Embed Size (px)
Citation preview

SLAC-R-512 UC-414
i
Generation and Characterization of Superradiant Undulator Radiation*
David Bocek
Stanford Linear Accelerator Center Stanford University Stanford, CA 94309
SLAC-Report-512 June 1997
Prepared for the Department of Energy under contract number DE-AC03-76SF00515
Printed in the United States of America. Available from the National Technical Infor- mation Service, U.S. Department of Commerce, 5285 Port Royal Road, Springfield, VA 22161.
*Ph.D. thesis, Stanford University, Stanford, CA 94309.

i
Abstract
-
High-power, pulsed, coherent, far-infrared (FIR) radiation has many scientific applica-
tions [l], such as pump-probe studies of surfaces, liquids, and solids, studies of high-ir, --rc- -
superconductors, biophysics, plasma diagnostics, and excitation of Rydberg atoms.
Few sources of such FIR radiation currently exist. Superradiant undulator radiation
produced at the SUNSHINE (Stanford UNiversity SHort INtense Electron-source)
is such a FIR source.
‘Z-.
First proposed in the mm-wave spectral range by Motz [a], superradiant undu-
lator radiation has been realized in the 45 pm to 300 pm spectral range by using
sub-picosecond electron bunches [3] produced by the SUNSHINE facility. The exper-
imental setup and measurements of this FIR radiation are reported in this thesis.
In addition to being a useful FIR source, the superradiant undulator radiation
produced at SUNSHINE is an object of research in itself. Measured superlinear
growth of the radiated energy along the undulator demonstrates the self-amplification
of radiation by the electron bunch. This superlinear growth is seen at 47 pm to 70 pm
wavelengths. These wavelengths are an order of magnitude shorter than in previous
self-amplification demonstrations [4,5].
. . . 111

Acknowledgements
Many people have helped me with this thesis work. I am grateful to all of them. I
thank my thesis advisor Prof. Helmut Wiedemann for suggestions and guidance in this -b- -
project, and for creation of a stimulating environment for a wide range. of technical
work at SUNSHINE. I am grateful to Prof. Todd I. Smith and Prof. Herman Winick
for their efforts in reading and correcting this thesis.
This project would not have been possible without use of the undulator and other
components from the Stanford Synchrotron Radiation Laboratory as authorized by
Prof. Arthur Bienenstock. Prof. Richard Pantell contributed rf equipment and over a
year of uninterrupted beam time. David Gough, Jim Sebek, and Ramona Theobald of
SSRL gave assistance with electronics, and Jim Weaver and Harold Morales fixed the
rf gun after the cathode burnt out. The Hansen Experimental Physics Laboratory
administration and staff provided infrastructure - electricity, water, and Internet
access.
My colleagues Pamela H. Kung and Hung-chi Lihn did much of the initial work
upon which this project was based, as did Michael Borland. Michael Hernandez, Jim
Sebek, and Chitrlada Settakorn provided help and constructive suggestions. William
Lavender contributed his code to calculate the undulator radiation spectrum and Eric
Crosson provided access to the HITRAN atmospheric absorption database.
Finally, and most importantly, I thank my wife Renee Shakerin for her encour-
agement, patience, and support.
V

Contents
Abstract -+- -
Acknowledgements
. . . 111
- t
V
1 Introduction 1
.-
‘.-.
1.1 Far Infrared Radiation . . . . . . . . . . . . . . . . . . . . . . . . . .
1.1.1 Applications of FIR sources . . . . . . . . . . . . . . . . . . .
1.1.2 Operational Facilities . . . . . . . . . . . . . . . . . . . . . . .
1.1.3 Superradiant Undulator Radiation as a FIR Source . . . . . .
1.2 Self-Amplification ............................. 5
1.2.1 SASE experiments ......................... 8
2 Theory of Superradiant Undulator Radiation 11
2.1 Undulator Radiation Theory ....................... 12
2.1.1 The Analytical Formula for Undulator Radiation ....... 13
2.1.2 Discussion of the Undulator Radiation Formula ........ 14
2.1.3 Numerical Evaluation ....................... 17
2.2 Coherent Enhancement: the Form Factor ................ 19
2.3 Coherent Enhancement of Undulator Radiation ............ 22
2.3.1 Coherent Enhancement in the Forward Direction ....... 22
vii

. . . Vlll CONTENTS
i 2.3.2 Coherent Enhancement in Arbitrary Direction . . . . . . . . . 25
2.3.3 Numerical Evaluation of.Superradiant Undulator Radiation . . 27
3 Theory of Self-Amplified Spontaneous Emission 33
3.1 Single-Pass FEL Theory ......................... 34
3.1.1 Mathematical Formulation .................... 35
3.1.2 Numerical Evaluation ....................... 41
4 Experimental Setup 45
4.1
- - 4.2
-;--
4.3
The SUNSHINE facility ......................... 45 -d.- - r - .
4.1.1 Rf Gun and Alpha Magnet .................... 46
4.1.2 Linac ................................ 49
4.1.3 Undulator ............................. 49
The Electron Beam ............................ 51
4.2.1 Time Format ........................... 51
4.2.2 Bunch Form Factor ........................ 53
4.2.3 Energy ............................... 56
4.2.4 Transverse Emittance ....................... 58
Instrumentation ............................... 60
4.3.1 Pyroelectric Detector and Electronics .............. 62
4.3.2 Michelson Interferometer ..................... 67
5 Characterization of Superradiant Undulator Radiation 71
5.1 Demonstration of Superradiance ..................... 71
5.2 Energy Spectral Density ......................... 74
5.2.1 Wavelength Tunability ...................... 76
5.3 Spatial Distribution ............................ 78
5.4 Angular Divergence ............................ 80

CONTENTS ix
-
5.4.1 Spatial Distribution vs. Undulator Length .
5.5 Polarization . . . . . . .’ . . . . . . . . . . . . . . .
6 Radiated Energy and Gain
6.1 Gain Measurements . . . . . . . . . . . . . . . . . .
6.1.1 Method of Measurement . . . . . . . . . . .
6.1.1.1 Variation of Undulator Length . .
6.1.1.2 Use of Michelson Interferometer . .
6.1.2 Gain Data . . . . . . . . . . . . . . . . . . .
6.2 Absolute Measurements &Radiated Energy . -. . .
6.2.1 Total Energy Collected at 52 pm . . . . . .
6.2.2 Energy in the Forward Direction . . . . . .
6.3 Absolute Gain Measurement . . . . . . . . . . . . .
6.4 Conclusions . . . . . . . . . . . . . . . . . . . . . .
7 Discussion of Measurements
7.1 Effect of the Electron Beam ...............
7.1.1 Effect of Energy Spread .............
7.1.1.1 Effect on Superradiance ........
7.1.1.2 Effect on SASE .............
7.1.2 Expected Effect of Measured Energy Spread .
7.1.3 Electron Beam Size ...............
7.1.3.1 Effect on Superradiance .......
7.1.3.2 Effect on SASE ............
7.1.4 Electron Beam Divergence ...........
7.2 Radiation Absorption ..................
7.3 Radiation Spatial Distribution and Divergence ....
7.3.1 Spatial Distribution at 52 pm .........
~ . .
. . .
. . .
. . .
. . .
* in . .
. . .
. . .
. . .
. . .
. . .
. . .
. . . .
. . . .
. . . .
. . . .
. . . .
. . . .
. . . .
. ” . ~
. . . 82
. . . 84
87
. . . 88
. . . 88
. . . 88
. . 89 ’
. . 89
. . 92
. . 95
. . 95
. . 99
. . 101
105
. . 107 -
. . 107
. . 108
. . 110
. . 111
. . 112
. . 112
. . 113
. . 114
. . 114
. . 116
. . 116

X CONTENTS
7.3.2 Angular Divergence . . . . . . . . . . . . . . . . . . . . . .
7.3.3 Experimental Measurement of Michelson Efficiency . . . .
7.4 Magnitude of Radiated Energy . . . . . . . . . . . . . . . . . . .
7.4.1 Energy in the Forward Direction ...........
7.5 Gain Measurements and Theory ................
8 Summary
8.1 A Bright Source . . . . . . . . . . . . . . . . . . . . . . . . .
8.2 Observation of Self-Amplification . . . . . . . . . . . . . . .
8.3 Future Prospects: Anoth_eyvndu.lator . D . . . . . . . . . . . -
Bibliography 129
. . .
116
120
121
121
122
125
125
126
126

List of Tables
1.1
1.2
1.3
1.4
2.1 -
3.1 Definition of SASE parameters . . . . . . . . . . . . . . . . . . . . . 35
4.1
‘-- 4.2
5.1 Angular divergence of radiation . . . . . . . . . . . . . . . . . . . . 81
_ 6.1 Forward power measurements. ..................... 96
6.2 Forward power vs K measurements at 0.7 m. ............. 97
6.3 Gain length absolute measurements. .................. 101
8.1 Parameters of superradiant undulator radiation at SUNSHINE . . . 126
Definition of various IR bands. ....................
Power output at operating far-infrared facilities. ........... -rc-
Parameters of superradiant undulator radiation at SUNSHIfiE: . .
Comparison of SASE experiments. ...................
Incoherent and coherent energy in the two polarizations . . . . . . . 31
Detector system calibration with 170 pm undulator radiation. . . . 65 _ Detector system calibration with 50 pm undulator radiation. . . . . 67
xi

i
List of Figures
1.1
1.2
2.1
2.2
- 2.3
2.4
2.5
2.6 ‘--
2.7
Gain measurements at short wavelength . . . . . . . . . . . . . . . .
Summary of gain measurements . . . . . . . . . . . . . . . . . . . . . -4.. - r - .
Schematic of undulator. . . . . . . . . . . . . . . . . . . . . . . . . .
Angle-integrated energy spectral density. . . . . . . . . . . . . . . . .
Energy spectral density as a function of acceptance angle. . . . . . . .
Peak energy spectral density as a function of angle. . . . . . . . . . .
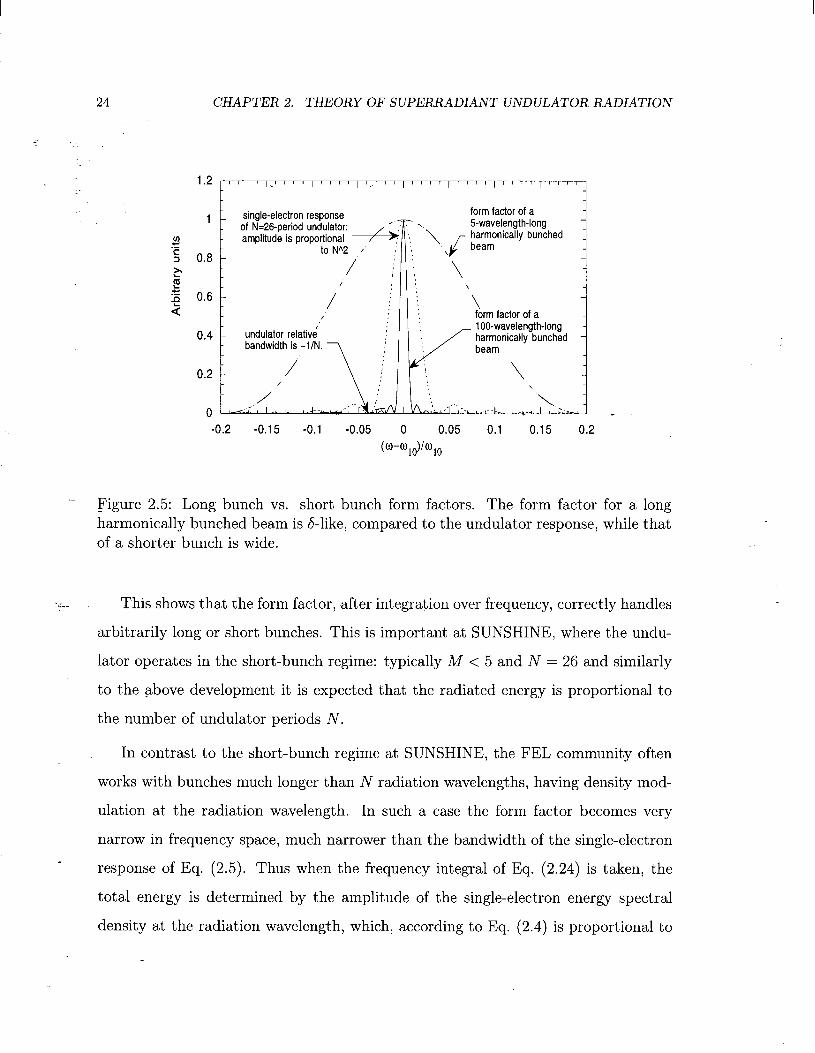
Long bunch vs. short bunch form factors. . . . . . . . . . . . . . . . .
Peak energy spectral density vs. angle with form factor effect. . . . .
Energy spectral density vs. acceptance angle with form factor effect. .
3.1 Calculated SASE variables vs undulator length ..............
_ 3.2 SASE energy per solid angle in forward direction. ...........
4.1
4.2
4.3
4.4
4.5
4.6
4.7
Block diagram of SUNSHINE. ......................
Simulated bunch compression. ......................
Schematic pulse format. .........................
The measured macropulse current. ...................
The measured and simulated bunch spectrum. .............
Measured energy verus time distribution of electron beam macropulse.
Measured energy versus time distribution of a slice of the macropulse.
. . . x111
6
7
12
16
18
20
24
27 -
29
41
42
47
48
51
52
54
56
57

xiv LIST OF FIGURES
4.8
_- 4.9
4.10
4.11
4.12
5.1
5.2
5.3
5.4
5.5
5.6
- 5.7
5.8
5.9
5.10 ‘--
5.11
6.1
6.2
6.3
6.4
6.5
8.6
6.7
7.1
7.2
Transport simulation of 0,. ....................... 59
Transport simulation of crU. .. : ..................... 59
Detailed schematic of superradiant undulator radiation setup ..... 61
Calibration of pyroelectric detectors. .................. 64
Michelson efficiency ............................ 69
Bolometer voltage vs charge squared. .................. 72
Auto and cross correlations. ....................... 73
Example measured interferogram. .................... 74
Example measured speck-. .-I .......... .- ....... -_ .. 75
Coherent enhancement of the third harmonic. ............. 76
Wavenumber as a function of K ..................... 77
Spatial distribution at 170 pm ...................... 78
Saturated spatial distribution at 170 pm ................ 79
Angular divergence at 227, 91, and 52 pm ............... 80
Measured spatial distribution as a function of undulator length .... 83
Horizontally and vertically polarized components ........... 84
Gain measurements at short wavelengths, 1 of 2 ............. 90
Gain measurements at short wavelengths, 2 of 2 ............ 91
Gain measurements at different wavelengths .............. 93
Summary of gain measurements ..................... 94
Plot of forward energy vs K measurements ............... 98
Measured energy vs undulator length at K = 0.6 ............ 100
Energy per solid angle vs. undulator length at K = 0.99 ....... 102
Effect of micropulse energy spread on superradiant radiation. ..... 108
Effect of energy slew on superradiance. ................. 109

LIST OFFIGURES xv
7.3 Effect of energy slew on SASE parameters. . . . . . . . . . . . . . .
.- 7.4 Effect of macropulse energy spread on the observable spectrum. . .
7.5 The effect of humidity as calculated from HITRAN. . ~ . . . . . . ,
7.6 Atmospheric absorption through different path lengths. .......
7.7 Measured spatial distribution at 52 pm ................
110
111
115
116
117
8.1 Extrapolation to two undulators at K = 0.6 . . . . . . . . . . . . . . 127
-+- -
-

Chapter 1
Introduction
This thesis presents an experimental investigation of the superradiant FIR (far-
infrared) radiation generated by passing a relativistic electron beam through a mag-
netic undulator. By “superradiant” it is meant that the radiation is due to the high
degree of phase coherence between the radiating electrons [6, page 5481. The su-
perradiant emission is both spatially and temporally coherent, and its intensity is _
proportional to the square of the number of radiating electrons. In itself, this radi-
ation is of value as a tool for physics, biology, and chemistry, and in the future the
SUNSHINE (Stanford University SHort INtense Electron source) facility, where this
.work was done, is intended to be offered to the scientific community as a light source.
Therefore this thesis (specifically Chapter 5) describes the measured energy spectral
density, spatial distribution, polarization, and time structure of the radiation so that
the potential user will understand the capabilities of the SUNSHINE facility.
Additionally this experiment observes gain in the radiated power as the elec-
tron beam traverses the undulator. This process is often referred to as SASE (Self-
Amplified Spontaneous Emission), and is crucial to the development of X-ray FELs
(Free-Electron Lasers) which depend on such a mechanism to achieve lasing. Self-
amplification has been seen previously in mm-waves [4] down to 600 pm [5]. In this
1

CHAPTER 1. INTRODUCTION 2
wavelength range molecular significance near infrared 0.7 to 3 .pm electronic transitions mid infrared 3 to 40 pm vibrational modes far infrared 40 to 1000 pm rotational modes
Table 1.1: Definition of various IR bands.
experiment self-amplification is observed for the first time at wavelengths as short as
47 pm.
The structure of this thesis follows the pattern of overview (Chapter l), theory
(Chapters 2 and 3), experimental setup (Chapter 4), measurements (Chapters 5 and
6)) discussion (Chapter 7)) and-s++rnmarg (Chapter 8). Chapters 1, 4, and .8 are
self-explanatory. Chapter 2 describes the theory and computation of superradiant
undulator radiation, which was the expected result of this experiment. Chapter 3
- describes single-pass FEL theory, which predicts self-amplification from a sufficiently
intense electron beami. Chapter 5 describes measurements characterizing the FIR ra-
diation, and may be of particular interest to potential users of the radiation. Chapter
6 describes measurements of self-amplification (gain). Finally, Chapter 7 describes
the effects of the non-ideal nature of the electron beam and instrumentation.
1.1 Far Infrared Radiation
In infrared science a typical division of the electromagnetic spectrum is shown in Table
1.1. Although the division is somewhat arbitrary, the various sub-bands correspond to
qualitatively different molecular processes as shown [7]. The superradiant undulator
radiation at SUNSHINE is tunable from 45 pm to 300 pm, hence falls into the far-
infrared (FIR) band.
‘The single-pass FEL theory predicts self-amplification at the levels observed in this experi- ment. However since 3-dimensional effects ignored in the theory are expected to reduce the self- amplification, the low or zero-gain limit of the theory, which is the superradiance described in Chapter 2, was the expected experimental result.

1.1. FAR INFRARED RADIATION
i
1.1.1 Applications of FIR sources _-
There are many applications of pulsed high-power FIR such as that produced at
SUNSHINE. These include, for example:
l pump-probe surface science,
l pump-probe studies of gases, liquids, and solids,
l non-linear solid state physics,
l studies of carrier dynamics of high-ir, superconductors, -+- - r
l studies of modes of large bio-molecules,
l plasma diagnostics, and
l excitation of Rydberg atoms.
‘--
In fact, the 1994 free electron laser study by the National Research Council concluded
that, “The scientific case for a tunable, short-pulse (picosecond) source in the far
infrared is compelling.. .” [ 11.
1.1.2 Operational Facilities
High-power, pulsed FIR sources are rare; there are only a few FEL user facilities in
the far-infrared range. They and their output powers are listed in Table 1.2, as are
the SUNSHINE parameters, for comparison.
1.1.3 Superradiant Undulator Radiation as a FIR Source
Superradiant undulator radiation has many desirable features as a FIR source. It is
temporally and spatially coherent, polarized, intense, and at SUNSHINE it is pulsed
in picosecond-long bursts. Achieved parameters of the radiation are listed in Table 1.3.

4 CHAPTERl. INTRODUCTION
facility wavelength micropulse macropulse average ref tunability power power power
UCSB FIRFEL 63 to 338 l-6 l-6 500 42 4 PI SUNSHINE 45 to 300 10-40 0.2-1.5 3-50 @ 30
FIREFLY 19 to 65 300 0.004 400 @ 20 PI FELIX 5 to 110 -1000 10 500 @ 5 PO1 units Pm kW kW mW@Hz
Table 1.2: Power output at operating far-infrared facilities.
It is useful to compare the brightness of the SUNSHINE undulator radiation with
that of a 2000 K blackbody, which approximates the commonly-used Globar source. --rc- -
From the listed parameters, the average brightness of the undulator radiation at
z5 50 pm is
- 3 x 10⁻³W/16%bandwidth 8 x lo6 [W] 7r(3 x 10⁻³m)27r(5 x 10⁻³rad)2 = [m2][sr][100%bandwidth]’ (1.1)
and at 73 200 pm
50 x 10-3W/16%bandwidth 9 x lo6 [W] 7r(3 x 10⁻³m)27r(20 x 10-3rad)2 = [m2] [sr] [lOO%bandwidth] . (1.2)
The brightness of the 2000 K blackbody is given by the Planck distribution as [7]
WV T) [WI 2hu4 ZZ-
[m2] [sr] [lOO%bandwidth] c2 1
ehv/kT - 1 M 2u3kT
C2 , (1.3)
which gives 1.3 x lo2 [W/m2/sr/100%bandwidth] at 50 pm (6.0 THz) and 2.1 x 10’
[W/m2/sr/100%bandwidth] at 200 pm (1.5 THz). The average SUNSHINE undulator
radiation is thus 4-6 orders of magnitude brighter than the blackbody source, and the
peak SUNSHINE brightness is lo-12 orders of magnitude brighter than the blackbody
source.

1.2. SELF-AMPLIFICATION
Parameter Value Wavelength tunability 45 to 300 pm Micropulse power lo-40 kW (50-200 pm) Macropulse power 0.2-1.6 kW (50-200 pm) Average power 3-50 mW (50-200 pm) Angular divergence 5-20 mrad (50-200 pm) Effective source size 3 mm l/e2 radius Polarization 80 % linear Micropulse length 26 radiation wavelengths Micropulse separation 350 ps Macropulse length 0.7-1.1 ps (50-200 pm) Macropulse repetition rate 4-30 Hz Macropulse linewidth 12-20% FWHM
Table 1.3: Parameters of superradiant undulator radiation at SUNSHINE.
- 1.2 Self-Amplification
Self-amplified spontaneous emission2 (SASE) re f ers to a process by which an electron
beam, spontaneously radiating as it travels through an undulator magnet, can bunch
itself as a result of energy modulation caused by the spontaneous emission [ll]. This
bunching leads to greater emission, which leads to more bunching. A signature of
this process is exponential increase of the radiated power along the length of the
undulator: P = POeNjN 9, where Ng is the gain length and N is distance in number of
oscillation periods along the undulator.
Figure 1.1 shows measurements both of gain and no gain, and Fig. 1.2 summarizes
gain length measurements at several different wavelengths. In these figures, the fit
function is not a pure exponential, but instead is of the form y(N) = ml x (eNIN - 1).
This is a modification of the exponential that goes linearly to zero as N approaches
zero, as discussed in Chapter 6.
2For the purposes of this thesis, it is assumed the term “SASE” applies to self-amplification arising from either shot-noise in the electron beam distribution, or, as is the case in this experiment, from coherent structure in the electron beam distribution.

6
-
CHAPTERl. INTRODUCTION
960613.dat; K=0.6; 193/cm 960627.dat; K=0.6; 193hm
6 10-4
z 5 10-4
2 m
2 4 10-4 I .E g 3 10-4
23 B $ 2 10-4 xi
s m” 1 10-4
0 IO0
0 5 10 15 20 25 30 0 5 10 15 20 25 30
Number of undulator periods Number of undulalor periods
96071 O.dat; K=0.6; 194/cm 960723.dat; K=0.6; 193/cm
0 5 10 15 20 25 30 0 5 10 15 20 25 30
Number of undulator periods Number of undulator periods
Figure 1.1: Gain measurements at short wavelengths. The dates of the measurements and wavelengths are indicated in the graph titles. The gain length in units of undu- lator periods is the quantity m2 in the equation tables of the graphs. The graph in the lower right-hand corner is the condition before optimization.

1.2. SELF-AMPLIFICATION
0.25
Figure 1.2: Summary of gain measurements. The fit gain coefficient, defined as the reciprocal of the gain length, is plotted as a function of the radiated wavenumber. The crosses indicate measurements from 1995, the circles are from 1996. The errors from the gain length fits give the error bars.

8 CHAPTER 1. INTRODUCTION
. . 1.2.1 SASE experiments :
Table 1.4 summarizes the parameters of the two previous SASE experiments along
with the results of the SUNSHINE experiment. The SUNSHINE data are discussed
in detail in Chapters 4-6 of this thesis. Some differences between the SUNSHINE
experiment and the other two in the table are:
l SUNSHINE experiment is at much shorter wavelength,
l electron source is a short pulse beam (rf-bunched),
l SUNSHINE electron beameBittan% is much lower, -
l SUNSHINE SASE can start up from strong coherent structure of the electron
beam,
l short-pulse effects may be important as the bunch length is only at most 4-5
radiation wavelengths long, and
l the radiation wavelength is l/30 to l/200 of the chamber radius so free-space
propagation is expected rather than waveguide modes.

1.2. SELF-AMPLIFICATION
-
=I--
experiment Livermore MIT SUNSHINE units reference PI PI [Chapters 4-61 e-beam parameters: energy 3.6 + 0.5 2.0 + 0.5 15 MeV Lorentz factor y 8.0 4.9 29.4 energy spread
--rc- - 0.2-0.4 - 0.8 - . %
current 450 780 53 A pulse length 15 30 0.0006 ns normalized emittance 4.7 x lop3 edge 5.2 x 10e4 2.0 x 1o-5 7r m-rad radius 8 3-4 1 mm p-parameter 0.063 0.029 0.0092 undulator parameters: geometry planar helical planar length 3 1.5 2 m period 9.8 3.1 7.7 field 4.8 1.3 0.8 El K 4.4 0.5 0.6 chamber cross-section 2.9 by 9.8 0.4 radius 1.0 radius cm radiation parameters: wavelength 8700 800 50 Pm mode TEol TJh over-moded measured gain length 3.3 2.1 4 to 5 periods
Table 1.4: Comparison of SASE experiments.

i
Chapter 2
Theory of Superradiant Undulator
Radiation - - r *
-
A unique feature of the SUNSHINE facility is its ability to generate sub-picosecond
pulses of relativistic electrons. A typical pulse lasts about 600 fs which corresponds
to 180 pm. If radiation at wavelengths much greater than 180 pm can be generated _
by the undulator, the electrons will radiate in phase, the field will be proportional
to the number of electrons, and the power will be proportional to the square of the
number of electrons [2]. This superradiance also occurs at wavelengths of the order
of and less than the pulse length, although at reduced amplitude due to destructive
interference between some of the radiating electrons. For wavelengths much less than
the bunch length the phase between radiating electrons becomes random and the
radiated power becomes proportional to the number of electrons, not the number
squared. This incoherent radiation cannot be observed in this experiment because
the sensitivity of the detectors used requires the large (typically - 108) coherent
enhancement of superradiance in order to have a measurable signal.
In its simplest form the undulator is a device that makes the electron follow a
sinusoidal trajectory. Although the trajectory is simple, relativistic effects make the
11

12 CHAPTER 2. THEORY OF SUPERRADIANT UNDULATOR RADIATION
i
e
Figure 2.1: Schematic of the undT&tor &owing the xyz coordinate system; orienta- tion of the permanent magnets, and trajectory of the electron beam.
- computation of the radiation distribution somewhat involved. In this chapter the
well-known quantitative results of the theory of undulator radiation from a single
electron are presented, and the effect of coherent enhancement is discussed.
=r--
2.1 Undulat or Radiation Theory
As at SUNSHINE, consider a planar undulator (as shown schematically in Fig. 2.1)
with magnetic field B’ which is entirely in the y direction and which varies sinusoidally
in the z direction with period X0:
i?(z) = B() cos(27rz/XrJ)jr, (2.1)
and consider an electron that enters the undulator at z = 0 with velocity v’= v%,
where the notation 2 denotes a unit vector in the z direction. If the deflection of the
electron by the magnetic field is small enough so that its velocity in the z direction
can be taken to be constant and equal to the speed of light c, then the trajectory

2.1. UNDULATOR RADIATION THEORY 13
i
followed by the electron can be found from the Lorentz force law to be sinusoidal:
where
is the undulator strength parameter, q is the magnitude of the electron charge, m
is the electron mass, and y = (electron energy)/ me2 is the Lorentz factor for the
electron. Here, as everywhere else in this thesis, SI units (rationalized MKSA [12]
units) are used. -&- - - - .
2.1.1 The Analytical Formula for Undulator Radiation
- Once the trajectory is known, the spectral and spatial distribution of radiation from a
single electron traversing a planar undulator is calculated from the Lienard-Weichert
potentials [13-15, for example] with the following result [14]:
where
. G,(K, $9, q5) = f$ (2.6)
& = +f Jk(n~z)J2k+n(nJ~), k=-cc
S2 = +f ~Jk(nl,)J2k+n(ntz), k=-cc
K2 A=1+cw2+T; a,=@,
2Y2Wo 27lc wl= 1+y2(j2+K2/2’ w”=x7
(2.7)
P-8)
(2.9)
(2.10)
and

14 CHAPTER 2. THEORY OF SUPERRADIANT UNDULATOR RADIATION
.. I = radiated energy,
: R =. solid angle,
w = angular frequency,
N = number of undulator periods,
e. = permittivity of free space,
6’ = angle with respect to the undulator axis (0 = 0 in the forward direction), -c. - - -
4 = angle about undulator axis ($ = 0 in the xx plane),
J, = the Bessel function of the first kind of order n.
In the forward direction (i.e. 19 = 0) with the fundamental frequency,
2Y2Wo wlo = 1 + K2/2’
(2.11)
=r-- the Eqs. (2.4)-(2.10) simplify to:
d21
dab o=. = ‘22,;‘&(K)
sin[Nn(w/wie - n)] 2 . (2.12)
0 ‘~rN(w/w~o - n) '
where .
K2n2 J’,(K) =
(1+W/2)2 x [J~.L (f$&) - JF ($$$)]’ if n= 1,3,5,...
0 otherwise
2.1.2 Discussion of the Undulator Radiation Formula
Some comments can be made about the physical interpretation of the above formu-
las. The frequency distribution at a particular observation angle 0 is determined by
2.1. UND ULATOR RADIATION THEORY 15
Eq. (2.5), which is a sharply peaked function that actually becomes a S-function for
: an infinitely long undulator [14]: ‘.
lim H,( K, 70, w) = lim sin[N7r(w/wr - n)] 2
N-CC N--tCC ~N(w/wl - n) ) =$(E--n).
For example, when 0 = 0 and n = 1 Eq. (2.14) is non-zero only when
wlo = 2y2wo/(l + K2/2),
which is the formula for the fundamental wavelength of undulator radiation:
For a finite-N-period undulator with 8 = 0 and n = 1 then Eq. (2.5) is recognizable
as the square of the Fourier transform of an N-period sinusoid at the fundamental
wavelength.
The fundamental wavelength and other properties of undulator radiation can be
understood by considering that the radiated field measured by an observer is propor-
tional to the apparent transverse acceleration [16] of the electron as viewed by the
observer. Consider an observer on the z axis. The electron trajectory is periodic
with period X0, but because the electron is moving almost as fast as the radiation,
the pulses from successive periods will appear to the observer time-compressed by a
factor of
where ,8 = V/C is the velocity of the electron relative to the velocity of light. This
gives the first term in Eq. (2.15). B ecause it follows a sinusoidal trajectory with
amplitude proportional to K/y < 1, the electron travels further than the radiation
by an amount proportional to K2/y2, which gives the second term in Eq. (2.15).
As 0 increases from zero in the xz plane, the time-compression seen by the ob-
server decreases, so the observed wavelength increases, as seen in the decrease of w1

16
i
: 2
CHAPTER 2. THEORY OF SUPERRADIANT UNDULATOR RADIATION
1 o-- Energy spectral density computed two ways; K=0.6
1 - Sigma-polarization; N=26
‘. Sigma-polarization; N->lnf - - Pi-polarization; N=26
-. - Pi-polarization; N-Anf
-1 t -\__ 0 ---- .___ --h
0 0.5 1 1.5 2 2.5 3 Frequency in units of the fundamental.
_- Figure 2.2: Angle-integrated energy spectral density. This figure demonstrates that the N --+ 00 approximation used in calculating the undulator radiation energy spec- tral density agrees well with the more accurate N = 26 calculation. Also noteworthy is that the radiation is dominated by the horizontally-polarized (a-polarization) com- ponent .
with 0 -in Eq. (2.10). Additionally, the magnitude of the apparent transverse accel-
eration decreases, dropping to zero near 8 = K/y, where the observer’s line-of-sight
is tangent to the zero-crossings of the sinusoidal trajectory (there is no bending, so
no acceleration at these points). So the observer measures radiation out to about
8 = K/y (in the xz plane). Finally, because the apparent acceleration is mainly
in the xz plane, the observer measures radiation mainly polarized in the xz plane.
The polarization terms appear in Eq (2.6), where [S~CUCOSC,~ - (Sr + iS2) &I’
refers to the horizontal polarization (a-mode) and Sfa2 sin2 4 refers to the vertical
polarization (n-mode).

2.1. UNDULATOR RADIATION THEORY 17
2.1.3 Numerical Evaluation
In order to numerically evaluate Eqs. (2.4)-(2.10), t i is convenient to take advantage
of the S-like nature of Eq. (2.5) by assuming it is a S-function and doing the integral
with respect to sinode, thus avoiding the computational expense associated with
integrating across a sharply-peaked function. This approach has been shown to give
good results for large N [17, pages 60-651. Th e resulting equation for the energy
spectral density of undulator radiation is [17]
dI q2y2N wQ 2= co dw=-- SC 47rQlC~W 0 n=l Gn W, -A, dWA
-d.- - (2.17)
where
@-pT-v-yi. (2.18)
Equations (2.17) and (2.18) are used to compute the expected radiation from
one electron passing through a K = 0.6 undulator, which is of relevance to the
-
experimental results of this thesis. The computational method is as follows:
l For the frequency w, find the minimum postive integer n,in, if it exists, such
that 13, is real.
l If n,in exists then find the maximum positive integer nm,, such that 8, is within
an acceptance angle Ba.
l If %nax 2 Gmin, then evaluate Eq. (2.17) for the frequency w where the sum
within the integral becomes CE;rmin.
Figure 2.2 shows $$ computed from Eqs. (2.17) and (2.18) and also from Eqs. (2.4)-
(2.10), with a 10/y acceptance angle [18]. This demonstrates that the approximation
of Eqs. (2.17) and (2.18) is sufficiently accurate for the purposes of this project.
Applying Eqs. (2.17) and (2.18) t o understand the spectral and spatial distribution
of the radiation gives Fig 2.3, which shows the energy spectral density of undulator

18 CHAPTER 2. THEORY OF SUPERRADIANT UNDULATOR RADIATION
Energy spec&4 density ([J][sy[rad]) vs acceptance angle [l/gamma]
. . . . . : , ,
, , .. j
Act ang
Frequency in unit of fundamental
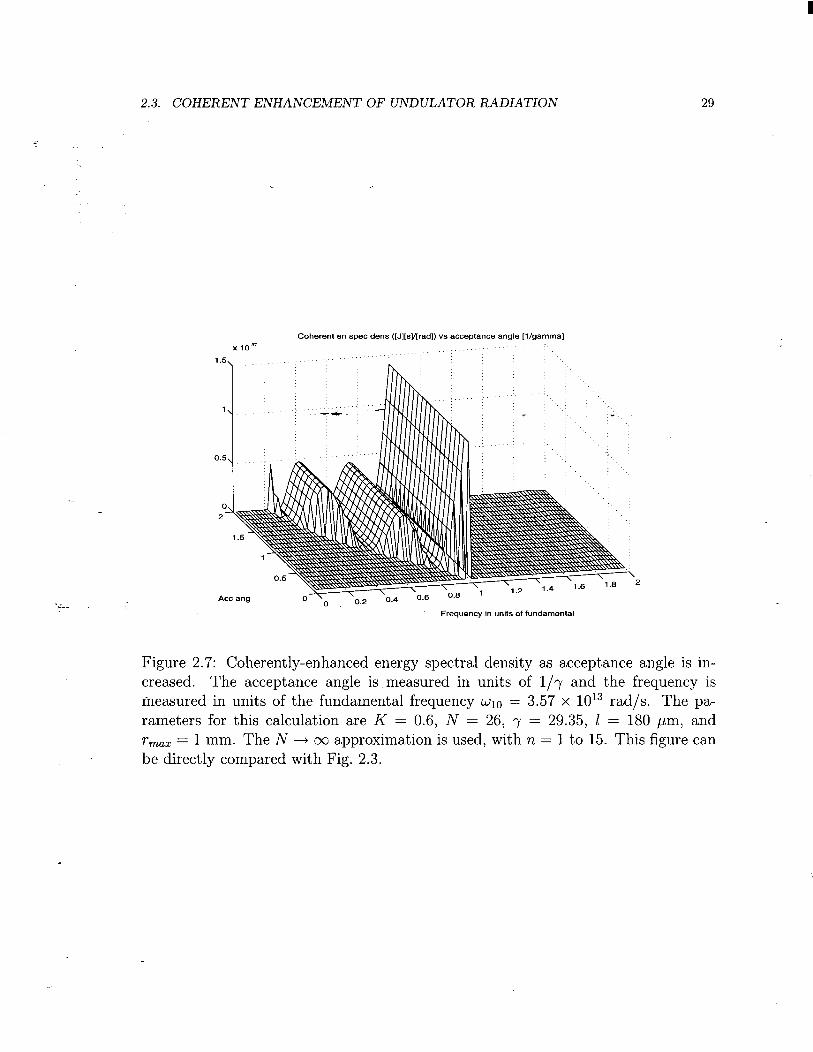
Figure 2.3: Angle-integrated energy spectral density as a function of acceptance an- gle. As the angular acceptance Ba, measured as the half-angle of a cone, increases, substantial radiation appears at frequencies below the fundamental. (This calculation is done for K = 0.6 using the N --f co approximation.)

2.2. COHERENT ENHANCEMENT: THE FORM FACTOR 19
radiation for K = 0.6 as the acceptance angle 8, is increased. It is worth noting that
as the acceptance angle increases,’ very much radiation appears at angles greater than
the so-called ‘opening angle’ [19, Sec. 4, Eq. (15)] of
(2.19)
which is the ‘opening angle’ only for the radiation within a relative frequency band
of +$ of the fundamental frequency; that is, it is the opening angle for which the
linewidth is not significantly broadened beyond the minimum natural linewidth. If all
frequencies are considered, then th_e spatial distribution appears as in Fig. 2.4, which -b- - -
shows Eqs. (2.17) and (2.18) evaluated for n = 1, and clearly exhibits substantial
radiated energy out to angles N t.
2.2 Coherent Enhancement: the Form Factor
The formalism for calculating the coherent radiation from a bunched beam was worked
out by Nodvick and Saxon [20] by adding the radiated fields from each electron in
the bunch. Following this approach, consider N, electrons travelling through an
undulator, entering at times tj and transverse offsets ?jl. Assume the electrons have
the same injection angle -so that they follow parallel trajectories- and assume that
they have the same energy. Then for radiation at frequency w in direction ti the
observer will see a field &,,(@ equal to the sum of the fields from each electron:
Et,,($) = &i) 5 ew3+%d. (2.20) j=l
Here &(i) is the field radiated by a single electron and i = fiw/c is the wavevector to
the observer, where fi is a (constant) unit vector from the undulator to the observer.
Equation (2.20) can be written more simply by relating time and transverse postion
coordinates to, for example, the first electron entering the the undulator. The other

20 CHAPTER 2. THEORY OF SUPERRADIANT UNDULATOR RADIATION
Energy spectral density per solid angle: K=O.E, gamma=29.35. “=I.
x 1 o-‘8 ”
2
Angle in x dir in [l/gamma] radians
Angle in y dir [l/gamma]
Figure 2.4: Peak energy spectral density as a function of angle. The peak’energy spectral density (energy spectral density at w = WI) per solid angle evaluated for K = 0.6, N = 26, y = 29.35, and n = 1 shows that the radiation does not drop to zero until 8 > $. The n = 1 term accounts for over 60% of the radiated power when K=0.6.
2.2. COHERENT ENHANCEMENT: THE FORM FACTOR 21
electrons will then enter at times tj = ,z~/c and Eq. (2.20) becomes
(2.21)
where i?j = ?jl + zj% locates the j-th electron with respect to the first electron. The
power radiated is proportional to the square of the field so
p,,&q = &,(i) 5 f$+ 2. (2.22) j=l
In the continuum limit one defines a probability distribution S(?)for the charge den-
sity of the electron bunch: -+- - ,. -
1 = S(qd3r, J
(2.23)
and the total power (at the frequency w = clc in direction i() then can be expressed
- as
(2.24)
Thus coherent enhancement, and in fact the entire effect of the bunch structure, is
characterized by the form factor f(i) defined as
(2.25)
which is the square of the 3-dimensional Fourier transform of the bunch distribution.
In this derivation the only assumptions are equal and constant particle energies and
parallel trajectories (that is, equal injection angles); the form factor then just follows
from the principle of superposition.
With the form factor and total power defined in this way, a random N,-particle
distribution has a form factor of l/N,, as is familiar from the random walk problem for
example, and thus Eq. (2.24) h s ows that the incoherent radiated power is proportional
to the number of electrons. If all the electrons are at an identical phase with respect to
i, then the form factor has its maximum value of one, which is the case of maximum
coherent enhancement.

22 CHAPTER 2. THEORY OF SUPERRADIANT UNDULATOR RADIATION
. 2.3 Coherent Enhancement of Undulator Radia- :
tion
A possible point of confusion is that the form factor can show coherent enhance-
ment from electrons that are causally separated. For example consider the forward
radiation from two electrons, separated by an integer M > N fundamental wave-
lengths, travelling through an N-period undulator. Then the form factor is one, and
Eq. (2.24) predicts the maximum coherent enhancement-yet the observer sees just
two N-period wave-packets completely separated in time/space, so there can be no co- -+- - - . herent enhancement in the radiated energy. If one realizes that B(w) in the derivation
is really the Fourier amplitude of the field, and therefore P(w) is the power spectral
density, then the apparent contradiction is resolved: there is coherent enhancement of
the energy spectral density at the fundamental, but there is no coherent enhancement
of the total energy because the bandwidth of the radiation has been reduced exactly
enough so that the total energy is just the sum of the energies in the two causally
‘A- separated wave-packets. Since this example is of fundamental importance in calcu-
lating coherent enhancement of undulator radiation, a mathematical demonstration
is now presented.
2.3.1 Coherent Enhancement in the Forward Direction
Consider an undulator which causes an electron to radiate an N-period sine wave in
the forward direction at the fundamental frequency wia. The Fourier transform of
the radiated field is then i
El,(w) K /2sN'w10 eiwlOte-i+jt =
0 ?I$! (eMiT"=) [si~~~~Q'] , (2.26)
‘here units are dropped as they are irrelevant to the argument.

2.3. COHERENT ENHANCEMENT OF UNDULATOR RADIATION 23
so the energy spectral density from one electron is
. (2.27)
The energy radiated by one electron will then be the integral over frequency of
Eq. (2.27) which gives 4r2N
11, m - WlO ’
(2.28)
that is, the total energy is proportional to the number of oscillations multiplied by
the period of the oscillations. Now consider 2 electrons separated by M fundamental
wavelengths. The form fast=.of this ‘bunch’ is then - -
f(w) = 11: (s(t) ’ s(t; 2nMlw10’) epiwt&i2 = cos2 (TM~) , (2.29)
- and the energy spectral density will be given by
dI (4 dw tot cc 22 cos2 (TM&) (g)’ [ si’li;,f;~l;Q’] 2, (2.30)
by application of Eq. (2.24). Defining the variable u = 7r(w - wiO)/wiO leads to
167r dw=-2 J m cos2(Mu) sin2(Nu)dU
tot WlO 0 u2 > (2.31)
and using integral tables [21, Eq. (3.828.11)]
Itot m gN ifM>N
E(N-M) ifM<N ’ (2.32)
So, as expected, when the wave-packets do not overlap (M > N) the energy from
two electrons is twice the energy from one, that is there is no coherent enhancement
of the energy. But as the electrons move together so that the radiated wave-packets
overlap the energy increases proportionally to the overlap, reaching a maximum of
4 times the single-electron energy when the two electrons are at the same location
(M = 0), also as expected.
CHAPTER 2. THEORY OF SUPERRADIANT UNDULATOR RADIATION
0.8
0.6
form factor of a 5-wavelength-long
/-- harmonically bunched
4 beam -
\ form factor of a
- 0.4 - undulator relativi
bandwidth is -l/N. lOO-wavelength-long bunched harmonically -
-0.2 -0.15 -0.1 -0.05 0 0.05 0.1 0.15 0.2 (~-@loY~lo
_- Figure 2.5: Long bunch vs. short bunch form factors. The form factor for a long harmonically bunched beam is S-like, compared to the undulator response, while that of a shorter bunch is wide.
I-‘-- This shows that the form factor, after integration over frequency, correctly handles
arbitrarily long or short bunches. This is important at SUNSHINE, where the undu-
lator operates in the short-bunch regime: typically A4 < 5 and N = 26 and similarly
to the above development it is expected that the radiated energy is proportional to
the number of undulator periods N.
In contrast to the short-bunch regime at SUNSHINE, the FEL community often
works with bunches much longer than N radiation wavelengths, having density mod-
ulation at the radiation wavelength. In such a case the form factor becomes very
narrow in frequency space, much narrower than the bandwidth of the single-electron
response of Eq. (2.5). Thus when the frequency integral of Eq. (2.24) is taken, the
total energy is determined by the amplitude of the single-electron energy spectral
density at the radiation wavelength, which, according to Eq. (2.4) is proportional to

2.3. COHERENT ENHANCEMENT OF UNDULATOR RADIATION 25
: N2, the square of the number of undulator periods. This is not the case at SUN-
SHINE, where the form factor of the electron bunch is usually much broader than the
single-electron response. At SUNSHINE, when the frequency integral of Eq. (2.24)
is taken, the l/N bandwidth of the single-electron response applies and makes the
expected energy proportional only to N, not N 2. The diagram of Fig. 2.5 illustrates
this.
2.3.2 Coherent Enhancement in Arbitrary Direction
The same principles of coherent enhancement discussed for the forward direction of
course apply to any direction. The 3-dimensional form factor is defined in i-space and
together with the z-space distribution of the radiation from a single electron (i.e., the
_- impulse response of the undulator) completely characterizes the radiation from the
bunch. To get the total energy radiated by the bunch one simply multiplies the form
factor by the single-electron response and integrates the result (which is Eq. (2.24))
over Z-space.
To model the electron beam distribution, it is reasonable to use a uniform-density
cylinder. Of course real bunches do not follow such a hard-edge distribution, but their
basic shapes agree with this model. The sharp edges of the cylinder may produce
more high-frequency components than are present in the real bunch; an alternate
model, that avoids this, is the much smoother Gaussian distribution. The measured
longitudinal distribution at SUNSHINE has been found to be somewhere between
these two models, tending to be closer to the uniform-density distribution [22, page
961 than to the Gaussian distribution.
The form factor of a uniform-density cylindrical electron bunch can be found easily
in cylindrical coordinates:
2
(2.33)

26 CHAPTER 2. THEORY OF SUPERRADIANT UNDULATOR RADIATION
where 1 is the bunch length and r,,, is the bunch radius. Since there is cylindrical : symmetry i. F can be evaluted in the yi plane (with the correct final result) giving
where Icl is the magnitude of the component of z in the zy plane. Then
which evaluates to
(2.34)
The first term in brackets is recognized as the F’raunhofer diffraction pattern of a
slit of width I in the %direction, and the second term in brackets is recognized as -
the F’raunhofer diffraction pattern‘of a circular aperture of radius T,,,. (This is not
suprising since the F’raunhofer diffraction pattern of an aperture can be calculated
from Huygens’ principle by considering the aperture to be filled with radiating sources,
‘CT. in the same way that the form factor of an electron bunch is calculated.) The first
term has a maximum of one if k, ---f 0 and falls to zero when Ic, = 27r/Z while the
second term has a maximum of one if kl t 0 and falls to zero when lcl = 3.832/r,,,.
If the beam distribution is Gaussian in each of the three dimensions with standard
deviations gX, gY, and gZ respectively, then each of the three rectangular coordinates
are independent. In the &direction,
This evaluates to
f(k,) = eeu2’z,
and so overall
(2.35)

2.3. COHERENT ENHANCEMENT OF UNDULATOR RADIATION 27
Coherent en spec dens I so1 ang : K=0.6. gamma=29.35, n=l, rLm=lmm, I=160um.
”
Angle in x dir in [l/gamma] radians
Angle in y dir [i/gamma]
Figure 2.6: Peak energy spectral density vs. angle with form factor effect. The form factor of a 1 mm radius, 180 pm long bunch multiplies the incoherent radiation distribution to produce the coherent distribution. The parameters of this calculation are N = 26, K = 0.6, y = 29.35, and n = 1. This figure can be compared directly with Fig. 2.4.
2.3.3 Numerical Evaluation of Superradiant Undulator Ra-
diat ion
The expected superradiant undulator radiation from SUNSHINE can now be calcu-
lated. The undulator strength is taken to be K = 0.6 as in many of the experiments
discussed later in this thesis, and the electron bunch is modeled as a uniform-density
cylinder of 1 mm radius and 180 pm length.
To visualize the coherently-enhanced spatial distribution the n = 1 term in G,
of Eq. (2.6) is computed with a resulting single-electron spatial distribution of peak
energy spectral density as shown in Fig. 2.4. By ‘peak’ energy spectral density is
meant the energy spectral density at WI for the given angle 8. The n = 1 term shown

28 CHAPTER 2. THEORY OF SUPERRADIANT UNDULATOR RADIATION
.s in the figure includes over 60% of the total radiation for K = 0.6. In Fig. 2.4 each
-. direction corresponds to a specific frequency of radiation which allows straightforward
application of the form factor for a cylindrical bunch of radius r,,, = lmm and length
180pm, giving Fig. 2.6.
Figure 2.6 shows the effect of shape of the bunch in the ripples. The zero at angle
0.4/y is because angle 0.4/y corresponds to radiation at frequency 60 pm, which is at
a zero of the 180 pm uniform distribution form-factor. The zero at $5’ = 1 is the first
zero of Ji(u)/u. At larger angles, the increase in (relative) intensity compared to the
single-electron distribution of Fig. 2.4 is a consequence of the lower frequency of the ~-be -
large-angle radiation, which allows more coherent enhancement. At angles greater
than the 2/y shown even lower frequencies become enhanced but these angles are
well outside of the acceptance of the experimental apparatus used in this project.
- To visualize the effect of the coherent enhancement on the observable energy
spectral density, the form-factor-enhanced version of the single-electron distribution
of Fig. 2.3 is displayed in Fig. 2.7, showing that some of the lower frequencies are
‘Z-. enhanced by the coherent effect while others are cancelled.
Finally, for future reference, Table 2.1 tabulates the radiated energy in Joules
expected from a single electron in each polarization mode (second and third columns),
then the same quantities after including the form factor (fourth and fifth columns),
as a function of increasing values of acceptance angle (first column). Note that at
3/y acceptance the total energy for a single electron is tabulated as 3.06 x 1O-22 J,
which agrees well with the formula:
rq2 Ny2K2 &3t = Tg = 3.18 x 1O-22 J.
0 X0 (2.36)
(The missing 4% appears at angles greater than 3/y.)
While Table 2.1 uses the N + 00 approximation, Eq. (2.12) is more accurate
(in the 0 = 0 d irection) and predicts the forward energy into an accepting solid
2.3. COHERENT ENHANCEMENT OF UNDULATOR RADIATION
Act ang
Coherent en spec dens ([J][sy[rad]) vs acceptance angle [l/gamma]
i 2
29
Frequency in units of fundamental
Figure 2.7: Coherently-enhanced energy spectral density as acceptance angle is in- creased. The acceptance angle is measured in units of l/y and the frequency is measured in units of the fundamental frequency wre = 3.57 x 1Or3 rad/s. The pa- rameters for this calculation are K = 0.6, N = 26, y = 29.35, 1 = 180 pm, and r mal = 1 mm. The N + 00 approximation is used, with n = 1 to 15. This figure can be directly compared with Fig. 2.3.

30 CHAPTER 2. THEORY OF SUPERRADIANT UNDULATOR RADIATION
.- angle of ~02 = n(y)” = 3.646 x 10m5, over a relative bandwidth of l/N, will be
-. 5.356 x 1O-24 J, which is close to the 6.866 x 1O-24 J obtained (in the N t 00
monochromatic approximation) in the first row of Table 2.1. The discrepancy is due
to the finite step size of integration used in computing Table 2.1 (a step of 0.5% of the
fundamental frequency was used) which creates some error with the extremely sharp
frequency spectrum that occurs at small opening angles in the N + co approximation.
Table 2.1 rapidly becomes more accurate at larger opening angles.
-&- -

2.3. COHERENT ENHANCEMENT OF UNDULATOR RADIATION 31
i
gle .. nle gcoh Kcoh
6.866e-24 3.738e-27 4.873e-26 3.052e-30 2.357e-23 5.659e-26 1.434e-25 7.434e-29 4.907e-23 2.593e-25 2.193e-25 3.027e-28 7.717e-23 7.092e-25 2.34e-25 4.059e-28 l .O91e-22 1.539e-24 2.451e-25 6.442e-28 1.406e-22 2.815e-24 3.08e-25 3.126e-27 1.682e-22 4.504e-24 3.917e-25 9.051e-27 1.911e-22 6.623e-24 4.411e-25 1.477e-26 2.09e-22 9.013e-24 4.5e-25 1.627e-26
2.225e-22 l.l57e-23 4.53e-25 1.713e-26 2.33e-22 1.436e-23 4.756e-25 2.514e-26
2;493e-22 1.688e-23 5.115e-25 4.085e-26 2.462e-22 1.948e-23 5.552e-25 6.352e-26 2.505e-22 2.184e-23 5.892e-25 8.385e-26 2.541e-22 2.418e-23 6.107e-25 9.826e-26 2.565e-22 2.593e-23 6.169e-25 l.O28e-25 2.59e-22 2.789e-23 6.179e-25 l.O36e-25
2.606e-22 2.923e-23 6.194e-25 l.O48e-25 2.62e-22 3.05e-23 6.271e-25 l.l16e-25
2.633e-22 3.168e-23 6.472e-25 1.296e-25 2.642e-22 3.259e-23 6.746e-25 1.549e-25 2.65e-22 3.342e-23 7.158e-25 1.937e-25
2.658e-22 3.421e-23 7.737e-25 2.492e-25 2.664e-22 3.472e-23 8.229e-25 2.97e-25 2.67e-22 3.541e-23 9.137e-25 3.862e-25
2.675e-22 3.587e-23 9.862e-25 4.582e-25 2.679e-22 3.629e-23 l.O68e-24 5.403e-25 2.681e-22 3.652e-23 l.l13e-24 5.851e-25 2.685e-22 3.689e-23 1.208e-24 6.819e-25 2.687e-22 3.709e-23 1.259e-24 7.338e-25
Table 2.1: The angle-integrated frequency-integrated radiated energy in the 2 po- larizations. The acceptance angle (first column) is measured in units of l/y. The radiated energy is measured in Joules. The first and second columns are the results for one electron, the third and fourth columns are the one electron results multiplied by the form factor. The parameters for this calculation are K = 0.6, N = 26, y = 29.35, 1 = 180 pm, and r,,, = 1 mm. The N + 00 approximation is used, with n = 1 to 15.
o! = ye,
0.1 0.2 0.3 0.4 0.5 0.6 0.7 0.8 0.9 1 1.1 1.2 1.3 1.4 1.5 1.6 1.7 1.8 1.9 2 2.1 2.2 2.3 2.4 2.5 2.6 2.7 2.8 2.9 3

Chapter 3
Theory of Self-Amplified -+- -
Spontaneous Emission *
-
The key assumptions in deriving the superradiant undulator radiation formulas of
the preceding chapter were that the electrons had equal energies and followed parallel
trajectories. One consequence of these assumptions is that the bunch emerges from
: the undulator with the same shape as it had when it entered. If the bunch does
change shape, for example due to different electrons radiating different amounts of
energy and following slightly different trajectories, then large changes in the radiated
energy may be seen due to the powerful effect of coherent enhancement. To model
this type of behavior, theory must account for the effect of the radiation on the bunch
dynamics.
High-gain FEL theory is concerned with this bunch/radiation dynamics. When
there is no external (seed) radiation field, the high-gain FEL dynamics is referred to
as SASE (Self-Amplified Spontaneous Emission) [31, for example].
The basic physics involves the interaction between the radiated field, the energy
distribution of the electron beam, and the charge density of the electron beam. In
a typical FEL the beam enters the undulator randomly bunched. The individual
33

34 CHAPTER 3. THEORY OF SELF-AMPLIFIED SPONTANEOUS EMISSION
electrons radiate at the fundamental frequency but with random phases, creating
: radiation at the fundamental frequency with power proportional to the current. As the
beam continues to propagate, electrons which radiate in phase with the spontaneous
field do work on it and lose energy, and consequently take a longer path through the
undulator. Other electrons gain energy from the field and take shorter paths through
the undulator. This energy-dependent path length provides a mechanism whereby
the beam can become bunched at the radiation wavelength thus greatly increasing
the radiated power, and is the source of gain in a single-pass FEL.
In a low-gain FEL an external field at frequency somewhat lower than the funda- -&. - F - .
mental frequency is amplified because particles that lose energy spend more time in
phase with the field, causing them to lose more energy, whereas particles at a phase
to gain energy spend less time at that phase and tend to move to a phase in which
they lose energy. Thus the particles tend to bunch at the radiation frequency, at a
phase in which they amplify the field. In a high-gain FEL bunching
fundamental frequency because the radiation is slowed down by the
-.--. being amplified [23, page 531.
3.1 Single-Pass FEL Theory
The simplest single-pass FEL model to examine computationally is a one dimen-
can occur at the
beam where it is
sional model. This provides insight into the physics and a quantitative prediction of
radiation gain that can be compared with experiment. The theoretical literature on
high-gain FELs is voluminous [24-29,11,30,31, for example] including review articles
[23,32, for example] and even books [33, for example]. For the purposes of this project
linearized, scaled FEL equations [ll] are applied as these permit a straightforward
analytical formulation covering the cases of no-gain, low-gain, and high-gain opera-
tion. The no-gain limit corresponds to the coherently-enhanced undulator radiation
3.1. SINGLE-PASS FEL THEORY 35
i
discussed in the previous chapter, and was originally the expected behavior for this
experiment. .
There exists a one-dimensional theory specifically describing the short-pulse super-
radiant regime [34], but to the author’s knowledge this theory has not been formulated
in a manner that covers the low and zero-gain limit, nor does it include the effects of
energy modulation of the initial electron bunch. Therefore, the theory of Ref. [34] is
not applied in this thesis.
3.1.1 Mathematical Formulation --6. - r --
Qualitatively, it is expected that the radiation field is mathematically related to
the bunching and energy modulation of the beam. In a linear model therefore one
would expect three equations relating the development of the three quantities (field,
bunching, and energy modulation), with particular solutions depending on the initial
conditions of the three quantities. Such a model exists and is documented in many
places [11,35, for example]. A review article by Murphy and Pellegrini [23] is the ref-
erence for this section. A definition of variables used in the mathematical formulation
is given in Table 3.1.
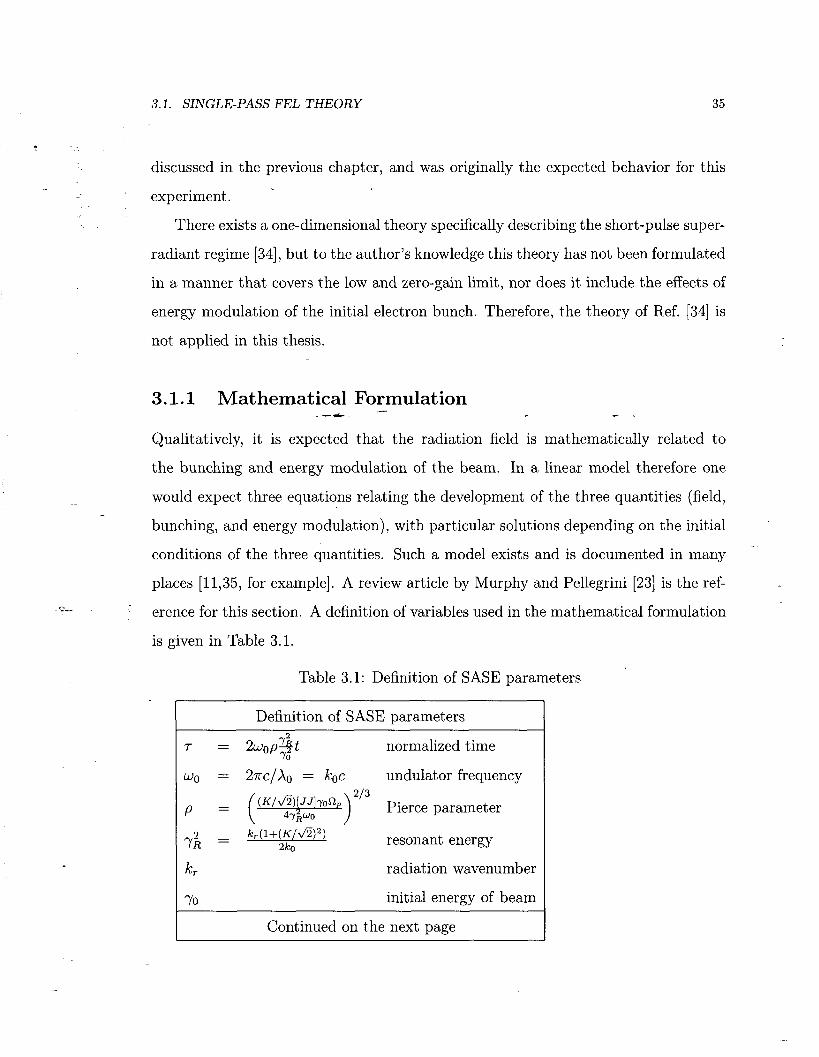
Table 3.1: Definition of SASE parameters
Definition of SASE parameters
7 = 2wop$ normalized time
wo = 27rc/x() = koc undulator frequency
P = (w) 2’3 Pierce parameter
7; = kr(1+(K/dq2) 2ko resonant energy
h- radiation wavenumber
70 initial energy of beam

36
i
CHAPTER 3. THEORY OF SELF-AMPLIFIED SPONTANEOUS EMISSION
Definition of SASE parameters, continued
[JJ] = Jo ($i&) - Jl (&$) planar undulator coupling correction
s2, = n,q2 ( >
112 com70
relativistic plasma frequency
%2 number density of electron bunch
X = &y;$gp2 normalized slowly varying amplitude
a0 = -iEroe%o slowly varying amplitude
/Xl2 = ;g$,
80 = wo (I- S) y = e-woiQj
( > bunching parameter
(9 = j$ Cgzl (*> averaging
j = 1,2,...N, indexing
tiOj = 27r(j - l)/Ne reference phase
5 = +oj - +j phase perturbation
z = ( eeiTqj) normalized energy distribution
% =Y relative energy deviation
CT2 = Q2 ‘1g space charge parameter
6 A@$ detuning parameter R
The three equations which describe the interaction between the radiated field X,
the bunching parameter Y, and the energy distribution 2 in the linear model are
derived in the reference [23]:
X - i(S - Jjo’)X + iY + pZ = 0,
-ipX+li-Z=O,
Xf%Y+i=O.

-
3.1. SINGLE-PASS FEL THEORY 37
The solution of these equations (3.1-3.3), including the effects of the initial con-
ditions, can be found by taking their Laplace transforms, defined by
X(S) = lm X(r)e-“‘dr.
where X0, Ye, and 20 are the initial conditions. Setting determinant of the matrix to
zero gives the poles (naturakesporise, homogeneous solutions) of the-system via the
dispersion relation:
[s-i(6-ic72)] (s2+f) -2ps-ipa2 -i = (s - sl)(S - S2)(S - S3) = 0, (3.5)
where sr, ~2, ss are of course the solutions of the dispersion relation. The solution for
the Laplace transform of the field variable, X(s), is
X0 i p
(S - SI)(S - SZ)(S - s3)X(s) = det Ya s -1
z-0 $ s
(3.6)
so
X(s) = X0(s2 + $) - Y,(is - a2) - Zo(ps + i)
(s - Sl)(S - s2)(s - s3) * (3.7)
After partial fraction expansion and transformation back to the r domain the result
for the field as a function of r is
X(7) = ( X0($ + 5) - Yo(isl - a2) - Z&xl + i)
(31 - S2)(Sl - s3) ) e SlT
+ (
X0($ + $) - Yo(is2 - a2) - Zo(ps2 + i)
(S2 - Sl)(S2 - s3) 1 e S2T
+ (
Xo(si + $) - Y0(is3 - 02) - Zo(ps3 + i) S3T
(s3 - Sl)(S3 - s2) )
e . (3.8)

38 CHAPTER 3. THEORY OF SELF-AMPLIFIED SPONTANEOUS EMISSION
Equation (3.8) includes the effect of initial perturbations in the field, bunching, and
: energy modulation via the three initial conditions X 0, Ye, and 2,. The author has not
found inclusion of the energy modulation terms elsewhere in the literature. Typically
it is assumed that 2, = 0, when Eq. (3.8) can be shown to give the correct low gain
and zero gain limits [23].
As a simple example of the solution of Eq. (3.8) consider the case of small S, 0,
and p. Then Eq. (3.5) becomes
$3 XI i
which has solutions
s1,2,3 = e in/6 , e &r/6 , e igT’6 = (h/2 + i/2), (--A/2 + i/2), (4).
and so in Eq. (3.8) - X(T) = (
.s2x (s1 - s2,(sYl - s3) )
,(A/2+iP)T + . . . . The e(fi/z)T t erm gives exponential growth of the field as ePntiPN and thus exponential
growth of the radiated energy as eNIN, where -i.
Ng = 1 47&P
(3.9)
is the energy gain length in terms of the number of undulator periods N.’ After
several-gain lengths the exponential growing term will dominate, but at the beginning
of the undulator the exponentially damped and the oscillating terms must also be
considered.
Along with Eq. (3.8) for the field variable, similar expressions can be derived for
the bunching parameter Y
Y(r) = Xo(ipsl - 1) + Y ( o ST -isl(S - $) -p)+ Zo(sl -i(S - $) -ip2)
(Sl - S2)(Sl - s3)
x eslT
+ similar terms for es2Tand es3T (3.10)

3.1. SINGLE-PASS FEL THEORY 39
and for the energy modulation 2
Z(r) = x&T2 - Sl) - Y,($( s1 - i(S - <)) - i) + Ze(s2 - isr(S - 5) - p)
(Sl - s2)(s1 - s3)
x eslT
+ similar terms for eS2Tand es3T. (3.11)
The slowly-varying envelope approximation used in obtaining the above formulas
assumes the radiation field can be written in the form
,qz, q = ,rqz, t)ei3r(z,t)ei(k~r-w~t) (3.12) -+- - r -
where the time (and spatial) variation of E, and $I~ are much slower than w, (and Ic,).
Thus Eq. (3.8) d escribes the development of the Fourier amplitude X corresponding to
a particular radiation frequency w,. To get the complete solution X+(r) is computed
for each frequency w, of interest. These XUr give the radiated energy spectral density
per solid angle in the forward direction as a function of undulator length.
To link the theory to experiment, the initial conditions Xe, Ye, and Za for the field,
bunching, and energy modulation must be specified. The initial field Xc is simply
zero. The bunching parameter is defined in Table 3.1:
y = ( @oiQj) . (3.13)
For the purposes of determining the inital condition Ya for continuous finite-length
distributions, the definition
s
1 Y = eeikzS(z)dx,
0 (3.14)
where 1 is the bunch length and S(Z) is the longitudinal particle density normalized
to one, is used. This gives a non-zero value for a rectangular distribution (S(Z) = l/Z)
if it is not an integral number of wavelengths long:
(3.15)

40 CHAPTER 3. THEORY OF SELF-AMPLIFIED SPONTANEOUS EMISSION \
which is the square root of the form factor (see the first factor in Eq. 2.34) up to a
: phase factor.
Similarly, the initial condition for the energy modulation due to a linear energy
chirp from “yo to 7maI occurring over the bunch length I is with
SE= 'Ymaz-70, (3.16) TO
This evaluates to
Z-0 = GE p1/x,
2p711/Xr-^ ( e-id/x, _ sin 7rl/X,
) 7rl/X, -’
(3.17)
_ (3.18) which will be used later in analyzing the experimental data.
Another step in linking the one-dimensional theory to experiment is to convert the
- one-dimensional solution to three-dimensions. One way to do this [30] is to consider
that the theory has found a Fourier amplitude ET0 for a particular frequency w,, which
can be interpreted in three-dimensional Fourier space by considering the solution to
be in the volume occupied by the beam, with periodic boundary conditions. Then *-‘--
Pars&al’s theorem will give
& = co .I
]E(@]$$d3” = eo& /- ]E(@j2w2dwdR,_, (3.19)
where 6 is the volume energy density in beam volume V and V/(27r)3 is the density
of states in &space. In the forward direction then,
d21 V2 d&b 8=. = tO(~~c,3w21E(W)12~ (3.20)
where IE(w)l 2 is given by the one-dimensional theory. This allows comparison with
the coherently-enhanced version of Eq. 2.12:
d21
dfidw o=. (3.21)
wheren= 1,3,5... is the harmonic number. The low particle density (p --+ 0) limit
of the FEL equations (3.8) agrees with Eq. (3.21) with n = 1 [30].

3.1. SINGLEPASS FEL THEORY
Scaled SASE parameters as a function of undulator length (SE parameters as a function of undulator length
--
0) 0.25- 7i 2 2 0.2- P
--
10 15 20 25 30 Period number
41
- Figure 3.1: Calculated magnitude of variables X, Y, and 2 vs. undulator length at the resonant wavelength. The bunch is of length 180 pm and radius 1 mm and contains 2 x lo8 electrons of energy “/o = 29.35. The wiggler is at strength K = 0.6 and has 26 periods each of length X0 = 0.077 m. The initial conditions are that 20 = 0 and X0 = 0; Ye is the square root of the form factor at the radiation frequency w,.
3.1.2 Numerical Evaluation
The theory can now be evaluated for the SUNSHINE experiment, and its output
_ compared with the superradiant formulas of the preceding chapter. As in the previous
chapter, numerical calculations are made for a cylindrical bunch of length 180 pm
and radius 1 mm. The bunch contains 2 x 10’ electrons of energy y. = 29.35. The
wiggler is at strength K = 0.6 and has 26 periods each of length X0 = 0.077 m. The
initial conditions are that 2s = 0 and X0 = 0; Yo is taken from the form factor at the
radiation frequency w, as Y. = ,/m. Th e scaling parameters at frequency wie
are S = 0, p = 0.009423, g = 0.04825, r = 0 to 3.079 over 26 periods of undulator,
X0 = 0, Ye = 0.08986, and 20 = 0. The resulting behavior of the SASE variables
X, Y, and 2 is shown in Fig. 3.1.

42 CHAPTER 3. THEORY OF SELF-AMPLIFIED SPONTANEOUS EMISSlON
i
1
0
90
-
0
0
.211-
I-
.a-
.6-
.4 -
.2-
o- 0
IO4 Energy per solid angle in the forward direction
K=0.6; gammaz29.35; Ne=2e6; k160micron; r-max=imm
- FEL theory Coherently-enhanced undulator radiation
10 15 20 Number of undulator periods N
Figure 3.2: Frequency-integrated energy per solid angle radiated in the forward di- rection as a function of undulator length calculated from Eq. (3.8) compared with coherently-enhanced undulator radiation calculated from Eq. (3.21) with n=l. The non-linearities for N < 5 occur because when the undulator is short the radiation spectrum becomes dominated by the form factor of the bunch rather than the undu- lator response, as discussed in Section 2.3.1.

3.1. SINGLE-PASS FEL THEORY 43
i
The calculated energy per solid angle in the forward direction, after integrating
over frequency, is plotted in Fig. 3.2, along with the coherently-enhanced Eq. (3.21).
The FEL theory agrees with the superradiant calculation at the beginning of the
undulator, but diverges from it and predicts exponential increase in energy towards
the end of the undulator.
Chapter 4
Experimental Setup
The previous two chapters have described the simplest theory of what might happen as
a short bunch travels through the undulator: one expects to see superradiant coherent
emission depending linearly’on the length of the undulator, and possibly the startup of
the SASE process which would give a measurable greater-than-linear radiated energy
versus length. The present chapter describes the setup of the experiment and the
=2-- properties of the electron beam.
4.1 The SUNSHINE facility
The SUNSHINE facilty consists of the following main components, as shown in
Fig. 4.1:
l A thermionic-cathode rf gun [36] provides a 2.5 MeV electron beam.
l An alpha magnet bends the beam about 270 degrees and allows energy colli-
mation via beam scrapers at the high-dispersion point.
l A SLAC lo-foot linac section is phased to accelerate the beam to about 15 MeV
for undulator radiation, although up to about 32 MeV is possible.
45

46 CHAPTER 4. EXPERIMENTAL SETUP
i
l A planar 26-period permanent magnet undulator creates superradiant radiation.
l Immediately after the undulator, an Al screen reflects the undulator radiation
out of the vacuum chamber to allow measurements of the spatial diatribution.
l Downstream of the electron beam dump, an Al-coated Mylar film reflects the
radiation into a Michelson interferometer for spectral analysis.
The thermionic rf gun, electron-beam optics, alpha magnet, linac, and the beam
dynamics of bunch compression- m discussed at length in the references by- Borland
[36] and Kung [37]. In particular reference [36] d escribes the experimental setup in
detail. Articles [38] and [39] also discuss the facility.
4.1.1 Rf Gun and Alpha Magnet
The features necessary to produce short bunches begin with the rf gun which is
adjusted (run at about 2 MW input power) to produce an M 2.5 MeV beam in which
there is a strong, almost linear, energy-time correlation, with first particles exiting
having the highest energy. The alpha magnet makes the higher energy particles
travel longer paths and reverses the energy-time correlation so that the higher energy
particles are later in time. As the beam drifts, the higher energy particles eventually
catch up to the lower-energy particles and a short bunch is formed. Energy collimation
in the alpha magnet removes particles which do not contribute to the short bunch.
The rf gun and the longitudinal dynamics of the beam have been extensively simulated
by Michael Borland [36] and Pam Kung [37], using MASK to model the gun and then
using elegant [36] or longi [37] to track the MASK output particles through the
rest of the beam line. The simulation results of longi shown in Figure 4.2 illustrate
the bunching process - note the change of scale in the figure.

4.1. THE SUNSHINE FACILITY 47
i
/\ Alpha magnet with energy slit
Actuator inserted Al film.
Beam dump a
Undulator
measured radiated energy and xyz distribution.
Michelson interferometer #l measured bunch length via coherent transition radiation.
Michelson interferometer #2 measured energy spectrum of undulator radiation.
Figure 4.1: Block diagram of the SUNSHINE facility.

48
i
CHAPTER 4. EXPERIMENTAL SETUP
At alpha exit
At linac entrance At linac exit
p 31.1
3co E 31
2 2 3
5 6 30.9 200
= 30.8 100
30.7
30.6 0
-6 10.13 0 loo
At undulator entrance 31.3~,,.,,....,,., I,, 1 ajsw
Longi simulation results for:
Alpha at 190 Amps Low slit at 5.06 [mc] Linac at -45 deg phase Linac at IO MVlm amplitude.
Figure 4.2: Simulation of bunch compression for superradiant undulator radiation at SUNSHINE. The dots show the energy vs. time distribution of the simulation
macro-particles. The solid line with circles shows the projection onto the time axis.

4.1. THE SUNSHINE FACILITY 49
i
4.1.2 Linac
The beam can be accelerated up to as much as about 32 MeV in the linac section,
which is a standard SLAC lo-foot section [40] powered by about 14 MW of 2856 MHz
rf power. There are two effects which must be considered concerning the high-current
non-ultra-relativistic beam from the rf gun. First, since the beam has some velocity
spread upon entering the linac and the acceleration is not infinite within the linac, the
longitudinal dynamics of the beam becomes important, particularly when the beam
is run far off the crest of the rf, as is necessary to achieve low energies. Secondly,
since the linac requires a Fiji@ timgto fill with rf energy, which the beam can remove - -
almost instantaneously, beam-loading effects are important. The first effect causes
bunch lengthening/compression and energy spread within the micropulse. The second
- - effect causes a large energy spread across the macropulse.
4.1.3 Undulator
The undulator used in this experiment is a planar 26-period permanent magnet de-
sign with an adjustable gap. The samarium-cobalt (SmCos) permanent magnets are
arranged in a M = 4 block per period Halbach configuration [41] with filling factor
E = 1, as shown in Fig. 2.1. The magnetic field has the form [41]
-B, + iB, = 2iB, 5 cos [mko( z + iy)] cmkogi2 (1 - e-my p=o
sin;K;$? ) (4.1)
where g is the (full) gap distance, h = X0/4 is the height of the permanent magnets,
B, is the remnant field of a single magnet, and m = 1 + PM. The vertical field due
to the dominant p = 0 term is
B, = 1.4263B,e-“g’Xo cosh( Icoy) cos( i&z) (4.2)
which in the y = 0 plane simplifies to
B, = B. cos( koz). (4.3)

50 CHAPTER 4. EXPERIMENTAL SETUP
i
.. As shown in Fig. 2.1, the undulator begins with a half-block at the phase of maximum
.- field. Defining z = 0 at this point and ‘neglecting fringe-field effects, the field does
indeed depend on z as B, = Bo cos(koz).
For the SUNSHINE undulator [17]
B. = 13.1e-“g’xo [kG], (4.4)
the period is X0 = 7.7 cm and the gap is adjustable from 8 cm to 2.5 cm, so Bo varies
from 0.050 kG to 4.72 kG. The strength parameter K, given in practical units by
K = O.O934B[kG]X,[cm] , -d.- -
can be varied from 0.36 to 3.4.
(4.5) - -
In order that the undulator introduce no change in angle or transverse position
of th<- beam exiting the undulator as compared with entering the undulator, the
following conditions must be met:
s 0 LBY(t)dz=O and lL[i*BV(~)d~]d~=O. (4.6)
The first condition guarantees that the change angle is zero, the second that the *z*-
change in offset (ie the integral of the angle) is zero. The condition of no net angle
is met by using an integral number of undulator periods as then obviously
s
NXo B. cos(koz + $o)dz = 0.
0
Here $0 is the phase of the undulator where the beam enters. The condition of no
net offset is met by having the beam enter at the phase of field maximum (ie +. = 0)
as then NXo u
s s NXo B. cos(Foz)dzdu =
0 0 s 0 2 [sin(lcoU) - sin(O)] du
J’ NXo B. XZ
0 - sin( keu)du k0
= 0,
as is true for the SUNSHINE undulator, when fringe-field effects are negligible.

4.2. THE ELECTRON BEAM 51
i
l/(Repetition rate) yf 16.67ms*N where N=2,3,4, . ..15 y
< 700 to 1000 ns x /. * p35ops Micropulses
++6OOfs j j /
ji j j
. . .
. . .
i< Macropulse 4 5 Macropulse --+
Figure 4.3: The time format of the SUNSHINE electron beam. -+- - - *
4.2 The Electron Beam
- $The properties of the electron beam are typically separated into logitudinal and trans- -
verse categories where the momentum (or energy) and z-position, or equivalently time,
are the longitudinal variables and the offsets and angles are the transverse variables.
4.2.1 Time Format
The time format of the electron beam produced at SUNSHINE for the superra-
diant undulator work is shown in Fig. 4.3. The beam consists of an M 1 ps long
macropulse at a repetition rate of from 4 Hz to 30 Hz. The repetition rate is de-
termined by dividing the 60 Hz power-line frequency, to which the beam pulse is
synchronized, by an integer from 2 to 15. The repetition rate was 15 Hz for much of
the superradiant undulator work.
Each macropulse consists of a set of microbunches spaced at 350 ps (l/2856 MHz).
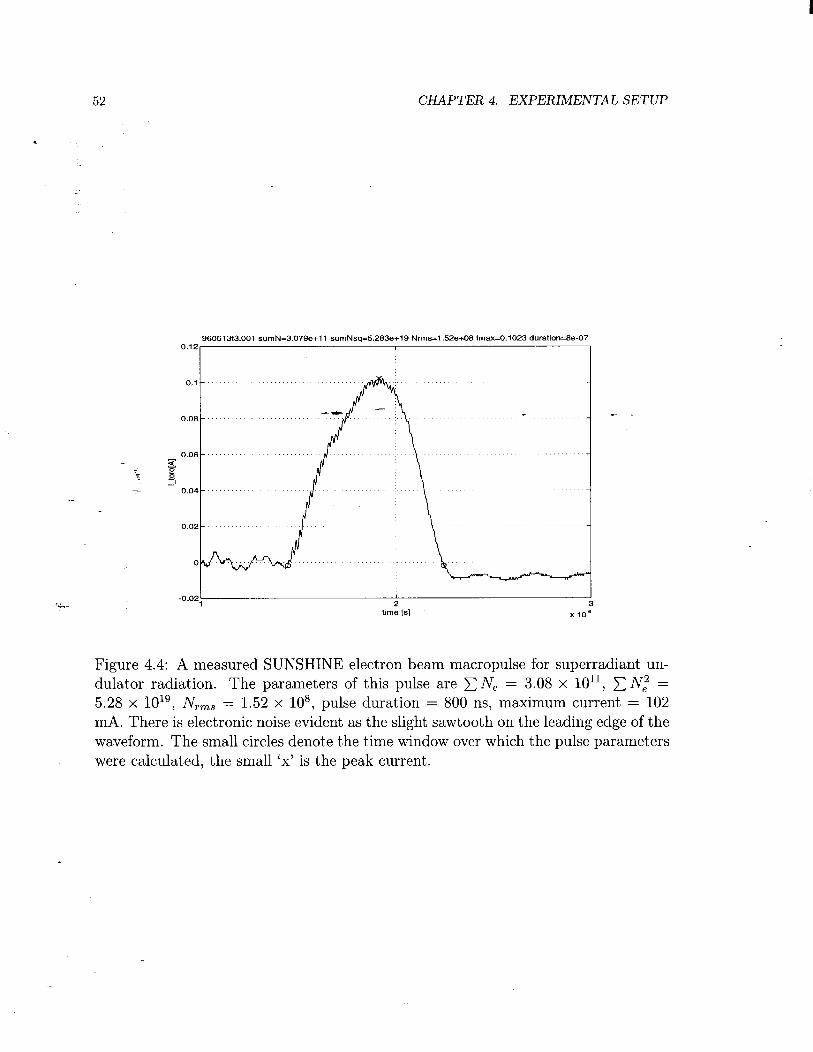
The microbunches are not necessarily equally populated, as seen in Figure 4.4, which
illustrates the measured macropulse current at the undulator. The measurement used
the induced current in a ferrite-core toroid encircling the electron beam.
The superradiant emission is proportional to Cj Nzj, where N,j is the number of
52 CHAPTER 4. EXPERIMENTAL SETUP
-; -
-
960613t3.001 sumN=3.079e+ll sumNsq=5283e+19 Nrms=l.52e+O8 lmax=0.1023 duration=%+07 A 49 V. IL
0.1 -
-
-
g
B -1
0.04-
0.02 -
-0.02 ‘A- l 2 3
time [s] x ion=
Figure 4.4: A measured SUNSHINE electron beam macropulse for superradiant un- dulator radiation. The parameters of this pulse are C N, = 3.08 x loll, C Ni = 5.28 x 101’ N - 1.52 x 10⁸, pulse duration = 800 ns, maximum current = 102 mA. There is e;kmc;.r&ic noise evident as the slight sawtooth on the leading edge of the waveform. The small circles denote the time window over which the pulse parameters were calculated, the small ‘x’ is the peak current.

4.2. THE ELECTRON BEAM 53
i
electrons in the jth microbunch, and where the sum is over all the microbunches.
Therefore the macropulse is characterized in this thesis by either Q N$, or by the
rms (root-mean-square) current value.
4.2.2 Bunch Form Factor
The microbunches have a time structure of their own, which is measured at SUN-
SHINE by interferometry of coherent transition radiation [3,42,22]. It is of course
this structure that provides the superradiance and the seed for SASE. The references
142,221 describe the bunch&$h-measuring system in-detail. Here, the principles
relevant to this thesis are briefly discussed.
- :. The bunch structure is obtained from transition radiation that occurs when the
_ electron bunch strikes a conductor. Imagining a single electron striking a perfect con-
ductor, one sees that the (backward) transition radiation is mathematically equivalent
to the radiation from the instantaneous longitudinal decceleration of the image charge,
and is thus a S-function in time. From the many electrons in a bunch the radiation
would then be the sum of many such S-functions leading to the conclusion that the
transition radiation is the time-replica of the electron bunch.
Thus by optical methods applied to the transition radiation, the bunch structure
can be determined. At SUNSHINE, a Michelson interferometer is used to study the
transition radiation. The interferometer consists of a beam-splitter that creates two
pulses whose relative times-of-arrival at the detector are adjusted by a moving mirror.
The detector responds to the energy it receives, which is proportional to the square
of the magnitude of the electric field; the phase information is lost. Therefore in
principle, one cannot say with certainty what the bunch shape is from the interfero-
gram, but it can be shown that (within a constant factor) the Fourier transform of
the interferogram is the form factor of the bunch.
Figure 4.5 shows the measured and simulated form factors. The essential feature

CHAPTER 4. EXPERIMENTAL SETUP
Wavenumber [l/cm]
Figure 4.5: The measured and simulated bunch spectrum are compared to the spec- trum expected from a 240-pm rectangular bunch. The envelope of the 240-pm bunch,
defined as (2)’ where 1 2 X/2, is a convenient approximation of the measured form factor.

4.2. THE ELECTRON BEAM 55
i
is that the form factor falls off rapidly with wavenumber (wavenumber is defined as
l/wavelength), at a rate of about 20 dB/decade. That is, the form factor falls 2
orders of magnitude with every one order of magnitude increase in wavenumber. The
simulated form factor at the undulator entrance, shown in Fig. 4.2, agrees with the
main feature of the measurement: the form factor rolls off at about 20 dB/decade.
This is what would be expected from an approximately rectangular pulse, and in fact a
240 pm rectangular pulse describes the measured form factor well, provided the zeros
of the rectangular pulse’s form factor are removed by taking only the envelope. This
does not mean that the pulse is 240 pm long, but rather this is a simple approximation
which describes the measured form factor:
(4.7)
and
where 1 = 240 pm.
It is also helpful to have a simple approximation of the bunch structure in the
spatial domain. At SUNSHINE it is assumed that the bunch is either Gaussian or
rectangular, making it possible to estimate its length from the FWHM (full-width
half-maximum) of the interferogram. Assuming a rectangular distribution, the bunch
length estimated from the FWHM of the interferogram is 180 pm. The difference
between this number and the 240 pm above is easily explained as due to the non-
rectangular shape of the real bunch, which may resemble the simulation shown in
Fig. 4.2. As pointed out earlier, the spatial structure cannot be uniquely determined
from the measured interferogram, but the form factor, as approximated in Eq. (4.7),
is a reliable measurement.

56
i
CHAPTER 4. EXPERIMENTAL SETUP
Momentum distribution of the macropulse
- Figure 4.6: The measured energy versus time distribution of the SUNSHINE electron beam macropulse.
4.2.3 Energy
The-energy spread of the beam over the macropulse is greatly affected by transient
beam loading. The rf gun starts emitting before the linac has filled, so there is an
energy ramp up at the beginning of the macropulse. Then the beam current draws
energy -from the linac and causes an energy droop at the end of the macropulse. The
linac-filling time constant is about 800 ns, whereas the beam can extract energy almost
instantaneously, so one expects that a constant current is required for several 800 ns
fill times to achieve equilibrium. However, the SUNSHINE macropulse, as shown in
Fig. 4.4, has large current variation within 800 ns, and therefore the macropulse has
a large energy variation, as shown in the measurement of Fig. 4.6.
Figure 4.6 shows ‘ghosts’ at lower and higher energies than the real beam. These
ghosts result from gaps at the edges of the energy collimator such that when the beam
is directed towards the edge of the collimator, about 20% of the current finds its way to

4.2. THE ELECTRON BEAM 57
i
Measured, fit, and simulated microbunch momentum distribution
g 0.05 -
2
go.o4- s P z 0.03 -
0.02 -
0.01 -
d
: . . : 0 0;
:rJ ‘.
0 ..O ..o 0 : ‘..
ol.... ” ” 9.: ’
, ‘&.i’
IO Measurement I
12.5 13 13.5 14 14.5 15 15.5 16 Momentum [mc]
16 .5
- Figure 4.7: The energy versus time distribution of the SUNSHINE electron beam mi- cropulse has obE/E = 0.9%. The measured satellites are an artifact of the momentum collimator. The simulated energy spread is the energy-shifted version of Fig. 4.2, and has u~E/E = 0.2%.
the Faraday cup that measures the transmitted current. The ghosts can be eliminated
from the data by fitting each time slice of data with a Gaussian distribution having
two satellite Gaussians of 20% amplitude shifted in energy by f7%. The standard
deviation of the fit Gaussian then characterizes the energy spread of the microbunch.
Figure 4.7 displays the Gaussian plus satellites fit for the time slice with the
highest peak current. This 10 ns time slice has a standard deviation of energy of
0.9%, which includes broadening due to the &0.5% aperture of the collimator. Taking
the collimator as a Gaussian aperture of a,ff = 1%/G gives 0~ = d0.g2 - 0.42 =
0.8% as the measured energy spread of the micropulse. This measurement is an
overestimate since the collimation is not perfect and appears to let twice as much
current to the Faraday cup than would be expected from a hard-edge collimator

58 CHAPTER 4. EXPERIMENTAL SETUP
. model. .’ The measured energy spread is much.larger than the about 0.2% simulated energy
spread. It is not possible to say from the measurement whether the micropulse energy
spread is correlated or random, but simulations suggest a correlated energy spread.
4.2.4 Transverse Emittance
At the time of writing the transverse structure is the least-measured feature of the
SUNSHINE electron beam. This is because the large variation in energy over the
macropulse (see Fig. 4.6) makes ittCfIicu~ to interpret measurements made-with the
relatively slow phosphor screens ‘. However previous measurements done on a similar
setup-at SSRL h ave shown a normalized l-a emittance of the microbunch of about
- 207r mm-mrad [36].
In this thesis, simulation results combined with phosphor screen measurements
before and after the undulator are used to characterize the transverse size of the bunch
through the undulator. Despite the above 207r mm-mrad emittance measurement at
SSRL, TRANSPORT runs corresponding to a 5n mm-mrad [37] microbunch yield
reasonable agreement with the observed beam sizes at the entrance and exit of the
SUNSHINE undulator. This may be because large offset particles are being scraped
within the linac section, effectively reducing the emittance of the transmitted beam.
The measured electron beam transverse full widths were 2.9 mm horizontal and 2.5
mm vertical at the phosphor screen before the undulator and 4.5 mm horizontal and
1.9 mm vertical at the screen after the undulator, which are comparable to 40 where
0 is from TRANSPORT output shown in Figs. 4.8 and 4.9. From TRANSPORT, the
average transverse sizes of the beam within the undulator are about oa: = 0.6 mm and
IJ~ = 0.4 mm. Taking or = 0.5 mm, the beam can be modelled as a cylinder with a
‘Work is underway on a wire-scanner system that will be able to resolve the details of the microbunch at SUNSHINE.

I
4.2. THE ELECTRON BEAM
0.4
0.35
0.3
0.25 -z 0 x 0.2
.4 VI 0.15
0.1
5,000000e-02
0
undul5mv r
i/
L
k-2
59
X:---
: -
-
I
linac QQ TR QQ undulator dump
Figure 4.8: Transport simulation of 0%.
undul5mv
:
linac QQ TR QQ undulator a=P
Figure 4.9: Transport simulation of gy.
-

60 CHAPTER 4. EXPERIMENTAL SETUP
. radially Gaussian density distribution where the distance from the center (maximum
: density) to the l/e2 point is 1 mm. This 1 mm radius contains 86% of the electron
beam. The average angular spreads from TRANSPORT are g2, = 0.5 mrad and
cry1 = 0.5 mrad.
4.3 Instrumentation
A detailed schematic of the setup to measure the undulator radiation is shown -&- - - - .
in Fig. 4.10. Starting from the undulator itself (17), the first feature is a travelling
steering magnet (18) to kick the beam out of the undulator chamber and thus allow
measuements of the radiated energy as a function of effective undulator length. The
magnet consists of two air-core coils of about 100 turns powered at 5 amps and
producing a measured J BdZ of 2 kG-cm (integrated over about 20 cm) at the center
of the undulator chamber. This is enough to kick the beam by an angle of l/y, and
-A. thus separates the beam and the radiation by the end of the corrector. In this project
the beam is considered dumped at the downstream end of the corrector. The corrector
location is monitored by a TV camera (19) and the position is changed remotely by
an electric motor.
The undulator is immediately followed by a screen that reflects the radiation out of
the vacuum chamber (22), through a high-density polyethelyne (HDPE) window, and
finally to a pyroelectric detector (‘bolometer’) mounted on a 3-dimensional translation
stage (20) capable of over 1 m of longitudinal motion, approximately 4 inches of
horizontal motion, and 2 inches of vertical motion. This allows measurement of the
spatial distribution and divergence of the radiation.
In the forward direction after the undulator, the dump magnet (25) bends the
electron beam down to the Faraday cup and the undulator radiation continues to an

1 = 79.4cm + 36.8 += 200.0cm +15.2+ + 99.7cm = 88.3cm --+
0 15
Component list: 1 - Bolometer. 2 - Copper condensing cone. 3 - Precision translation stage. 4 - Moving mirror. 5 - Mylar beam-splitter. 6 - Stationary mirror. 7 - Paraboloidal mirror. 8 - Flat mirror. 9 - 5-way cross allows insertion
of transition radiator and phosphor screen. Light exits out a 3/4 inch diameter lmm thick high-density polyethlyene (HDPE) window.
lo- Toroid 3 current monitor. 1 l- TV camera. 12- QS focussing quadrapole. 13- Q9 defocussing quadrapole. 14- 4-cross allows insertion of phosphor screen. 15 TV camera. 16- WV1 vertical and WHl horizontal
steering magnets.
0 23
17- 26-period 2-m long undulator. 1% Travelling horizontal steering magnet. 19- TV camera monitors postion
of travelling steering magnet. 20- XYZ translation stage. 21- Bolometer. 22- 5-way cross allows insertion of
mirror and phosphor screen. Light exits out a l-1/4 inch diameter, lmm thick HDPE window.
23- TV camera. 24- Toroid 4 current monitor. 25- Dump magnet deflects beam down
to faraday cup dump/current monitor. 26. Dump chamber. 27- 5-way cross allows insertion of Al-coated
Mylar film. Light exits out a 3/4 inch diameter lmm thick HDPE window.
28 Stationary mirror. 29- Precision translation stage and
moving mirror. 30- Mylar beam-splitter. 3 1- Parabaloidal mirror. 32- Bolometer.
I
Some relevant dimensions: From radiator to HDPE window in cross (9): Optical path length from HDPE window in (9) to bolometer ( 1): Inner radius of undulator chamber: From radiator to HDPE window in cross (22): Dump chamber horizontal aperture: From radiator to HDPE window
’ in cross (27): Optical path length from HDPE window in (27) to bolometer (32):
7.3 cm
57.2 cm 1.0 cm
13.7 cm
2.5 cm
7.3 cm
32.4 cm
Superrudiant Undulutor Radiation Experimental Setup June-Aug. 96
This drawing is not to scale.
Figure 4.10: Detailed schematic of the superradiant undulator radiation setup.

62 CHAPTER 4. EXPERIMENTAL SETUP
aluminum-coated Mylar film (27) which reflects the light into a Michelson interferom-
: eter (2%32), discussed in-the next section. At this point there can be no interference
from transition radiation and there is very little acceptance of synchrotron radiation
from the dump magnet. Thus this Michelson is ideal for measuring the radiated
energy as a function of undulator length.
Not shown in the figure is another screen 2 m downstream of the dump Michelson
which was used for interferometry and xy measurements at various stages of the
investigation.
-rc- -
4.3.1 Pyroelectric Detector and Electronics - -
The- superradiant undulator radiation was measured using Molectron Pl-65 room-
_- temperature pyroelectric bolometers. These devices consist of a 5 mm active diameter
LiTaOs crystal which expands when it absorbs energy. The crystal has net electric
polarization, which changes as the crystal expands, giving a AC signal which is am-
plified by electronics [22] h aving a gain of from 1 up to 200 into a 50 R load and =i-
from 2 up to 400 into a high-impedance load. The relative spectral response of the
detector is flat from at least 3 pm to about 100 pm according to the Molectron data
sheet.
The responsivity of the detector is quoted by the manufacturer to be typically 25
V/W at 25 Hz at 632.8 nm and is measured by the manufacturer to be between 28
and 32 V/W at 15 Hz at 632.8 nm for the devices used in this work. In the factory
calibration mode the response of the detector is given as
R,[V/W] = ck!Ri RE j2xf RTH 1 +j2rfRECT 1 +j2n-fRTH (4.9)
where
Ri = current responsivity in A/W

4.3. INSTRUMENTATION 63
cy = absorption coefficient (assumed = 1 in calibration)
RE = load resistor or feedback resistor in ohms (108R)
f = frequency in Hz (15 Hz for factory calibration)
CT = CD + &np in F in voltage mode (75 pF) and Cf in current mode
H = heat capacity in J/‘C (RTH = l/r s)
RT = thermal resistance in ‘C/W -&- -
Putting in the numbers at 15 Hz gives the calibration value of
-~ (a& > factory = 0.37 f 0.02 [/LA/W] _-
for the uncoated detectors used in this experiment, and
(&)cc,factory = 0.61[,9.A/W] -i.
for the detector equipped with a black absorbing coating. The manufacturer also
directly quotes the typical current responsivity as
(&)~atas~eet = 0.25 [d/W]
so there are some discrepancies.
In any case it is necessary to calibrate the response of the entire detection system
including electronics and cables, as the responsivity can easily be degraded by stray
capacitance, and the electronic amplification can be degraded by the high output
impedance of the FET included with the detector.
In this experiment the detectors respond to a 1 ps macropulse of radiation, which
is much faster than the RECT = 10’ x 75 x lo-l2 = 7.5 ms time constant. The

64 CHAPTER 4. EXPERIMENTAL SETUP
Sdibration with condensed radiation:
Pyroelectric detector and amplifier
Pymelecuic detector and amplifier.
IJ ...I ..-
E3“
.._ f‘,,
_.
undulat . . .
I Calibration with on-axis radiation:
Power meter t5cm
5mm diameter aperture -r
- - .-.... .y-&-“’ ( _. ._..
Figure 4.11: Detector system calibration setup.
response is then that the detector integrates the input radiation pulse over the entire
macropulse with a voltage responsivity of
~-i- (&)jactory = F
0.37 x 1o-6 = 75 x 10-12 = (4.9 f 0.3) x lo3 [V/J]
for the uncoated detector and
(Rv )cc,factory = 8.1 x lo3 [V/J] (4.10)
for the coated detector according to the manufacturer’s calibration at 632.8 nm, and
3.2 x lo3 [V/J] if the manufacturer’s data sheet number for the current responsivity
is used.
The calibration was done at FIR wavelengths by comparing the signal from the
pyroelectric detector and its electronics with the response of a Scientech laser power

4.3. INSTRUMENTATION 65
170 pm on-axis radiation condensed rad. units power meter voltage 46.8 f 1.5 558 f 16 WI power meter average power 0.498 f 0.016 5.87 f 0.17 WV avg. energy per macropulse 49.8 ZII 1.6 587 f 17 bJ1 uncoated pyroelectric (1.99 f 0.04)/20 (1.12 f 0.07)/l [V]/(amp gain) coated pyroelectric (1.94 f 0.04)/20 (2.03 f 0.13)/2 gain) uncoated calibration 2.00 f 0.10 1.91 f 0.17 [~~(;np
coated calibration 1.95 f 0.10 1.73 rk 0.16 Iv/:Jl overall calibration 1.9 f 0.1 WmJl
Table 4.1: Detector system calibration with 170 pm undulator radiation.
meter. The Scientech is basically a thermopile detector which has a quoted response -+- - * -- .
of 93 pV/mW input power. That is, the Scientech produces 93 PV when it absorbs
1 mW of average power. This response was checked by inputting a known amount
-~of electrical power, and measuring the Scientech’s output. This calibration gave
95 pV/mW, verifying the Scientech was working correctly.
The undulator and beamline were set up to produce an M 2 V/macropulse signal
at - 170 pm with the pyroelectric detector electronics at a gain of 2. The detector
: system was calibrated in two different ways with two different pyroelectric elements.
The two calibration methods are shown in Fig. 4.11.
The first method was to use the high average power, at 170 pm, .collected by a
condensing cone, to compare the Scientech power meter measurement to the average
power measured by the detector system (the macropulse energy multiplied by the
repetition rate, which was 10 Hz for the calibration).
The second method did not use the cone; the power propagating directly to the 5-
mm diameter active surface of the pyroelectric element was compared with the power
allowed through a 5-mm diameter aperture to the power meter. The two pyrolelectric
elements were a standard Pl-65 detector and a Pl-65 detector with a black absorbing
coating.
The results of the calibration measurements at 170 pm are shown in Table 4.1

66 CHAPTER 4. EXPERIMENTAL SETUP
and show an overall responsitivity of
: (&)170pm = 1.9 f 0.1 [V/mJ] (4.11)
for the entire detection system using the nominal gain of the electronics. This is
about a factor of two less responsive than would be expected from the manufacturer’s
claims for the uncoated detector, and a factor of four less than the claims for the
coated detector.
The explanation for this discrepancy is that the detectors, and in particular the
coated detector, are less sensitive to long (ie > 10 pm) wavelengths than to the optical
wavelengths at which the manufa&urer c%librates the device. A calibration--done at
50 pm (Table 4.2) showed a much greater
( Rv)cc,50pm = 4.3 Z!X 0.3 [V/mJ] (4.12)
responsivity for the coated bolometer, which is more consistent with the data sheet
and with the 632.8 nm calibration. Calibrating the uncoated bolometer with respect
to the coated one gives
(Rv)50pm = 2.5 f 0.5 [V/mJ] (4.13)
as the responsivity of the uncoated bolometer at 50 pm.
Neither of these calibrations is corrected for atmospheric absorption, which is
assumed zero, or for the absorptivity of the Scientech power meter, which is assumed
perfectly absorbing. Both of these factors reduce the amount of power the Scientech
receives with respect to the pyroelectric, and thus make the pyroelectric appear more
sensitive than it really is. Consequently the calibration numbers quoted in Table 4.1
and Table 4.2 represent upper limits on the responsivity of the pyroelectric detector.
The calibrations do account for electronic effects, such as cable attenuation and scope
calibration.
Typically the coated bolometer was used for forward and total power measure-
ments while the uncoated bolometer was used in the Michelson interferometer. When

4.3. INSTRUMENTATION 67
50 pm condensed rad. units power meter voltage . . 51.8 f 3.6 bV1 power meter average power 0.546 f 0.038 bW1 equiv. energy per macropulse 54.6 f 3.8 bJ1 coated pyroelectric (4.65 & 0.24)/20 [V]/(amp gain) coated calibration 4.3 f 0.3 WmJl uncoated calibration 2.5 f 0.5 WmJl
Table 4.2: Detector system calibration with 50 pm undulator radiation.
results are expressed “in bolometer volts”, what is meant is that the measured voltage
-
has been divided by the nominal gain of the electronics. The calibrated energy is re- --+- -
covered from “bolometer volts” by dividing by the calibration factor 413 & 0.3 [V/mJ]
for the coated detector and 2.5 f 0.5 [V/mJ] for th e uncoated when the wavelength
-is cz 50 pm, or by 1.9 f 0.1 [V/mJ] when the wavelength is E 170 pm.
4.3.2 Michelson Interferometer
To measure the frequency spectrum of the FIR radiation a Michelson interferometer
was employed. The interferometer consisted of l/4-mil Mylar beam splitter, a station-
ary Al-coated front-surface mirror, a moving Al-coated front-surface mirror stepped
by a Newport motion-control system capable of sub-micron steps, and a paraboloidal
mirror that focussed the re-combined light into the Pl-65 detector. Since it had less
frequency dependence, the uncoated detector was used in the Michelson.
The interferometer was not directly calibrated. However, the expected interferom-
eter efficiency can be calculated from the optical properties of the Mylar beam-splitter.
The effect of the beam splitter is calculated from the index of refraction of the My-
lar, assuming no absorption in its l/4 mil thickness. The energy, given unit incident
intensity, transmitted to the detector when the two arms of the interferometer differ

68 CHAPTER 4. EXPERlMENTAL SETUP
.. in path length by phase 6 is given by [43]
I(S) = 4 (1 + cosS) (1 - cosa) r2 (1 - r”)”
(1 - r22 cos ct + r*)” > (4.14)
with cos ei - n, cos 8,
r=rl= cos ei + 72, cos 8, (4.15)
for radiation polarized perpendicular to the plane of incidence with respect to the
beam-splitter, and 72, cos ei - cos em
r = rII = cos ei + 72, cos em (4.16)
for radiation polarized parallel -to&he plane of incidence. Here n, = 1.61 is the
index of refraction of the Mylar as given by the manufacturer (Goodfellow), I, =
6.35-x 10e6 m its thickness, and
41,~ nL, a=- ~- x ( cos 0,
tan 8, cos Bi 1
, (4.17)
where 8i = 7r/4 is the angle of incidence and 19, = sin-‘(sin 0,/n,) = 0.454 is the
angle of transmission within the Mylar.
When S = 7r the detector receives no energy, when 6 = 0 it receives the maximum,
which is two times the efficiency of the interferometer &ff. If a pure frequency sine
wave is input into the Michelson then as the moving arm goes from S = 0 to S = 7r
the detected energy varies from 0 to 2A&,,. That is
I@) = 2w?,, cos2(S/2) = M,T,,(l + cos(S)), (4.18)
where half of the energy in the interferogram is in the DC component, and the other
half of the energy is in the harmonic component, and the efficiency is defined in terms
of the harmonic component.
Figure 4.12 shows the interferometer efficiency including the beam splitter effect.
Since the undulator radiation is polarized horizontally and the beam splitter is re-
flecting it horizontally, the radiation is polarized parallel to the plane of incidence

4.3. INSTRUMENTATION 69
Michelson interferometer efficiency: wl.61, I=i/4mil, 45 degree incidence 0.5 I , I ,
/- 0,45- . . . . . . . . .;... ‘4 , y
, 0,4- /
I’ 0.35 - /
I 0.3- .. /
! , ! , I
_--_ -.
-‘i : ‘\
\ .\. .:.
\ \
\ \
\ \
1. \
\ \-
\ \
\ \ \ \
- -’ PerpeAdicular bolarizafion _ Parallel polarization
200 250 300 350 400 450 500 Wavenumber [l/cm]
- Figure 4.12: Michelson interferometer efficiency. The undulator radiation is polarized parallel to the plane of incidence, so the lower curve applies.
(the xx plane in this case) and so the lesser of the two curves shown applies, giving
a maximum efficiency of less than 0.10.
Chapter 5
Characterization of Superradiant --rc. -
Undulator Radiation r -
The intent of the present chapter is to provide a reference of the FIR radiation proper-
ties which may be of interest to a potential user. This chapter catalogs the measured
properties of the superradiant undulator radiation at SUNSHINE, beginning with
proof of superradiance (and therefore coherence), and continuing with the energy
spectral density, spatial distribution, angular divergence, and polarization. The time
format of the radiation follows that of the electron beam as illustrated in Fig. 4.3.
5.1 Demonstration of Superradiance
In principle the demonstration of superradiance is straightforward: measure the
radiated energy as a function of e-beam current and show that the radiated energy
varies as the square of the charge. At SUNSHINE the only complication is that the
device used to reduce the current is the energy collimator in the alpha magnet, which
can potentially change the bunch structure by scraping off particles of a particular
71

72 CHAPTER 5. CHARACTERIZATION OF SUPERRADIANT UNDULATOR RADIATION
i
_;_.
0 5 0.01 _:_.
>”
0.001 1 -i
Bolometer volts vs CN2 19fApr95 - 170 p.m
,016 ,o~?7-- ,018 ZN2 1o19 1 02@ ,021 - .
Figure-5.1: Bolometer voltage vs charge squared at M 170 pm. The circles are the - measurement, the line is a fit line .of slope one, demonstrating the superradiance of
the radiation.
energy that correspond to a particular position in the bunch. With the undulator ra-
-.L- diation it was found that the high-energy scraper, which was normally not used, could
produce a slow and relatively uniform change in current across the macropulse with a
similar slow and steady change in the radiated energy. Reducing the current with the
high energy scraper, the radiated energy tracked the sum of particles squared very
linearly over three orders of magnitude in the bolometer voltage (volts to millivolts)
as shown in Fig. 5.1. As usual in this thesis the sum of particles squared, C Ni, is
taken over each microbunch as
EN: = NebNzi, j=l
where Nmb is the number of microbunches in the macropulse and Nei is the number
of particles in the jth microbunch.
In addition to the above measurement, superradiance is indicated by the amount

5.1. DEMONSTRATION OF SUPERRADIANCE 73
Auto and cross-correlations - 941013mi.003
-,-. :
Expanded cross-correlation ,Expanded auto-correlation
-2 0 10 20 30 40 50 0
Mirror position [mm]
- Figure 5.2: Measured auto. and cross correlations demonstrating coherence of the radiation. This was one of the first measurements made with the superradiant un- dulator radiation, and required -2 hours to complete. The stability of the radiation has been greatly improved since then, due to installation of a high-voltage regula- tor, temperature regulator for the rf gun, and active feedback directly stabilizing the current pulse out of the gun by adjustment of the thermionic cathode heating.
of energy in the radiation. The total incoherent radiation in the forward direction
expected for the beam parameters of Fig. 5.1 (K = 3.1, y = 36, C N, = 5.9 x 101i)
is given by Eq. (2.12) to be 13 nJ/ sr which corresponds to 0.14 pJ into the 1 x 10e5
sr acceptance of the bolometer, or equivalently 0.26 nV of bolometer voltage. The
measured 0.269 V is thus nine orders of magnitude greater than is expected from the
incoherent radiation.
Additionally, since superradiant emission is by definition coherent, it should be
possible to generate interference patterns of the radiation from one microbunch with
the radiation from another, and this is shown in Fig. 5.2. In the figure, the auto-
correlation refers to the interference of radiation from each microbunch with itself,

74 CHAPTER 5. CHARACTERIZATION OF SUPERRADIANT UNDULATOR RADIATION
Example measured interferogram 960612M1.001
I,
9 1o-4
z 8 1O-4 ii p 7 1o-4 z z E 6 1O-4
: 5 1o-4
4 1 o-4
3 1o-4 0 0.2-- 5.4 0.6 0.8 1 -
Mirror postion [mm]
- _ Figure 5.3: Example measured interferogram of 52 pm radiation.
and the cross-correlation is the interference of the radiation from each microbunch
with the radiation from the adjacent bunch in the macropulse. The beamline was
not fully optimized at the time the data was taken and there was drift (which has =I--
subsequently been greatly reduced) in the radiation signal, but even so one can clearly
see that the cross-correlation exists and is basically the same as the autocorrelation,
demonstrating that the radiation is coherent,
5.2 Energy Spectral Density
Potential users will be interested in the bandwidth of the undulator radiation,
which in principle will not be less than 0.9/26 = 3.5% FWHM from the 26-period
undulator r. A typical interferogram and its corresponding spectrum are shown in
‘For users interested in a broadband FIR source, work is progressing on a transition-radiation laser which is expected to produce a half-cycle of THz radiation at 10 MW peak power or greater 1441.

5.2. ENERGY SPECTRAL DENSITY
Example measured spectrum 960612SP.001
FWHM = 22km
75
0 loo 0 1 lo2 2 lo2 3 lo2 4 lo2 5 lo2
Wavenumber [l/cm]
Figure 5.4: Example measured spectrum corresponding to the interferogram of Fig. 5.3. The circles are the measurement, the line is a fit of the sin2u/u2 func- tion.

76 CHAPTER 5. CHARACTERIZATION OF SUPERRADIANT UNDULATOR RADIATION
i
Coherently-enhanced third harmonic 960424sp.019
105lcm
\ 0
0 50 100 150 Wavenumber [l/cm]
200 250
- Figure 5.5: Coherent enhancement of the third harmonic. The circles connected by the dotted line are the measurement, the solid line is a fit of the fundamental plus third harmonic.
Figs. 5.3 and 5.4. The linewidth of the superradiant undulator radiation is broader ‘i-
than the theoretical minimum, for example 12% in Fig. 5.4. This is expected from
the large energy variation across the electron beam macropulse, as shown in Fig. 4.6.
Figure 5.5 may be of interest to accelerator physicists as well as potential users:
it shows coherent enhancement of undulator radiation at the third harmonic. The
fundamental was tuned to a very long wavelength (- 300 pm) in order to achieve this
(K = 3.2).
5.2.1 Wavelength Tunability
One of the advantages of free-electron radiation sources is their tunability, and
this is certainly true at SUNSHINE, where the superradiant undulator radiation is
tunable over more than a factor of 5 in wavelength (from - 50 to - 300 pm) merely

5.2. ENERGY SPECTRAL DENSITY
Wavenumber vs K (24 Apr 96)
200
150
100
50
Expected for 14.9 MeV
77
Figure 5.6: Wavenumber as a function of K. This data was taken with‘constant elec- tron beam energy. The strength parameter K was changed by closing the undulator gap. The circles are the central wavenumbers, and the errorbars are the FWHM of the measurements.

78 CHAPTER 5. CHARACTERIZATION OF SCJPERRADIANT UNDULATOR RADIATION
Measured spatial distribution 950405xy.001 has max at 111 UJ
-4 : 30
Horizontal position [mm] Vertical position [mm]
Figure_5.7: Spatial distribution at 170 pm. The distribution is measured 0.7 m from -
the undulator exit.
by changing the undulator gap, as shown in Fig. 5.6. Further tunability is possible
by changing the electron beam energy.
5.3 Spatial Distribution
The spatial distribution of the superradiant undulator radiation was measured by
(remotely) moving the pyroelectric detector across the radiation beam using a two-
dimensional translation stage. From the downstream end of the undulator chamber,
the radiation travelled 66 cm in vacuum, through a 1 mm HDPE window and then
through 4 cm of air to reach the detector. The measured distribution when the beam
was optimized for 170 pm radiation is shown in Fig. 5.7. This measurement corre-
sponds to a total energy of 1.65 mJ in the macropulse; distributed over approximately
3000 microbunches, each of 26 cycles of 170 pm wavelength, it corresponds to 40 kW

5.3. SPATIAL DISTRIBUTION 79
Measured spatial distribution 950427xy.001 saturates at 160 UJ
Horizontal position [mm] Vertical position [mm]
- Figure 5.8: Saturated spatial distribution at 170 pm. The undulator chamber was ef- fectively extended to the measurement point using light pipes to do this measurement. This can be compared directly with Fig. 5.7.
peak power averaged over all the microbunches.
The highest measured power achieved was with a temporary setup in which a
brass light pipe was used to effectively extend the undulator chamber to the HDPE
window. The beam was set up as in Fig. 5.7 and a brass light pipe with 90 degree
reflector was inserted into the undulator chamber and extended to the window where
the distribution was measured. Vacuum difficulties led to abandoning this setup, but
one measurement was completed as shown in Fig. 5.8. There are at least four points
in which the electronics was completely saturated at 160 pJ, but even so 3.39 mJ of
energy in the macropulse was measured, corresponding to over 80 kW of peak power,
3.2 kW average power over the 1.05 ~LS macropulse, and 102 mW averaged over all
time (at 30 Hz repetition rate). These numbers would be higher if the amplifier had
21t has not yet become possible to measure the micropulse (radiated) energy directly at SUN- SHINE; the macropulse energy is the measured quantity.

80 CHAPTER 5. CHARACTERIZATION OF SUPERRADIANT UNDULATOR RADIATION
i
Measurements of radiation divergence at 227, 91, and 52 pm wavelengths.
:
-2 -1.5 -1 -0.5 0 0.5 1 1.5 Distance from undulator exit [m]
Figure 5.9: Measured angular divergence at 227, 91, and 52 pm. The symbols are measured radiation beam sizes defined as the distance from maximum intensity to l/e2 of the maximum intensity. The lines are fits giving the angular divergences and waist positions. The bold line indicates the physical aperture of the undulator chamber.
not saturated.
At shorter wavelengths the spatial distribution is more sharply peaked, as shown
in Fig. 5.10 taken at 55 pm wavelength. The full undulator (leftmost plot of the
figure) -produced 0.43 volts at the bolometer, which corresponds to 100 pJ. This was
distributed over 2000 microbunches for a peak power of 10 kW over 26 cycles of
radiation.
5.4 Angular Divergence
The angular divegence of the radiation exiting the undulator was measured by
using an xyz translation stage (20) in Fig. 4.10. The spatial distribution was measured
at several distances from the undulator, at several different radiation wavelengths.

5.4. ANGULAR DIVERGENCE 81
K wavelength waist size waist position Rayleigh length divergence
[WI . [mm1 ’ [ml [ml [mrad] 0.6 52 3.1 310.6 -1.91 f 0.53 0.58 f 0.23 5.2 f 1.1 1.6 91 2.9 f 0.6 -0.67 f 0.32 0.29 f 0.12 9.8 f 2.2 2.8 227 3.8 410.9 -0.48 310.29 0.20 f 0.09 19.0 f 4.8
Table 5.1: Angular divergence of radiation. The waist position is measured from the downstream end of the undulator, where z = 0, and x > 0 in the radiation/beam direction. The values come from the fits shown in Fig. 5.9.
-
The pattern at larger distances z from the undulator was compared with that at the
nearest location by doing a least-squares fit in which the near pattern was expanded
in the x and y directions t&natcl; the far pattern. This uses the full information of
the xy scan to determine the expansion.
The beam radius, defined as the distance from maximum intensity to l/e2 of the
maximum intensity, of the .near data is scaled by the expansion factors from the fit
to give the beam sizes as a function of distance, which can then be compared with
the theoretical expansion equation for a Gaussian beam [6, page 6651:
where W. is the beam radius at the waist, defined as the distance from maximum
intensity to l/e2 of the maximum intensity, and
is the Rayleigh length, which is the distance from the location of the waist to the
location where the Gaussian beam has expanded in area by a factor of two.
The measurements at 52 pm wavelength shown in Figs. 5.9 demonstrate a rela-
tively small 5.2 f 1.0 mrad divergence. As the wavelength increases by increasing K
the angular divergence increases, becoming 9.8 f 2.2 mrad at 91 pm, and 19.0 f 4.8
mrad at 227 pm, as seen in Table 5.1.

82 CHAPTER 5. CHARACTERIZATION OF SUPERRADIANT UNDULATOR RADIATION
5.4.1 Spatial Distribution vs. Undulator Length
Another way to try to measure the angular divergence is instead of moving the
bolometer in Z, move the undulator in z and do zy scans with the bolometer. Of
course it would be impractical to physically move the undulator, but a steering magnet
can be used to deflect the beam out of the undulator and this has a similar effect.
Steering the beam out has the disadvantage of reducing the undulator length, and so
the amplitude of the radiation source will changed as well as the distance. It would be
expected though that the shape of the distribution would change, becoming broader
as the undulator moves away from&e detector. Suprisingly, this was not seen in the
measurement.
The measurements of Fig. 5.10 taken at 55 pm show the spatial distribution
- of radiation versus undulator length. From the downstream end of the undulator
chamber, the radiation travelled 29 cm in vacuum, through a 1 mm HDPE window
and then through 18 cm of air to reach the detector. Undulator length was varied
by deflecting the beam at the 8th, 15th, and 21st periods within the undulator using ‘i-
horizontal steering magnets.
The measured distribution is only slightly broader when the beam is deflected out
at the 8th period as compared to propagating through all 26 periods. The FWHMs in
the horizontal direction were 5.9, 6.5, 7.2, and 8.0 mm going from the full undulator
(26-periods) through the 21,15, and 8-period long case, and the corresponding vertical
FWHMs were 8.9, 10.5, 8.1, and 10.0 mm. While there is a trend in that the horizontal
FWHM increased as the undulator ‘moved away’, a subsequent measurement did not
reproduce this trend, but gave FWHMs of 8.2, 6.8 and 7.9 for 26, 9, and 5-period
deflection locations. The shape of the measured distribution is basically unchanged
as the beam is deflected out at different locations in the undulator. The main effect
is just a change in amplitude of the measured distribution.
In the context of comparing measurements with theoretical expectations this result

960509xy.003 N=26
0.05
0.04
0.03
0.02
0.01
0
l<
YCmml
:. ...: _:: : : : ._ : .: : .-.
-006 N=21 -007 N=15 . . _. .:- -:, : : :
: ._.j. .;
-006 N=6
Figure 5.10: Measured spatial distribution as a function of undulator length. The units are bolometer volts per macropulse and can be divided by 4300 to convert to J/macropulse. The diqtribution is only slightly broader when the beam is dumped at the 8th period’(rightmost plot) as compared to when the beam is propagating through all 26 periods (leftmost plot). Data taken 960509 at 55 pm wavelength.

84 CHAPTER 5. CHARACTERIZATION OF SUPERRADIANT UNDULATOR RADIATION
Horizontal polarization .‘. .,
y[r _ -
- -10
nml xlmml
Vertical polarization
x 1 o-3 .. ...‘... . . . : ....,
y[mm] -‘” Hmml
Figure 5.11: Horizontally and vertically polarized radiation components measured using a wire grid polarizer. The degree of polarization is greater than 90% at the peak.
is suprising, and will be refered to in a subsequent chapter. In the context of angular
-i-- divergence measurements this result shows that the shape of the xy distribution
cannot be used by itself to determine the angular divergence.
5.5 . Polarization
The polarization of the superradiant undulator radiation was measured with a
wire-grid polarizer manufactured by Graseby-Specac (Model IGP223). The polarizer
consisted of 4 pm wire grid photo-lithed onto a polyethylene substrate. The spatial
distribution was first measured with the wires oriented to pass the horizontal polar-
ization, then measured again with the polarizer rotated 90 degrees. The results, after
subtracting a uniform 300 ,LLV background due to amplifier offset and stray ionizing
radiation, are shown in Fig. 5.11. Figure 5.11 shows that the degree of horizontal (g)

5.5. POLARIZATION 85
polarization, defined as la/(ln + I,) w h ere I, is the intensity of horizontally polarized
radiation and I, is the intensity’of the vertically polarized radiation, is 95% where
the beam is most intense. Overall, the measured polarization is 80%. This is not cor-
rected for the 4% transmission (manufacturer data) of ‘unwanted’ radiation through
the polarizer, compared to 80% transmission of ‘wanted’ radiation, which tends to
reduce the measured polarization with respect to the actual polarization.

Chapter 6
Radiated Energy and Gain _ .
- In this chapter measurements of greater-than-linear growth of radiated energy as
a function of undulator length are presented. The degree of superlinearity is used
to characterize the ‘gain’ in a set of a dozen measurements. Gain lengths of five
undulator periods are seen at 50 pm. A trend toward decreasing gain (longer gain
length) with increasing radiated wavelength is seen.
Absolute measurements of forward-radiated energy show that at all wavelengths
the forward energy is much greater than expected from superradiant undulator radi-
ation alone. After correction for the efficiency of the Michelson interferometer, the
measured energy per solid angle and the energy per solid angle expected from the
single-pass FEL theory of Chapter 3 are compared absolutely in several of the gain
measurements. It is found that the measured energy per solid angle versus undulator
length, at 50 pm through 70 pm, is consistent with the gain expected from single-
pass FEL theory. The larger-than-expected forward energy at 80 pm, and possibly
at longer wavelengths, is not demonstrated to be the result of gain, but rather may
be the result of waveguiding by the 1 cm radius vacuum chamber.
87
88 CHAPTER 6. RADIATED ENERGY AND GAIN
*
.- 6.1 Gain Measurements : I 6.1.1 Method of Measurement
To measure gain, interferograms of the radiated field were recorded as the effective
length of the undulator was varied. The bolometer voltage in the interferogram,
which was proportional to the energy received in the interferometer, was observed to
grow much greater than linearly with undulator length. In order to characterize this
non-linearity the function
y(IqZ-ml;; (eNINg - 1) - c (6-l)
was fit to the data. Here N is the length of the undulator measured in undulator pe-
- riods, Ng is the gain length measured in undulator periods, and ml is a fit parameter.
The physical significance of the function y(N) is that for N >> Ng it becomes a pure
exponential, as expected from single-pass FEL theory, and for N << Ng it becomes
linear, also as expected. Thus, Equation (6.1) is an approximation of the complete
~-A- single-pass FEL theory discussed in Chapter 3. The complete theory is compared
with measurements in Sec. 6.3.
6.1.1.1 Variation of Undulator Length
Effective undulator length was varied in two ways:
1) In measurements from 1995, ferromagnetic plates were placed between the un-
dulator and the vacuum chamber, thus ‘shorting out’ the field of the undulator’s
permanent magnets. This method had the disadvantage of requiring that the
electron beam be turned off to allow access to the undulator.
2) In measurements from 1996, the electron beam was steered out of the vacuum
chamber as described in Chapter 4.

6.1. GAIN MEASUREMENTS 89
: 6.1.1.2 Use of Michelson Interferometer
Michelson interferometry was used to measure the undulator radiation. By fitting a
9 function about the radiated wavelength in the interferogram, background due to
stray synchrotron, transition, or X-ray radiation was eliminated. These backgrounds
were the result of steering the electron beam out of the vacuum chamber. They also
occurred when using ferromagnetic shorting plates because nonuniform residual fields,
from non-ideal shorting, missteered the electron beam.
6.1.2 Gain Data --- -
-
The measured bolometer voltages as a function of undulator length, fit by the func-
tion of Eq. 6.1, are shown in Figures 6.1, 6.2, and 6.3. Figures 6.1 and 6.2 are gain
measurements made at around 50 pm. Figure 6.3 shows measurements at differ-
ent undulator strengths, and therefore different wavelengths, and establishes a trend
toward less gain at longer wavelengths.
Figures 6.1 and 6.2 show measurements made in 1995 as well as in 1996. The
chronology deserves comment. The first measurement of gain was made in 1995, and
reported in [45]. Th is was followed by a major change in the rf system which greatly
increased the rf power in the gun. This produced macropulse currents of over 1 A at
the gun and up to 0.5 A after the linac. It was discovered that
1) Measurable 50 pm radiation was unobtainable at the highest gun powers.
2) The measurement of gain was correlated with maximizing the radiated energy
per number of electrons at the undulator.
By reproducing the earlier rf power levels and by maximizing the radiated energy per
number of electrons, the 50 pm radiation and gain were reproduced.
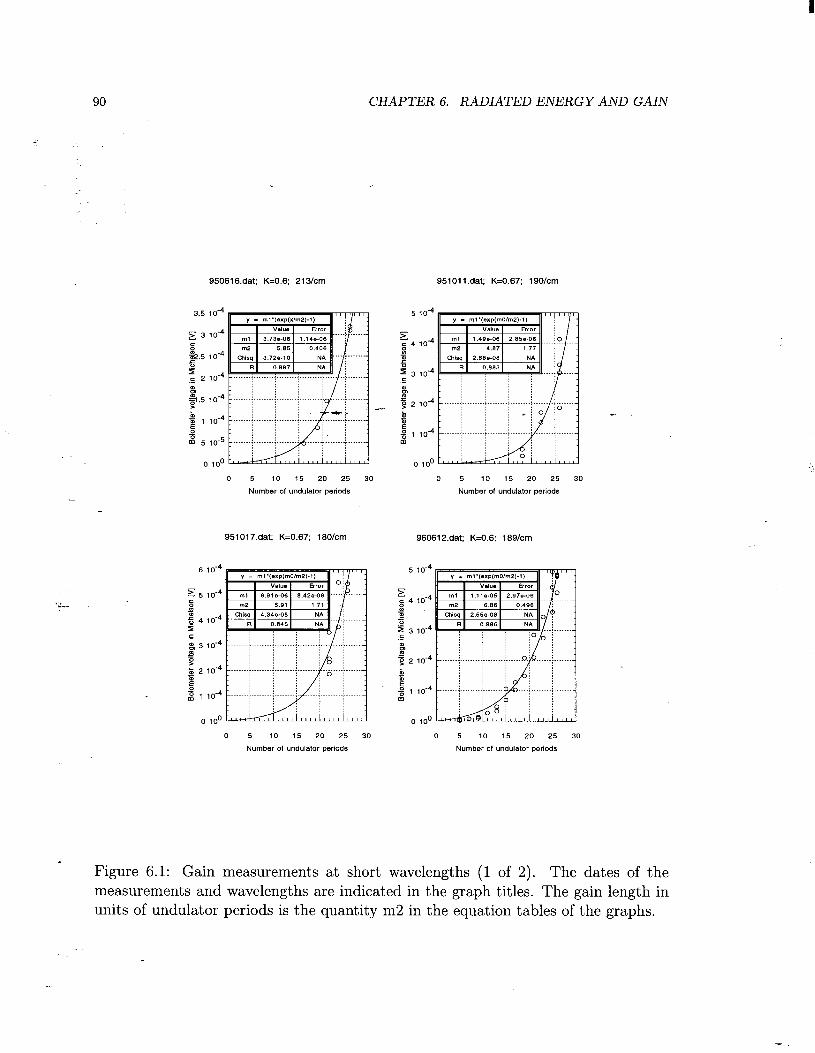
CHAPTER 6. RADIATED ENERGY AND GAIN
950616.dat; K=0.6; 213/cm 951011.dat; K=0.67; 190/cm
6 10-4
E 5 10-4 s Y m
-$ 4 10-4 z .c g 3 10-4
22 : b 2 10 -4
5
E $ 1 10-4
0 IO0
0 5 10 15 20 25 30 0 5 10 15 20 25 30
Number of undulator periods Number of undulator periods
951017.dat; K=0.67; 160lcm 96061 P.dat; K=0.6; 189hn
5 10-4
E c 4 10-4 P aI 4 = 3 10-4 .5
8 g g 2 10-4
z 5 5 x 1 10-4
0 IO0
0 5 10 15 20 25 30 0 5 10 15 20 25 30
Number of undulator periods Number of undulator periods
Figure 6.1: Gain measurements at short wavelengths (1 of 2). The dates of the measurements and wavelengths are indicated in the graph titles. The gain length in units of undulator periods is the quantity m2 in the equation tables of the graphs.
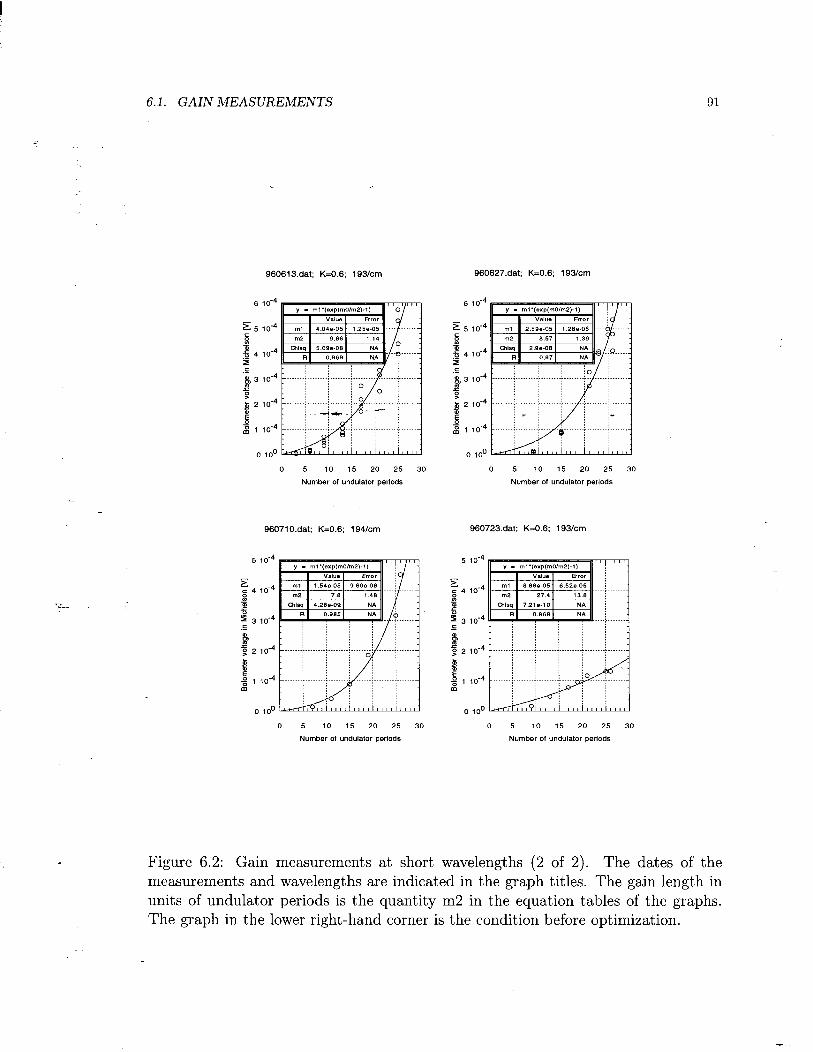
6.1. GAIN MEASUREMENTS 91
960613.dat; K=O.6; 193/cm 960627.dat; K=0.6; 193km
6 10-4
E 5 10-4 s % f 4 10-4
.E g 3 10-4
z B z 2 10 -4
;ii
B g 1 10-4
0 IO0 0 5 10 15 20 25 30
Number of undulator periods 0 5 10 15 20 25 30
Number of undulator periods
96071 O.dat; K=0.6; 194km 960723.dat; K=0.6; 193km
5 10-4
E c 4 10-4 4 2 P 3 10-4 .6
$ s g 2 10-4
& 5 5 2
1 10-4
0 IO0
5 10-4
z c 4 10-4 4 z
P 3 10-4 .E
8 s g 2 10-4
5 z
5 $ 1 10-4
0 IO0
0 5 10 15 20 25 30 0 5 10 15 20 25 30
Number of undulator periods Number of undulatot periods
Figure 6.2: Gain measurements at short wavelengths (2 of 2). The dates of the measurements and wavelengths are indicated in the graph titles. The gain length in units of undulator periods is the quantity m2 in the equation tables of the graphs. The graph in the lower right-hand corner is the condition before optimization.

92 CHAPTER 6. RADIATED ENERGY AND GAIN
By the end of 1995, the gun cathode had deteriorated with age, and eventually
-. the cathode had to be replaced. The new cathode became operational and stable in
May 1996, when measurements resumed.
A summary of the gain measurements of Figs. 6.1 through 6.3 appears in Fig. 6.4.
The trend is toward lower gain at longer wavelengths. Gain measurements at wave-
lengths longer than 80 pm were not done because of inadequate clearance between
the vacuum chamber and the undulator magnets which caused difficulties in moving
the steering magnet and in removing ferromagnetic shorting plates.
~-be - r - .
6.2 Absolute Measurements of Radiated Energy
Absolute measurements of radiated energy were usually made with the coated bolome- -
ter, whose calibration is reported in Chapter 4 and repeated here for convenience:
(~v)mlpIn = 1.9 f 0.1 [V/mJ],
(&)cc,50pn = 4.3 f 0.3 [V/mJ].
The detector radius was 2.5 mm. The detector could be left stationary or, could
be scanned transversely across the FIR beam (an ‘z:y-scan’). Alternatively, the FIR
beam could be focussed into the detector.
To calculate the expected total energy, the solid angle acceptance of the detector
must be defined. For a bolometer of radius rb at distance z from the end of an
undulator of length L, the average solid angle accepted is
where
< dR >= rri
($) = +--z+L$ds = ,(,: L). (6.3)
(6.2)

6.2. ABSOLUTE MEASUREMENTS OF RADIATED ENERGY
960612.099; K=0.99; 163km 960627.046; K=0.46; 202/cm
0 5 10 15 20 25 30
Number of undulator periods
960627.099; K=0.99; 145/cm
0 5 10 15 20 25 30
Number of undulaior periods
960627.130; K=l.30; 125km
0 5 10 15 20 25 30 0 5 10 15 20 25 30
Number of undulator periods Number of undulator periods
93
Figure 6.3: Gain measurements at different wavelengths. The dates of the measure- ments and wavelengths are indicated in the graph titles. The gain length in units of undulator periods is the quantity m2 in the equation tables of the graphs.

94
-
*i--
CHAPTER 6. RADIATED ENERGY AND GAIN
o*25 _1 ::~_ , 0.20 -
% : 0.15 -
0.10 - 0
0.05 - +
0.00 I I I I I I I I I I I I I I I II 1 120 140 160 180 200 220
wavenumber [l/cm]
Figure 6.4: Summary of gain measurements. The fit gain coefficient, defined as the reciprocal of the gain length, is plotted as a function of the radiated wavenumber. The crosses indicate measurements from 1995, the circles are from 1996. The errors from the gain length fits give the error bars.
6.2. ABSOLUTE MEASUREMENTS OF RADIATED ENERGY 95
In this section, z = 0 at the undulator exit, and z increases in the direction of the
: radiation.
6.2.1 Total Energy Collected at 52 pm
When optimized, the measured radiated energy exceeded that expected from super-
radiance without gain. The total radiated energy at the window 0.3 m after the
undulator exit measured by xy scans was 41 pJ. Collected by a focussing paraboloid,
it measured 37 pJ. The conditions for these measurements were K = 0.6, y = 29,
ig andCN,2=5.3xlO .- T&se measured energies can be compared Lo the expected
superradiant radiation (with no gain) by multiplying the appropriate entries of Table
2.1 by C N,2 = 5.3 x 10 ig The window has an acceptance of .
- < &-I >= 7r(0.016)2
(0.3;(2.3) = Te”
so the acceptance angle 8, = 19.3 mrad is 0.6/y, and thus 16 PJ is expected, in the
absence of gain. The measured 37-41 PJ within this 19.3 mrad acceptance is thus
2-3 times greater than expected. The measured energy into a smaller acceptance
of 0, = 2 mrad is about 10 times greater than expected, as shown in the following
subsection.
6.2.2 Energy in the Forward Direction
To eliminate possible geometric errors and to take advantage of the simple formula
Eq. (2.12), in this subsection the radiation measurements discussed are confined to
solid angles of the order of lop5 sr, which corresponds to an opening angle of about
2 mrad. This allows straightforward calculation of the expected superradiance via
Eq. (3.21), with the form factor of Eq. 4.7, and allows comparison with the single-
pass FEL theory of Chapter 3.

96 CHAPTER 6. RADIATED ENERGY AND GAIN
._ IK expect meas half one multiplied expect meas ratio of wvnum wvnum _ width electron by meas to
formfactor expect l/cm l/cm l/cm J/sr J/sr PJ PJ
O-.46 202.3 202 29 l.O73e-19 4.644e-22 0.29 2.6 9 0.60 189.6 192 22 1.457e-19 7.177e-22 0.44 5.6 13 0.99 150.2 146 26 1.774e-19 1.393e-21 0.86 9.1 11 1.30 121.3 129 27 1.48e-19 1.781e-21 1.09 9.8 9
Table 6.1: Forward energy measurements taken 4.3 m from the undulator exit by xy scans of a 1 cm radius window. The parameters for the expected energy calculation are y = 29.35, C Nz = 5.3 x iOr’, and the solid angle acceptance of the window is da,,, = 7r(0.01)2/(4.3 x 6.3) = 1.16 x 10m5 sr. The expected undulator radiation per solid angle per electron from Eq,2&.2 ismultiplied by the form factor from~ Eq. 4.7 to give the column labelled ‘multiplied by formfactor’, which in turn is multiplied by C Nz and by da,,, to get the expected energy. The measured energy is the measured bolometer voltage divided by the 4.3 V/mJ bolometer responsivity. Data taken 960627.
Spatial scans at the 1 cm radius window 4.3 m from the undulator exit were made
at a set of several different wavelengths. The results are presented in Table 6.1 and
show consistently that the detected energy is an order of magnitude larger than can
be explained by coherently-enhanced undulator radiation.
Similar forward energy measurements made at a set of several different wave-
lengths in an earlier stage of the project are presented in Table 6.2 and plotted in
Fig. 6.5 and show a detected energy consistently over twenty times larger than can be
explained by coherently-enhanced undulator radiation alone. The decrease in radiated
energy reported in Table 6.1 with respect to Table 6.2 is related to the replacement
of the cathode of the rf gun. Differences in the cathode appear to have degraded the
electron beam quality.

6.2. ABSOLUTE MEASUREMENTS OF RADIATED ENERGY 97
K wvnum BoloResp meas expect mess/expect l/cm V/J J J
6.020e-01 1.771ef02 4.074e+03 9.205e-06 3.416e-07 27 8.900e-01 1.498e+02 3.568e+03 l.O50e+OO 1.348e+@L -3.289e+03 1.240e+OO l.l82e+02 2.982e+03 1.470e+OO l.O05e+02 2.653e+03 1.740e+OO 8.320e+Ol 2.331e+03 2.050e+OO 6.744e+Ol 2.038e+03 2.470e+OO 5.163e+Ol 1.745e+03 2.710efOO 4.476e+Ol 1.617e+03 3.030e+OO 3.741e+Ol 1.480e+03 3.230e+OO ’ 3.364e+Ol 1.411e+03
1.359e-05 6.031e-07 24 1.550e-05 7.391e-07 - 22 1.794e-05 8.841e-07 22 2.790e-05 l.O32e-06 31 3.668e-05 l.l68e-06 37 4.661e-05 1.281e-06 45 4.385e-05 1.378e-06 40 4.298e-05 1.415e-06 39 3.208e-05 1.450e-06 29 2.659e-05 1.465e-06 24
Table 6.2: Forward energy measurements taken 0.7 m from the undulator exit by 2.5 mm radius bolometer. The parameters for the expected energy calculation are y = 28.4, C N,2 = 4.5 x 1Org , and the solid angle acceptance of the bolometer is dR act = ~(0.0025)~/(0.7 x 2.7) = 1.04 x 10m5 sr. The expected undulator radiation per solid angle per electron from Eq. 2.12 including the fundamental and third and fifth harmonics for bunches coherently-enhanced by the form factor of Eq. 4.7 is multiplied by C Nz and by dR,,, to get the expected energy. The coated bolometer responsivity in the third column is a linear fit of the responsivity measured at 170 pm and 50 pm. Data taken 950419.

98 CHAPTER 6. RADIATED ENERGY AND GAIN
1C
iasured and calculated forward energies vs K with fundamental + 2 odd harmonic(s)
Zero-length bunch superradiance m----X---+---, ---s
Cr -%-2-i- - ,*
---- -+a
xx-.-x .x... x.. Expected superradiance -x-..- . . . . . x . . . . . . . . . x ,,,,
“.X...., “-x. . . . . . . .
-x
1O“L 20 40 60 80 100 120 140
Expected fundamental wavenumber [l/cm] 160 180
Figure 6.5: Plot of the forward energy vs K measurements listed in Table 6.2; see Table 6.2 for a description of the calculation. The circles are the measurement, the ‘x’-es are expected superradiance, and the asterisks are the calculated radiation from zero-length bunches.

6.3. ABSOLUTE GAIN MEASUREMENT 99
6.3 Absolute Gain Measurement
The Michelson interferometer was used to measure the radiated energy since it pro-
vided noise immunity. Undulator radiation was distinguished by fitting a Zi$!! func-
tion to the measured spectrum, as shown for example in Fig. 5.4. The measured
bolometer voltage was the integrated voltage of the q fit. The measured energy
was the bolometer voltage divided by the responsivity of the uncoated detector (2.5
V/mJ at 50 pm).
To compare the measured energy with the energy per solid angle predicted by
theory, the measured energy- from the interferogram was divided by the following
correction factors:
- 1) beam splitter efficiency at the fundamental wavelength from Fig. 4.12,
2) average atmospheric absorption in the undulator radiation band from Fig. 7.6,
3) 75 % HDPE window transmission, and
4) solid angle with respect to beam exit from undulator from Eq. (6.3).
With these corrections the measurements were compared with the single-pass FEL
theory discussed in Chapter 3. The parameters varied in the fits were
1) p, the variation of which corresponds physically to varying the particle density
by changing the bunch radius, and
2) the relative energy chirp dE (assumed to occur across a 240 pm distance).
These parameters were varied to minimize the squared error of the theoretical predic-
tion with respect to the corrected Michelson data. All microbunches were assumed
to contribute equally at the rms current value, even though there is reason to believe
many of the microbunches did not contribute, as seen in Fig. 7.4.

100 CHAPTER 6. RADIATED ENERGY AND GAIN
0.2
0.18
0.16 F
$0.14
F rd
n 0.12
72 $ 0.1 a
e 0.08
I5 0.06
960612 K=0.6 _ 960613 K=O,.6 960627 K=0.6 960723 K=0.6
0.2 -
0.18-
0.16-
0.14-
0.12-
0.1 -
0.08- /
0.2
0.18 I----
0.16-
0.14-
0.12-
0.18
0.16
0.1
0.08
0.06
0.04
0.02
d 6;” 0
0 10 20 - Period number Period number Period number Period number
Figure 6.6: Energy per solid angle vs undulator length at K = 0.6. The circles are the measurements, the solid line is a theoretical SASE fit, and the dashed lines are calculated superradiant undulator radiation as discussed in the text. The first three
*A- plots are the result of optimizing the radiated energy. The fourth graph is the result of setting up the electron beam without optimizing the radiated energy and approaches the expected linear behavior in the absence of gain.
A summary of the results of this comparison for several data sets at different
wavelengths is shown in Table 6.3. At 52 pm the fit p parameter corresponds to the p
parameter that would be expected from a 180 pm-long bunch of radius 0.8 mm, and
at 67 pm the fit corresponds to a 180 pm-long bunch of radius 1.2 mm. These radii
are close to what is expected from the measurements of Chapter 4. For a Gaussian
beam with a l/e2 radius W, a uniform radial distribution with the same peak charge
density and same total charge can be defined with an effective radius Weff = W/a,
so the the 1 mm l/e2 radius beam of Chapter 4 corresponds to an effective radius of
0.7 mm. .

6.4. CONCLUSIONS 101
date K A- b4 dE P xl 960612 0.6 . 53 0.0134 f 0.001 (9.84 0.238) f x 1O-3 4.67 f 0.11 960613 0.6 53 0.0175 f 0.006 (6.16 f 5.67) x 1O-3 7.46 f 6.87 960627 0.6 53 0.0172 f 0.001 (9.08 f 0.479) x 1O-3 5.06 f 0.27 960612 0.99 67 0.0000 f 0.004 (10.9 f 0.214) x 1O-3 4.22 f 0.08 960627 0.99 67 0.0000 f 0.030 (9.86 f 0.550) x 1O-3 4.66 f 0.26
Table 6.3: Gain length absolute measurements. This table summarizes the theoretical fits shown in Figures 6.6 and 6.7 in terms of the energy chirp dE and the p parameter, which were the only variables in the fits. The p parameter is related to the gain length Ng listed in the table by Ng = 1/(47&p).
-
The measured energy and theoretical fits for the 52 pm radiation are shown in --rc- - r -
Fig. 6.6. The first three plots show data resulting from experimentally optimizing
the radiated energy; the fourth graph is the result of setting up the electron beam
without optimizing the radiated energy and approaches the expected linear behavior
in the absence of gain. This illustrates that the observed gain is a result of optimiz-
ing the total radiated energy, and experimentally verifies the linear energy-vs-length
dependence expected from short-bunch superradiance.
Regardless of theory, this experiment has observed self amplification which is the
cause of a factor of four increase in detected radiation over superradiance as shown
in Fig. 6.6. This factor of four is less than the factor of 13 reported in Table 6.1. It is
possible that in addition to the factor of four from the gain there is a factor of three
enhancement due to guiding of the radiation. This factor of three does not appear
in Fig. 6.6 because the Michelson is only l/3 as efficient as expected at 50 pm, as
discussed in Section 7.3.3.
6.4 Conclusions
.
From the gain and forward energy measurements described in this chapter, the fol-
lowing conclusions can be drawn:

102 CHAPTER 6. RADIATED ENERGY AND GAXN
-
*rL-
960612 K=0.99 0.35
0.3 - 0.3 -
10 10 20 20 Period number Period number
960612 K=0.99 loo. .! !.
. . . . . . . . . . . . . . . . . . . . . . . . . . . . . . . . . . . . . . . . . . .
._ 0 v
.&I,’ .‘...‘....‘.‘). & . . . . ..a.. ./.:....... CT 6
’ g lo-* . . . . . . . . . . . . . . . . . w
:-.
. . . . . . . . . . . . . . . . . . . . .
-1. ..
t”“’ ..~ 1o-3
0 10 20 Period number
30
Figure 6.7: Energy per solid angle vs. undulator length at K = 0.99. The circles are the measurements, the solid line is a theoretical SASE fit, and the dashed lines are calculated superradiant undulator radiation as discussed in the text. The first graph is in linear scale, the second is semilog.

6.4. CONCL,USIONS 103
1) The forward energy is more than expected from superradiant emission at all
: wavelengths-the radiation’.is an extremely bright FIR source.
2) At 50 pm through 70 pm wavelengths, the higher-than-expected forward energy
is primarily the result of the gain predicted from single-pass FEL theory.
3) At 80 pm, and longer wavelengths if the trend shown in Fig. 6.4 continues,
the higher-than-expected forward energy is not the result of the gain. At these
wavelengths the higher-than-expected forward energy may be the result of wave-
guiding by the 1 cm radius vacuum chamber. --6. - F w

Chapter 7
Discussioti of Measurements
-
In support of the conclusions of the previous chapter, complicating effects involving
the details of the electron beam and instrumentation are discussed in the present
chapter. Interesting features of the spatial distribution and divergence of the FIR
radiation are discussed as well. Summarizing the points made in this chapter:
1) At K = 0.6 the bunch shortening/lengthening from energy spread is expected
to change the coherent enhancement at the downstream end of the undulator
by &20%.
2) Energy chirp may increase the total energy emitted from the undulator by a
factor of three due to its effect as a source term in single-pass FEL theory.
3) In order to match the measured energy spread, one must assume that only 40%
of square of the macropulse charge is contributing to the measured undulator
radiation.
4) At K = 0.6 the beam may be twice as wide horizontally when exiting the
undulator (as compared to entering the undulator) causing a 26% increase in
gain length at the exit.
105

106 CHAPTER 7. DISCUSSION OF MEASUREMENTS
: 5) At 50 pm, the Michelson measured efficiency is only one third of that expected
from theory. .
6) The measured radiation divergence is consistent with a Gaussian beam of 3 mm
effective l/e2 radius, which is larger than the measured 1 mm effective l/e2
electron beam radius.
7) The radiation divergence increases with wavelength linearly with X.
-b- - - - .
8) The spatial distribution of radiation is approximately radially symmetric. It
does not exhibit a measurably larger horizontal divergence than vertical diver- -
gence, even when there is - 100 mrad bending in the horizontal plane.
9) The spatial distribution of radiation measured at the downstream end of the
=A- ,: undulator chamber does not change as the beam is steered out of the undulator.
Items 1, 2, 3, and 4 state that the effects of energy spread and beam size upon
the SASE process are either relatively small, or actually help the process (item 2).
Item 5 states that the Micheson underestimates the full amount of radiation by a
factor of l/3. Items 6, 7, 8, and 9 are consistent with guided radiation emerging as a
diffraction pattern from the downstream end of the undulator chamber.
Although there is strong evidence of waveguiding, the analysis of these measure-
ments in terms of waveguiding and/or optical guiding is not pursued in this thesis.
The point of this thesis is to experimentally characterize the FIR source and the
self-amplification. If there is sufficient interest in these results, it is hoped that the
theory will be pursued by others in the FEL community.

7.1. EFFECT OF THE ELECTRON BEAM 107
7.1 Effect of the Electron Beam
The electron beam has properties not considered in the theory of Chapters 2 and 3.
The electron beam is not mono-energetic, nor is it mono-directional: it has an energy
spread and emittance.
7.1.1 Effect of Energy Spread
The electron beam energy spread within a micropulse is important in the determining
the bunch/radiation dynamics, while the energy spread over the macropulse is less
important and only broad&Tthe observable spectrum (t-he detector sjrstem integrates
the radiated energy over the entire macropulse).
- To understand the effect of energy spread it is worthwhile to consider the sinusoidal
trajectory described in Eq: (2.2). The path length through the undulator for an
electron of energy y and velocity /3 = ,/w is
which becomes
L S= J( 1 + - sin2
0 $ F)di=L(I+$).
The transit time is
(7.1)
(7.2)
To the same order of approximation the difference in transit times between particles
of energy y and y - Sy is
Equation (7.4) d escribes the bunch lengthening ST due to a fractional energy spread
9. Evaluating it for the SUNSHINE conditions, y = 29.35, L = 2.0, K = 0.6, with

108 CHAPTER 7. DISCUSSION OF MEASUREMENTS
The effect of energy spread on superradiant undulator radiation
--L 0.0001 spread 1 integrated energy 0.002 spread 0.9002 integrated energy
- 0.004 energy spread 0.6756 integrated 0.008 energy spread 0.3828 integrated
- 0.01 energy spread 0.3148 integrated
f50 160 170 180 190 200 210 Waver-umber [i/cm]
220 230 240 250
Figure 7.1: Calculated effect of micropulse energy spread on superradiant radiation. Energy spectral density per solid angle for infinitesimally short bunches entering the - undulator with Gaussian rms energy spreads of 0.01, 0.2, 0.4, 0.8, and 1%
ti = 0 01 gives ST = 77 fs which is negligible in comparison to the = 600 fs bunch Y *’ length. However for large K values the bunch lengthening (or compression) due to
*i- energy spread (or slew) can be quite large. For example if y = 29.35, K = 3.2, and
b = 0.01, then ST = 474 fs is of the order of the bunch length itself. Y
7.1 .l. 1 Effect on Superradiance
The effect of micropulse energy spread on the emitted superradiant radiation can be
approximated by considering an infinitesimally short bunch with a Gaussian energy
spread entering a 26-period undulator. Each electron will radiate 26 oscillations
at the fundamental frequency determined by its energy. At first all the particles
radiate in phase, but because they radiate at slightly different frequencies, destructive
interference soon occurs-this is analagous to the way a delta function can be built
out of sine waves. This causes line-broadening, but also reduces the amplitude of the

7.1. EFFECT OF THE ELECTRON BEAM 109
Effect of energy slew: 600 fs bunch, 53 micron wavelength
dE/E=O
dE/E=-0.01
dEIE=O.Ot
0.2 -
-+- - - 0
0 5 10 15 20 25 30 Undulator length [periods]
-
Figure 7.2: Calculated effect of energy slew on superradiant undulator radiation. The bunch is of length 180 pm and energy “/. = 29.35. The wiggler is at strength K = 0.6. The energy slew dE/E occurs over the length L of the bunch. A positive slew corresponds to greater energy particles at later times. Reductions to 62% and 44% of the mono-energetic case occur due to the 1% slew.
coherently-enhanced radiation. As shown in Fig. 7.1, a 1% rms energy spread reduces
the coherent-enhancement to 30% of the ideal value. This can be understood as a
consequence of the reduced form factor of the initially zero-length bunch due to the
bunch-lengthening described by Eq. (7.4).
Micropulse energy chirp can have a helpful or detrimental effect on superradiant
undulator radiation depending on whether it shortens or lengthens the bunch. For a
rectangular bunch of 600 fs (= 180 pm) length radiating at 52 pm, the form factor
is near a local maximum, so energy chirp of either sign is detrimental-as shown in
Fig. 7.2 a *l% energy chirp over the length of the bunch reduces the superradiant
emission to about 50% of the mono-energetic case.

110 CHAPTER 7. DISCUSSION OF MEASUREMENTS
Scaled SASE parameters as a function of undulator length
;--;r-;
15 20 Period number
Figure 7.3: Calculated effect of energy slew on magnitude of SASE parameters X (field) and 2 (energy modulation). The bunch is of length 180 pm and radius 1 mm - and contains 2 x lo8 electrons of energy y. = 29.35. The wiggler is at strength K = 0.6 and has 26 periods each of length X0 = 0.077 m. The energy slew of magnitude dE occurs over the length L of the bunch.
The measured form factor of the beam is proportional to the square of the wave-
length over the bunch length and has a smoother roll off than that of a pure rectan-
gular pulse. Therefore changes of less than 50% in the radiated energy are expected.
An energy chirp of 1% producing a 77 fs change in a bunch with an effective length
of 800 fs and a form factor given by Eq. 4.7 will produce a 2 x 77/800 = 0.2 = 20%
increase or decrease in the form factor, and therefore in the radiated energy.
7.1.1.2 Effect on SASE
There are two effects of micropulse energy spread on the SASE process. First, random
energy spread reduces the efficiency of the SASE process, and can inhibit it completely
when the rms energy spread is of the order of the Pierce parameter p [23, page 631.
Secondly, non-random energy spread, ie energy modulation, can actually help the

7.1. EFFECT OF THE ELECTRON BEAM 111
Comparison of measured and expected macropulse spectra
180 200 220 Wavenumber [l/cm]
Figure 7.4: Effect of macropulse energy spread on the observable spectrum
-
SASE process [46], by way of the 20 source term in Eq. (3.8). As shown in Fig. 7.3,
a one percent energy chirp over the length of the microbunch can result in a factor
of 5/3 increase in the field variable, and thus a factor of 3 in the energy. This is in
: contrast to the superradiant calculation discussed in the previous subsection, where
the energy chirp reduced the superradiant energy under the same conditions.
j.1.2 Expected Effect of Measured Energy Spread
The energy variation over the macropulse is large, as shown in Fig. 4.6. In fact
the measured radiation spectrum, as shown in Fig. 5.4, is narrower than would be
expected if the entire electron beam macropulse were contributing. A 150 ns time-
slice of the macropulse (leading up to and including the peak current) produces an
expected spectrum matching the measured spectrum shown in Fig. 7.4. This time
slice contains 39% of the total C Nz over the macropulse. This shows that perhaps
only half of the macropulse is contributing to the 52 pm radiation.
112 CHAPTER 7. DISCUSSION OF MEASUREMENTS
In computing the expected spectrum, each micropulse within the macropulse is
: weighted by the square of its charge, because each micropulse is expected to radiate
proportional to the square of its charge. The average, again weighted by the square of
the current, measured micropulse energy spread is 0.9% rms over the 150 ns time-slice.
This is enough spread to cause some effect in the coherent enhancement. From the
previous section, a 1% energy chirp causes a 20% increase or decrease in the radiated
energy at the end of the undulator, but causes a factor of three increase in SASE.
If the the measured energy spread were purely random, theory predicts self-
amplification will not occur. Since self-amplification is seen, theory predicts the -)- - - -
measured energy spread is mostly correlated: ‘slewed’ or ‘chirped’ rather than ran-
dom, and therefore helps the SASE process, as shown in Fig. 7.3. It is not possible
to tell from direct measurements whether the micropulse energy spread is correlated -
or uncorrelated.
7.1.3 Electron Beam Size
As discussed in Sec. 4.2.4, TRANSPORT gives an average l/e2 beam radius of 1 mm
in the undulator.
7.1.3.1- Effect on Superradiance
The beam size does not cause line-broadening of the frequency spectrum due to
electrons at different positions experiencing different undulator strengths, because
from Eq. (4.2), the field at the edge of the beam,
B, m cosh(kosna, ) = cosh(27r x 0.001/0.077) = 1.003,
is clearly negligibly close to the field at the center (y = 0). A large offset of the
electron beam within the undulator can cause some effect. For example a 5 mm offset

7.1. EFFECT OF THE ELECTRON BEAM 113
increases the B, field by S%, which for K = 0.6 translates to a 3% shift in radiated
wavelength. .
The three-dimensional form factor discussed in Chapter 2 includes the effect of
the beam size on superradiance, which is basically that smaller transverse size means
more off-axis coherent radiation. This is analagous to Ft-aunhofer diffraction from
the electron bunch. (As mentioned in Chapter 2, that mathematics of Fraunhofer
diffraction is identical to the mathematics of the form factor.)
7.1.3.2 Effect on SASE -6. -
The primary effect of beam size on SASE is through the charge density: the higher
the charge density, the greater the self amplification. This can be seen from the
dependence p oc nii3 where p and the number density n, are defined in Table 3.1.
The gain length Ns cx l/p then gives Ns oc ne1i3, so larger n, means shorter gain
length. The beam sizes, measured on phosphor screens (15) and (23) in Fig. 4.10,
were 2.9 mm horizontal and 2.5 mm vertical full width before the undulator (at (15) in
Fig. 4.10), and 4.5 mm horizontal and 1.9 mm vertical full width after the undulator
(at (23) in Fig. 4.10). From these measurements, and from the TRANSPORT model
shown in Figs. 4.8 and 4.9, the beam is approximately constant in vertical size but is
twice as wide horizontally exiting the undulator as compared to entering. Thus the
gain length is expected to be 2 V3 - 1 = 26% longer at the exit than at the entrance
of the undulator.
-
Another effect is that in SASE theory the diffraction of the radiation from the
finite source size, in this case the size of the electron beam, is expected to cause a
reduction in gain. The radiation divergence at 52 pm from a uniform 1 mm radius
source is expected from the first zero of J~(u)/u to be
Odiv = 0.61X/r,,, = 32 mrad,

114 CHAPTER 7. DISCUSSION OF MEASUREMENTS
. and from a IV0 = 1 mm l/e2-radius waist of a Gaussian beam
wo ediv = ZR =
x - = 17 mrad. TWO
However, the measurements of Table 5.1 indicate the angular divergence of the radia-
tion is 5 mrad at 52 pm, which implies a 3 mm radius source size. This is significantly
larger than the 1 mm radius electron beam, and significantly reduces diffraction ef-
fects.
To explain this discrepancy in radiation source size with respect to electron beam
size, one can argue that there ~QJ- be waveguiding by the undulator chamber or
optical guiding by the electron beam.
- 7.1.4 Electron Beam Divergence
The TRANSPORT-modeled average angular spreads of the electron beam within the
undulator are g,f = oY/ = 0.5 mrad. This angular divergence does not broaden the
Z--S radiation pattern significantly, and its effect on superradiant emission and SASE is
therefore ignored.
7.2 _ Radiation Absorption
FIR radiation is partially absorbed by polyethylene windows and by water vapor in
the atmosphere. The polyethylene windows used to separate the vacuum required for
the electron beam from the atmosphere have (intensity) transmissions of from 75%
at 50 pm to 90% at 200 pm, according to the manufacturer.
A practical model known as HITRAN [47] is used to compute the effect of atmo-
spheric humidity via the commercial code HITRAN-PC [48]. The transmission at the
wavenumbers of interest is plotted in Fig. 7.5 which shows that the absorption due to

7.3. RADIATION SPATIAL DISTRIBUTION AND DIVERGENCE 115
Transmission spectrum: 1 atm. 25 degC, 60% relative humidity, 1 m path
11 15 Wavenumber [I
-
Figure 7.5: The effect of humidity as calculated from HITRAN. The energy trans- mission for wavenumbers 20/cm through 250/cm is shown. The parameters of the HITRAN run are 1 m path length, 25deg C, 1 atm pressure, and 0.012 atm Hz0 vapor pressure corresponding to 60% relative humidity.
water vapor can be quite severe. Energy measurements must be corrected to account
for this.
For a one-meter path length and 60% relative humidity the transmission averages
30% over the lOO-200/ cm wavenumber range. In order to see the overall transmission,
Figure 7.6 shows the mathematically smoothed transmission spectrum for several
different path lengths. The smoothed spectrum is used to correct the energy measured
by the Michelson interferometer.

116 CHAPTER 7. DISCUSSION OF MEASUREMENTS
Transmission: 1 atm. 25 degC, 60% relative humidity, 1, 0.5, 0.3, and 0.1 m paths 1, I
~-- - 150 Wavenumber [l/cm]
200 - 250 -
Figure 7.6: Atmospheric absorption through 0.1, 0.3, 0.5, and 1 m path lengths. The other parameters are identical to Fig. 7.5. The transmission spectrum has been
- mathematically smoothed to illustrate the overall effect of atmospheric absorption.
7.3 Radiation Spatial Distribution and Divergence
~?>-. 7.3,:1 Spatial Distribution at 52 ,um
The measured spatial distribution at 52 pm in Fig. 7.7 illustrates a typical distribu-
tion and its Gaussian approximation. The measured distribution is approximately
Gaussian, but is somewhat sharper than the Gaussian, in Fig. 7.7 having 24% greater
amplitude than the fit Gaussian. As shown in Fig. 5.9 and Table 5.1 and discussed
below the size-vs-distance behavior of the distribution is consistent with a Gaussian
beam which fills the undulator chamber at exit.
7.3.2 Angular Divergence
The measurements of the 227, 91, and 52 pm radiation as shown in Fig. 5.9 and Ta-
ble 5.1 demonstrate that the angular divergence increases linearly with the radiation

7.3. RADIATION SPATIAL DISTRIBUTION AND DIVERGENCE
FWHMx=l2 FWHMy=l2mm maxV=O.O2lV sigX=7 sigY=6mm maxV=O.O17V
0.02 1 E”.015 g g & 0.01. E -0 2i
0.005..
0 I
Y [mm1 Y b-W
117
Figure 7.7: Leftmost plot is measured (960612) spatial distribution at 52 pm taken 0.32 m from undulator exit. A 600 PV uniform background has been subtracted from the measured data. The maximum bolometer voltage is 21 mV and the integrated voltage over the entire measurement, when corrected for the overcounting due to 2 mm steps of a 5 mm aperture, is 176 mV which corresponds to 41 pJ. The FWHM measured is 12 mm. The rightmost plot shows a least-squares fit of a Gaussian to the measurement.

118 CHAPTER 7. DISCUSSION OF MEASUREMENTS
.s wavelength, as would be expected from a diffraction-limited source. The angular di-
: vergence does not increase as 6, as would be expected for the quasi-monochromatic
‘central cone’ of Eq. (2.19).
The measurements shown in Fig. 5.9 are for the vertical dimension, which is per-
pendicular to the wiggle plane, so one would not expect broadening from increasing
K. In the horizontal plane the measurements are basically the same: the measured
spatial distributions are approximately radially symmetric, as shown in Figs. 5.7,
5.10, and Fig. 7.7, for example. Overall the measurements suggest that a Gaus-
sian beam filling the undulator chamber is a reasonable approximation of the spatial -b- - - -
characteristics of the radiation.
In Fig. 5.9 the beam size measurement nearest the undulator for the 52 pm radia-
tion (approximately the same as that shown in Fig. 7.7) is not included. If included, - the measurements showed the shape of the distribution could be modelled as a Gaus-
sian beam expanding with 2 mrad divergence from a waist some 5.7 m usptream of
the undulator. However there was an obvious problem in that the size of the modelled
=A- beam would be larger than the inner radius of the undulator chamber.
One possible cause of this effect is the structure of the mirror used to reflect the
radiation. The mirror consists of a circular ‘drumhead’ of Al foil, 43 mm in diameter.
The drumhead tension is provided by a 4-mm-thick ring surrounding the drumhead
foil. The ring contains sharp edges which can scatter incident radiation. Near to
the mirror a beam reflected from the ring structure may resemble the incident beam,
with some broadening. Further from the mirror the scattered radiation diverges and
forms a low level background about the remaining core of the beam. The net result
is that the core of the beam looks larger near the mirror and appears to get smaller
further from the mirror. Thus the core of the beam appears less divergent, and may
even appear slightly convergent depending on the degree of scattering.
To get around this problem the 52 pm radiation data taken nearest the mirror was

7.3. RADIATION SPATIAL DISTRIBUTION AND DIVERGENCE 119
ignored. The 91 pm and 227 pm measurements were sensible without the preceding
correction, possibly because these longer wavelengths do not ‘see’ the sharp edges.
The near data was included in the fits for these wavelengths as shown in Fig. 5.9.
In order to independently verify the divergence measured for the 52 pm radiation,
energy measurements at different locations were done. Spatial distribution measure-
ments of a total energy of 41 PJ at the window 0.3 m from the undulator compare to
5.6 PJ at a 1 cm radius window 4.3 m from the undulator, and total energies collected
by paraboloids at the same two locations are 37 PJ and 3.9 PJ respectively.
Using the Gaussian be_am, mod21
I(r) = I(&, (7.5) -
where 1s is the peak radiation intensity in [W/m2], th e p ower within a radial distance
rmax is
(7.6)
where Ptot is the total power in the radiation beam. With a -1.91 m source location
and 0.58 m Rayleigh length, Eq. (5.1) predicts a 12 mm beam radiusat 0.3 m, and
a 33 mm beam radius W at 4.3 m. Within the T = 10 mm window radius at those
locations 97% and 17%, respectively, of the total beam energy are expected. Thus at
4.3 m 17% of the energy measured at 0.3 m should be detected. This compares to
the 11% measured with the paraboloids and 14% measured by xy scans.
To eliminate this discrepancy and match the 14% measured by xy scans, a 36.9
mm radiation beam radius is needed at 4.3 m. This corresponds to a source radius of
2.8 mm, and thus a 0.47 m Rayleigh length. This is not significantly different from the
3.1 f 0.6 mm radius and 0.58 f 0.23 m Rayleigh length of Table 5.1. Thus the energy
measurement confirms, within errors, the result of the divergence measurement.

120 CHAPTER 7. DISCUSSION OF MEASUREMENTS
.- 7.3.3 Experimental Measurement of Michelson Efficiency :
The-preceding measurements can be compared to the 165 nJ detected under the same
conditions by the Michelson after the dump. This requires making corrections for the
acceptance, beam-splitter efficiency, and atmospheric absorption of the Michelson.
The Michelson acceptance is determined by a 1 cm HDPE window, at 2.1 m from
the undulator exit, where a beam width of 2.2 cm is expected, and hence 34% of the
radiation beam energy should be accepted. The beam-splitter efficiency is 7% and
the atmospheric absorption is 60% so 1.4% of the total energy, that is 518 nJ of 37
pJ, is expected at the detector. ~Th&_is greater than the 165 nJ detected, which may
be partially due to a misalignment in the Michelson.
There is about 240 nJ in the DC component of the Michelson interferogram com-
- pared to 165 nJ in the undulator radiation (integrated energy spectral density), which
may mean that some of the incident radiation is not interfering at the detector. In
the ideal case the DC component of the interferogram should equal the sum of the
harmonic components (see Eq. (4.18))) h owever if the beam spots from the two arms =-. e_. of the interferometer are offset at the detector, then the harmonic components are
reduced while the DC component of the interferogram remains the same. More com-
monly, if there is an angular error then rather than a uniform spot, fringes will appear.
As the-scan progresses the bright fringes exchange positions with dark fringes and
so do not contribute to the harmonic component of the interferogram; the detected
interference is dominated by the amount of the central spot that is imaged to the
detector. This may be happening to some extent in the Michelson, and would explain
why the DC voltage level in the interferogram is greater than the integrated voltage
in the spectrum. It would also help explain why the detected energy is smaller than
expected from comparison with the paraboloids and xy scans.
Whatever the reason, these measurements show that the energy in the interfero-
gram is only a third of what is expected, after correction for beam-splitter efficiency

7.4. MAGNITUDE OF RADIATED ENERGY 121
and atmospheric absorption. Therefore the efficiency of the Michelson is a factor of
three less than expected. ’
7.4 Magnitude of Radiated Energy
The total energy at 52 pm (and all other wavelengths) was found to be greater than
expected from coherent enhancement alone. To explain the discrepancy at 52 pm
as due to collection of large-angle radiation and match the measured 41 pJ, the xy
scan must collect angles out to 2.1/y = 70 mrad, which is a 9 cm radius at the -+- -
scan location (with respect to the undulator midpoint).- This is certainly not in any
way consistent with the either 1.6 cm radius of the HDPE window or the 3 cm full
travel of the scan. Of course, the angular divergence measurements discussed in the
previous section directly show that such large-angle radiation is not contributing to
the measurement. With the large acceptance provided by light pipes discussed in
Chapter 5, see Figs. 5.7 and 5.8, it was shown that there can be substantial radiation
at large angles, it was simply not collected with the setup of Fig 4.10.
7.4.1 Energy in the Forward Direction
A remarkable feature of the radiation measurements of Table 6.2 and Fig. 6.5 is that
the measured energy at long wavelengths, if it is all at the fundamental frequency,
is greater even than would be expected from a form-factor of one, the maximum
possible. One factor reducing this discrepancy is that there is substantial coherently-
enhanced radiation in the higher harmonics, especially the third harmonic-evidence
of this is seen in Fig. 5.5.
Another effect that underestimates the expected radiation is that the calculation
has assumed an average acceptance angle defined in Eq. (6.3), which is equivalent
to assuming the radiation propagates as in free space, becoming spherical wavefronts

122 CHAPTER 7. DISCUSSION OF MEASUREMENTS
-S after several Rayleigh lengths. If the radiation is being guided within the undulator
-. chamber then Eq. (6.3) no longer applies and a better approximation is that the ra-
diation is diverging from the undulator exit. Using the acceptance with respect to
the undulator exit results in multiplying the expected and form-factor-one energies
by a factor of 2.7/0.7 = 4, after which the measured energy is less than the calcu-
lated form-factor-one energy, even ignoring the contribution of the third and higher
harmonics.
Other evidence at long wavelengths pointing to guiding, and in particular wave-
guide modes, is that the measured spatial distribution is approximately symmetric, as ~-&- -
shown in Fig. 5.7 for example. What is expected at a wiggler strength K = 3,as is the
case in Fig. 5.7, is a distribution that is three times wider horizontally (ie in the wiggle
plane) than vertically and this is not seen at all. The measured spatial distribution -
and the angular divergence measurements of Fig. 5.9 suggest that at long wavelengths
the radiation is expanding as an approximately symmetric diffraction pattern from
near the exit of the undulator.
‘>-- At short wavelengths, the measurement of Fig. 5.10 showed that the spatial distri-
bution of undulator radiation did not change as a function of undulator length. This
is strong evidence of waveguiding even at short wavelengths.
7.5 Gain Measurements and Theory
The quantitative agreement with one-dimensional theory is suprising, as there are
two main effects that would be expected to reduce the measured gain from that
expected from the theory. One is the diffraction of the radiation away from the
electron beam. The other is the forward slippage of the light away from the finite-
length electron bunch, which reduces the time the light can interact with the electron
beam. The diffraction effect is not too severe, since the measured Rayleigh length

7.5. GAIN MEASUREMENTS AND THEORY 123
of 52 pm radiation is about 0.5 m, which means the spot doubles in area (and the
intensity drops by‘50Y) o every 0.‘5 m. This Rayleigh distance corresponds to about
seven undulator periods hence seven radiation wavelengths and thus is longer than
the slippage time for the light across the approximately four-wavelength-long bunch.
Thus diffraction within a ‘slippage time’ is small, and the effect of slippage is expected
to be greater than that of diffraction.
-
The gain degradation expected from slippage may be overcome by several fac-
tors. One is the unique properties of very-short bunches which are ignored in the
slowly-varying-envelope approximation (SVEA) which is used in most, if not all, FEL -b- -
theories. Theoretical studies suggest that including theierms dropped by the SVEA
will result in an increase in the predicted gain [50].
Another factor which may overcome the losses due to slippage is the energy-time
correlation in the SUNSHINE beam which acts as a source term in Eq. (3.8) [46]. As
shown in Fig. 7.3 a 1% linear energy chirp over the bunch can result in almost tripling
the radiated energy predicted by the theory. Possibly other coherent structure in the
energy distribution is contributing to the measured gain.
Finally, if the radiation is propagating as high-order modes of the 1 cm radius
vacuum chamber, slippage will be reduced due to the slower-than-c group velocity of
such modes.

Chapter 8
Summary
-
1. e_.
This thesis has documented the operation and performance of a bright, pulsed FIR
source of potential value to .the scientific community. The source uses single-pass su-
perradiant undulator radiation from sub-picosecond electron bunches. The brightness
of this undulator radiation exceeds what is expected from coherent enhacement alone.
This can be explained in the 50-70 pm range as mainly due to self-amplification as
‘- evidenced by the measured superlinear growth in radiation with undulator length.
This is the first such measurement at wavelengths less than 600 pm.
8.1 A Bright Source
For reference, the measured radiation parameters of Table 1.3 are repeated here. As
pointed out in Eq. (1.3), these parameters correspond to a peak brightness lo-12
orders of magnitude greater than that of a 2000 K blackbody.
125

126 CHAPTER 8. SUMMARY
Table 8. : 1:
Parameter Value Wavelength tunability . 45 to 300 pm Micropulse power lo-40 kW (50-200 pm) Macropulse power 0.2-1.6 kW (50-200 pm) Average power 3-50 mW (50-200 pm) Angular divergence 5-20 mrad (50-200 pm) Effective source size 3 mm l/e2 radius Polarization 80 % linear Micropulse length 26 radiation wavelengths Micropulse separation 350 ps Macropulse length 0.7-1.1 ,LLS (50-200 pm) Macropulse repetition rate 4-30 Hz Macropulse linewidth 12-20% FWHM
~-rc- - Parameters of superradiant undulator radiation at SUNSHINE.
8.2 Observation of Self-Amplification -
=-. *--
Regardless of the theory, self-amplification has been observed in this experiment,
as shown in Fig. 6.6 for example. The self-amplification is correlated with a greater-
than-expected superradiant power as calculated from the measured beam parameters,
and .:can be repeatably generated operationally by maximizing the radiated energy
normalized by the square of electron beam current,
8.3 _ Future Prospects: Another Undulator
The immediate extension of this thesis work is the installation of a second undu-
lator, identical to the first, which is already underway. If the trend seen in Fig. 6.6
is maintained, then extrapolation of those fits will give the curves shown in Figs. 8.1,
and thus an increase of a factor of 10-100 in the FIR power. A peak power of the
order of 1 MW at 50 pm may be achievable.

8.3. FUTURE PROSPECTS: ANOTHER UNDULATOR
960612 K=0.6
127
960627 K=0.6
0 20 40 Period number
Figure 8.1: Measured energy vs undulator length at K = 0.6 and extrapolation to the case of two undulators. The circles are the measurements, the solid line is a theoretical SASE fit, and the dashed lines are calculated superradiant undulator radiation.
i
Bibliography
[I] Committee on Free Electron Lasers and Other Advanced Coherent Light Sources.
Free Electron Lasers and Other Advanced Sources of Light. National Academy --+- - - . Press, Washington, D.C., 1994.
[2] H. Motz. Applications of the radiation from fast electron beams. Journal of
Applied Physics, 22(5):527-535, 1951.
[3] P. Kung, D. Bocek, H.-C. Lihn, and H. Wiedemann. Generation and measure-
ment of 50-fs (rms) electron pulses. Physical Review Letters, 73(7):967-970, 1994.
[4] T. J. Orzechowski et al. Microwave radiation from a high-gain free-electron laser
amplifier. Physical Review Letters, 54(9):889-892, 1985.
[5] D. A. Kirkpatrick et al. A millimeter and submillimeter wavelength free-electron
laser. Physics of Fluids I?, 1(7):1511-1518, 1989.
[6] A. E. Siegman. Lasers. University Science Books, Mill Valley, California, 1986.
[7] G. W. Chantry. Long-wave Optics. Academic Press, London, 1984.
[8] G. Ramian. The new UCSB free-electron lasers. Nuclear Instruments and Meth-
ods in Physics Research, A318:225-229, 1992.
[9] K. Berryman and T.I. Smith. First lasing, capabilities, and flexibilty of FIRE-
FLY. Nuclear Instruments and Methods in Physics Research, A375:6-9, 1996.
129

130 BIBLIOGRAPHY
i
.- [lo] D. Oepts, A. F. G. van der Meer, and P. W. van Amersfoort. The free-electron- : laser user facility FELIX. Infrared physics and Technology, 36(1):297-308, 1995.
[li] R. Bonifacio, C. Pelligrini, and L.M. Narducci. Optics Communications, 50:373,
1984.
[12] J. D. Jackson. Classical Electrodynamics. John Wiley and Sons, New York, 1975.
[13] D.F. Alf erov, Yu. A. Bashmakov, and E.G. Bessonov. Transl. Sov. Phys. Tech.
Phys., 18: 1336, 1974. --&- - - - .
[14] S. Krinsky. Undulator for the 700 MeV VUV-ring. Nuclear Instruments and.
Methods, 172:73-76, 1980.
- 1151 A. Hofmann. Theory of synchrotron radiation. SSRL ACD-note 38, Stanford
Synchrotron Radiation Laboratory, 1986.
[16] R. P. Feynman. Lectures on Physics, volume 1. Addison-Wesley, 1963. I .
-e_.
[17] W. M. Lavender. Observation and analysis of x-ray undulator radiation from
PEP. SSRL Report 89/02, Stanford Synchrotron Radiation Laboratory, ,1989.
[18] W: M. Lavender. polarization. c and g-k-dphi . c programs. Unix-compilable
C code, 1989.
[19] D. Vaughan et al. X-Ray Data Booklet. Lawrence Berkeley Laboratory, Berkeley,
California, 1986.
[20] J. S. Nodvick and D. S. Saxon. Physical Review, 96:180, 1954.
[21] I. S. Gradshteyn and I. M. Ryzhik. Tables of Integrals, Series, and Products.
Academic Press, New York, 1965. _

BIBLIOGRAPHY 131
[22] H.-C. Lihn. Stimulated Coherent Transition Radiation. PhD thesis, Stanford
University, 1996.
[23] J. B. Murphy and C. Pellegrini. Laser Handbook Volume 6, chapter 2. North-
Holland, Amsterdam, 1990.
[24] N.M. Kroll and W.A. McMullin. Physical Review A, 17:300, 1978.
[25] A. Gover and Z. Livni. Optics Communications, 26:375, 1978.
[26] I.B. Bernstein and J.L. Hirshfeld. Physical Review A, 20:1661, 1979. -6. -
[27] P. Sprangle, C.M. Tang, and W.M. Manheimer. Physical Review A, 21:302, 1980.
[28] C.C. Shih and A. Yariv. IEEE Journal of Quantum Electronics, QE-17:1387,
1981.
[29] G. Dattoli, A. Marino, A. Renieri, and F. Romanelli. IEEE Journal of Quantum
Electronics, QE-17:1371, 1981.
[30] S. Krinsky. Intoduction to the theory of free electron lasers. In AIP Conference
Proceedings, number 153, pages 1015-1043, 1985.
[31] K.-J. Kim. An analysis of self-amplified spontaneous emission. Nuclear Instru-
ments and Methods in Physics Research, A250:396-403, 1986.
[32] E. T. S h 1 c ar emann. Laser Handbook Volume 6, chapter 9. North-Holland, Ams-
terdam, 1990.
[33] H. P. Freund and T. M. Antonsen. Principles of Free-electron Lasers. Chapman
and Hall, New York, 1992.
[34] R. Bonifacio, C. Pelligrini, and L.M. Narducci. Slippage and superradiance in
the high-gain FEL: Linear theory. Optics Communications, 68:369-374, 1988.

132 BIBLIOGRAPHY
[35] R. Bonifacio, F. Casagrande, G. Cerchioni, L. De Salvo Souza, and P. Pierini.
: High Gain, High Power Free Electron Lasers, pages 35-94. Elsevier Science
Publishers, 1989.
[36] M. Borland. A high-brightness thermionic microwave electron gun. SLAC Report
402, Stanford Linear Accelerator Center, 1991.
[37] P. Kung. Generation and Characterization of Sub-picosecond Electron Bunches.
PhD thesis, Stanford University, 1996.
[38] H. Wiedemann, P. Kung, ani.-C.%hn. Nuclear Instruments and MEthods in
Physics Research, A319:1, 1992.
- [39] P. Kung, D. B ocek, H.-C. Lihn, and H. Wiedemann. High-intensity coherent
FIR radiation from sub-picosecond electron bunches. In Gas, Metal Vapor, and
Free-Electron Lasers and Applications, number 2118, page 191. SPIE, 1994.
‘r-- [40] .R. B. Neal et al. The Stanford Two-mile Accelerator. W. A. Benjamin, New
York, 1968.
[41] K. Halbach. Phy sical and optical properties of rare earth cobalt magnets. Nuclear
Instruments and Methods in Physics Research, 187:109-117, 1981.
[42] H.-C. Lihn, D. Bocek, P. Kung, C. Settakorn, and H. Wiedemann. Measurement
of subpicosecond electron pulses. Physical Review E, 53(6):6413-6418, 1996.
[43] G. W. Chantry. Submillimetre Spectroscopy. Academic Press, New York, 1971.
[44] H.-C. Lihn, D. B ocek, M. Hernandez, P. Kung, C. Settakorn, and H. Wiede-
mann. Observation of stimulated transition radiation. Physical Review Letters,
76(22):4163-4166, 1996.

BIBLIOGRAPHY 133
[45] D. Bocek, P. Kung, H.-C. Lihn, C. Settakorn, and H. Wiedemann. Observation of
SASE at 47,um. Nuclear Inst&ments and Methods in Physics Research, A375:13-
16, 1996.
[46] L.H. Yu. personal communication.
[47] L. S. Rothman et al. The HITRAN molecular database: editions of 1991 and
1992. Journal of Quantitative Spectroscopy and Radiative Transfer, 48:496-507,
Nov.-Dec. 1992.
[48] Ontar Corporation. -L&‘F HLTRAN-PC Version $41. 9 Village. Way North
Andover MA 01845.
- [49] D. Bocek, M. H ernandez, H.-C. Lihn, P. Kung, C. Settakorn, and H. Wiedemann.
Observation of coherent undulator radiation from sub-picosecond electron pulses.
In AIP Conference Proceedings, number 367, pages 381-390, 1995.
[50] E. H. Haselhoff. Free-electron-laser model without the slowly-varying-envelope
=r-- approximation. Physical Review E, 49( l):R47-R50, 1994.