Embed Size (px)
Citation preview
General Disclaimer
One or more of the Following Statements may affect this Document
This document has been reproduced from the best copy furnished by the
organizational source. It is being released in the interest of making available as
much information as possible.
This document may contain data, which exceeds the sheet parameters. It was
furnished in this condition by the organizational source and is the best copy
available.
This document may contain tone-on-tone or color graphs, charts and/or pictures,
which have been reproduced in black and white.
This document is paginated as submitted by the original source.
Portions of this document are not fully legible due to the historical nature of some
of the material. However, it is the best reproduction available from the original
submission.
Produced by the NASA Center for Aerospace Information (CASI)
https://ntrs.nasa.gov/search.jsp?R=19800024810 2018-05-12T01:31:28+00:00Z
ctq ; o - L4 i ^-
Int c• rir_ rtnce
^^:.:ct,Y u^ etAaIfbl(l:uri-.iAC; t"SUN,iC: A u J/,1 E Ail
Filter Photometery of Periodic Comet Ashbrook-Jackson
INTL%,VhREhL6 tILTEa Nu0-3.1i18RiuDIC ::JALT
(J -6 t Pro t - ,llsiuu Ldb.) JO p
%:SCL JJA Uri CId.i
isJ/8'I 1dd9J
R.L. Newb , irn, Jr.'^
J.F. Bell+ V
T.B. McCord+
* Jet Proptslsion Laboratory, California Institute of Technology
+ Hawaii Institute of Geophysics, University of Hawaii at Manoa
II Department of Ph y sics and Astronomy, University of Hawaii at Manoa
JArlU e"SA riACCF
Report on Constract NASA/JPL BP 699 908
AugusL 1980
1. INTRODUCTION
TES
P/Ashbrook-Jackson was discovered on Aug. 24, 1948 by Ashbrook at Lowell
Observatory and simultaneously by Jackson'in Johannesburg, South Africa. The.
comet has a period of 7.43 years and comes to perihelion at 2.284 Al`. It is
a law inclination obJect (12°5) of moderate eccentricity (0.400) (Marsden,
1979). In 1963 it made the best possible apparition, coming; to periholion
and apposition virtually simultaneously, but no one made physical observation:
of faint periodic comets in 1963, In 1978 Ashbrook-,Jackson came to opposition
on Sept. 28, ,just 40 days after perihelion. it will be just over 100 years
before an equally favorable apparition recurs.
P/Ashbrook-Jackson was recovered b y Pereyra at Cordoba Observatory on
April. 28, 1977, more than a year and a quarter before perihelion and already
showing a diffuse coma with central condensation (Marsden, 1977). Its helio-
centric distance was then 3.7 AL'! At that time there was no published photo-
electric photometry for any comet beyond 2 At' nor for any short period comet,
although we were aware of some data in each category awaiting publication. All
extensive program was planned, but equipment problems and weather ultimately
limited it to tine two nights of data reported here.
1-1
11. * OBSERVATIMNS
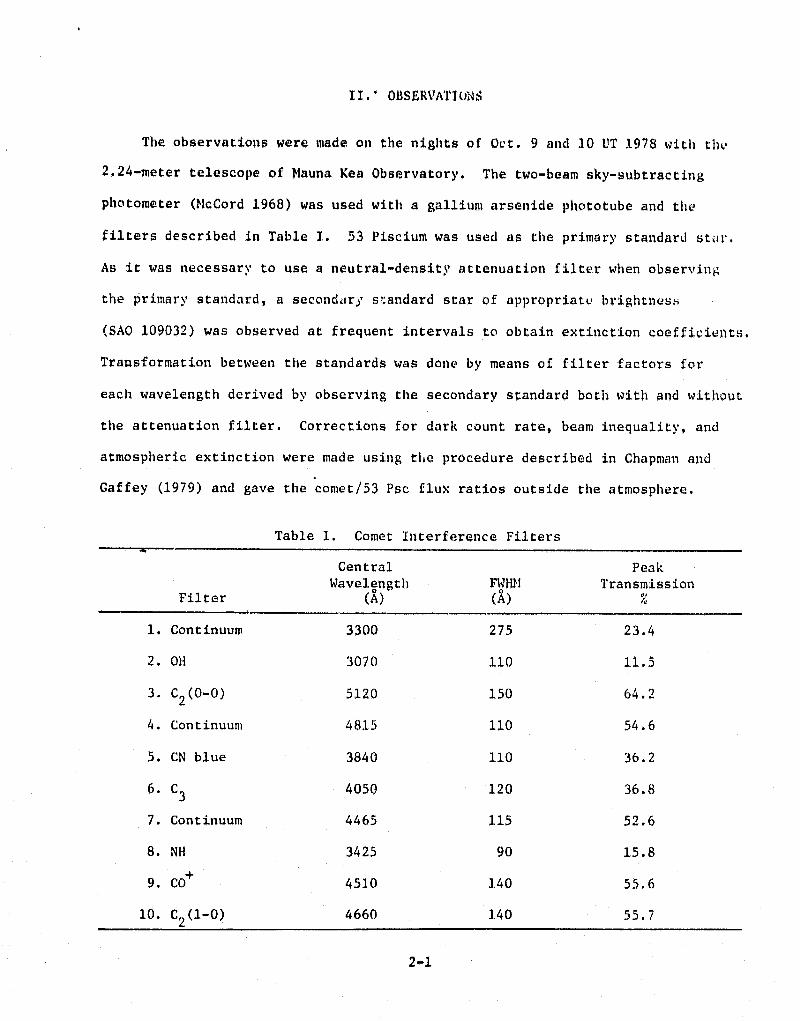
The observations were made on the nights of Oct. 9 and 10 UT 1978 with the
2,24-meter telescope of Mauna Ken Observatory. The two-beam sky-subtracting
photometer (McCord 1968) was used with a gallium arsenide phototube and the
filters described in Table 1. 53 Piscium was used as the primary standard star,
As it was necessary to use a neutral-density attenuation filter when observing
the primary standard, a secondary standard star of appropriate brightness;
(SAO 109032) was observed at frequent intervals to obtain extinction coefficients,
Transformation between the standards was done by means of filter factors for
each wavelength derived by observing the secondary standard both with and without
the attenuation filter. Corrections for dark count rate, beam inequality, and
atmospheric extinction were made using the procedure described in Chapman and
Gaffey (1979) and gave the comet/53 Psc flux ratios outside the atmosphere.
Table 1. Comet Interference Filters
Central PeakWavelength
FWWJ TransmissionFilter (A) (A) 1
1. Continuum 3300 275 23.4
2. Oli 3070 110 11.5
3. C 2 (0-0) 5120 150 64.2
4. Continuum 4815 110 54.6
5. CN blue 3840 110 36.2
6. C3 4050 120 36.8
7. Continuum 4465 115 52.6
8. NH 3425 90 15.8
9. Co+ 4510 140 55.6
10. C2(1-0) 4660 140 55.7
2-1
4
3-1
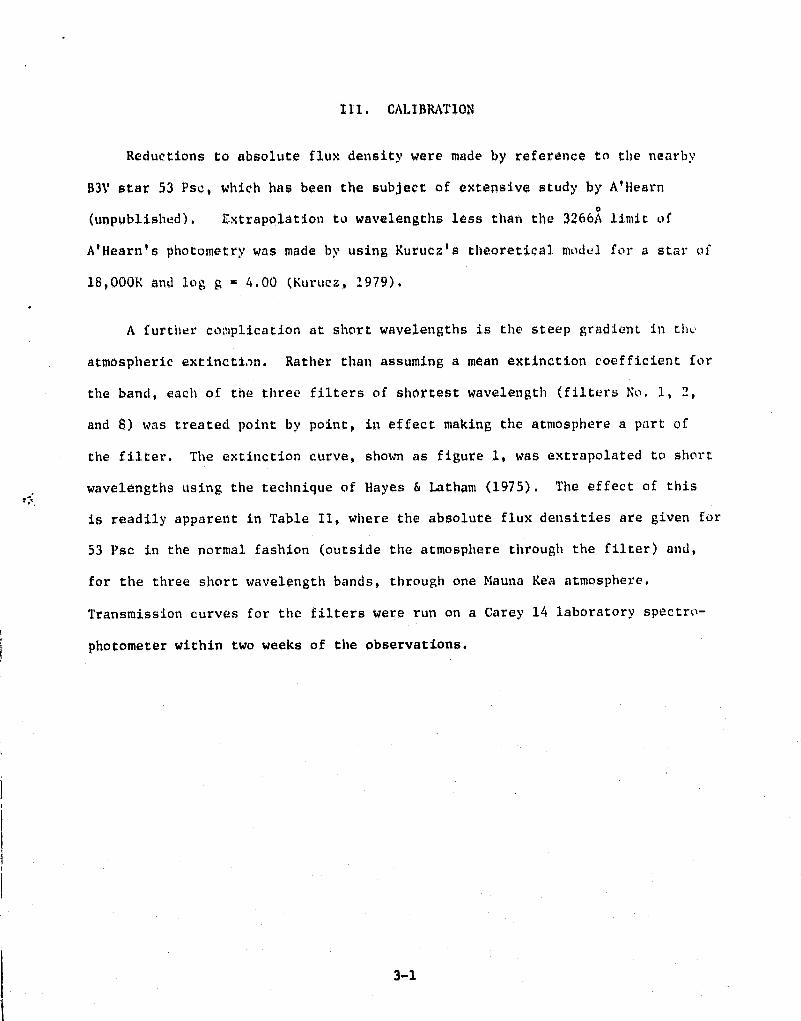
111. CALIBRATION
Reductions to absolute flux density were made by reference to the nearby
B3V star 53 Psc, which has been the subject of extensive study by A'Hearn
(unpublished). Extrapolation to wavelengths less than the 3266A limit of
A'Hearn's photometry was made by using Kurucz's theoretical model for a star of
18,OOOK and log g - 4.00 (Kuruez, 1979).
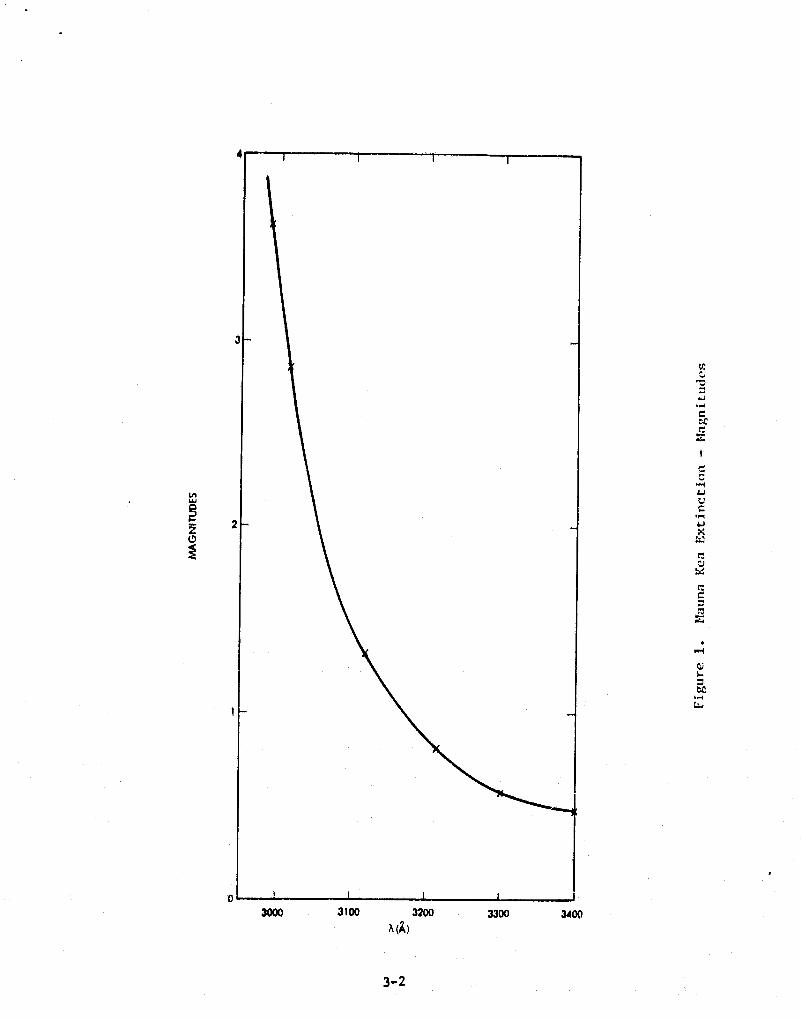
A further complication at short wavelengths is the steep gradient ill th--'
atmospheric extinctiin. Rather than assuming a mean extinction coefficient for
the band, each of the three filters of shortest wavelength (filters No. 1, 2,
and 8) was treated point by point, in effect making the atmosphere a part of
the filter. The extinction curve, shown as figure 1, was extrapolated to short
wavelengths using the technique of Hayes & Latham (1975). The effect of this
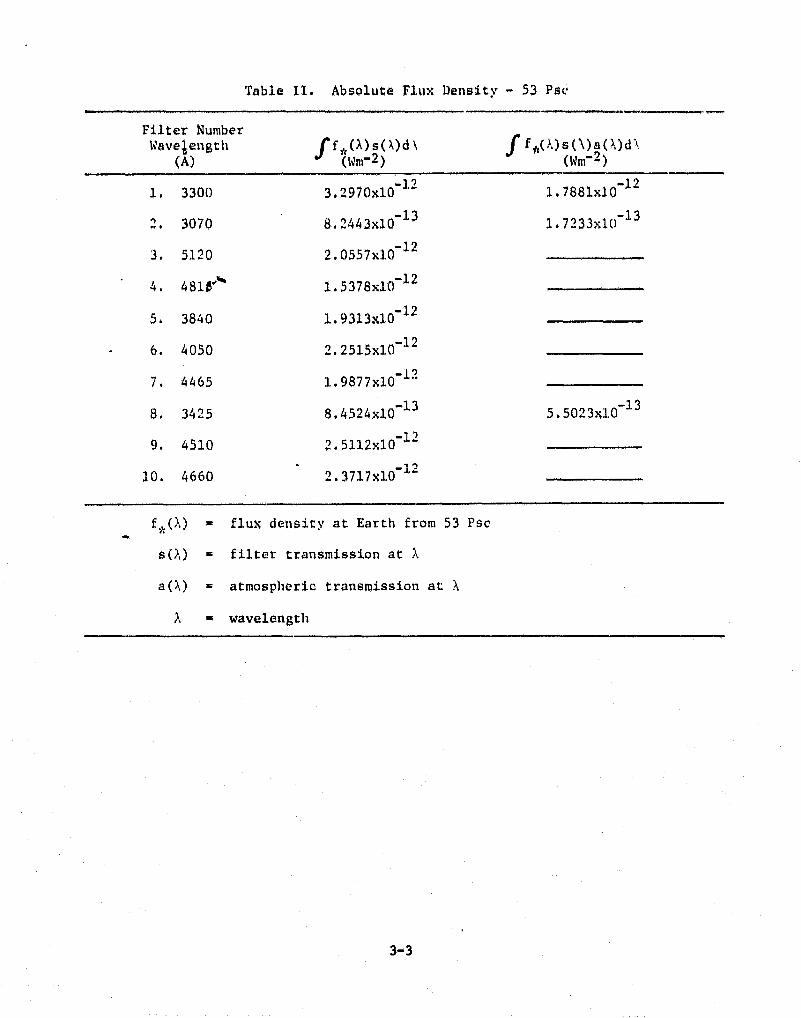
is readily apparent in Table 11, where the absolute flux densities are given for
53 Pse in the normal fashion (outside the atmosphere through the filter) and,
for the three short wavelength bands, through one Mauna Kea atmosphere.
Transmission curves for the filters were run on a Carey 14 laboratory spectro-
photometer within two weeks of the observations.
k
3000 3100 3200 3300 3400
A (A)
3-2
LnW
Z
d^2
G
0
I g:, i
Table 11. Absolute Flux Densit y* - 53 Psc
Filter Number f fj,(A)s(N)a(%)dI,Wavelength f * (a)s0)d\f(A) (Wm-2) (Wm-2)
1, 3300 3.2970x10⁻¹² 1.7881x10⁻¹²
2. 3070 8.2443x1Q 13 1.7233xIO-13
3. 5120 2.0557x10⁻¹²
4. 4816" 1.5378x10`12
5. 3840 1.9313x10⁻¹²
- 6. 4050 2.2515x10⁻¹²
7. 4465 1.9877x10_ 1
8. 3425 8.4524x10-1.3 5.5023x10⁻¹³
9. 4510 ?.5112x10 12
10. 4660 2.3717x10⁻¹²
f * (X) = flux density at Earth from 53 Psc
s M = filter transmission at X
a(?,) = atmospheric transmission at X
- wavelength
3-3
{ t
M
M DATA REDUCTION
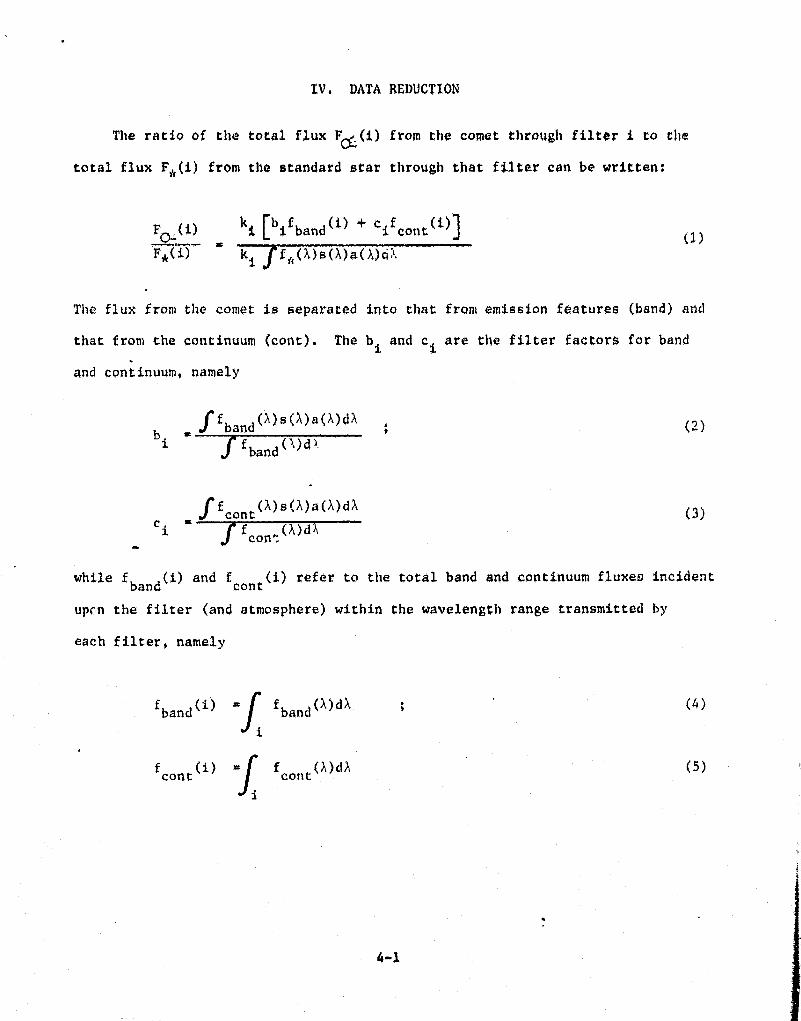
The ratio of the total flux Fc (.M from the comet through filter i to the
total flux F* (i) from the standard star through that filter can be written:
F0-(i)ki tbi fband (i) + cifcont(i)J
F*( ) ki f f j' MsMaMc '
The flux front the comet is separated into that front emission features (band) and
that from the continuum (cont). The b and c are the filter factors for band
and continuum, namely
bandf(X)s(X)a(X)dX
b f (2)
i f band (a)d?`
_ f f cont M s(a)a(X)dX
(3)C i ff onl ('W
while f band (i) and f cont (i) refer to the total band and continuum fluxes incident
upon the filter (and atmosphere) within the wavelength range transmitted by
each f filter, namely
fband (i)f band (X)dXfif cont (i) f cont (X)dX
i
(l)
(4)
(5)
i
4-1
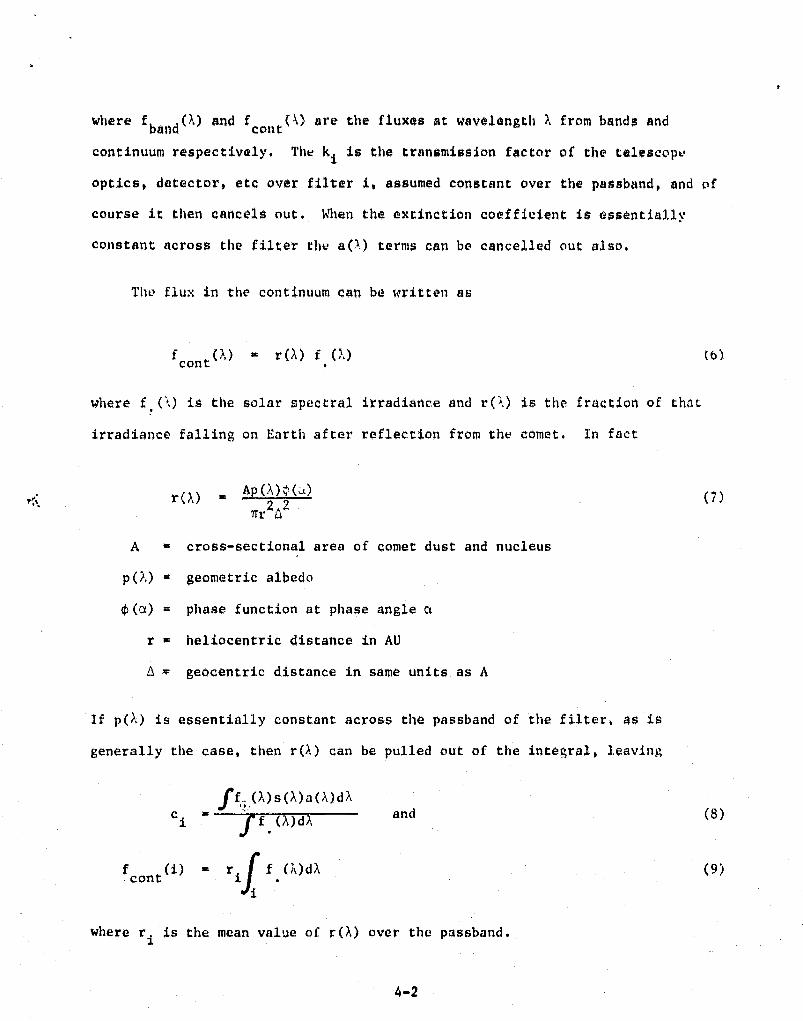
where f band
(k) and f cont (k) are the fluxes at wavelength ). from bands and
continuum respectively. The k is the transmission factor of the telescope
optics, detector, etc over filter i, assumed constant over the passband, and of
course it then cancels nut. When the extinction coefficient is essentially
constant across the filter the a(^) terms can be cancelled out also.
Tbo flux in the continuum can be written as
f contM r f (".) (6)
where f , (3.) is the solar spectral irradiance and r() is the fraction of that
irradiance falling on Earth after reflection from the comet. In fact
r = Ap(-- '^)^(a) (7)7rr2A
A z cross-sectional area of comet dust and nucleus
p(>.) = geometric albedo
c (a) = phase function at phase angle a
r = heliocentric distance in AU
A = geocentric distance in same units as A
If p(X) is essentially constant across the passband of the filter, as is
generally the case, then r(a) can be pulled out of the integral, leaving;
and (b)
i
f ftP)s(^)a(A)dC.
f cont (i)ri f.ONX
i
where r. is the mean value of r1
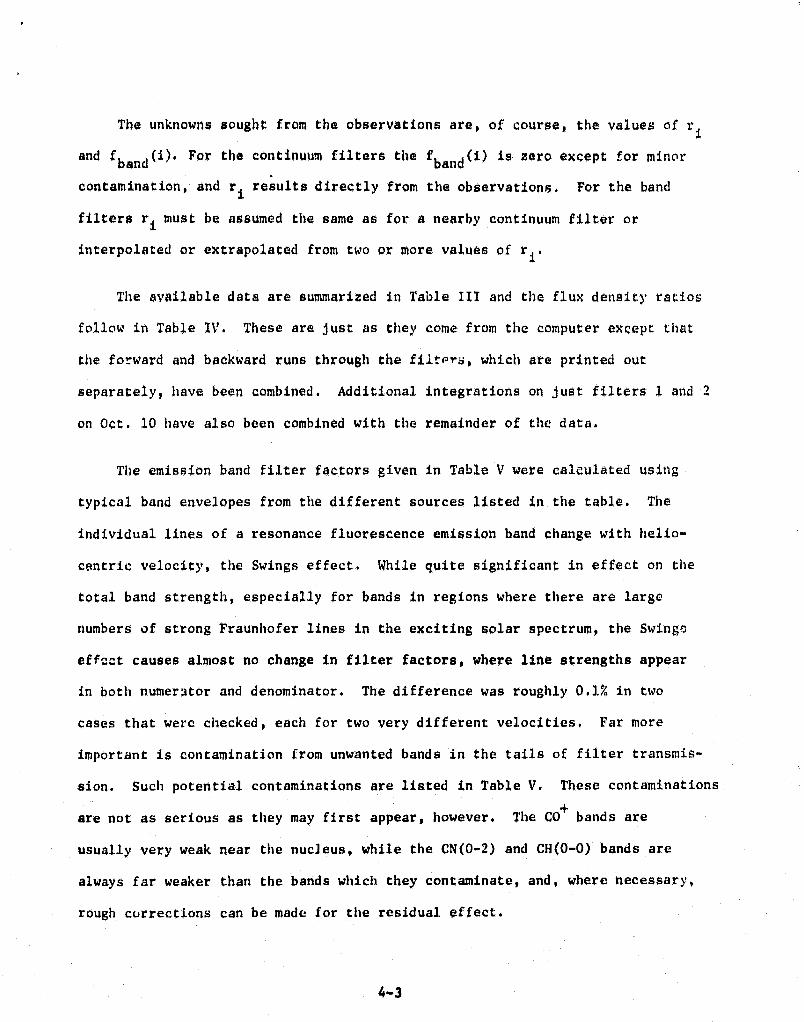
The unknowns sought from the observations axe, of course, the values of r
and f band (i). For the continuum filters the fband(i) is zero except for minor
contamination, and r results directly from the observations. For the band
filters r must be assumed the same as for a nearby continuum filter or
interpolated or extrapolated from two or more values of ri.
The available data are summarized in Table Iii and the flux density ratios
follow in Table IV. These are just as they come from the computer except that
the forward and backward runs through the filters, which are printed out
separately, have been combined. Additional integrations on ,just filters l and 2
on Oct. 10 have also been combined with the remainder of tile) data.
The emission band filter factors given in Table V were calculated using
typical band envelopes from the different sources listed in the table. The
individual lines of a resonance fluorescence emission band change with helio-
centric velocity, the Swings effect. While quite significant in effect on the
total band strength, especially for bands in regions where there are large
numbers of strong Fraunhofer lines in the exciting solar spectrum, the Swingy
effect causes almost no change in filter factors, where line strengths appear
in both numerator and denominator. The difference was roughly 0.1% in two
cases that were checked, each for two very different velocities. Far more
important is contamination from unwanted bands in the tails of filter transmis-
sion. Such potential contaminations are listed in Table V. These contaminations
are not as serious as they may first appear, however. The CO + bands are
usually very weak near the nucleus, while the CN(0-2) and CH(0-O) bands are
always far weaker than the bands which they contaminate, and, where necessary,
rough currrections can be made for the residual effect.
4-3
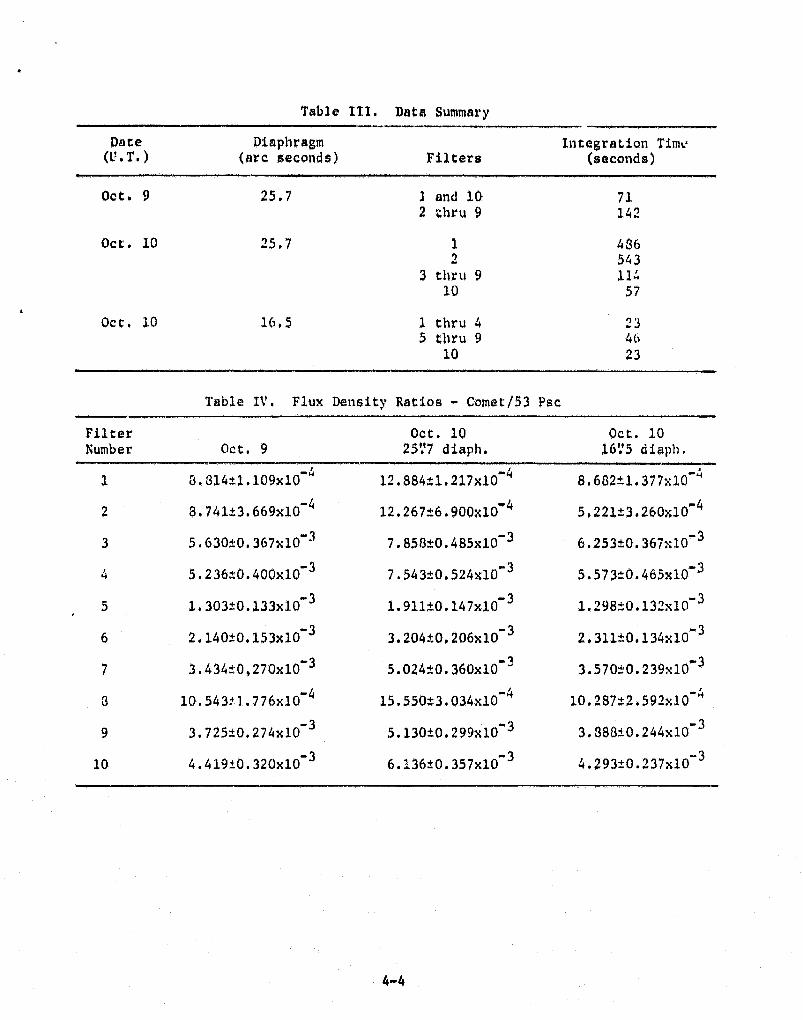
Table III. Data Summary
Data Diaphragm Integration Time(!?.T.) (arc seconds) Filters (seconds)
Oct. 9 25.7 1 and 10 712 zhru 9 142.
Oct. 10 25.7 1 4362 543
3 thru 9 1110 57
Oct. 10 16.5 1 thru 4 235 thru 9 4t-,
10 23
Table IV. Flux Density Ratios - Comet/53 Psc
Filter Oct. 10 Oct. 10Number Oct. 9 2577 diaph. 16:`5 diaph.
1 3.314±1.109x10 12.884±1.217x10⁴
8.682+1.377x10⁻⁴
2 8.74113.669x10-4 12.267*6.900x10 4 5.221±3.260x10⁻⁴
3 5.630*0.367x1,0-3
7.858±0.485x10⁻³ 6.253±0.367x10⁻³
4 5.236±0.400x10⁻³ 7.543*_0.524x10'3 5.573_*0.465x10⁻³
5 1:303±0.133xlO 3 l.91lt0.147xl0-3
1..298±0.132x10⁻³
6 2.140*0.153x10-3
3.20410.206x10-3 2.311±0.134x1O 3
7 3.434±0,270x10 3 5.024 ±0.360x10³
3.570±0.239x10⁻³
3 10.5431.776x10-4
15.550±3.034x10 " 10.287 +2.592x10
9 3.725±0.274x10!3 5.130*--0.299x10⁻³ 3.388±0.244x10⁻³
10 4.419±0.320x10⁻³
6.-36±0.357x10 3 4.293:0.237x10⁻³
4-4
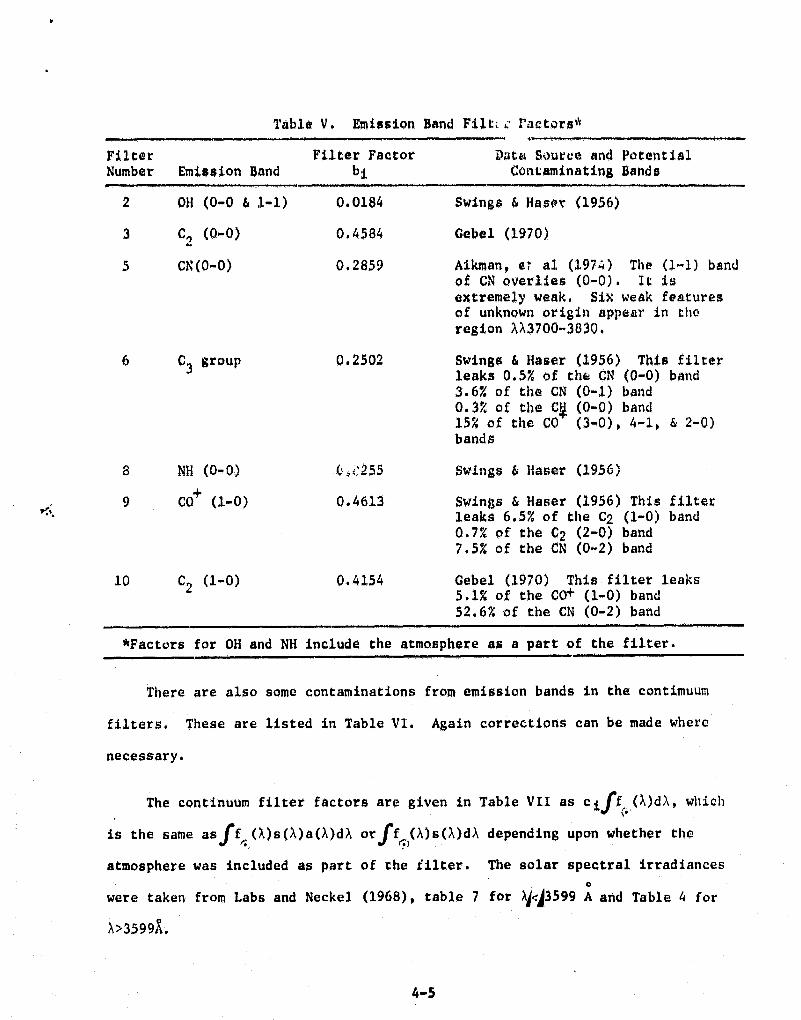
Table V. Emission sand Filt;. ractors*
Filter Filter Factor Pato Source and PotentialNumber Emission Band bi Contaminating Bands
2 Oil (0-0 & 1-1) 0.0184 Swings & Haser (1956)
3 C2 (0-0) 0.4584 Gebel (1970)
5 CN(0-0) 0.2859 Aikman, at al (1974) The (1•-1) bandof CN overlies (0-0). It isextremely weak. Six weak featuresof unknown origin appear in theregion XX3700•-3830.
(1956) This filter.ht^ CN (0-0) band(0-1) band(0-0) band(3-0), 4-1 0 & 2-0)
6 C3 group 0.2502 Swings & Haserleaks 0.5% of3.6% of the CN0.3% of the C^15% of the CObands
8 NH (0-0) G, '255 Swings 4 }laser (1956)
9 CO+ (1-0) 0.4613 Swings & Haser (1956) This filterleaks 6.5% of the C2 (1-0) band0.7% of the C2 (2-0) band7.5% of the CN (0-2) band
10 C2 (1-0) 0.4154 Gebel (1970) This filter leaks5.1% of the CO's' (1-0) band52.6% of the CN (0-2) band
*Factors for OH and NH include the atmosphere as a part of the filter.
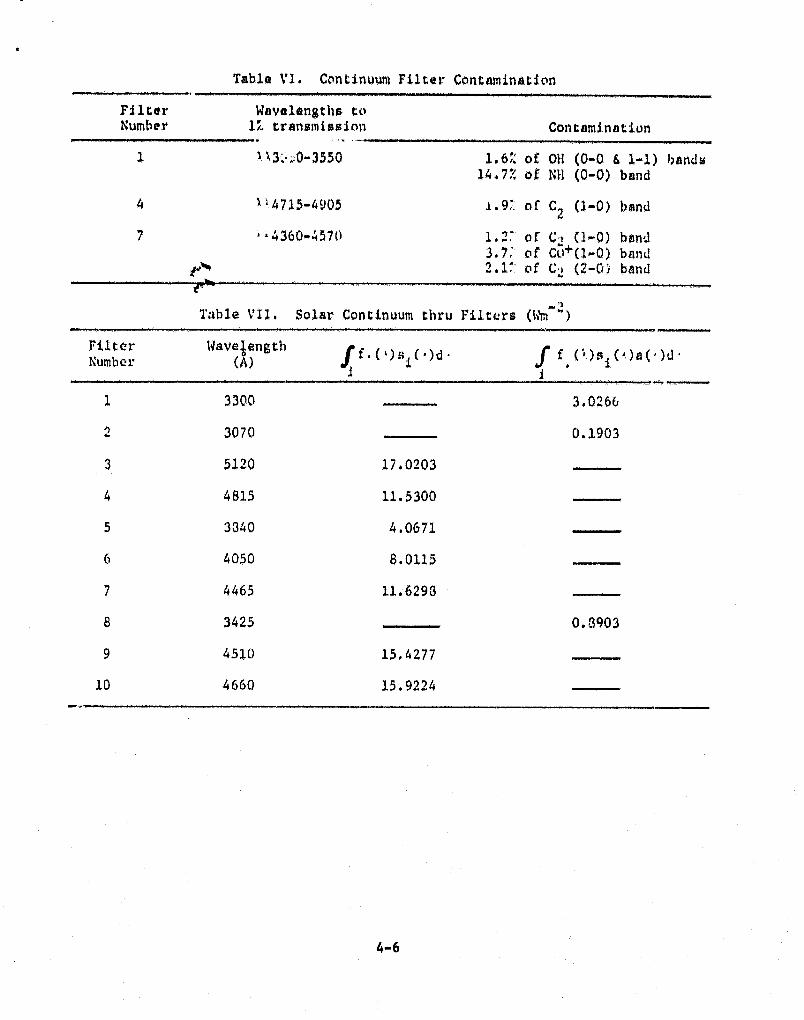
There are also some contaminations from emission bands in the continuum
filters. These are listed in Table VI. Again corrections can be made where
necessary.
The continuum filter factors are given in Table VIl as c iff (X)dX, which
is the same as ff. (X)s(X)a(X)dX or ff.)(A)s(A)dX depending upon whether the
,atmosphere was included as part of the filter. The solar spectral irradiances0
were taken from Labs and Neckel (1968) 0 table 7 for aj<J3599 A and Table 4 for
X>3599A.
4-5
a
Table V1. Continuum Filter Contamination
Filter Wavelengths toNumber 1"<I transmission Contamination
1 a.^3v11;0-3550 1.6 of Oil (0-0 & 1-1) hands14.7% of NH (0-0) band
4 114715-4905 1.9'. of C2 (1-0) band
7 —4360-4570 1.3` of Cq (1-0) ban33.7" of Cct4 (1^-0) band
O.Aft 2 ,1.,of C: j (2-0) band
Table VII. Solar Continuum thru Filters (Wm-")
Filter;cumber
Wavelength f.C;)sf
( , )d . f ( "')s C' )aC'7d{CA) i f i
1 3 300 .____ ... 3.02166
2 30701 0.1903
3 5120 17.0203
4 4815 11.5300
5 3340 4.0671
6 4050 8.0115
7 4465 11.6293
8 3425 0.8403
9 4510 15.4277
10 4660 15.9224
4-6
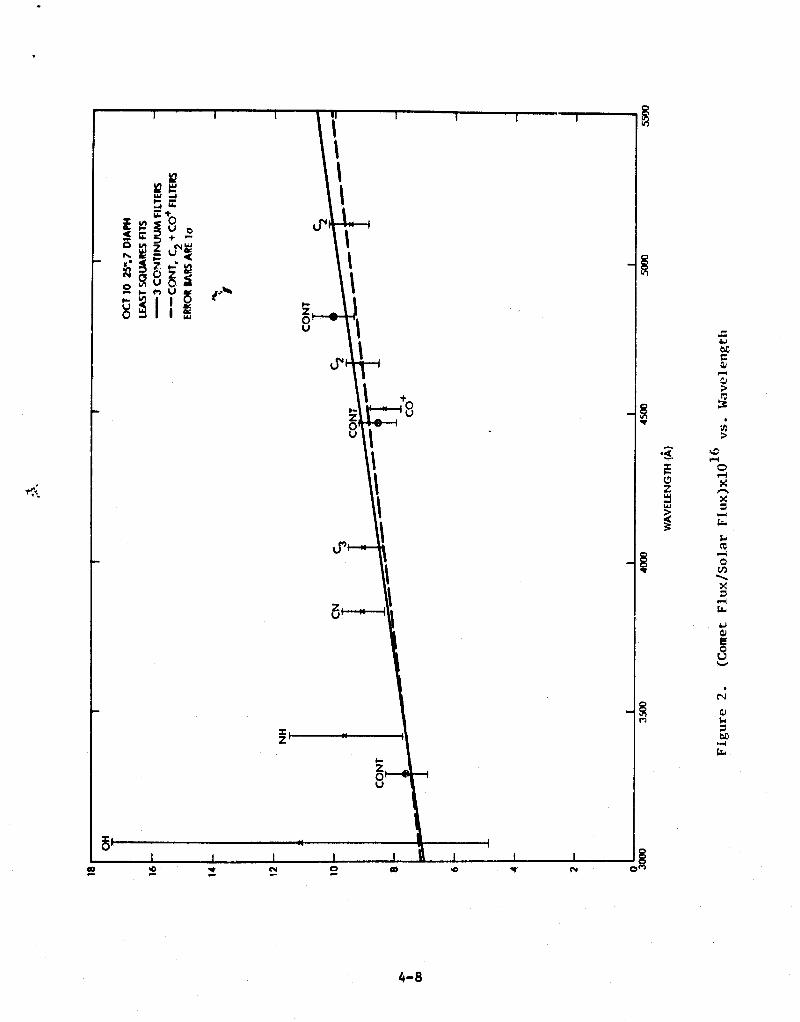
In order to ,get a feeli►►g for the relative magnitudes of continuum and
emission contributions by the comet, the results for Oct. 10 through the 14rg'.r
diaphragm were treated as if there were no emission contribution. Values of r
were calculated for each passba►nd, assuming b=0, and plotted vs. wavelength
as shown in Figure 2. It immediately became obvious that the continuum
dominated the spectrum to the extant that our data were consistent with r,ui.c.
continuum, no emission band being more than 1-1/2 standard deviations above thv
apparent continuum as suggested by least squares fats to three and six filters.
The h211 band contamination of the No. I continuum filter would skew the fit, if
the apparent NH were real. Attempting to solve for the NH and continuum level
simultaneously, assuming the later is the same for both filters, immediately
indicates that there is little or r,o NH, the formal solution in fact giving a
t'[ negative NH abundance. Including the NH filter in the continuum determination
would raise it only slightly since the NH passband is noisy and would have co
be given low weight.
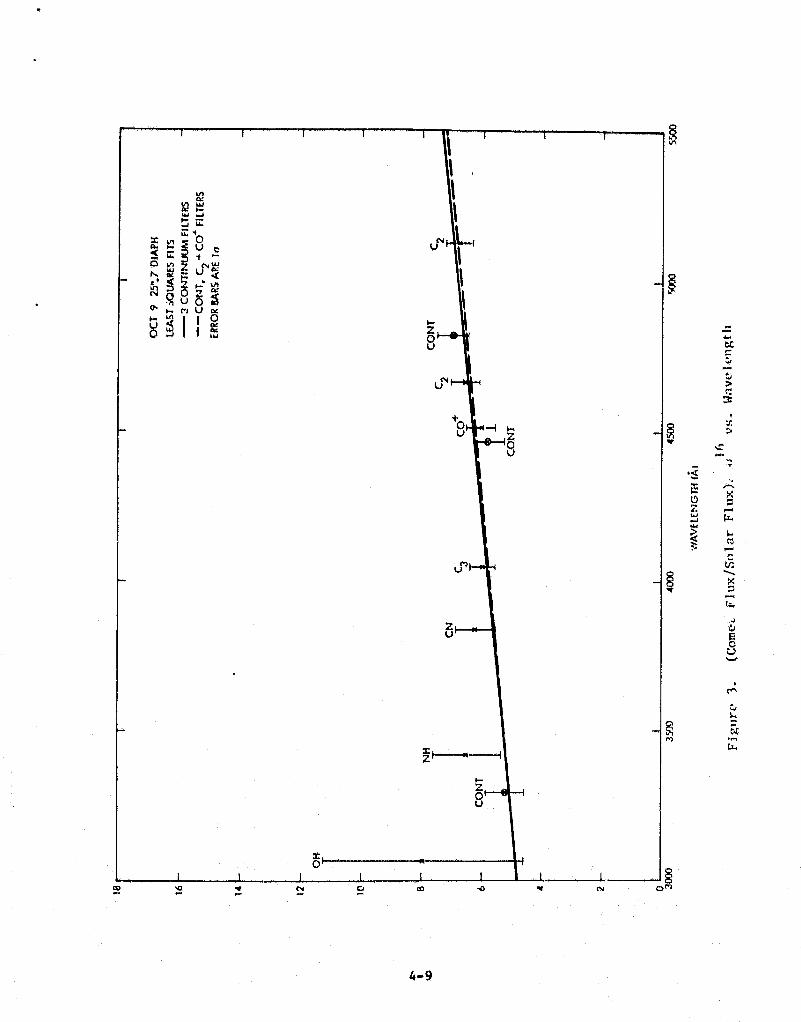
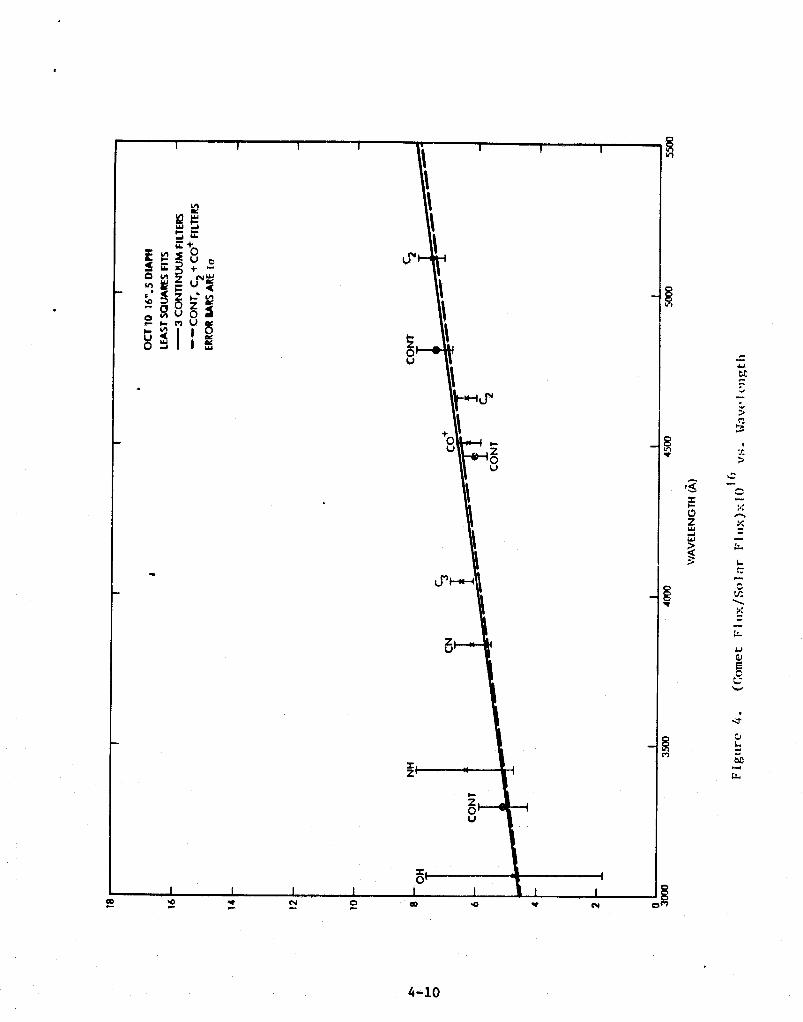
Obviously Ashbrook-Jackson must have a gas coma, the gas being required
to raise the dust and/or icy grains which largely are responsible for the very
prominent visible light coma. It is equally obvious that neither C., nor Ce are
major components of that gas in the inner 12,500 km (1279) of the coma.
Therefore the data for October 9 and the smaller diaphragm data for October 10
are presented in plots similar to Figure 2 as Figures 3 and 4. The dotted line
is again a least squares fit to the three continuum filters plus the two C9
filters and the CO+ filter, while the solid line fits only the three continuum
filters. The values plotted in all three figures are also given in Table VIII.
4-7.
c ^Z^
^c ~^
u '
J4
+Z
Ou
u IV
ts,Iziu
ZZ
2Ouf
I
3
.Q a0
O
W^
W '^
3 ^w
0rn
asa
w
016OUv
^l
O00
Ls.
m :2 2 N O
T ^2-W Cld
5!co ♦ OM
cz
u
69
L)u
ULA 0
LP
'10,u
Lp
zu
z
0u
O
GC
:3:
as
Rt
z
C4
4-9
4-10
9ou :2 T. N 5?
M+
A m g
.2m +0O Z0 N
ZZR b 0 ii.. cn U
"tp
+0Z0
zi
Z.0,
=I
1 10
GC
ti
r.
F
I
I
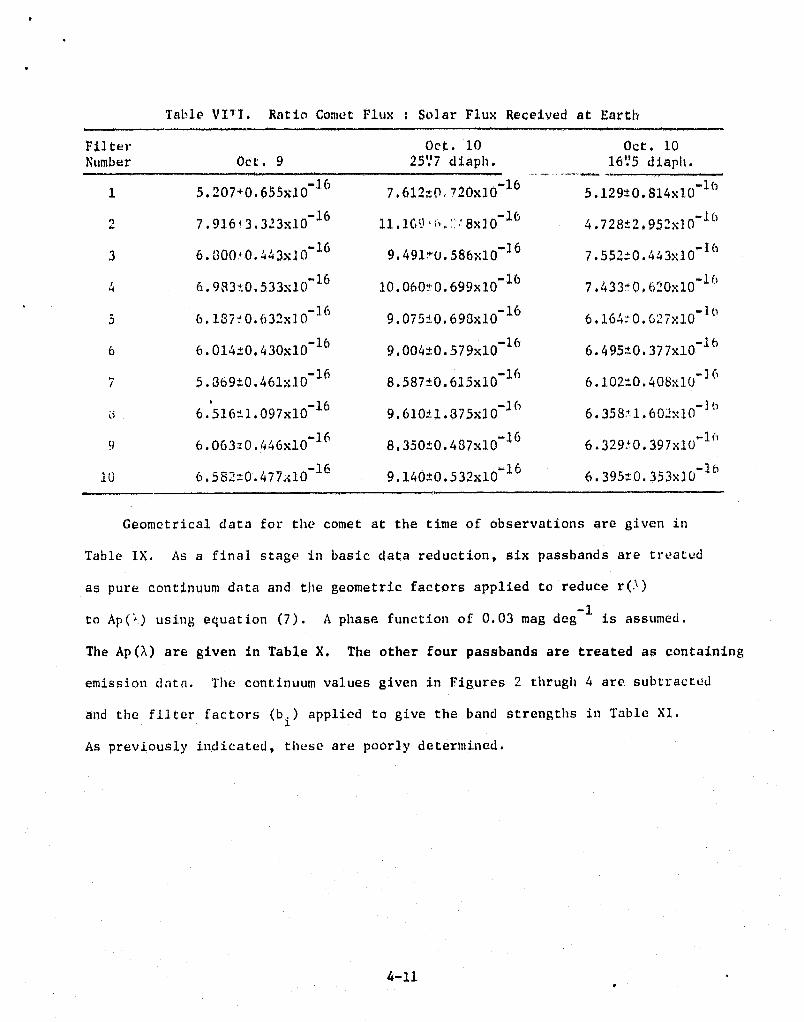
Table VI T I. Ratio Comet Flux : Solar Flux Received at Earth
Filter Oct. 10 Oct. 10
Number Oct. 9 257 7 diaph. 1675 d iaph,
1 5.207*O.655xIO-16 7.612tO.'720x10-16 5.129*0.814x10-1(1
2 7.916+3.323x10⁻¹⁶ 11. W) 8x10-16 4.728*_2.952x10-1.G
3 6.300A.443>00- 16 9.491*U.586xl0-16 7.552--0.443xlO-16
4 6.983tO.533x1U-16 10.06OtO.699x1O -1.6 7.433`0.620x10⁻¹⁶
5 6.137tO.632x1O-16 9.075±0.693x10⁻¹⁶ 6.164:0.627::10-1(1
6 6.014_O.43Oxl0-16 9.004:0.579x10⁻¹⁶
6.495*0.377x10-16
7 5.3b9t0.46lxl0-16 8. 587*_0.615x1O16
6.102:0.~05x10-1(,
6 6.516"1.097x10⁻¹⁶ 9.610:1.375x1.0-1f' 6.358 1.604x10—lo
9 6.063z0.446x1O 16 8.35010.487x10-16
6.329`0.397x1U_l(;
10 6.5fi1'=0.477.c10-16 9.140*0.532x10-16
6.395:0.353x10⁻¹⁶
Geometrical data for the comet at the time of observations are given in
Table IX. As a final stage in basic data reduction, six passbands are treated
as pure continuum data and the geometric factors applied to reduce r(^)
to Ap(.) using equation (7). A phase function of 0.03 mag deg assumed.
The Ap(A) are given in Table X. The other four passbands are treated as containing
emission date. The continuum values given in Figures 2 thrugh 4 are subtracted
and the filter factors (b i ) applied to give the band strengths in Table XI.
As previously indicated, these are poorly determined.
Li4-11
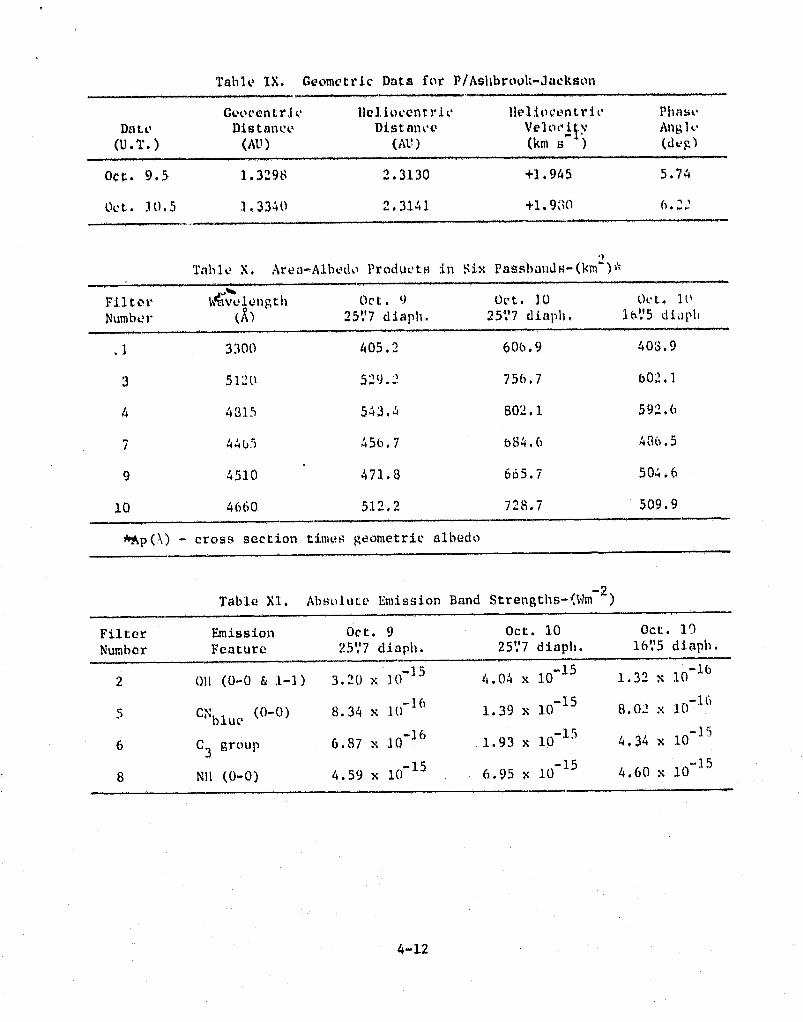
Table IX. Geometric Data for P/Ashbrook -Jackson
Geocentric Heliocentric Heliocentr icDate Distance Distance velooi ti Angle-
(U.T.) (AU ) (Al` ) (km s- ) (dog)
Oct. 9.5 1.32.98 2.3130 +1.945 5.74
Oct. ) 0. 5 1.33 +0 2.3141 +1.960 f,, w'.,
Table X. Area-Albe'do Products in Six Passbands-0o?t2)*
Filter Wive^l.ongtlt Oct. 9 Oct. 1,0 Oct 10
Number (r) 25."7 diaph. 25."7 diaph. 1h"5 dialNII
.1 3300 405.2 60b.9 403.9
3 5120 529. ' 75b.7 60-1.1
4 4315 543.4 802.1 59'2. (I
7 44o5 45b.7 684.6 436.5
9 4510 471.8 665.7 504.6
10 4660 512.2 723.7 509.9
*Ap(.N) - crass section time ,; geometric. albedo
Table X1. Absolute Lmission Band Strengths-IIWm 2)
Filter Emission Oct. 9 Oct. 10 Oct. 10
Number Feature 25':7 diaph. 25 "7 diaph. 161.15 diaph.
2 Oil (0-0 F. 1-1) 3.20 x 10 15 4.04 x 10⁻¹⁵ 1.32 x 1.0-16
5C^'bluex
(0-0) 8.34 x 10⁻¹⁶
1.39 x 10⁻¹⁵
8.02 x 10⁻¹⁶
6 C3 group 6.87 x 10_16
1.93 x 10⁻¹⁵
4.34 x 10⁻¹'
8 Nil (0-0) 4.59 x 10⁻¹⁵ 6.95 x 10- 15 4.60 x 10⁻¹⁵
4-12
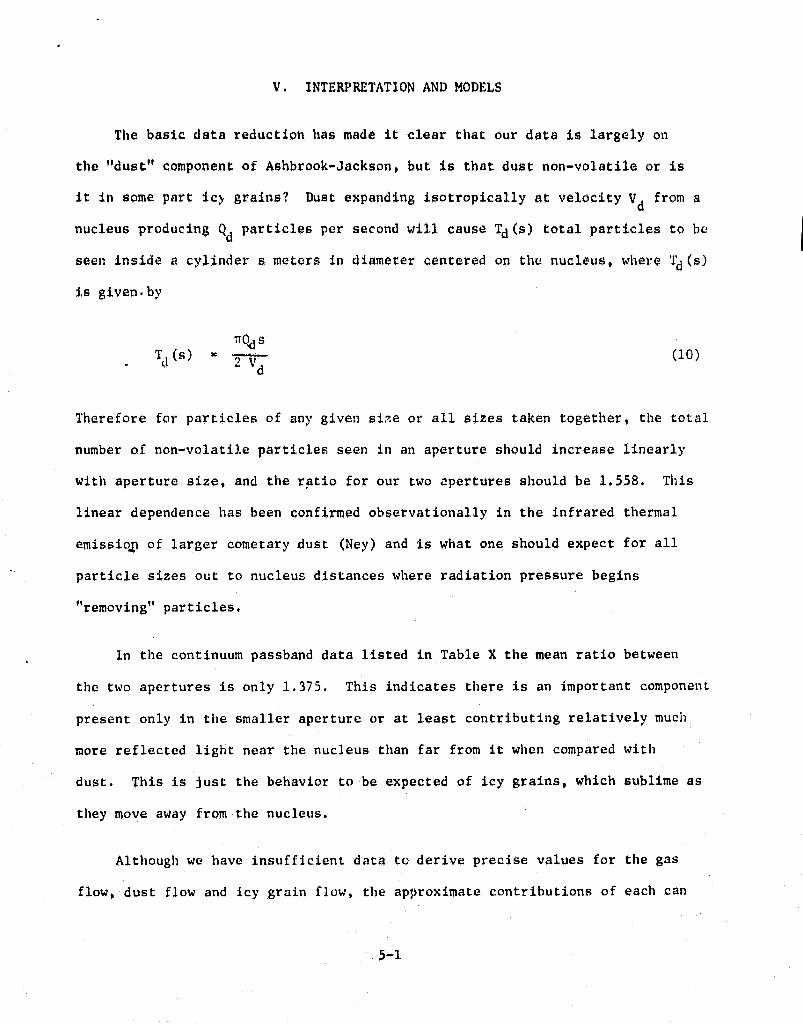
V. INTERPRETATION AND MODELS
The basic data reduction has made it clear that our data is largely on
the "dust" component of Ashbrook-Jackson, but is that dust non-volatile or is
it in some part icy grains? Dust expanding isotropically at velocity V from a
nucleus producing Q particles per second will cause Td (s) total particles to be
seen inside a cylinder s meters in diameter centered on the nucleus, where Td(s)
is given, by
1TQd STd (s) g 1,
d
Therefore for particles of any given size or all sizes taken together, the total
number of non-volatile particles seen in an aperture should increase linearly
with aperture size, and the ratio for our two apertures should be 1.558. This
linear dependence has been confirmed observationally in the infrared thermal
emission of larger cometary dust (Ney) and is what one should expect for all
particle sizes out to nucleus distances where radiation pressure begins
"removing" particles.
In the continuum passband data listed in Table X the mean ratio between
the two apertures is only 1.375. This indicates there is an important component
present only in the smaller aperture or at least contributing relatively much
more reflected light near the nucleus than far from it when compared with
dust. This is just the behavior to be expected of icy grains, which sublime as
they move away from the nucleus.
Although we have insufficient data to derive precise values for the gas
flow, dust flow and icy grain flow, the approximate contributions of each can
(10)
5-1
be determined within the framework of a simple model. The contributions of each
must be internally consistent in that the gas cannot lift ninny times its
own mass in dust and grains from the nucleus, and the mass of grains, which
soon become gas, cannot be more than a fraction of the mass of gas.
We first set limits on the gas flow, since the total gas flux d+:termines
the expansion velocities of dust and grains. If we consider the apparent valtiv
of the CN emission data, then the 1.39 x 10 1 ' Wm .. passing through our
1.22 x 10⁻³ sr diaphragm corresponds to 1.01 x 10 29 CN molecules, using the
appropriate Tatum and Gillespie (1977) emission rate factor. Using the Haser
theory formalism (e.g. Newburn & Johnson, 1973) and Delsemme's (1976) scaly
lengths for CN, this implies a CN production rate of 5.7 x 10 24 molecules s-l.
If the CN abundance is normal, the total gas production should be about
6 x 1026 molecules s-l . Part of this production may originate from the icy
grains rather than directly on the nucleus, but it seems likely that there is
a surface flow of at least half of this or 3 x 10²G molecules s-1 . As
an upper limit the icy grains would constitute only a few percent of the gas
flow, and the real observed value of flux would be at its 30 upper limit,
making the gas production 1.8 x 10 27 molecules s-l . This could be stretched
only by assuming an abornmally low CN abundance (i.e. a mixing ratio —10 `).
Such a low abundance might occur because the "normal" chemistry no longer func-
tions in the inner coma at low densities far from the Sun for example.
The fluxes are even less certain than the production rates since the size
of the nucleus is unknown. Assuming a nominal 2.5 km radius nucleus emitting
isotropically in the low flux case and only from the sunward hemisphere in the
high flux case, the gas fluxes are 3.3 x 10 18 m 2 s_1 and 4.6 x 10¹⁹ m-2 s-l.
5-2
The two Droduction rates corresnond to eas flow in mass of 22.2 ka s- I
(half as gas, half as grains) and 66.7 kg s-1 (all as gas), assuming a mean
molecular mass of 22.3 ( H20 plus 20'/' mass 44 amu). All of these figures
aro uncertain, but they Indicate the right orders of magnitude.
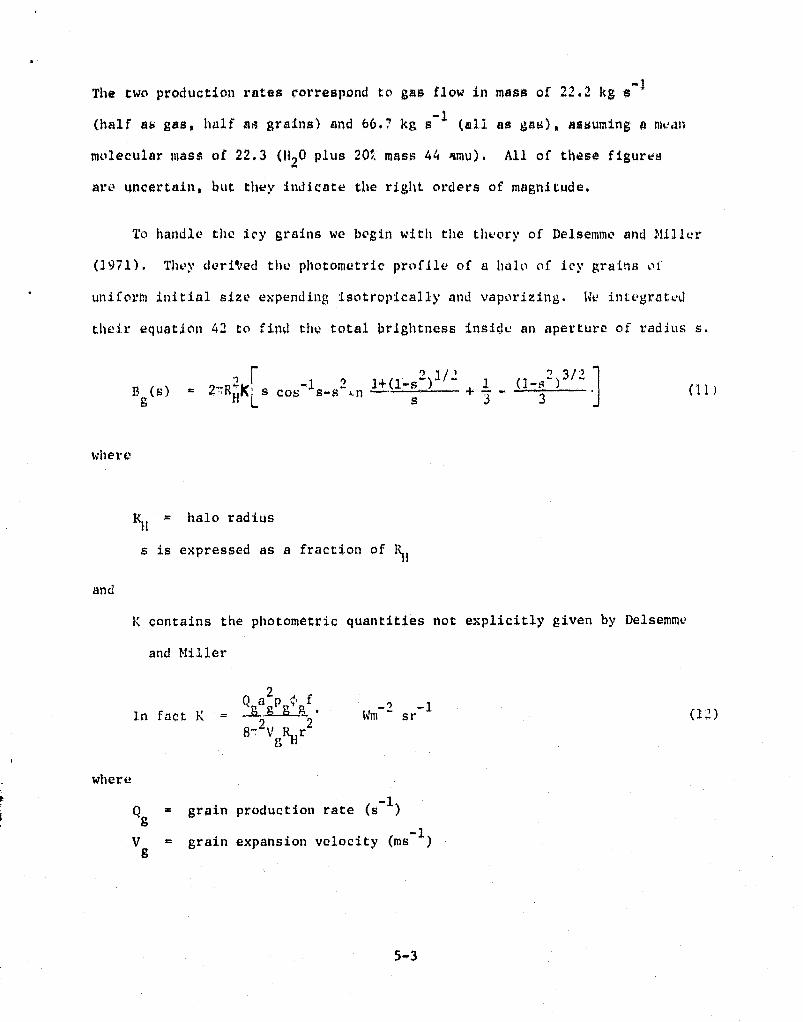
To handle the
icy grains we begin with the theory of Delsemme and Miller
(1)71). Thoy deriWd the , photometric profile of a halo of icy grains of
uniform initial size expending isotropically and vaporizing. We intogratvd
their equation 42 to find the total brightness inside an aperture of radius s.
B W 2'^'RH
K
F s cos'-Is-s
2 j4n 1+(1-S + (1-8 2 )
3/2
9 L s 3
where
N ^ halo radius
s is expressed as a fraction of RH
and
K contains the photometric quantities not explicitly given by Delsemme
and Miller
12P 4' f
In fact K = sr-187
2 V % r 2
where
Qg = grain production rate (s-
V g = grain expansion velocity (ms-
(1l)
(12)
5-3
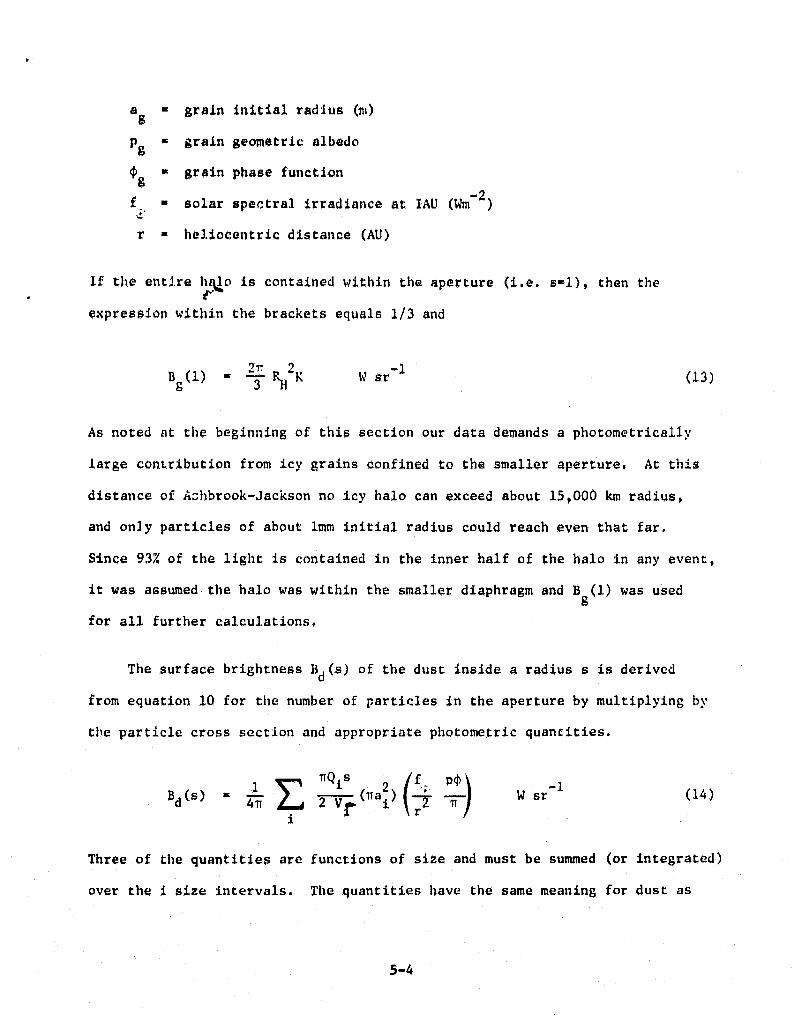
a = grain initial radius (m)
p grain geometric albedo
$s = grain phase function
f solar spectral irradiance at IAU (Wm- 2)
r - heliocentric distance (AU)
If the entl.re h o is contained within the aperture (i.e. s-1), then the
expression within the brackets equals 1/3 and
B9 (1)_ 27T 2
K W sr-1
(13)
As noted at the beginning of this section our data demands a photometrically
large contribution from icy grains confined to the smaller aperture. At this
distance of Achbrook-Jackson no icy halo can exceed about 15,000 km radius,
and only particles of about lmm initial radius could reach even that far.
Since 93% of the light is contained in the inner half of the halo in any event,
it was assumed the halo was within the smaller diaphragm and B g (1) was used
for all further calculations.
The surface brightness Bd (s) of the dust inside a radius s is derived
from equation 10 for the number of particles in the aperture by multiplying by
the particle cross section and appropriate photometric quantities.
TrQ i s f pyBd(s)
z 'AF2 V (Tsai)
IT
W sr-1
(14)
i ^ r )
Three of the quantities are functions of size and must be summed (or integrated)
over the i size intervals. The quantities have the same meaning for dust as
5-4
.
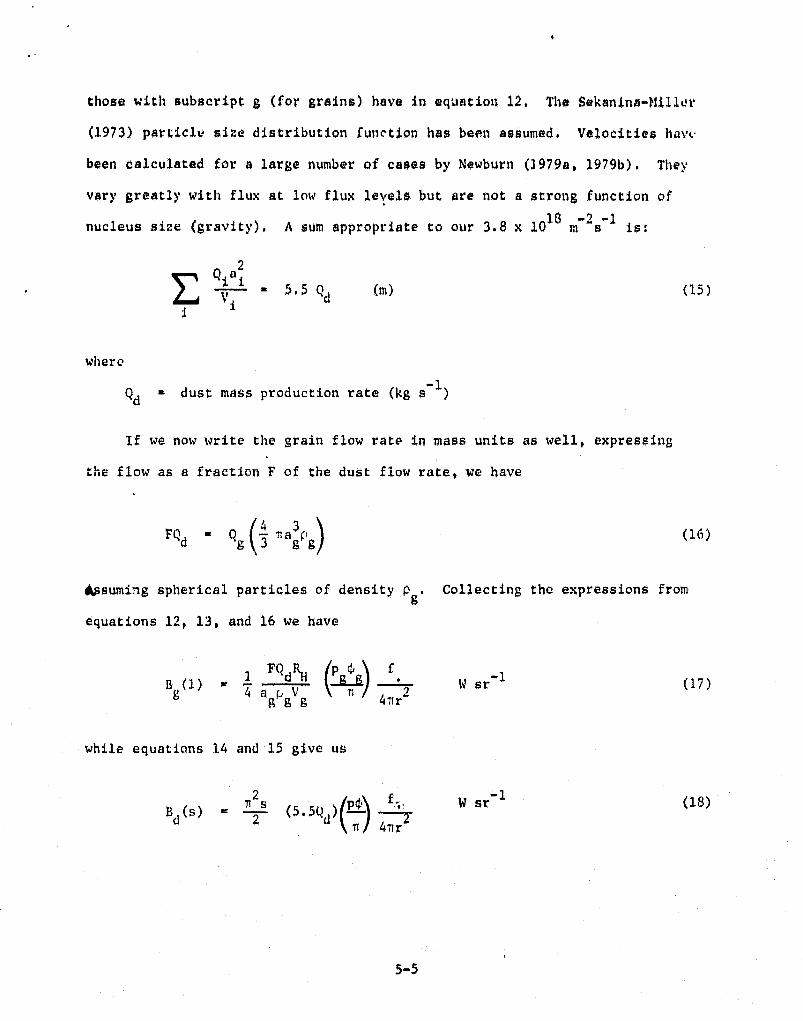
those with subscript g (for grains) have in equation 12. The Sekanins-Millor
(1973) particle size distribution function has been assumed. Velocities have
been calculated for a large number of cases by hewburn (1979x, 1979b). They
vary greatly with flux at low flux levels but are not a strong function of
nucleus size (gravity). A sum appropriate to our 3.8 x 1418 m-2 s-1 is:
E QiaiV°t 5.5 Qd (m) (15)
i i
where
Qd = dust mass production rate (kg s-1)
If we now write the grain flow rate in mass units as well, expressing
the flow as a fraction F of the dust flow rate, we have
iFQd Qg (4
^,I,g(16)
#.ssuming spherical particles of density p g • Collecting the expressions from
equations 12, 13, and 16 we have
Q P ^ fBy(1)F
_ 4 QA ^̂ ^ •
fir' sr-1
(17)b
8 8 & 4^Tr
2
while equations 14 and 15 give us
tt2 s W sr-1
(13)t B (s) = (.5Qd 2 d) r 4._._..
5-5
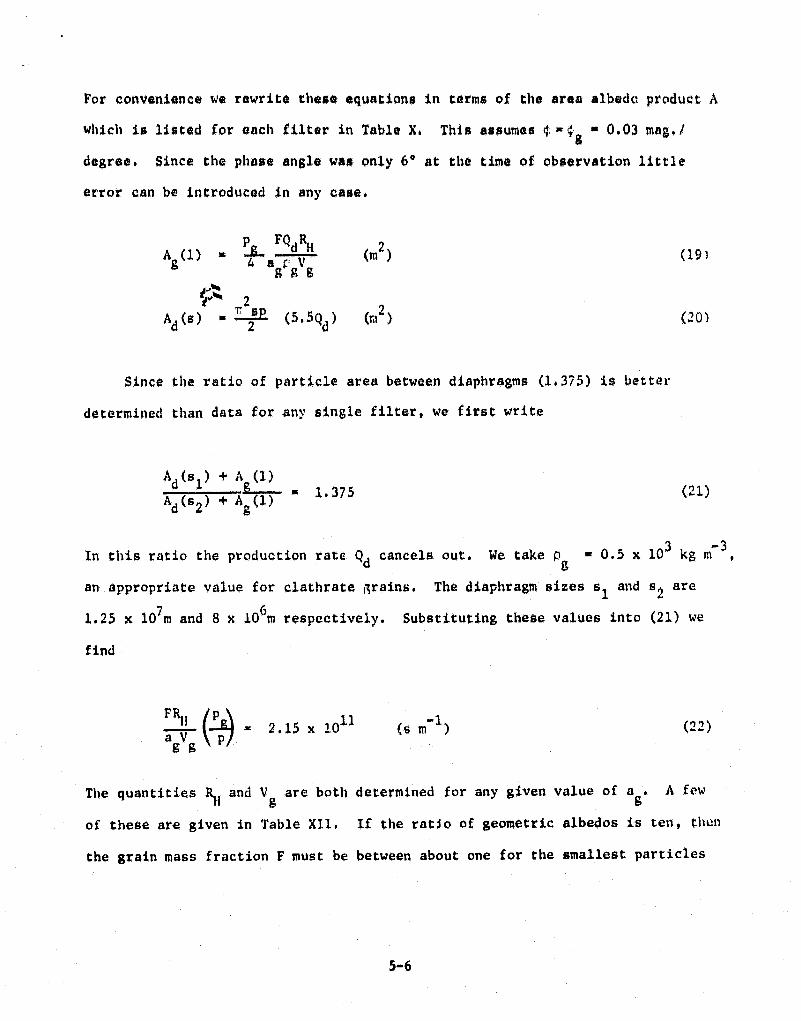
For convenience we rewrite these equations in terms of the area albedc product A
which is listed for each filter in Table X. This assumes ^, -4 g • 0.03 mag.1
degree. Since the phase angle was only 6 0 at the time of observation little
error can be introduced in any case.
Ag(l)8-
(m2) (19)
888
A (s) (5.5Q ) (r>>'') (20)d 2 d
Since the ratio of particle area between diaphragms (1.375) is better
determined than data for any single filter, we first write
Ad ( s l ) + A (1)1.375 (21)
Ad (s2) + Ag(l)
In this ratio the production rate. Q d cancels out. We take p g = 0.5 x 10 3 kg m 3,
an appropriate value for clathrate grains. The diaphragm sixes s and s2 are
1.25 x 10 7m and 8 x 10⁶m respectively. Substituting these values into (21) we
find
F 1p.\
a V \
" 2.15 x 1 011 /,s m-1 ) (22)p8 g
} Tile quantitiesRN and V g are both determined for any given value of a^. A few
of these are given in Table X7,1. If the ratio of geometric albedos is ten, then
the grain mass fraction F must be between about one for the smallest particles
5-6
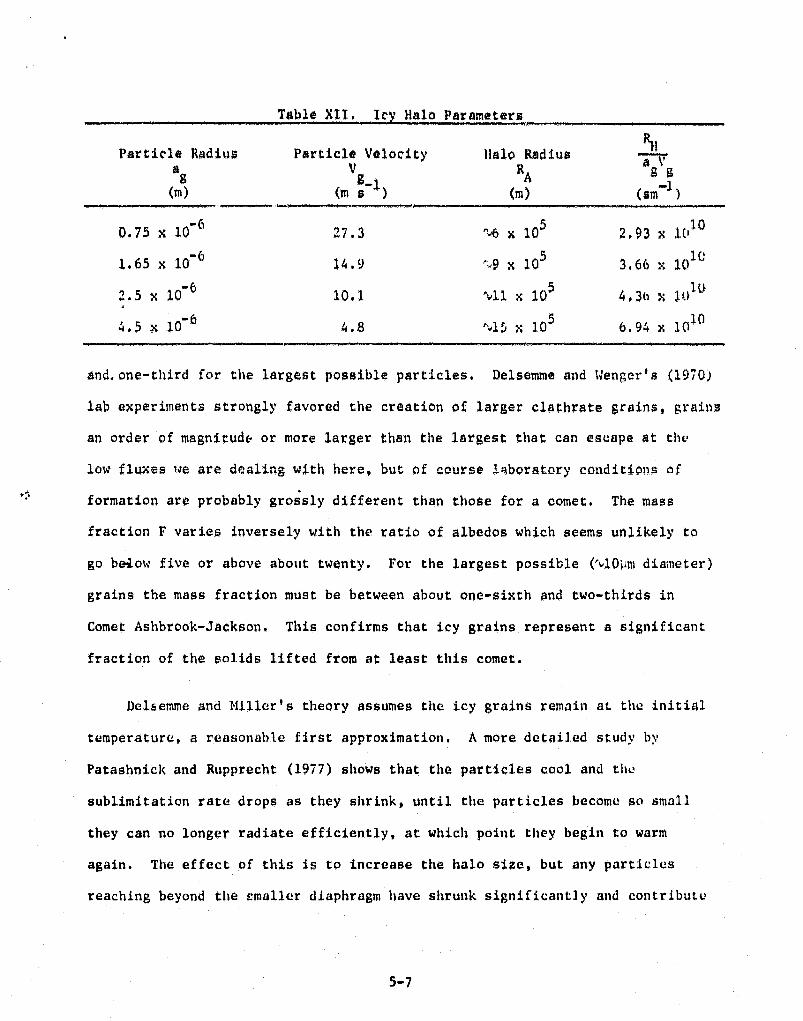
Table M. IcY Halo Parameters
Particle Radius Particle Velocity Halo Radius RHa9 Vg-1 RA a
(m) (m s } (m) (sm )
0.75 x 10⁻⁶ 27.3 x 10 5 2.53 x 1('101.65 x 10⁻⁶ 14.9 "4 x 10 5 3.66 x 10 G2.5 x 10-6 10.1 'V11 x 10 5 4, 3b x 10l u+.5 x 10^ 6 4.8 --15 x 10 6.94 x 10¹⁰
and.one-third for the largest possible particles. Delsemme and Wenger's (1970)
lab experiments strongly favored the creation of larger clathrate grains, grains
an order of magnitudes or more larger than the largest that can escape at the
low fluxes we are dialing with here, but of course laboratory conditions of
formation arerobablp y grossly different than those for a comet. The mass
fraction F varies inversely with the ratio of albedos which seems unlikely to
go be4ow five or above about twenty. For the largest possible ('v10 -pm diameter)
grains the mass fraction must be between about one-sixth and two-thirds in
Comet Ashbrook-Jackson. This confirms that icy grains represent a significant
fraction of the solids lifted from at least this comet.
Del6emme and Fuller's theory assumes the icy grains remain at the initial
temperature, a reasonable first approximation. A more detailed study by
Patashnick and Rupprecht (1977) shows that the particles cool and the
sublimitation rate drops as they shrink, until the particles become so small
they can no longer radiate efficiently, at which point they begin to warm
again. The effect of this is to increase the halo size, but any particles
reaching beyond the Smaller diaphragm have shrunk significantly and contribute:
5-7
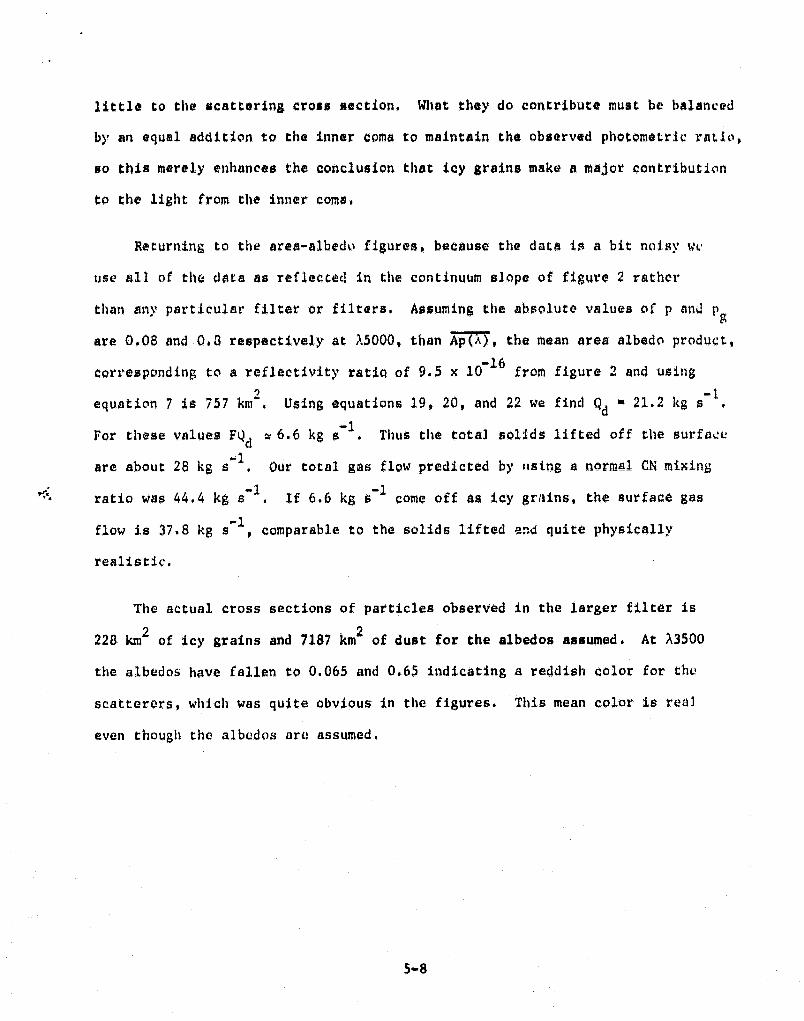
little to the scattering cross section. What they do contribute must be balanced
by an equal addition to the :inner coma to maintain the observed photometric ratio,
so this merely enhances the conclusion that icy grains make a major contribution
to the light from the inner coma,
Returning to the area-albedo figures, because the data is a bit noisywv
use all of the data as reflected in the continuum slope of figure 2 rather
than any particular filter or filters. Assuming the absolute values of p ani P area 0.06 and 0.3 respectively at ,X5000, than Ap(nj, the mean area albedo product,
corresponding to a reflectivity ratio of 9.5 x 10⁻¹⁶
from figure 2 and using
equation 7 is 757 km2 . Using equations 19, 20, and 22 we find Q r 21.2 kg s^l,
For these values RQd
x 6.6 kg s-1 . Thus the total solids :lifted off the surface
are about 28 kg s-1. Our total gas flow predicted by rising a normal CR mixing;
ratio was 44.4 kg s -1 . if 6.6 kg s-1 come off as icy grains, the surface gas
flow is 37.8 kg s 1 , comparable to the solids lifted and quite physically
realistic.
The actual cross sections of particles observed in the larger filter is
228 km2 of icy grains and 7187 km2 of dust for the albedos assumed. At X3500
the albedos have fallen to 0.065 and 0.65 indicating a reddish color for the
scatterers, which was quite obvious in the figures. This mean color is real
even though the albedos are assumed.
5-8
VI. SM MARY AND CONCLUSIONS
P/Ashbrook-Jackson is a comet with a strong reddish continuum which
dominates the surface brightness out to 12,500 km nucleus distance, even in
emission bend filters. Further, within 8000 km of the nucleus roughly two-
thirds of the continuum flux is scattered from icy grains.
An extension of Delsemme and Miller's (1971) theory of icy grains has bean
made to allow quantitative modeling of the continuum observations. Although
iiz,bers had to be assn-ed for icy grain density, icy grain and dust geometric
albedos, and the CN mixing ratio, completely normal values of 0.5 x 10 3 kg m- .
0.8 and 0.08 at X5000, and 10 - 2 respectively resulted in a completely self
consistent model with a volatile flaw of 44-1/2 kg s -1 1 6-1/2 kg s-1 of that
as icy grains, and a non-volatile flow of 21 kg s -1 . The icy grains had a
diameter of 10 pm or less, the limit set by the low surface gas flue;.
Absolute values are presented for the strengths of four emission bands, but
with the exception of CN these are not discussed in detail because of the largo
statistical errors in the weak signals. The apparent zero signal in three other
bands is quite consistent with normal cometary abundances. The continuum data
is well determined, however, especially in the aggregate of all 10 filters,
and the quantitative conclusions on the continuum color and cross-section and
the necessity for icy grains are quite firm.
5-9
r
ACKNOWLEDGEMENTS
We would like to acknowledge the help of D. Yeomans who furnished our
ephemerides and L. Douglas who ran the filter transmission curves in the
laboratory. M. O'H(,rn sent us his absolute photometry of 53 Psi, in advance of
publication. K. Jewel calculated most of our filter factors. M. Ronstadt
stayed with us during the observing run to cure those ills to which modern
electronics are occasionally subject. Our sincere thanks to your all.
One of Res (RLN) wishes to acknowledge that these results represent one
phase of research carried out at the Jet Propulsion Laboratory, California
Institute of Technology, under Contract NAS7-100, sponsored by the Planetary
Program Office, Office of Space Science, National Aeronautics and Space
Administration.
BIBLIOGRAPHY
Aikman, G.C.L., Balfour, W.J., and Tatum, J.B. (1974). The cyanogen bands
of Comet Ben pett 197011. Icarus 21, 303-316.
Chapman, C.R., And Gaffey, M.J. (1979). Reflectance spectra for 277 asteroids.
pp 655-687 in Asteroids, T. Gehrels, ed. Univ. of Arizona Press, Tucson.
Delsomme, A.H. (1970). The neutral coma of comets: A review. in The Studv
of Comets, pp 711-733. NASA SP-393.
Delso m e , A.H., and Miller, U.C. (1971). Physico-chemical phenomena in comets-111.
Tile Continuum of Comet Burnham (196011). Planet. Space Sci. 19, 1239-1257.
Uelsemme, A.H., and Wenger, A. (1970). Physico-chemical phenomena in comets-l.
Experimental stud y of snows in a cometary environment. Planet. Space Sci,
13, 709-715.
Finson, M.L. and Probstein, R.F. (1968). A theory of dust comets. 11. Results
for Comet Arend-Roland. Astrophys. J. 154, 353-380.
Gebel, W.L. (1970). Spectrophotometry of Comets 1967n, 1968b, and 1968c.
Astrophys. J. 161, 765-777.
Hayes, D.S. and Latham, U.W. (1975). A rediscussion of the atmospheric extinction
and the absolute spectral-energy distribution of Vega. Astrophys. J. 197,
593-601.
Kurucz, R.L. (1979). Model atmospheres for G,F,A,B, and 0 stars. Astrophys.
J. Supp. 40 1-340.
•
Labs, D. and NevkO, 11 (1908). Th e radiation of the solar photosphere from 20(W
to 100;.. 7eit f. Astrophvs. 0 1) 1-7.1.
fIarsdon, B.G. (19 717). Periodic Cornet Ashbrook-inokson (1 077g). X.A.U. Ciro.
No, 3070.
'41arsdcan, B.G. (19-09). CaLaloguo of comet.ary orbits, third edition.
1%%Smi,thsonlan Astr4phys. Obs. , Camhridgv.
McCord, T.B. (19oS). A double beam astronomical. phoLomater. App. Op" . 7,w ^
,Nowburn, R.1.. Jr. (1979a). Models of P/Tempel. 2. JPL Publication 79-00.
Ja Propulsion Lab. , Pasadonza.
Newburn, It.L. Jr. (1979b). Physical models of Comet Halley based upon
qualitatiVO data from the 1910 apparition. The Comet Halley Microancteoroid
Hazard pp 35-50, ESA, Paris.
Nowburn, R.L. Jr., and Johnson, T-V. (1973). Postperilaelion interference filter
photometr y of the "annual" comet P/Encke. Icarus X35, , 360-363.
Sokanina, Z., and Miller, F.D. (1973) . Comet Bennett 197011. Science 179.
565-5 67 .
Swings, P., aiid Haser, L. (1956). Atlas of Representati ve Cometary Spectra.
Liege, Belgium.
Tatum, J.B., and Gil.aesp v, M.I. (1.977). The cyanogen abundance of comets.
Astrophys. .1. 218, 569-572.