Embed Size (px)
Citation preview
HAL Id: hal-03348149https://hal.archives-ouvertes.fr/hal-03348149
Submitted on 17 Sep 2021
HAL is a multi-disciplinary open accessarchive for the deposit and dissemination of sci-entific research documents, whether they are pub-lished or not. The documents may come fromteaching and research institutions in France orabroad, or from public or private research centers.
L’archive ouverte pluridisciplinaire HAL, estdestinée au dépôt et à la diffusion de documentsscientifiques de niveau recherche, publiés ou non,émanant des établissements d’enseignement et derecherche français ou étrangers, des laboratoirespublics ou privés.
Gender in 30 Years of IEEE VisualizationNatkamon Tovanich, Pierre Dragicevic, Petra Isenberg
To cite this version:Natkamon Tovanich, Pierre Dragicevic, Petra Isenberg. Gender in 30 Years of IEEE Visualization.IEEE Transactions on Visualization and Computer Graphics, Institute of Electrical and ElectronicsEngineers, 2022, �10.1109/TVCG.2021.3114787�. �hal-03348149�
Gender in 30 Years of IEEE VisualizationNatkamon Tovanich, Pierre Dragicevic, and Petra Isenberg
Abstract— We present an exploratory analysis of gender representation among the authors, committee members, and award winnersat the IEEE Visualization (VIS) conference over the last 30 years. Our goal is to provide descriptive data on which diversity discussionsand efforts in the community can build. We look in particular at the gender of VIS authors as a proxy for the community at large. Weconsider measures of overall gender representation among authors, differences in careers, positions in author lists, and collaborations.We found that the proportion of female authors has increased from 9% in the first five years to 22% in the last five years of theconference. Over the years, we found the same representation of women in program committees and slightly more women in organizingcommittees. Women are less likely to appear in the last author position, but more in the middle positions. In terms of collaborationpatterns, female authors tend to collaborate more than expected with other women in the community. All non-gender related data isavailable on https://osf.io/ydfj4/ and the gender-author matching can be accessed through https://nyu.databrary.org/volume/1301.
Index Terms—visualization, gender, diversity, publication, scientometry, collaboration.
1 INTRODUCTION
We present a descriptive, exploratory data analysis of gender represen-tation in the academic visualization community. We draw data fromauthors of papers published at the IEEE Visualization (VIS) conference,the largest and oldest academic visualization-focused venue. At theVIS conference, gender as well as more broad diversity efforts havestarted to emerge. Since 2014, we have seen efforts such as the firstFamily Room (2014), VisKids Chairs (2015), and in 2017 the first panelon the topic of diversity more broadly. Since 2018, inclusivity chairsare part of the organizing committee and have put tremendous effortsinto new initiatives such as the inclusivity and diversity scholarships.The new VIS charter [20] emphasizes that “all committees should be di-verse in their membership in terms of research area, academic lineage,gender, geographic origin, sector (academia, industry, government),demographics and other characteristics as they emerge.”
In March 2019, Metoyer and Gaither edited a book on diversity invisualization [36]. In this book, the two editors call for additional dataanalysis regarding the diversity of the community: “To truly understandand measure the diversity of a community, we must begin to collect thisdata [6]. It is difficult to understand where to go if we are uncertainabout where we are.” We follow this call and provide data focusedon the gender representation in the IEEE VIS community. Some ofour data has been published as part of one chapter in the diversity invisualization book [36], where we showed that the number of authors atVIS has increased steadily since 1990 but the number of female authorsgrew less quickly than the number of male authors.
Our present article includes updated and more extensive data and amuch deeper analysis of additional metrics. It describes the history andcurrent state of the conference in regards to male and female genderrepresentation. What the paper does not attempt is to suggest possi-ble causes, consequences or solutions regarding gender representationissues. Instead, our work is motivated by the need to provide the com-munity with factual foundations from which discussions can take placewithin the wider community. We hope that our data will help organizing,steering, and executive committees to make data-driven assessmentsand further address potential issues related to gender representation.
• Natkamon Tovanich is with IRT SystemX, Paris-Saclay, 91120, Palaiseau,France and also with Universite Paris-Saclay, CNRS, Inria, LISN, 91405,Orsay, France. E-mail: [email protected].
• Pierre Dragicevic is with Universite Paris-Saclay, CNRS, Inria, LISN,91405, Orsay, France. E-mail: [email protected].
• Petra Isenberg is with Universite Paris-Saclay, CNRS, Inria, LISN, 91405,Orsay, France. E-mail: [email protected].
©2021 IEEE. This is the author’s version of the article that will be published inIEEE Transactions on Visualization and Computer Graphics. The final versionof this article is available at: xx.xxxx/TVCG.2021.xxxxxxx/
Our analysis is based on full paper publication data from VISfor the years 1990–2020 and, similar to other bibliometric analy-ses [11, 22, 26, 29, 43], on a first name to gender matching. We engagedin a systematic in-depth manual cleaning of the data to improve, inparticular, accuracy for the early years of VIS where many authorspublished with only abbreviated first names and for Asian names forwhich automatic matching has shown to be much less reliable [37].Importantly, like all work based on first-name to gender matches (seeSect. 8), we are not able to capture the non-binary and fluid natureof gender and acknowledge this shortcoming. Our gender to nameassociations should, therefore, be considered as inferred rather thantrue representations of authors’ self-identified genders.
Based on our analyses of gender differences in related fields (seeSect. 8), we extracted various metrics to trace gender representationand publications at the IEEE VIS conference. While exploratory, ouranalysis was guided by two broader research directions:• How is male/female gender represented among VIS authors, commit-
tees, and award winners and how has their representation changedover time? Data about current and historic gender representation,dropouts, and career ages of community members allows to identifypossible gender gaps and their trends in the community and can helpto steer discussions on how to address them.
• What are gender related collaboration and publication patterns inthe VIS community and how have they evolved? How a communitycollaborates and networks could potentially influence how healthy,innovative, and impactful it is [11]. How credit is shared amongauthors and analyzing co-authorship relationships in the VIS com-munity may provide an overview of how members of the communitywork with each other.In summary, our work contributes an in-depth analysis of gender-
related patterns in the VIS community and a cleaned dataset of com-mittee members, awardees, and authors, as well as a name-gendermatching dataset.
2 DATA AND METHODS
In this section, we describe the data we collected, cleaned, andhow we analyzed it. All our data is available for follow-up re-search. We consider the name-gender matching to be sensitive per-sonal information and chose to make it available through Databrary(https://nyu.databrary.org/volume/1301) that offers a framework forsharing research data of sensitive nature and requires authorization foraccess. All other data is available via https://osf.io/ydfj4/.
2.1 Publications Dataset
We obtained a list of IEEE Visualization (VIS) publications from vis-pubdata.org [21], a public dataset that contains cleaned-up meta-datafor all years of the conference (1990–2020). The dataset contains
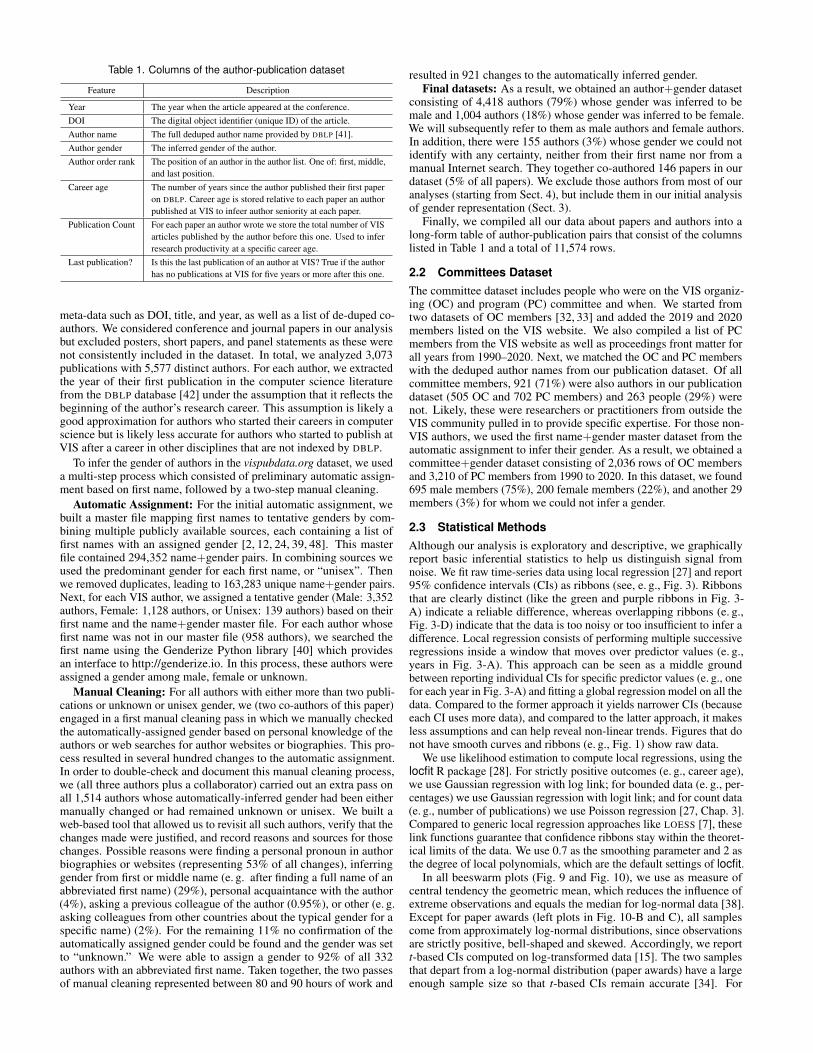
Table 1. Columns of the author-publication dataset
Feature Description
Year The year when the article appeared at the conference.DOI The digital object identifier (unique ID) of the article.Author name The full deduped author name provided by DBLP [41].Author gender The inferred gender of the author.Author order rank The position of an author in the author list. One of: first, middle,
and last position.Career age The number of years since the author published their first paper
on DBLP. Career age is stored relative to each paper an authorpublished at VIS to infeer author seniority at each paper.
Publication Count For each paper an author wrote we store the total number of VISarticles published by the author before this one. Used to inferresearch productivity at a specific career age.
Last publication? Is this the last publication of an author at VIS? True if the authorhas no publications at VIS for five years or more after this one.
meta-data such as DOI, title, and year, as well as a list of de-duped co-authors. We considered conference and journal papers in our analysisbut excluded posters, short papers, and panel statements as these werenot consistently included in the dataset. In total, we analyzed 3,073publications with 5,577 distinct authors. For each author, we extractedthe year of their first publication in the computer science literaturefrom the DBLP database [42] under the assumption that it reflects thebeginning of the author’s research career. This assumption is likely agood approximation for authors who started their careers in computerscience but is likely less accurate for authors who started to publish atVIS after a career in other disciplines that are not indexed by DBLP.
To infer the gender of authors in the vispubdata.org dataset, we useda multi-step process which consisted of preliminary automatic assign-ment based on first name, followed by a two-step manual cleaning.
Automatic Assignment: For the initial automatic assignment, webuilt a master file mapping first names to tentative genders by com-bining multiple publicly available sources, each containing a list offirst names with an assigned gender [2, 12, 24, 39, 48]. This masterfile contained 294,352 name+gender pairs. In combining sources weused the predominant gender for each first name, or “unisex”. Thenwe removed duplicates, leading to 163,283 unique name+gender pairs.Next, for each VIS author, we assigned a tentative gender (Male: 3,352authors, Female: 1,128 authors, or Unisex: 139 authors) based on theirfirst name and the name+gender master file. For each author whosefirst name was not in our master file (958 authors), we searched thefirst name using the Genderize Python library [40] which providesan interface to http://genderize.io. In this process, these authors wereassigned a gender among male, female or unknown.
Manual Cleaning: For all authors with either more than two publi-cations or unknown or unisex gender, we (two co-authors of this paper)engaged in a first manual cleaning pass in which we manually checkedthe automatically-assigned gender based on personal knowledge of theauthors or web searches for author websites or biographies. This pro-cess resulted in several hundred changes to the automatic assignment.In order to double-check and document this manual cleaning process,we (all three authors plus a collaborator) carried out an extra pass onall 1,514 authors whose automatically-inferred gender had been eithermanually changed or had remained unknown or unisex. We built aweb-based tool that allowed us to revisit all such authors, verify that thechanges made were justified, and record reasons and sources for thosechanges. Possible reasons were finding a personal pronoun in authorbiographies or websites (representing 53% of all changes), inferringgender from first or middle name (e. g. after finding a full name of anabbreviated first name) (29%), personal acquaintance with the author(4%), asking a previous colleague of the author (0.95%), or other (e. g.asking colleagues from other countries about the typical gender for aspecific name) (2%). For the remaining 11% no confirmation of theautomatically assigned gender could be found and the gender was setto “unknown.” We were able to assign a gender to 92% of all 332authors with an abbreviated first name. Taken together, the two passesof manual cleaning represented between 80 and 90 hours of work and
resulted in 921 changes to the automatically inferred gender.Final datasets: As a result, we obtained an author+gender dataset
consisting of 4,418 authors (79%) whose gender was inferred to bemale and 1,004 authors (18%) whose gender was inferred to be female.We will subsequently refer to them as male authors and female authors.In addition, there were 155 authors (3%) whose gender we could notidentify with any certainty, neither from their first name nor from amanual Internet search. They together co-authored 146 papers in ourdataset (5% of all papers). We exclude those authors from most of ouranalyses (starting from Sect. 4), but include them in our initial analysisof gender representation (Sect. 3).
Finally, we compiled all our data about papers and authors into along-form table of author-publication pairs that consist of the columnslisted in Table 1 and a total of 11,574 rows.
2.2 Committees DatasetThe committee dataset includes people who were on the VIS organiz-ing (OC) and program (PC) committee and when. We started fromtwo datasets of OC members [32, 33] and added the 2019 and 2020members listed on the VIS website. We also compiled a list of PCmembers from the VIS website as well as proceedings front matter forall years from 1990–2020. Next, we matched the OC and PC memberswith the deduped author names from our publication dataset. Of allcommittee members, 921 (71%) were also authors in our publicationdataset (505 OC and 702 PC members) and 263 people (29%) werenot. Likely, these were researchers or practitioners from outside theVIS community pulled in to provide specific expertise. For those non-VIS authors, we used the first name+gender master dataset from theautomatic assignment to infer their gender. As a result, we obtained acommittee+gender dataset consisting of 2,036 rows of OC membersand 3,210 of PC members from 1990 to 2020. In this dataset, we found695 male members (75%), 200 female members (22%), and another 29members (3%) for whom we could not infer a gender.
2.3 Statistical MethodsAlthough our analysis is exploratory and descriptive, we graphicallyreport basic inferential statistics to help us distinguish signal fromnoise. We fit raw time-series data using local regression [27] and report95% confidence intervals (CIs) as ribbons (see, e. g., Fig. 3). Ribbonsthat are clearly distinct (like the green and purple ribbons in Fig. 3-A) indicate a reliable difference, whereas overlapping ribbons (e. g.,Fig. 3-D) indicate that the data is too noisy or too insufficient to infer adifference. Local regression consists of performing multiple successiveregressions inside a window that moves over predictor values (e. g.,years in Fig. 3-A). This approach can be seen as a middle groundbetween reporting individual CIs for specific predictor values (e. g., onefor each year in Fig. 3-A) and fitting a global regression model on all thedata. Compared to the former approach it yields narrower CIs (becauseeach CI uses more data), and compared to the latter approach, it makesless assumptions and can help reveal non-linear trends. Figures that donot have smooth curves and ribbons (e. g., Fig. 1) show raw data.
We use likelihood estimation to compute local regressions, using thelocfit R package [28]. For strictly positive outcomes (e. g., career age),we use Gaussian regression with log link; for bounded data (e. g., per-centages) we use Gaussian regression with logit link; and for count data(e. g., number of publications) we use Poisson regression [27, Chap. 3].Compared to generic local regression approaches like LOESS [7], theselink functions guarantee that confidence ribbons stay within the theoret-ical limits of the data. We use 0.7 as the smoothing parameter and 2 asthe degree of local polynomials, which are the default settings of locfit.
In all beeswarm plots (Fig. 9 and Fig. 10), we use as measure ofcentral tendency the geometric mean, which reduces the influence ofextreme observations and equals the median for log-normal data [38].Except for paper awards (left plots in Fig. 10-B and C), all samplescome from approximately log-normal distributions, since observationsare strictly positive, bell-shaped and skewed. Accordingly, we reportt-based CIs computed on log-transformed data [15]. The two samplesthat depart from a log-normal distribution (paper awards) have a largeenough sample size so that t-based CIs remain accurate [34]. For
0
100
200
300
400
500
1990 1995 2000 2005 2010 2015 2020Year
(A) # Authors in IEEE VIS
0%
25%
50%
75%
100%
1990 1995 2000 2005 2010 2015 2020Year
(B) % Authors in IEEE VIS
0
100
200
300
1990 1995 2000 2005 2010 2015 2020Year
(C) # Authors by conference
0%
10%
20%
30%
1990 1995 2000 2005 2010 2015 2020Year
(D) % Female by conference
Female Male Unknown All authors New authors InfoVis SciVis VAST Vis
Fig. 1. Number of paper authors per year: (A) Total number of authors per year and gender. (B) Percentage of authors per year and gender. (C)Number of authors per year, for each child conference across all genders. (D) Percentage of female authors per year, for each child conference.
proportions (Fig. 10-a), we report Wilson’s CIs for a single proportion[47]. For guidance on how to visually interpret overlap in CIs, see [25].
3 GENDER REPRESENTATION IN VIS
We begin our exploration of the data with an analysis of the overallgender representation in paper authorship over time. Fig. 1-A shows thenumber of VIS authors from 1990 to 2020. The green and purple linesshow the number of male and female authors, respectively. Solid linesshow the total number of authors, while dashed lines show new authorswho published their first VIS paper in that particular year. Over the past30 years, the visualization research community has been continuallygrowing, and the number of VIS authors has been increasing every year.This is true for both genders: the number of female authors increasedfrom 9 in the first year to 140 in 2020, while male authors increasedfrom 104 to 462. The number of new authors also increased but at aslower pace. During the past five years (2016–2020), there were, onaverage, 61 new female authors and 175 new male authors per year.
Fig. 1-B shows the percentage of male and female authors per year.The percentage of female authors rose from 9% in the first five yearsto 22% (+13%) in the last five. Accordingly, the percentage of maleauthors decreased from 86% to 75% (-11%). Hence, there has been asubstantial decrease in the gender gap, but the gap is still remarkablylarge. The trend is the same for new authors (the dashed lines).
Next, we looked at the trends for each child conference making upIEEE Visualization, namely: Vis, VAST, InfoVis, and SciVis [36]. Theevolution of number of authors for each child conference is reportedin Fig. 1-C across all genders. The Vis conference (in yellow) existedfrom 1990 to 2011 and has been predominantly continued by SciVis (inblue) afterward. InfoVis (in red) started in 1995 and has seen a constantincrease in the number of authors over the years. The VAST conference(in green) began in 2006 and has the most significant number of authorsin the last five years. The percentages of female authors are shownin Fig. 1-D. Percentages have fluctuated over the years due to therelatively small number of female authors in each conference. Vis andSciVis have a smaller female representation than the other conferences,although there has been a slight increase from 9% in 1990–1994 to 14%(+5%) in 2016–2020. The Infovis conference has also seen an increasein female participation from 17% in 1995–1999 to 27% (+10%) in2016–2020. Over the 15 years of the VAST conference, we observedthat female authors have fluctuated around 22% per year (2006–2020).
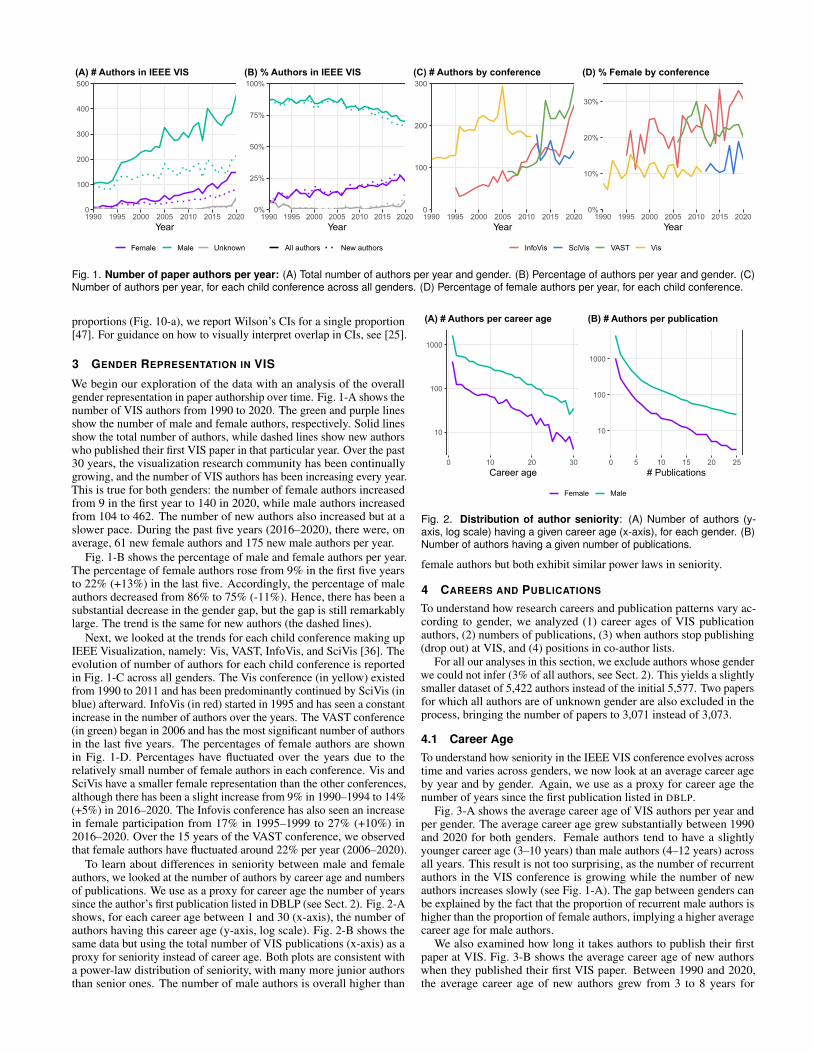
To learn about differences in seniority between male and femaleauthors, we looked at the number of authors by career age and numbersof publications. We use as a proxy for career age the number of yearssince the author’s first publication listed in DBLP (see Sect. 2). Fig. 2-Ashows, for each career age between 1 and 30 (x-axis), the number ofauthors having this career age (y-axis, log scale). Fig. 2-B shows thesame data but using the total number of VIS publications (x-axis) as aproxy for seniority instead of career age. Both plots are consistent witha power-law distribution of seniority, with many more junior authorsthan senior ones. The number of male authors is overall higher than
10
100
1000
0 10 20 30Career age
(A) # Authors per career age
10
100
1000
0 5 10 15 20 25# Publications
(B) # Authors per publication
Female Male
Fig. 2. Distribution of author seniority: (A) Number of authors (y-axis, log scale) having a given career age (x-axis), for each gender. (B)Number of authors having a given number of publications.
female authors but both exhibit similar power laws in seniority.
4 CAREERS AND PUBLICATIONS
To understand how research careers and publication patterns vary ac-cording to gender, we analyzed (1) career ages of VIS publicationauthors, (2) numbers of publications, (3) when authors stop publishing(drop out) at VIS, and (4) positions in co-author lists.
For all our analyses in this section, we exclude authors whose genderwe could not infer (3% of all authors, see Sect. 2). This yields a slightlysmaller dataset of 5,422 authors instead of the initial 5,577. Two papersfor which all authors are of unknown gender are also excluded in theprocess, bringing the number of papers to 3,071 instead of 3,073.
4.1 Career AgeTo understand how seniority in the IEEE VIS conference evolves acrosstime and varies across genders, we now look at an average career ageby year and by gender. Again, we use as a proxy for career age thenumber of years since the first publication listed in DBLP.
Fig. 3-A shows the average career age of VIS authors per year andper gender. The average career age grew substantially between 1990and 2020 for both genders. Female authors tend to have a slightlyyounger career age (3–10 years) than male authors (4–12 years) acrossall years. This result is not too surprising, as the number of recurrentauthors in the VIS conference is growing while the number of newauthors increases slowly (see Fig. 1-A). The gap between genders canbe explained by the fact that the proportion of recurrent male authors ishigher than the proportion of female authors, implying a higher averagecareer age for male authors.
We also examined how long it takes authors to publish their firstpaper at VIS. Fig. 3-B shows the average career age of new authorswhen they published their first VIS paper. Between 1990 and 2020,the average career age of new authors grew from 3 to 8 years for
0
5
10
15
1990 1995 2000 2005 2010 2015 2020Year
(A) Career age of all authors
0
5
10
15
1990 1995 2000 2005 2010 2015 2020Year
(B) Career age of new authors
0
5
10
15
20
25
0 5 10 15 20 25# Publications
(C) Career age per publication count
0%
5%
10%
15%
20%
25%
0 10 20 30Career age
(D) Dropout rate
Female Male
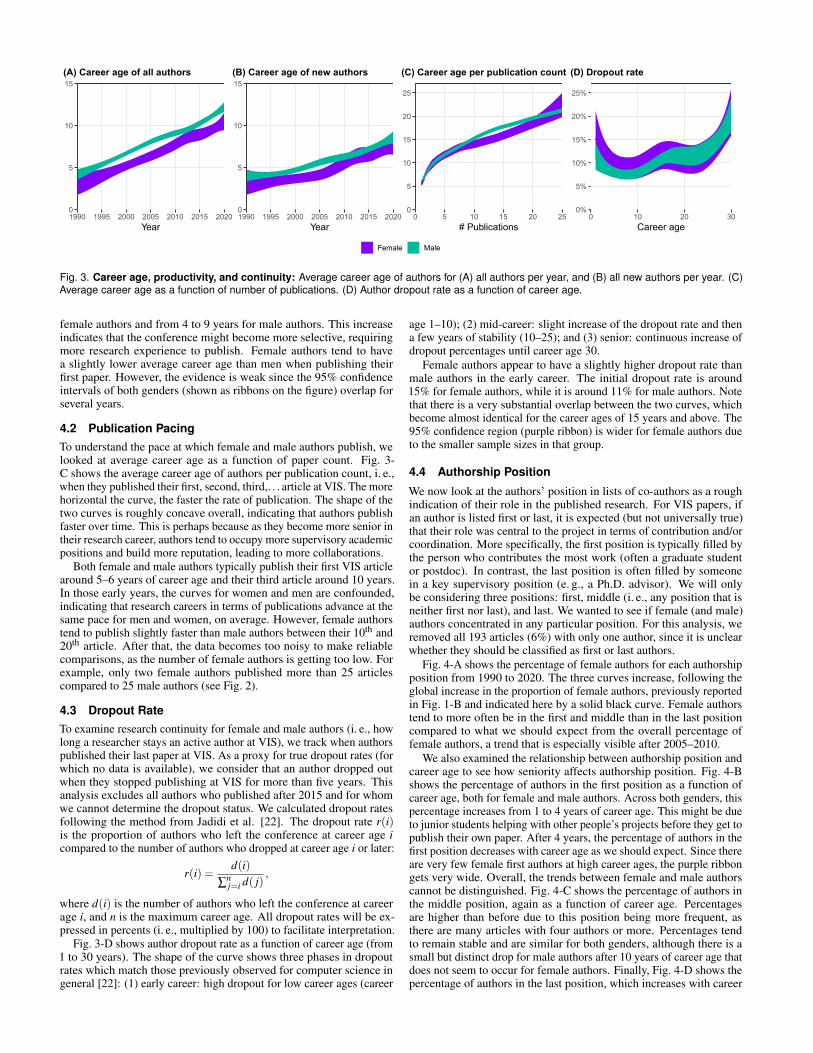
Fig. 3. Career age, productivity, and continuity: Average career age of authors for (A) all authors per year, and (B) all new authors per year. (C)Average career age as a function of number of publications. (D) Author dropout rate as a function of career age.
female authors and from 4 to 9 years for male authors. This increaseindicates that the conference might become more selective, requiringmore research experience to publish. Female authors tend to havea slightly lower average career age than men when publishing theirfirst paper. However, the evidence is weak since the 95% confidenceintervals of both genders (shown as ribbons on the figure) overlap forseveral years.
4.2 Publication PacingTo understand the pace at which female and male authors publish, welooked at average career age as a function of paper count. Fig. 3-C shows the average career age of authors per publication count, i. e.,when they published their first, second, third,. . . article at VIS. The morehorizontal the curve, the faster the rate of publication. The shape of thetwo curves is roughly concave overall, indicating that authors publishfaster over time. This is perhaps because as they become more senior intheir research career, authors tend to occupy more supervisory academicpositions and build more reputation, leading to more collaborations.
Both female and male authors typically publish their first VIS articlearound 5–6 years of career age and their third article around 10 years.In those early years, the curves for women and men are confounded,indicating that research careers in terms of publications advance at thesame pace for men and women, on average. However, female authorstend to publish slightly faster than male authors between their 10th and20th article. After that, the data becomes too noisy to make reliablecomparisons, as the number of female authors is getting too low. Forexample, only two female authors published more than 25 articlescompared to 25 male authors (see Fig. 2).
4.3 Dropout RateTo examine research continuity for female and male authors (i. e., howlong a researcher stays an active author at VIS), we track when authorspublished their last paper at VIS. As a proxy for true dropout rates (forwhich no data is available), we consider that an author dropped outwhen they stopped publishing at VIS for more than five years. Thisanalysis excludes all authors who published after 2015 and for whomwe cannot determine the dropout status. We calculated dropout ratesfollowing the method from Jadidi et al. [22]. The dropout rate r(i)is the proportion of authors who left the conference at career age icompared to the number of authors who dropped at career age i or later:
r(i) =d(i)
∑nj=i d( j)
,
where d(i) is the number of authors who left the conference at careerage i, and n is the maximum career age. All dropout rates will be ex-pressed in percents (i. e., multiplied by 100) to facilitate interpretation.
Fig. 3-D shows author dropout rate as a function of career age (from1 to 30 years). The shape of the curve shows three phases in dropoutrates which match those previously observed for computer science ingeneral [22]: (1) early career: high dropout for low career ages (career
age 1–10); (2) mid-career: slight increase of the dropout rate and thena few years of stability (10–25); and (3) senior: continuous increase ofdropout percentages until career age 30.
Female authors appear to have a slightly higher dropout rate thanmale authors in the early career. The initial dropout rate is around15% for female authors, while it is around 11% for male authors. Notethat there is a very substantial overlap between the two curves, whichbecome almost identical for the career ages of 15 years and above. The95% confidence region (purple ribbon) is wider for female authors dueto the smaller sample sizes in that group.
4.4 Authorship Position
We now look at the authors’ position in lists of co-authors as a roughindication of their role in the published research. For VIS papers, ifan author is listed first or last, it is expected (but not universally true)that their role was central to the project in terms of contribution and/orcoordination. More specifically, the first position is typically filled bythe person who contributes the most work (often a graduate studentor postdoc). In contrast, the last position is often filled by someonein a key supervisory position (e. g., a Ph.D. advisor). We will onlybe considering three positions: first, middle (i. e., any position that isneither first nor last), and last. We wanted to see if female (and male)authors concentrated in any particular position. For this analysis, weremoved all 193 articles (6%) with only one author, since it is unclearwhether they should be classified as first or last authors.
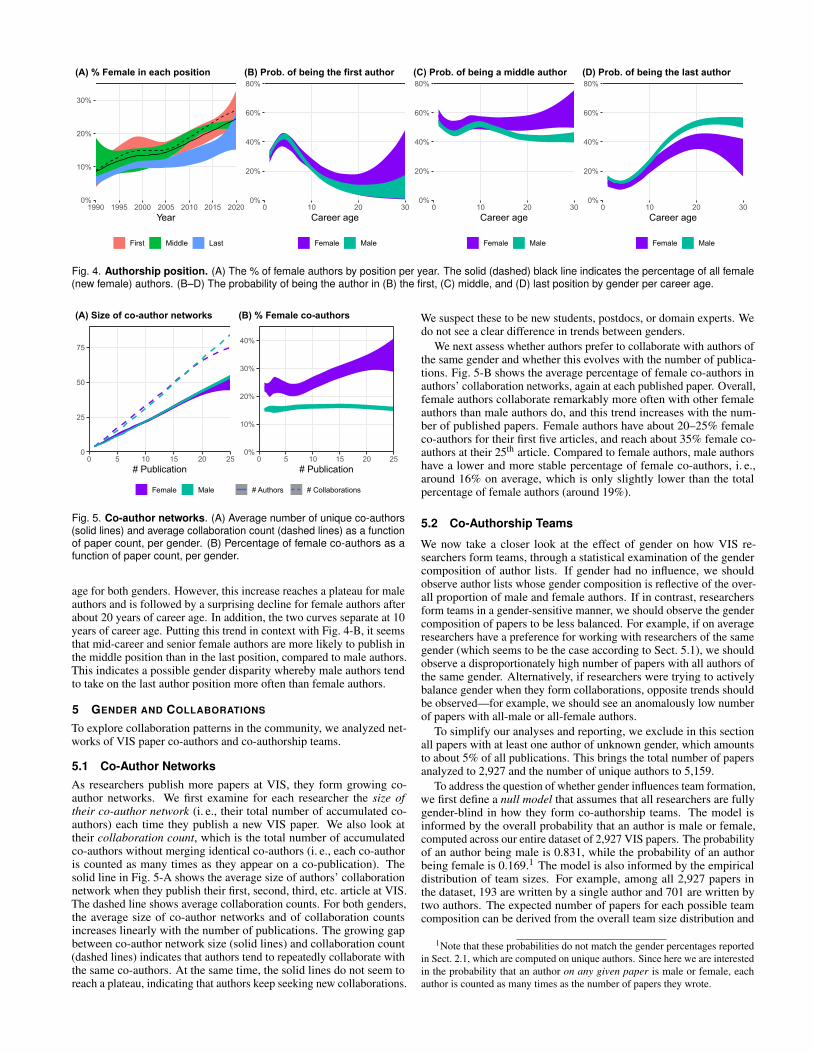
Fig. 4-A shows the percentage of female authors for each authorshipposition from 1990 to 2020. The three curves increase, following theglobal increase in the proportion of female authors, previously reportedin Fig. 1-B and indicated here by a solid black curve. Female authorstend to more often be in the first and middle than in the last positioncompared to what we should expect from the overall percentage offemale authors, a trend that is especially visible after 2005–2010.
We also examined the relationship between authorship position andcareer age to see how seniority affects authorship position. Fig. 4-Bshows the percentage of authors in the first position as a function ofcareer age, both for female and male authors. Across both genders, thispercentage increases from 1 to 4 years of career age. This might be dueto junior students helping with other people’s projects before they get topublish their own paper. After 4 years, the percentage of authors in thefirst position decreases with career age as we should expect. Since thereare very few female first authors at high career ages, the purple ribbongets very wide. Overall, the trends between female and male authorscannot be distinguished. Fig. 4-C shows the percentage of authors inthe middle position, again as a function of career age. Percentagesare higher than before due to this position being more frequent, asthere are many articles with four authors or more. Percentages tendto remain stable and are similar for both genders, although there is asmall but distinct drop for male authors after 10 years of career age thatdoes not seem to occur for female authors. Finally, Fig. 4-D shows thepercentage of authors in the last position, which increases with career
0%
10%
20%
30%
1990 1995 2000 2005 2010 2015 2020Year
First Middle Last
(A) % Female in each position
0%
20%
40%
60%
80%
0 10 20 30Career age
Female Male
(B) Prob. of being the first author
0%
20%
40%
60%
80%
0 10 20 30Career age
Female Male
(C) Prob. of being a middle author
0%
20%
40%
60%
80%
0 10 20 30Career age
Female Male
(D) Prob. of being the last author
Fig. 4. Authorship position. (A) The % of female authors by position per year. The solid (dashed) black line indicates the percentage of all female(new female) authors. (B–D) The probability of being the author in (B) the first, (C) middle, and (D) last position by gender per career age.
0
25
50
75
0 5 10 15 20 25# Publication
(A) Size of co-author networks
0%
10%
20%
30%
40%
0 5 10 15 20 25# Publication
(B) % Female co-authors
Female Male # Authors # Collaborations
Fig. 5. Co-author networks. (A) Average number of unique co-authors(solid lines) and average collaboration count (dashed lines) as a functionof paper count, per gender. (B) Percentage of female co-authors as afunction of paper count, per gender.
age for both genders. However, this increase reaches a plateau for maleauthors and is followed by a surprising decline for female authors afterabout 20 years of career age. In addition, the two curves separate at 10years of career age. Putting this trend in context with Fig. 4-B, it seemsthat mid-career and senior female authors are more likely to publish inthe middle position than in the last position, compared to male authors.This indicates a possible gender disparity whereby male authors tendto take on the last author position more often than female authors.
5 GENDER AND COLLABORATIONS
To explore collaboration patterns in the community, we analyzed net-works of VIS paper co-authors and co-authorship teams.
5.1 Co-Author NetworksAs researchers publish more papers at VIS, they form growing co-author networks. We first examine for each researcher the size oftheir co-author network (i. e., their total number of accumulated co-authors) each time they publish a new VIS paper. We also look attheir collaboration count, which is the total number of accumulatedco-authors without merging identical co-authors (i. e., each co-authoris counted as many times as they appear on a co-publication). Thesolid line in Fig. 5-A shows the average size of authors’ collaborationnetwork when they publish their first, second, third, etc. article at VIS.The dashed line shows average collaboration counts. For both genders,the average size of co-author networks and of collaboration countsincreases linearly with the number of publications. The growing gapbetween co-author network size (solid lines) and collaboration count(dashed lines) indicates that authors tend to repeatedly collaborate withthe same co-authors. At the same time, the solid lines do not seem toreach a plateau, indicating that authors keep seeking new collaborations.
We suspect these to be new students, postdocs, or domain experts. Wedo not see a clear difference in trends between genders.
We next assess whether authors prefer to collaborate with authors ofthe same gender and whether this evolves with the number of publica-tions. Fig. 5-B shows the average percentage of female co-authors inauthors’ collaboration networks, again at each published paper. Overall,female authors collaborate remarkably more often with other femaleauthors than male authors do, and this trend increases with the num-ber of published papers. Female authors have about 20–25% femaleco-authors for their first five articles, and reach about 35% female co-authors at their 25th article. Compared to female authors, male authorshave a lower and more stable percentage of female co-authors, i. e.,around 16% on average, which is only slightly lower than the totalpercentage of female authors (around 19%).
5.2 Co-Authorship Teams
We now take a closer look at the effect of gender on how VIS re-searchers form teams, through a statistical examination of the gendercomposition of author lists. If gender had no influence, we shouldobserve author lists whose gender composition is reflective of the over-all proportion of male and female authors. If in contrast, researchersform teams in a gender-sensitive manner, we should observe the gendercomposition of papers to be less balanced. For example, if on averageresearchers have a preference for working with researchers of the samegender (which seems to be the case according to Sect. 5.1), we shouldobserve a disproportionately high number of papers with all authors ofthe same gender. Alternatively, if researchers were trying to activelybalance gender when they form collaborations, opposite trends shouldbe observed—for example, we should see an anomalously low numberof papers with all-male or all-female authors.
To simplify our analyses and reporting, we exclude in this sectionall papers with at least one author of unknown gender, which amountsto about 5% of all publications. This brings the total number of papersanalyzed to 2,927 and the number of unique authors to 5,159.
To address the question of whether gender influences team formation,we first define a null model that assumes that all researchers are fullygender-blind in how they form co-authorship teams. The model isinformed by the overall probability that an author is male or female,computed across our entire dataset of 2,927 VIS papers. The probabilityof an author being male is 0.831, while the probability of an authorbeing female is 0.169.1 The model is also informed by the empiricaldistribution of team sizes. For example, among all 2,927 papers inthe dataset, 193 are written by a single author and 701 are written bytwo authors. The expected number of papers for each possible teamcomposition can be derived from the overall team size distribution and
1Note that these probabilities do not match the gender percentages reportedin Sect. 2.1, which are computed on unique authors. Since here we are interestedin the probability that an author on any given paper is male or female, eachauthor is counted as many times as the number of papers they wrote.
33
20
3.3
0.4
0.05
0.005
160
197
48
8.7
1.2
0.2
0.01
485
237
65
12
1.9
0.2
0.03
390
212
58
13
1.8
0.3
0.04
262
143
47
8.7
1.6
0.3
0.03
141
92
26
6.2
1.4
0.2
0.008
76
42
15
4.7
0.7
0.04
0.007
0
1
2
3
4
5
6
0 1 2 3 4 5 6# male authors
# fe
mal
e au
thor
s
0100200300400500
count
Predicted paper countsA
27
16
11
7
3
0
166
148
54
16
5
0
0
537
188
73
19
4
0
0
426
170
65
18
9
1
0
282
118
53
4
0
0
1
144
73
24
7
2
0
0
81
37
8
3
1
0
0
0
1
2
3
4
5
6
0 1 2 3 4 5 6# male authors
# fe
mal
e au
thor
s
0100200300400500
count
Actual paper countsB
−5.5
−3.9
7.7
6.6
3.0
−0.005
5.5
−49
5.9
7.3
3.8
−0.2
−0.01
52
−49
8.4
7.3
2.1
−0.2
−0.03
36
−42
7.2
5.4
7.2
0.7
−0.04
20
−25
6.3
−4.7
−1.6
−0.3
1
3.4
−19
−1.8
0.8
0.6
−0.2
−0.008
5.4
−5.5
−7.2
−1.7
0.3
−0.04
−0.007
0
1
2
3
4
5
6
0 1 2 3 4 5 6# male authors
# fe
mal
e au
thor
s
−60
−30
0
30
60
DifferencesC
0.8
0.8
3.4
16
62
0
1.0
0.8
1.1
1.8
4.2
0
0
1.1
0.8
1.1
1.6
2.1
0
0
1.1
0.8
1.1
1.4
5.1
3.9
0
1.1
0.8
1.1
0.5
0
0
36
1.0
0.8
0.9
1.1
1.4
0
0
1.1
0.9
0.5
0.6
1.5
0
0
0
1
2
3
4
5
6
0 1 2 3 4 5 6# male authors
# fe
mal
e au
thor
s
0.0
0.5
1.0
1.5
2.0
RatiosD
2.6
2.2
10.8
21.1
15.8
0.0
2.6
15.9
2.3
5.9
7.1
0.2
0.0
17.2
15.0
2.8
5.1
3.0
0.3
0.0
8.4
13.3
2.6
3.6
13.6
2.2
0.1
4.4
7.9
2.6
4.1
2.3
0.4
5.2
1.4
7.4
1.4
1.2
1.3
0.2
0.0
2.0
2.6
5.8
1.7
1.0
0.1
0.0
0
1
2
3
4
5
6
0 1 2 3 4 5 6# male authors
# fe
mal
e au
thor
s
1050510
s−value
Statistical significanceE
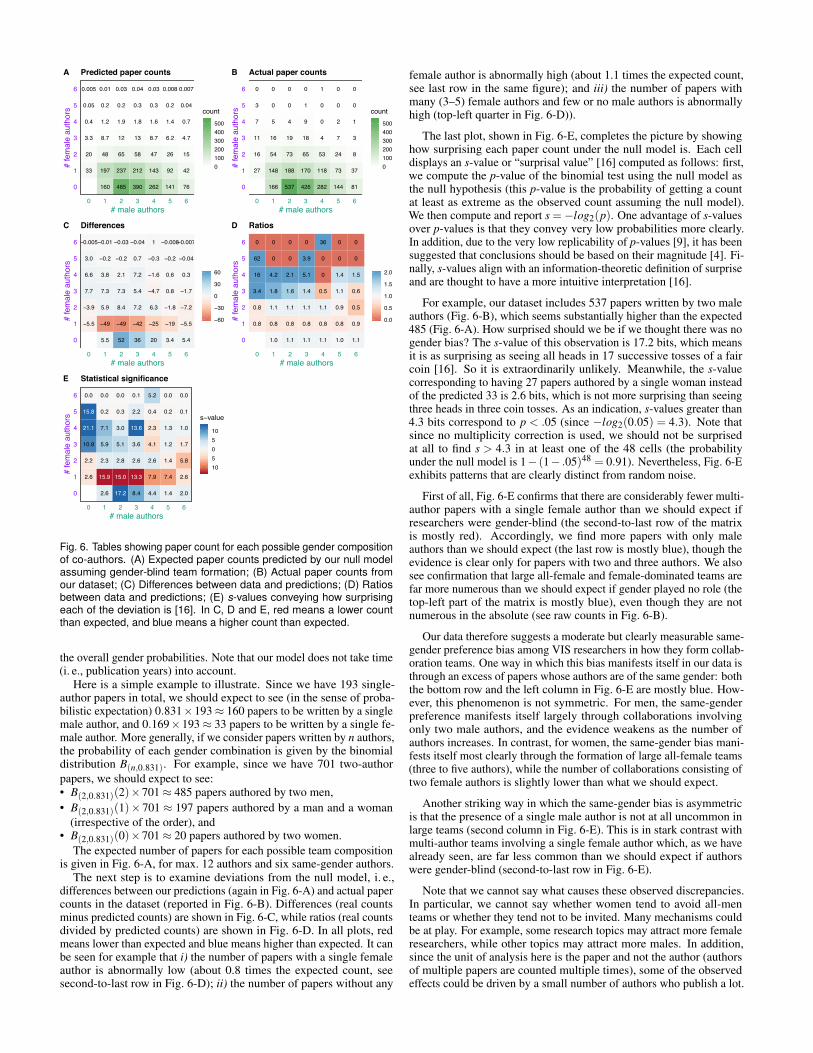
Fig. 6. Tables showing paper count for each possible gender compositionof co-authors. (A) Expected paper counts predicted by our null modelassuming gender-blind team formation; (B) Actual paper counts fromour dataset; (C) Differences between data and predictions; (D) Ratiosbetween data and predictions; (E) s-values conveying how surprisingeach of the deviation is [16]. In C, D and E, red means a lower countthan expected, and blue means a higher count than expected.
the overall gender probabilities. Note that our model does not take time(i. e., publication years) into account.
Here is a simple example to illustrate. Since we have 193 single-author papers in total, we should expect to see (in the sense of proba-bilistic expectation) 0.831×193 ≈ 160 papers to be written by a singlemale author, and 0.169×193 ≈ 33 papers to be written by a single fe-male author. More generally, if we consider papers written by n authors,the probability of each gender combination is given by the binomialdistribution B(n,0.831). For example, since we have 701 two-authorpapers, we should expect to see:• B(2,0.831)(2)×701 ≈ 485 papers authored by two men,• B(2,0.831)(1)× 701 ≈ 197 papers authored by a man and a woman
(irrespective of the order), and• B(2,0.831)(0)×701 ≈ 20 papers authored by two women.
The expected number of papers for each possible team compositionis given in Fig. 6-A, for max. 12 authors and six same-gender authors.
The next step is to examine deviations from the null model, i. e.,differences between our predictions (again in Fig. 6-A) and actual papercounts in the dataset (reported in Fig. 6-B). Differences (real countsminus predicted counts) are shown in Fig. 6-C, while ratios (real countsdivided by predicted counts) are shown in Fig. 6-D. In all plots, redmeans lower than expected and blue means higher than expected. It canbe seen for example that i) the number of papers with a single femaleauthor is abnormally low (about 0.8 times the expected count, seesecond-to-last row in Fig. 6-D); ii) the number of papers without any
female author is abnormally high (about 1.1 times the expected count,see last row in the same figure); and iii) the number of papers withmany (3–5) female authors and few or no male authors is abnormallyhigh (top-left quarter in Fig. 6-D)).
The last plot, shown in Fig. 6-E, completes the picture by showinghow surprising each paper count under the null model is. Each celldisplays an s-value or “surprisal value” [16] computed as follows: first,we compute the p-value of the binomial test using the null model asthe null hypothesis (this p-value is the probability of getting a countat least as extreme as the observed count assuming the null model).We then compute and report s =−log2(p). One advantage of s-valuesover p-values is that they convey very low probabilities more clearly.In addition, due to the very low replicability of p-values [9], it has beensuggested that conclusions should be based on their magnitude [4]. Fi-nally, s-values align with an information-theoretic definition of surpriseand are thought to have a more intuitive interpretation [16].
For example, our dataset includes 537 papers written by two maleauthors (Fig. 6-B), which seems substantially higher than the expected485 (Fig. 6-A). How surprised should we be if we thought there was nogender bias? The s-value of this observation is 17.2 bits, which meansit is as surprising as seeing all heads in 17 successive tosses of a faircoin [16]. So it is extraordinarily unlikely. Meanwhile, the s-valuecorresponding to having 27 papers authored by a single woman insteadof the predicted 33 is 2.6 bits, which is not more surprising than seeingthree heads in three coin tosses. As an indication, s-values greater than4.3 bits correspond to p < .05 (since −log2(0.05) = 4.3). Note thatsince no multiplicity correction is used, we should not be surprisedat all to find s > 4.3 in at least one of the 48 cells (the probabilityunder the null model is 1− (1− .05)48 = 0.91). Nevertheless, Fig. 6-Eexhibits patterns that are clearly distinct from random noise.
First of all, Fig. 6-E confirms that there are considerably fewer multi-author papers with a single female author than we should expect ifresearchers were gender-blind (the second-to-last row of the matrixis mostly red). Accordingly, we find more papers with only maleauthors than we should expect (the last row is mostly blue), though theevidence is clear only for papers with two and three authors. We alsosee confirmation that large all-female and female-dominated teams arefar more numerous than we should expect if gender played no role (thetop-left part of the matrix is mostly blue), even though they are notnumerous in the absolute (see raw counts in Fig. 6-B).
Our data therefore suggests a moderate but clearly measurable same-gender preference bias among VIS researchers in how they form collab-oration teams. One way in which this bias manifests itself in our data isthrough an excess of papers whose authors are of the same gender: boththe bottom row and the left column in Fig. 6-E are mostly blue. How-ever, this phenomenon is not symmetric. For men, the same-genderpreference manifests itself largely through collaborations involvingonly two male authors, and the evidence weakens as the number ofauthors increases. In contrast, for women, the same-gender bias mani-fests itself most clearly through the formation of large all-female teams(three to five authors), while the number of collaborations consisting oftwo female authors is slightly lower than what we should expect.
Another striking way in which the same-gender bias is asymmetricis that the presence of a single male author is not at all uncommon inlarge teams (second column in Fig. 6-E). This is in stark contrast withmulti-author teams involving a single female author which, as we havealready seen, are far less common than we should expect if authorswere gender-blind (second-to-last row in Fig. 6-E).
Note that we cannot say what causes these observed discrepancies.In particular, we cannot say whether women tend to avoid all-menteams or whether they tend not to be invited. Many mechanisms couldbe at play. For example, some research topics may attract more femaleresearchers, while other topics may attract more males. In addition,since the unit of analysis here is the paper and not the author (authorsof multiple papers are counted multiple times), some of the observedeffects could be driven by a small number of authors who publish a lot.
0
20
40
60
1990 1995 2000 2005 2010 2015 2020Year
(A) # OC members
0%
25%
50%
75%
100%
1990 1995 2000 2005 2010 2015 2020Year
(B) % OC members
0
40
80
120
160
1990 1995 2000 2005 2010 2015 2020Year
(C) # PC members
0%
25%
50%
75%
100%
1990 1995 2000 2005 2010 2015 2020Year
(D) % PC members
Female Male Unknown Committee Publication
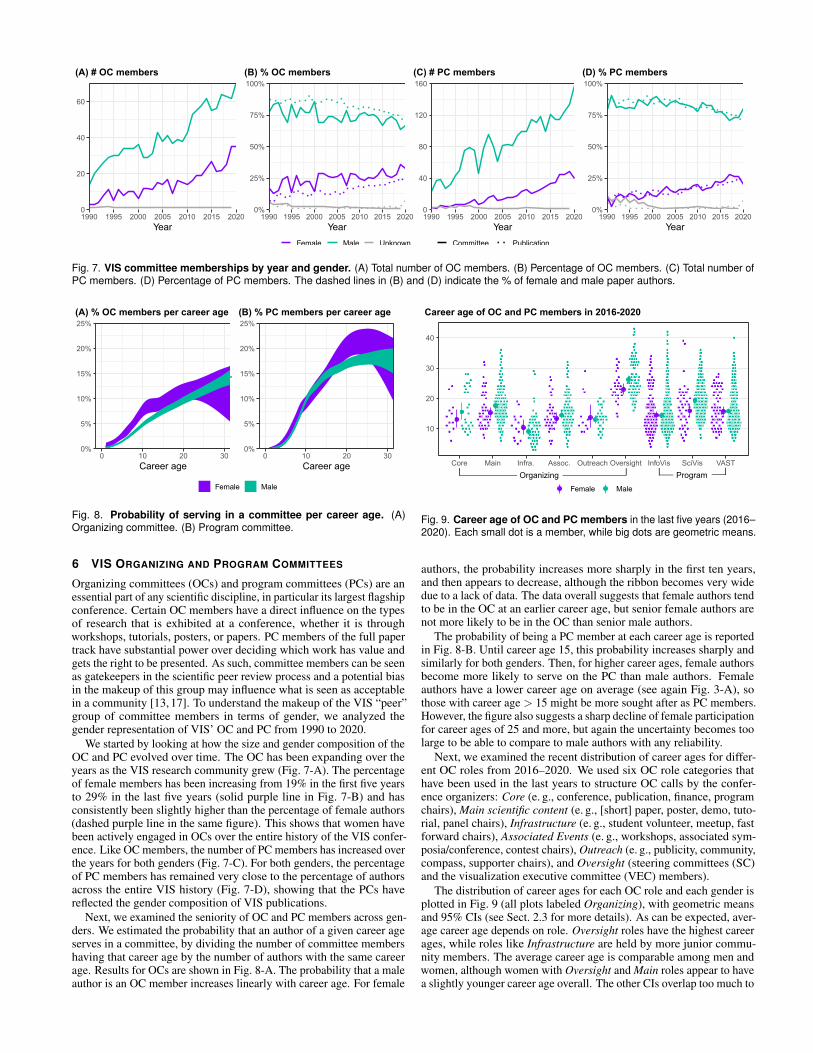
Fig. 7. VIS committee memberships by year and gender. (A) Total number of OC members. (B) Percentage of OC members. (C) Total number ofPC members. (D) Percentage of PC members. The dashed lines in (B) and (D) indicate the % of female and male paper authors.
0%
5%
10%
15%
20%
25%
0 10 20 30Career age
(A) % OC members per career age
0%
5%
10%
15%
20%
25%
0 10 20 30Career age
(B) % PC members per career age
Female Male
Fig. 8. Probability of serving in a committee per career age. (A)Organizing committee. (B) Program committee.
6 VIS ORGANIZING AND PROGRAM COMMITTEES
Organizing committees (OCs) and program committees (PCs) are anessential part of any scientific discipline, in particular its largest flagshipconference. Certain OC members have a direct influence on the typesof research that is exhibited at a conference, whether it is throughworkshops, tutorials, posters, or papers. PC members of the full papertrack have substantial power over deciding which work has value andgets the right to be presented. As such, committee members can be seenas gatekeepers in the scientific peer review process and a potential biasin the makeup of this group may influence what is seen as acceptablein a community [13, 17]. To understand the makeup of the VIS “peer”group of committee members in terms of gender, we analyzed thegender representation of VIS’ OC and PC from 1990 to 2020.
We started by looking at how the size and gender composition of theOC and PC evolved over time. The OC has been expanding over theyears as the VIS research community grew (Fig. 7-A). The percentageof female members has been increasing from 19% in the first five yearsto 29% in the last five years (solid purple line in Fig. 7-B) and hasconsistently been slightly higher than the percentage of female authors(dashed purple line in the same figure). This shows that women havebeen actively engaged in OCs over the entire history of the VIS confer-ence. Like OC members, the number of PC members has increased overthe years for both genders (Fig. 7-C). For both genders, the percentageof PC members has remained very close to the percentage of authorsacross the entire VIS history (Fig. 7-D), showing that the PCs havereflected the gender composition of VIS publications.
Next, we examined the seniority of OC and PC members across gen-ders. We estimated the probability that an author of a given career ageserves in a committee, by dividing the number of committee membershaving that career age by the number of authors with the same careerage. Results for OCs are shown in Fig. 8-A. The probability that a maleauthor is an OC member increases linearly with career age. For female
10
20
30
40
Core Main Infra. Assoc. Outreach Oversight InfoVis SciVis VAST
Female Male
Organizing Program
Career age of OC and PC members in 2016-2020
Fig. 9. Career age of OC and PC members in the last five years (2016–2020). Each small dot is a member, while big dots are geometric means.
authors, the probability increases more sharply in the first ten years,and then appears to decrease, although the ribbon becomes very widedue to a lack of data. The data overall suggests that female authors tendto be in the OC at an earlier career age, but senior female authors arenot more likely to be in the OC than senior male authors.
The probability of being a PC member at each career age is reportedin Fig. 8-B. Until career age 15, this probability increases sharply andsimilarly for both genders. Then, for higher career ages, female authorsbecome more likely to serve on the PC than male authors. Femaleauthors have a lower career age on average (see again Fig. 3-A), sothose with career age > 15 might be more sought after as PC members.However, the figure also suggests a sharp decline of female participationfor career ages of 25 and more, but again the uncertainty becomes toolarge to be able to compare to male authors with any reliability.
Next, we examined the recent distribution of career ages for differ-ent OC roles from 2016–2020. We used six OC role categories thathave been used in the last years to structure OC calls by the confer-ence organizers: Core (e. g., conference, publication, finance, programchairs), Main scientific content (e. g., [short] paper, poster, demo, tuto-rial, panel chairs), Infrastructure (e. g., student volunteer, meetup, fastforward chairs), Associated Events (e. g., workshops, associated sym-posia/conference, contest chairs), Outreach (e. g., publicity, community,compass, supporter chairs), and Oversight (steering committees (SC)and the visualization executive committee (VEC) members).
The distribution of career ages for each OC role and each gender isplotted in Fig. 9 (all plots labeled Organizing), with geometric meansand 95% CIs (see Sect. 2.3 for more details). As can be expected, aver-age career age depends on role. Oversight roles have the highest careerages, while roles like Infrastructure are held by more junior commu-nity members. The average career age is comparable among men andwomen, although women with Oversight and Main roles appear to havea slightly younger career age overall. The other CIs overlap too much to
19% 81%
18% 82%
9% 91%
27% 73%VIS Academy
VIS VGTC Awards
Paper Awards
Baseline percentages
0% 25% 50% 75% 100%
(A) % Award recipients per gender
0
10
20
30
40
50
PaperAwards
VIS Academy
(B) Career age
0
20
40
60
VIS Academy
(C) # Publications
Female Male
VIS VGTCAwards
PaperAwards
VIS VGTCAwards
(all VIS authors)
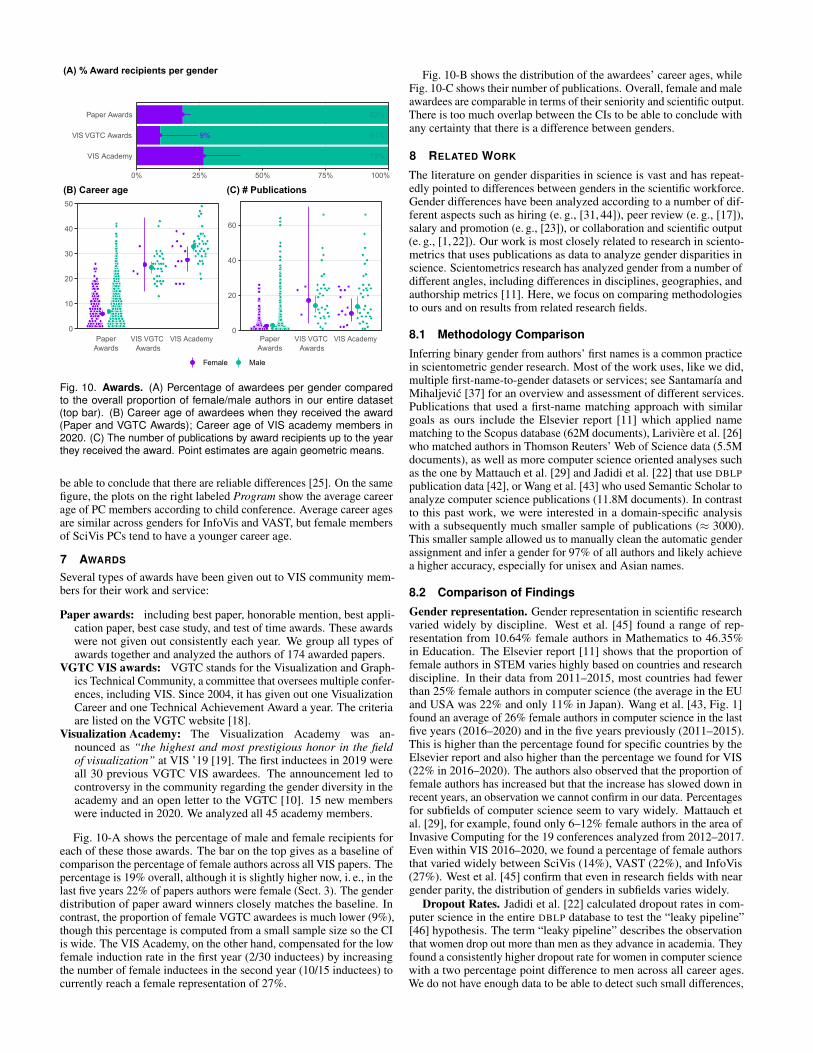
Fig. 10. Awards. (A) Percentage of awardees per gender comparedto the overall proportion of female/male authors in our entire dataset(top bar). (B) Career age of awardees when they received the award(Paper and VGTC Awards); Career age of VIS academy members in2020. (C) The number of publications by award recipients up to the yearthey received the award. Point estimates are again geometric means.
be able to conclude that there are reliable differences [25]. On the samefigure, the plots on the right labeled Program show the average careerage of PC members according to child conference. Average career agesare similar across genders for InfoVis and VAST, but female membersof SciVis PCs tend to have a younger career age.
7 AWARDS
Several types of awards have been given out to VIS community mem-bers for their work and service:
Paper awards: including best paper, honorable mention, best appli-cation paper, best case study, and test of time awards. These awardswere not given out consistently each year. We group all types ofawards together and analyzed the authors of 174 awarded papers.
VGTC VIS awards: VGTC stands for the Visualization and Graph-ics Technical Community, a committee that oversees multiple confer-ences, including VIS. Since 2004, it has given out one VisualizationCareer and one Technical Achievement Award a year. The criteriaare listed on the VGTC website [18].
Visualization Academy: The Visualization Academy was an-nounced as “the highest and most prestigious honor in the fieldof visualization” at VIS ’19 [19]. The first inductees in 2019 wereall 30 previous VGTC VIS awardees. The announcement led tocontroversy in the community regarding the gender diversity in theacademy and an open letter to the VGTC [10]. 15 new memberswere inducted in 2020. We analyzed all 45 academy members.
Fig. 10-A shows the percentage of male and female recipients foreach of these those awards. The bar on the top gives as a baseline ofcomparison the percentage of female authors across all VIS papers. Thepercentage is 19% overall, although it is slightly higher now, i. e., in thelast five years 22% of papers authors were female (Sect. 3). The genderdistribution of paper award winners closely matches the baseline. Incontrast, the proportion of female VGTC awardees is much lower (9%),though this percentage is computed from a small sample size so the CIis wide. The VIS Academy, on the other hand, compensated for the lowfemale induction rate in the first year (2/30 inductees) by increasingthe number of female inductees in the second year (10/15 inductees) tocurrently reach a female representation of 27%.
Fig. 10-B shows the distribution of the awardees’ career ages, whileFig. 10-C shows their number of publications. Overall, female and maleawardees are comparable in terms of their seniority and scientific output.There is too much overlap between the CIs to be able to conclude withany certainty that there is a difference between genders.
8 RELATED WORK
The literature on gender disparities in science is vast and has repeat-edly pointed to differences between genders in the scientific workforce.Gender differences have been analyzed according to a number of dif-ferent aspects such as hiring (e. g., [31, 44]), peer review (e. g., [17]),salary and promotion (e. g., [23]), or collaboration and scientific output(e. g., [1, 22]). Our work is most closely related to research in sciento-metrics that uses publications as data to analyze gender disparities inscience. Scientometrics research has analyzed gender from a number ofdifferent angles, including differences in disciplines, geographies, andauthorship metrics [11]. Here, we focus on comparing methodologiesto ours and on results from related research fields.
8.1 Methodology Comparison
Inferring binary gender from authors’ first names is a common practicein scientometric gender research. Most of the work uses, like we did,multiple first-name-to-gender datasets or services; see Santamarıa andMihaljevic [37] for an overview and assessment of different services.Publications that used a first-name matching approach with similargoals as ours include the Elsevier report [11] which applied namematching to the Scopus database (62M documents), Lariviere et al. [26]who matched authors in Thomson Reuters’ Web of Science data (5.5Mdocuments), as well as more computer science oriented analyses suchas the one by Mattauch et al. [29] and Jadidi et al. [22] that use DBLPpublication data [42], or Wang et al. [43] who used Semantic Scholar toanalyze computer science publications (11.8M documents). In contrastto this past work, we were interested in a domain-specific analysiswith a subsequently much smaller sample of publications (≈ 3000).This smaller sample allowed us to manually clean the automatic genderassignment and infer a gender for 97% of all authors and likely achievea higher accuracy, especially for unisex and Asian names.
8.2 Comparison of Findings
Gender representation. Gender representation in scientific researchvaried widely by discipline. West et al. [45] found a range of rep-resentation from 10.64% female authors in Mathematics to 46.35%in Education. The Elsevier report [11] shows that the proportion offemale authors in STEM varies highly based on countries and researchdiscipline. In their data from 2011–2015, most countries had fewerthan 25% female authors in computer science (the average in the EUand USA was 22% and only 11% in Japan). Wang et al. [43, Fig. 1]found an average of 26% female authors in computer science in the lastfive years (2016–2020) and in the five years previously (2011–2015).This is higher than the percentage found for specific countries by theElsevier report and also higher than the percentage we found for VIS(22% in 2016–2020). The authors also observed that the proportion offemale authors has increased but that the increase has slowed down inrecent years, an observation we cannot confirm in our data. Percentagesfor subfields of computer science seem to vary widely. Mattauch etal. [29], for example, found only 6–12% female authors in the area ofInvasive Computing for the 19 conferences analyzed from 2012–2017.Even within VIS 2016–2020, we found a percentage of female authorsthat varied widely between SciVis (14%), VAST (22%), and InfoVis(27%). West et al. [45] confirm that even in research fields with neargender parity, the distribution of genders in subfields varies widely.
Dropout Rates. Jadidi et al. [22] calculated dropout rates in com-puter science in the entire DBLP database to test the “leaky pipeline”[46] hypothesis. The term “leaky pipeline” describes the observationthat women drop out more than men as they advance in academia. Theyfound a consistently higher dropout rate for women in computer sciencewith a two percentage point difference to men across all career ages.We do not have enough data to be able to detect such small differences,
but we did find some evidence for a higher dropout rate for femaleauthors in the early career phase.
Productivity. The productivity of men and women has been studiedin terms of number of papers published as well as citation count. The“productivity puzzle” [8] was coined as a term to describe the unknowncause of lower publication rates for women in various fields. Acrossscience, the Elsevier report [11] found that on average women publishedfewer papers than men, but found no evidence of an impact of this lowerpublication count on citations or downloads. For computer scienceresearch, Jadidi et al. [22] found a higher average productivity formen across all years (measured in terms of publication count), butthe difference virtually disappeared once the authors’ career age wascontrolled for. They showed that the apparently higher productivityof men in the computer science literature is due to a higher count ofsenior male authors. This observation was confirmed by Mattauch etal. [29]. In our dataset, we similarly observed a higher average careerage for men (8 years for men vs. 6 years for women) and did not find asubstantial difference of productivity across career ages.
Author Position. The Elsevier report [11] analyzed author positionacross engineering disciplines, which use similar ways of orderingauthors as VIS: the first author contributes the most work with the seniorauthor often listed last. Their analysis shows that in engineering, theshare of papers first-authored by women is greater than the percentageof female authors in the field. We did not replicate this result for VIS,and found instead that the number of papers first-authored by womenis comparable to the percentage of female authors. West et al. [45]report that women were underrepresented as authors of single-authoredpapers for fields in the natural sciences. However, our analysis ofco-authorship teams does not provide conclusive evidence that at VIS,women publish single-authored papers less often than men.
Collaboration. Homophily is the tendency to bond with others whoare similar to oneself. In academia, homophily can manifest itselfby a tendency for researchers to collaborate with researchers of thesame gender. Jadidi et al. [22] showed that women tend to collaboratemore than expected with other women in computer science researchand Wang et al. [43] came to the same conclusion for both same-gender collaborations in computer science. This same-gender biashas been found in specific computer science fields like informationretrieval [49], as well as in other disciplines. For example, it has longbeen documented in economics [5, 14, 30]. However, the effect doesnot seem universal. For example, no same-gender bias was found in astudy of Turkish social sciences researchers [35]. Our data shows thata same-gender bias is present at VIS, and provides a detailed analysisof the different ways this bias is expressed among female authors andmale authors. The Elsevier report [11] also looked at internationalcollaborations, something we did not analyze. The report found thatwomen collaborate less with authors from other countries but that therewas no effect on how papers are cited or downloaded.
Committee Membership. Felt [13] examined the gender of com-mittee members for eight computer science conferences in 2017, findinga range of 12–25% female members and an average of 19%. Amongthese, SIGGRAPH (25%) and VLDB (20%) are perhaps the most re-lated to VIS. At VIS, in the last five years, the program committee(PC) had 25% female members while the organizing committee (OC)had 29%. We found that across the entire history of VIS, the gendermakeup of the PC closely matched the gender distribution of paperauthors, while the proportion of women in OCs was slightly higher.
At ACM CHI, the group of subcommittee chairs (the equivalent ofVIS paper chairs) had a 50-50 gender ratio in 2020 [3], due to diversityinitiatives in the community. At VIS, we found a 15% ratio for femalepaper chairs across all years, and 25% in the last five years.
9 DISCUSSION AND CONCLUSION
We provided an exploratory analysis to inform the community aboutgender representation at IEEE VIS. We specifically omitted any conclu-sion beyond the dataset as well as our personal views because we wantthese discussion to happen in the wider community. Discussions on pos-sible causes or solutions to gender gaps can build on our data but shouldalso include discussions on data that we could not analyze—such as
the possible effects of having children on researchers’ careers. Thesekinds of discussions have already started [36] and need to continue.We hope our paper will serve in such discussions and beyond. The keyobservations from our analysis are summarized as follows:1. Across all VIS publications, 19% of authors are female. SciVis has
a smaller female representation than InfoVis and VAST.2. The proportion of female authors has been steadily increasing over
the years, from 9% in 1990–1995 to 22% in the last five years. Thisnumber however remains below the average in computer science(26% in the last five years according to Wang et al. [43]).
3. Because there were fewer female authors in the past, male authorsare more senior on average (measured in terms of career age).
4. If career age is controlled for, publication rates are comparableacross genders, though female authors seem to publish slightlyfaster mid-career (between their 10th and 20th articles).
5. We did not find evidence for a substantial difference in drop-outrates across genders, except for a possibly higher drop-out rate forwomen during their first few years of career age. Note that our dataonly allows us to reliably detect large differences.
6. Women take on the first author position about as often as men.However, among mid-career and senior researchers, male authorstake on the last position more frequently than female authors, whoare more often in a middle position relative to men.
7. Compared to men, women have substantially more female co-authors, a trend that increases with the number of publications(women have 23% female co-authors at their 1st article and 35%at their 25th article). Male authors have 16% female co-authors onaverage. Women tend to collaborate in relatively large teams whilemen tend to collaborate in pairs. Teams with a single female authorare underrepresented, while teams with a single male author are not.
8. Across all VIS history, the composition of program committeeshas closely reflected the proportion of male and female authors.Meanwhile, the proportion of women in organizing committees hasbeen slightly higher than the proportion of female authors.
9. Among recipients of paper awards, the proportion of women closelymirrors the proportion of female authors. The proportion of womenamong VIS VGTC awardees is lower than the baseline, while theproportion of women in the VIS Academy is higher. We found noevidence for a difference in average career age or publication countamong female and male awardees, for none of the award types.Our work has several limitations. As we mentioned before, like much
previous work, our analysis is limited to male and female genders. Thiscould be addressed in future work by considering self-identified gender,although it will be likely impossible to cover the entire set of VISauthors, as many will be unreachable. Our method for inferring genderis also imperfect, although as we noted before, our extensive manualcleaning likely makes our data more accurate than most previous work.Another source of uncertainty are the relatively small sample sizes,especially for senior female authors, making it sometimes difficultto draw reliable inferences about gender differences. This could beimproved by extending our dataset with data from related venues.
There are many ways our analysis could be extended. One importantway is by looking at diversity metrics beyond gender. Several met-rics that warrant further investigation have been mentioned in the newVIS Charter [20]: geographic origin, sector (academia, industry, gov-ernment), academic lineage of authors, and the diversity of academicbackground or research areas of authors, for example.
ACKNOWLEDGMENTS
Steve Haroz helped us considerably during all stages of this research,including by providing statistical expertise, by giving advice on how tomaximize the transparency of our reporting, and by contributing to thequalitative coding work. Steve was initially part of the research team butwithdrew from authorship due to methodological disagreements. Wethank Tamara Munzner who shared detailed data and patiently answeredour questions about early years of the conference. We also received datafrom the students of the Visual Analytics 2017 class at CentraleSupelec,as well as Lucy Lu Wang. All images in the paper are licensed undercb Attribution 4.0 and available on https://osf.io/ydfj4/.
REFERENCES
[1] D. W. Aksnes, F. N. Piro, and K. Rørstad. Gender gaps in international re-search collaboration: a bibliometric approach. Scientometrics, 120(2):747–774, Aug. 2019. doi: 10.1007/s11192-019-03155-3
[2] A. Babu. Data.world “gender by names‘’ dataset. Online, 2020. Available:https://data.world/arunbabu/gender-by-names. Downloaded:Feb. 13, 2020.
[3] P. Bjørn and S. Zhao. Diversity of the program committee for CHI 2020.Online. Available: https://chi2020.acm.org/blog/diversity-of-the-program-committee-for-chi-2020/.
[4] D. D. Boos and L. A. Stefanski. P-value precision and reproducibility.The American Statistician, 65(4):213–221, 2011.
[5] A. Boschini and A. Sjogren. Is team formation gender neutral? evidencefrom coauthorship patterns. Journal of Labor Economics, 25(2):325–365,2007. doi: 10.1086/510764
[6] W. Bunton. Best practices in achieving workforce diversity. Online, Oct.2000. Available: https://govinfo.library.unt.edu/npr/library/workforce-diversity.pdf.
[7] W. S. Cleveland. Robust locally weighted regression and smoothingscatterplots. Journal of the American statistical association, 74(368):829–836, 1979. doi: 10.1080/01621459.1979.10481038
[8] J. Cole and H. Zuckerman. The productivity puzzle. Advances in Motiva-tion and Achievement, pp. 217–258, Jan. 1984.
[9] G. Cumming. Replication and p intervals: p values predict the futureonly vaguely, but confidence intervals do much better. Perspectives onPsychological Science, 3(4):286–300, 2008. doi: 10.1111/j.1745-6924.2008.00079.x
[10] N. Elmqvist, P. Isenberg, and C. Collins. Open letter to the IEEE VGTCregarding the Visualization Academy. Online, 2019. Available: https://sites.google.com/d/1Z6Hid2saUBb8x16sViQ4v9VBlJNLFOJ-
/p/1TmTMyzpbPKLzpZcTH0awr1HKE4PGCe06/edit.[11] Elsevier. Gender in the global research landscape: Analysis of research
performance through a gender lens across 20 years, 12 geographies, and 27subject areas. Technical report, Elsevier, 2017. Available: https://www.elsevier.com/research-intelligence/campaigns/gender-17.
[12] Etalab. Liste de prenoms. Online, 2020. Available: https://www.data.gouv.fr/fr/datasets/liste-de-prenoms/. Downloaded: Feb.13, 2020.
[13] A. P. Felt. “peer” review? gender imbalance in program committees. Blogpost, 2019. Available: https://www.adrienneporterfelt.com/writing/2019/11/27/peer-review-gender-imbalance-in-progra
m-committees.[14] M. A. Ferber and M. Teiman. Are women economists at a disadvantage in
publishing journal articles? Eastern Economic Journal, 6(3/4):189–193,1980.
[15] M. J. Gardner and D. G. Altman. Confidence intervals rather than pvalues: estimation rather than hypothesis testing. Br Med J (Clin Res Ed),292(6522):746–750, 1986. doi: 10.1136/bmj.292.6522.746
[16] S. Greenland. Valid p-values behave exactly as they should: Some mis-leading criticisms of p-values and their resolution with s-values. TheAmerican Statistician, 73(sup1):106–114, 2019. doi: 10.1080/00031305.2018.1529625
[17] M. Helmer, M. Schottdorf, A. Neef, and D. Battaglia. Research: Genderbias in scholarly peer review. eLife, 6:e21718, Mar. 2017. doi: 10.7554/eLife.21718
[18] IEEE VGTC. IEEE VGTC Visualization Technical Awards. Online, 2021.Available: https://tc.computer.org/vgtc/awards/visualization-technical-awards/.
[19] IEEE VGTC. The IEEE VGTC Visualization Academy. Online, 2021.Available: https://tc.computer.org/vgtc/awards/visualization-academy/.
[20] IEEE VIS Committees. IEEE VIS Charter. PDF document, 2020. Avail-able: https://drive.google.com/file/d/1CzoEKf0CiHvybLsB44OcoD9OFiCTT210/view.
[21] P. Isenberg, F. Heimerl, S. Koch, T. Isenberg, P. Xu, C. Stolper, M. Sedl-mair, J. Chen, T. Moller, and J. Stasko. vispubdata.org: A metadatacollection about IEEE visualization (VIS) publications. IEEE Transac-tions on Visualization and Computer Graphics, 23(9):2199–2206, Sept.2017. doi: 10.1109/TVCG.2016.2615308
[22] M. Jadidi, F. Karimi, H. Lietz, and C. Wagner. Gender disparities in sci-ence? dropout, productivity, collaborations and success of male and femalecomputer scientists. Advances in Complex Systems, 21(03n04):1750011,
2018. doi: 10.1142/S0219525917500114[23] J. Jokinen and J. Pehkonen. Promotions and earnings—gender or merit?
evidence from longitudinal personnel data. Journal of Labor Research,38:306–334, 2017. doi: 10.1007/s12122-017-9254-7
[24] M. Kantrowitz. CMU AI repository names corpus. Online, 2020. Avail-able: http://www.cs.cmu.edu/afs/cs/project/ai-repository/ai/areas/nlp/corpora/names/. Downloaded: Feb. 13, 2020.
[25] K. Krzywinski and N. Altman. Error bars. Nature methods, 10:921–922,2013. doi: 10.1038/nmeth.2659
[26] V. Lariviere, C. Ni, Y. Gingras, B. Cronin, and C. R. Sugimoto. Globalgender disparities in science. Nature, 504:211–213, Dec. 2013. doi: 10.1038/504211a
[27] C. Loader. Local regression and likelihood. Springer, 2006. doi: 10.1007/b98858
[28] C. Loader and M. A. Liaw. Package ‘locfit’. The Comprehensive R ArchiveNetwork, 2013. Available: https://cran.r-project.org/web/packages/locfit/locfit.pdf.
[29] S. Mattauch, K. Lohmann, F. Hanning, D. Lohmann, and J. Teich. Abibliometric approach for detecting the gender gap in computer science.Communications of the ACM, 63(5):74–80, 2020. doi: 10.1145/3376901
[30] J. M. McDowell and J. K. Smith. The effect of gender-sorting on propen-sity to coauthor: Implications for academic promotion. Economic Inquiry,30(1):68–82, 1992. doi: 10.1111/j.1465-7295.1992.tb01536.x
[31] C. A. Moss-Racusin, J. F. Dovidio, V. L. Brescoll, M. J. Graham, andJ. Handelsman. Science faculty’s subtle gender biases favor male students.Proceedings of the National Academy of Sciences, 109(41):16474–16479,2012. doi: 10.1073/pnas.1211286109
[32] T. Munzner. VIS Historical Year Through 2018. Google spreadsheet,2019. Available: https://docs.google.com/spreadsheets/d/1fz3KkR03JCyOoL7wFj2UorD6UqG0iZBXlY4POk1 iVU/edit.
[33] T. Munzner. Steering/VEC Members Historical Archive. Google spread-sheet, 2020. https://docs.google.com/document/d/1OXVHMB7oTD9lujDC0WragUP-kyOPX0PQ6y12sF hYg4/edit.
[34] G. Norman. Likert scales, levels of measurement and the “laws” ofstatistics. Advances in Health Sciences Education, 15(5):625–632, 2010.doi: 10.1007/s10459-010-9222-y
[35] B. Ozel, H. Kretschmer, and T. Kretschmer. Co-authorship pair distributionpatterns by gender. Scientometrics, 98(1):703–723, 2014. doi: 10.1007/s11192-013-1145-y
[36] B. E. Rogowitz, A. Diehl, P. Isenberg, R. Borgo, and A. Abdul-Rahman.Marshalling the many facets of diversity. In R. Metoyer and K. Gaither,eds., Diversity in Visualization, Synthesis Lectures on Visualization. Mor-gan Claypool, 2019. doi: 10.2200/S00894ED1V01Y201901VIS010
[37] L. Santamarıa and H. Mihaljevic. Comparison and benchmark of name-to-gender inference services. PeerJ Computer Science, 4:e156, July 2018.doi: 10.7717/peerj-cs.156
[38] J. Sauro and J. R. Lewis. Average task times in usability tests: what toreport? In Proceedings of the SIGCHI Conference on Human Factorsin Computing Systems, pp. 2347–2350, 2010. doi: 10.1145/1753326.1753679
[39] Social Security Administration. Beyond the top 1000 names - nationaldata. Online, 2020. Available: https://www.ssa.gov/oact/babynames/limits.html. Downloaded: Nov. 19, 2020.
[40] SteelPangolin. Genderize. Python package, 2020. Available: https://github.com/SteelPangolin/genderize. Downloaded: Nov. 2020.
[41] The dblp team: dblp computer science bibliography. Dblp computerscience bibliography. Online, 2021. Available: https://dblp.org/.
[42] The dblp team: dblp computer science bibliography. Monthly snapshotrelease of March 2021. Online, 2021. Available: https://dblp.org/xml/release/dblp-2021-03-01.xml.gz.
[43] L. L. Wang, G. Stanovsky, L. Weihs, and O. Etzioni. Gender trends incomputer science authorship. Communications of the ACM, 64(3):78–84,Feb. 2021. doi: 10.1145/3430803
[44] S. F. Way, D. B. Larremore, and A. Clauset. Gender, productivity, andprestige in computer science faculty hiring networks. In Proceedingsof the Conference on World Wide Web (WWW), pp. 1169–1179. IW3C2,2016. doi: 10.1145/2872427.2883073
[45] J. D. West, J. Jacquet, M. M. King, S. J. Correll, and C. T. Bergstrom. Therole of gender in scholarly authorship. PLoS ONE, 8(7):68–82, 2013. doi:10.1371/journal.pone.0066212
[46] P. Wickware. Along the leaky pipeline. Nature, (390):202–203, 1997. doi:10.1038/36639
[47] E. B. Wilson. Probable inference, the law of succession, and statistical

inference. Journal of the American Statistical Association, 22(158):209–212, 1927. doi: 10.2307/2276774
[48] M. Winkelmann. List of first names, genders and country-specific frequen-cies. Online, 2020. Available: https://github.com/MatthiasWinkelmann/firstname-database. Downloaded: Feb. 13, 2020.
[49] C. Zhang, Y. Bu, Y. Ding, and J. Xu. Understanding scientific collabora-tion: Homophily, transitivity, and preferential attachment. Journal of theAssociation for Information Science and Technology, 69(1):72–86, 2018.doi: 10.1002/asi.23916