Embed Size (px)
Citation preview

Gender and Gender and Educational and Educational and
Occupational ChoicesOccupational ChoicesJacquelynne S. EcclesJacquelynne S. Eccles
University of MichiganUniversity of Michigan
Paper presented at the Gender Role ConferencePaper presented at the Gender Role ConferenceSan Francisco April 2004 San Francisco April 2004
and Chinese University of Hong Kong, February, 2004and Chinese University of Hong Kong, February, 2004
Acknowledgements: This research was funded by grants from NIMH, NSF, Acknowledgements: This research was funded by grants from NIMH, NSF, and NICHD to Eccles and by grants from NSF, Spencer Foundation and and NICHD to Eccles and by grants from NSF, Spencer Foundation and
W.T. Grant to Eccles and BarberW.T. Grant to Eccles and Barber
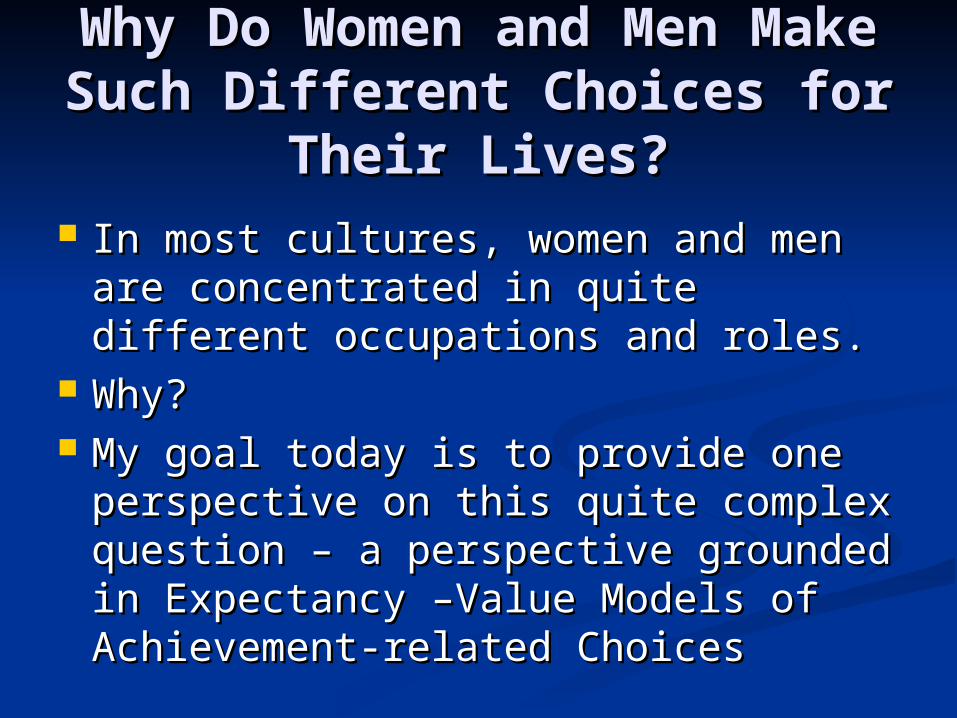
Why Do Women and Men Why Do Women and Men Make Such Different Make Such Different
Choices for Their Lives?Choices for Their Lives? In most cultures, women and men In most cultures, women and men
are concentrated in quite different are concentrated in quite different occupations and roles.occupations and roles.
Why?Why? My goal today is to provide one My goal today is to provide one
perspective on this quite complex perspective on this quite complex question – a perspective grounded in question – a perspective grounded in Expectancy –Value Models of Expectancy –Value Models of Achievement-related Choices Achievement-related Choices
OverviewOverview
I began my research work in this I began my research work in this area focused on one specific area focused on one specific question:question:
WHY ARE FEMALES LESS LIKELY WHY ARE FEMALES LESS LIKELY TO GO INTO MATH AND PHYSICAL TO GO INTO MATH AND PHYSICAL SCIENCE THAN MALES?SCIENCE THAN MALES?
Overview 2Overview 2 I became increasingly aware, however, I became increasingly aware, however,
that this question is a subset of two much that this question is a subset of two much more general questions:more general questions:
WHY DOES ANYONE DO ANYTHING?WHY DOES ANYONE DO ANYTHING?
WHAT PSYCHOLOGICAL, BIOLOGICAL, WHAT PSYCHOLOGICAL, BIOLOGICAL, AND SOCIAL FORCES INFLUENCE THE AND SOCIAL FORCES INFLUENCE THE CRITICAL CHOICES PEOPLE MAKE CRITICAL CHOICES PEOPLE MAKE ABOUT HOW TO SPEND THEIR TIME ABOUT HOW TO SPEND THEIR TIME AND THEIR LIVES?AND THEIR LIVES?
GoalsGoals
Provide an overview of gender Provide an overview of gender differences in occupational plans and differences in occupational plans and choiceschoices
Discuss alternative explanations for Discuss alternative explanations for these differences – focusing on my these differences – focusing on my Expectancy – Value Model of Expectancy – Value Model of Achievement-Related ChoicesAchievement-Related Choices
Summarize our research findings Summarize our research findings relevant to this question and this modelrelevant to this question and this model
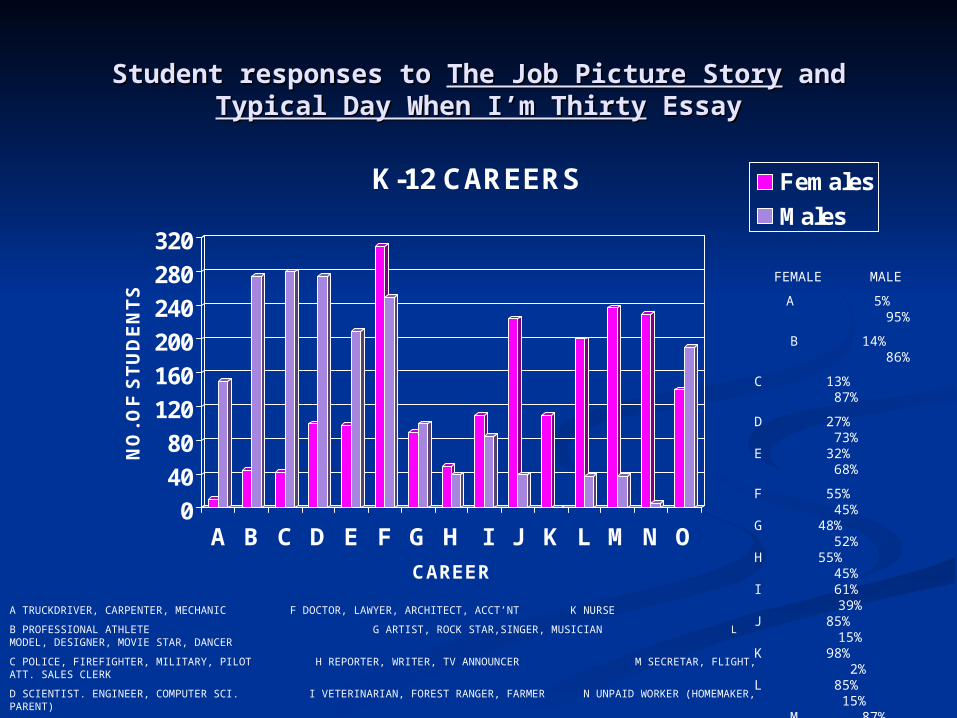
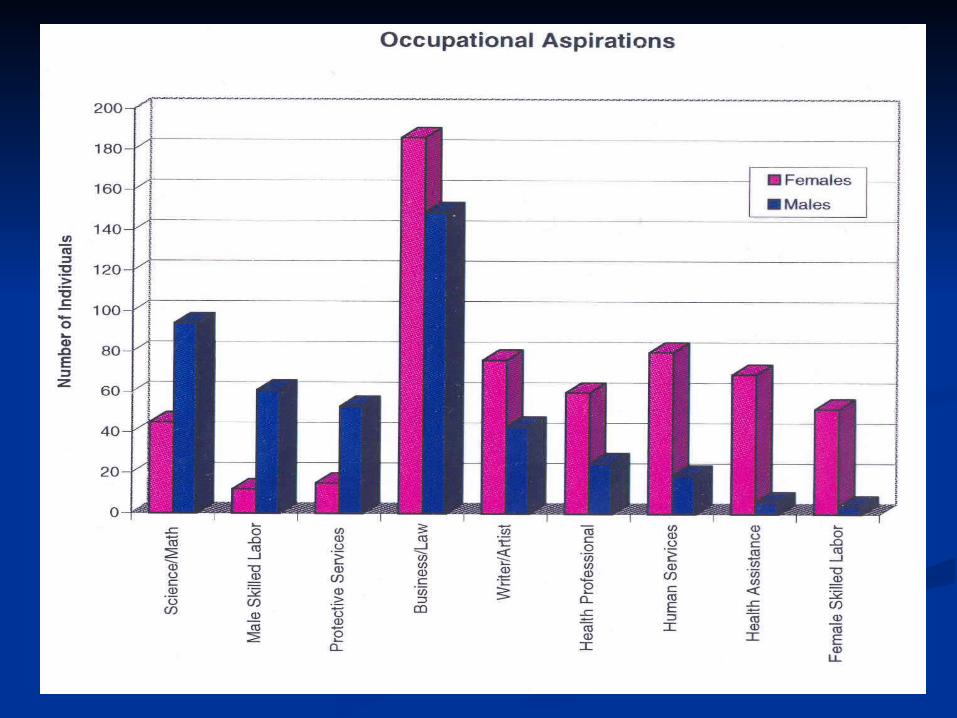
Student responses to Student responses to The Job Picture StoryThe Job Picture Story and and Typical Typical Day When I’m ThirtyDay When I’m Thirty Essay Essay
0
40
80
120
160
200
240
280
320
NO
. OF
ST
UD
EN
TS
A B C D E F G H I J K L M N O
CAREER
K-12 CAREERS Females
Males
FEMALE MALE
A 5% 95%
B 14% 86%
C 13% 87%
D 27% 73%E 32% 68%
F 55% 45%G 48% 52%H 55% 45%I 61% 39%J 85% 15%K 98% 2%L 85% 15%M 87% 13%N 97% 3%O 42% 58%
N= 1987 N=1962
TOTAL N= 3949A TRUCKDRIVER, CARPENTER, MECHANIC F DOCTOR, LAWYER, ARCHITECT, ACCT’NT K NURSE
B PROFESSIONAL ATHLETE G ARTIST, ROCK STAR,SINGER, MUSICIAN L MODEL, DESIGNER, MOVIE STAR, DANCER
C POLICE, FIREFIGHTER, MILITARY, PILOT H REPORTER, WRITER, TV ANNOUNCER M SECRETAR, FLIGHT, ATT. SALES CLERK
D SCIENTIST. ENGINEER, COMPUTER SCI. I VETERINARIAN, FOREST RANGER, FARMER N UNPAID WORKER (HOMEMAKER, PARENT)
E EXECUTIVE, BUSINESSPERSON, BANKER J TEACHER 0 THER
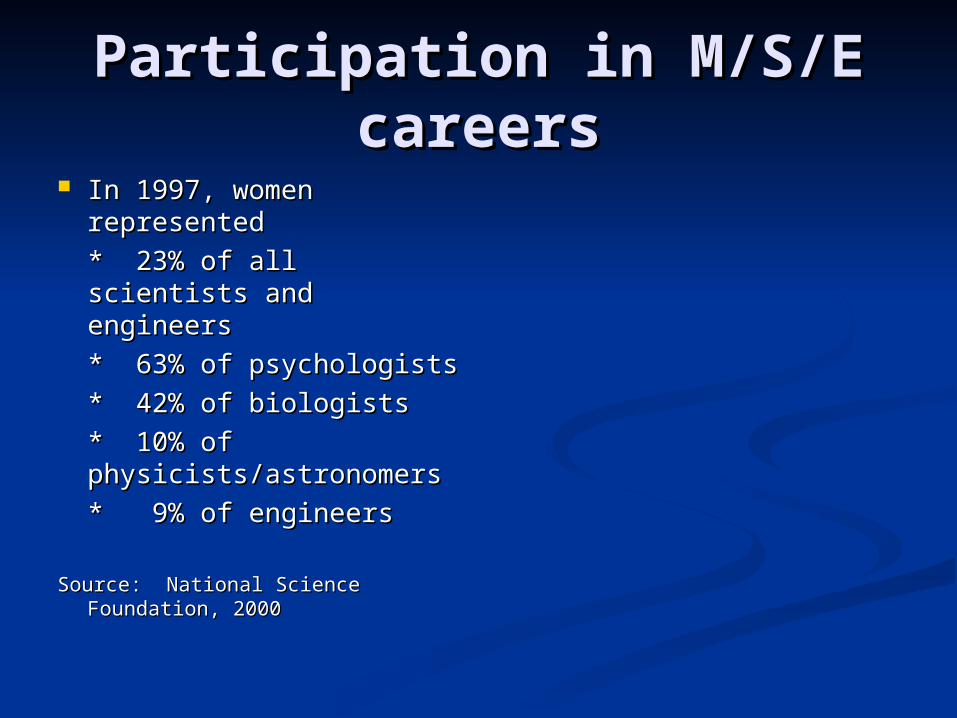
Participation in M/S/E Participation in M/S/E careerscareers
In 1997, women In 1997, women representedrepresented
* 23% of all scientists * 23% of all scientists and engineersand engineers
* 63% of psychologists* 63% of psychologists
* 42% of biologists* 42% of biologists
* 10% of * 10% of physicists/astronomersphysicists/astronomers
* 9% of engineers* 9% of engineers
Source: National Science Source: National Science Foundation, 2000Foundation, 2000
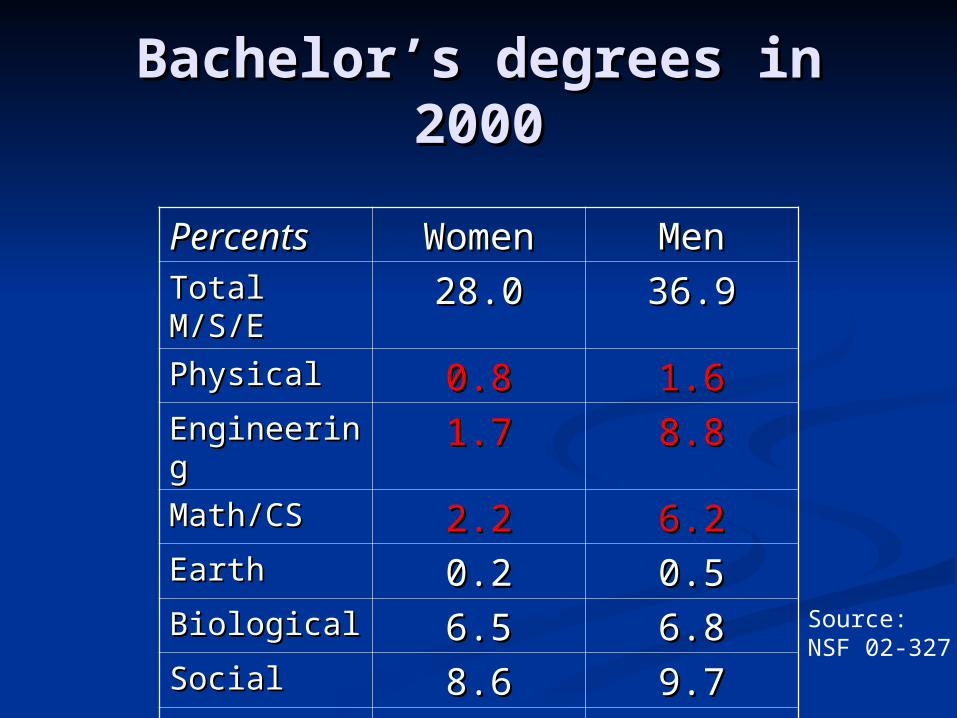
Bachelor’s degrees in 2000Bachelor’s degrees in 2000
PercentsPercents WomenWomen MenMenTotal M/S/ETotal M/S/E 28.028.0 36.936.9PhysicalPhysical 0.80.8 1.61.6EngineerinEngineeringg
1.71.7 8.88.8
Math/CSMath/CS 2.22.2 6.26.2EarthEarth 0.20.2 0.50.5BiologicalBiological 6.56.5 6.86.8SocialSocial 8.68.6 9.79.7PsychologyPsychology 8.08.0 3.33.3
Source:NSF 02-327
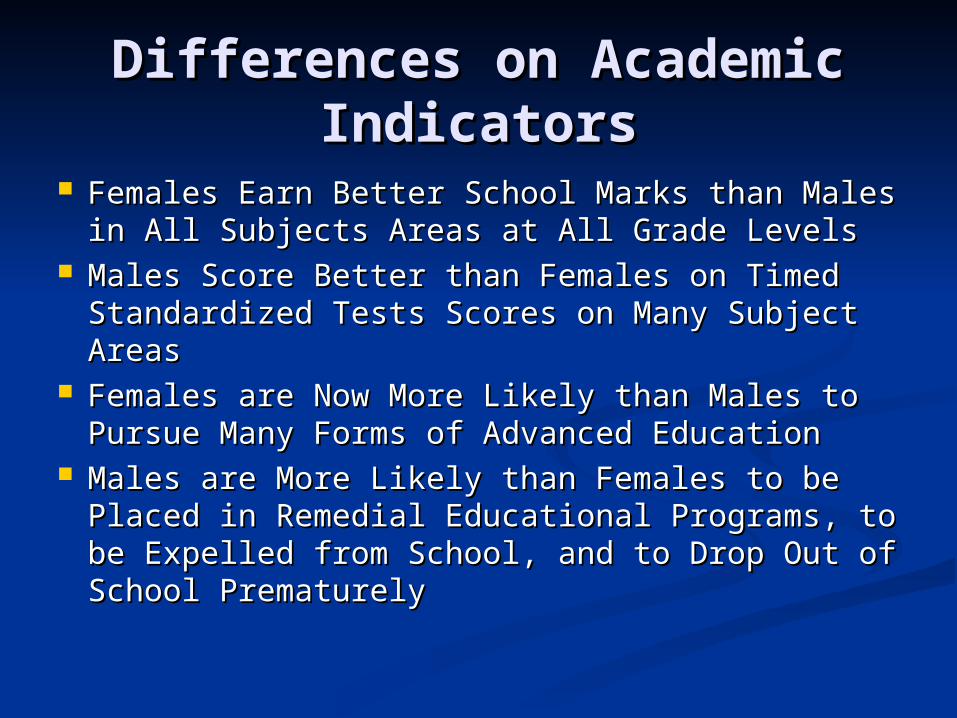
Differences on Academic Differences on Academic IndicatorsIndicators
Females Earn Better School Marks than Males Females Earn Better School Marks than Males in All Subjects Areas at All Grade Levelsin All Subjects Areas at All Grade Levels
Males Score Better than Females on Timed Males Score Better than Females on Timed Standardized Tests Scores on Many Subject Standardized Tests Scores on Many Subject AreasAreas
Females are Now More Likely than Males to Females are Now More Likely than Males to Pursue Many Forms of Advanced EducationPursue Many Forms of Advanced Education
Males are More Likely than Females to be Males are More Likely than Females to be Placed in Remedial Educational Programs, to Placed in Remedial Educational Programs, to be Expelled from School, and to Drop Out of be Expelled from School, and to Drop Out of School PrematurelySchool Prematurely
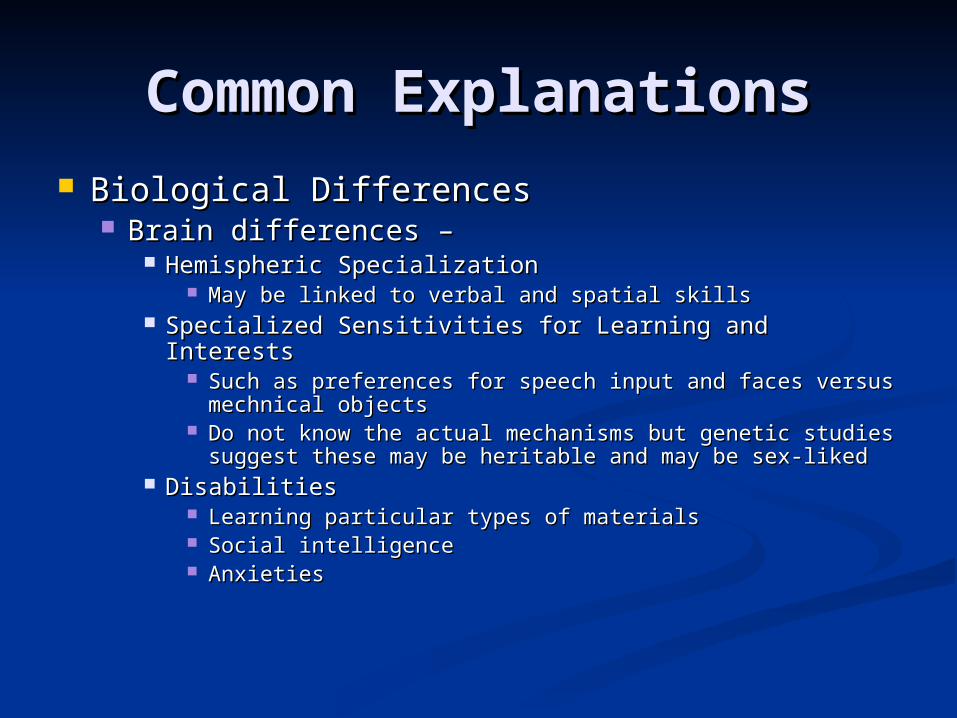
Common ExplanationsCommon Explanations Biological DifferencesBiological Differences
Brain differences –Brain differences – Hemispheric SpecializationHemispheric Specialization
May be linked to verbal and spatial skillsMay be linked to verbal and spatial skills Specialized Sensitivities for Learning and InterestsSpecialized Sensitivities for Learning and Interests
Such as preferences for speech input and faces versus Such as preferences for speech input and faces versus mechnical objectsmechnical objects
Do not know the actual mechanisms but genetic studies Do not know the actual mechanisms but genetic studies suggest these may be heritable and may be sex-likedsuggest these may be heritable and may be sex-liked
DisabilitiesDisabilities Learning particular types of materialsLearning particular types of materials Social intelligenceSocial intelligence AnxietiesAnxieties
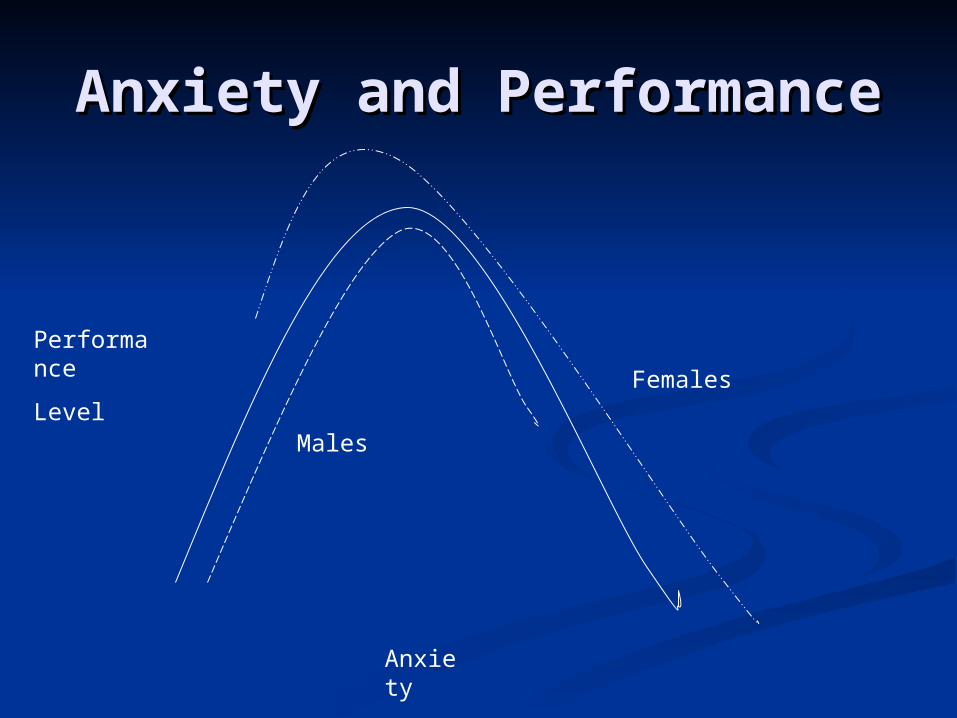
Anxiety and PerformanceAnxiety and Performance
Anxiety
Performance
LevelMales
Females
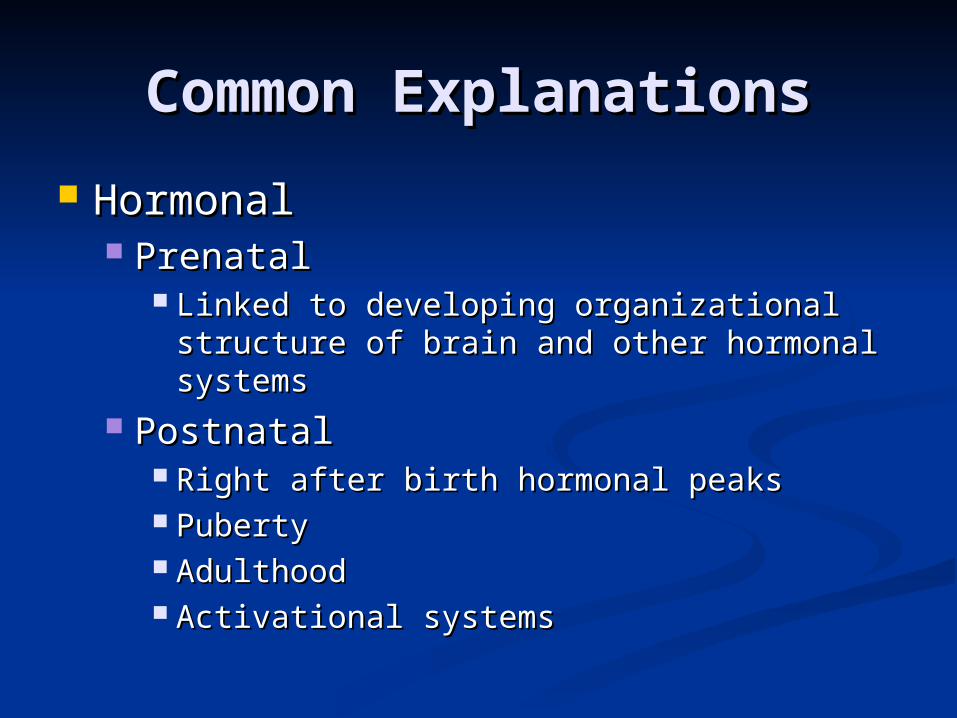
Common ExplanationsCommon Explanations
HormonalHormonal PrenatalPrenatal
Linked to developing organizational Linked to developing organizational structure of brain and other hormonal structure of brain and other hormonal systemssystems
PostnatalPostnatal Right after birth hormonal peaksRight after birth hormonal peaks PubertyPuberty AdulthoodAdulthood Activational systemsActivational systems
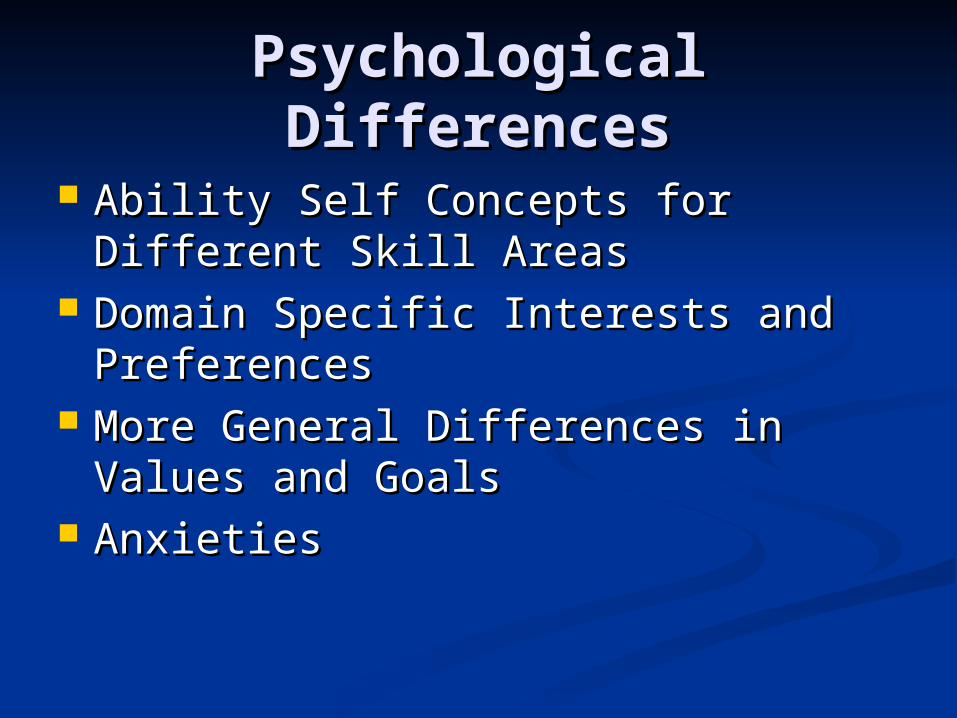
Psychological Psychological DifferencesDifferences
Ability Self Concepts for Different Ability Self Concepts for Different Skill AreasSkill Areas
Domain Specific Interests and Domain Specific Interests and PreferencesPreferences
More General Differences in Values More General Differences in Values and Goalsand Goals
AnxietiesAnxieties
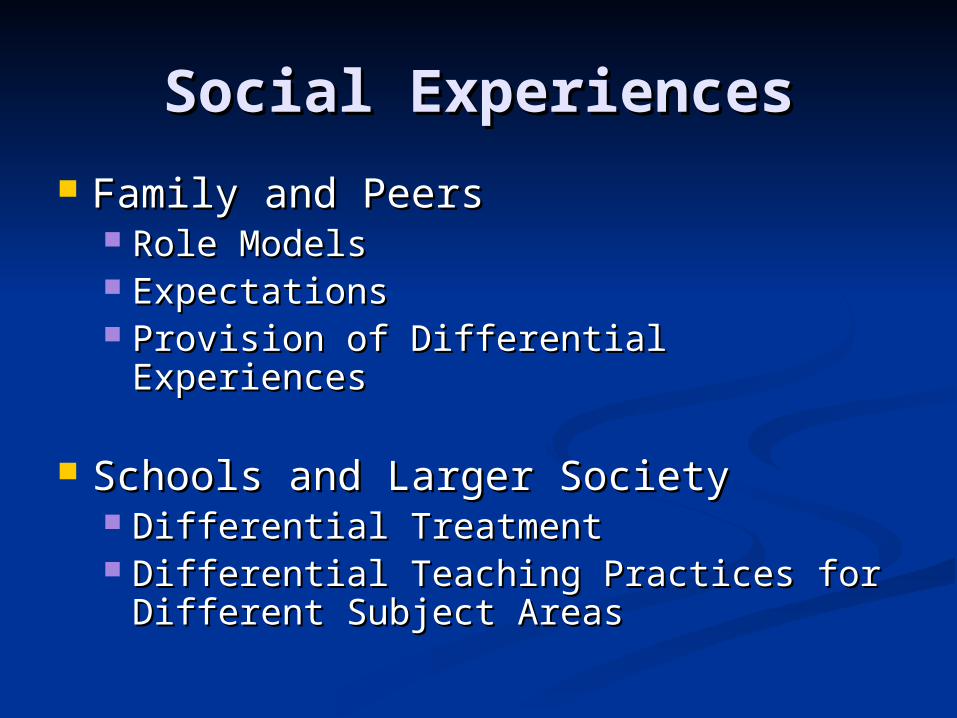
Social ExperiencesSocial Experiences
Family and PeersFamily and Peers Role ModelsRole Models ExpectationsExpectations Provision of Differential ExperiencesProvision of Differential Experiences
Schools and Larger SocietySchools and Larger Society Differential TreatmentDifferential Treatment Differential Teaching Practices for Differential Teaching Practices for
Different Subject AreasDifferent Subject Areas
Very Difficult to Distinguish These Very Difficult to Distinguish These Hypotheses Hypotheses
All are Likely InfluencesAll are Likely Influences
In Addition, People Self-Socialize In Addition, People Self-Socialize into the Culturally Approved Social into the Culturally Approved Social Roles and NichesRoles and Niches
One Way to Frame the One Way to Frame the QuestionQuestion
Do these differences exist even Do these differences exist even amongst a group of individuals who amongst a group of individuals who have sufficient intelligence to choose have sufficient intelligence to choose even the most demanding even the most demanding intellectual careers? For example intellectual careers? For example amongst people who are highly amongst people who are highly gifted in both the verbal and gifted in both the verbal and mathematical areas?mathematical areas?
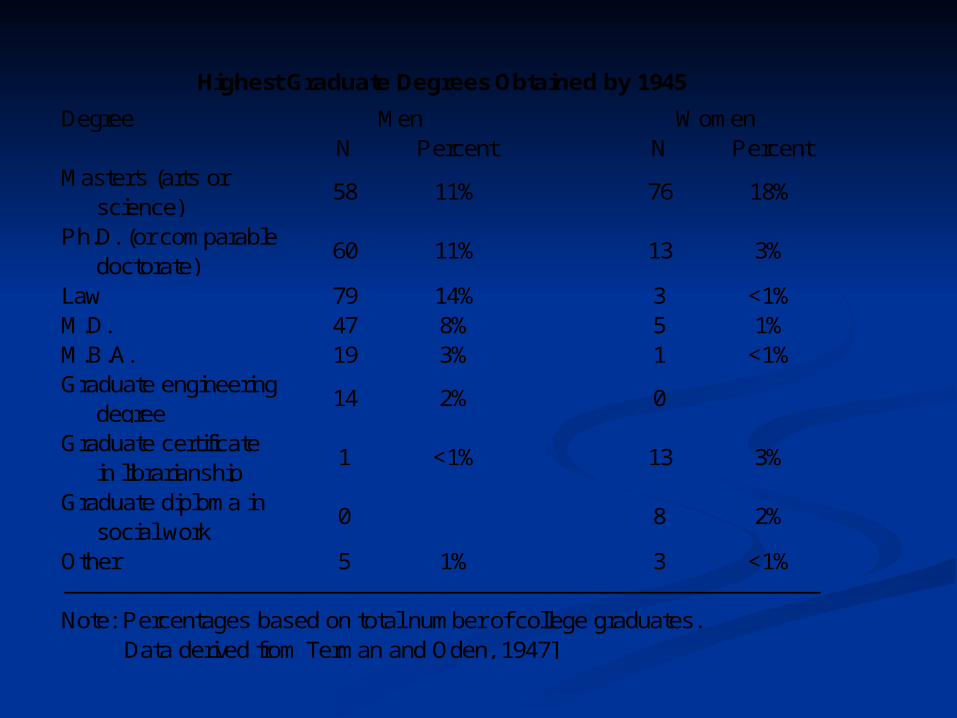
DegreeN Percent N Percent
Master's (arts or science)
58 11% 76 18%
Ph.D. (or comparable doctorate)
60 11% 13 3%
Law 79 14% 3 <1%M.D. 47 8% 5 1%M.B.A. 19 3% 1 <1%Graduate engineering degree
14 2% 0
Graduate certificate in librarianship
1 <1% 13 3%
Graduate diploma in social work
0 8 2%
Other 5 1% 3 <1%
Note: Percentages based on total number of college graduates. Data derived from Terman and Oden, 1947]
Highest Graduate Degrees Obtained by 1945
------------------------------------------------------------------------------------------------------------
Men Women
Current Gifted ResearchCurrent Gifted Research
Similar differences emergeSimilar differences emerge Females now more likely to go on to Females now more likely to go on to
college but are still underrepresented in college but are still underrepresented in the physical sciences and engineeringthe physical sciences and engineering

Another ViewAnother View
Look at the proportion of women at Look at the proportion of women at each step along the pipelineeach step along the pipeline
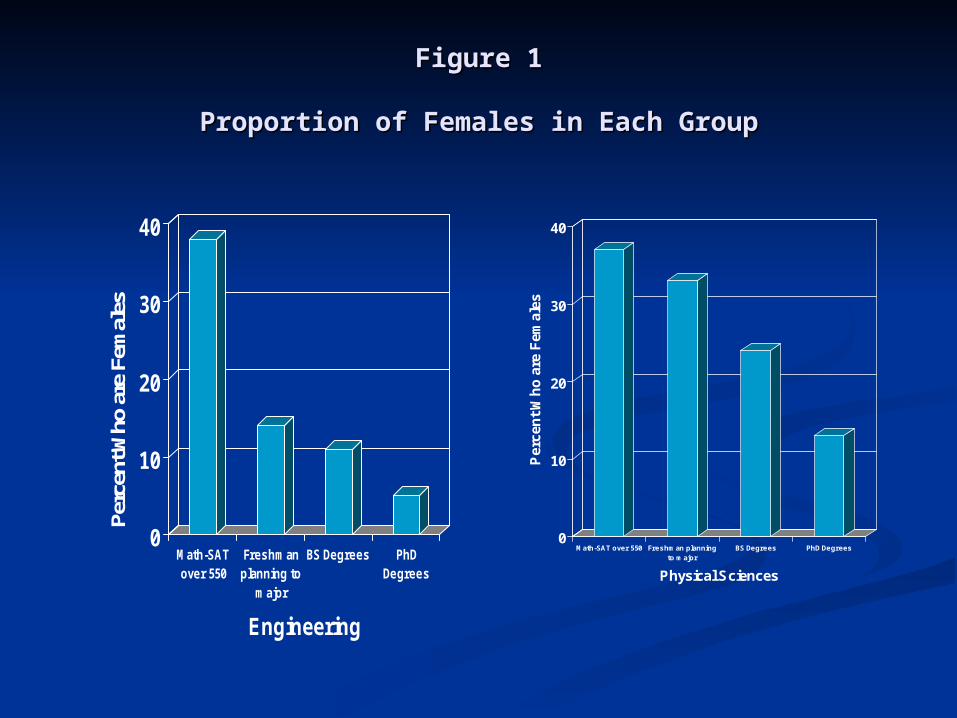
Figure 1Figure 1
Proportion of Females in Each GroupProportion of Females in Each Group
0
10
20
30
40
Per
cen
t W
ho
are
Fem
ales
Math-SAT over 550 Freshman planningto major
BS Degrees PhD Degrees
Physical Sciences
0
10
20
30
40
Perc
ent W
ho a
re F
emal
es
Math-SATover 550
Freshmanplanning to
major
BS Degrees PhDDegrees
Engineering
Final ViewFinal View
Put the question into a larger Put the question into a larger perspective –perspective –
Why does anyone do anything?Why does anyone do anything?
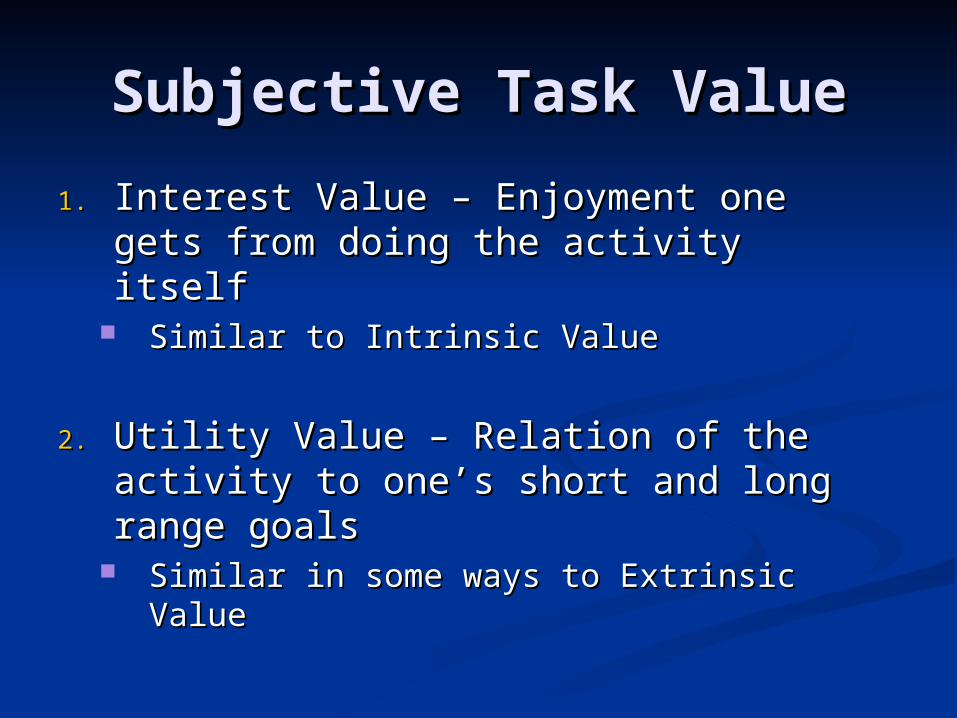
Subjective Task ValueSubjective Task Value
1.1. Interest Value – Enjoyment one Interest Value – Enjoyment one gets from doing the activity itselfgets from doing the activity itself
Similar to Intrinsic ValueSimilar to Intrinsic Value
2.2. Utility Value – Relation of the Utility Value – Relation of the activity to one’s short and long activity to one’s short and long range goalsrange goals
Similar in some ways to Extrinsic Similar in some ways to Extrinsic ValueValue
Subjective Task Value Subjective Task Value ContinuedContinued
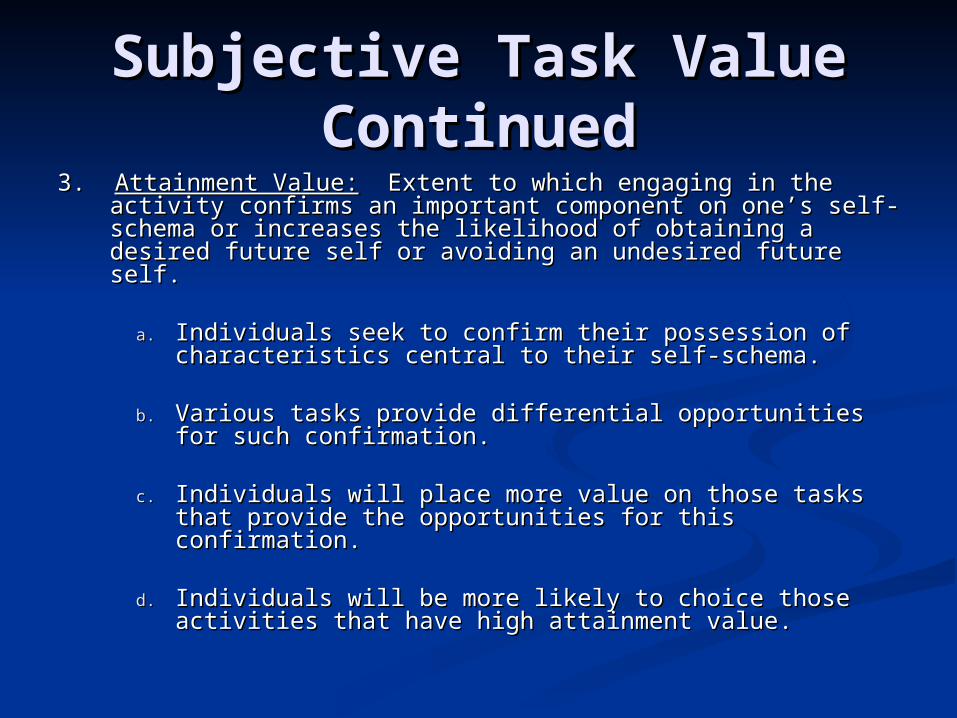
3. 3. Attainment Value:Attainment Value: Extent to which engaging in the Extent to which engaging in the activity confirms an important component on one’s self-activity confirms an important component on one’s self-schema or increases the likelihood of obtaining a desired schema or increases the likelihood of obtaining a desired future self or avoiding an undesired future self.future self or avoiding an undesired future self.
a.a. Individuals seek to confirm their possession of Individuals seek to confirm their possession of characteristics central to their self-schema.characteristics central to their self-schema.
b.b. Various tasks provide differential opportunities for Various tasks provide differential opportunities for such confirmation.such confirmation.
c.c. Individuals will place more value on those tasks Individuals will place more value on those tasks that provide the opportunities for this confirmation.that provide the opportunities for this confirmation.
d.d. Individuals will be more likely to choice those Individuals will be more likely to choice those activities that have high attainment value.activities that have high attainment value.
Subjective Task Value Subjective Task Value ContinuedContinued
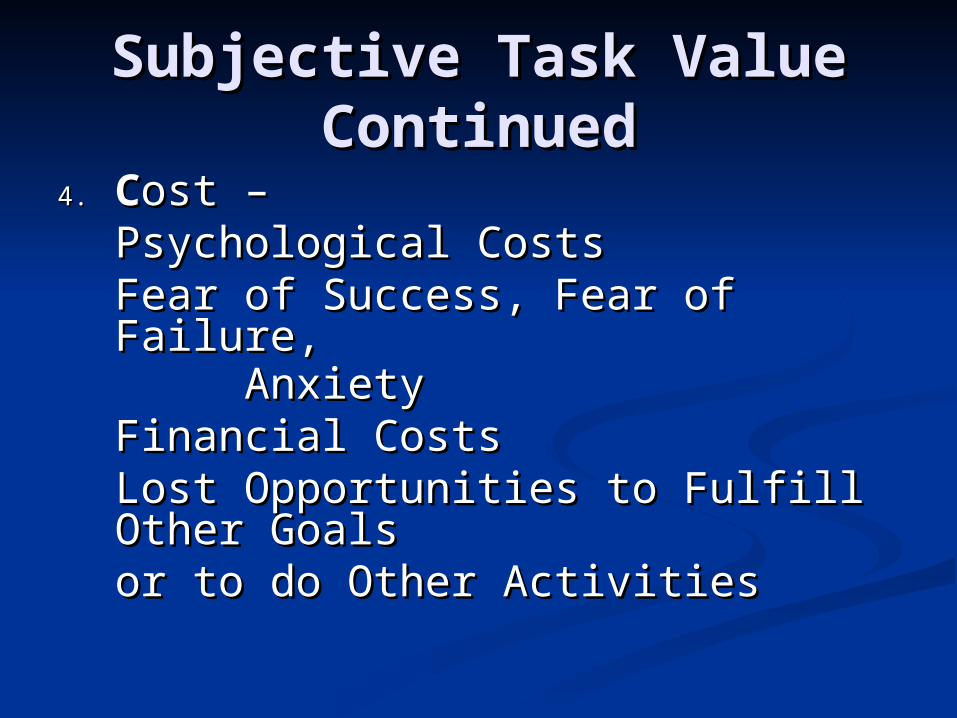
4.4. CCost –ost –Psychological CostsPsychological Costs
Fear of Success, Fear of Fear of Success, Fear of Failure,Failure, AnxietyAnxiety
Financial CostsFinancial CostsLost Opportunities to Fulfill Other Lost Opportunities to Fulfill Other GoalsGoals
or to do Other Activitiesor to do Other Activities
Key Features of ModelKey Features of Model
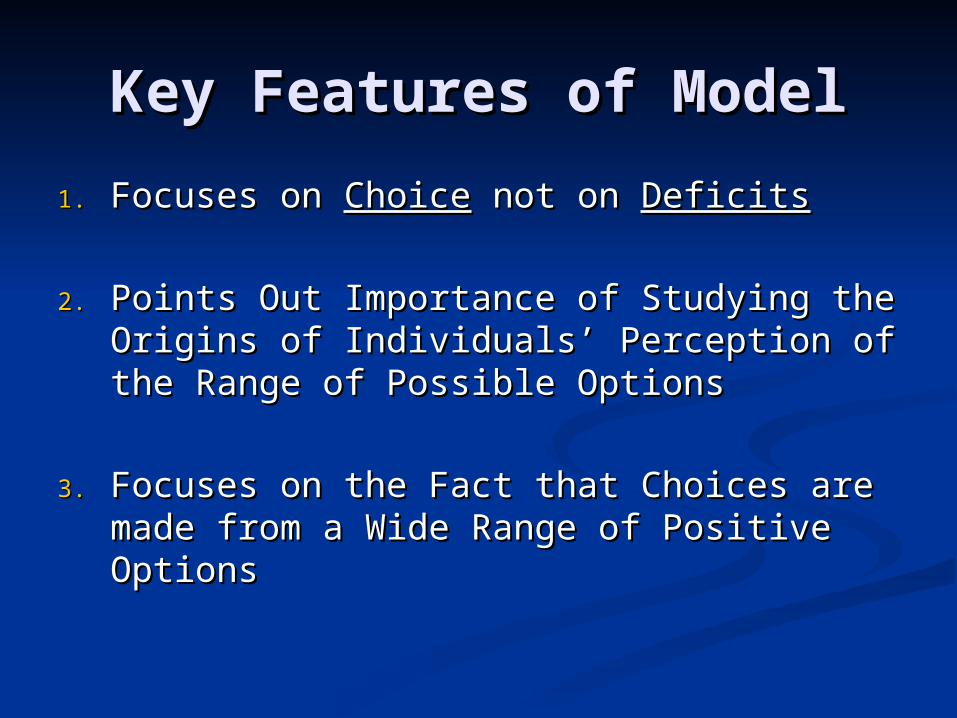
1.1. Focuses on Focuses on ChoiceChoice not on not on DeficitsDeficits
2.2. Points Out Importance of Studying the Points Out Importance of Studying the Origins of Individuals’ Perception of Origins of Individuals’ Perception of the Range of Possible Optionsthe Range of Possible Options
3.3. Focuses on the Fact that Choices are Focuses on the Fact that Choices are made from a Wide Range of Positive made from a Wide Range of Positive OptionsOptions

How Does This Relate To Gender?How Does This Relate To Gender?
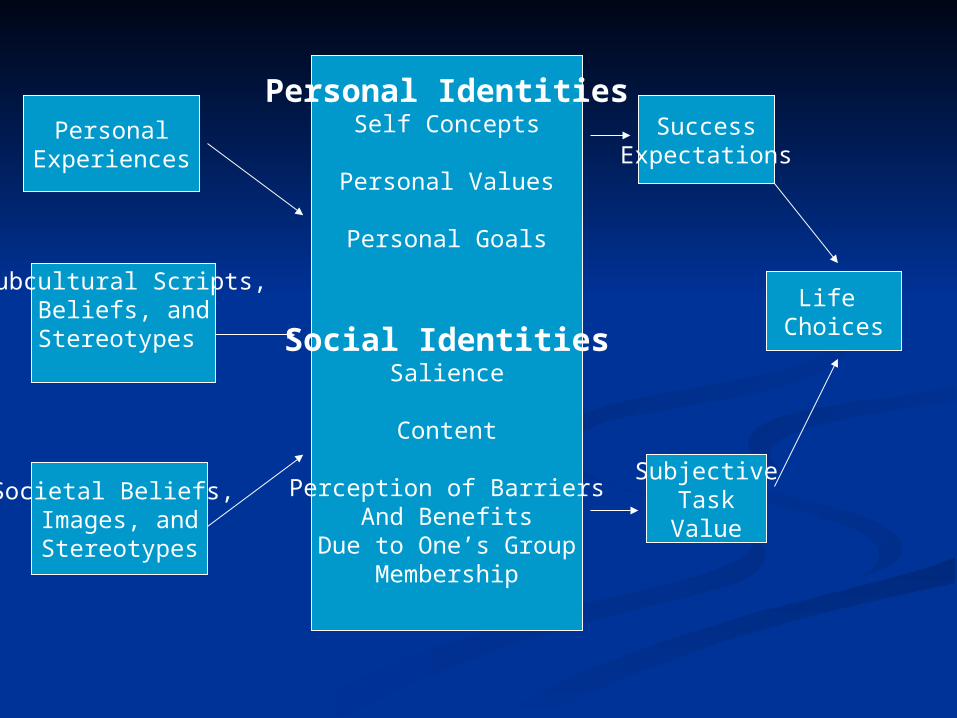
PersonalExperiences
Subcultural Scripts,Beliefs, andStereotypes
Societal Beliefs, Images, andStereotypes
Personal IdentitiesSelf Concepts
Personal Values
Personal Goals
Social IdentitiesSalience
Content
Perception of BarriersAnd Benefits
Due to One’s GroupMembership
SuccessExpectations
SubjectiveTaskValue
Life Choices
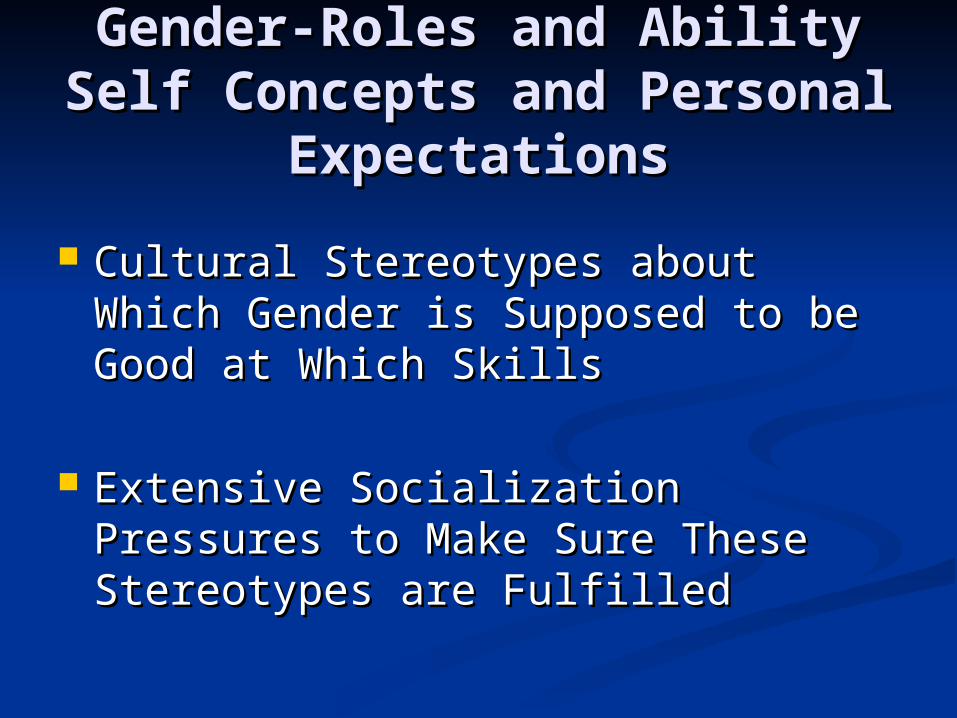
Gender-Roles and Ability Gender-Roles and Ability Self Concepts and Personal Self Concepts and Personal
ExpectationsExpectations
Cultural Stereotypes about Which Cultural Stereotypes about Which Gender is Supposed to be Good at Gender is Supposed to be Good at Which SkillsWhich Skills
Extensive Socialization Pressures to Extensive Socialization Pressures to Make Sure These Stereotypes are Make Sure These Stereotypes are FulfilledFulfilled
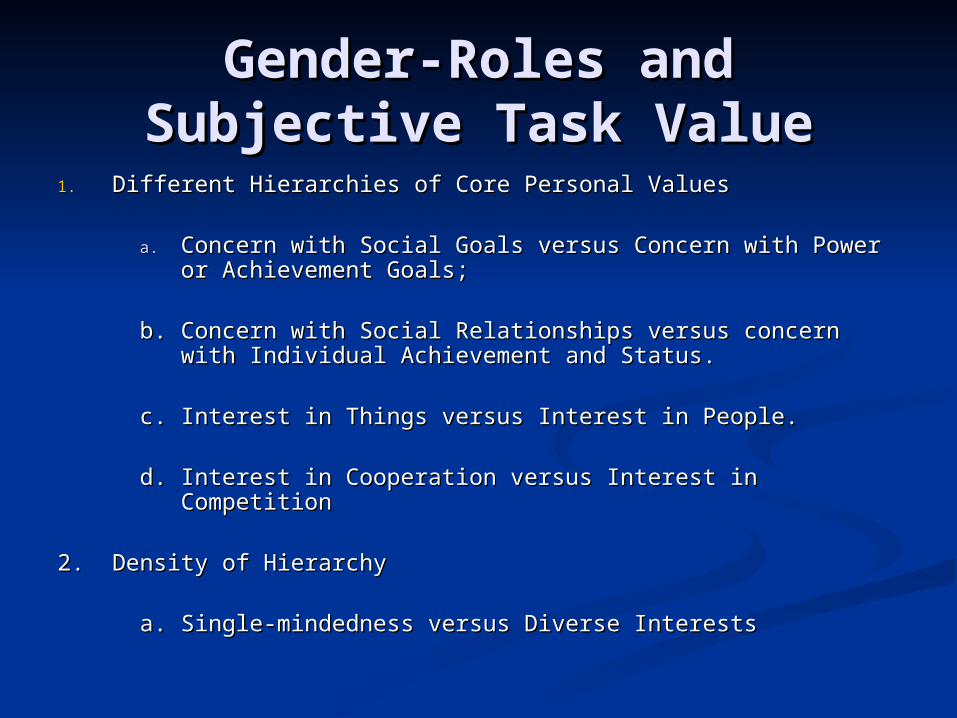
Gender-Roles and Gender-Roles and Subjective Task ValueSubjective Task Value
1.1. Different Hierarchies of Core Personal ValuesDifferent Hierarchies of Core Personal Values
a.a. Concern with Social Goals versus Concern with Power Concern with Social Goals versus Concern with Power or Achievement Goals;or Achievement Goals;
b.b. Concern with Social Relationships versus concern with Concern with Social Relationships versus concern with Individual Achievement and Status.Individual Achievement and Status.
c.c. Interest in Things versus Interest in People.Interest in Things versus Interest in People.
d.d. Interest in Cooperation versus Interest in CompetitionInterest in Cooperation versus Interest in Competition
2.2. Density of HierarchyDensity of Hierarchy
a.a. Single-mindedness versus Diverse InterestsSingle-mindedness versus Diverse Interests
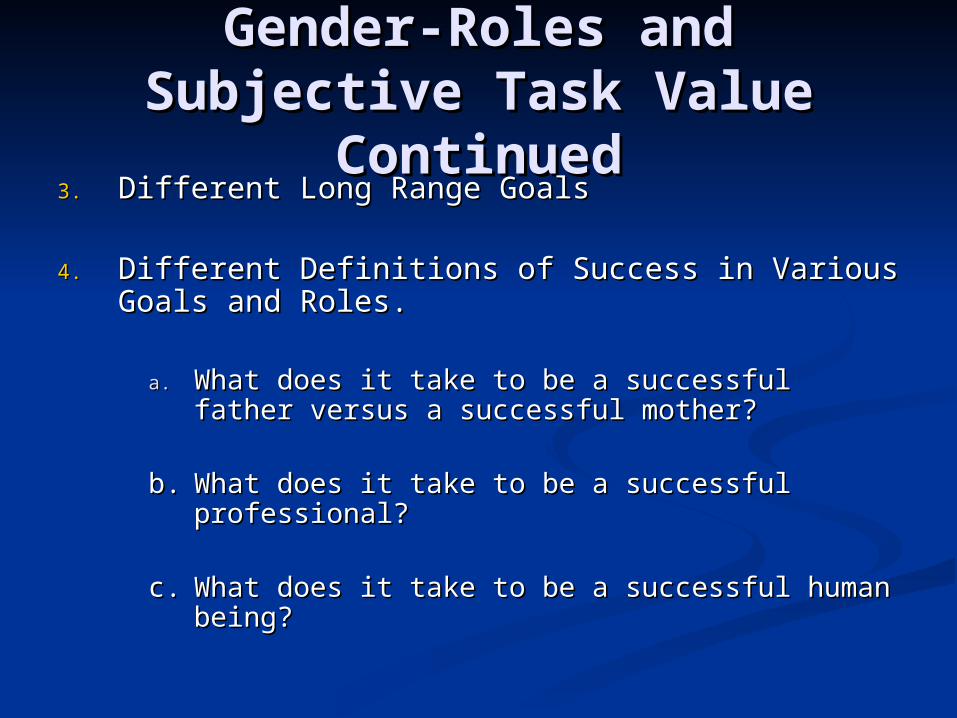
Gender-Roles and Gender-Roles and Subjective Task Value Subjective Task Value
ContinuedContinued3.3. Different Long Range GoalsDifferent Long Range Goals
4.4. Different Definitions of Success in Various Goals Different Definitions of Success in Various Goals and Roles.and Roles.
a.a. What does it take to be a successful father What does it take to be a successful father versus a successful mother?versus a successful mother?
b.b. What does it take to be a successful What does it take to be a successful professional?professional?
c.c. What does it take to be a successful human What does it take to be a successful human being?being?
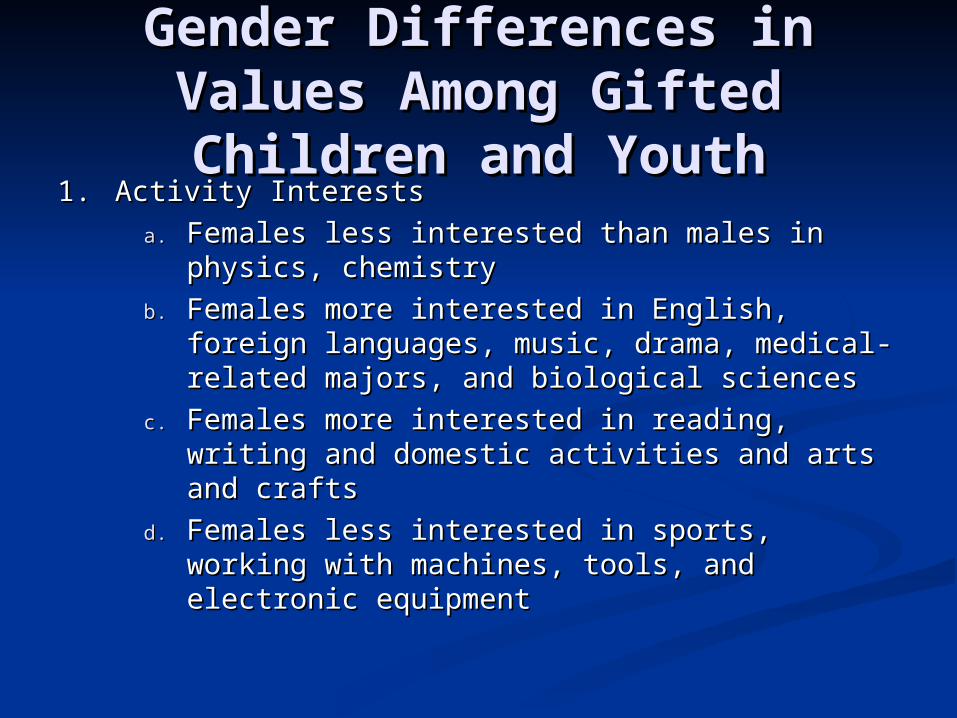
Gender Differences in Gender Differences in Values Among Gifted Values Among Gifted Children and YouthChildren and Youth
1.1. Activity InterestsActivity Interests
a.a. Females less interested than males in Females less interested than males in physics, chemistryphysics, chemistry
b.b. Females more interested in English, foreign Females more interested in English, foreign languages, music, drama, medical-related languages, music, drama, medical-related majors, and biological sciencesmajors, and biological sciences
c.c. Females more interested in reading, writing Females more interested in reading, writing and domestic activities and arts and craftsand domestic activities and arts and crafts
d.d. Females less interested in sports, working Females less interested in sports, working with machines, tools, and electronic with machines, tools, and electronic equipmentequipment
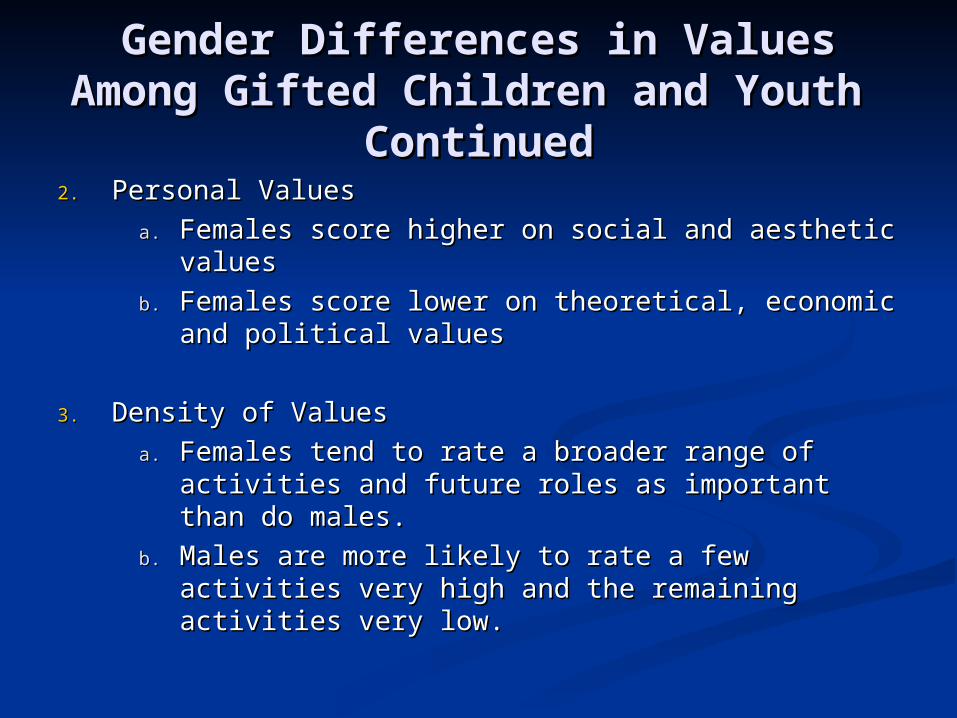
Gender Differences in Values Gender Differences in Values Among Gifted Children and Youth Among Gifted Children and Youth
ContinuedContinued2.2. Personal ValuesPersonal Values
a.a. Females score higher on social and aesthetic Females score higher on social and aesthetic valuesvalues
b.b. Females score lower on theoretical, economic Females score lower on theoretical, economic and political valuesand political values
3.3. Density of ValuesDensity of Values
a.a. Females tend to rate a broader range of Females tend to rate a broader range of activities and future roles as important than do activities and future roles as important than do males.males.
b.b. Males are more likely to rate a few activities Males are more likely to rate a few activities very high and the remaining activities very low.very high and the remaining activities very low.
Michigan Study of Adolescent Life TransitionsMichigan Study of Adolescent Life Transitions(MSALT)(MSALT)
U of M Affiliated Investigators:U of M Affiliated Investigators:
Waves 1-4Waves 1-4Jacque EcclesJacque EcclesCarol MidgleyCarol MidgleyAllan WigfieldAllan Wigfield
Jan JacobsJan JacobsConnie FlanaganConnie Flanagan
Harriet FeldlauferHarriet FeldlauferDavid ReumanDavid ReumanDoug MacIverDoug MacIverDave KlingelDave Klingel
Doris YeeDoris YeeChristy Miller BuchananChristy Miller Buchanan
Waves 5-8Waves 5-8Jacque EcclesJacque EcclesBonnie BarberBonnie BarberLisa ColarossiLisa Colarossi
Deborah JozefowiczDeborah JozefowiczPam FromePam FromeSarah LordSarah LordMina VidaMina Vida
Robert RoeserRobert RoeserLaurie MeschkeLaurie Meschke
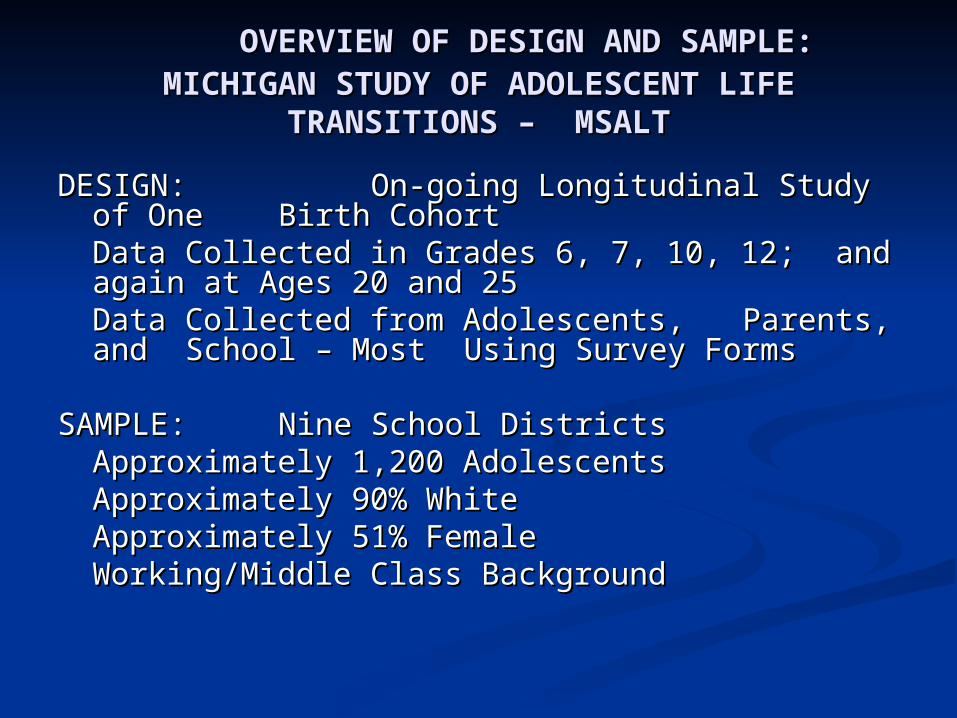
OVERVIEW OF DESIGN AND SAMPLE:OVERVIEW OF DESIGN AND SAMPLE:MICHIGAN STUDY OF ADOLESCENT LIFE MICHIGAN STUDY OF ADOLESCENT LIFE
TRANSITIONS – MSALTTRANSITIONS – MSALT
DESIGN: DESIGN: On-going Longitudinal Study of On-going Longitudinal Study of One One Birth Cohort Birth Cohort
Data Collected in Grades 6, 7, 10, Data Collected in Grades 6, 7, 10, 12; 12; and again at Ages 20 and 25and again at Ages 20 and 25
Data Collected from Adolescents, Data Collected from Adolescents, Parents, and Parents, and School – School –
Most Most Using Survey Using Survey FormsForms
SAMPLE:SAMPLE: Nine School DistrictsNine School DistrictsApproximately 1,200 AdolescentsApproximately 1,200 AdolescentsApproximately 90% WhiteApproximately 90% WhiteApproximately 51% FemaleApproximately 51% FemaleWorking/Middle Class BackgroundWorking/Middle Class Background
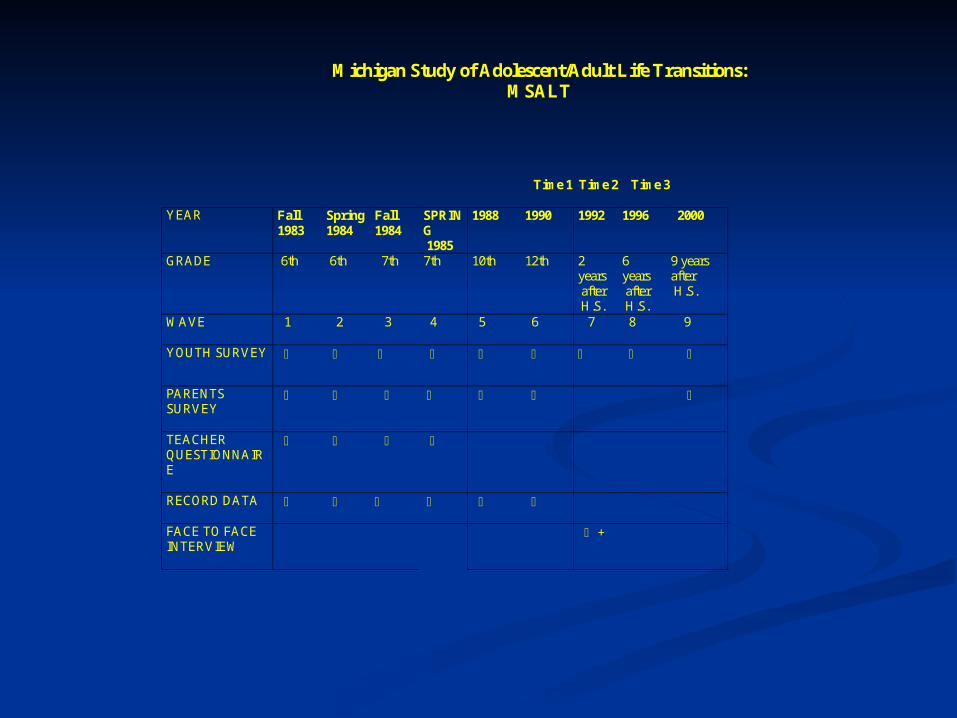
Michigan Study of Adolescent/Adult Life Transitions: MSALT
Time 1 Time 2 Time 3
YEAR Fall 1983
Spring 1984
Fall 1984
SPRING 1985
1988 1990 1992 1996 2000
GRADE 6th 6th 7th 7th 10th 12th 2 years after H.S.
6 years after H.S.
9 years after H.S.
WAVE
1 2 3 4 5 6 7 8 9
YOUTH SURVEY
PARENTS SURVEY
TEACHER QUESTIONNAIRE
RECORD DATA
FACE TO FACE INTERVIEW
+
MSALT Sample General MSALT Sample General CharacteristicsCharacteristics
School based sample drawn from 10 School based sample drawn from 10 school districts in the small city school districts in the small city communities surrounding Detroit.communities surrounding Detroit.
Predominantly White, working and middle Predominantly White, working and middle class familiesclass families
Approximately 50% of sample of youth Approximately 50% of sample of youth went on to some form of tertiary went on to some form of tertiary educationeducation
Downsizing of automobile industry caused Downsizing of automobile industry caused major economic problems while the youth major economic problems while the youth were in secondary schoolwere in secondary school
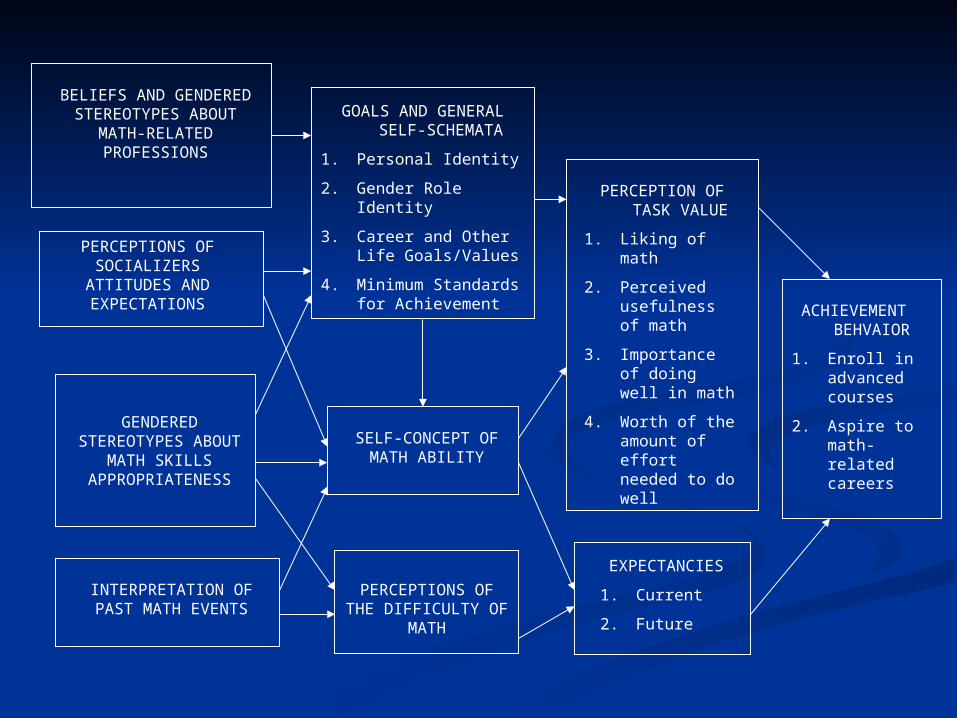
BELIEFS AND GENDERED
STEREOTYPES ABOUT MATH-RELATED PROFESSIONS
PERCEPTIONS OF SOCIALIZERS
ATTITUDES AND EXPECTATIONS
GENDERED STEREOTYPES
ABOUT MATH SKILLS APPROPRIATENESS
INTERPRETATION OF PAST MATH EVENTS
GOALS AND GENERAL SELF-SCHEMATA
1. Personal Identity
2. Gender Role Identity
3. Career and Other Life Goals/Values
4. Minimum Standards for Achievement
SELF-CONCEPT OF MATH ABILITY
PERCEPTIONS OF THE DIFFICULTY OF
MATH
PERCEPTION OF TASK VALUE
1. Liking of math
2. Perceived usefulness of math
3. Importance of doing well in math
4. Worth of the amount of effort needed to do well
EXPECTANCIES
1. Current
2. Future
ACHIEVEMENT BEHVAIOR
1. Enroll in advanced courses
2. Aspire to math-related careers
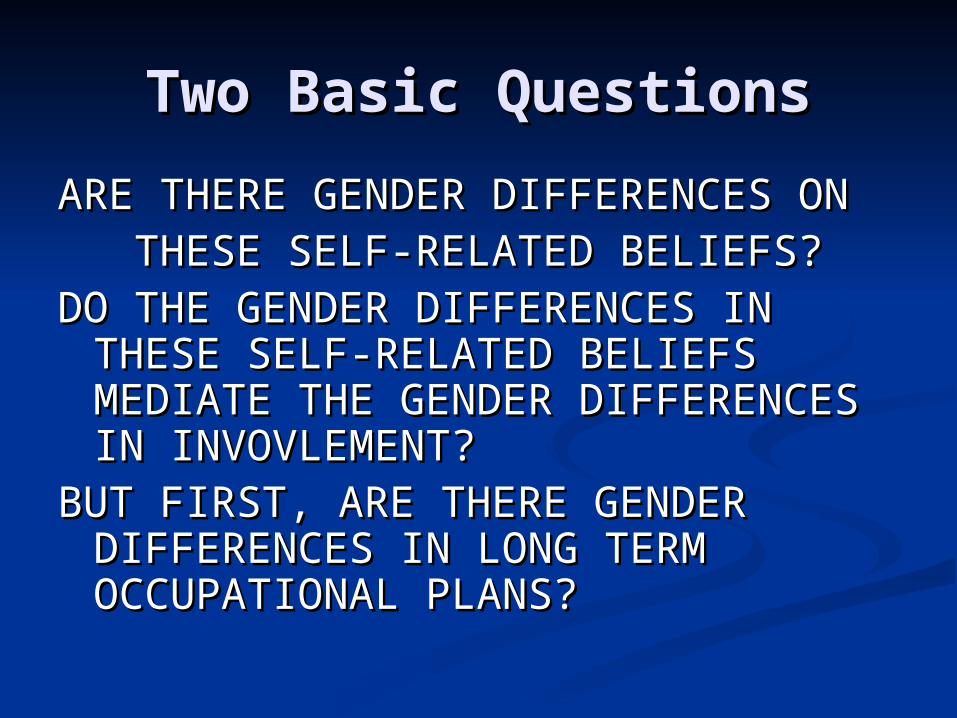
Two Basic QuestionsTwo Basic Questions
ARE THERE GENDER DIFFERENCES ARE THERE GENDER DIFFERENCES ON ON
THESE SELF-RELATED BELIEFS? THESE SELF-RELATED BELIEFS? DO THE GENDER DIFFERENCES IN DO THE GENDER DIFFERENCES IN
THESE SELF-RELATED BELIEFS THESE SELF-RELATED BELIEFS MEDIATE THE GENDER MEDIATE THE GENDER DIFFERENCES IN INVOVLEMENT?DIFFERENCES IN INVOVLEMENT?
BUT FIRST, ARE THERE GENDER BUT FIRST, ARE THERE GENDER DIFFERENCES IN LONG TERM DIFFERENCES IN LONG TERM OCCUPATIONAL PLANS?OCCUPATIONAL PLANS?
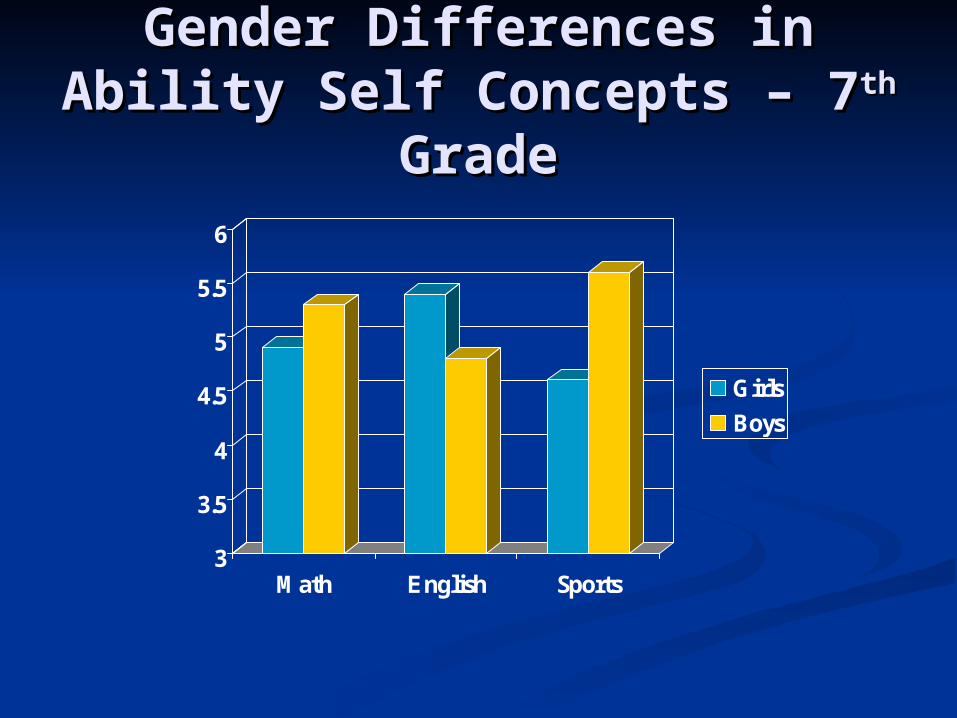
Gender Differences in Gender Differences in Ability Self Concepts – 7Ability Self Concepts – 7thth
GradeGrade
3
3.5
4
4.5
5
5.5
6
Math English Sports
GirlsBoys
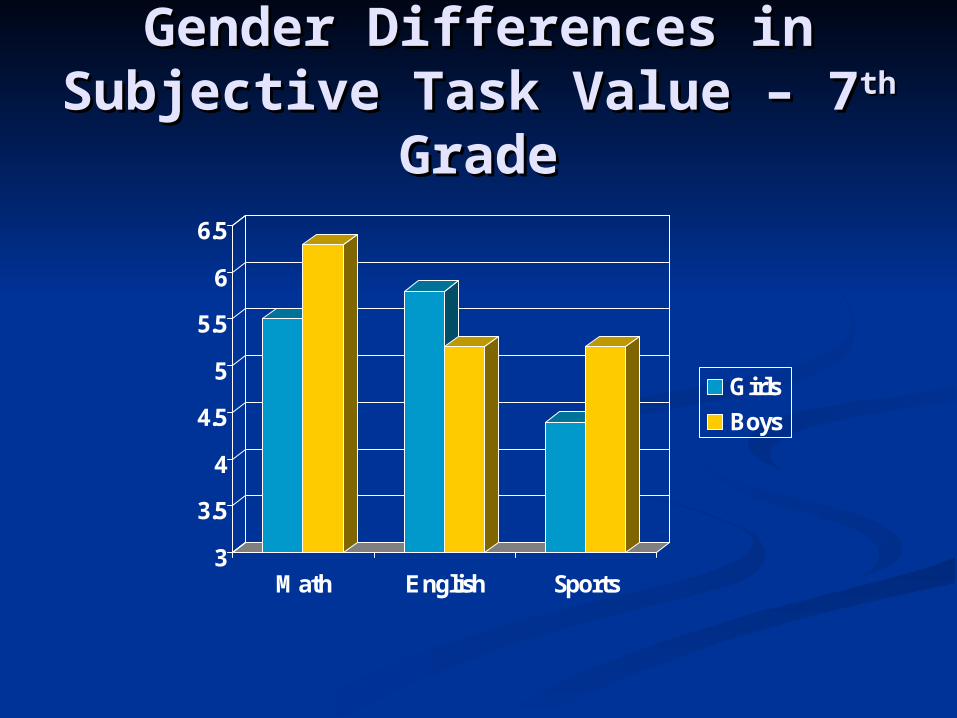
Gender Differences in Gender Differences in Subjective Task Value – 7Subjective Task Value – 7thth
GradeGrade
3
3.5
4
4.5
5
5.5
6
6.5
Math English Sports
GirlsBoys
How Young Do These How Young Do These Differences EmergeDifferences Emerge
Childhood and Beyond StudyChildhood and Beyond Study Similar MeasuresSimilar Measures Similar Population in Southeastern Similar Population in Southeastern
Michigan Michigan 4 Middle Class School Districts4 Middle Class School Districts Primarily WhitePrimarily White 3 Cohorts Beginning in 13 Cohorts Beginning in 1stst, 2, 2ndnd, and 4, and 4thth
gradesgrades Followed Longitudinally until age 22Followed Longitudinally until age 22
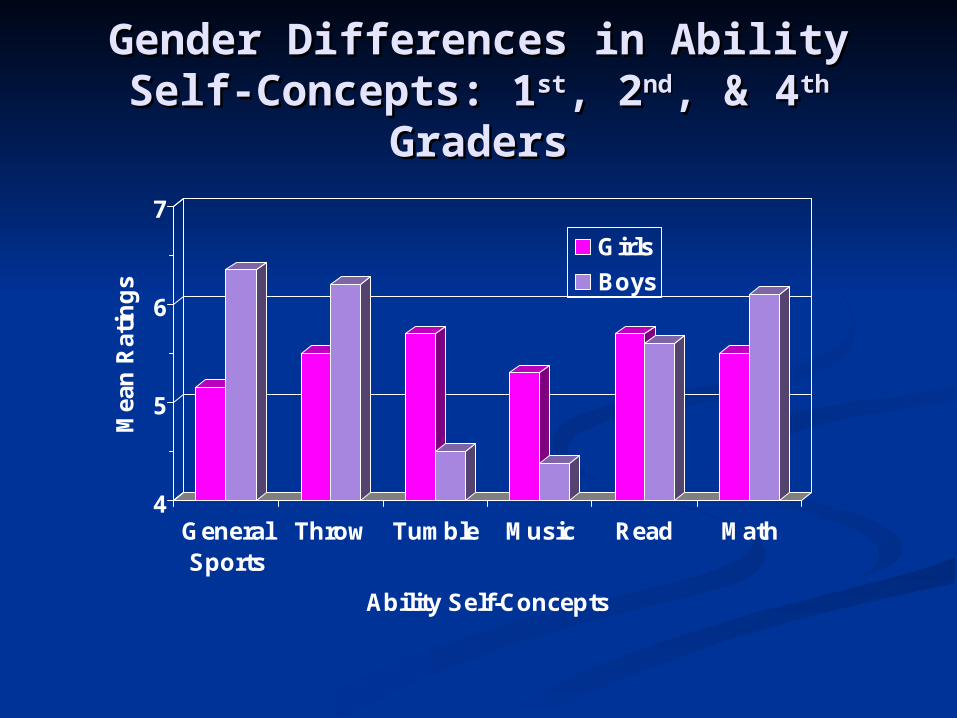
Gender Differences in Ability Self-Gender Differences in Ability Self-Concepts: 1Concepts: 1stst, 2, 2ndnd, & 4, & 4thth Graders Graders
4
5
6
7
Mea
n R
atin
gs
GeneralSports
Throw Tumble Music Read Math
Ability Self-Concepts
Girls
Boys
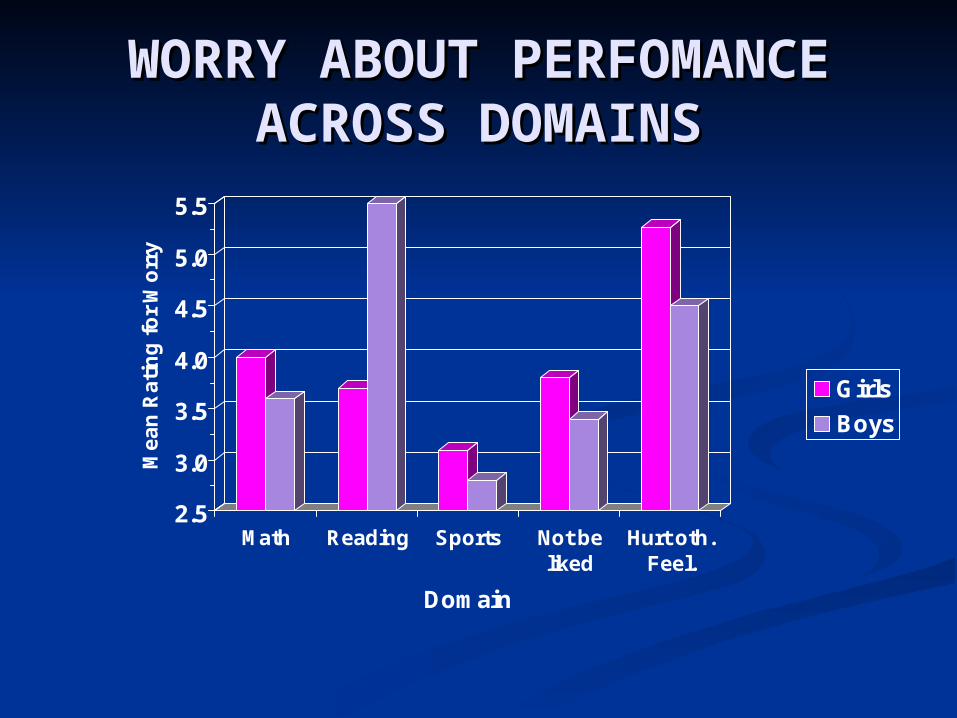
WORRY ABOUT WORRY ABOUT PERFOMANCE ACROSS PERFOMANCE ACROSS
DOMAINSDOMAINS
2.5
3.0
3.5
4.0
4.5
5.0
5.5
Me
an
Ra
tin
g f
or
Wo
rry
Math Reading Sports Not beliked
Hurt oth.Feel.
Domain
Girls
Boys
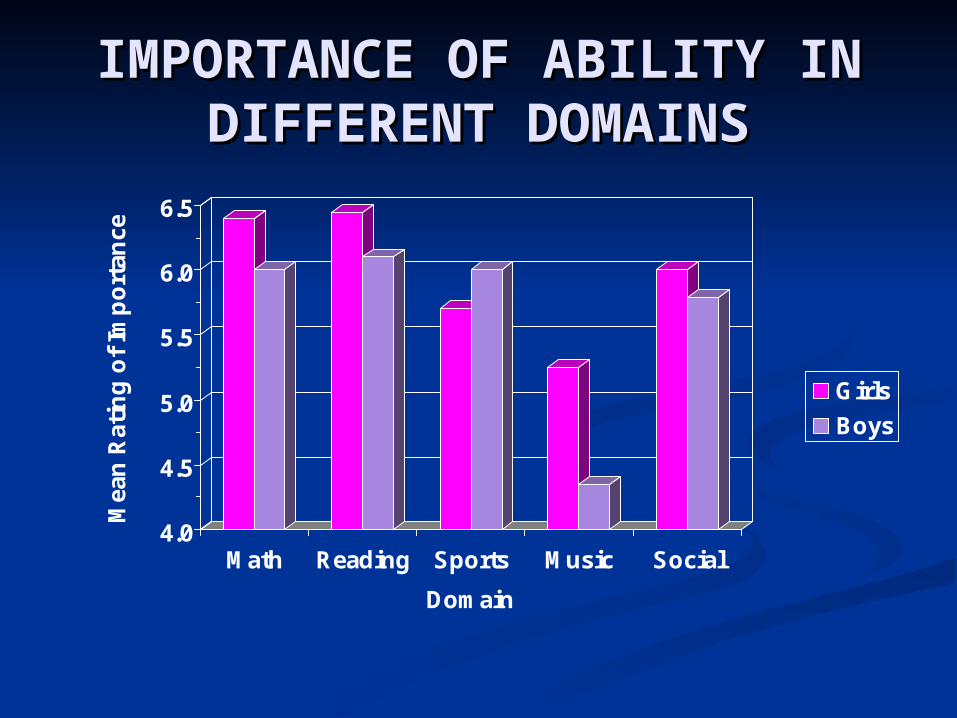
IMPORTANCE OF ABILITY IMPORTANCE OF ABILITY IN DIFFERENT DOMAINSIN DIFFERENT DOMAINS
4.0
4.5
5.0
5.5
6.0
6.5
Mea
n R
atin
g o
f Im
po
rtan
ce
Math Reading Sports Music Social
Domain
Girls
Boys
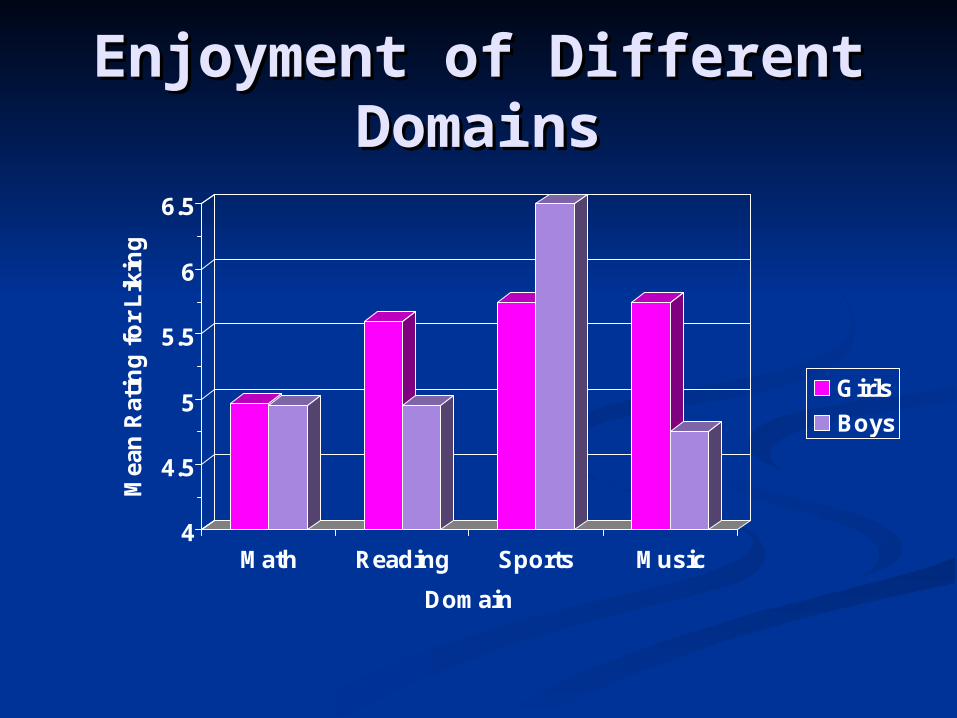
Enjoyment of Different Enjoyment of Different DomainsDomains
4
4.5
5
5.5
6
6.5
Mea
n R
atin
g f
or
Lik
ing
Math Reading Sports Music
Domain
Girls
Boys
ConclusionConclusion
Gender Differences Occur across Gender Differences Occur across Several Domains for Both Ability Self Several Domains for Both Ability Self Concepts and Subjective Task ValuesConcepts and Subjective Task Values
Gender Differences Emerge Quite Gender Differences Emerge Quite YoungYoung
Do These Differences Mediate Gender Do These Differences Mediate Gender Differences in Course Taking and Differences in Course Taking and Activity Involvement?Activity Involvement?
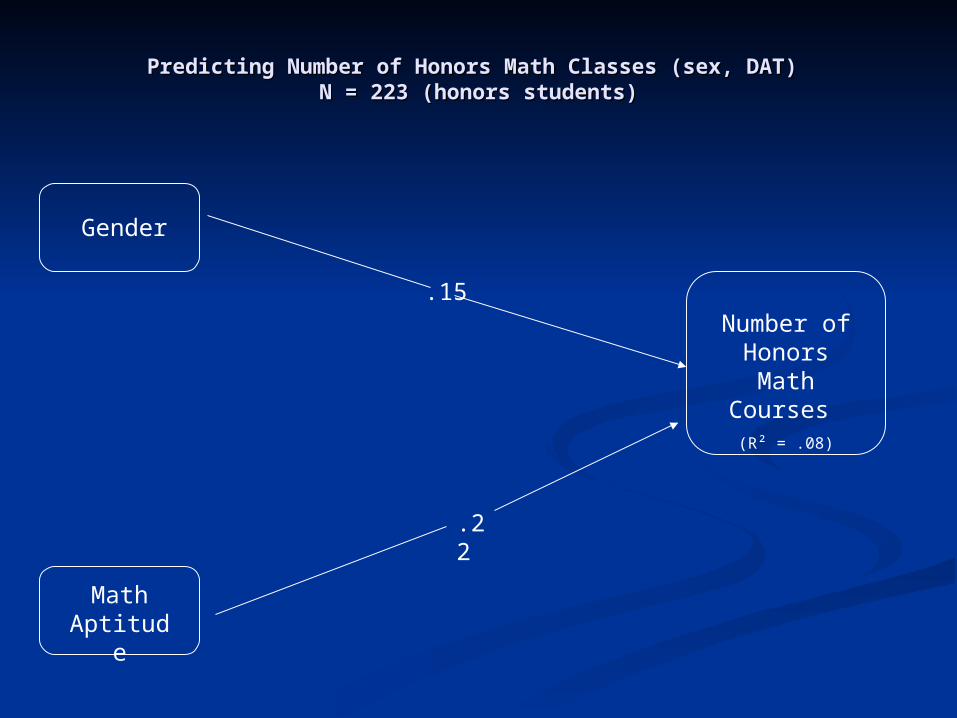
Predicting Number of Honors Math Classes (sex, DAT) Predicting Number of Honors Math Classes (sex, DAT) N = 223 (honors students)N = 223 (honors students)
Gender
Math Aptitude
Number of Honors Math
Courses (R² = .08)
.15
.22
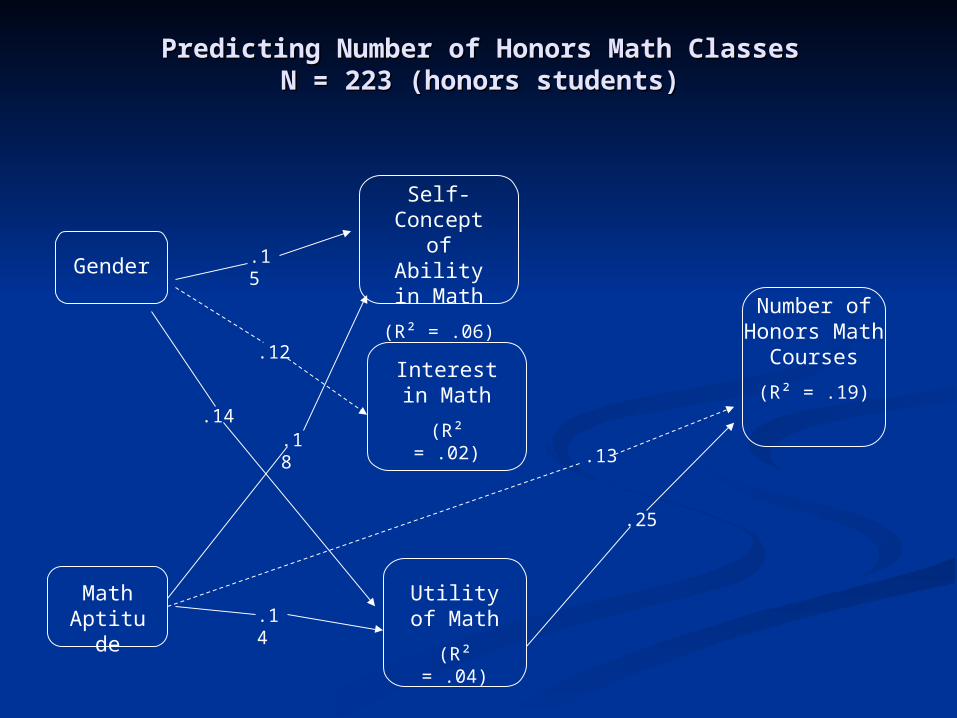
Predicting Number of Honors Math ClassesPredicting Number of Honors Math ClassesN = 223 (honors students)N = 223 (honors students)
Gender
Math Aptitude
Self-Concept of Ability in
Math
(R² = .06)
Interest in Math
(R² = .02)
Utility of Math
(R² = .04)
Number of Honors Math
Courses
(R² = .19)
.15
.12
.14.18
.14
.13
.25
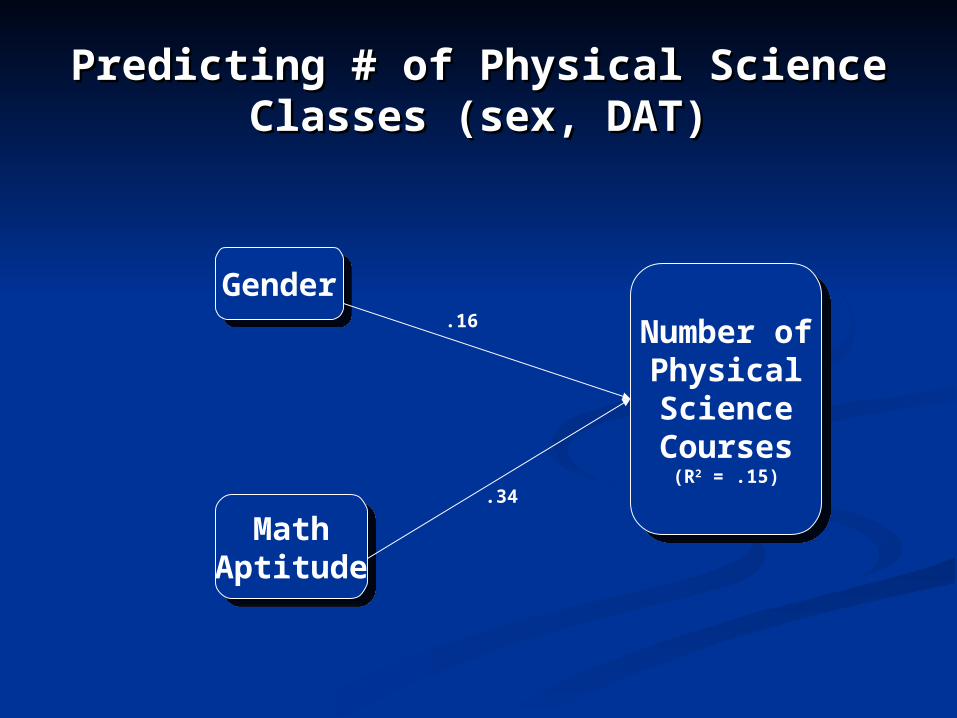
Predicting # of Physical Science Predicting # of Physical Science Classes (sex, DAT)Classes (sex, DAT)
Number ofPhysicalScienceCourses
(R2 = .15)
Number ofPhysicalScienceCourses
(R2 = .15)
GenderGender
MathAptitude
MathAptitude
.34
.16
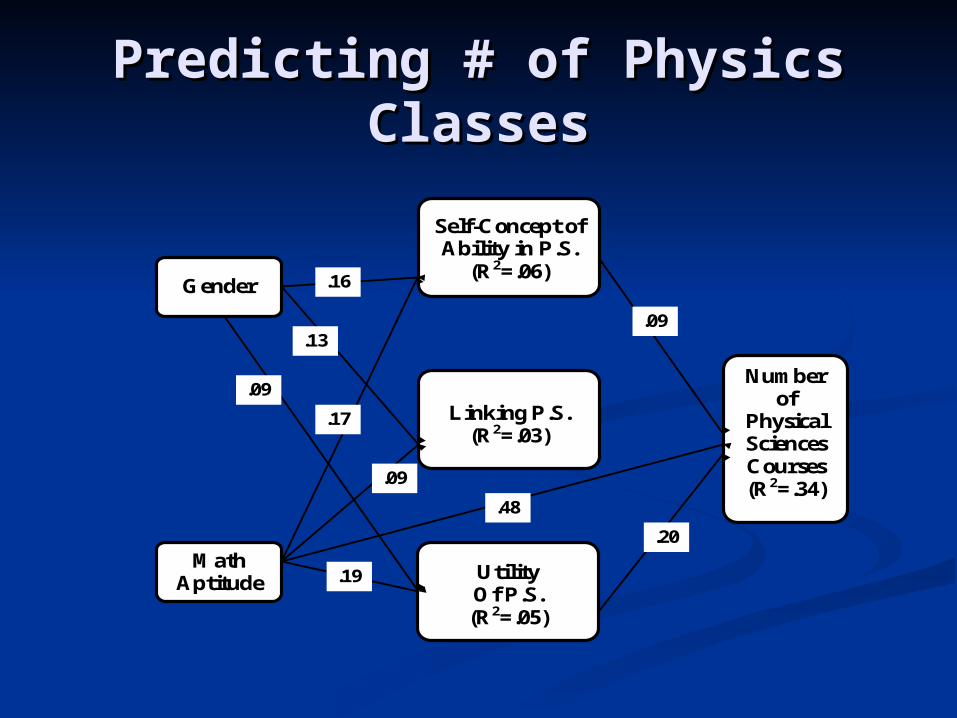
Predicting # of Physics Predicting # of Physics ClassesClasses
Gender
Math Aptitude
Utility Of P.S. (R2=.05)
Linking P.S.
(R2=.03)
Self-Concept of Ability in P.S.
(R2=.06)
Number of
Physical Sciences Courses (R2=.34)
.20
.19
.48
.09
.09
.17
.13
.16
.09
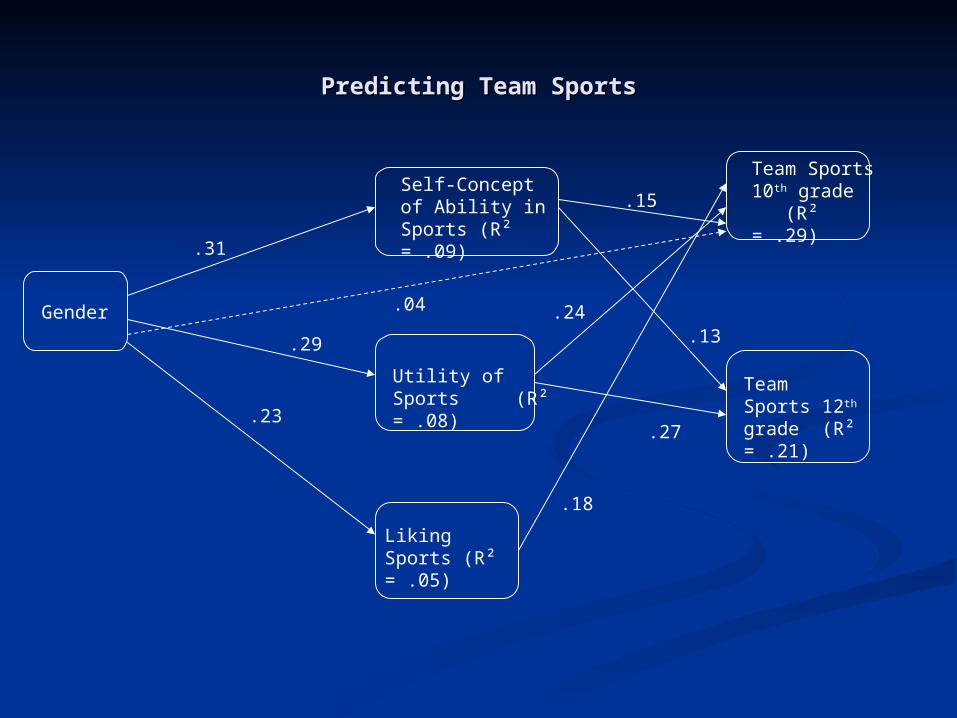
Predicting Team SportsPredicting Team Sports
Gender
Self-Concept of Ability in Sports (R² = .09)
Utility of Sports (R² = .08)
Liking Sports (R² = .05)
Team Sports 10th grade (R² = .29)
Team Sports 12th grade (R² = .21)
.31
.04
.29
.23
.15
.13.24
.27
.18
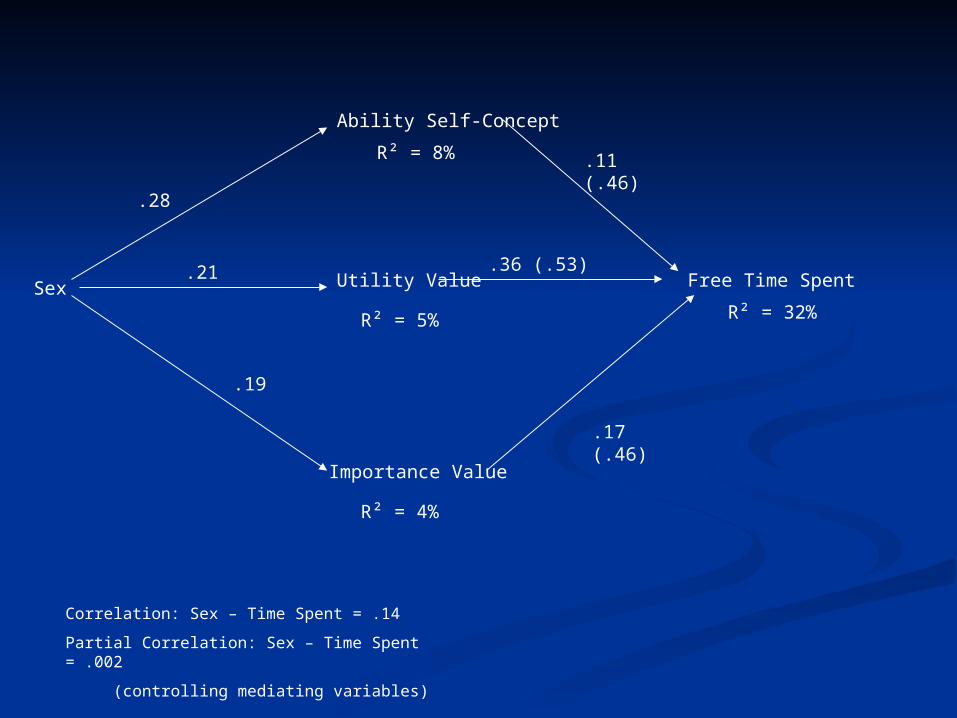
Ability Self-Concept
Sex Utility Value
Importance Value
Free Time Spent
.28
.21
.19
.11 (.46)
.36 (.53)
.17 (.46)
R² = 8%
R² = 5%
R² = 4%
R² = 32%
Correlation: Sex – Time Spent = .14
Partial Correlation: Sex – Time Spent = .002
(controlling mediating variables)
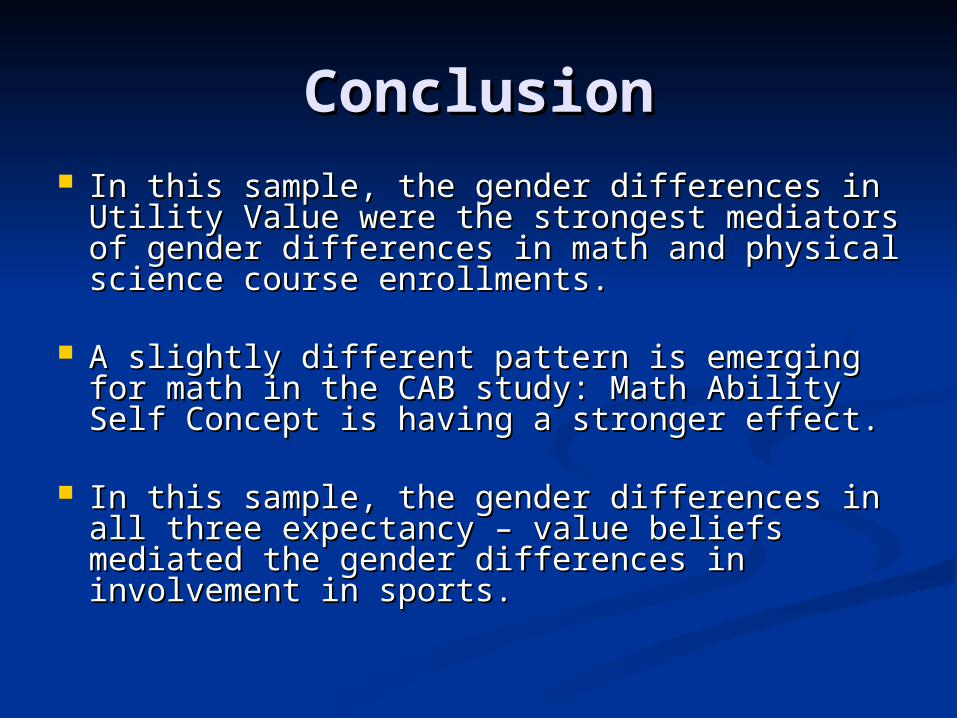
ConclusionConclusion In this sample, the gender differences in In this sample, the gender differences in
Utility Value were the strongest mediators Utility Value were the strongest mediators of gender differences in math and physical of gender differences in math and physical science course enrollments.science course enrollments.
A slightly different pattern is emerging for A slightly different pattern is emerging for math in the CAB study: Math Ability Self math in the CAB study: Math Ability Self Concept is having a stronger effect. Concept is having a stronger effect.
In this sample, the gender differences in all In this sample, the gender differences in all three expectancy – value beliefs mediated three expectancy – value beliefs mediated the gender differences in involvement in the gender differences in involvement in sports.sports.

What about College Course What about College Course Choices?Choices?
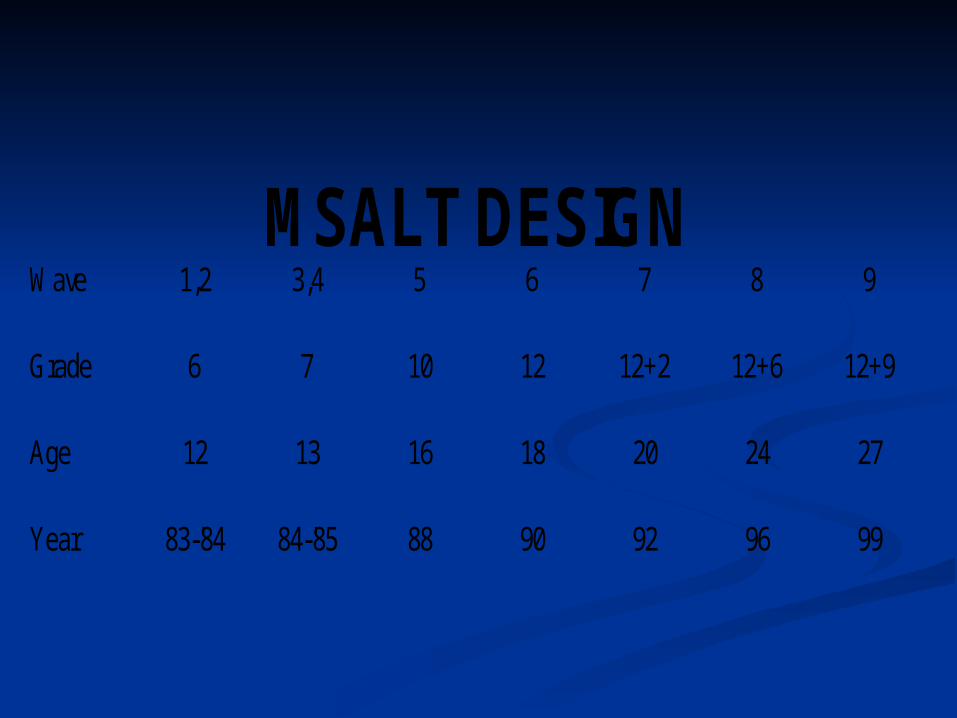
Wave 1,2 3,4 5 6 7 8 9
Grade 6 7 10 12 12+2 12+6 12+9
Age 12 13 16 18 20 24 27
Year 83-'84 84-'85 88 90 92 96 99
MSALT DESIGN
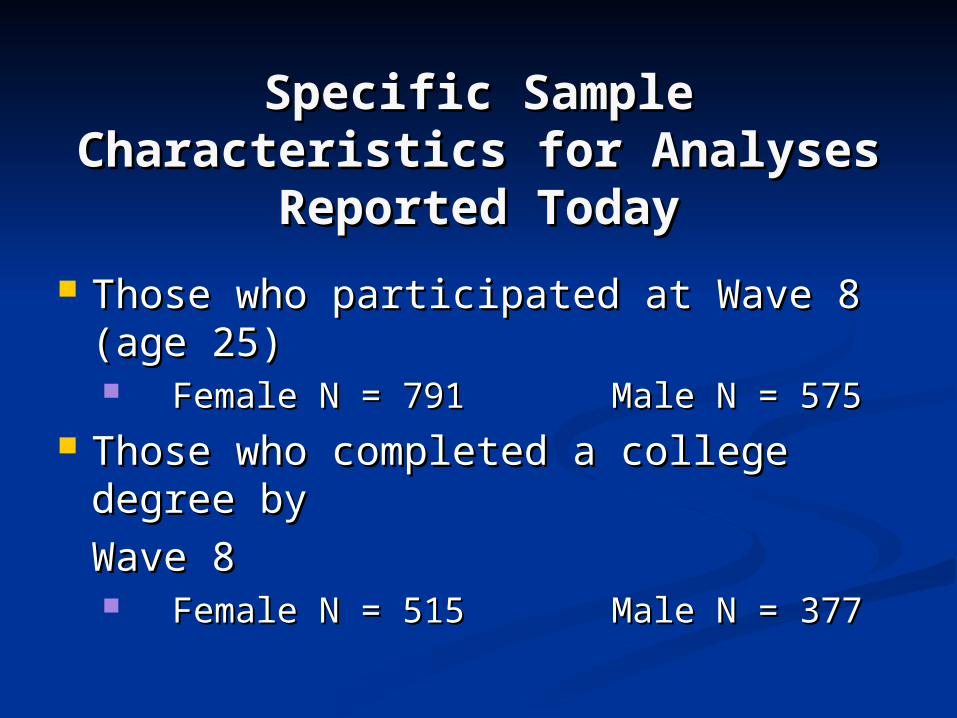
Specific Sample Specific Sample Characteristics for Analyses Characteristics for Analyses
Reported TodayReported Today
Those who participated at Wave 8 Those who participated at Wave 8 (age 25)(age 25) Female N = 791 Male N = 575Female N = 791 Male N = 575
Those who completed a college Those who completed a college degree bydegree by
Wave 8Wave 8 Female N = 515 Male N = 377Female N = 515 Male N = 377
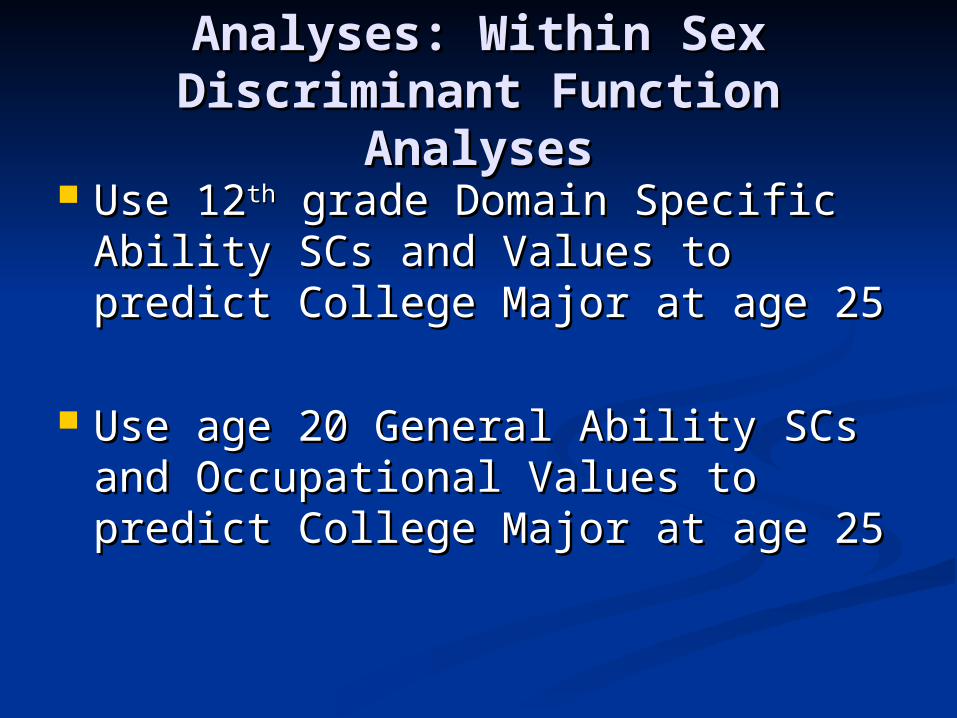
Analyses: Within SexAnalyses: Within SexDiscriminant Function Discriminant Function
AnalysesAnalyses Use 12Use 12thth grade Domain Specific grade Domain Specific
Ability SCs and Values to predict Ability SCs and Values to predict College Major at age 25College Major at age 25
Use age 20 General Ability SCs and Use age 20 General Ability SCs and Occupational Values to predict Occupational Values to predict College Major at age 25College Major at age 25
Analyses 2: Between SexAnalyses 2: Between Sex
Logistic regression to test for Logistic regression to test for mediators of sex differences in mediators of sex differences in college Math/Engineering/Physical college Math/Engineering/Physical Science majorsScience majors
Time 1 Measures: 12Time 1 Measures: 12thth GradeGrade
Math/Physical Science Self-Math/Physical Science Self-Concept of AbilityConcept of Ability
Math/PS Value and UsefulnessMath/PS Value and Usefulness Biology Self-Concept of AbilityBiology Self-Concept of Ability Biology Value and UsefulnessBiology Value and Usefulness English Self-Concept of AbilityEnglish Self-Concept of Ability English Value and UsefulnessEnglish Value and Usefulness High School Grade Point AverageHigh School Grade Point Average
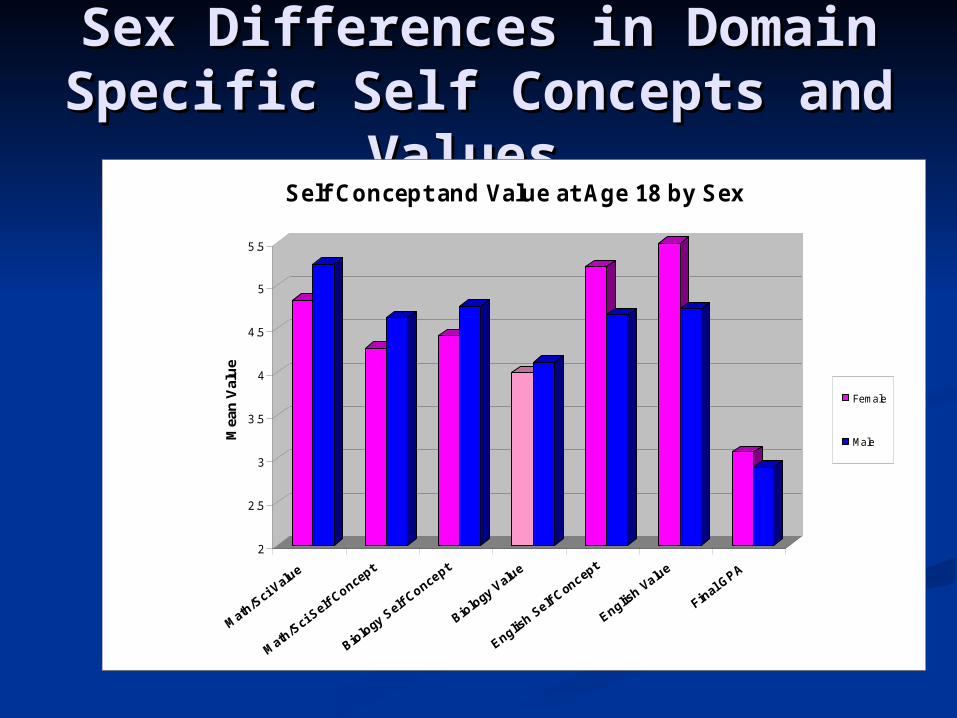
Sex Differences in Domain Sex Differences in Domain Specific Self Concepts and Specific Self Concepts and
Values Values
2
2.5
3
3.5
4
4.5
5
5.5M
ean
Val
ue
Self Concept and Value at Age 18 by Sex
Female
Male
Time 2 Measures: Age 20Time 2 Measures: Age 20Ability-RelatedAbility-Related
Math/Science General Ability Self Math/Science General Ability Self ConceptConcept Efficacy for jobs requiring math/scienceEfficacy for jobs requiring math/science
Intellectual Ability Self ConceptIntellectual Ability Self Concept Relative ability in logical and analytical Relative ability in logical and analytical
thinkingthinking High School Grade Point AverageHigh School Grade Point Average
Time 2 Measures: Time 2 Measures: Occupational ValuesOccupational Values
Job FlexibilityJob Flexibility Does not require being away from Does not require being away from
family family Mental ChallengeMental Challenge
Opportunity to be creative and learn Opportunity to be creative and learn new thingsnew things
Working with PeopleWorking with People Working with othersWorking with others
AutonomyAutonomy Own BossOwn Boss
Time 2 Measures: Comfort Time 2 Measures: Comfort with Job Characteristicswith Job Characteristics
Business Orientation: Comfort with Business Orientation: Comfort with tasks associated with being a tasks associated with being a supervisorsupervisor
People Orientation: Comfort working People Orientation: Comfort working with people and childrenwith people and children
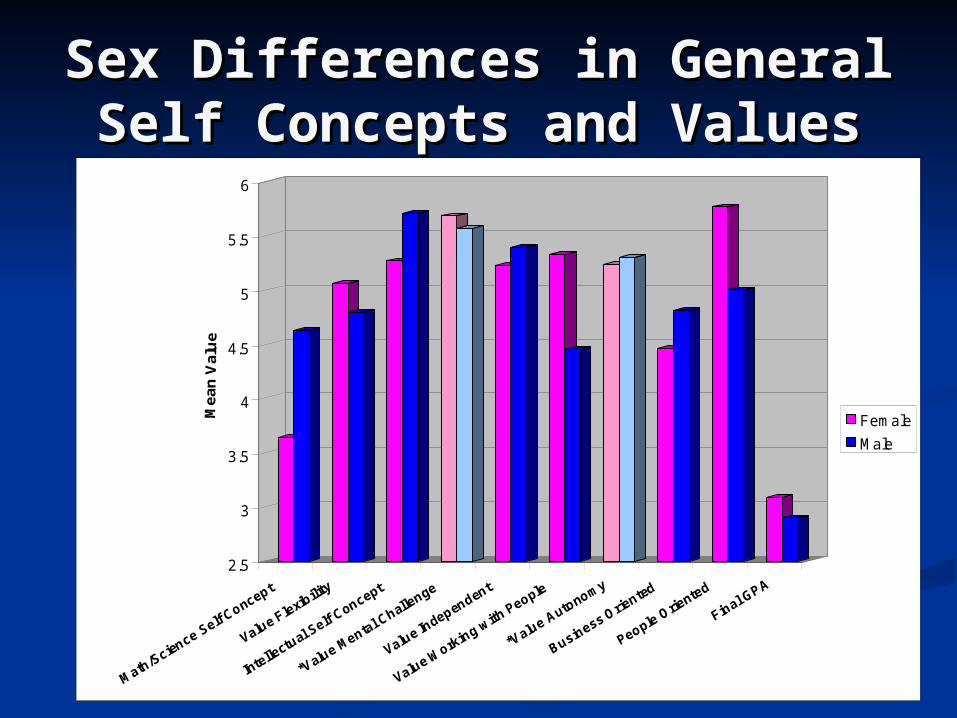
Sex Differences in General Sex Differences in General Self Concepts and ValuesSelf Concepts and Values
2.5
3
3.5
4
4.5
5
5.5
6
Me
an
Va
lue
Female
Male
Time 3 Measures: Age 25Time 3 Measures: Age 25
Final College MajorFinal College Major
Occupation at Age 25: Coded into Occupation at Age 25: Coded into Global Categories based on Census Global Categories based on Census Classification CriteriaClassification Criteria
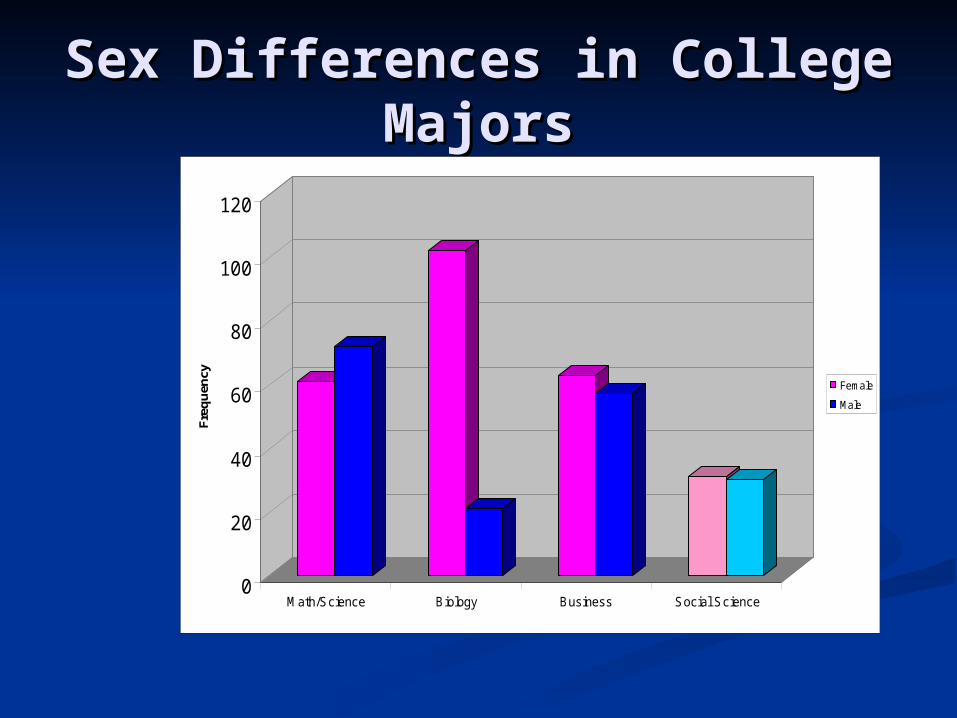
Sex Differences in College Sex Differences in College MajorsMajors
0
20
40
60
80
100
120F
req
uen
cy
Math/Science Biology Business Social Science
Female
Male
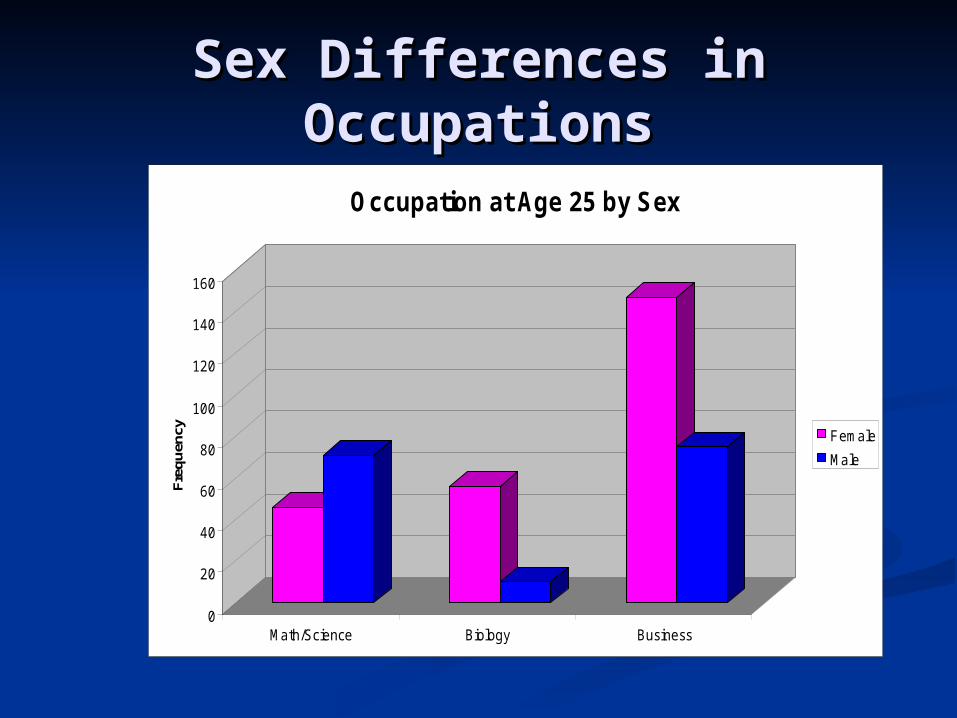
Sex Differences in Sex Differences in OccupationsOccupations
0
20
40
60
80
100
120
140
160
Fre
qu
ency
Math/Science Biology Business
Occupation at Age 25 by Sex
Female
Male

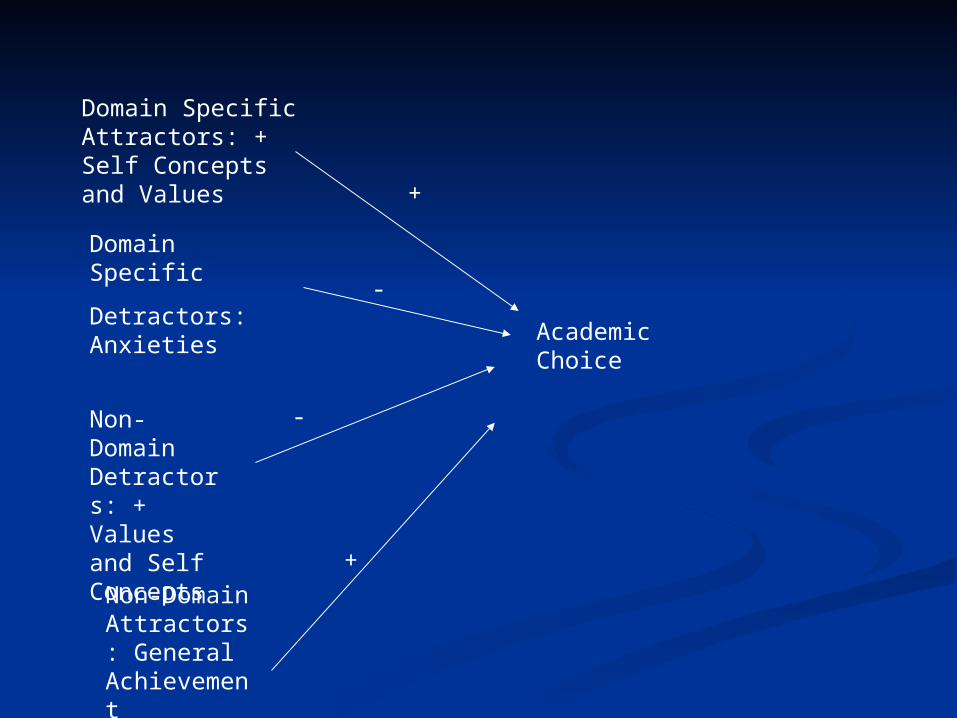
Domain Specific Attractors: + Self Concepts and Values
Domain Specific
Detractors: Anxieties
Non-Domain Detractors: + Values and Self Concepts
Non-Domain Attractors: General Achievement
Academic Choice
+
-
-
+
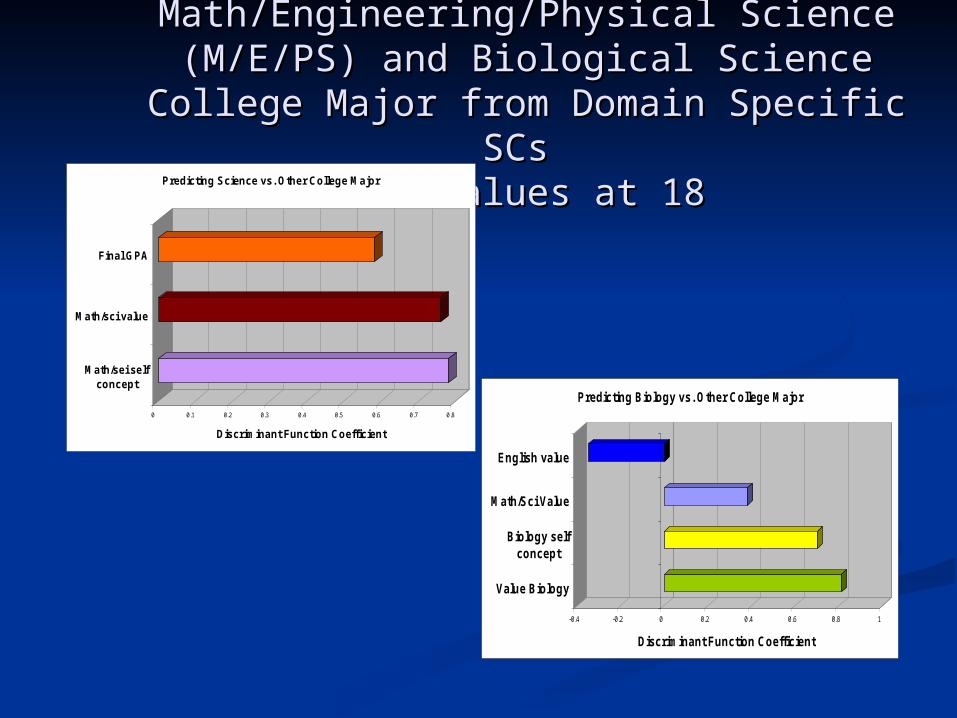
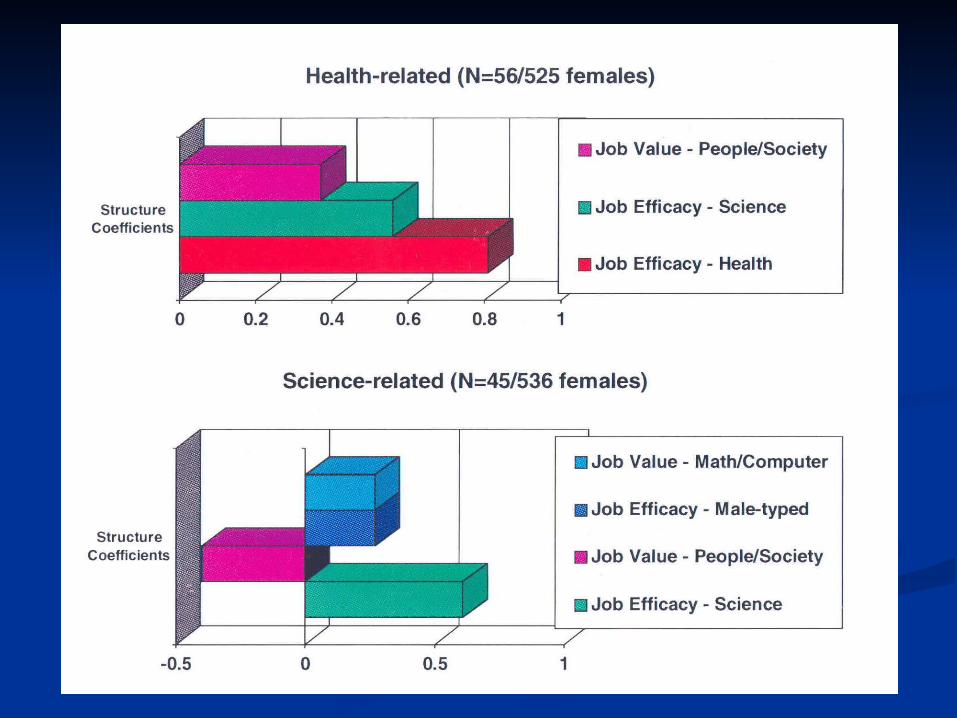
Predicting Women’s Math/Engineering/Physical Predicting Women’s Math/Engineering/Physical Science (M/E/PS) and Biological Science College Science (M/E/PS) and Biological Science College
Major from Domain Specific SCs Major from Domain Specific SCs and Values at 18and Values at 18
-0.4 -0.2 0 0.2 0.4 0.6 0.8 1
Discriminant Function Coefficient
Value Biology
Biology selfconcept
Math/Sci Value
English value
Predicting Biology vs. Other College Major 0 0.1 0.2 0.3 0.4 0.5 0.6 0.7 0.8
Discriminant Function Coefficient
Math/sei selfconcept
Math/sci value
Final GPA
Predicting Science vs. Other College Major
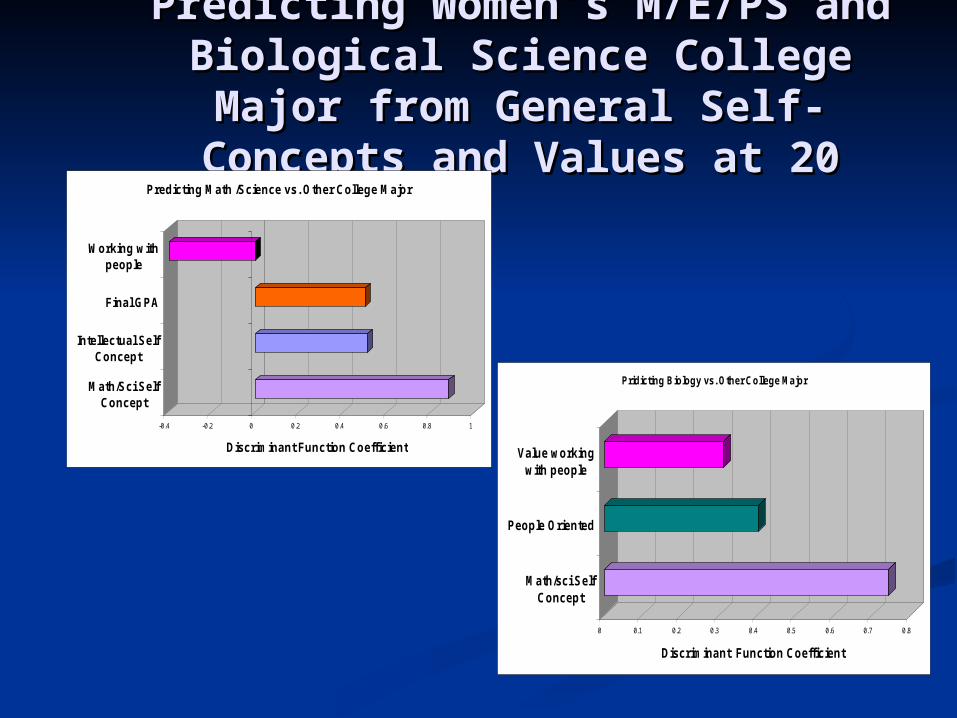
Predicting Women’s M/E/PS and Predicting Women’s M/E/PS and Biological Science College Major from Biological Science College Major from
General Self-Concepts and Values at 20General Self-Concepts and Values at 20
0 0.1 0.2 0.3 0.4 0.5 0.6 0.7 0.8
Discriminant Function Coefficient
Math/sci SelfConcept
People Oriented
Value workingwith people
Pridicting Biology vs. Other College Major
-0.4 -0.2 0 0.2 0.4 0.6 0.8 1
Discriminant Function Coefficient
Math/Sci SelfConcept
Intellectual SelfConcept
Final GPA
Working withpeople
Predicting Math /Science vs. Other College Major
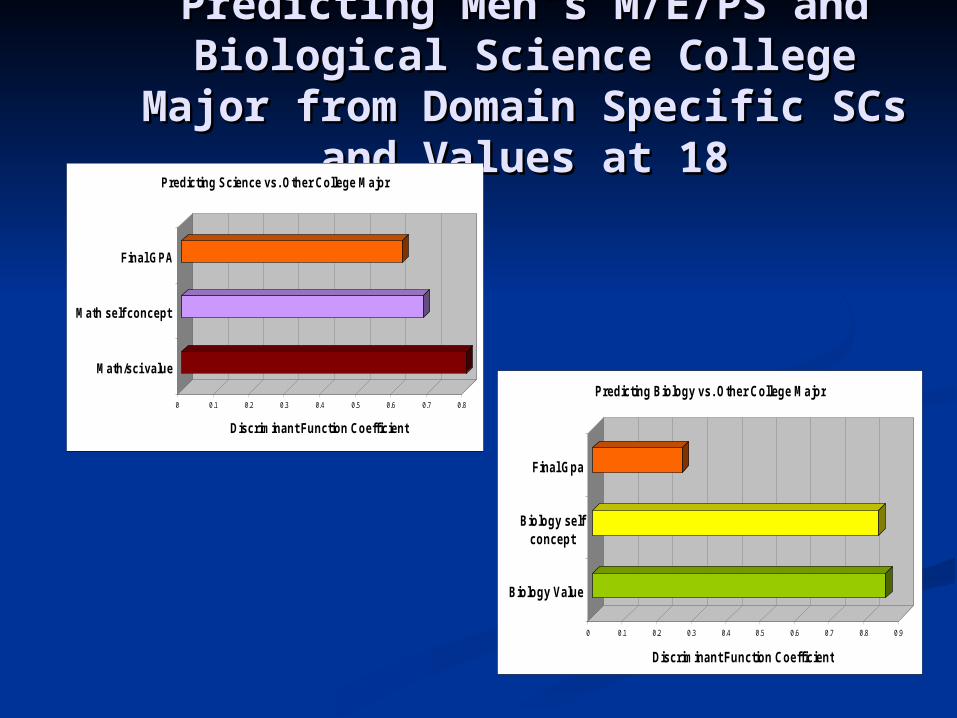
Predicting Men’s M/E/PS and Biological Predicting Men’s M/E/PS and Biological Science College Major from Domain Science College Major from Domain
Specific SCs and Values at 18Specific SCs and Values at 18
0 0.1 0.2 0.3 0.4 0.5 0.6 0.7 0.8 0.9
Discriminant Function Coefficient
Biology Value
Biology selfconcept
Final Gpa
Predicting Biology vs. Other College Major 0 0.1 0.2 0.3 0.4 0.5 0.6 0.7 0.8
Discriminant Function Coefficient
Math/sci value
Math self concept
Final GPA
Predicting Science vs. Other College Major
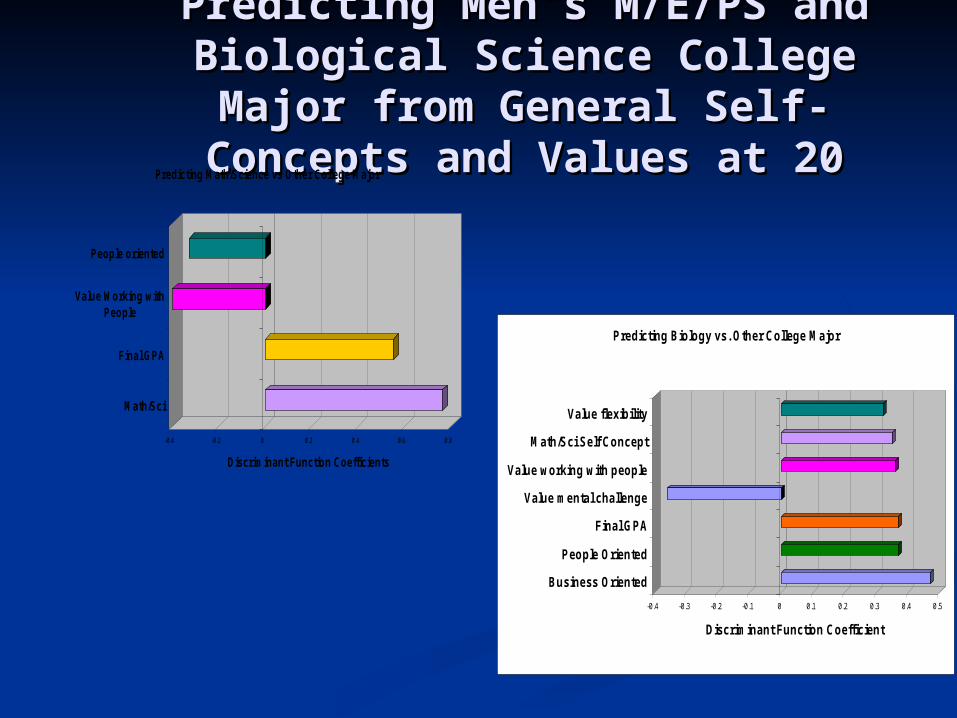
Predicting Men’s M/E/PS and Biological Predicting Men’s M/E/PS and Biological Science College Major from General Self-Science College Major from General Self-
Concepts and Values at 20Concepts and Values at 20
-0.4 -0.3 -0.2 -0.1 0 0.1 0.2 0.3 0.4 0.5
Discriminant Function Coefficient
Business Oriented
People Oriented
Final GPA
Value mental challenge
Value working with people
Math/Sci Self Concept
Value flexibility
Predicting Biology vs. Other College Major
-0.4 -0.2 0 0.2 0.4 0.6 0.8
Discriminant Function Coefficients
Math/Sci
Final GPA
Value Working withPeople
People oriented
Predicting Math/Science vs Other College Major
Mediation of Sex Mediation of Sex DifferencesDifferences
Used logistic regression to assess Used logistic regression to assess the extent to which the Time 1 and the extent to which the Time 1 and Time 2 predictors explained the sex Time 2 predictors explained the sex difference in majoring in difference in majoring in Math/Engineering/Physical ScienceMath/Engineering/Physical Science
Step 1: Sex onlyStep 1: Sex only Step 2: Sex plus all of Time 1 or Step 2: Sex plus all of Time 1 or
Time predictorsTime predictors
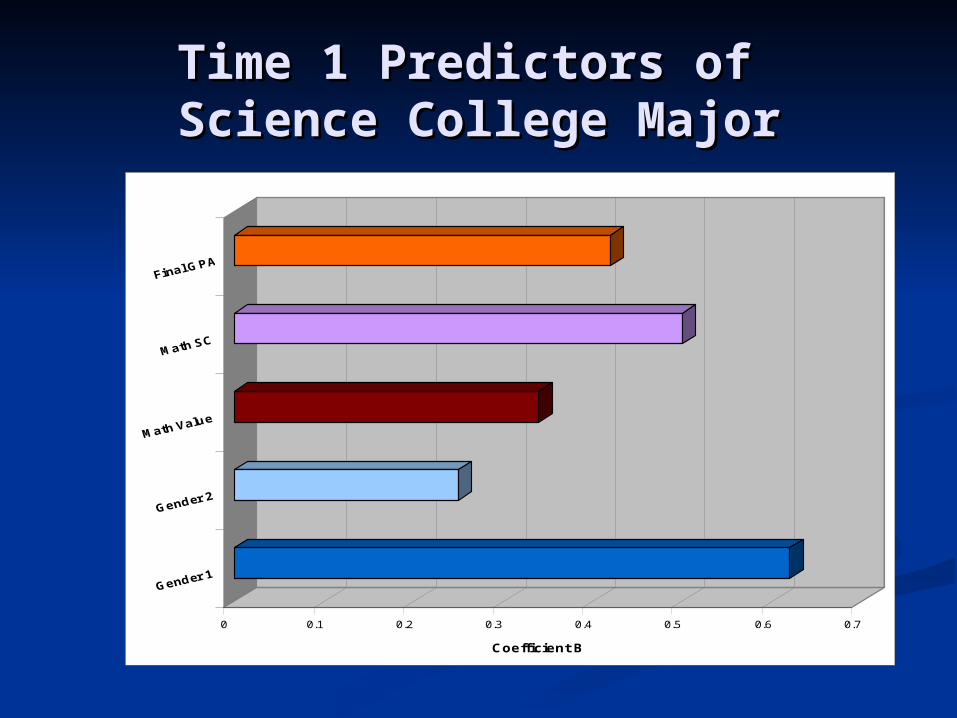
Time 1 Predictors of Time 1 Predictors of Science College MajorScience College Major
0 0.1 0.2 0.3 0.4 0.5 0.6 0.7
Coefficient B
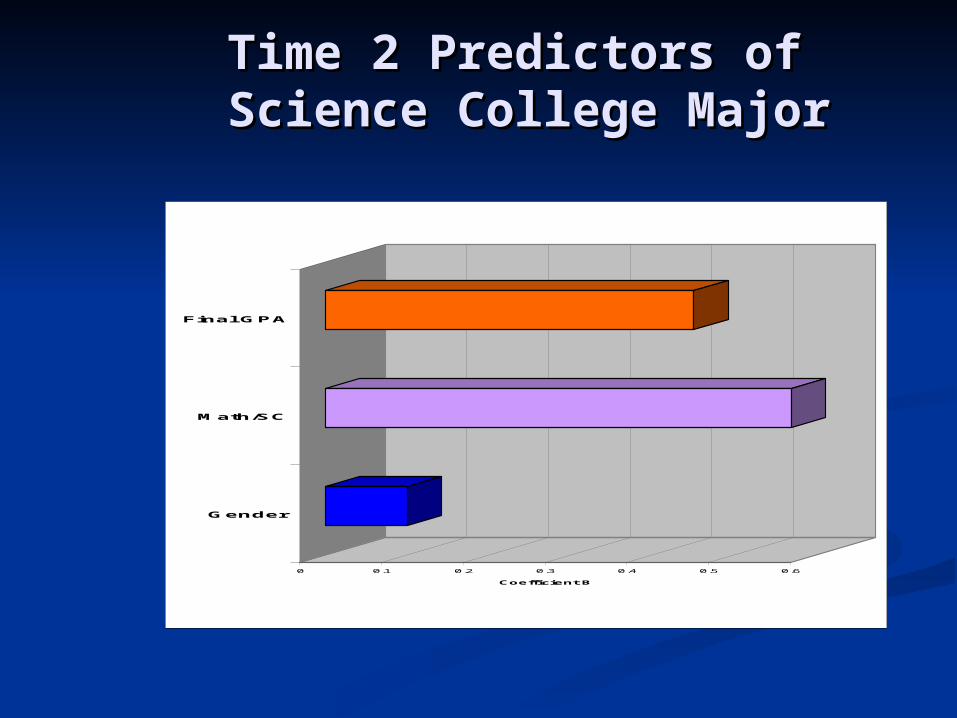
Time 2 Predictors of Time 2 Predictors of Science College MajorScience College Major
0 0.1 0.2 0.3 0.4 0.5 0.6
Coefficient B
Gender
Math/SC
Final GPA
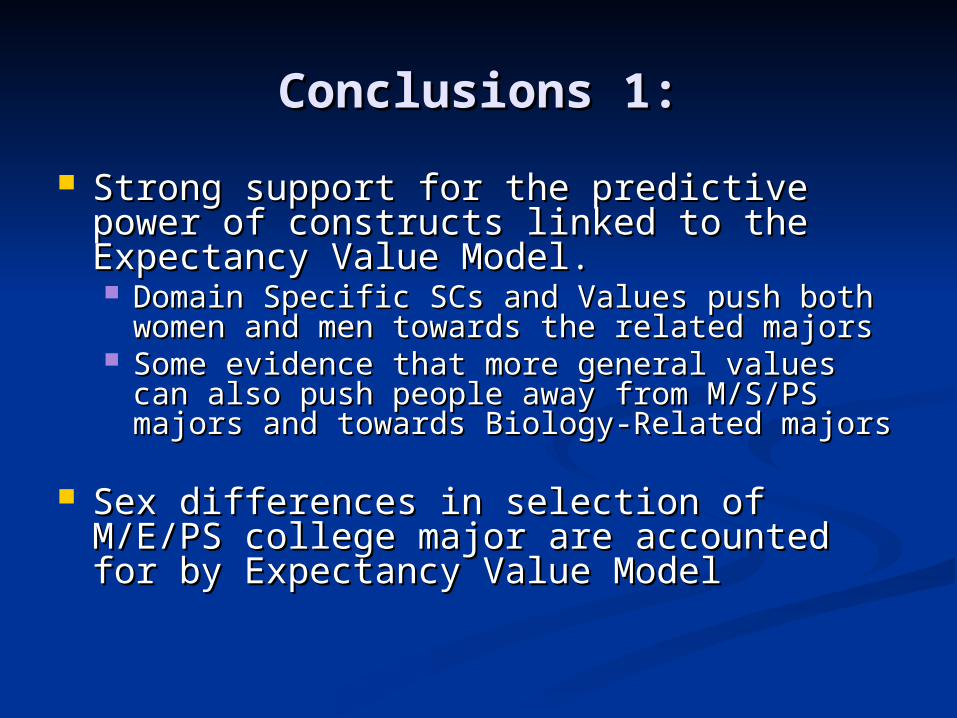
Conclusions 1:Conclusions 1:
Strong support for the predictive power of Strong support for the predictive power of constructs linked to the Expectancy Value constructs linked to the Expectancy Value Model.Model. Domain Specific SCs and Values push both Domain Specific SCs and Values push both
women and men towards the related majorswomen and men towards the related majors Some evidence that more general values can Some evidence that more general values can
also push people away from M/S/PS majors also push people away from M/S/PS majors and towards Biology-Related majorsand towards Biology-Related majors
Sex differences in selection of M/E/PS Sex differences in selection of M/E/PS college major are accounted for by college major are accounted for by Expectancy Value ModelExpectancy Value Model
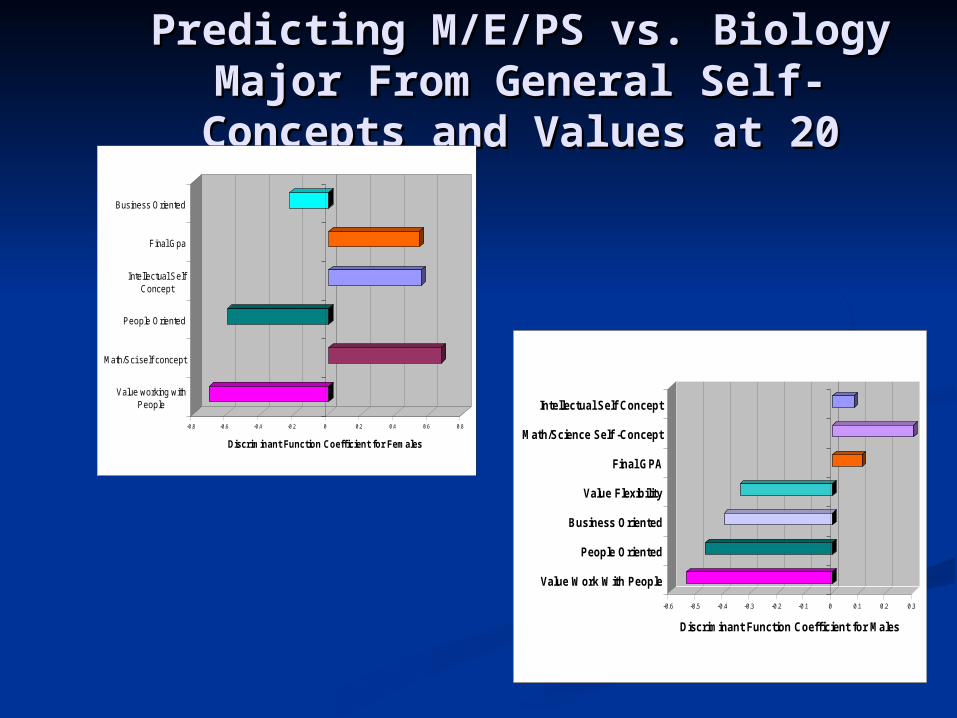
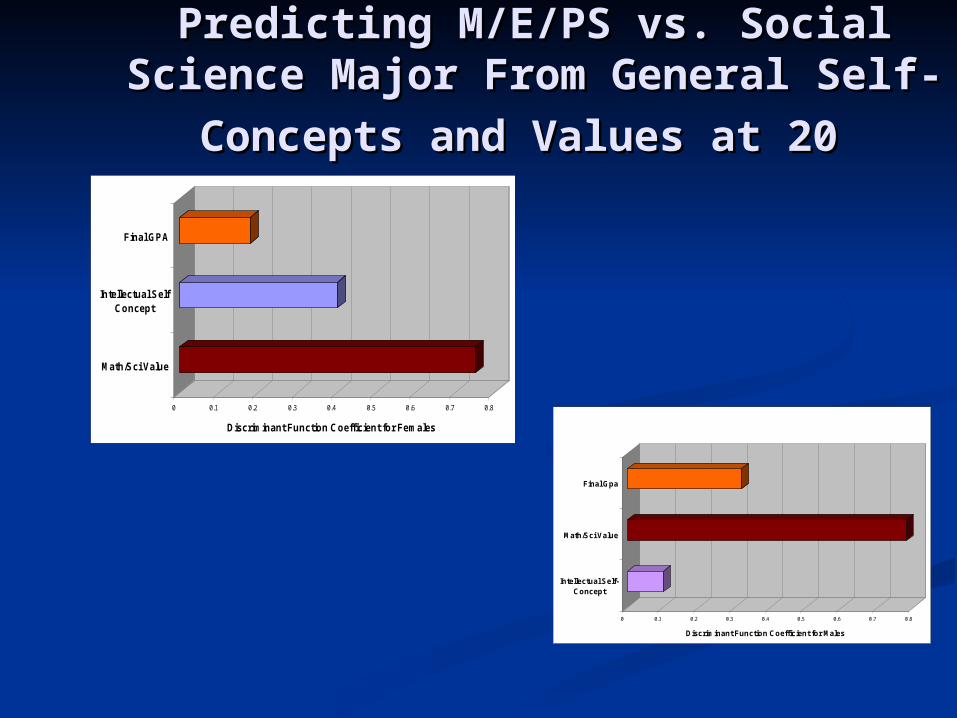
Predicting M/E/PS vs. Biology Predicting M/E/PS vs. Biology Major From General Self-Major From General Self-Concepts and Values at 20Concepts and Values at 20
-0.8 -0.6 -0.4 -0.2 0 0.2 0.4 0.6 0.8
Discriminant Function Coefficient for Females
Value working withPeople
Math/Sci self concept
People Oriented
Intellectual SelfConcept
Final Gpa
Business Oriented
-0.6 -0.5 -0.4 -0.3 -0.2 -0.1 0 0.1 0.2 0.3
Discriminant Function Coefficient for Males
Value Work With People
People Oriented
Business Oriented
Value Flexibility
Final GPA
Math/Science Self -Concept
Intellectual Self Concept
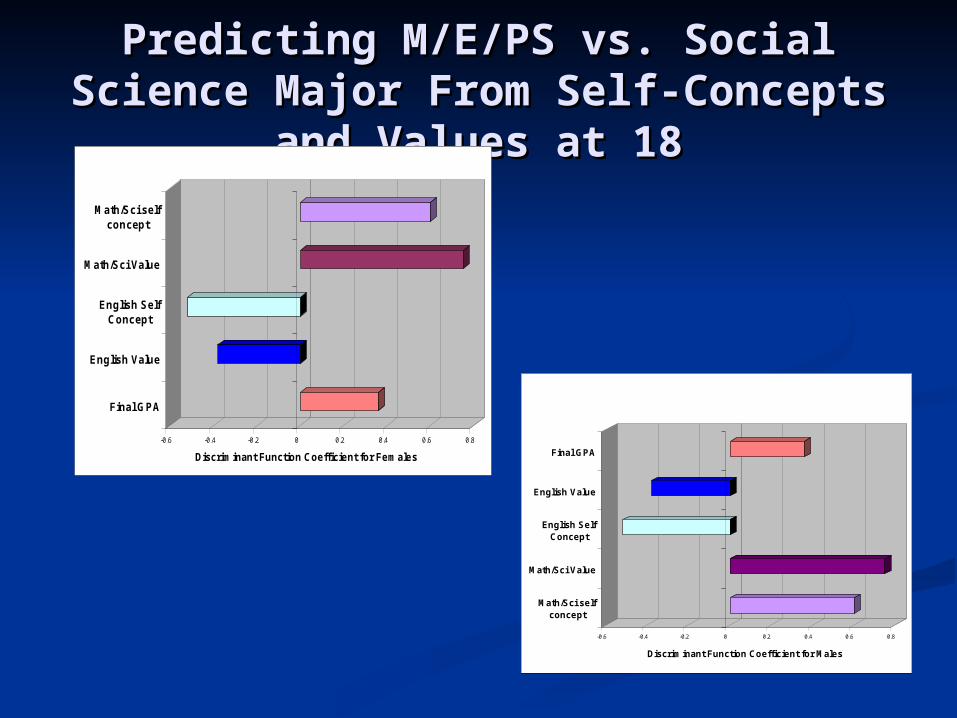
Predicting M/E/PS vs. Social Predicting M/E/PS vs. Social Science Major From Self-Concepts Science Major From Self-Concepts
and Values at 18and Values at 18
-0.6 -0.4 -0.2 0 0.2 0.4 0.6 0.8
Discriminant Function Coefficient for Males
Math/Sci selfconcept
Math/Sci Value
English SelfConcept
English Value
Final GPA-0.6 -0.4 -0.2 0 0.2 0.4 0.6 0.8
Math/Sci selfconcept
Math/Sci Value
English SelfConcept
English Value
Final GPA
Discriminant Function Coefficient for Females
Predicting M/E/PS vs. Social Predicting M/E/PS vs. Social Science Major From General Self-Science Major From General Self-
Concepts and Values at 20Concepts and Values at 20
0 0.1 0.2 0.3 0.4 0.5 0.6 0.7 0.8
Discriminant Function Coefficient for Females
Math/Sci Value
Intellectual SelfConcept
Final GPA
0 0.1 0.2 0.3 0.4 0.5 0.6 0.7 0.8
Discriminant Function Coefficient for Males
Intellectual Self-Concept
Math/Sci Value
Final Gpa
Conclusions 2Conclusions 2
Even stronger support for both the Even stronger support for both the push and pull aspects of the Eccles push and pull aspects of the Eccles et al. Expectancy Value Modelet al. Expectancy Value Model
Strong evidence that valuing having Strong evidence that valuing having a job that allows one to work with a job that allows one to work with and for people pushes individuals and for people pushes individuals away from M/E/PS majors and pulls away from M/E/PS majors and pulls them toward the Biological Sciencesthem toward the Biological Sciences
Analyses 3Analyses 3
Now lets shift to the second set of Now lets shift to the second set of analyses: those linking self concepts analyses: those linking self concepts and values from ages 18 and 20 to and values from ages 18 and 20 to occupational plans at age 20 and occupational plans at age 20 and actual occupations at age 25actual occupations at age 25
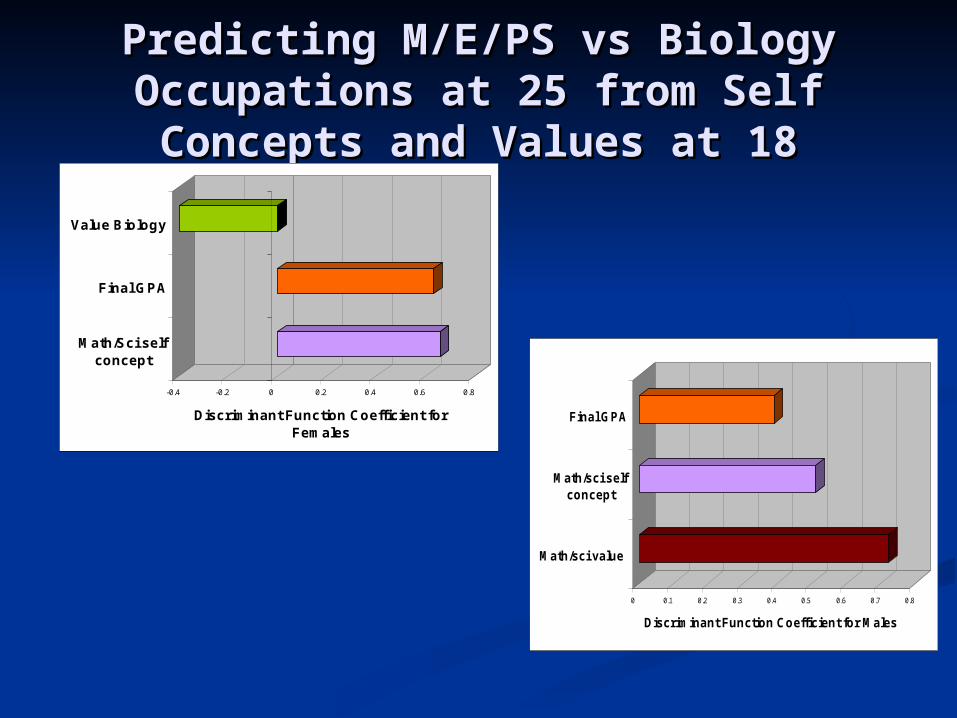
Predicting M/E/PS vs Biology Predicting M/E/PS vs Biology Occupations at 25 from Self Occupations at 25 from Self Concepts and Values at 18Concepts and Values at 18
-0.4 -0.2 0 0.2 0.4 0.6 0.8
Discriminant Function Coefficient for Females
Math/Sci selfconcept
Final GPA
Value Biology
0 0.1 0.2 0.3 0.4 0.5 0.6 0.7 0.8
Discriminant Function Coefficient for Males
Math/sci value
Math/sci selfconcept
Final GPA
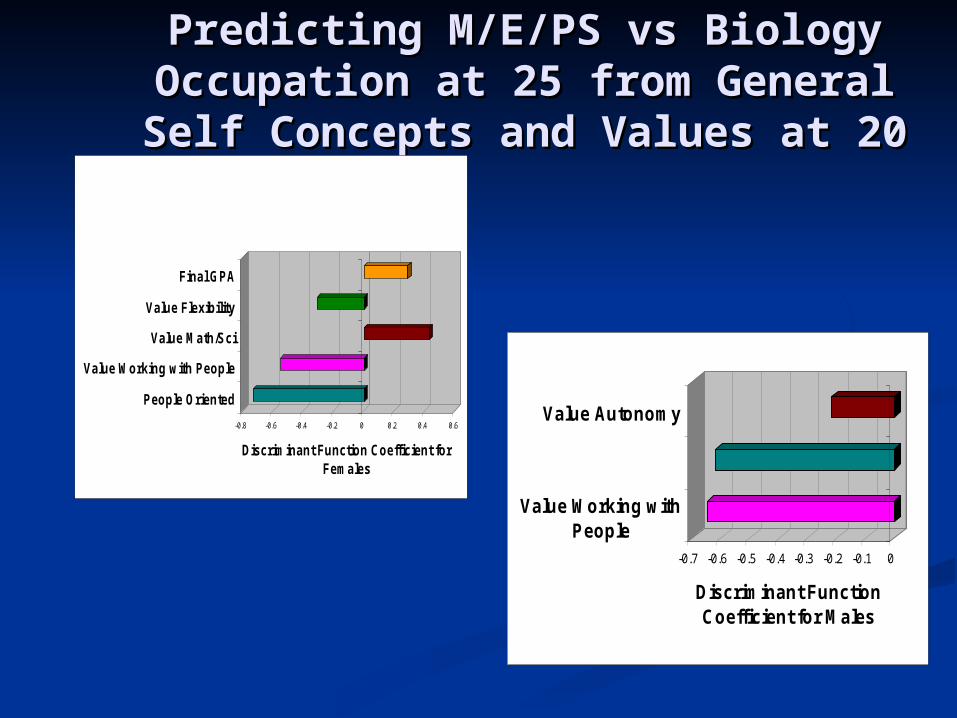
Predicting M/E/PS vs Biology Predicting M/E/PS vs Biology Occupation at 25 from General Occupation at 25 from General Self Concepts and Values at 20Self Concepts and Values at 20
-0.8 -0.6 -0.4 -0.2 0 0.2 0.4 0.6
Discriminant Function Coefficient for Females
People Oriented
Value Working with People
Value Math/Sci
Value Flexibility
Final GPA
-0.7 -0.6 -0.5 -0.4 -0.3 -0.2 -0.1 0
Discriminant Function Coefficient for Males
Value Working withPeople
Value Autonomy
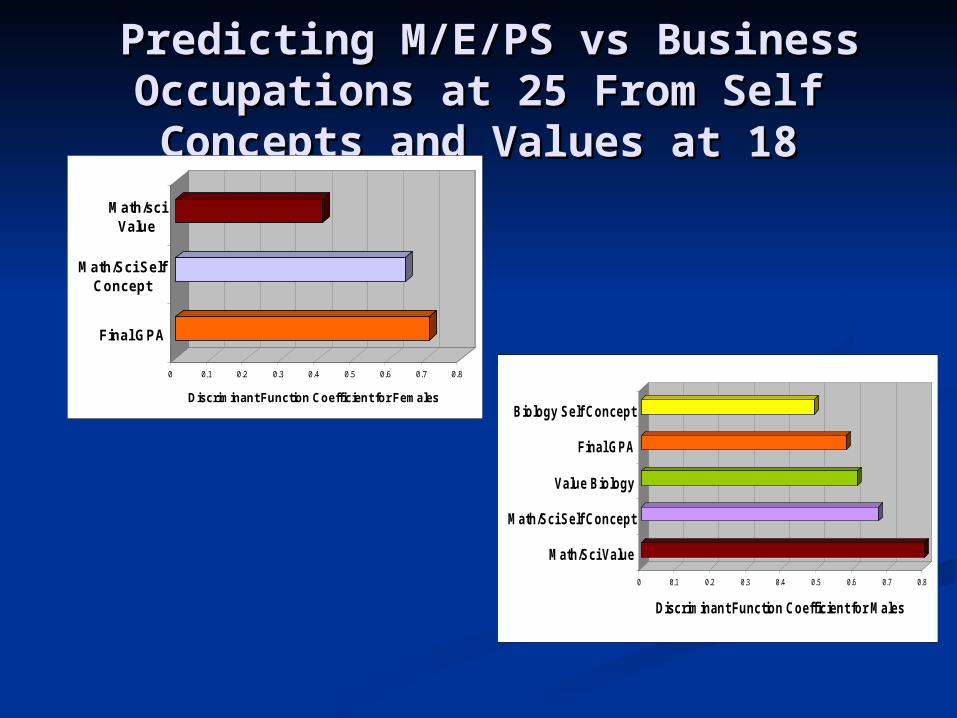
Predicting M/E/PS vs Business Predicting M/E/PS vs Business Occupations at 25 From Self Occupations at 25 From Self Concepts and Values at 18Concepts and Values at 18
0 0.1 0.2 0.3 0.4 0.5 0.6 0.7 0.8
Discriminant Function Coefficient for Females
Final GPA
Math/Sci SelfConcept
Math/sciValue
0 0.1 0.2 0.3 0.4 0.5 0.6 0.7 0.8
Discriminant Function Coefficient for Males
Math/Sci Value
Math/Sci Self Concept
Value Biology
Final GPA
Biology Self Concept
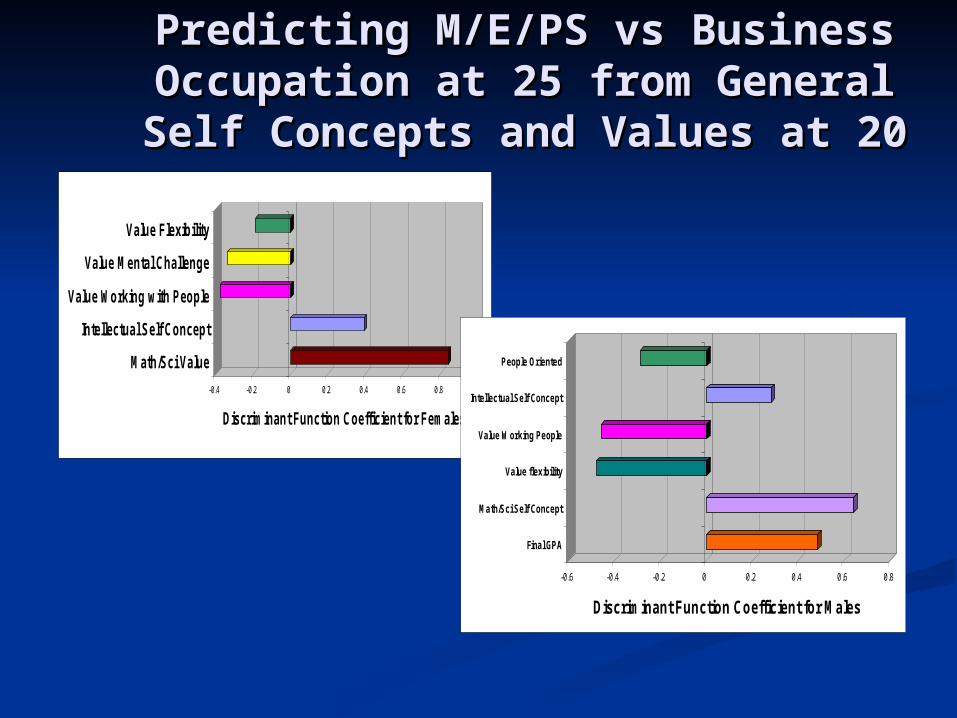
Predicting M/E/PS vs Business Predicting M/E/PS vs Business Occupation at 25 from General Occupation at 25 from General Self Concepts and Values at 20Self Concepts and Values at 20
-0.4 -0.2 0 0.2 0.4 0.6 0.8 1
Discriminant Function Coefficient for Females
Math/Sci Value
Intellectual Self Concept
Value Working with People
Value Mental Challenge
Value Flexibility
-0.6 -0.4 -0.2 0 0.2 0.4 0.6 0.8
Discriminant Function Coefficient for Males
Final GPA
Math/Sci Self Concept
Value flexibility
Value Working People
Intellectual Self Concept
People Oriented
Conclusions Conclusions
Expectancy Value Model provides a Expectancy Value Model provides a good explanatory framework for good explanatory framework for understanding both individual understanding both individual differences and sex differences in differences and sex differences in educational and occupational educational and occupational choiceschoices
What about Gender Roles?What about Gender Roles?Role of Traditionality in Terms of Role of Traditionality in Terms of FamilyFamily
Role of Gender Role Stereotypes Role of Gender Role Stereotypes of Achievement Domainof Achievement Domain
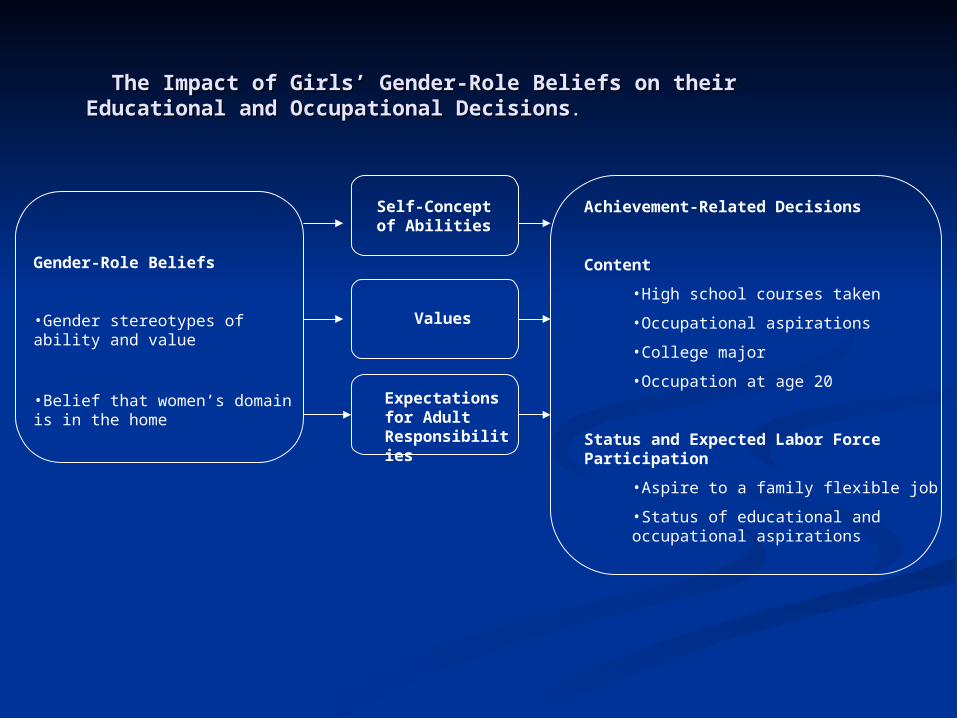
The Impact of Girls’ Gender-Role Beliefs on their Educational The Impact of Girls’ Gender-Role Beliefs on their Educational and Occupational Decisionsand Occupational Decisions..
Gender-Role Beliefs
•Gender stereotypes of ability and value
•Belief that women’s domain is in the home
Self-Concept of Abilities
Values
Expectations for Adult Responsibilities
Achievement-Related Decisions
Content
•High school courses taken
•Occupational aspirations
•College major
•Occupation at age 20
Status and Expected Labor Force Participation
•Aspire to a family flexible job
•Status of educational and occupational aspirations
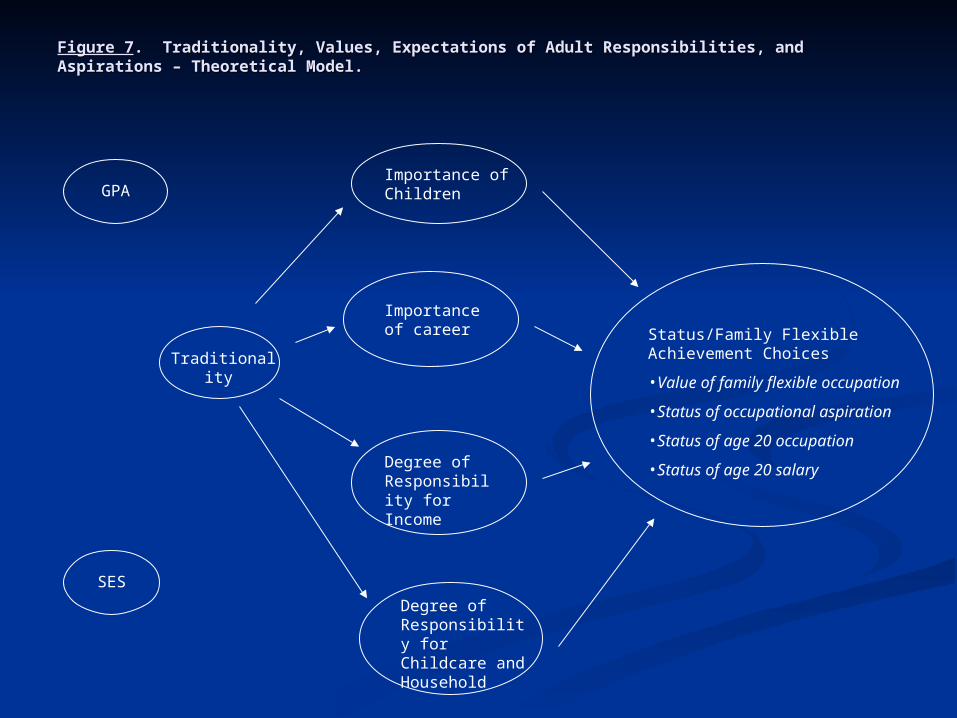
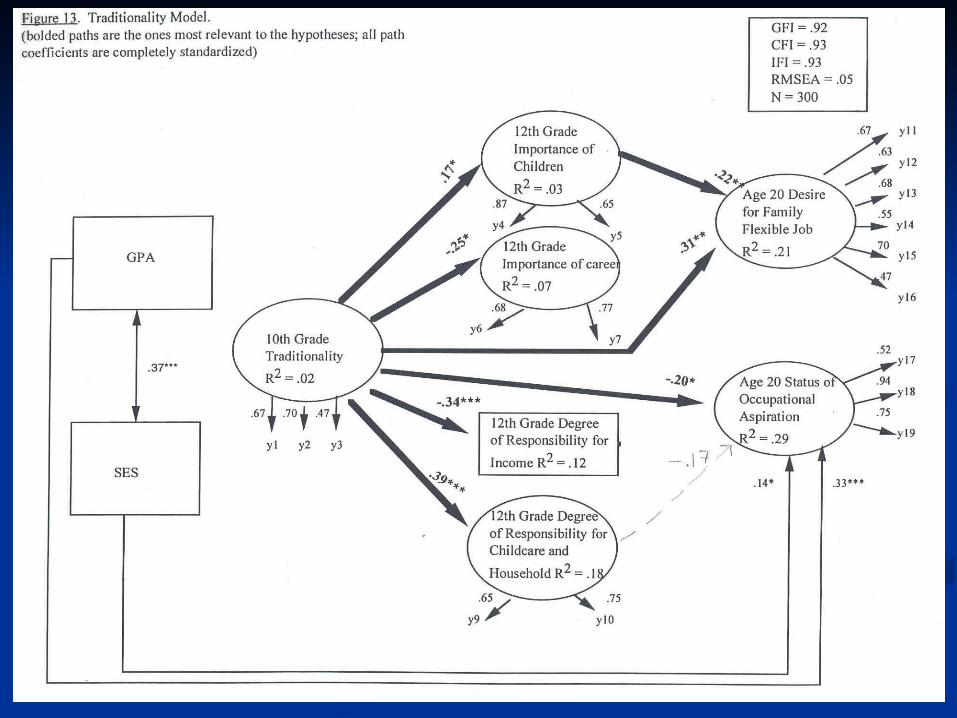
Figure 7Figure 7. Traditionality, Values, Expectations of Adult Responsibilities, and Aspirations – . Traditionality, Values, Expectations of Adult Responsibilities, and Aspirations – Theoretical Model.Theoretical Model.
GPA
SES
Traditionality
Importance of Children
Importance of career
Degree of Responsibility for Income
Degree of Responsibility for Childcare and Household
Status/Family Flexible Achievement Choices
•Value of family flexible occupation
•Status of occupational aspiration
•Status of age 20 occupation
•Status of age 20 salary
What About Gender Role What About Gender Role Stereotypes?Stereotypes?
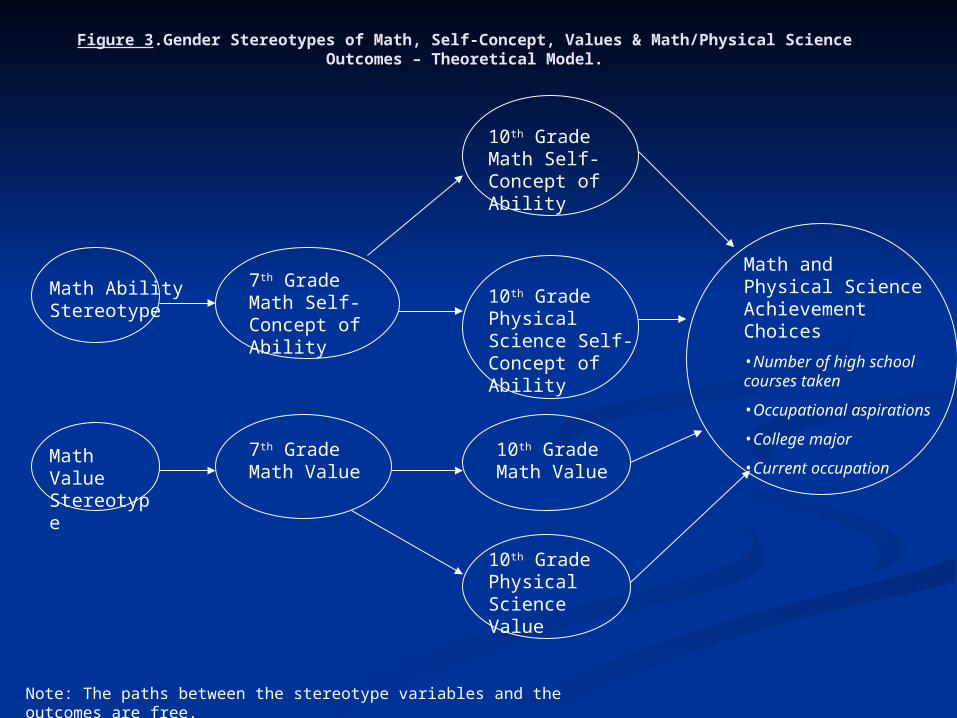
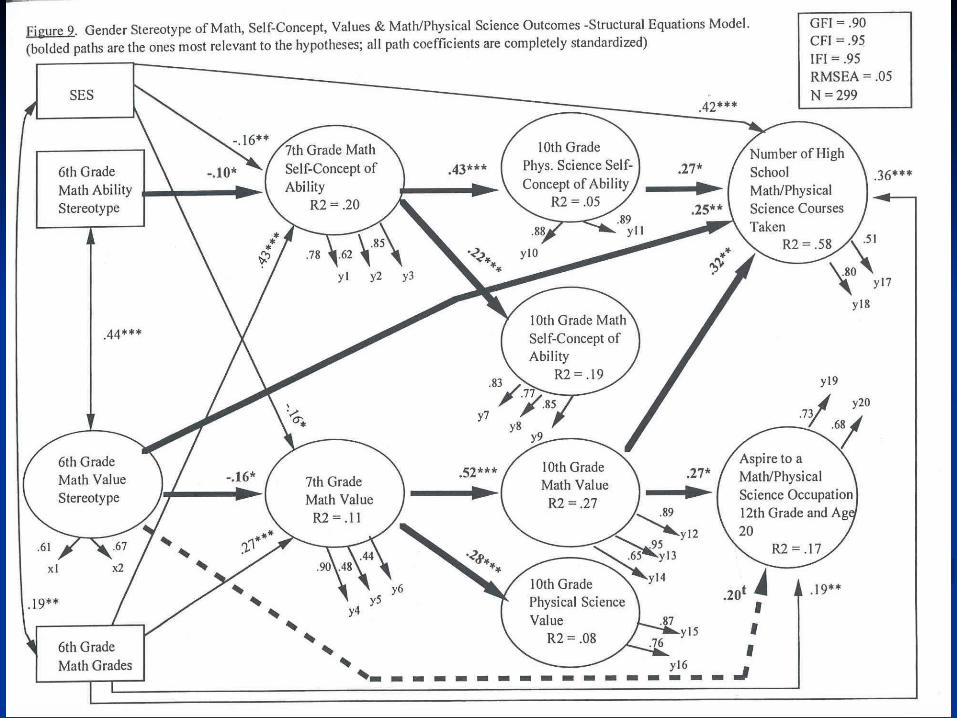
Figure 3Figure 3.Gender Stereotypes of Math, Self-Concept, Values & Math/Physical Science .Gender Stereotypes of Math, Self-Concept, Values & Math/Physical Science Outcomes – Theoretical Model.Outcomes – Theoretical Model.
Note: The paths between the stereotype variables and the outcomes are free.
Math Ability Stereotype
Math Value Stereotype
7th Grade Math Self-Concept of Ability
7th Grade Math Value
10th Grade Math Self-Concept of Ability
10th Grade Physical Science Self-Concept of Ability
10th Grade Math Value
10th Grade Physical Science Value
Math and Physical Science Achievement Choices
•Number of high school courses taken
•Occupational aspirations
•College major
•Current occupation
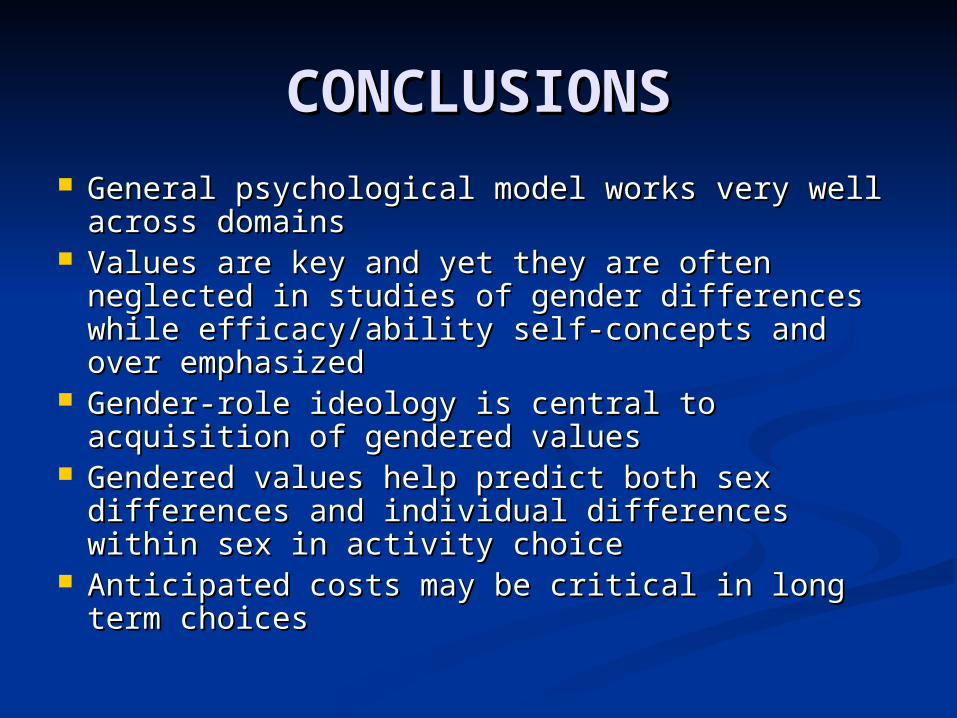
CONCLUSIONSCONCLUSIONS General psychological model works very well General psychological model works very well
across domainsacross domains Values are key and yet they are often neglected in Values are key and yet they are often neglected in
studies of gender differences while efficacy/ability studies of gender differences while efficacy/ability self-concepts and over emphasizedself-concepts and over emphasized
Gender-role ideology is central to acquisition of Gender-role ideology is central to acquisition of gendered valuesgendered values
Gendered values help predict both sex differences Gendered values help predict both sex differences and individual differences within sex in activity and individual differences within sex in activity choicechoice
Anticipated costs may be critical in long term Anticipated costs may be critical in long term choiceschoices
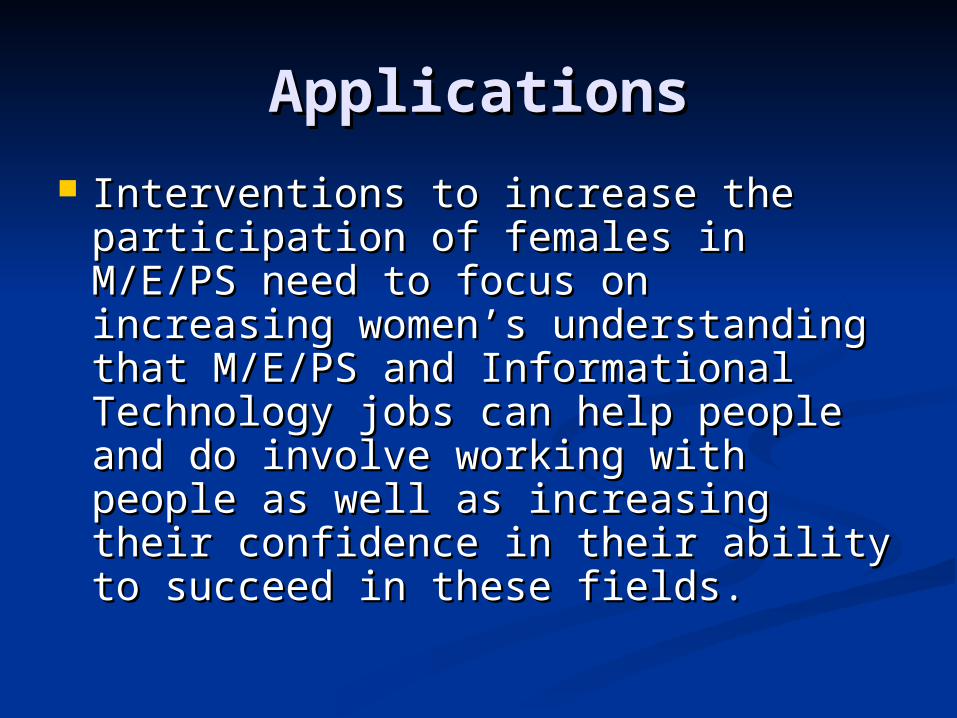
ApplicationsApplications
Interventions to increase the Interventions to increase the participation of females in M/E/PS participation of females in M/E/PS need to focus on increasing women’s need to focus on increasing women’s understanding that M/E/PS and understanding that M/E/PS and Informational Technology jobs can Informational Technology jobs can help people and do involve working help people and do involve working with people as well as increasing with people as well as increasing their confidence in their ability to their confidence in their ability to succeed in these fields.succeed in these fields.
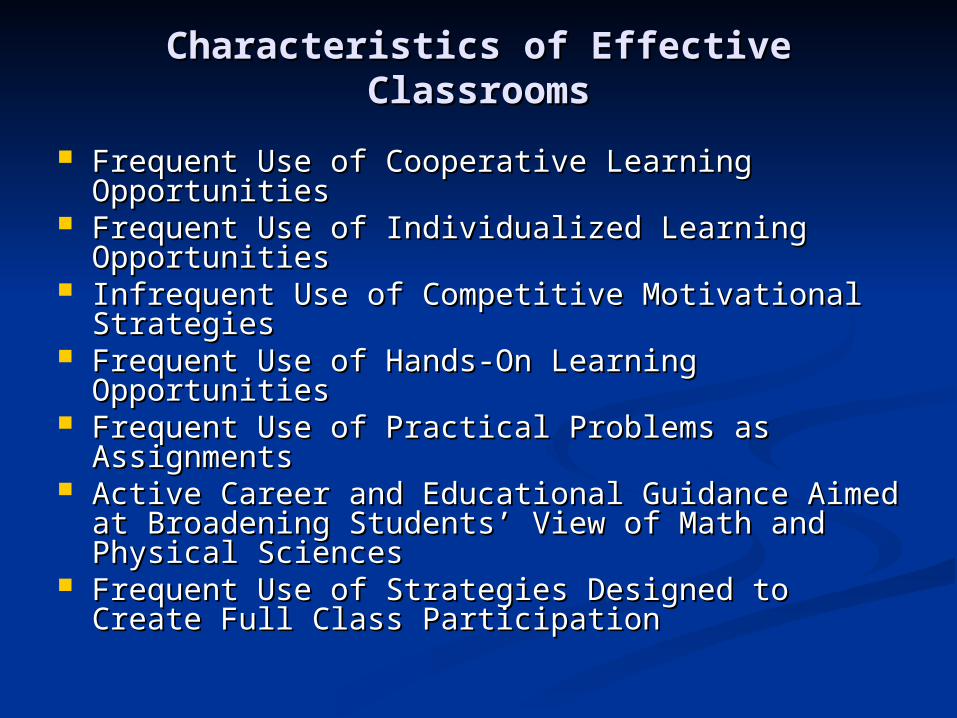
Characteristics of Effective ClassroomsCharacteristics of Effective Classrooms
Frequent Use of Cooperative Learning Frequent Use of Cooperative Learning OpportunitiesOpportunities
Frequent Use of Individualized Learning Frequent Use of Individualized Learning OpportunitiesOpportunities
Infrequent Use of Competitive Motivational Infrequent Use of Competitive Motivational Strategies Strategies
Frequent Use of Hands-On Learning Frequent Use of Hands-On Learning OpportunitiesOpportunities
Frequent Use of Practical Problems as Frequent Use of Practical Problems as AssignmentsAssignments
Active Career and Educational Guidance Aimed Active Career and Educational Guidance Aimed at Broadening Students’ View of Math and at Broadening Students’ View of Math and Physical SciencesPhysical Sciences
Frequent Use of Strategies Designed to Create Frequent Use of Strategies Designed to Create Full Class Participation Full Class Participation

Thank YouThank You
More details and copies can be More details and copies can be found at found at
www.rcgd.isr.umich.edu/garp/www.rcgd.isr.umich.edu/garp/
The EndThe End