Embed Size (px)
Citation preview

Family and School Influences on Student Motivation and School Achievement
Jacquelynne S. EcclesJacquelynne S. Eccles University of MichiganUniversity of Michigan
Presentation at Swiss Educational Society MeetingPresentation at Swiss Educational Society Meeting Bern, SwitzerlandBern, Switzerland
Fall 2003Fall 2003
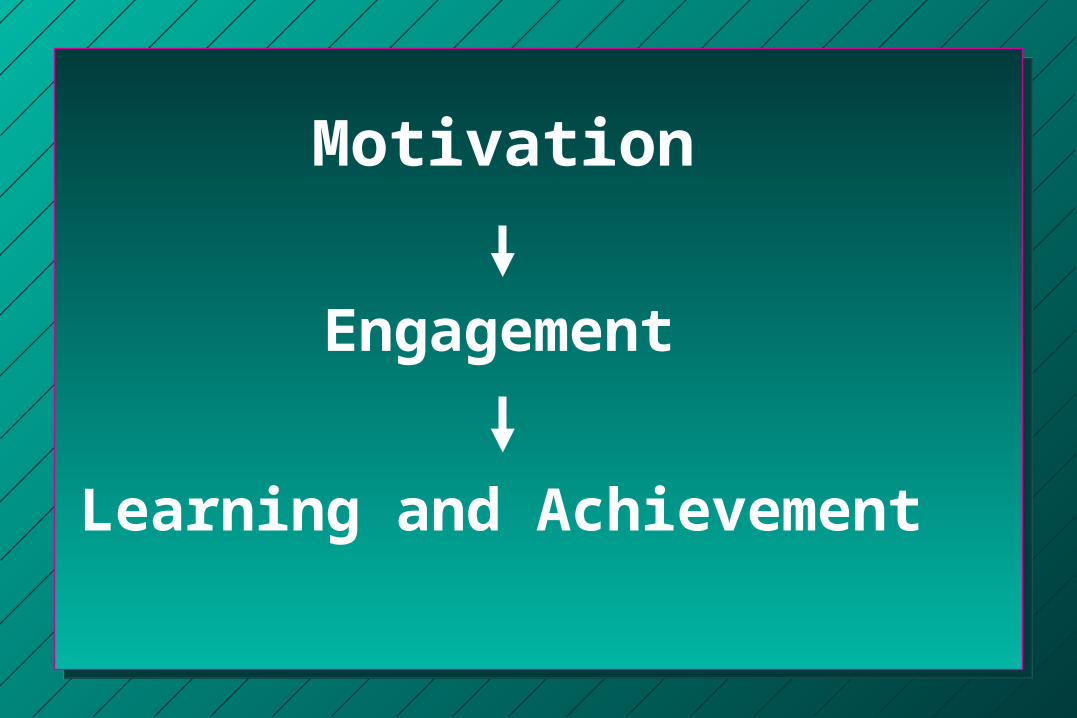
Motivation
Engagement
Learning and Achievement
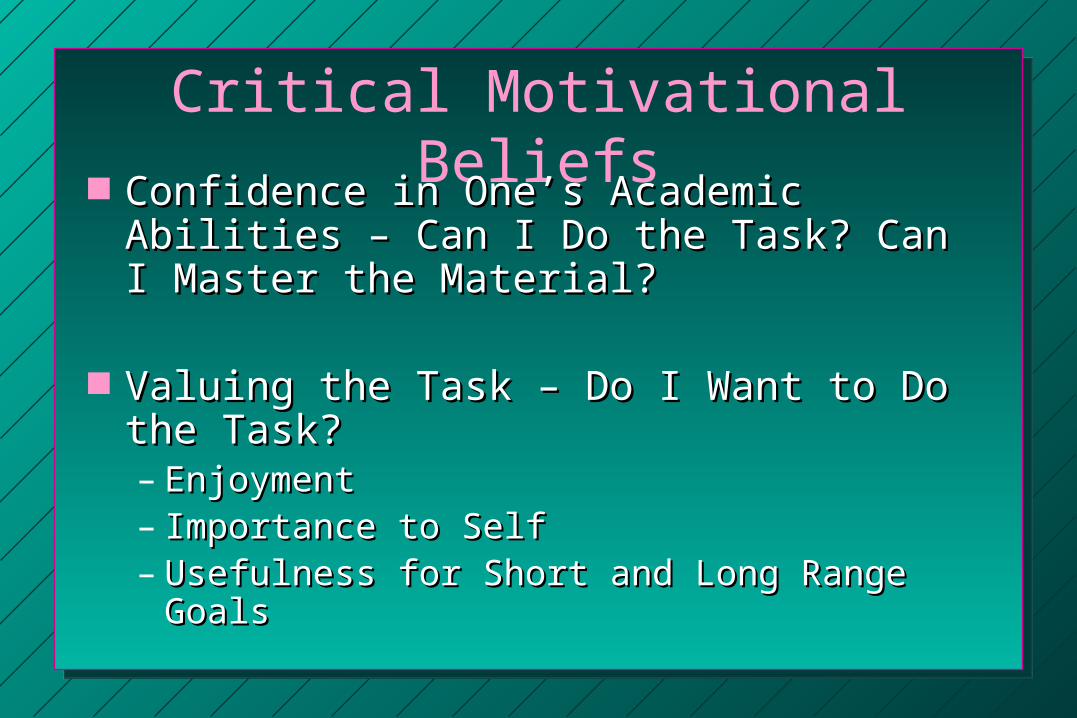
Critical Motivational Beliefs Confidence in One’s Academic Abilities – Confidence in One’s Academic Abilities –
Can I Do the Task? Can I Master the Can I Do the Task? Can I Master the Material?Material?
Valuing the Task – Do I Want to Do the Valuing the Task – Do I Want to Do the Task?Task?– EnjoymentEnjoyment– Importance to SelfImportance to Self– Usefulness for Short and Long Range GoalsUsefulness for Short and Long Range Goals
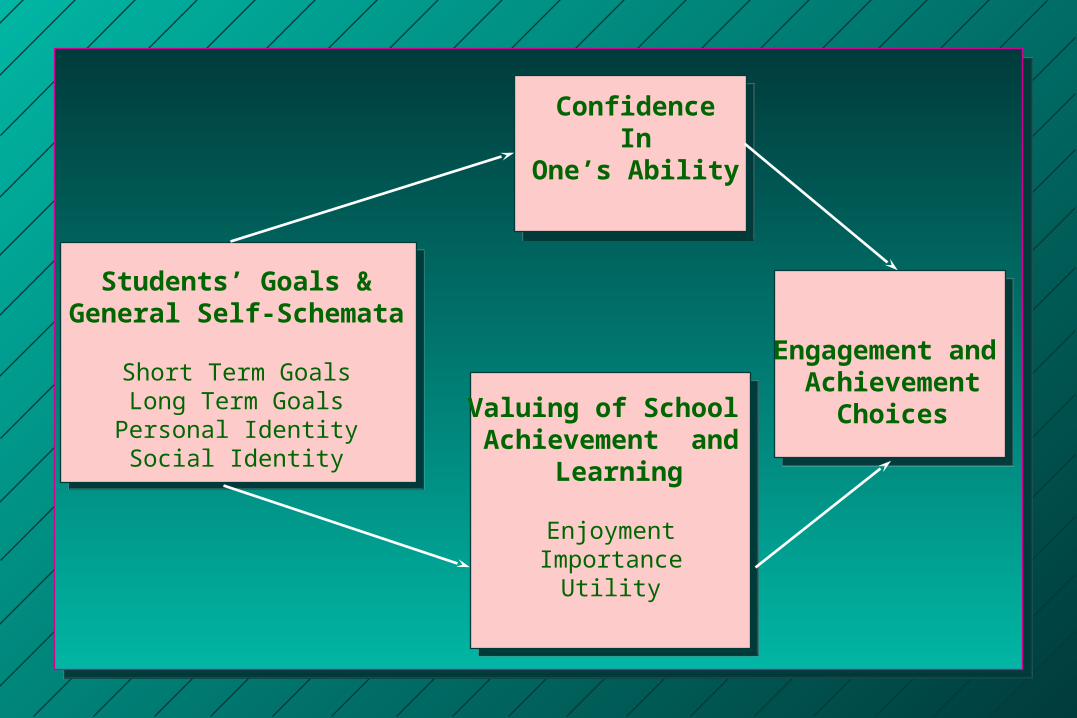
Students’ Goals &General Self-Schemata
Short Term GoalsLong Term GoalsPersonal Identity
Social Identity
ConfidenceIn
One’s Ability
Valuing of School Achievement and
Learning
EnjoymentImportance
Utility
Engagement and Achievement
Choices
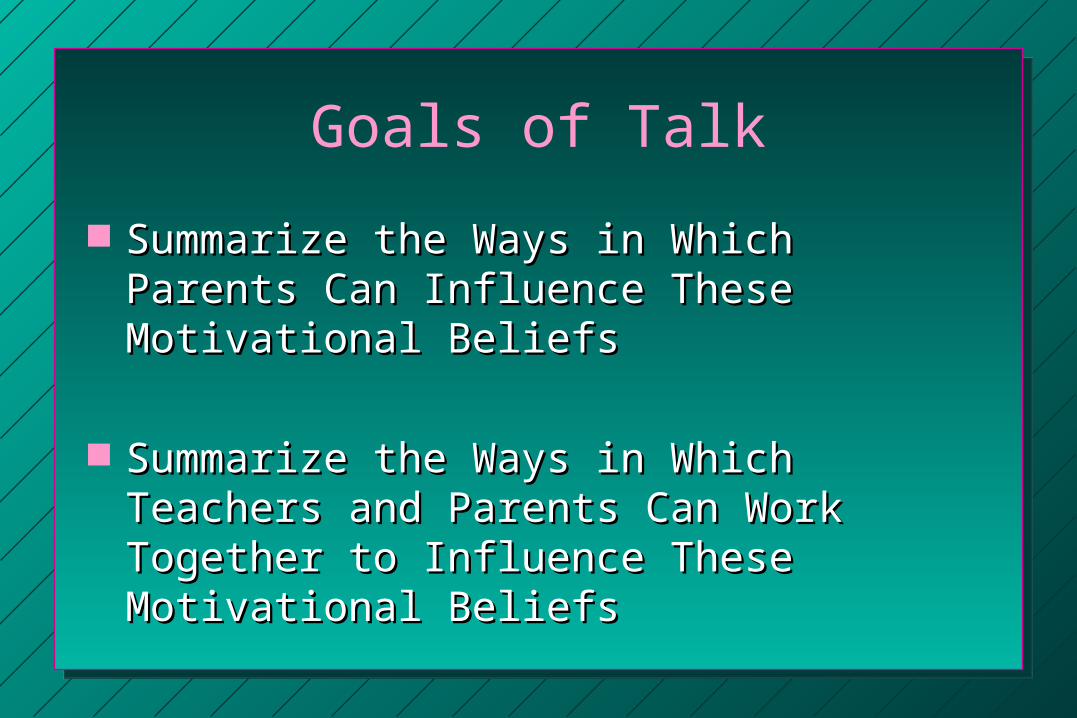
Goals of Talk
Summarize the Ways in Which Parents Can Summarize the Ways in Which Parents Can Influence These Motivational BeliefsInfluence These Motivational Beliefs
Summarize the Ways in Which Teachers and Summarize the Ways in Which Teachers and Parents Can Work Together to Influence Parents Can Work Together to Influence These Motivational BeliefsThese Motivational Beliefs
How Might Parents Influence Their Children’s How Might Parents Influence Their Children’s Motivation to Engage in Academic Subjects Motivation to Engage in Academic Subjects and In School Achievement?and In School Achievement?
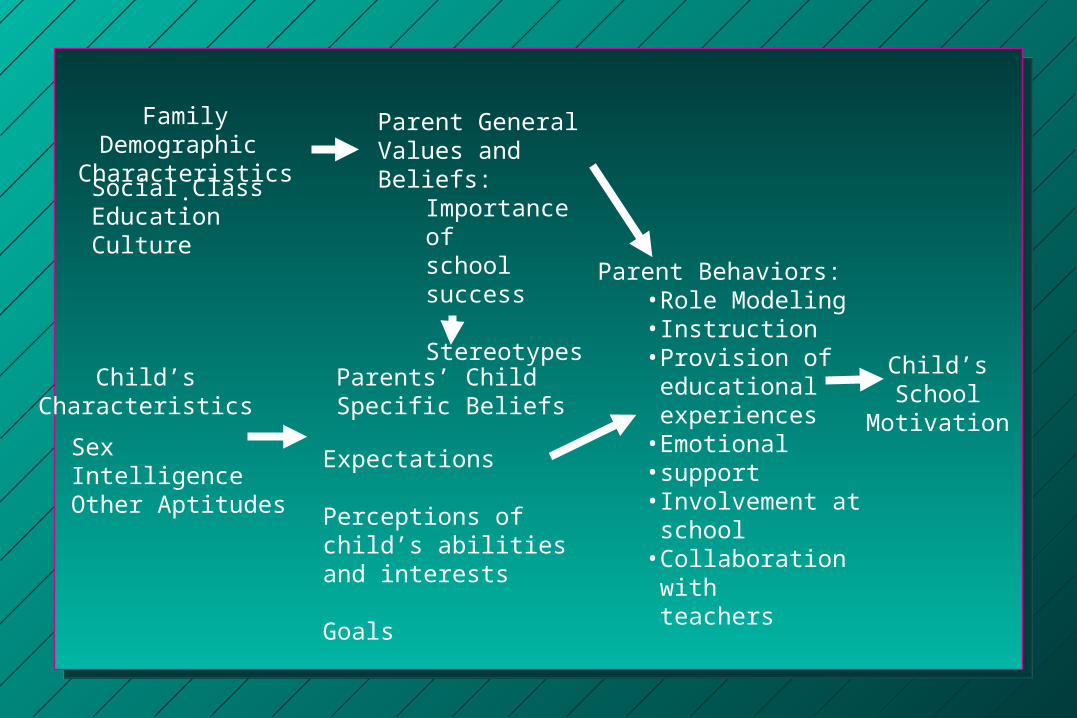
Family Demographic Characteristics:
Social ClassEducationCulture
Parent GeneralValues and Beliefs:
Importance ofschool success
StereotypesParent Behaviors:
•Role Modeling•Instruction•Provision of educational experiences•Emotional •support•Involvement at school•Collaboration with teachers
Child’sSchool
Motivation
Child’sCharacteristics
SexIntelligenceOther Aptitudes
Parents’ Child Specific Beliefs
Expectations
Perceptions of child’s abilitiesand interests
Goals
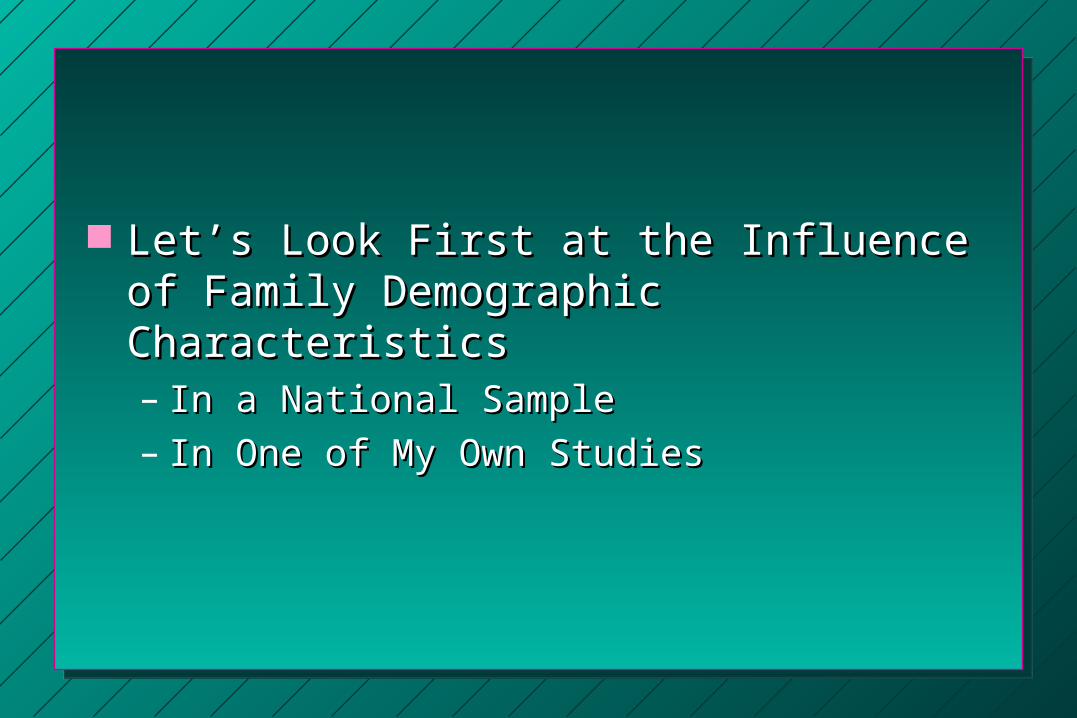
Let’s Look First at the Influence of Family Let’s Look First at the Influence of Family Demographic CharacteristicsDemographic Characteristics– In a National SampleIn a National Sample– In One of My Own StudiesIn One of My Own Studies
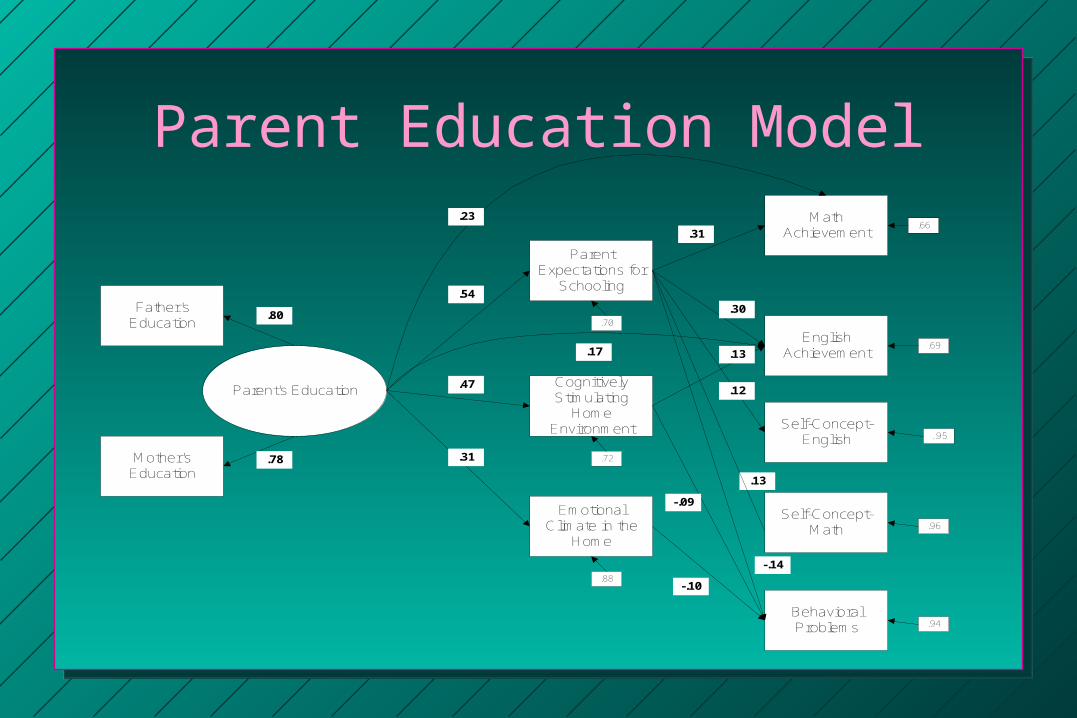
Parent Education Model
Parent's Education
Father'sEducation
Mother'sEducation
ParentExpectations for
Schooling
CognitivelyStimulating
HomeEnvironment
EmotionalClimate in the
Home
MathAchievement
EnglishAchievement
Self-Concept-English
BehavioralProblems
Self-Concept-Math
.80
.78 .31
.23
.54
.17
.47
.31
.30
.13
-.14
-.09
-.10
.12
.13
.70
.72
.88
.69
..95
.96
.94
.66
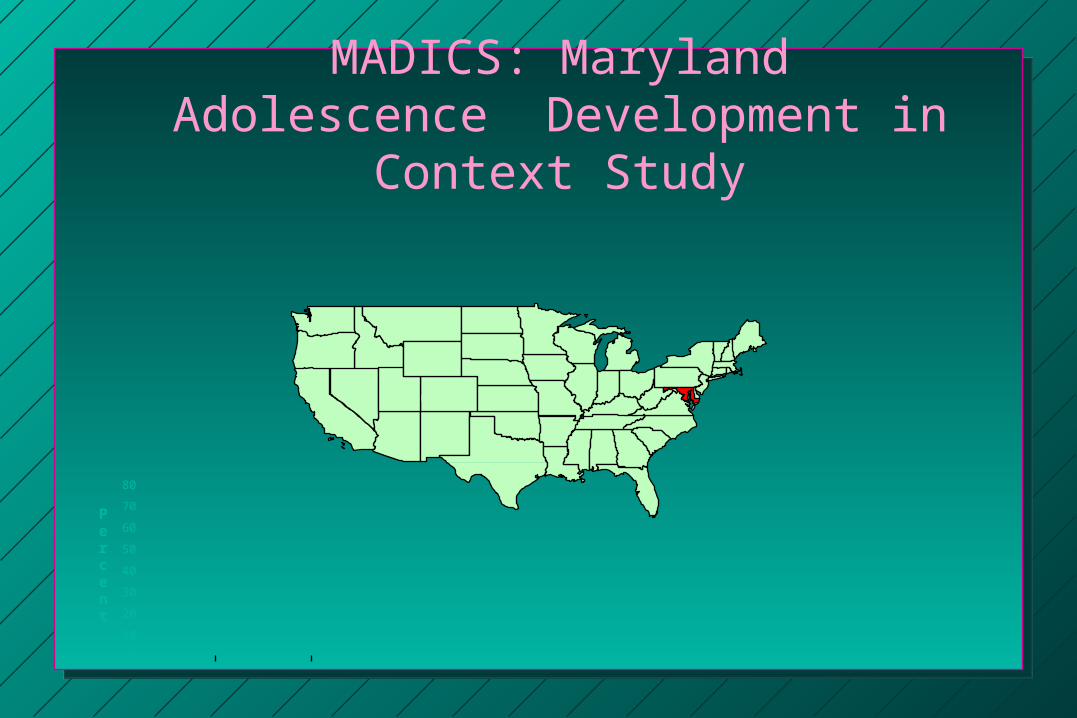
MADICS: Maryland Adolescence Development in Context Study
Percent
0
10
20
30
40
50
60
70
80
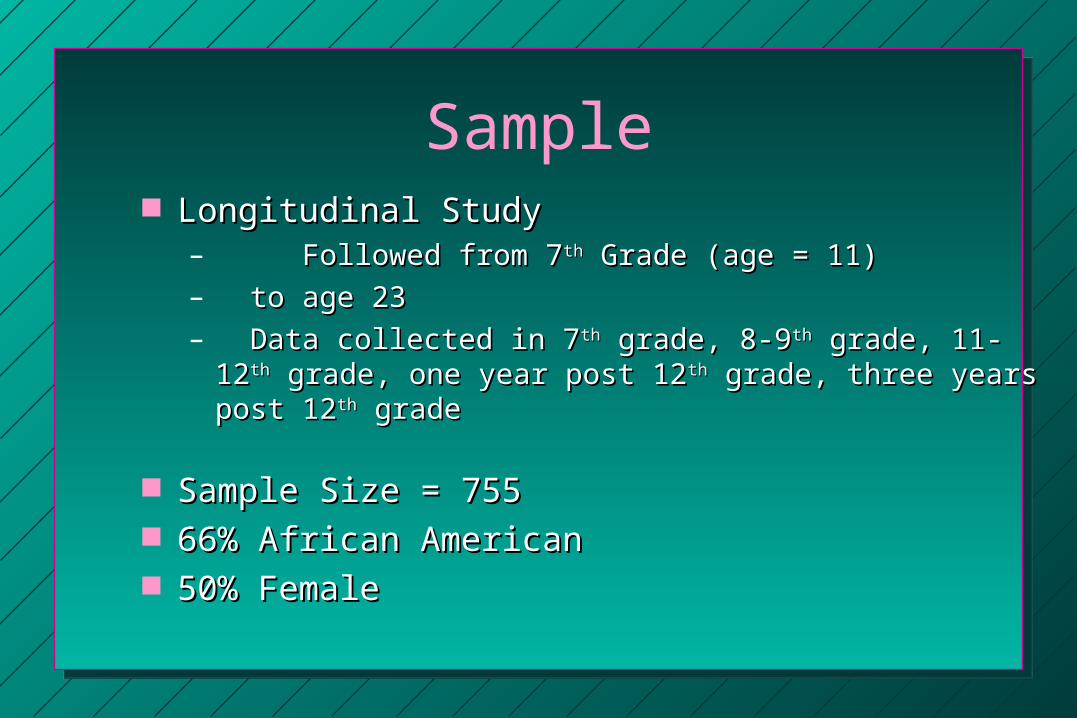
Sample Longitudinal StudyLongitudinal Study
– Followed from 7Followed from 7thth Grade (age = 11) Grade (age = 11)– to age 23to age 23– Data collected in 7Data collected in 7thth grade, 8-9 grade, 8-9thth grade, 11-12 grade, 11-12thth grade, grade,
one year post 12one year post 12thth grade, three years post 12 grade, three years post 12thth grade grade
Sample Size = 755Sample Size = 755 66% African American66% African American 50% Female50% Female
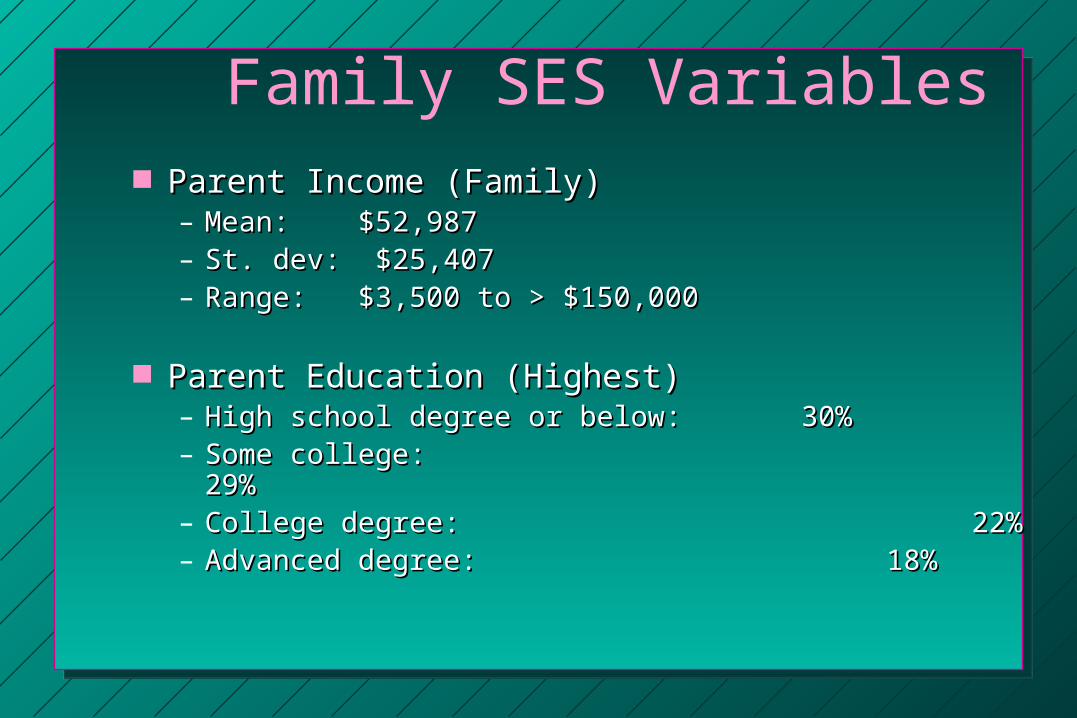
Family SES Variables Parent Income (Family)Parent Income (Family)
– Mean: $52,987 Mean: $52,987 – St. dev: $25,407St. dev: $25,407– Range: $3,500 to > $150,000Range: $3,500 to > $150,000
Parent Education (Highest)Parent Education (Highest)– High school degree or below: High school degree or below: 30%30%– Some college: 29%Some college: 29%– College degree: College degree: 22%22%– Advanced degree: Advanced degree: 18%18%
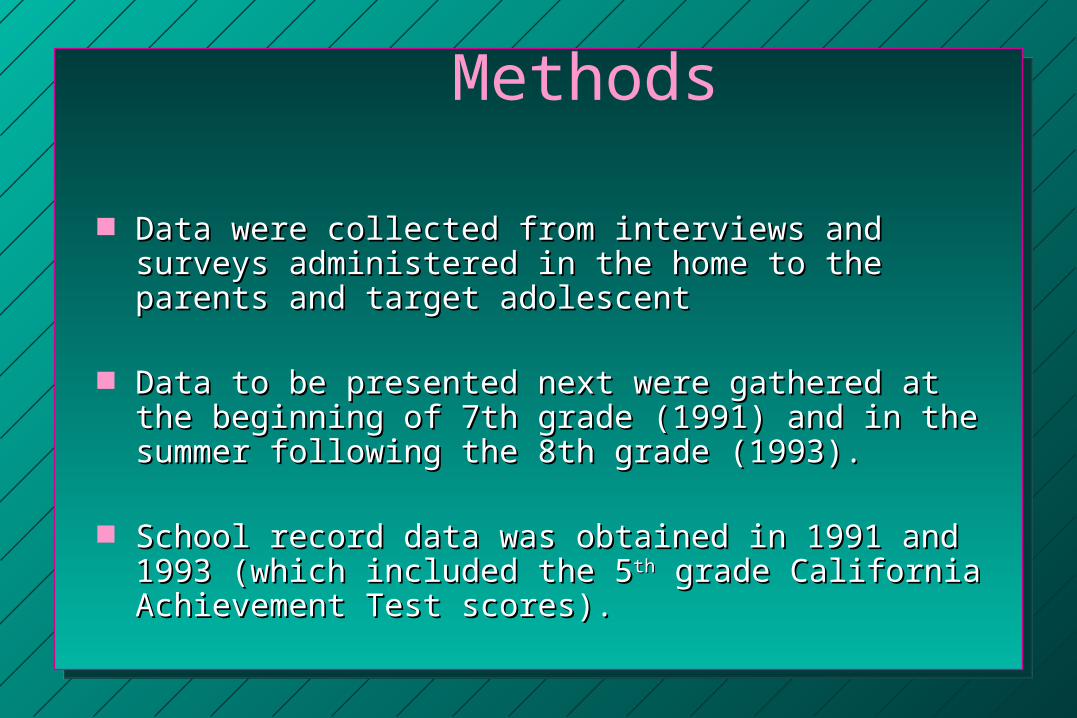
Methods
Data were collected from interviews and surveys Data were collected from interviews and surveys administered in the home to the parents and target administered in the home to the parents and target adolescent adolescent
Data to be presented next were gathered at the beginning of Data to be presented next were gathered at the beginning of 7th grade (1991) and in the summer following the 8th grade 7th grade (1991) and in the summer following the 8th grade (1993).(1993).
SSchool record data was obtained in 1991 and 1993 (which chool record data was obtained in 1991 and 1993 (which included the 5included the 5thth grade California Achievement Test scores). grade California Achievement Test scores).
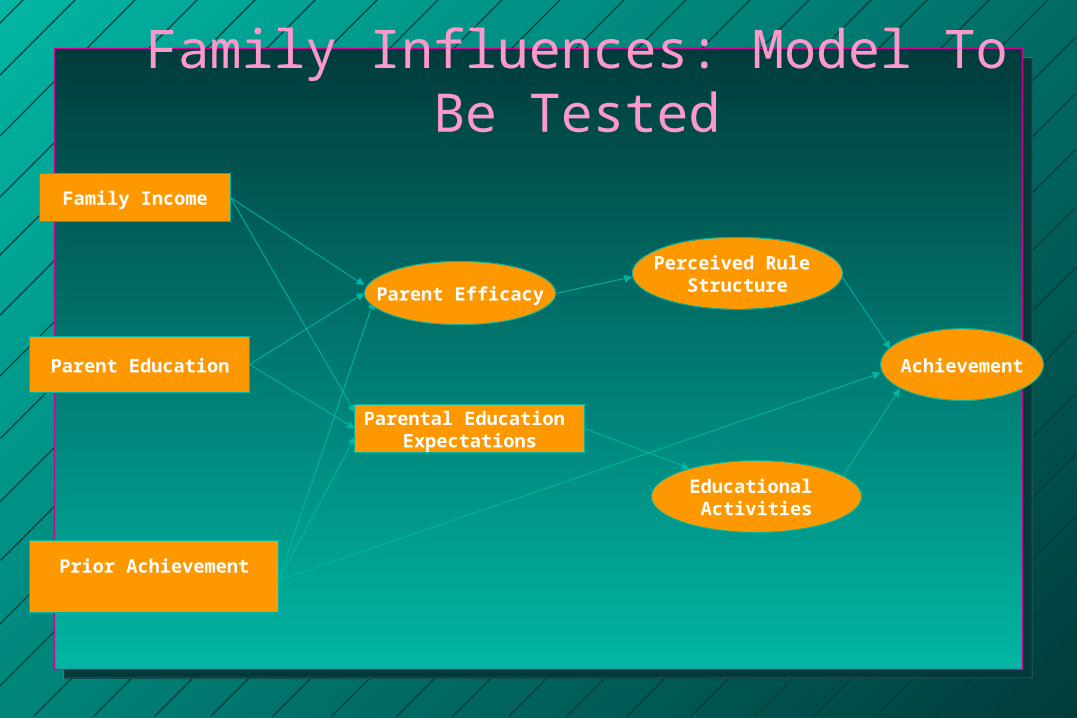
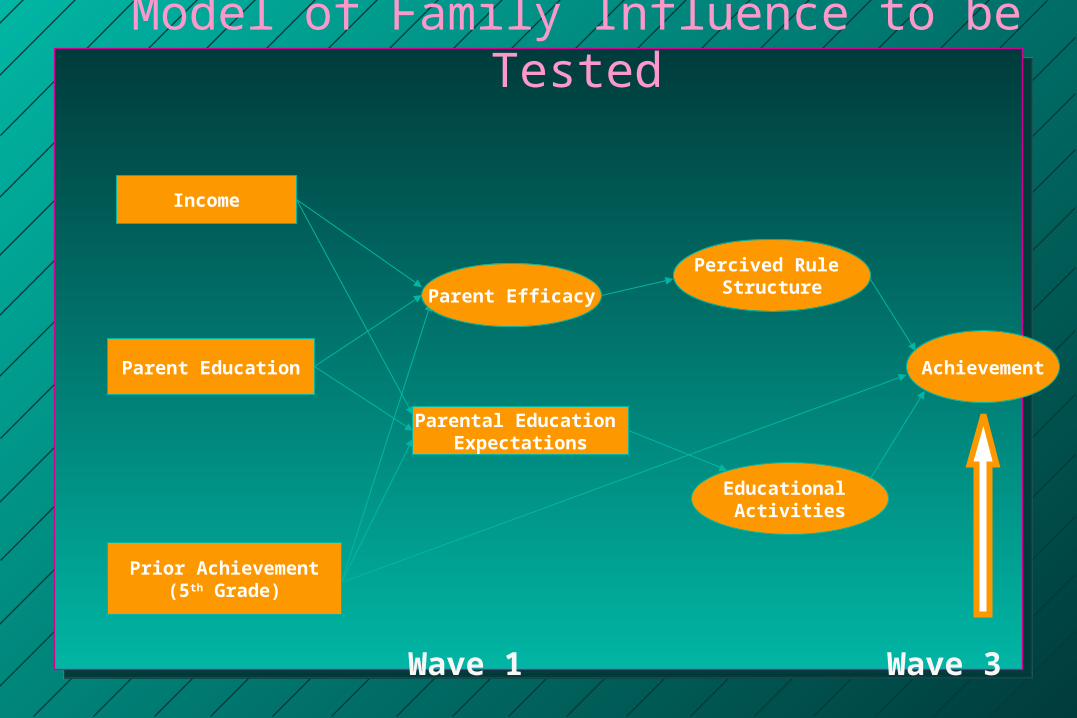
Family Influences: Model To Be Tested
Achievement
Family Income
Parent Education
Prior Achievement
Educational Activities
Parent Efficacy
Parental Education Expectations
Perceived Rule Structure
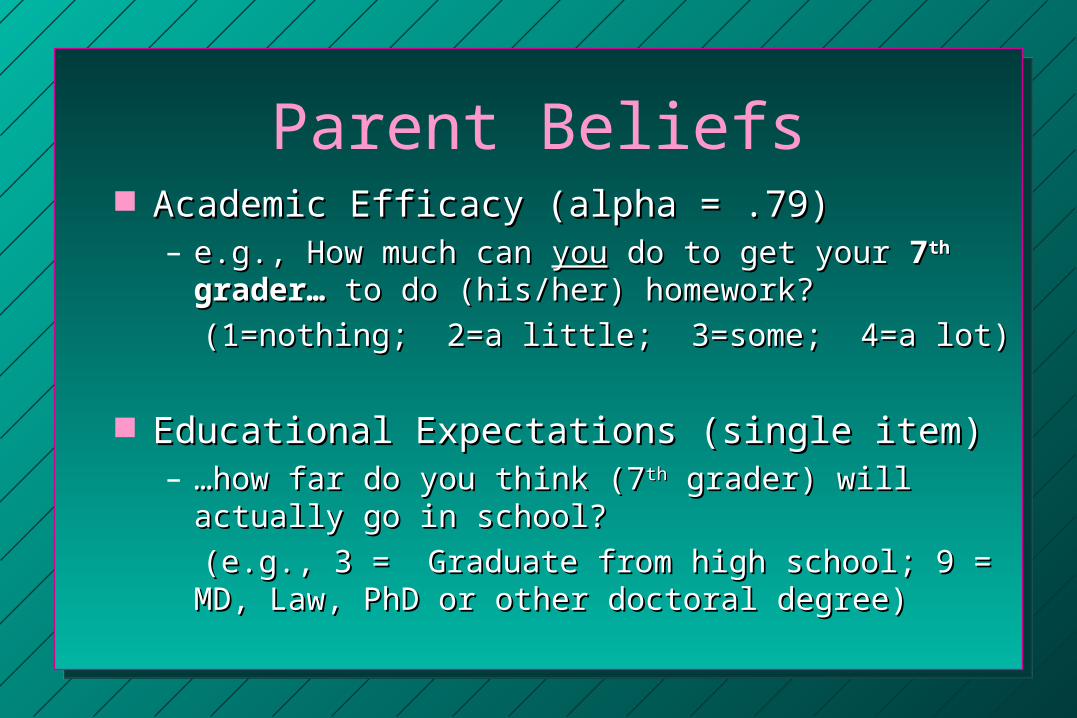
Parent Beliefs Academic Efficacy (alpha = .79)Academic Efficacy (alpha = .79)
– e.g., How much can e.g., How much can youyou do to get your do to get your 77thth grader… grader… to do to do (his/her) homework? (his/her) homework?
(1=nothing; 2=a little; 3=some; 4=a lot) (1=nothing; 2=a little; 3=some; 4=a lot)
Educational Expectations (single item)Educational Expectations (single item)– ……how far do you think (7how far do you think (7thth grader) will actually go in school? grader) will actually go in school?
(e.g., 3 = Graduate from high school; 9 = MD, Law, PhD or (e.g., 3 = Graduate from high school; 9 = MD, Law, PhD or other doctoral degree) other doctoral degree)
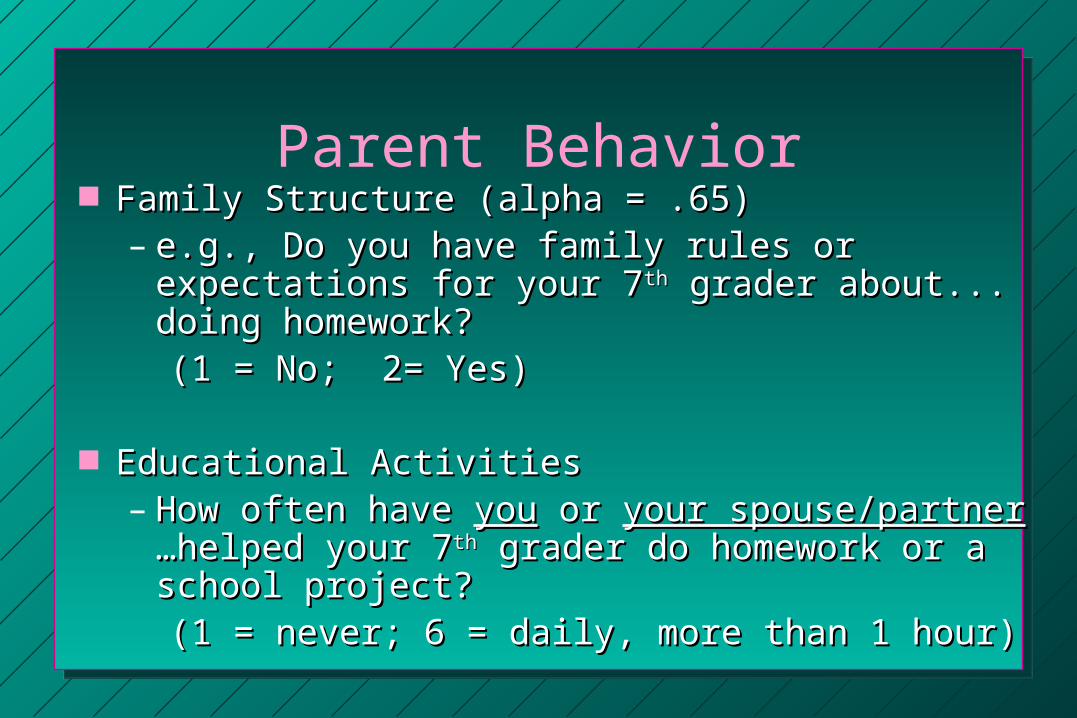
Parent Behavior Family Structure (alpha = .65)Family Structure (alpha = .65)
– e.g., Do you have family rules or expectations for e.g., Do you have family rules or expectations for your 7your 7thth grader about... doing homework? grader about... doing homework?
(1 = No; 2= Yes) (1 = No; 2= Yes)
Educational ActivitiesEducational Activities– How often have How often have youyou or or your spouse/partneryour spouse/partner … …
helped your 7helped your 7thth grader do homework or a school grader do homework or a school project? project?
(1 = never; 6 = daily, more than 1 hour)(1 = never; 6 = daily, more than 1 hour)
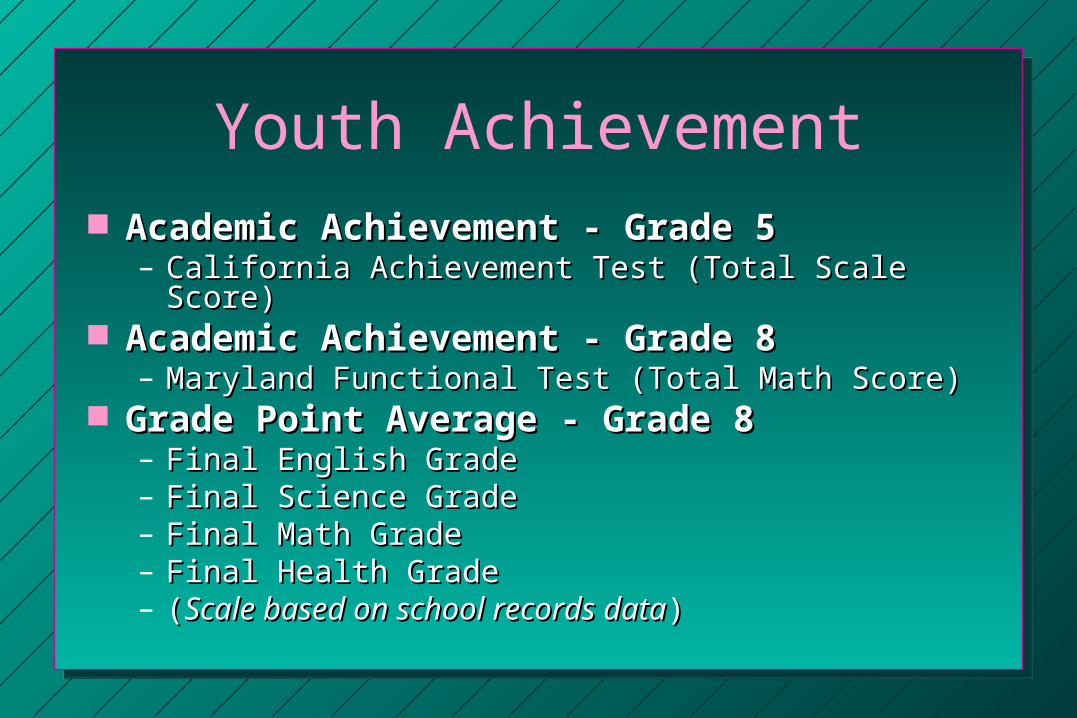
Youth Achievement Academic Achievement - Grade 5Academic Achievement - Grade 5
– California Achievement Test (Total Scale Score)California Achievement Test (Total Scale Score) Academic Achievement - Grade 8Academic Achievement - Grade 8
– Maryland Functional Test (Total Math Score)Maryland Functional Test (Total Math Score) Grade Point Average - Grade 8 Grade Point Average - Grade 8
– Final English Grade Final English Grade – Final Science GradeFinal Science Grade– Final Math GradeFinal Math Grade– Final Health GradeFinal Health Grade– ((Scale based on school records dataScale based on school records data))
Model of Family Influence to be Tested
Achievement
Income
Parent Education
Prior Achievement(5th Grade)
Educational Activities
Parent Efficacy
Parental Education Expectations
Percived Rule Structure
Wave 1 Wave 3
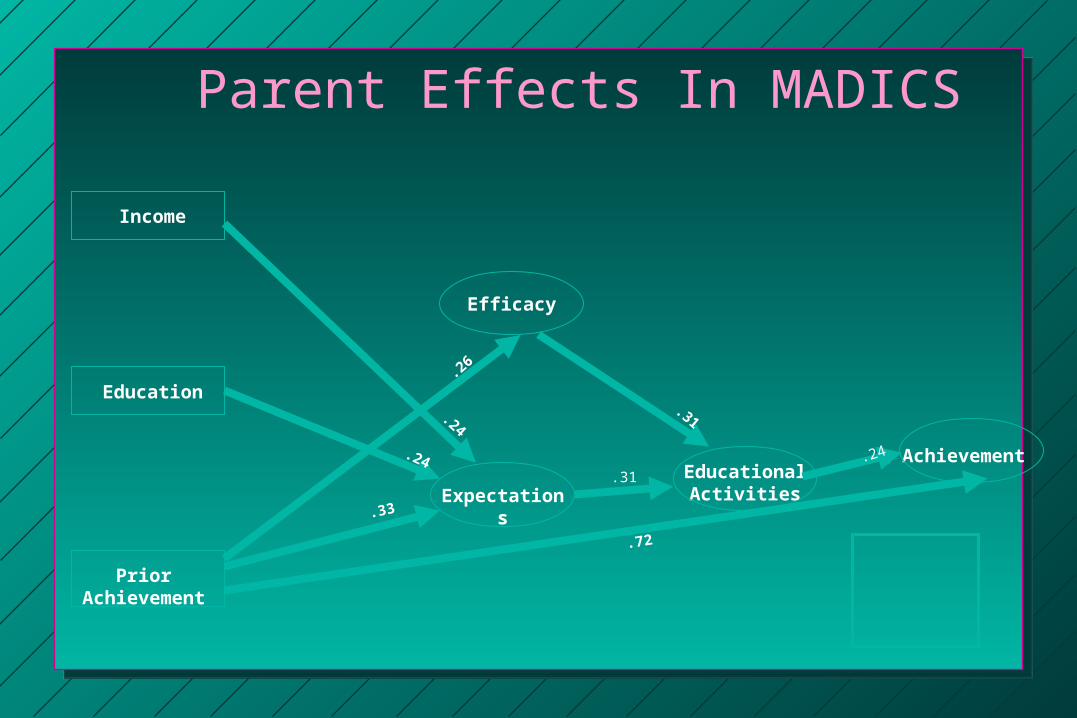
Income
Education
Prior Achievement
Efficacy
Educational Activities
Achievement
.26
.72
.24.24
.24.31
.33
.31Expectations
Parent Effects In MADICS
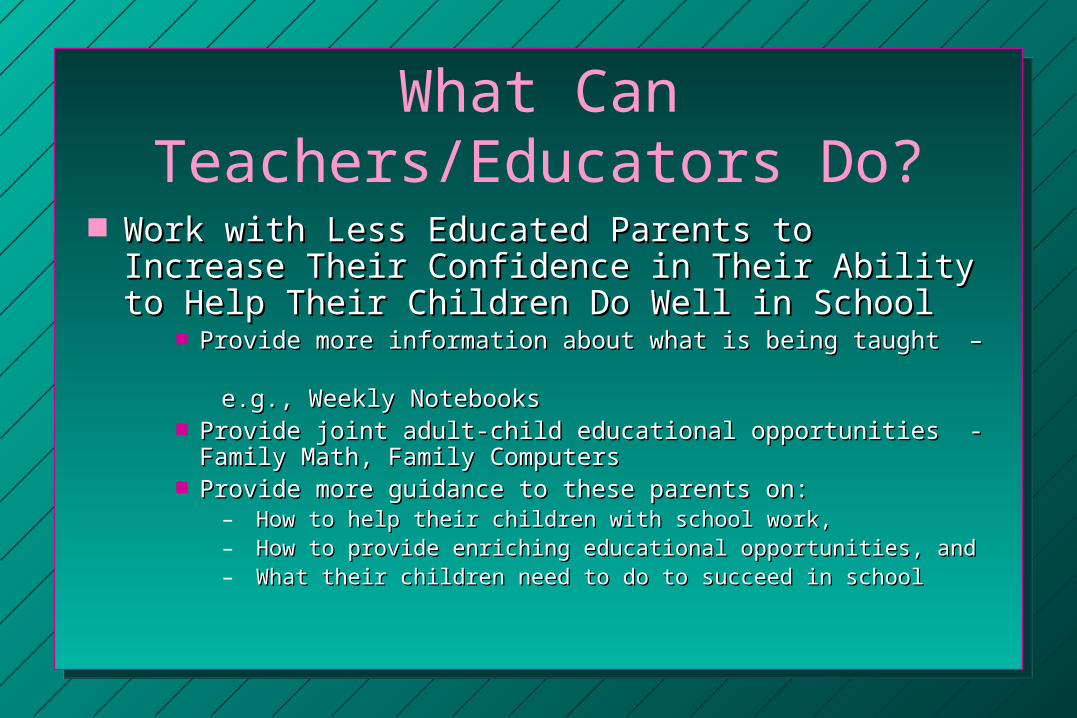
What Can Teachers/Educators Do?
Work with Less Educated Parents to Increase Their Work with Less Educated Parents to Increase Their Confidence in Their Ability to Help Their Children Confidence in Their Ability to Help Their Children Do Well in SchoolDo Well in School
Provide more information about what is being taught – Provide more information about what is being taught – e.g., Weekly Notebookse.g., Weekly Notebooks Provide joint adult-child educational opportunities - Family Math, Provide joint adult-child educational opportunities - Family Math,
Family ComputersFamily Computers Provide more guidance to these parents on:Provide more guidance to these parents on:
– How to help their children with school work, How to help their children with school work, – How to provide enriching educational opportunities, and How to provide enriching educational opportunities, and – What their children need to do to succeed in schoolWhat their children need to do to succeed in school
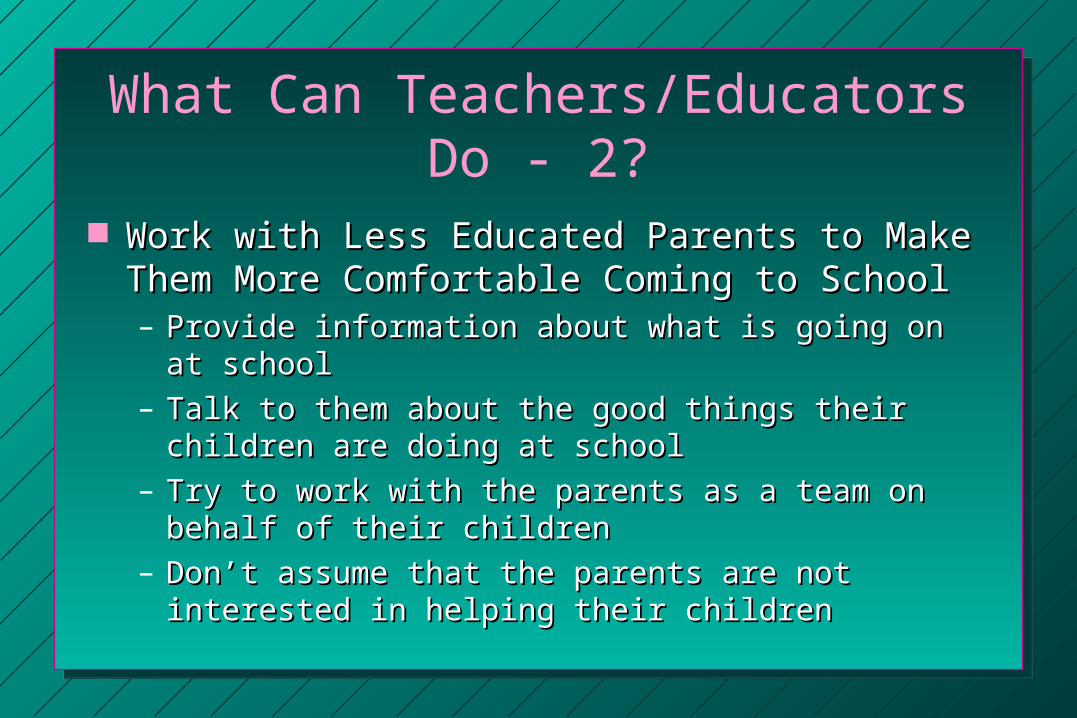
What Can Teachers/Educators Do - 2?
Work with Less Educated Parents to Make Them Work with Less Educated Parents to Make Them More Comfortable Coming to SchoolMore Comfortable Coming to School– Provide information about what is going on at schoolProvide information about what is going on at school– Talk to them about the good things their children are Talk to them about the good things their children are
doing at schooldoing at school– Try to work with the parents as a team on behalf of their Try to work with the parents as a team on behalf of their
childrenchildren– Don’t assume that the parents are not interested in Don’t assume that the parents are not interested in
helping their childrenhelping their children
What Else Do Parents Do To Influence Their Children’s Engagement in
Intellectual Activities?
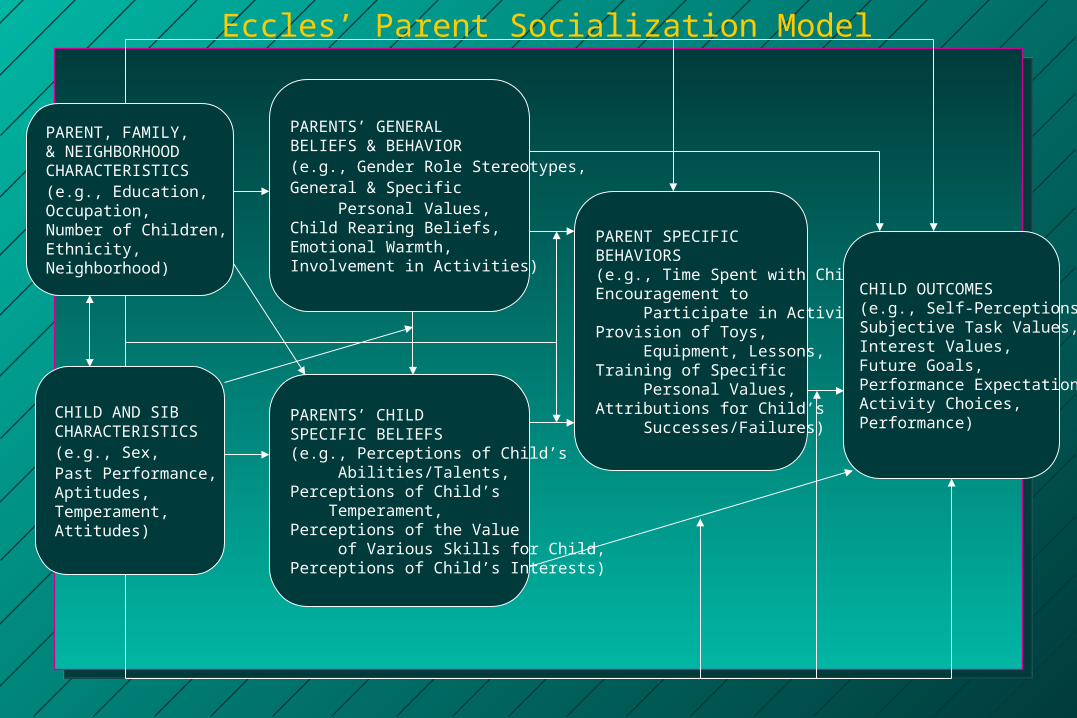
PARENT, FAMILY,& NEIGHBORHOODCHARACTERISTICS(e.g., Education, Occupation, Number of Children, Ethnicity, Neighborhood)
PARENTS’ GENERAL BELIEFS & BEHAVIOR(e.g., Gender Role Stereotypes,General & Specific Personal Values,Child Rearing Beliefs, Emotional Warmth,Involvement in Activities)
PARENT SPECIFICBEHAVIORS(e.g., Time Spent with Child, Encouragement to Participate in Activities,Provision of Toys, Equipment, Lessons, Training of Specific Personal Values,Attributions for Child’s Successes/Failures)
CHILD OUTCOMES(e.g., Self-Perceptions,Subjective Task Values,Interest Values,Future Goals,Performance Expectations,Activity Choices,Performance)PARENTS’ CHILD
SPECIFIC BELIEFS(e.g., Perceptions of Child’s Abilities/Talents, Perceptions of Child’s Temperament, Perceptions of the Value of Various Skills for Child, Perceptions of Child’s Interests)
CHILD AND SIBCHARACTERISTICS(e.g., Sex,Past Performance,Aptitudes,Temperament, Attitudes)
Eccles’ Parent Socialization Model
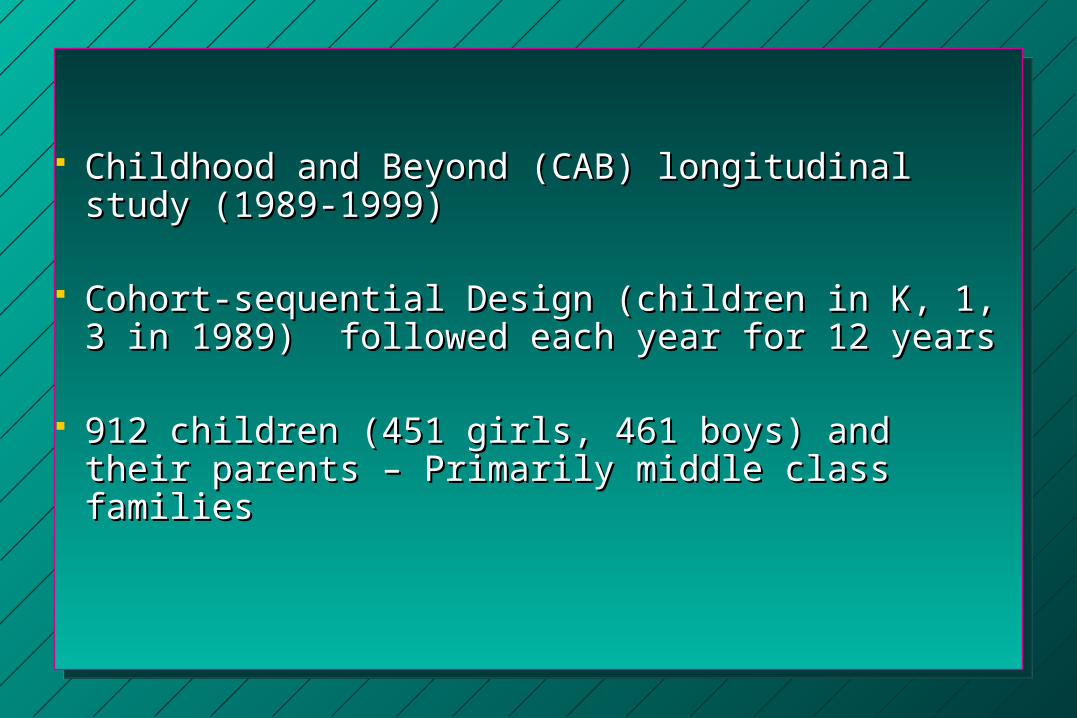
Childhood and Beyond (CAB) longitudinal study Childhood and Beyond (CAB) longitudinal study (1989-1999)(1989-1999)
Cohort-sequential Design (children in K, 1, 3 in Cohort-sequential Design (children in K, 1, 3 in 1989) followed each year for 12 years1989) followed each year for 12 years
912 children (451 girls, 461 boys) and their 912 children (451 girls, 461 boys) and their parents – Primarily middle class familiesparents – Primarily middle class families
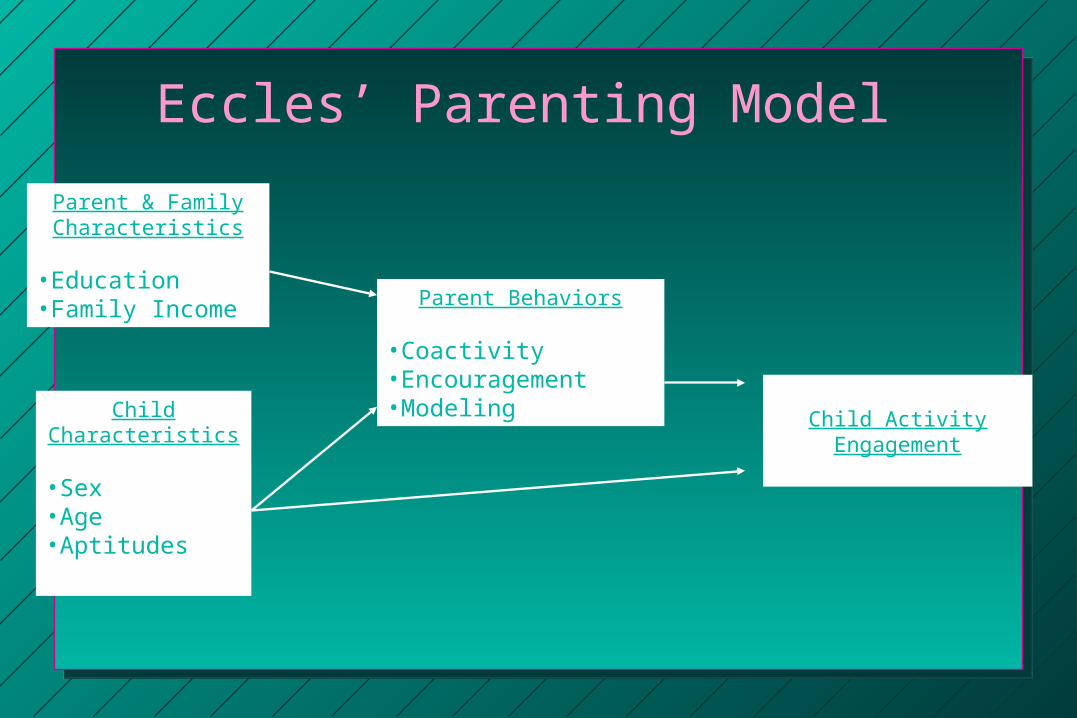
Eccles’ Parenting Model
Parent & Family Characteristics
•Education•Family Income
Child Characteristics
•Sex•Age•Aptitudes
Parent Behaviors
•Coactivity•Encouragement•Modeling Child Activity
Engagement
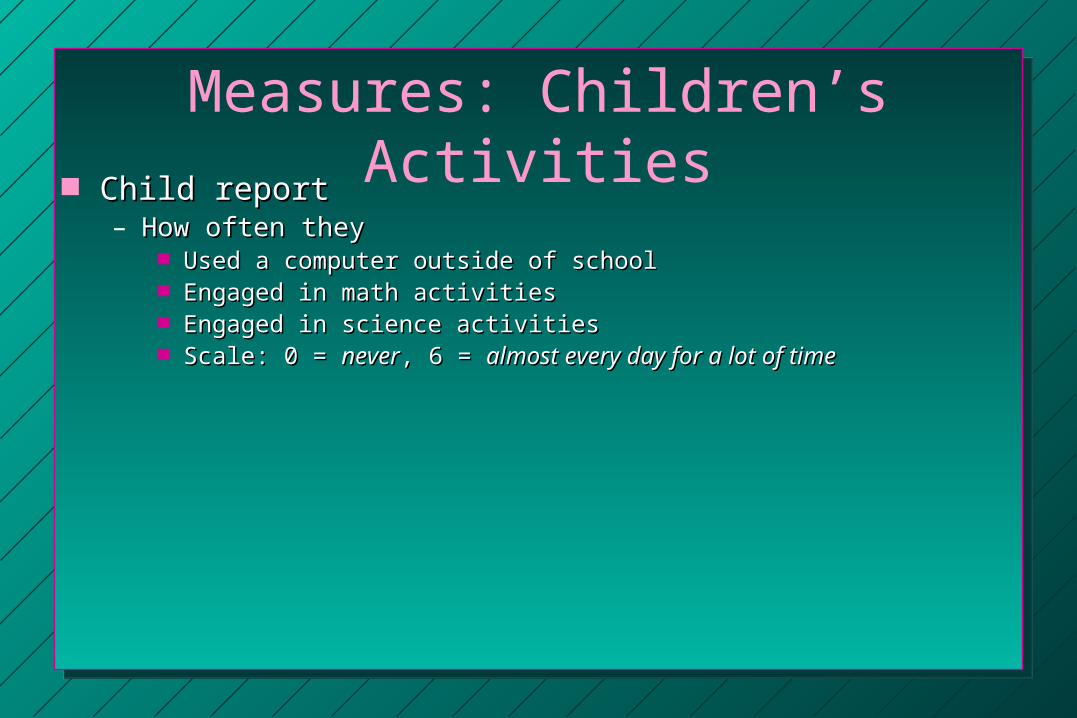
Measures: Children’s Activities Child reportChild report
– How often they How often they Used a computer outside of school Used a computer outside of school Engaged in math activitiesEngaged in math activities Engaged in science activitiesEngaged in science activities Scale: 0 = Scale: 0 = nevernever, 6 = , 6 = almost every day for a lot of timealmost every day for a lot of time
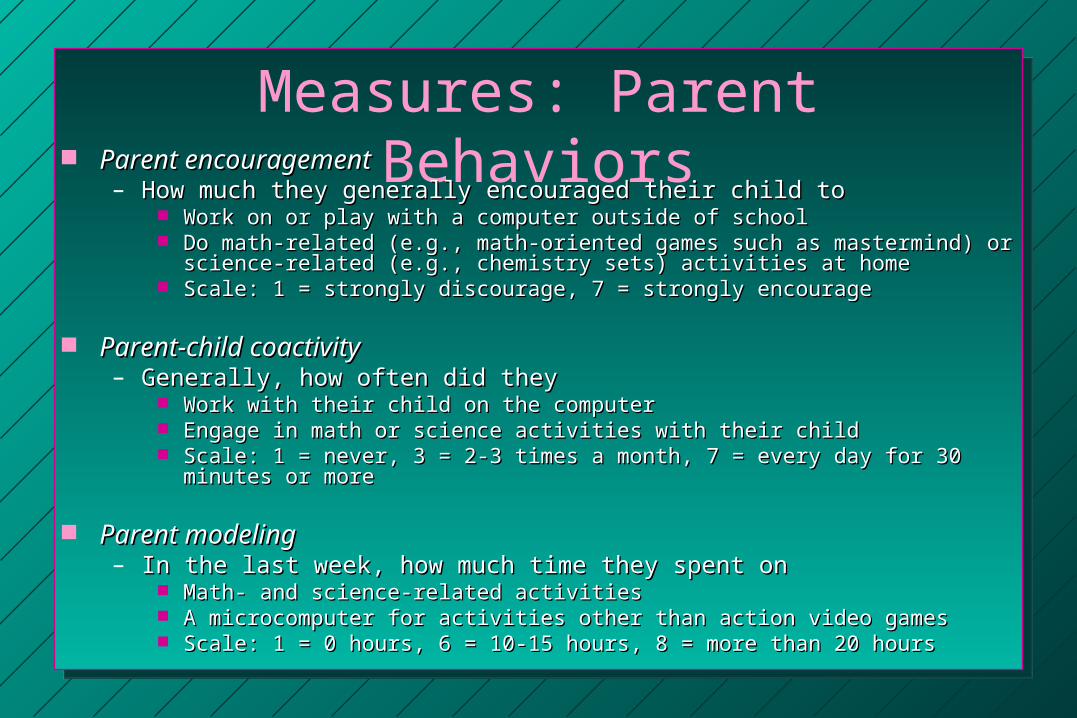
Measures: Parent Behaviors Parent encouragementParent encouragement
– How much they generally encouraged their child to How much they generally encouraged their child to Work on or play with a computer outside of schoolWork on or play with a computer outside of school Do math-related (e.g., math-oriented games such as mastermind) or science-related Do math-related (e.g., math-oriented games such as mastermind) or science-related
(e.g., chemistry sets) activities at home(e.g., chemistry sets) activities at home Scale: 1 = strongly discourage, 7 = strongly encourageScale: 1 = strongly discourage, 7 = strongly encourage
Parent-child coactivityParent-child coactivity– Generally, how often did they Generally, how often did they
Work with their child on the computerWork with their child on the computer Engage in math or science activities with their childEngage in math or science activities with their child Scale: 1 = never, 3 = 2-3 times a month, 7 = every day for 30 minutes or more Scale: 1 = never, 3 = 2-3 times a month, 7 = every day for 30 minutes or more
Parent modelingParent modeling– In the last week, how much time they spent on In the last week, how much time they spent on
Math- and science-related activitiesMath- and science-related activities A microcomputer for activities other than action video gamesA microcomputer for activities other than action video games Scale: 1 = 0 hours, 6 = 10-15 hours, 8 = more than 20 hoursScale: 1 = 0 hours, 6 = 10-15 hours, 8 = more than 20 hours
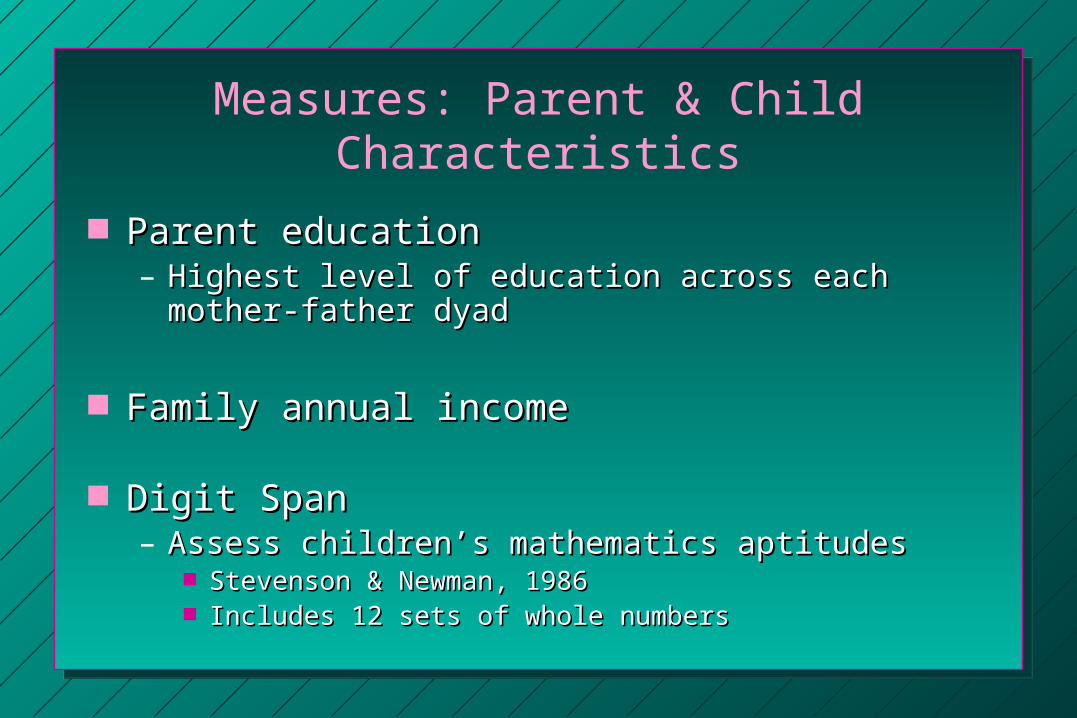
Measures: Parent & Child Characteristics
Parent educationParent education– Highest level of education across each mother-father Highest level of education across each mother-father
dyaddyad
Family annual income Family annual income
Digit SpanDigit Span– Assess children’s mathematics aptitudes Assess children’s mathematics aptitudes
Stevenson & Newman, 1986Stevenson & Newman, 1986 Includes 12 sets of whole numbersIncludes 12 sets of whole numbers
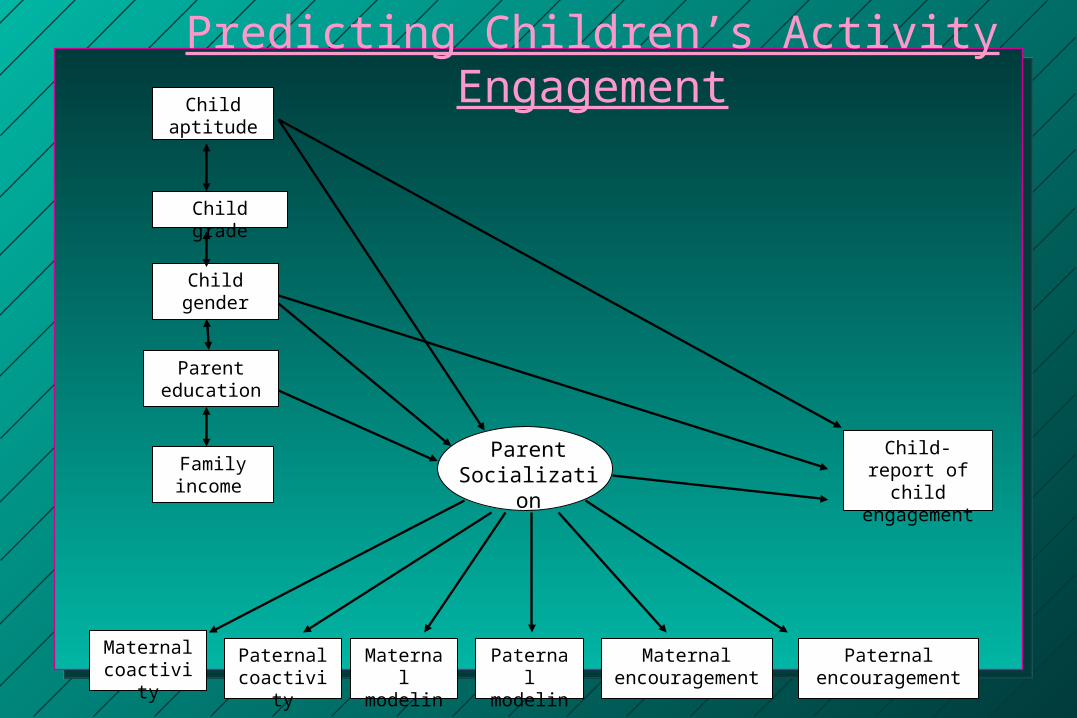
Predicting Children’s Activity Engagement
Maternal coactivity
Paternal coactivity
Maternal modeling
Paternal modeling
Maternal encouragement
Paternal encouragement
Child-report of child
engagement
Child grade
Child gender
Parent education
Family income
Parent Socialization
Child aptitude
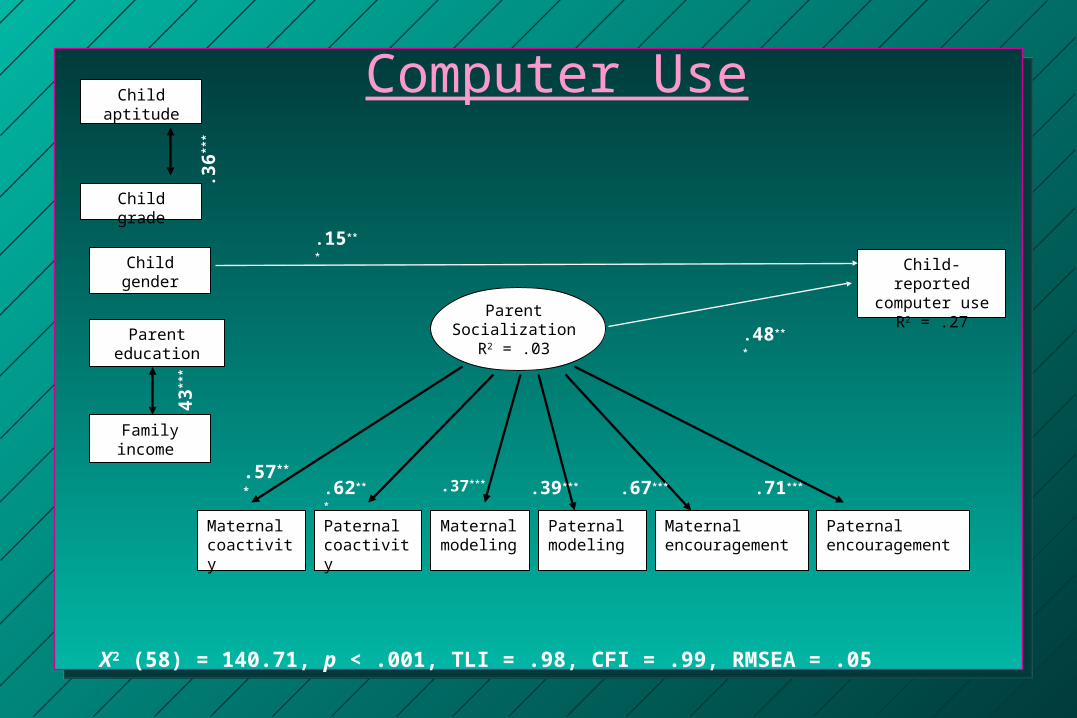
Computer Use
Maternal coactivity
Paternal coactivity
Maternal modeling
Paternal modeling
Maternal encouragement
Paternal encouragement
Child-reported computer use
R2 = .27
Child grade
Child gender
Parent education
Family income
Parent Socialization
R2 = .03
.43**
*
.36**
*
.48***
.37***.62***.57***
.71***.67***.39***
.15***
Child aptitude
X2 (58) = 140.71, p < .001, TLI = .98, CFI = .99, RMSEA = .05
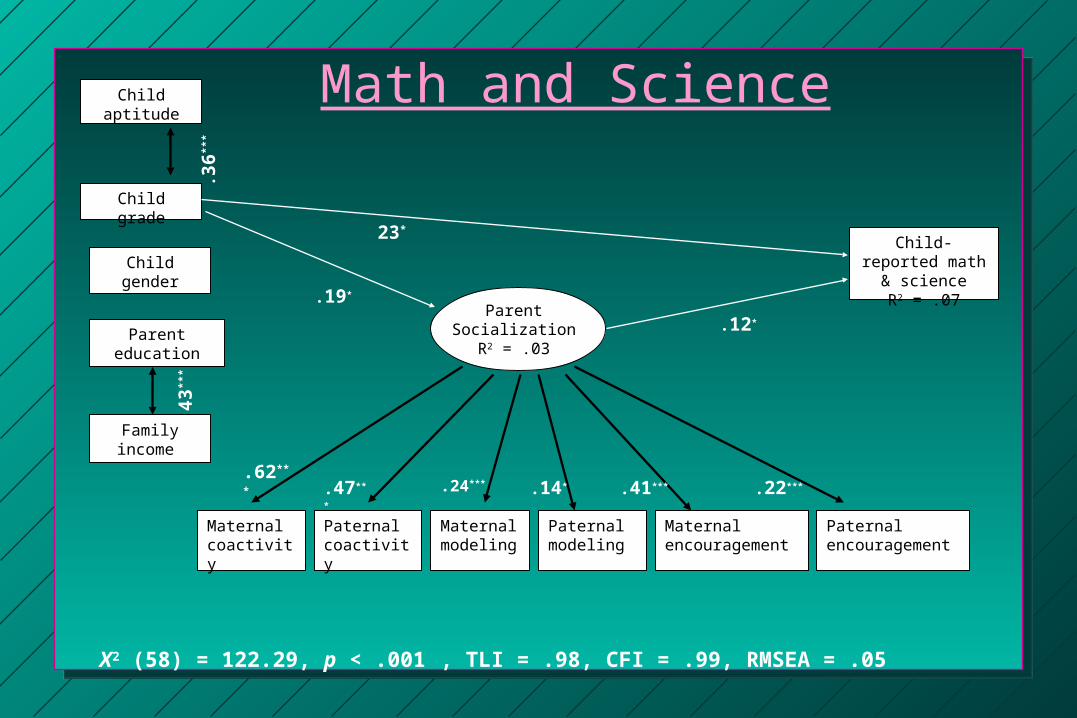
Math and Science
Maternal coactivity
Paternal coactivity
Maternal modeling
Paternal modeling
Maternal encouragement
Paternal encouragement
Child-reported math & science
R2 = .07
Child grade
Child gender
Parent education
Family income
Parent Socialization
R2 = .03
.43**
*
.36**
*
.12*
.24***.47***.62***
.22***.41***.14*
23*
.19*
Child aptitude
X2 (58) = 122.29, p < .001 , TLI = .98, CFI = .99, RMSEA = .05
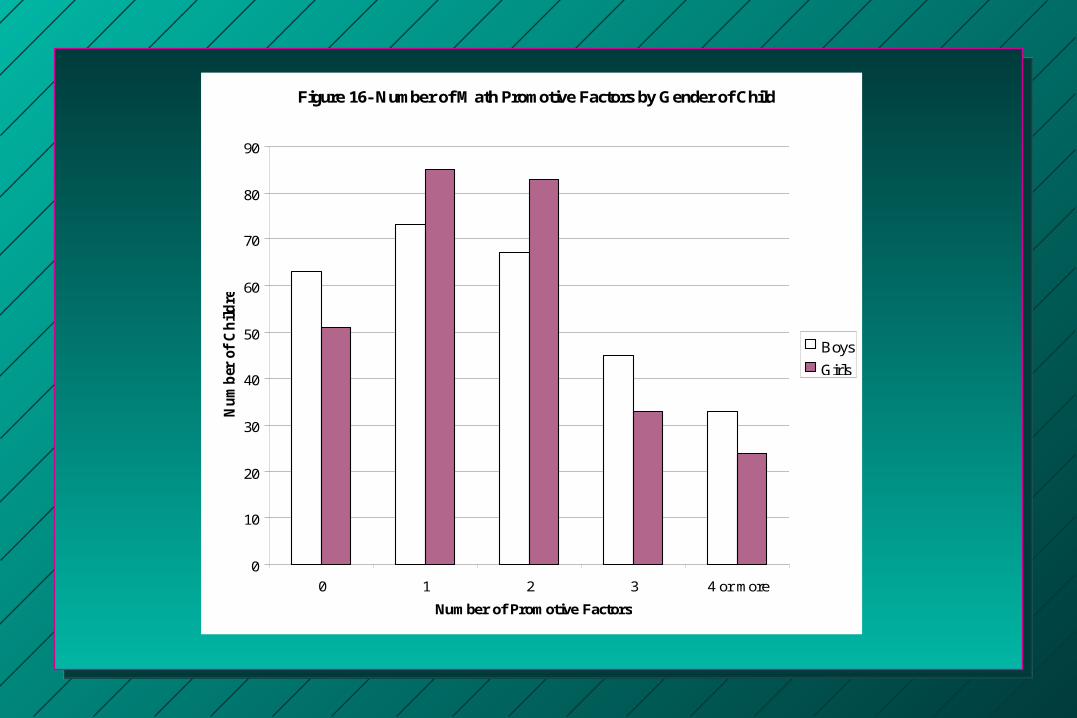
Figure 16- Number of Math Promotive Factors by Gender of Child
0
10
20
30
40
50
60
70
80
90
0 1 2 3 4 or more
Number of Promotive Factors
Nu
mb
er o
f C
hil
dre
n
Boys
Girls
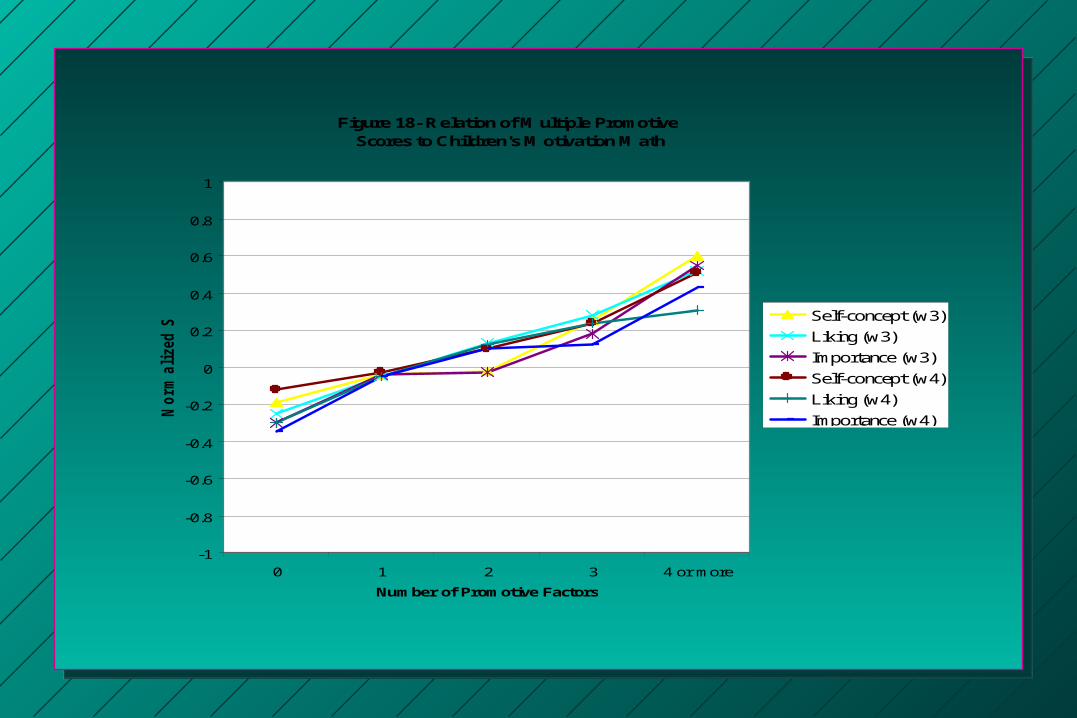
Figure 18- Relation of Multiple Promotive Scores to Children's Motivation Math
-1
-0.8
-0.6
-0.4
-0.2
0
0.2
0.4
0.6
0.8
1
0 1 2 3 4 or more
Number of Promotive Factors
Norm
ali
zed
Sco
res
Self-concept (w3)
Liking (w3)
Importance (w3)
Self-concept (w4)
Liking (w4)
Importance (w4)
Conclusions
Synergistic combination of socialization Synergistic combination of socialization methodsmethods
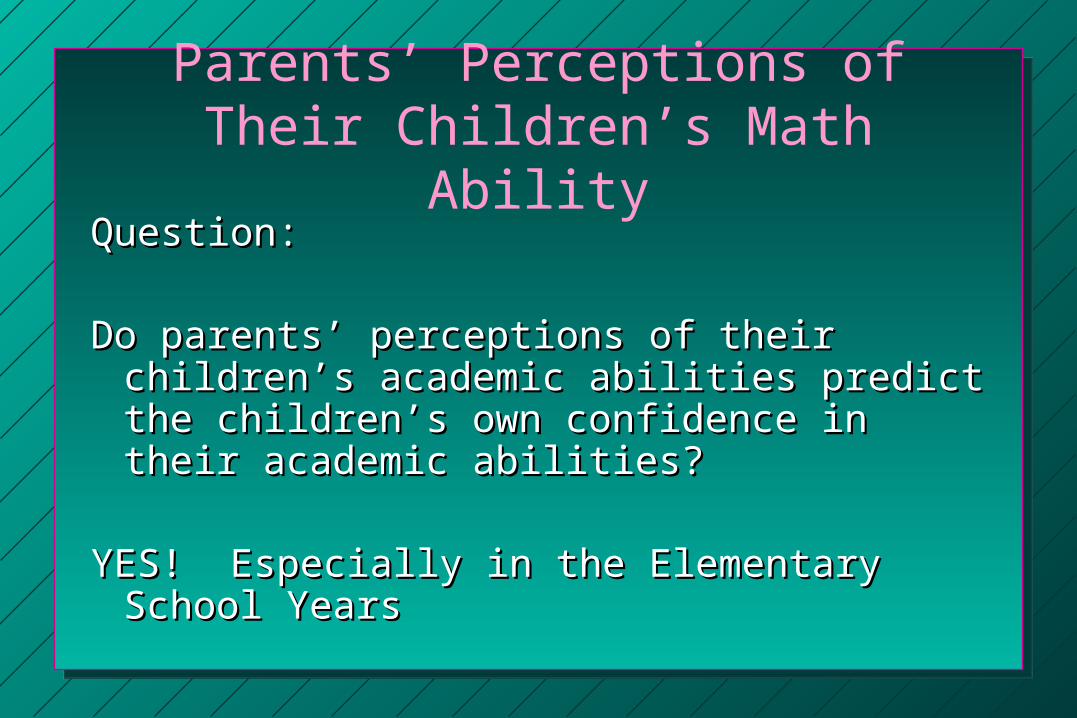
Parents’ Perceptions of Their Children’s Math Ability
Question: Question:
Do parents’ perceptions of their children’s Do parents’ perceptions of their children’s academic abilities predict the children’s own academic abilities predict the children’s own confidence in their academic abilities?confidence in their academic abilities?
YES! Especially in the Elementary School YES! Especially in the Elementary School YearsYears
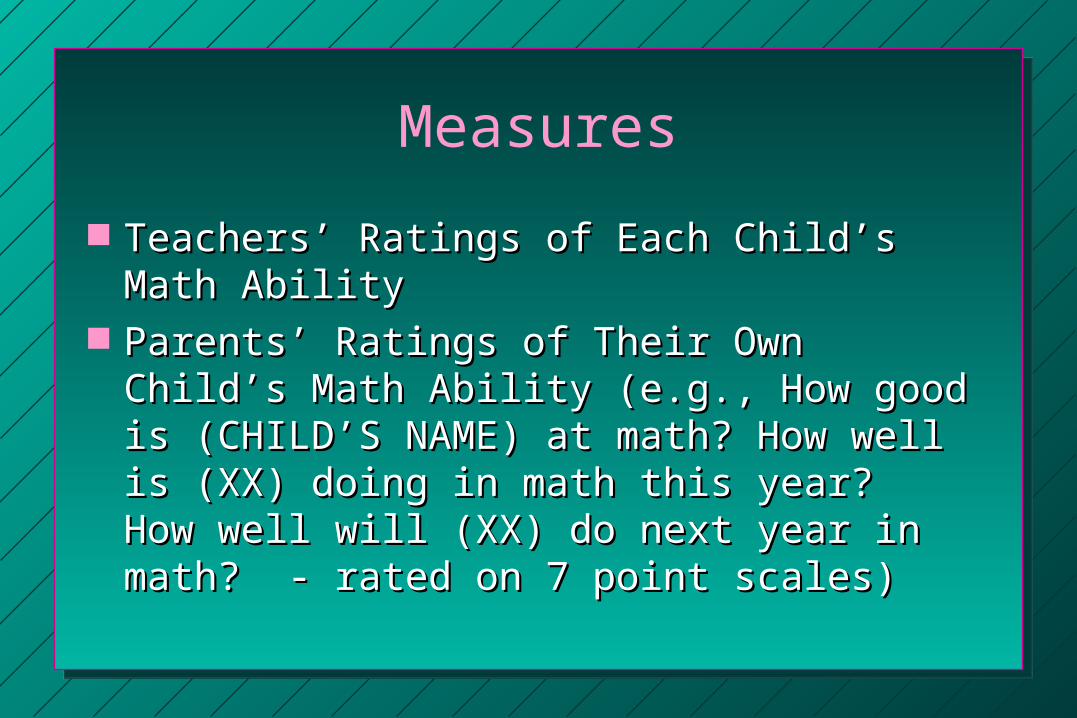
Measures
Teachers’ Ratings of Each Child’s Math Teachers’ Ratings of Each Child’s Math AbilityAbility
Parents’ Ratings of Their Own Child’s Math Parents’ Ratings of Their Own Child’s Math Ability (e.g., How good is (CHILD’S NAME) at Ability (e.g., How good is (CHILD’S NAME) at math? How well is (XX) doing in math this math? How well is (XX) doing in math this year? How well will (XX) do next year in year? How well will (XX) do next year in math? - rated on 7 point scales)math? - rated on 7 point scales)
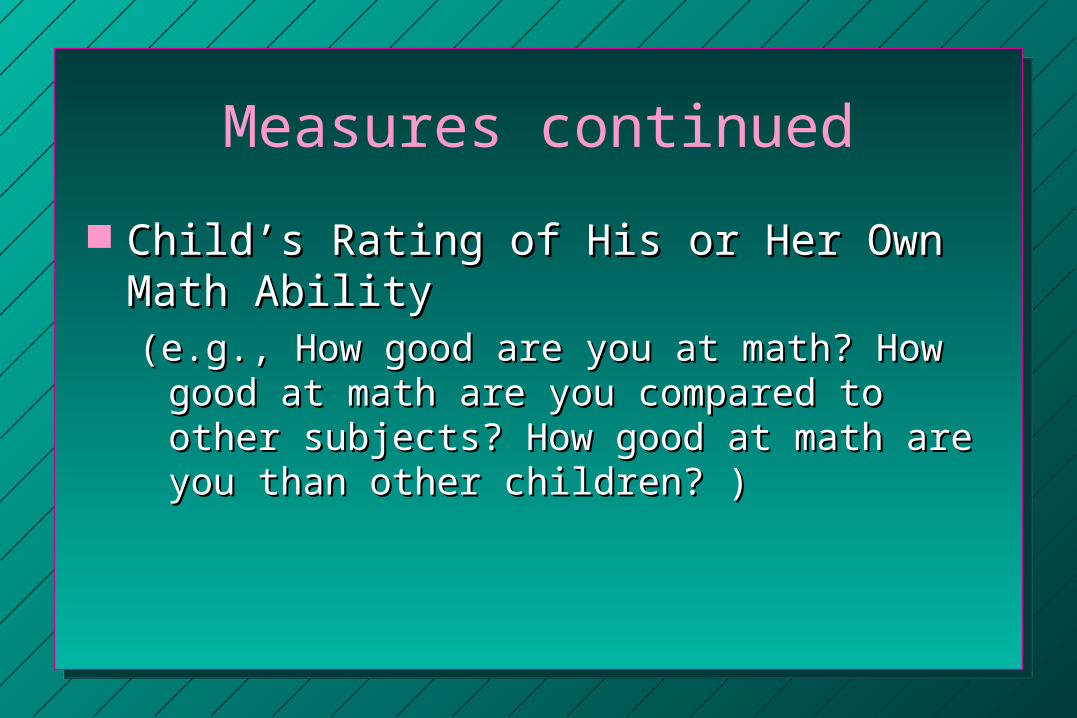
Measures continued
Child’s Rating of His or Her Own Math AbilityChild’s Rating of His or Her Own Math Ability(e.g., How good are you at math? How good at (e.g., How good are you at math? How good at
math are you compared to other subjects? How math are you compared to other subjects? How good at math are you than other children? )good at math are you than other children? )
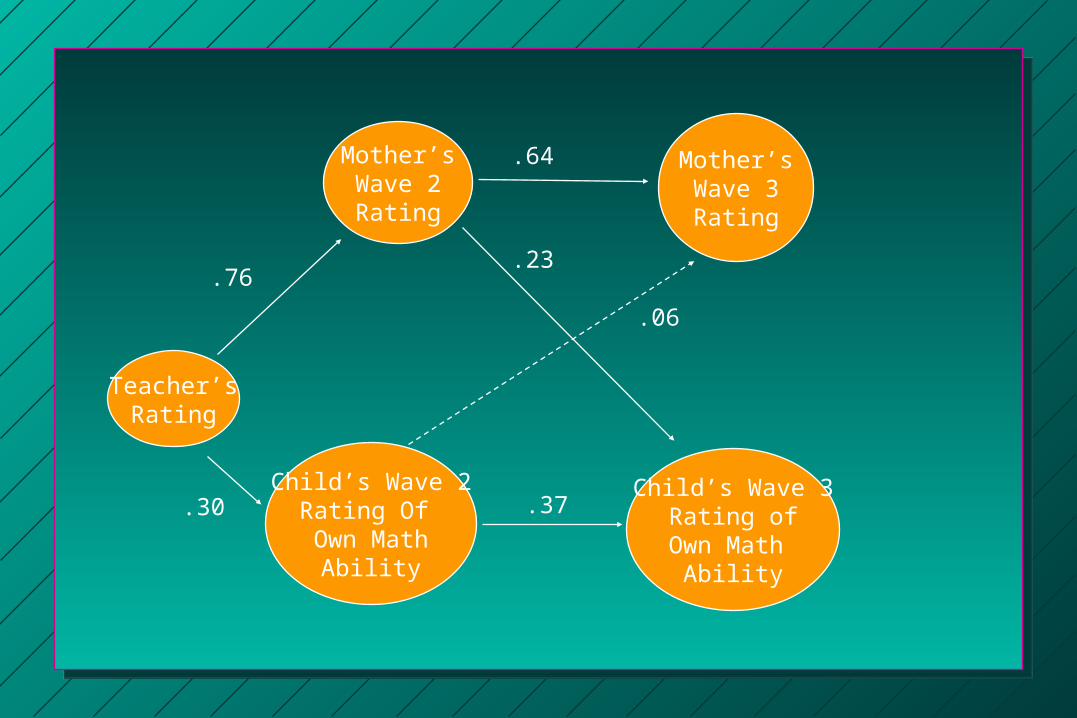
Teacher’sRating
Mother’sWave 2Rating
Child’s Wave 2Rating Of Own Math
Ability
Mother’sWave 3Rating
Child’s Wave 3Rating of
Own Math Ability
.76
.30
.64
.37
.23
.06
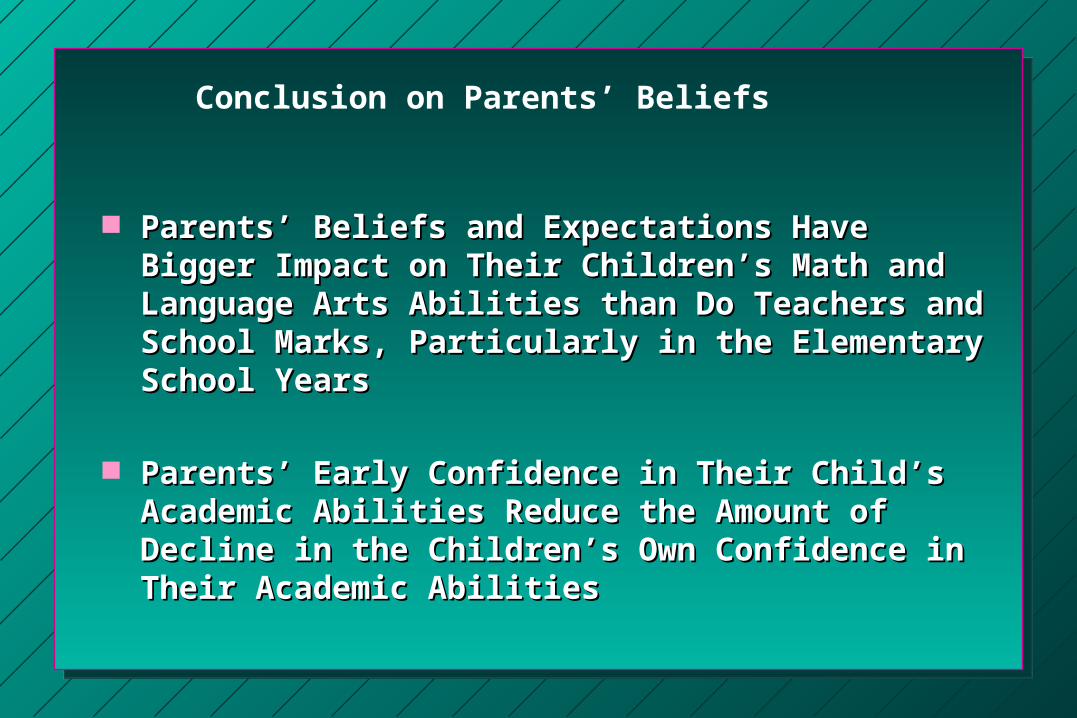
Parents’ Beliefs and Expectations Have Bigger Impact Parents’ Beliefs and Expectations Have Bigger Impact on Their Children’s Math and Language Arts Abilities on Their Children’s Math and Language Arts Abilities than Do Teachers and School Marks, Particularly in the than Do Teachers and School Marks, Particularly in the Elementary School YearsElementary School Years
Parents’ Early Confidence in Their Child’s Academic Parents’ Early Confidence in Their Child’s Academic Abilities Reduce the Amount of Decline in the Children’s Abilities Reduce the Amount of Decline in the Children’s Own Confidence in Their Academic AbilitiesOwn Confidence in Their Academic Abilities
Conclusion on Parents’ Beliefs
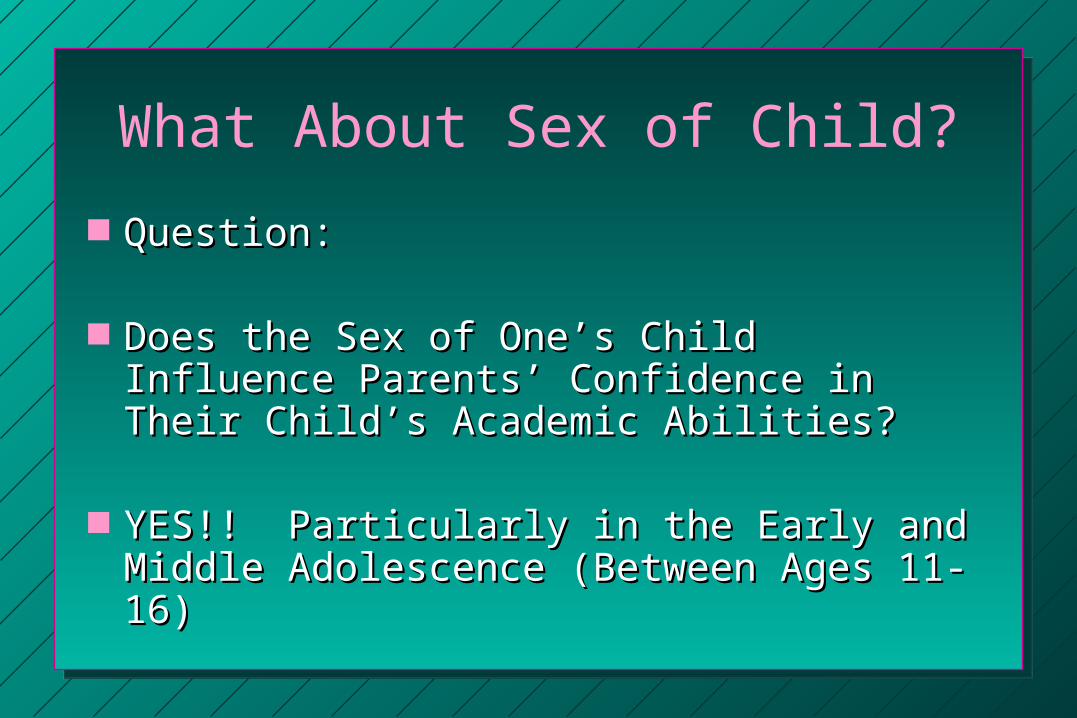
What About Sex of Child?
Question:Question:
Does the Sex of One’s Child Influence Does the Sex of One’s Child Influence Parents’ Confidence in Their Child’s Parents’ Confidence in Their Child’s Academic Abilities?Academic Abilities?
YES!! Particularly in the Early and Middle YES!! Particularly in the Early and Middle Adolescence (Between Ages 11-16)Adolescence (Between Ages 11-16)
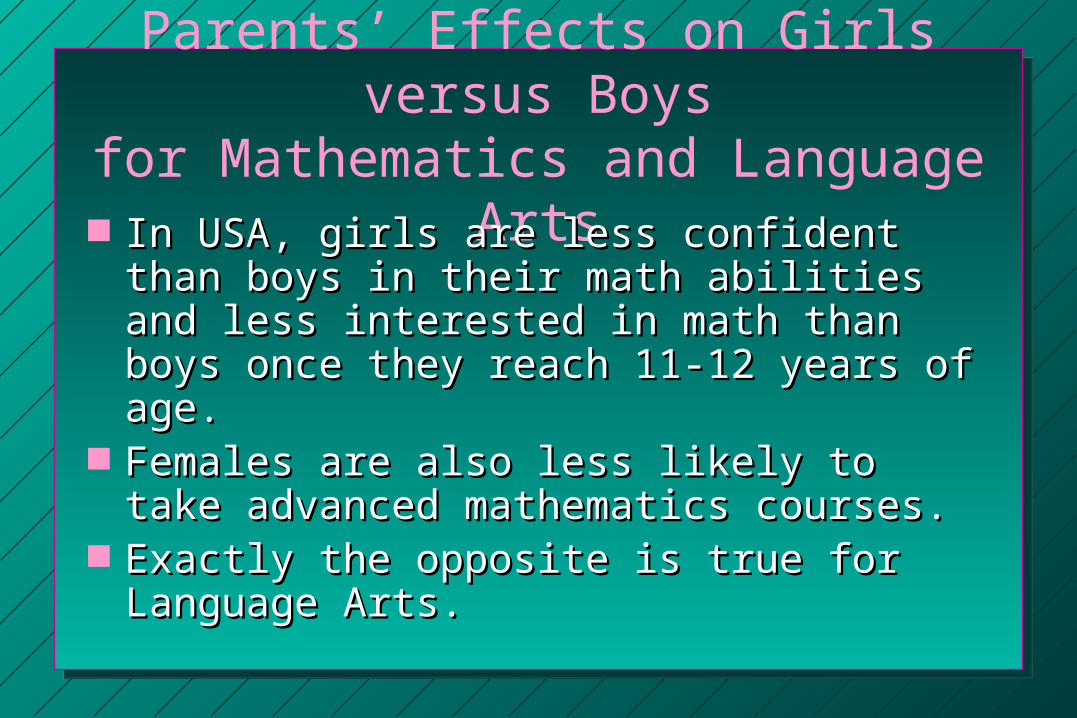
Parents’ Effects on Girls versus Boysfor Mathematics and Language Arts
In USA, girls are less confident than boys in In USA, girls are less confident than boys in their math abilities and less interested in their math abilities and less interested in math than boys once they reach 11-12 years math than boys once they reach 11-12 years of age. of age.
Females are also less likely to take advanced Females are also less likely to take advanced mathematics courses.mathematics courses.
Exactly the opposite is true for Language Exactly the opposite is true for Language Arts.Arts.
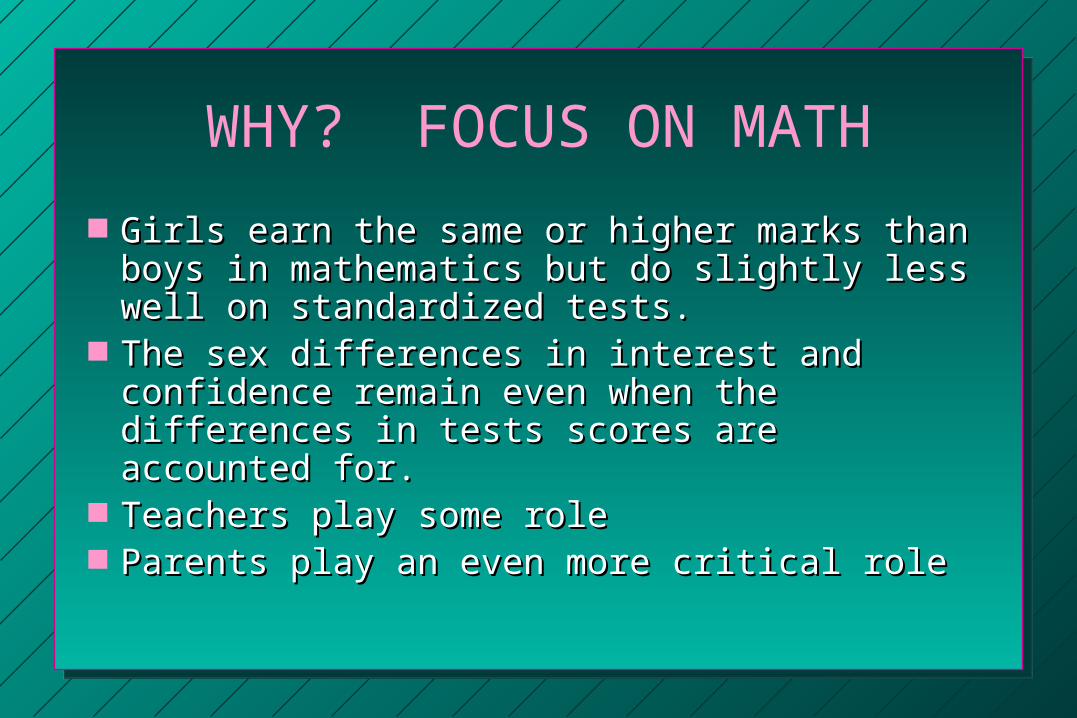
WHY? FOCUS ON MATH
Girls earn the same or higher marks than Girls earn the same or higher marks than boys in mathematics but do slightly less well boys in mathematics but do slightly less well on standardized tests.on standardized tests.
The sex differences in interest and The sex differences in interest and confidence remain even when the differences confidence remain even when the differences in tests scores are accounted for.in tests scores are accounted for.
Teachers play some roleTeachers play some role Parents play an even more critical roleParents play an even more critical role
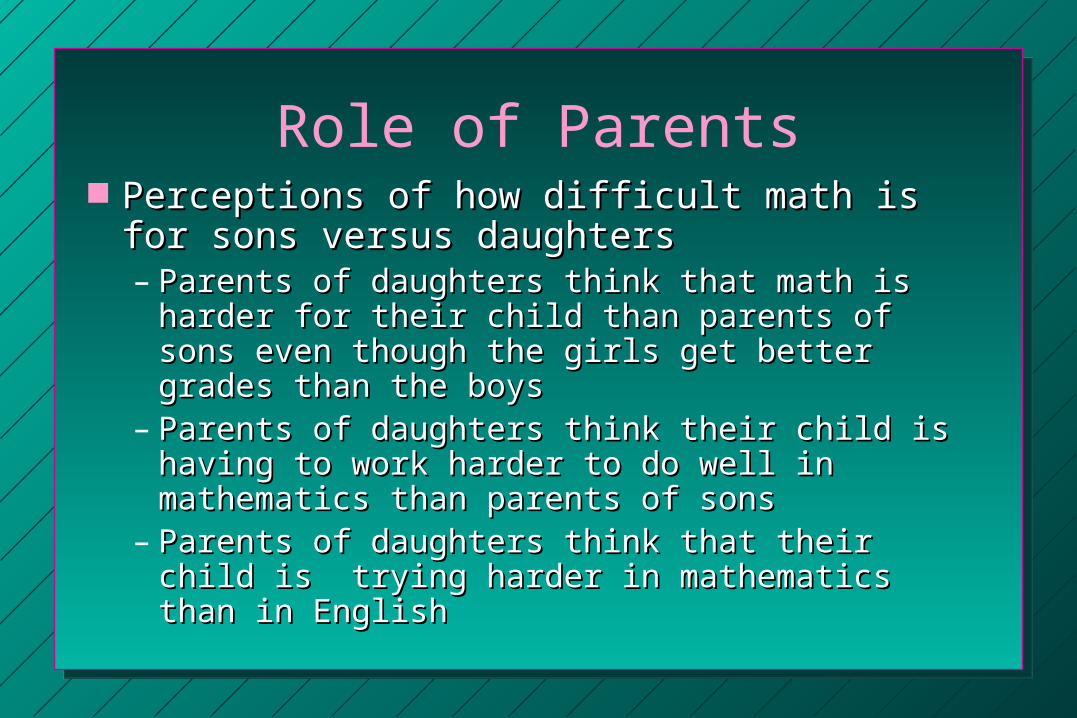
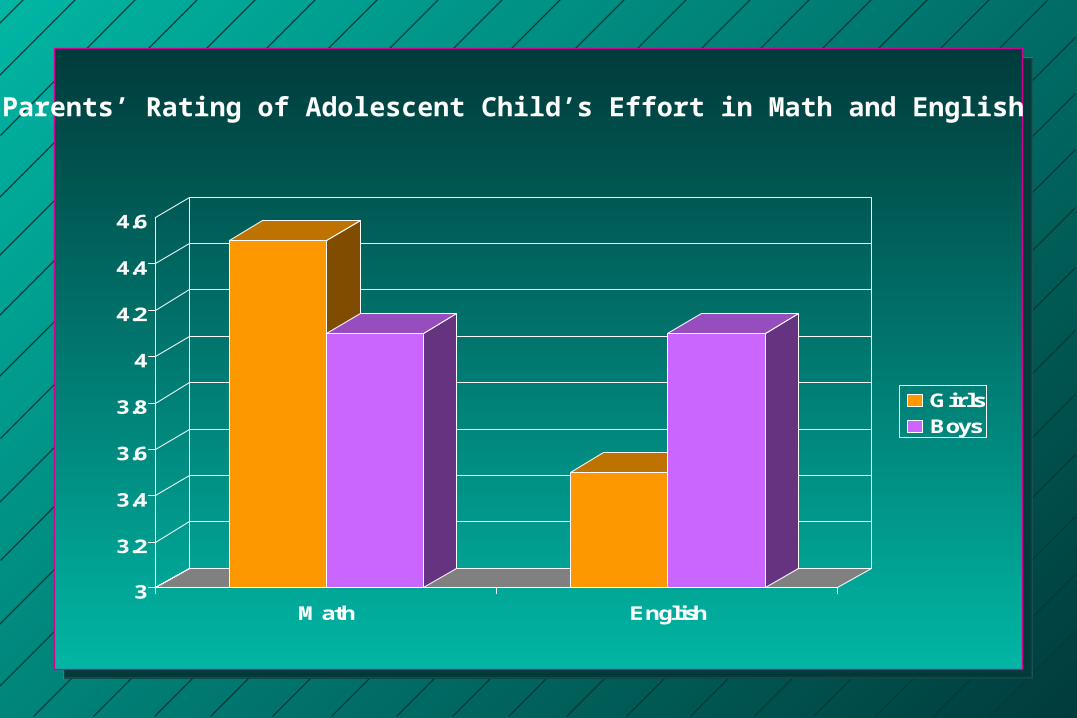
Role of Parents Perceptions of how difficult math is for sons Perceptions of how difficult math is for sons
versus daughtersversus daughters– Parents of daughters think that math is harder for Parents of daughters think that math is harder for
their child than parents of sons even though the their child than parents of sons even though the girls get better grades than the boysgirls get better grades than the boys
– Parents of daughters think their child is having to Parents of daughters think their child is having to work harder to do well in mathematics than work harder to do well in mathematics than parents of sonsparents of sons
– Parents of daughters think that their child is Parents of daughters think that their child is trying harder in mathematics than in English trying harder in mathematics than in English
3
3.2
3.4
3.6
3.8
4
4.2
4.4
4.6
Math English
GirlsBoys
Parents’ Rating of Adolescent Child’s Effort in Math and English
Role of Parents
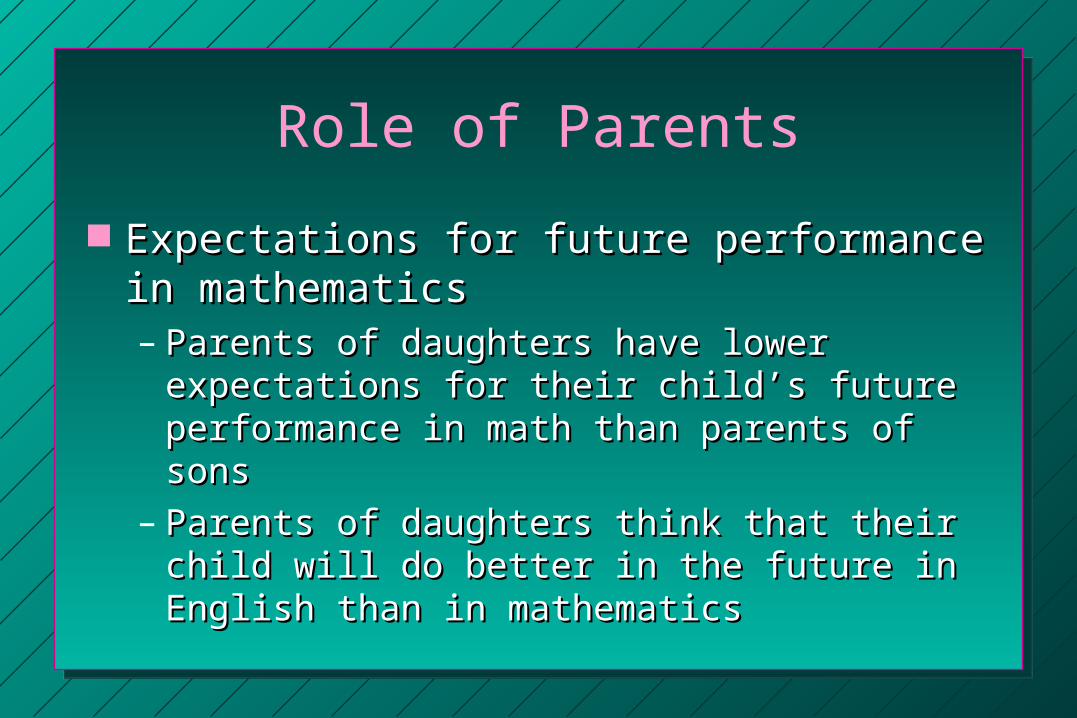
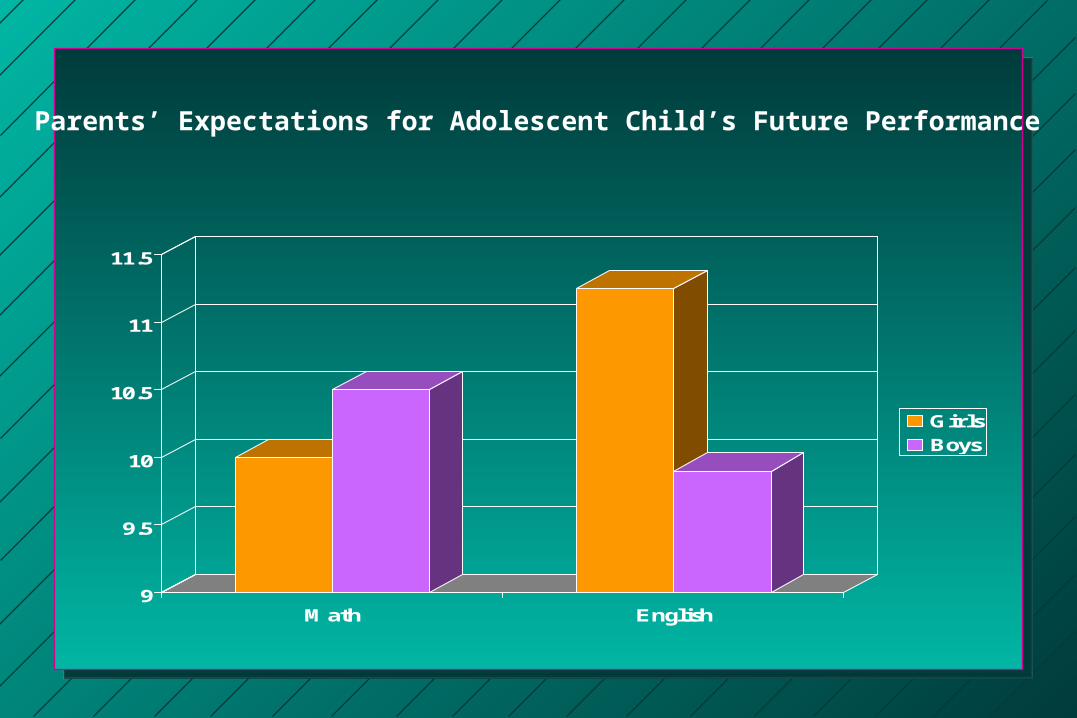
Expectations for future performance in Expectations for future performance in mathematicsmathematics– Parents of daughters have lower expectations for Parents of daughters have lower expectations for
their child’s future performance in math than their child’s future performance in math than parents of sonsparents of sons
– Parents of daughters think that their child will do Parents of daughters think that their child will do better in the future in English than in better in the future in English than in mathematicsmathematics
9
9.5
10
10.5
11
11.5
Math English
GirlsBoys
Parents’ Expectations for Adolescent Child’s Future Performance
Why Do Parents Have These Views?
Boys are actually better than girls at mathematics.Boys are actually better than girls at mathematics.– MAYBE BUT at this age boys and girls are doing equally MAYBE BUT at this age boys and girls are doing equally
well and are putting in an equal amount of effort on math well and are putting in an equal amount of effort on math according to their teachers and girls continue to earn according to their teachers and girls continue to earn better grades than boys in math throughout primary and better grades than boys in math throughout primary and secondary school, as well as at the universitysecondary school, as well as at the university
Parents have a different explanation for girls’ than Parents have a different explanation for girls’ than for boys’ performances in math.for boys’ performances in math.– YES!YES!
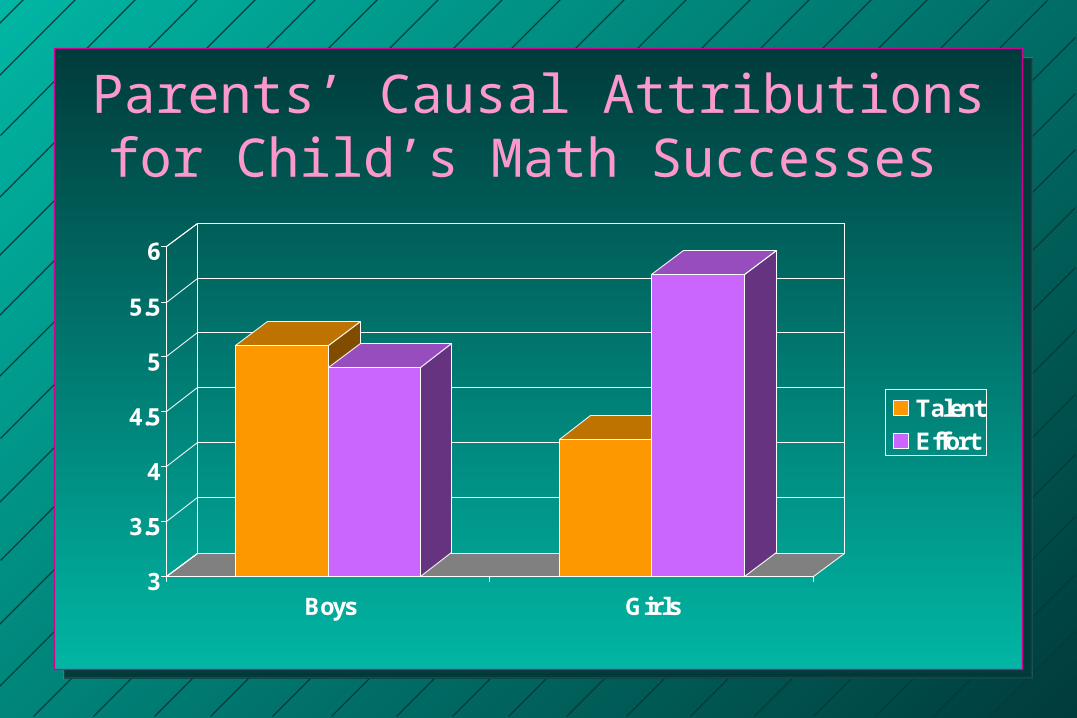
Parents’ Causal Attributions for Child’s Math Successes
3
3.5
4
4.5
5
5.5
6
Boys Girls
TalentEffort
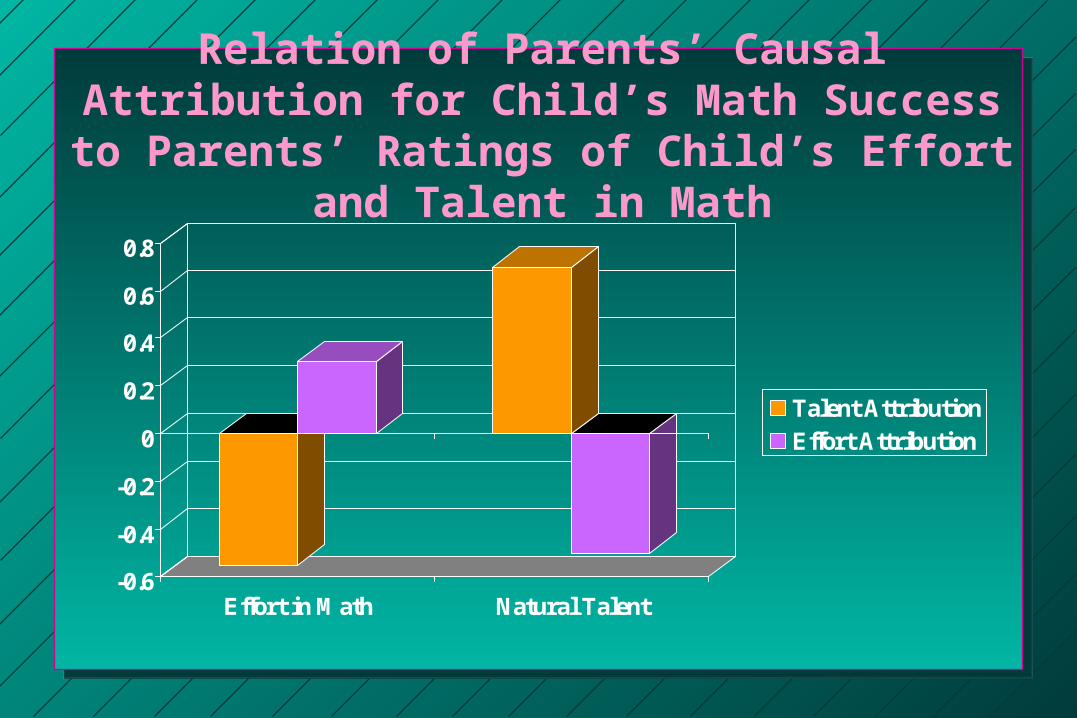
Relation of Parents’ Causal Attribution for Child’s Math Success to Parents’ Ratings of Child’s Effort
and Talent in Math
-0.6
-0.4
-0.2
0
0.2
0.4
0.6
0.8
Effort in Math Natural Talent
Talent AttributionEffort Attribution
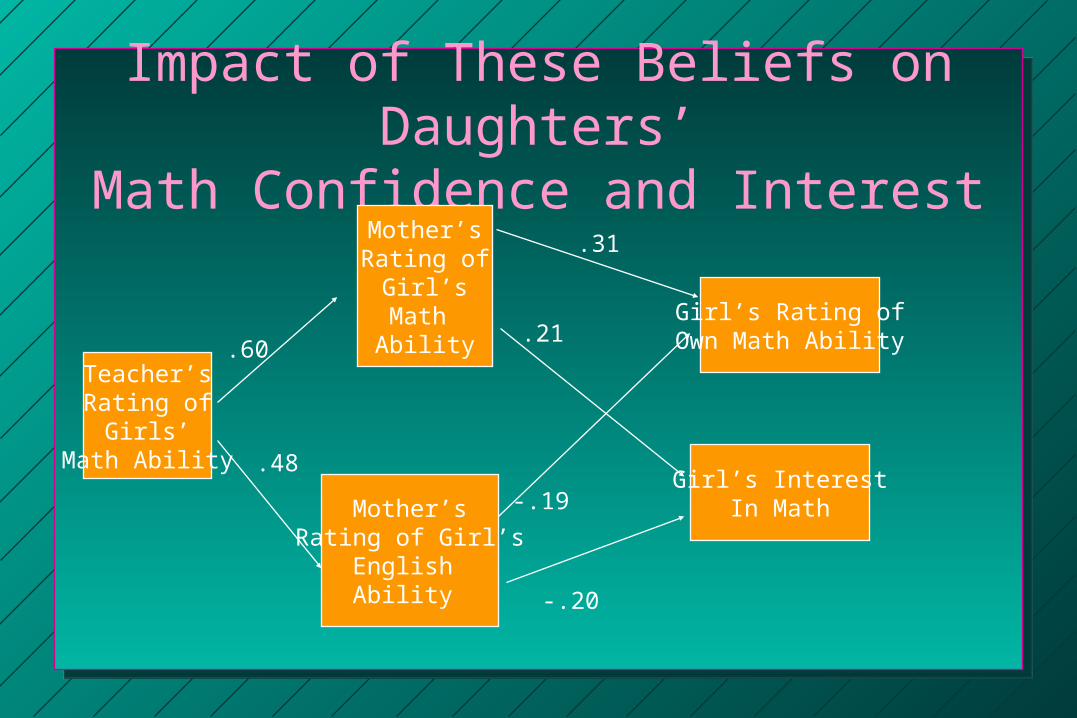
Impact of These Beliefs on Daughters’Math Confidence and Interest
Teacher’sRating of
Girls’Math Ability
Mother’sRating of
Girl’sMath Ability
Mother’sRating of Girl’s
English Ability
Girl’s Rating ofOwn Math Ability
Girl’s InterestIn Math
.60
.48
.31
.21
-.19
-.20
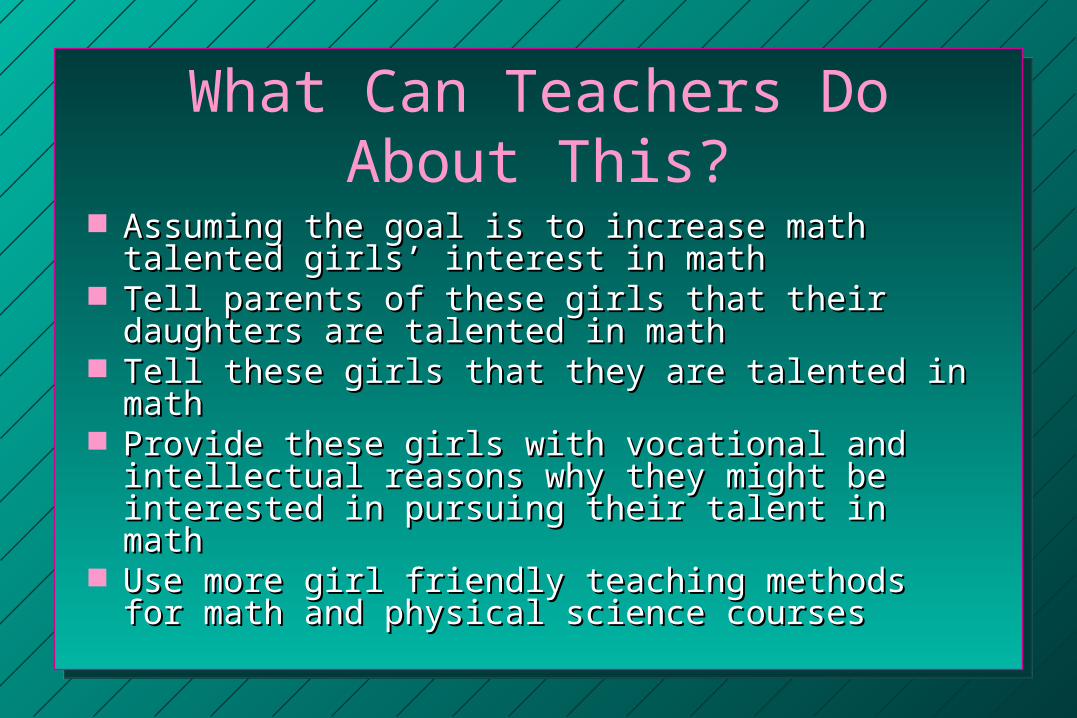
What Can Teachers Do About This?
Assuming the goal is to increase math talented Assuming the goal is to increase math talented girls’ interest in mathgirls’ interest in math
Tell parents of these girls that their daughters are Tell parents of these girls that their daughters are talented in mathtalented in math
Tell these girls that they are talented in mathTell these girls that they are talented in math Provide these girls with vocational and intellectual Provide these girls with vocational and intellectual
reasons why they might be interested in pursuing reasons why they might be interested in pursuing their talent in maththeir talent in math
Use more girl friendly teaching methods for math Use more girl friendly teaching methods for math and physical science coursesand physical science courses
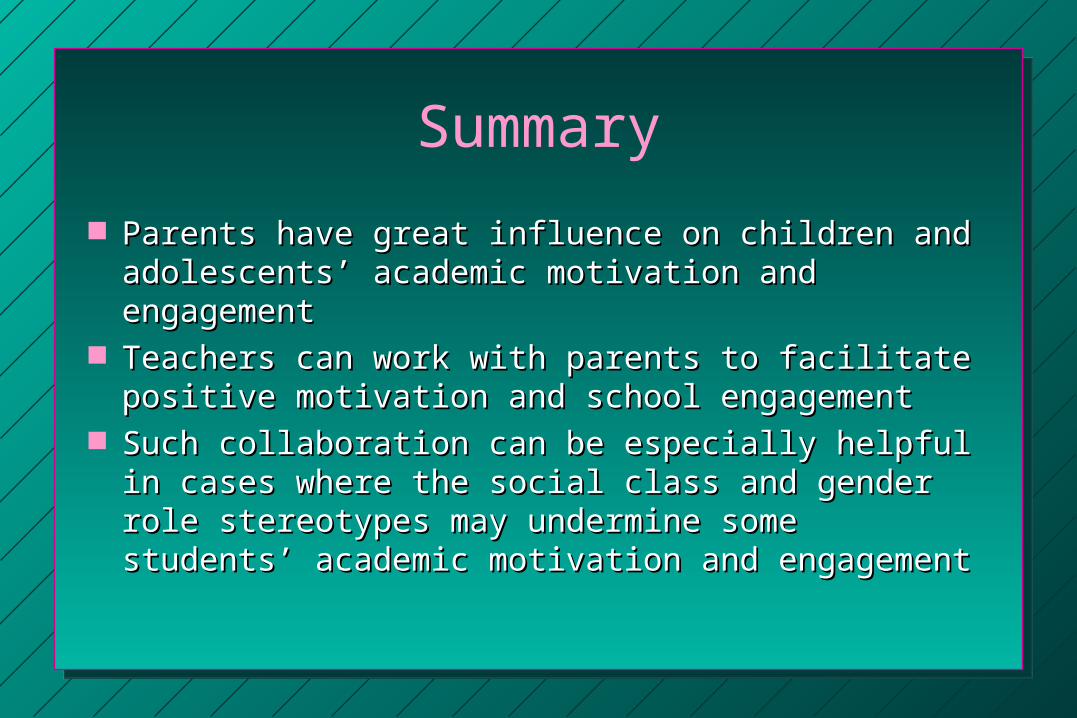
Summary
Parents have great influence on children and Parents have great influence on children and adolescents’ academic motivation and engagementadolescents’ academic motivation and engagement
Teachers can work with parents to facilitate positive Teachers can work with parents to facilitate positive motivation and school engagementmotivation and school engagement
Such collaboration can be especially helpful in Such collaboration can be especially helpful in cases where the social class and gender role cases where the social class and gender role stereotypes may undermine some students’ stereotypes may undermine some students’ academic motivation and engagementacademic motivation and engagement
Thank you.For More Information:
http://www.rcgd.isr.umich.edu/garp
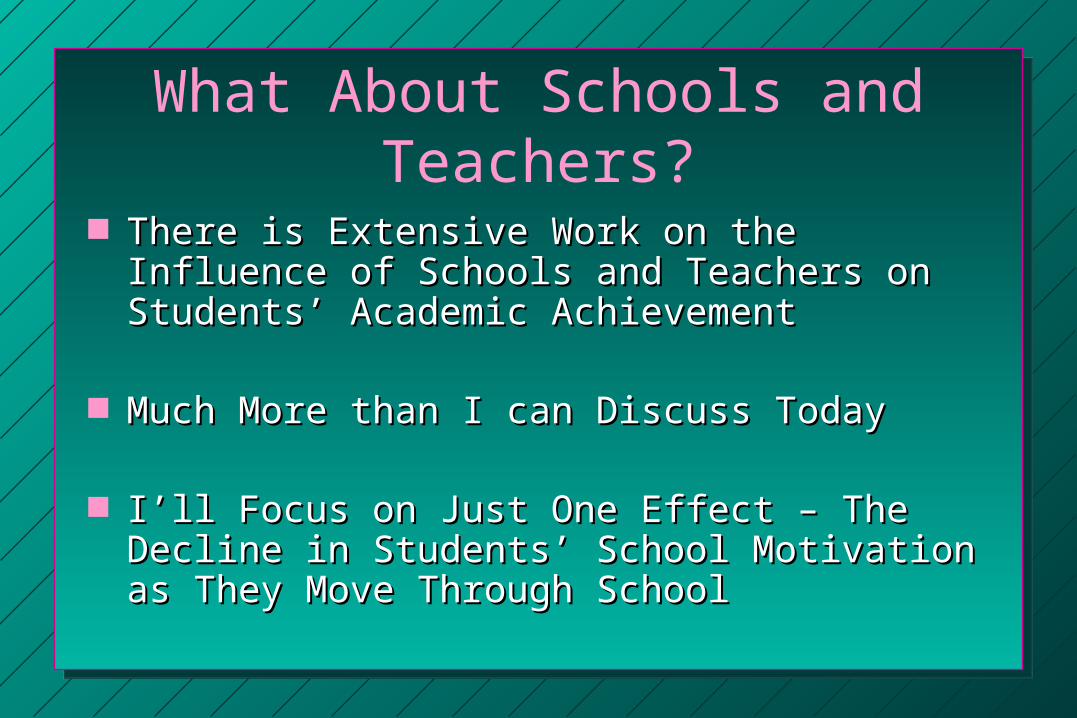
What About Schools and Teachers?
There is Extensive Work on the Influence of There is Extensive Work on the Influence of Schools and Teachers on Students’ Academic Schools and Teachers on Students’ Academic AchievementAchievement
Much More than I can Discuss TodayMuch More than I can Discuss Today
I’ll Focus on Just One Effect – The Decline in I’ll Focus on Just One Effect – The Decline in Students’ School Motivation as They Move Through Students’ School Motivation as They Move Through SchoolSchool
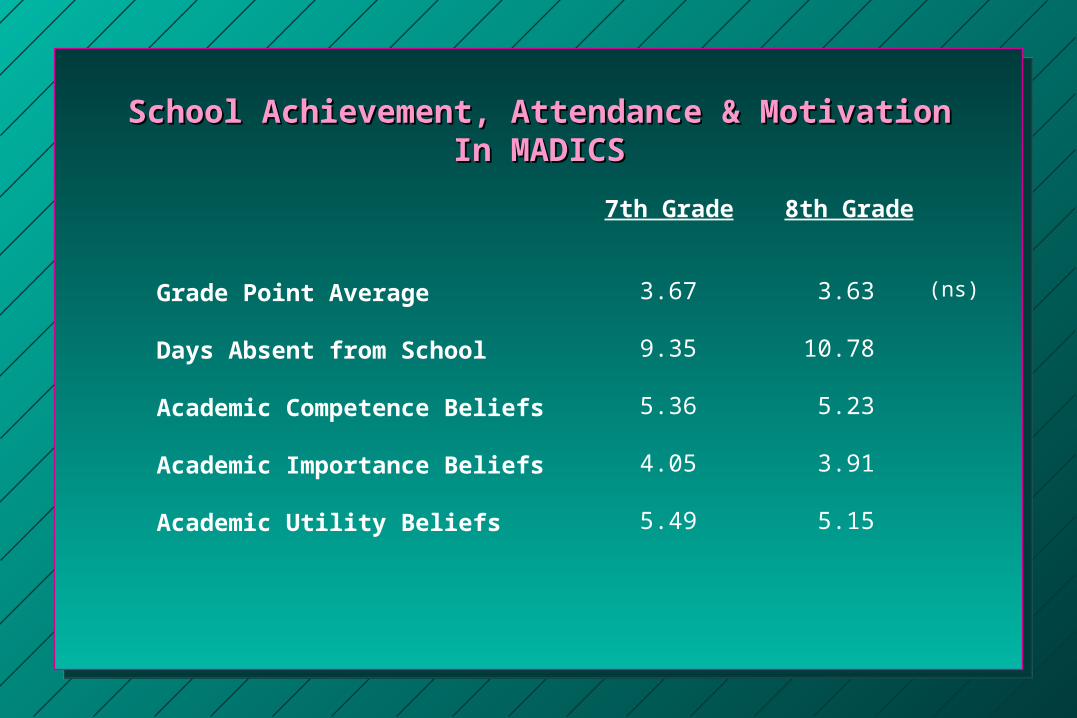
School Achievement, Attendance & MotivationSchool Achievement, Attendance & MotivationIn MADICSIn MADICS
7th Grade
Grade Point Average
Days Absent from School
Academic Competence Beliefs
Academic Importance Beliefs
Academic Utility Beliefs
8th Grade
3.67
9.35
5.36
4.05
5.49
3.63
10.78
5.23
3.91
5.15
(ns)
0%
10%
20%
30%
40%
50%
60%
Per
cent
Men
tioni
ngO
nce
in T
wo
Cha
nces
Seventh GradeEighth Grade
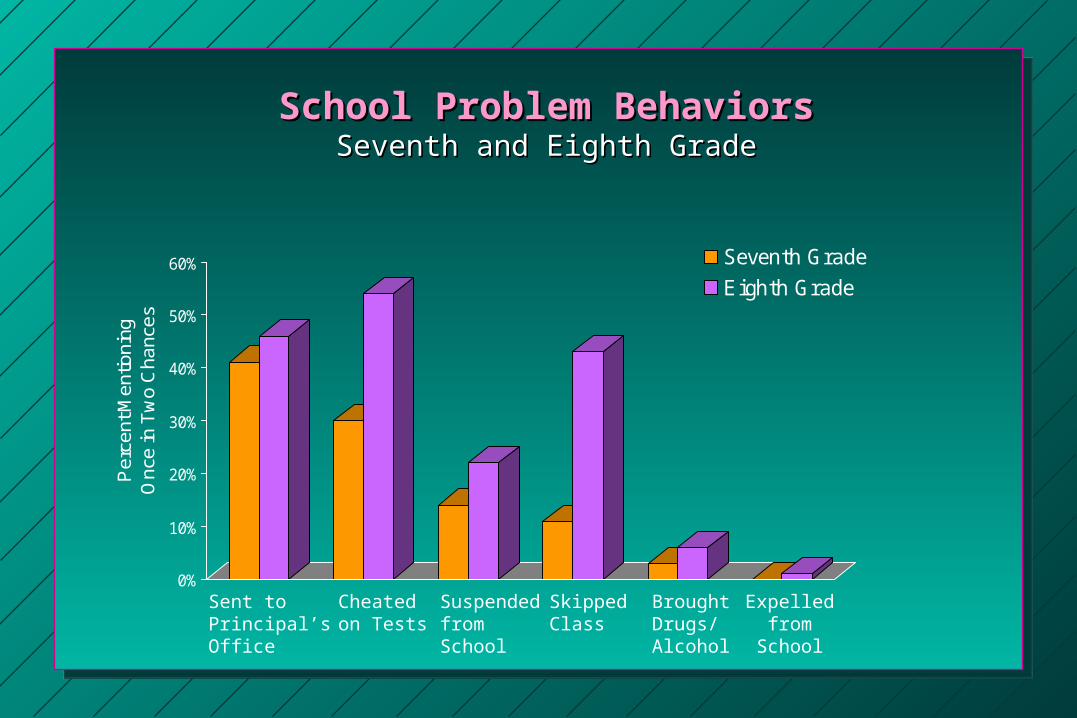
School Problem BehaviorsSchool Problem BehaviorsSeventh and Eighth GradeSeventh and Eighth Grade
Sent toPrincipal’sOffice
Cheatedon Tests
SuspendedfromSchool
SkippedClass
BroughtDrugs/Alcohol
Expelledfrom
School
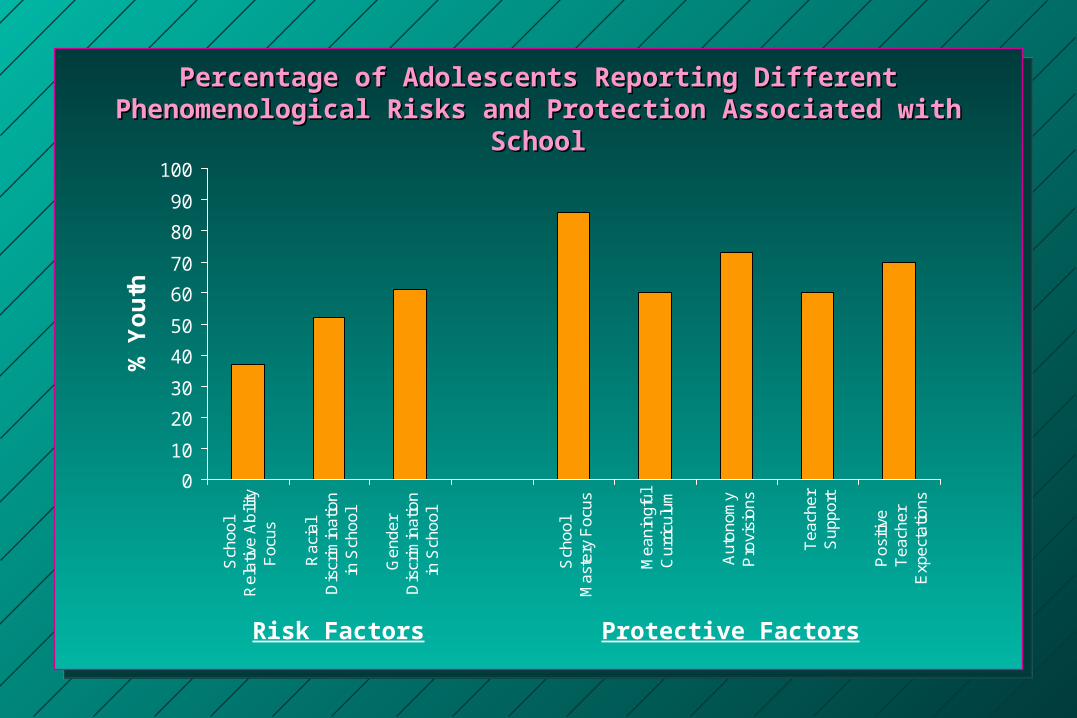
Percentage of Adolescents Reporting Different Percentage of Adolescents Reporting Different Phenomenological Risks and Protection Associated with Phenomenological Risks and Protection Associated with
SchoolSchool
0
10
20
30
40
50
60
70
80
90
100
Sch
ool
Rel
ativ
e A
bilit
yF
ocus
Rac
ial
Dis
crim
inat
ion
in S
choo
l
Gen
der
Dis
crim
inat
ion
in S
choo
l
Sch
ool
Mas
tery
Foc
us
Mea
ning
ful
Cur
ricul
um
Aut
onom
yP
rovi
sion
s
Tea
cher
Sup
port
Pos
itive
Tea
cher
Exp
ecta
tions
% Y
ou
th
Risk Factors Protective Factors
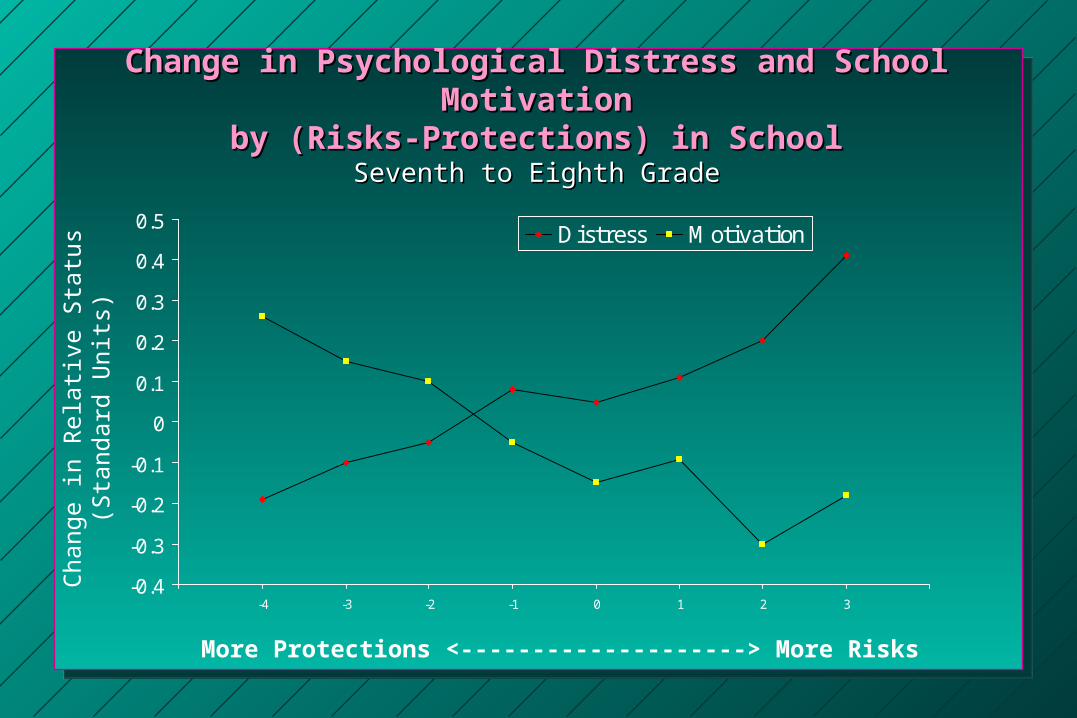
Change in Psychological Distress and School Change in Psychological Distress and School MotivationMotivation
by (Risks-Protections) in Schoolby (Risks-Protections) in SchoolSeventh to Eighth GradeSeventh to Eighth Grade
-0.4
-0.3
-0.2
-0.1
0
0.1
0.2
0.3
0.4
0.5
-4 -3 -2 -1 0 1 2 3
Distress Motivation
More Protections <--------------------> More Risks
Cha
nge
in R
elat
ive
Sta
tus
(Sta
ndar
d U
nits
)
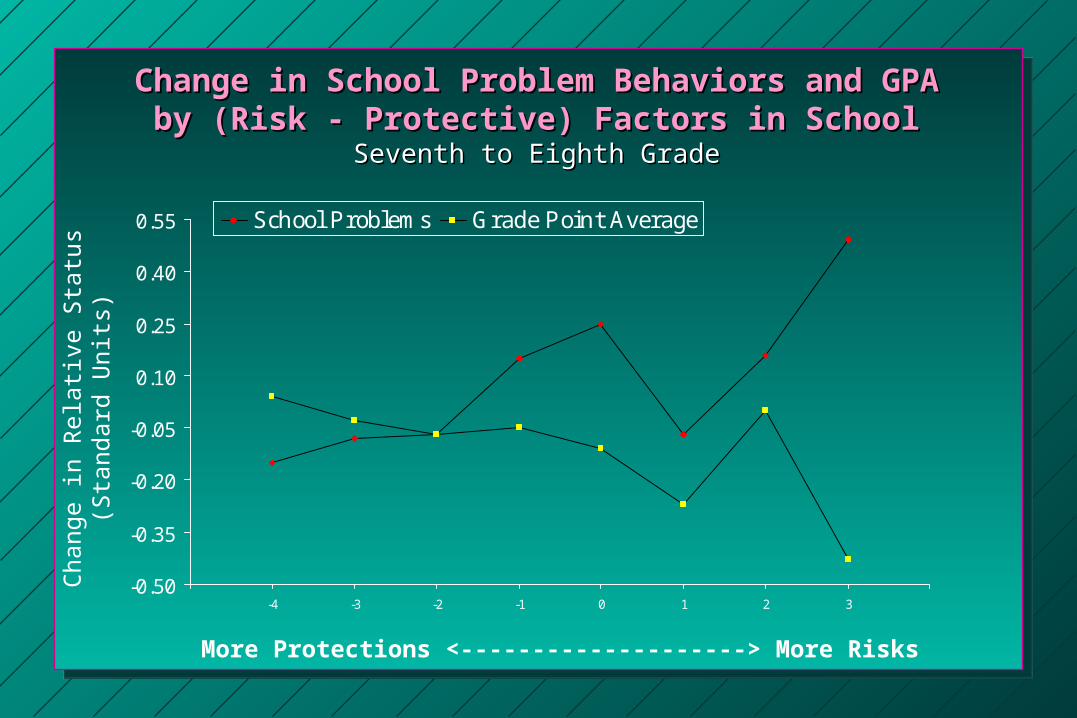
Change in School Problem Behaviors and GPAChange in School Problem Behaviors and GPAby (Risk - Protective) Factors in Schoolby (Risk - Protective) Factors in School
Seventh to Eighth GradeSeventh to Eighth Grade
-0.50
-0.35
-0.20
-0.05
0.10
0.25
0.40
0.55
-4 -3 -2 -1 0 1 2 3
School Problems Grade Point Average
More Protections <--------------------> More Risks
Cha
nge
in R
elat
ive
Sta
tus
(Sta
ndar
d U
nits
)