Embed Size (px)
Citation preview

Group Decision and Negotiation – GDN 2013
17-21 June 2013, Stockholm, Sweden
Prediction of Game Behavior Based on Culture Factors
Elnaz Nouri1, David Traum1
1Institute for Creative Technologies, University of Southern California, LA, CA, USA
[email protected], [email protected]
Abstract: This paper investigates the cultural differences in values and decision
making in on-line surveys and games, comparing subjects from the United
States and India. The empirical data validates the existence of cultural
differences seen previously for in-person game performance; there are also
significant differences in answers to Hofstede’s Values Survey Models
questions, the derived Hofeste dimensions, and our own values questions. We
also use this data to make predictions of game play, country of origin, and
values, based on other features. We are also able to predict the national culture
of the participants by considering their behavior in the game. The results show
that our value model is significantly better than other indicators such as
Hofstede’s dimensional values at predicting game play, but Hofstede questions
are best at predicting country of origin.
Keywords: Cultural Differences, Decision Making and Negotiation, Low
Stakes Ultimatum Game, Multi Attribute Decision Making, Culture, Cross
Cultural Ultimatum Game, Mechanical Turk
1 Introduction
Previous research has shown that decision-making behavior does not simply maximize
economic self-interest and varies systematically across cultural background (Camerer, 2003;
Henrich et al., 2005). While the body of work on quantitative measurement of the effect of
cultural background on people’s decision making process is ever increasing, it is still very
Group Decision and Negotiation – GDN 2013
17-21 June 2013, Stockholm, Sweden
2
limited.. In this paper we intend to add to this knowledge, looking specifically at several
different models of culture, two simple negotiation games, and populations of on-line
players from two different national culture groups: The United States and India. We
present what we believe to be the first cross-cultural study of online low-stakes game play
for the Ultimatum game and Dictator game.
Our goal is to create models of decision-making behavior that is sensitive to the role of
cultural background and individual values, as well as the specific context. In particular, we
are focusing on decision-making behavior in the context of simple negotiation games. In
previous work (Nouri and Traum 2011, Nouri et al., to appear 2013), we have posited that
multi-attribute decision-making techniques (Fishburn, 1968) can be applied to social-
decision making, by allowing different weights to be assigned to different valuations of a
situation. Valuations include self-gain (as in the traditional economic models), but also
factors like total gain, other gain, relative gain, and fairness. Individual differences in
decision-making can be attributed to different weights on the valuation, and different
trends across cultural groups can be attributed to different distributions of weights across
individuals in the different groups. In (Nouri and Traum, 2011), we used weights based on
Hofstede’s Cultural dimensions (Hofstede, 2001), and tested the model by having agents
play the ultimatum game. This model did show results that were broadly consistent with
the reported results of human players in multiple cultures, in terms of average offer and
rejection rate, however the specific choice of weights were somewhat ad hoc and the model
was limited to considering only high and low values for each dimension, rather than actual
values. In (Nouri et al., 2012), we learned weights from distributions of culture-specific
player data, using inverse reinforcement learning techniques. This resulted in models that
could generate distributions of play that were closer to the culture that they were designed
for than other cultures, however, a set of training data from the culture is required to learn
the weights, and it was not discernible whether these models represented the players actual
values.
In this paper, we present new work aimed at eliciting the actual values that players
report, as well as examining correlations between these values and game play as well as
correlations to the Hofestede dimensions and the raw questions that were used to form the
Hofstede dimension values. Our hope is that using this data can lead to better, more

Group Decision and Negotiation – GDN 2013
17-21 June 2013, Stockholm, Sweden
3
accurate models, as well as an ability to generalize to other cultures, where we have some
notion of cultural values, but no performance data.
The rest of the paper is structured as follows. In section 2, we review background work
related to observed cultural differences in negotiation game play and models of culture. In
Section 3, we present our experimental design, in which we elicited game play behavior,
Hofstede’s Values Survey Module (Hofstede et al., 2008), and our own values survey, for
two different games (dictator game and ultimatum game) and two different broad national
cultures: US and India. In Section 4, we present the results, looking at cultural and game-
specific differences among each of these elements. In Section 5, we apply machine-learning
techniques to try to predict game play based on cultural factors (country of origin,
Hofstede dimension values, VSM question answers, and our value questionnaire), as well as
trying to predict country of origin, based on game play, Hofstede dimension values, VSM
question answers, or our value questionnaire.
2 Background and Related Work
2.1 Cultural Differences & On-line games
Country-level differences are observed in different levels of social, cultural, financial and
economical behavior. A high level economic example is the difference in behavior towards
the security of property as public good (Campos et al., 2012). Behavioral game theorists try
to measure these phenomena by looking into games that appear to reflect the common
interactional patterns of everyday life. A very good example of such work on
demonstrating country level differences in behavior is (Roth, et al 1991) in which four
countries of Israel, Japan, US and Yugoslavia are studied in terms of bargaining and market
behavior. (Heinrich et al., 2005) studies the influence of culture on decision making process
in economic domains by running the ultimatum, public goods, and dictator games among
15 small-scale societies. This study not only reveals substantially more behavioral variability
across social cultural groups than has been found in previous research but also suggests
that group-level differences in economic organization and the structure of social
interactions explain a substantial portion of the behavioral variation across societies. This

Group Decision and Negotiation – GDN 2013
17-21 June 2013, Stockholm, Sweden
4
study also provides evidence that the available individual-level economic and demographic
variables do not consistently explain game behavior, either within or across groups.
In most prior work people participate in face to face laboratory conditions. A few recent
studies have begun to look into what happens when these games are played online. These
studies have reestablished the classical findings in behavioral studies such as the effect of
framing and priming on Mechanical Turk participants (e.g., Buhrmester et al 2011; Rand,
2011). (Amir et al., 2011) has also shown that running economic games experiments on
Mechanical Turk are comparable to those run in laboratory setting even when using very
low stakes for payment. These experiments alleviate concerns about the validity of
economic games experiments run online versus ones in the laboratory. There have also
been studies t (e.g., Suri and Watts, 2011; Horton et al., 2010) that have shown that self-
reported demographics on Amazon Turk in these tasks are reliable.
2.2 Hofstede’s Dimensional Model of Culture
Hofstede's model of culture (Hofstede, 2001; Hofstede and Hofstede, 2005; Hofstede et
al., 2008) posits that cultures vary systematically along several dimensions, such as ways of
coping with inequality, uncertainty, relations with groups, and gender. Based on statistical
analyses of the trends of answers to questions about values and attitudes, four different
dimensions were identified (with three additional dimensions added later). These
dimensions are PDI: Power Distance (large vs. small), IDV: Individualism vs. Collectivism,
MAS: Masculinity vs. Femininity, UAI: Uncertainty Avoidance (strong vs. weak), LTO:
Long- vs. Short-Term Orientation, IVR: Indulgence vs. Restraint, and MON:
Monumentalism vs. Self-Effacement.
The values of a culture for the dimensions can be estimated using instruments like the
Values Survey Module 2008 (Hofstede et al., 2008). This is a 28-item questionnaire, with a
set of questions that relate to each dimension. The questions are shown in Table 1, with
answers ranging from 1 to 5.
Table 1. Hofstede Questions from VSM 2008
Question
Number
Question Related
Dimensio
n

Group Decision and Negotiation – GDN 2013
17-21 June 2013, Stockholm, Sweden
5
Q1 have sufficient time for your personal or home life IDV
Q2 have a boss (direct superior) you can respect PDI
Q3 get recognition for good performance MAS
Q4 have security of employment IDV
Q5 have pleasant people to work with MAS
Q6 do work that is interesting IDV
Q7 be consulted by your boss in decisions involving your work PDI
Q8 live in a desirable area MAS
Q9 have a job respected by your family and friends IDV
Q10 have chances for promotion MAS
Q11 keeping time free for fun IVR
Q12 moderation: having few desires IVR
Q13 being generous to other people MON
Q14 modesty: looking small, not big MON
Q15 If there is something expensive you really want to buy but you do
not have enough money, what do you do?
LTO
Q16 How often do you feel nervous or tense? UAI
Q17 Are you a happy person? IVR
Q18 Are you the same person at work (or at school if you’re a student)
and at home?
LTO
Q19 Do other people or circumstances ever prevent you from doing
what you really want to
IVR
Q20 how would you describe your state of health these days? UAI
Q21 How important is religion in your life? MON
Q22 How proud are you to be a citizen of your country? MON
Q23 How often, in your experience, are subordinates afraid to
contradict their boss (or students their teacher?)
PDI
Q24 One can be a good manager without having a precise answer to
every question that a subordinate may raise about his or her work
UAI
Q25 Persistent efforts are the surest way to results LTO
Q26 An organization structure in which certain subordinates have two
bosses should be avoided at all cost
PDI
Q27 A company's or organization's rules should not be broken - not
even when the employee thinks breaking the rule would be in the
organization's best interest
UAI
Q28 To what extent We should honor our heroes from the past LTO

Group Decision and Negotiation – GDN 2013
17-21 June 2013, Stockholm, Sweden
6
The value for each dimension is calculated as a linear combination of the answers to four
questions, as shown in Table 2. The constant for each dimension is used to normalize
scores. In section 4, we use constants chosen so that our values for the US match the
values from the literature.
Table 2. Hofstede Dimension Value Formulae
Power Distance Index (PDI) = 35(m07 – m02) + 25(m23 – m26) + C(pd)
Individualism Index (IDV) = 35(m04 – m01) + 35(m09 – m06) + C(ic)
Masculinity Index (MAS) = 35(m05 – m03) + 35(m08 – m10) + C(mf)
Uncertainty Avoidance Index (UAI) = 40(m20 - m16) + 25(m24 – m27) + C(ua)
Long Term Orientation Index (LTO) = 40(m18 – m15) + 25(m28 – m25) + C(ls)
Indulgence versus Restraint Index (IVR) = 35(m12 – m11) + 40(m19 – m17) + C(ir)
Monumentalism Index (MON) = 35(m14 – m13) + 25(m22 – m21) + C(mo)
We find the Hofstede model of culture attractive because it includes the following
features:
Explicit dimensions of cultural norms that can be tied to valuation
Multiple ways in which cultures can be similar or differ
Data on dimension values for a large range of (national) cultures
On the other hand, it is not trivial to relate the general values to evaluation of a specific
situation. Therefore we also examine another valuation scheme that can be more directly
tied to the outcomes of simple games. This is described in Section 3.
2.3 Support Vector Machines
In section 5, we create classifiers that attempt to predict offers or country of origin from
other available information about an individual. To do this we use support vector machines
(SVM) with the radial basis function kernel. Some recent applications and extensions of
support vector machines in pattern recognition are handwritten digit recognition (Cortes
and Vapnik, 1995), object recognition (Blanz et al., 1996), and face detection and
identification in images (Osuna, Freund and Girosi, 1997). In most of these cases, SVM

Group Decision and Negotiation – GDN 2013
17-21 June 2013, Stockholm, Sweden
7
generalization performance (i.e. error rates on test sets) either matches or is significantly
better than that of competing methods.
3 Data Collection Design
3.1 Participants
The tasks were set up as “hits” on Amazon Mechanical Turk, open to participants from the
US and India. Roughly two hundred participants were recruited for each culture, and
assigned randomly to one of two game conditions described below (107 for each culture
for the dictator game, and 101 for each culture for the ultimatum game). Each participant
was told they would receive a $0.5 fee for participating in the task and they had an
opportunity to earn up to another $0.5 based on their performance in the game. They were
told they would receive $0.05 for each 10 points that they accumulated in the game.
3.2 Games
The Ultimatum Game. is a simple bargaining game for two players in which the first
player, often called the “proposer,” is provisionally allotted a divisible “pie”(usually
money). The proposer then offers a portion of the pie to a second person, often called the
“responder.” The responder, knowing both the offer and the total amount of the pie, then
has the opportunity to either accept or reject the proposer’s offer. If the responder accepts,
he or she receives the amount offered and the proposer receives the remainder (the pie
minus the offer). If the responder rejects the offer, then neither player receives anything. In
either case, the game ends and the two subjects receive their winnings accordingly. This
stylized negotiation was first studied in (Guth et al., 1982).
The Dictator Game. The Dictator Game is played exactly like the standard Ultimatum
Game, except that the responder is not given an opportunity to accept or reject the offer.
The proposer merely dictates the division. In the Dictator Game positive offers cannot
result from a fear of rejection. Thus, when used in conjunction with the Ultimatum Game,
this experimental tool allows researchers to determine whether proposers make positive
offers out of a ‘sense of fairness’ or from a ‘fear of rejection’ (Henrich et al., 2005).

Group Decision and Negotiation – GDN 2013
17-21 June 2013, Stockholm, Sweden
8
Just like in the case of standard Ultimatum game, in this game, the canonical assumption
would predict that the proposers would offer the minimum possible offer to the other
person but numerous studies have shown that people deviate from this prediction and
make considerable amounts of the pie offers to the other person. (Camerer, 2003).
3.3 Decision-making Values Survey
In order to directly calculate weights for the model from (Nouri and Traum, 2011), we
created a survey of desiderata for making game decisions, shown in Table 3. Participants
were asked to indicate how important each factor was in their decision making process, on
a scale from -5 (very important to avoid) to 0 (not important) to 5 (very important to have).
Table 3. Decision-making Values
Abbreviati
on
Value Description
Vself Getting a lot of points
Vother The other player getting a lot of points
Vcompete Getting more points than the other player
Vfairness having the same number of points as the other player
Vjoint Making sure that if we add our points together we got as
many points as possible
Vrawls The player with fewest points (whoever that is) gets as
many as possible
Vlower bound Making sure to get some points (even if not as many as
possible)
Vchance The chance to get a lot of points (even if there's also a
chance not to get any points)

Group Decision and Negotiation – GDN 2013
17-21 June 2013, Stockholm, Sweden
9
3.4 Method
Participants who accepted the “hit” from Amazon mechanical turk went through the
following sequence:
1. Fill out the VS08 Hofestede Survey (Table 1), as well as demographic
information about their country of origin and native language.
2. Receive instructions about the game (Dictator Game or Ultimatum Game). They
were told that they would be playing with another participant from their country.
3. Make an offer as the proposer in Dictator Game or Ultimatum game, proposing
a partition of 100 points between themselves and their partner in the game.
4. Fill out the Decision-making values survey (Table 3)
5. Receive their partner’s move (in the case of the ultimatum game) and their final
reward. In reality, there was no partner and the ultimatum game responses were
chosen according to a fixed protocol.
4 Results
We investigate differences between behavior of the US and Indian player groups. We
examine differences in game play (size of offers), Hofstede Values, as cacluated using the
formulae in Figure 2, Hofstede questions, as shown in Table 1, and our Decision-making
values, shown in Table 4.
4.1 Offers in the Ultimatum Game and the Dictator Game
Table 4 shows a summary of mean offers and Standard Deviations for US and Indian
players in the Dictator and Ultimatum games. Following the trend of reported results of
different previous studies we also observe that in our experiments the majority of the
participants from both US and India offer a significant amount of the money to the other
person.
Table 4. Summary of Offers across Game and Culture
Condition
(mean,std)
Dictator
Game
Ultimatum
Game

Group Decision and Negotiation – GDN 2013
17-21 June 2013, Stockholm, Sweden
10
US 39.81, 21.23 48.51, 16.08
India 37.75, 27.96 45.14, 20.52
Both 38.78, 24.78 46.83, 18.47
Ultimatum Game. As reported in Table 4, the average offer for US participants was
$48.51 in comparison to the average offer of $45.14 for the Indian participants. More
detailed distributions are shown in in Figure 1. 63% of the US participants offered half of
the money to the other person in the game in comparison to the 40% of the Indian
participants. The result of one way ANOVA test on offers in Ultimatum Game grouped by
the country of the proposers does not show a significant difference in offers (p= 0.20). The
Kruskal-Wallis1 test trends toward significance (p= 0.058)
The KL-divergence2 value between to distributions is 0.2048.
Figure 1. Offer Distribution in Ultimatum Game
Dictator Game. As shown in Table 4, the average offer for US participants was $39.8
in comparison to the average offer of $37.7 for the Indian participants. More detailed
1 Kruskal-Wallis compares the medians of the samples in X, and returns the p-value for the null hypothesis that all
samples are drawn from the same population (or equivalently, from different populations with the same distribution). Note that the Kruskal-Wallis test is a nonparametric version of the classical one-way ANOVA, and an extension of the Wilcoxon rank sum test to more than two groups.
2 To measure the difference between the distributions of offers we use Kullback-Leibler divergence measure between two probability distributions P and Q that is defined as follows:
D KL(P||Q) = i=1 P(i)log2 P(i) Q(i) where n is the number of points in the distribution that we consider. Because KL divergence is asymmetric we calculate
DKL(P||Q) and DKL(Q||P) and then we take the average. The lower the KL divergence the closer the distributions.
0
0.1
0.2
0.3
0.4
0.5
0.6
0.7
off
er 0
off
er 1
0
off
er 2
0
off
er 3
0
off
er 4
0
off
er 5
0
off
er 6
0
off
er 7
0
off
er 8
0
off
er 9
0
off
er 1
00
US UltimatumGame
India UltimatumGame

Group Decision and Negotiation – GDN 2013
17-21 June 2013, Stockholm, Sweden
11
distributions are shown in in Figure 2. 48% of the US participants offered half of the
money to the other person in the game in comparison to the 30% of the Indian
participants. We were not able to detect a significant difference in game performance
between US and Indian participants in either the one-way ANOVA (p= 0.5453) or the
Kruskal-Wallis test (p=0.4368). The KL-divergence value between the two distributions is
0.2914.
Figure 2. Offer Frequency in the Dictator Game
The comparison of all individual offers in both games shows significant game effect on
the amount of the offers in the game, offers made in ultimatum game being higher than
offers in the dictator game. We believe this is mainly due to fear of rejection in Ultimatum
game. (Camerer, 2003)
The KL-divergence value between Ultimatum Game distribution and Dictator Game
distribution of the US participants is 0.35, and for Indian participants the KL-divergence
value is 0.42.
4.2 Hofstede’s dimensional values
Given that the procedure was exactly the same for both games up to this stage and that we
recruited subjects from the same pool with the same method, we report the culture profiles
calculated for the two countries here with both games aggregated. We analyzed the cultural
scores of the participants based on the answers that they provided to the Hofstede
0
0.1
0.2
0.3
0.4
0.5
0.6
off
er 0
off
er 1
0
off
er 2
0
off
er 3
0
off
er 4
0
off
er 5
0
off
er 6
0
off
er 7
0
off
er 8
0
off
er 9
0
off
er 1
00
US Dictator Game
India DictatorGame

Group Decision and Negotiation – GDN 2013
17-21 June 2013, Stockholm, Sweden
12
questionnaire VS08 and calculated the values for the Hofstede’s dimensional culture model
for participants of the two countries, according to the formulae in Table 2. The initial
results are shown in Table 5.
Table 5. Hofstede values Calculation
Dimensions PDI IDV MAS UAI LTO IVR MON
US scores reported by Hofstede 40 91 62 46 29 68 0
India scores reported by
Hofstede
77 48 56 40 61 26 0
Initial calculated US 15.21 11.10 -2.18 -56.37 9.18 30.31 -2.93
Initial calculated India 17.95 0.67 5.38 -53.17 4.83 56.00 70.98
Constants using US baseline 24.78 79.89 64.18 102.37 19.81 37.68 2.93
ANOVA p-values 0.60 0.05* 0.13 0.62 0.47 0.00** 0.00**
As mentioned in (Hofstede and Hofstede, 2005), the difference observed between the
reported values and the new calculated ones can be attributed to many factors such as the
differences between the demographics of the people who take the survey and culture
change throughout time (the Hofstede scores are based on the IBM survey in 1970). Given
that set of matched samples from different countries should include at least one sample
matched with the others in our study for one country covered before with Hofstede score;
we chose US to be the base country. The base value score for MON dimension is set to 0
since this dimension was not present in the earlier version of Hofstede’s cultural model.
The final scores are shown in Figure 3. We notice significant differences between Indian
and US norms for three of the seven dimensions, as shown in the last line of Table 5. No
linear correlation was observed between the Hofstede Scores and the offers made.
40.0
91.0
62.0
46.0
29.0
68.0
0.0
42.7
80.6 69.6
49.2
24.6
93.7
73.9
0
20
40
60
80
100
PDI IDV MAS UAI LTO IVR MON
US calculatedHofstede's scores
India calculatedHofstede's scores
Figure 3. Derived Hofstede Dimension Scores

Group Decision and Negotiation – GDN 2013
17-21 June 2013, Stockholm, Sweden
13
4.3 Hofstede’s Survey Questions
We also analyze differences in the distribution of the individual VSM 2008 survey
questions, shown in Table 1. These provide a more fine-grained, though less theoretically
motivated view of the cultural differences. Table 6 shows the questions that have
significant differences in distribution across the countries at the * (p< 0.05), ** (P < 0.01),
and ** (P, 0.001) levels.
Table 6. Cultural Differences for VSM 2008 Questions
Question
Number
ANOVA
p-value
Question Related
Dimension
Q3 0.01** get recognition for good performance MAS
Q4 0.02* have security of employment IDV
Q5 0.03* have pleasant people to work with MAS
Q6 0.02* do work that is interesting IDV
Q9 0.00*** have a job respected by your family and friends IDV
Q10 0.01** have chances for promotion MAS
Q13 0.01** being generous to other people MON
Q14 0.00** modesty: looking small, not big MON
Q16 0.02* How often do you feel nervous or tense? UAI
Q17 0.00*** Are you a happy person? IVR

Group Decision and Negotiation – GDN 2013
17-21 June 2013, Stockholm, Sweden
14
Q20 0.01** how would you describe your state of health these
days?
UAI
Q21 0.00*** How important is religion in your life? MON
Q22 0.00*** How proud are you to be a citizen of your country? MON
Q24 0.00*** One can be a good manager without having a precise
answer to every question that a subordinate may
raise about his or her work
UAI
Q26 0.00*** An organization structure in which certain
subordinates have two bosses should be avoided at
all cost
PDI
Q27 0.00** A company's or organization's rules should not be
broken - not even when the employee thinks
breaking the rule would be in the organization's best
interest
UAI
Q28 0.01** To what extent We should honor our heroes from
the past
LTO
No correlation was found between each answer to the questions and the offers made.
4.4 Decision-Making Values
Figures 4-6 show differences between participants from the US and India on the Decision-
making Values Survey in Table 3. Figure 4 shows median values in the Dictator Game,
Figure 5 shows median values in the Ultimatum Game, and Figure 6 shows median values
across both games.

Group Decision and Negotiation – GDN 2013
17-21 June 2013, Stockholm, Sweden
15
Figure 4. Decision Making Values in Dictator Game
Figure 5. Decision-making Values in Ultimatum Game
Figure 6. Decision-making Values across both Games
2.2
0.4 -0.1
1.6 2.6
-0.1
2.2
0.4
3.1
-0.5
2.4
0.7
2.3
0.3
2.2 1.9
-5
-3
-1
1
3
5
US DG Values
India DG Value
2.7
-0.2
1.0 0.7
2.2
0.0
1.9 1.6
2.8
0.3
2.0 1.2
2.5
0.2
2.1 1.8
-5
-3
-1
1
3
5
US UG Values
India UG Value
2.42
0.09 0.45
1.16
2.39
-0.04
2.10
0.98
2.94
-0.13
2.19
0.98
2.39
0.3
2.15 1.85
-5
-3
-1
1
3
5
US Values
India Values
Group Decision and Negotiation – GDN 2013
17-21 June 2013, Stockholm, Sweden
16
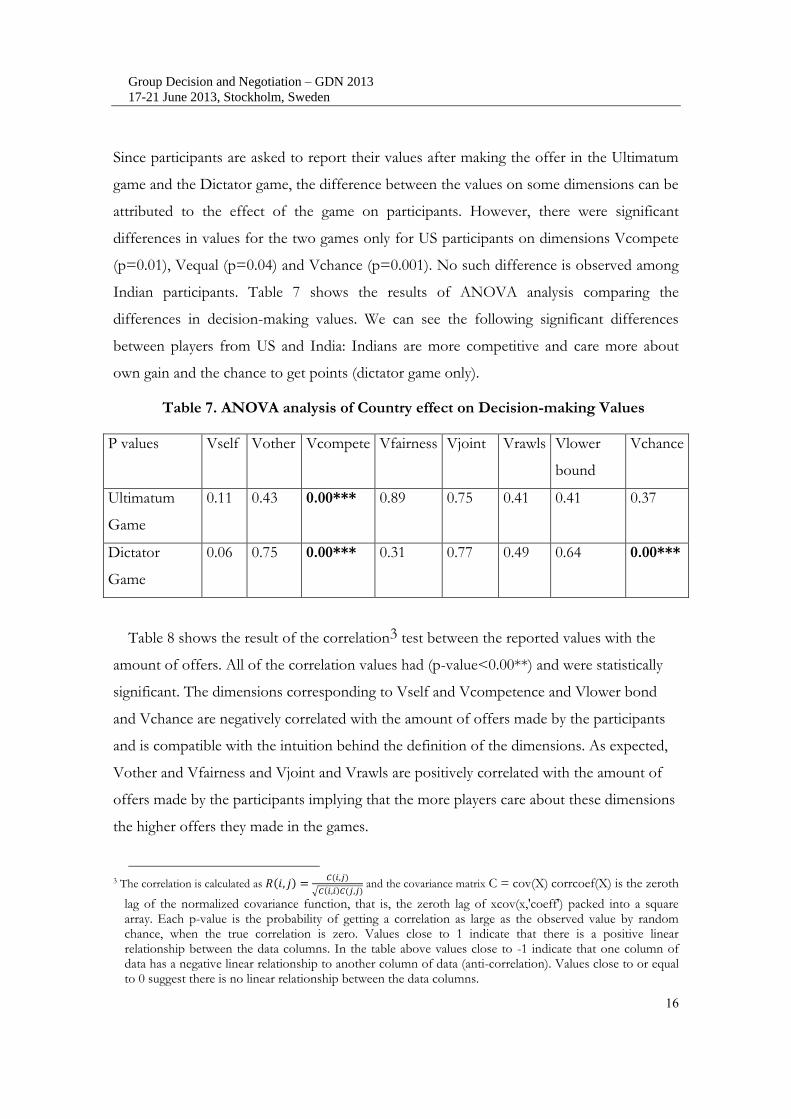
Since participants are asked to report their values after making the offer in the Ultimatum
game and the Dictator game, the difference between the values on some dimensions can be
attributed to the effect of the game on participants. However, there were significant
differences in values for the two games only for US participants on dimensions Vcompete
(p=0.01), Vequal (p=0.04) and Vchance (p=0.001). No such difference is observed among
Indian participants. Table 7 shows the results of ANOVA analysis comparing the
differences in decision-making values. We can see the following significant differences
between players from US and India: Indians are more competitive and care more about
own gain and the chance to get points (dictator game only).
Table 7. ANOVA analysis of Country effect on Decision-making Values
P values Vself Vother Vcompete Vfairness Vjoint Vrawls Vlower
bound
Vchance
Ultimatum
Game
0.11 0.43 0.00*** 0.89 0.75 0.41 0.41 0.37
Dictator
Game
0.06 0.75 0.00*** 0.31 0.77 0.49 0.64 0.00***
Table 8 shows the result of the correlation3 test between the reported values with the
amount of offers. All of the correlation values had (p-value<0.00**) and were statistically
significant. The dimensions corresponding to Vself and Vcompetence and Vlower bond
and Vchance are negatively correlated with the amount of offers made by the participants
and is compatible with the intuition behind the definition of the dimensions. As expected,
Vother and Vfairness and Vjoint and Vrawls are positively correlated with the amount of
offers made by the participants implying that the more players care about these dimensions
the higher offers they made in the games.
3 The correlation is calculated as ( )
( )
√ ( ) ( ) and the covariance matrix C = cov(X) corrcoef(X) is the zeroth
lag of the normalized covariance function, that is, the zeroth lag of xcov(x,'coeff') packed into a square array. Each p-value is the probability of getting a correlation as large as the observed value by random chance, when the true correlation is zero. Values close to 1 indicate that there is a positive linear relationship between the data columns. In the table above values close to -1 indicate that one column of data has a negative linear relationship to another column of data (anti-correlation). Values close to or equal to 0 suggest there is no linear relationship between the data columns.

Group Decision and Negotiation – GDN 2013
17-21 June 2013, Stockholm, Sweden
17
Table 8. Correlation analysis between Decision-making Values and Offer Values in
the games
Correlation Vself Vother Vcompete Vfairness Vjoint Vrawls Vlower
bound
Vchance
Dictator
Game
-0.35 0.36 -0.33 0.36 0.24 0.20 -0.03 -0.28
Ultimatum
Game
-0.14 0.23 -0.26 0.27 0.20 0.05 -0.05 -0.09
No such linear correlation was observed between each individual dimension of the
Hofstede scores and the offer values in the games.
5 Prediction of the culture and behavior
In this section, we use machine learning in order to make a model of our data that can
predict the value of the offer an individual would make in the dictator game or in the
ultimatum game based on different features of their cultural background. We perform two
experiments: trying to predict the offer, and trying to predict the country of origin. For
each experiment we try all other sets of features.
5.1 Prediction of offers
We used support vector machine (SVM) classifiers to predict the offers made, using each
of the following sets of features:
a) Country of the origin
b) Hofstede’s calculated scores (section 4.2)
c) Answers to the Hofstede Survey Questions (section 4.3)
d) Decision-making values (Section 4.4)
Given that the number of sample points we had were limited to the data we collected in
our experiment (101 distinct data points for each country in the Ultimatum Game and 107
data points from each country in the Dictator game that made up a total of 416 individual
data points), we used a 10-fold cross-validation training/test paradigm. We performed a

Group Decision and Negotiation – GDN 2013
17-21 June 2013, Stockholm, Sweden
18
support vector machine (SVM) classification with parameters C and γ optimized through
grid search. For the prediction model, (SVM) classifier with the radial basis function kernel
was trained and tested.
Table 9. Prediction of Offers from Cultural Features
Percent correct Dictator
Game
(214 total)
Ultimatum
Game
(202 total)
Country (US or India) 39.55% 51.61%
Hofstede Scores (7 dimensions) 39.56% 50.05%
Hofstede Questions (28 questions) 39.24% 53.52%
Decision-making Values (8 values) 52.86% 54.90%
Random baseline: frequency of offers in the data 21% 32%
Most common offer baseline (50%) 38% 51%
The final reported accuracy in Table 9 is the average of the all the predictions made in each
round of the 10-fold cross-validation. For each game, the best classifier is based on our
Decision-making values. In the dictator game Welch’s two sample t-test shows that this is
significantly better than all other classifiers (p < 0.01). For the Ultimatum game, the
decision-making value classifier performs significantly better than the classifier using
Hofstede’s scores (p < 0.05), however it is not significantly better than the other classifiers.
5.2 Prediction of country based on offers in the Game
We also use the same method as in section 5.1 to try to predict country of origin from
game play, the Hofstede values, the Hofstede Questions, and the Decision-Making values.
Table 10 shows the results (all of the differences are significant). We can see that the
Decision-making values again out-performs the Hofestede scores, but in this case, the
model trained on the individual Hofstede questions is better able to distinguish the country
of the participant.

Group Decision and Negotiation – GDN 2013
17-21 June 2013, Stockholm, Sweden
19
Table 10. Prediction of Country of Origin
percent correct Dictator
Game
(214 total)
Ultimatum
Game
(202 total)
Offers (11 values) 53.40% 54.11%
Hofstede Scores (7 dimensions) 64.42% 69.85%
Hofstede Questions (28 questions) 76.39% 77.79%
Decision-making Values (8 values) 60.09% 65.70%
Random Baseline 50% 50%
6 Discussion and Conclusion
In terms of the general behavior in the two games most people tend to offer about 50%
to the other side of the interaction and the offers are higher in the Ultimatum game in
comparison to the Dictator game. The offers in both games follow a normal distribution.
Considering the simplicity of these one shot games we were not able to detect meaningful
cultural differences between the US and Indian offers in the context of the ultimatum
Game and dictator Game. Significant cultural differences are observed in the answers to
the Hofstede survey questions and the score values. It is worth mentioning that the
reported values by participants demonstrate that they have more than one valuation criteria
when they were making their decisions. We are able to make SVM based models that can
predict the behavior in the games based on the national culture or self reported value of the
players. We are also able to determine what culture the participants belong to with higher
than chance probability based on the offers that they make in the games.
In future we will investigate more complex negotiation scenarios and whether we can
make computational agents that use the self reported values for their policies in the
negotiation.
Acknowledgments. This work was funded by a MURI award through ARO grant number
W911NF-08-1-0301.

Group Decision and Negotiation – GDN 2013
17-21 June 2013, Stockholm, Sweden
20
References
Amir O, Rand G. D, Kobi Gal Y(2012) Economic Games on the Internet: The Effect of
$1 Stakes
Blanz, V., Scölkopf, B., Bülthoff, H., Burges, C., Vapnik, V. and Vetter, T. (1996):
Comparison of view–based object recognition algorithms using realistic 3d models.
Artificial Neural Networks—ICANN’96, pages 251 – 256, Berlin. Springer Lecture
Notes in Computer Science, Vol. 1112.
Buhrmester M, Kwang T, Gosling S(2011) Amazons mechanical turk: a new source of
inexpensive, yet high quality, data? Perspectives on Psychologcal Science 6: 3
Camerer, C.F. (2003), Behavioral game theory - Experiments in strategic interaction.
Princeton University Press.
Campos-Ortiz, Francisco et al. (2012): Security of property as a public good: Institutions,
socio-political environment and experimental behavior in five countries, Discussion
Paper Series, Forschungsinstitut zur Zukunft der Arbeit, No. 6982,
http://hdl.handle.net/10419/67263
Cortes, C. and Vapnik, V. 1995: Support vector networks. Machine Learning, 20:273–297.
Fishburn, P.C. (1968): Utility theory. MANAGEMENT SCIENCE 14(5), 335-378,
http://mansci.journal.informs.org/cgi/content/abstract/14/5/335.
Guth, W., Schmittberger, R., Schwarze, B. (1982): An experimental analysis of ultimatum
bargaining. Journal of Economic Behavior & Organization 3(4), 367 { 388
http://www.sciencedirect.com/science/article/B6V8F-
45GSF2VH/2/a458fe2117c85c23081869d475210a09.
Henrich, J., Boyd, R., Bowles, S., Camerer, C., Fehr, E., Gintis, H., McElreath, R., Alvard,
M., Barr, A., Ensminger, J., Henrich, N.S., Hill, K., Gil-White, F., Gurven, M., Marlowe,
F.W., Patton, J.Q., Tracer, D. (2005),: in cross-cultural perspective: Behavioral
experiments in 15 small-scale societies. Behavioral and Brain Sciences 28(06), 795{815
http://dx.doi.org/10.1017/S0140525X05000142.
Hofstede, G.H.: Culture's consequences: comparing values, behaviors, institutions, and
organizations across nations. SAGE, Thousand Oaks, CA (2001).
Hofstede, G., Hofstede, G. H., Cultures and Organizations: Software of the Mind. 2nd
Edition, McGraw-Hill USA, 2005

Group Decision and Negotiation – GDN 2013
17-21 June 2013, Stockholm, Sweden
21
Hofstede, G., Hofstede, G. J., Minkov, M., & Vinken, H. (2008). Announcing a new
version of the Values Survey Module: the VSM 08.
Horton J, Rand D, Zeckhauser R(2010) The online laboratory: Conducting experiments in
a real labor maker.Tehcnial report, National Bureau of Economic Research
Nouri, E., & Traum, D. (2011). A cultural decision-making model for virtual agents playing
negotiation games. In Proceedings of the International Workshop on Culturally
Motivated Virtual Characters. Reykjavik, Iceland.
Nouri, E., Georgila & Traum, D. (2012) A Cultural Decision-Making Model for
Negotiation based on Inverse Reinforcement Learning. In Proceedings of the Cognitive
Science.
Nouri, E., Georgila & Traum, D. (to appear, 2013) Culture–specific models of negotiation
for virtual characters: multi-attribute decision-making based on culture-specific values.
To appear in AI & Society, 2013.
Osuna E , Freund R, Girosi F (1997): An Improved Training Algorithm for Support
Vector Machines
Rand D (2011) The promise of mechanical turk: How online labor markets can help
theorists run behavioral experiments. Journal of Theoretical Biology.
Roth, A.E.,Prasnikar,V.,Okun-Fujiwara,M.,Zamir,S.,(1991).Bargaining and market behavior
in Jerusalem, Ljubljana, Pittsburgh, and Tokyo : an experimental study. The American
Economic Review 81, 1068–1095.
Suri S, Watts D(2011) Cooperation and contagion in web based, networked public goods
experiments. PLoS One 6:e16836