Embed Size (px)
Citation preview
GCC MONITORING AND EVALUATION
FEBRUARY 23, 2016 USAID E3 OFFICE OF GLOBAL CLIMATE CHANGE
KATE FAULHABER, BECKY NICODEMUS, KATHRYN STRATOS
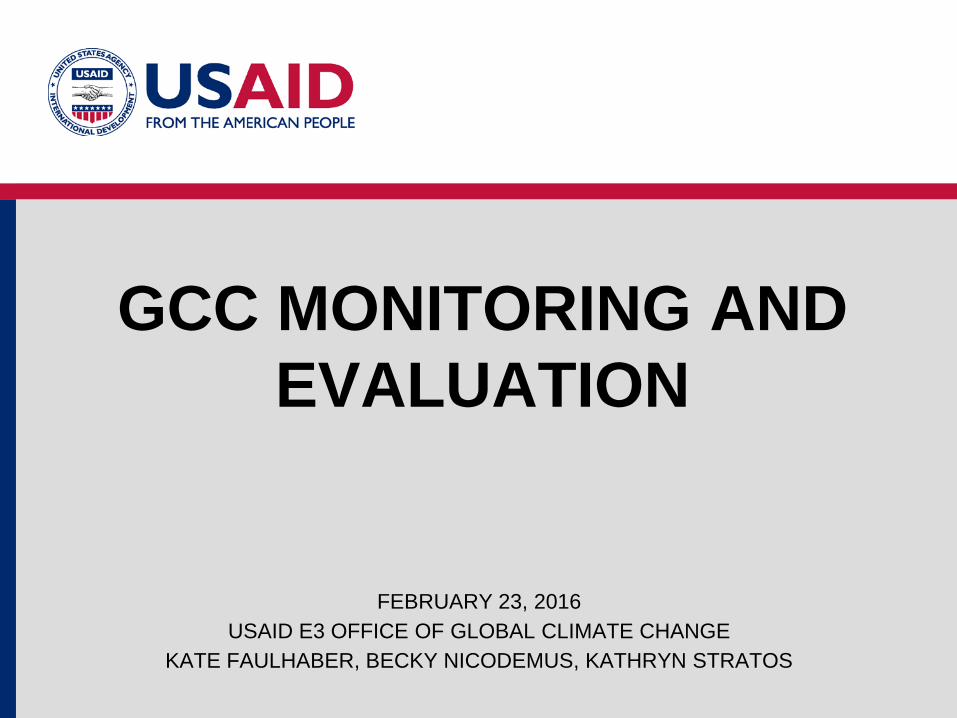
SESSION AGENDA
Welcome and Introductions Monitoring and Reporting: Why it Matters FY 2015-2016 Updates to Standard Indicators Attributing and Reporting on Indirect Climate Change Benefits GCC Evaluations Additional Guidance and Tools World Café: Showcasing Measurement Tools and Approaches

Please share with the people sitting in your immediate vicinity: • Name • Mission • GCC Indicator you find the most challenging to
report on
INTRODUCTIONS

U.S. Pledges to Conference of Parties
Image from UNFCCC
Double U.S. Assistance for Adaptation by 2020
Help mobilize $100 billion/year in climate change finance by 2020
Support Implementation of
Developing Countries’ NDCs & Development of NAPs
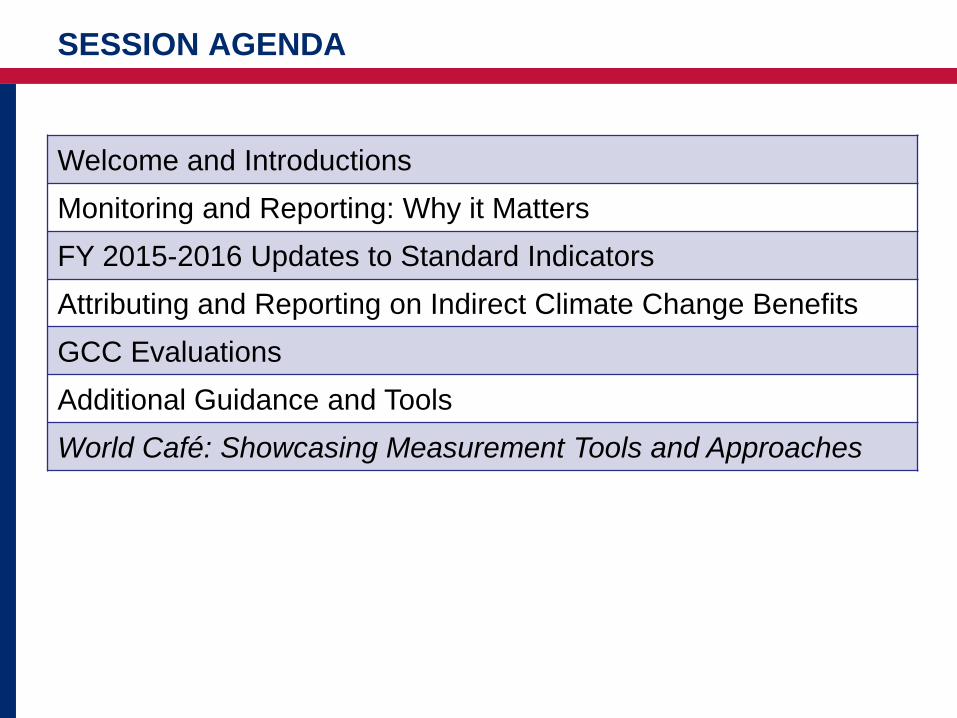
SUMMARY OF USAID GCCI RESULTS (minus State)
Indicator FY10-FY14 Actual
FY15 Estimate
FY16 Target
FY17 Target
Investment leveraged for climate change (USD) 2,945 M 869 M 667 M 1,085 M
GHG emissions avoided, reduced or sequestered (metric tons)
342 M 46 M 61 M 52 M
Stakeholders with increased adaptive capacity 3.6 M 1.3 M 1 M 1 M
Institutions with increased capacity to address climate change
5,310 3,775 1,940 1,440
Laws, policies, agreements, … for climate change 4,130 1,690 820 730
FY10-15 results, FY16-17 targets for five current GCC standard indicators
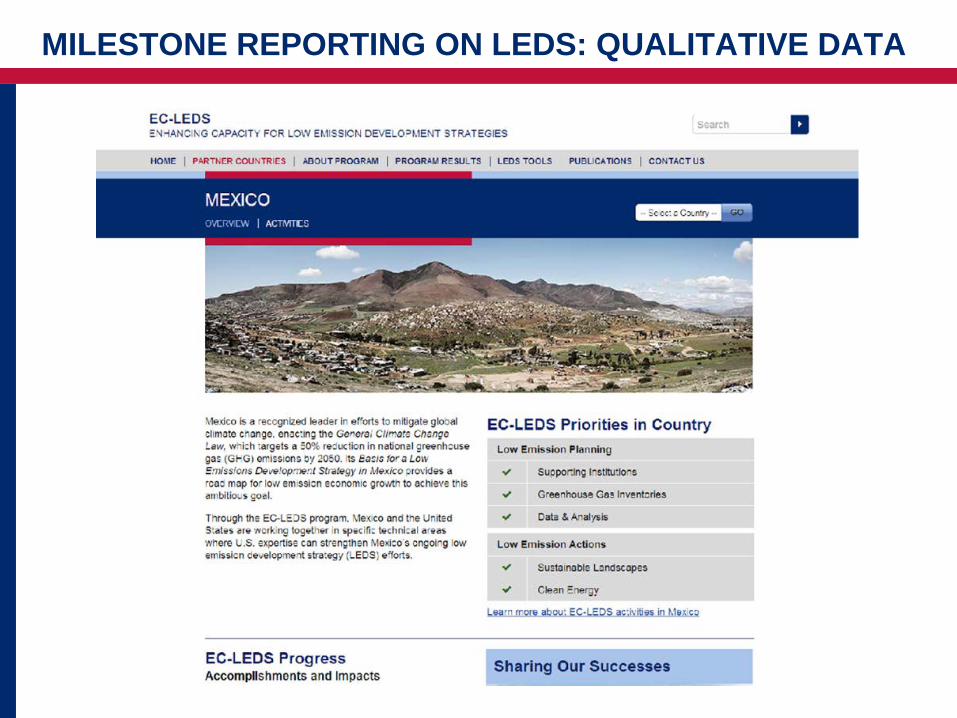
MILESTONE REPORTING ON LEDS: QUALITATIVE DATA
GCCI ACCOMPLISHMENTS INCLUDE GOOD STORIES
• EC-LEDS supported development of 11 INDCs – with potential to reduce the equivalent of 440 MtC02 by 2030
• In the Philippines, more than $120 million of private sector investments for clean energy were mobilized as a result of USG assistance… with similar stories in India, Indonesia, Georgia and elsewhere
• In Bangladesh, SERVIR helped regional science experts track river levels 600 miles upstream, doubling advance warning time to 8 days and warning of a 2014 flood wave--although similar floods had killed thousands, this time 17 lives were lost, partly due to earlier warning
• Capture scope and potential impact of U.S. programming – Projected GHGs, number of people supported – Greater use of context indicators
• Capture people-level and development impacts – # people using climate information/ risk-reducing practices – # people receiving livelihood co-benefits from SL
• Estimate US contribution to international targets – $100 billion/year climate change finance target – Adaptation Funding Doubled by 2020 (indirect must increase!)
• Most robust data collection – Reduced reliance on disaggregates – Fewer gaps in reporting of required indicators
NEXT STEPS TO IMPROVING REPORTING
FY 2016 GCC INDICATORS
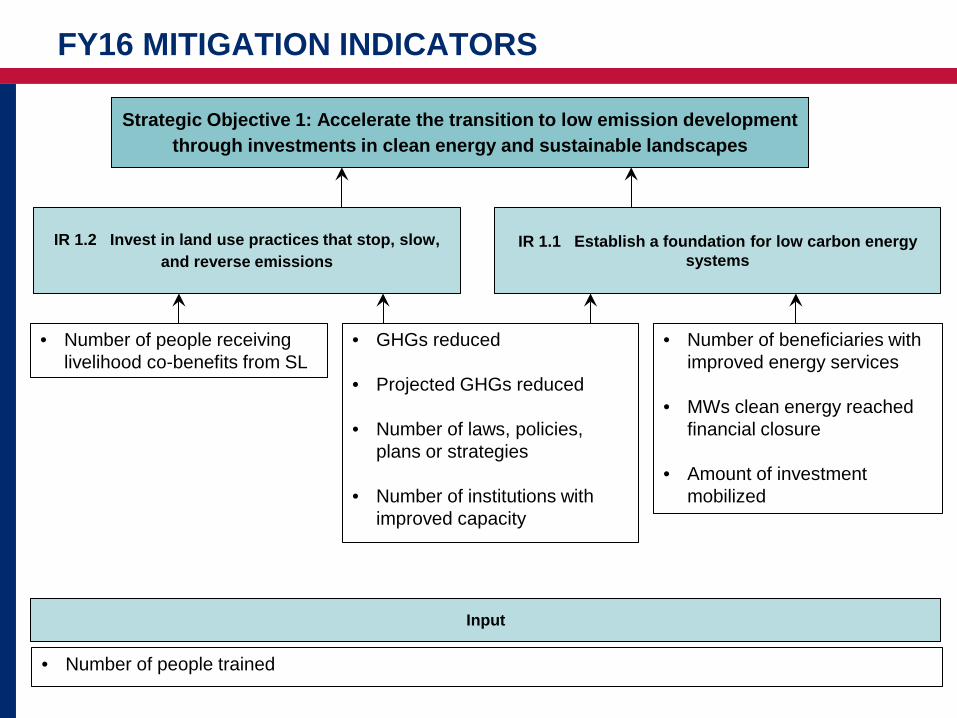
FY16 MITIGATION INDICATORS
IR 1.2 Invest in land use practices that stop, slow, and reverse emissions
IR 1.1 Establish a foundation for low carbon energy systems
Strategic Objective 1: Accelerate the transition to low emission development through investments in clean energy and sustainable landscapes
• Number of people receiving livelihood co-benefits from SL
• GHGs reduced
• Projected GHGs reduced
• Number of laws, policies, plans or strategies
• Number of institutions with improved capacity
• Number of beneficiaries with improved energy services
• MWs clean energy reached financial closure
• Amount of investment mobilized
Input
• Number of people trained
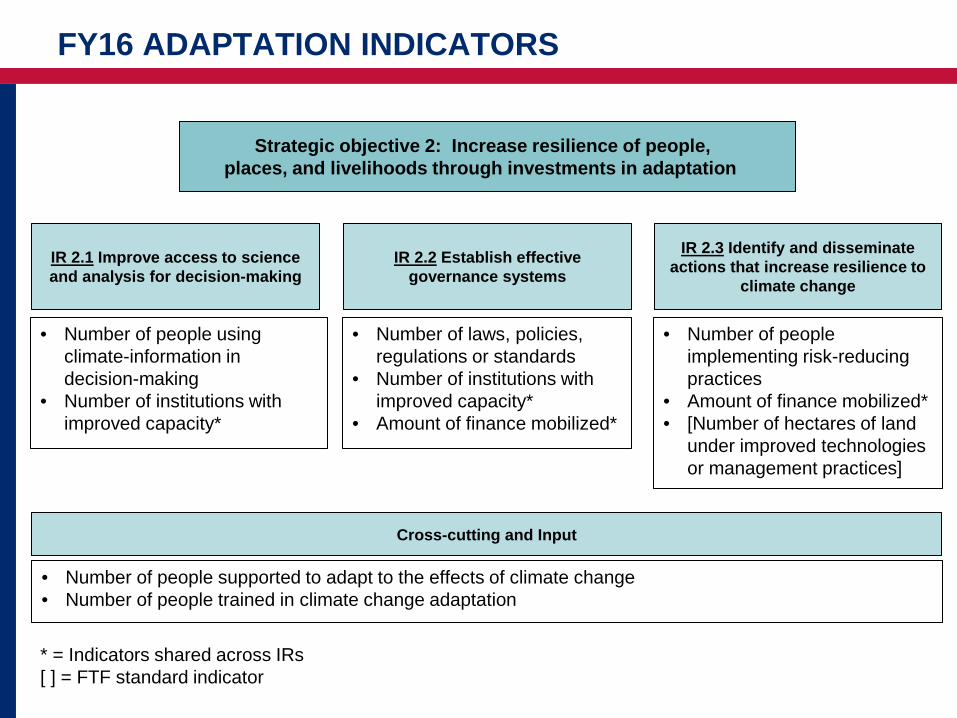
FY16 ADAPTATION INDICATORS
IR 2.1 Improve access to science and analysis for decision-making
IR 2.3 Identify and disseminate actions that increase resilience to
climate change
IR 2.2 Establish effective governance systems
Strategic objective 2: Increase resilience of people, places, and livelihoods through investments in adaptation
• Number of people using climate-information in decision-making
• Number of institutions with improved capacity*
• Number of laws, policies, regulations or standards
• Number of institutions with improved capacity*
• Amount of finance mobilized*
• Number of people implementing risk-reducing practices
• Amount of finance mobilized* • [Number of hectares of land
under improved technologies or management practices]
Cross-cutting and Input
• Number of people supported to adapt to the effects of climate change • Number of people trained in climate change adaptation
* = Indicators shared across IRs [ ] = FTF standard indicator
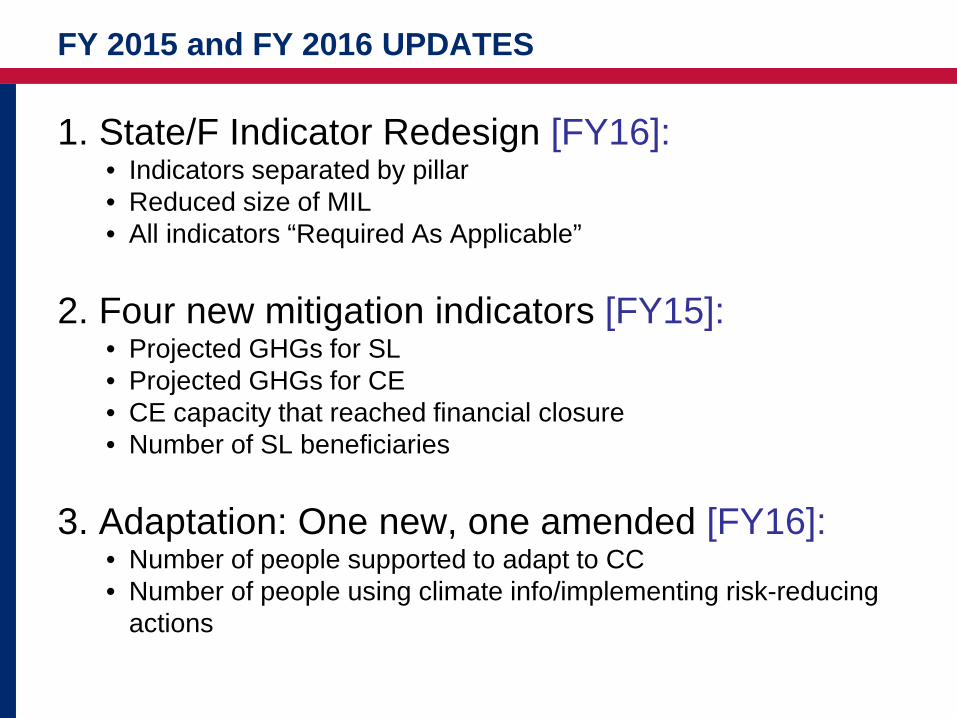
FY 2015 and FY 2016 UPDATES
1. State/F Indicator Redesign [FY16]: • Indicators separated by pillar • Reduced size of MIL • All indicators “Required As Applicable”
2. Four new mitigation indicators [FY15]:
• Projected GHGs for SL • Projected GHGs for CE • CE capacity that reached financial closure • Number of SL beneficiaries
3. Adaptation: One new, one amended [FY16]:
• Number of people supported to adapt to CC • Number of people using climate info/implementing risk-reducing
actions
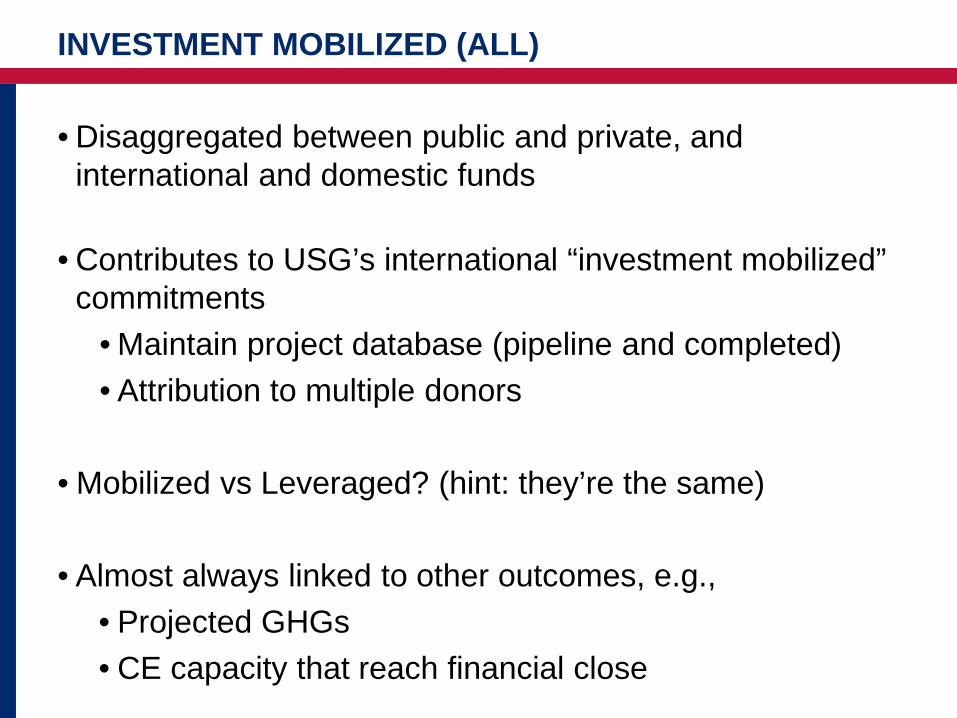
• Disaggregated between public and private, and international and domestic funds
• Contributes to USG’s international “investment mobilized”
commitments • Maintain project database (pipeline and completed) • Attribution to multiple donors
• Mobilized vs Leveraged? (hint: they’re the same)
• Almost always linked to other outcomes, e.g.,
• Projected GHGs • CE capacity that reach financial close
INVESTMENT MOBILIZED (ALL)
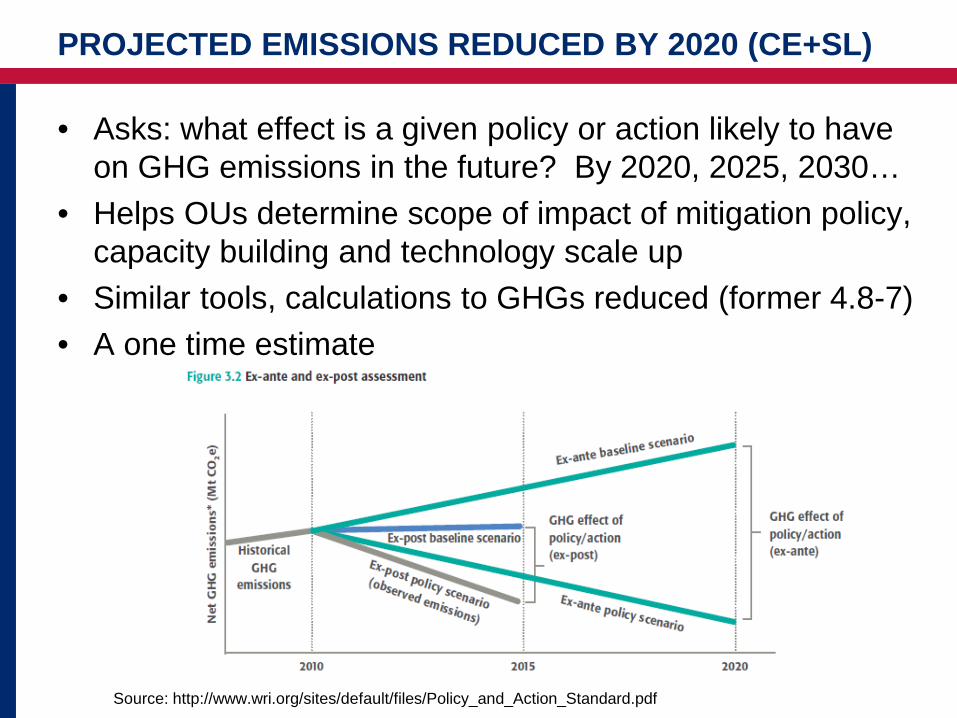
• Asks: what effect is a given policy or action likely to have on GHG emissions in the future? By 2020, 2025, 2030…
• Helps OUs determine scope of impact of mitigation policy, capacity building and technology scale up
• Similar tools, calculations to GHGs reduced (former 4.8-7) • A one time estimate
PROJECTED EMISSIONS REDUCED BY 2020 (CE+SL)
Source: http://www.wri.org/sites/default/files/Policy_and_Action_Standard.pdf
• Monetary benefits examples: • Carbon credits or other payments for ecosystems
services
• Non-monetary benefits examples: • Access to programs or services, land titling or
registration, access to markets, improved rights or authorities
• Tracking beneficiaries: • Overlap between activities • Indirect beneficiaries need to be documented
LIVELIHOOD CO-BENEFITS (SL)
• “Number of people supported by the USG to adapt to the effects of climate change”
• Parallels DFID’s indicator (“Number of people supported to cope…”)
• Provides an estimation of the breadth of people supported by our AD efforts
• Indicators that count number of people trained and number of people that have taken action (by using climate info/implementing action) will remain – Can be counted under new indicator as well
NEW ADAPTATION INDICATOR
U.S. Adaptation Pledge at 2015 Conference of Parties:
The United States will double its grant-based, public climate finance for adaptation by 2020.
How will we do this? 1) Practice climate risk management when designing 2) Incorporate climate adaptation measures as appropriate 3) Estimate value (budget) of measures in Operational
Plans
ATTRIBUTING INDIRECT ADAPTATION FUNDING

DIRECT & INDIRECT ADAPTATION FUNDING TRENDS
0
50
100
150
200
250
300
350
400
450
500
FY 2010 FY 2011 FY 2012 FY 2013 FY 2014 FY 2015
AD - IndirectAD - Direct
Milli
ons
of d
olla
rs

• E.O. 13677 on Climate-Resilience International Development requires USAID to report the: – Proportion of budget for which climate-risk assessments have
been conducted – Proportion of budget for which climate risk was identified and
acted upon
• The E.O. applies to USAID’s development portfolio writ large, with limited exceptions
• Compliance with the E.O. currently required at strategy
level, will be required at project/activity level in FY17 • Still determining best means of monitoring compliance,
may use annual Operating Plan to track by mechanism
E.O. 13677 MONITORING

Relationship between EO budget metrics, indirect and focused GCC-adaptation funding
E.O. 13677 RESULTS V. ADAPTATION RESULTS
Minimum result
No Harm
Tangible climate change adaptation
benefits
Strategic climate change adaptation
results
Budget, climate risk assessed
Budget, climate risk acted upon
GCC-adaptation budget (focused & indirect)
Focused GCC- adaptation budget
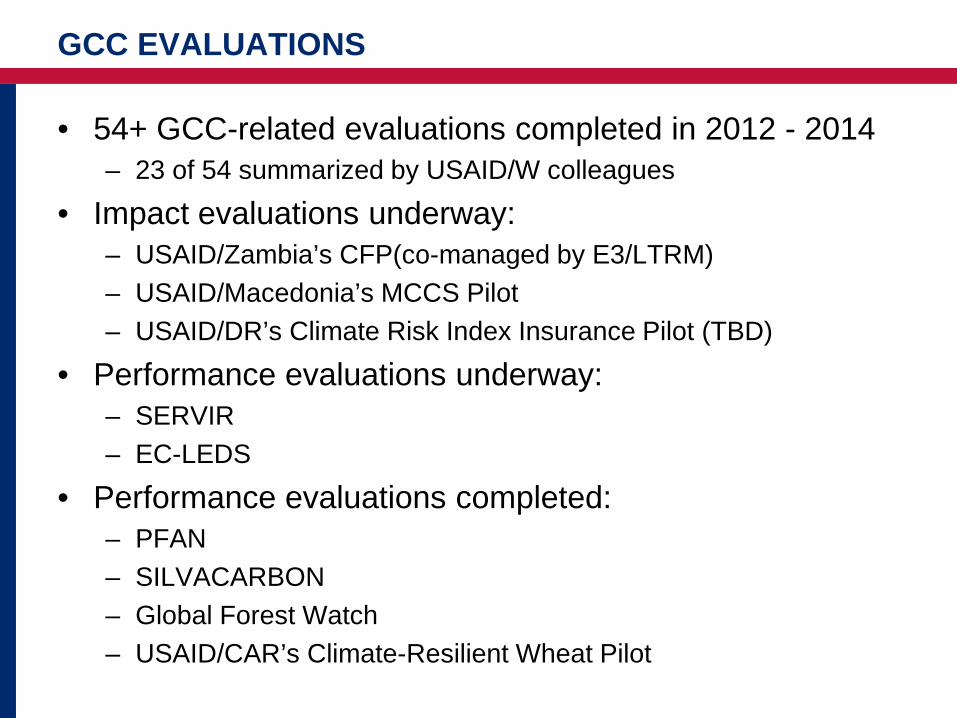
• 54+ GCC-related evaluations completed in 2012 - 2014 – 23 of 54 summarized by USAID/W colleagues
• Impact evaluations underway: – USAID/Zambia’s CFP(co-managed by E3/LTRM) – USAID/Macedonia’s MCCS Pilot – USAID/DR’s Climate Risk Index Insurance Pilot (TBD)
• Performance evaluations underway: – SERVIR – EC-LEDS
• Performance evaluations completed: – PFAN – SILVACARBON – Global Forest Watch – USAID/CAR’s Climate-Resilient Wheat Pilot
GCC EVALUATIONS
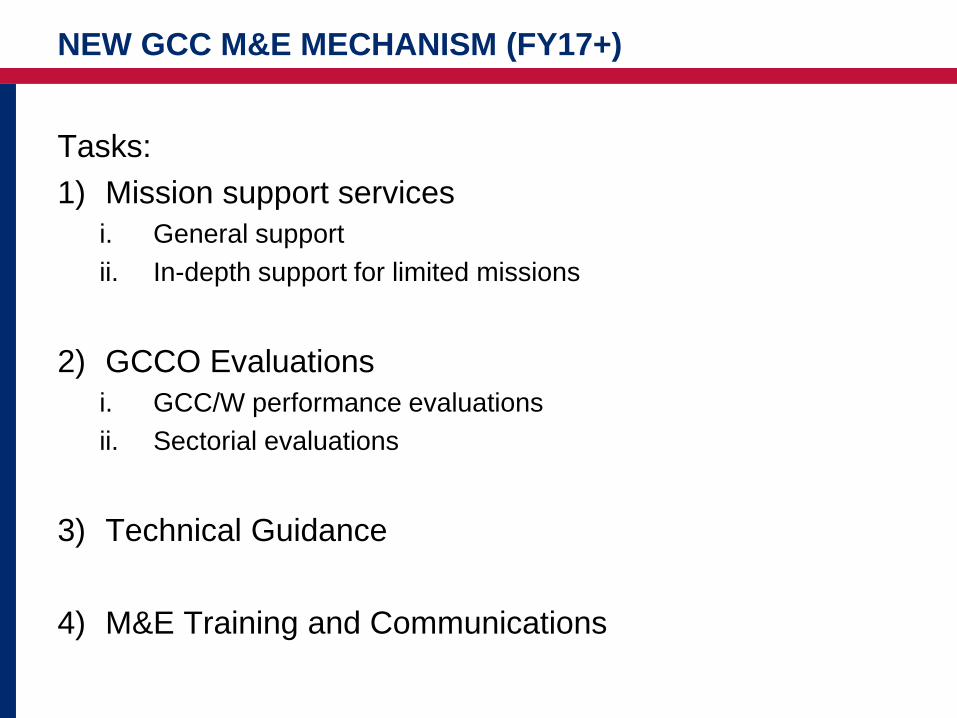
Tasks: 1) Mission support services
i. General support ii. In-depth support for limited missions
2) GCCO Evaluations
i. GCC/W performance evaluations ii. Sectorial evaluations
3) Technical Guidance
4) M&E Training and Communications
NEW GCC M&E MECHANISM (FY17+)

• Handout: M&E Definitions and Resources
• Performance Indicator Reference Sheets (PIRS)
• ProgramNet, Learning Lab and GCC Intranet pages
• Climatelinks’ GCC M&E page
• Development Experience Clearinghouse (DEC) • Coming soon: Templates, Supplementary Guidance Tools: • AFOLU – for measuring emissions from land use/forestry
• CLEER – for measuring emissions reduced through CE
• GCC Institutional Capacity Assessment Tool
WHAT RESOURCES ARE AVAILABLE?

The Clean Energy Emission Reduction (CLEER) suite of tools for calculating emissions reductions from a range of clean energy activities. The station will: • Showcase online CLEER tool, which can estimate annual
and projected GHG emissions reductions
• Highlight training and resources available to missions and implementing partners
• Preview case studies of recent clean energy projects accessed using CLEER
STATION 1: CLEER TOOL (CE)

The Agriculture, Forestry, and Other Land Use (AFOLU) suite has seven tools for calculating emissions reductions from a range of sustainable landscapes activities. SL GHG Calculators: • Forest Protection • Forest Management • Grazing • Afforestation/Reforestation • Agroforestry • Cropland • Forest Degradation by Fuel wood
STATION 2: AFOLU CALCULATOR (SL)
www.afolucarbon.org Available at:

The Ex-Ante Carbon-balance Tool (EX-ACT) is an appraisal system developed by FAO providing estimates of the impact of agriculture and forestry development projects, programs and policies on the carbon-balance.
STATION 3: EX-ANTE CARBON-BALANCE TOOL (EX-ACT)

STATION 4: GLOBAL FOREST WATCH
Global Forest Watch (GFW) is an interactive online forest monitoring and alert system designed to empower people everywhere with the information they need to better manage and conserve forest landscapes.

STATION 5: E3/GCC M&E HELP DESK
Representatives from the GCC M&E team are available to answer any questions you have on data collection, reporting, evaluation and learning.