Embed Size (px)
Citation preview
Global Research
GCC Investment Strategy
Equity - GCC
January 10, 2012
GCC Investment Strategy - 2012
Faisal Hasan, CFA
Head of Research
Tel.: (965) 22951270
Global Investment House
www.globalinv.net
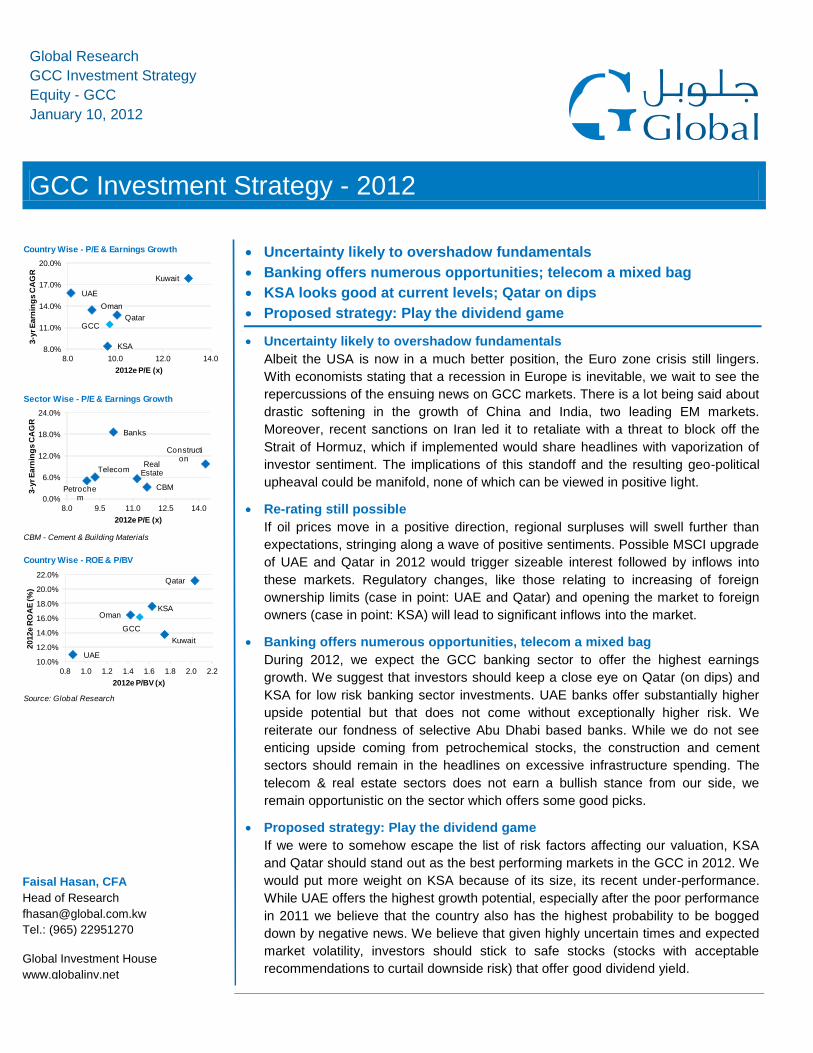
Country Wise - P/E & Earnings Growth
Sector Wise - P/E & Earnings Growth
CBM - Cement & Building Materials
Country Wise - ROE & P/BV
Source: Global Research
UAE
Kuwait
Oman
Qatar
KSA
GCC
8.0%
11.0%
14.0%
17.0%
20.0%
8.0 10.0 12.0 14.0
3-y
r E
arn
ing
s C
AG
R
2012e P/E (x)
UAE
Kuwait
Oman
Qatar
KSA
GCC
10.0%
12.0%
14.0%
16.0%
18.0%
20.0%
22.0%
0.8 1.0 1.2 1.4 1.6 1.8 2.0 2.2
2012e R
OA
E (%
)
2012e P/BV (x)
Banks
Telecom
Petrochem
Real Estate
Construction
CBM
0.0%
6.0%
12.0%
18.0%
24.0%
8.0 9.5 11.0 12.5 14.0
3-y
r E
arn
ing
s C
AG
R
2012e P/E (x)
Uncertainty likely to overshadow fundamentals
Banking offers numerous opportunities; telecom a mixed bag
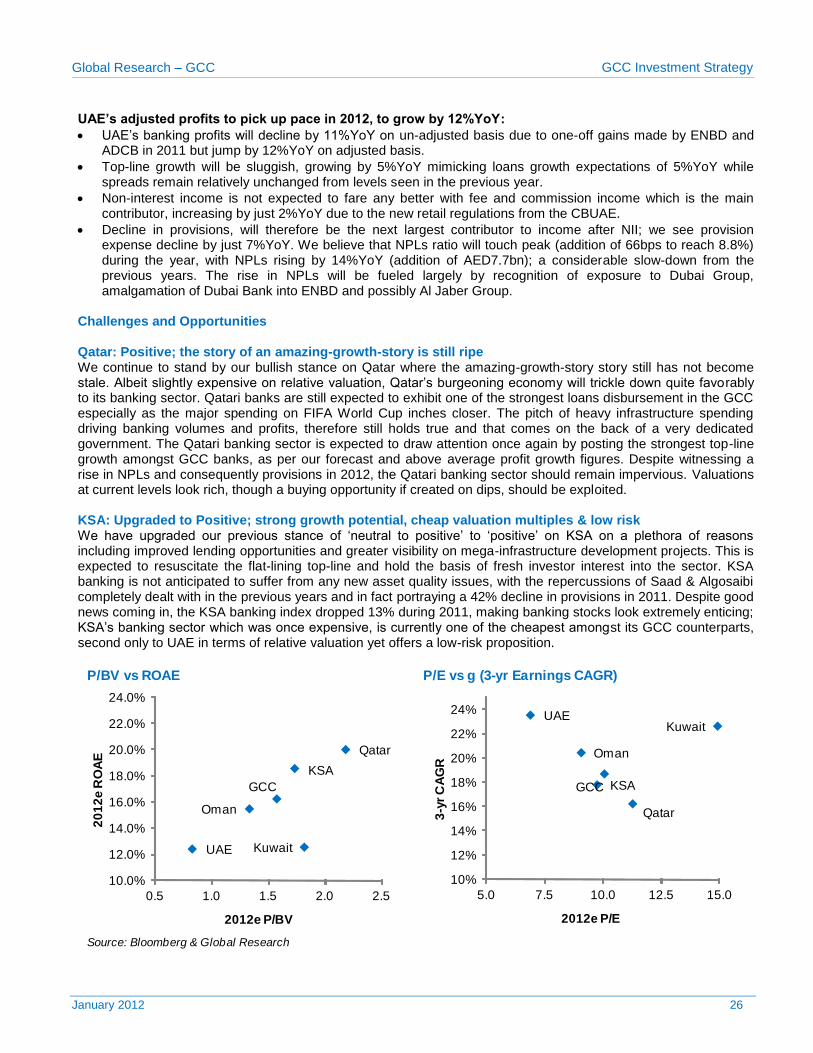
KSA looks good at current levels; Qatar on dips
Proposed strategy: Play the dividend game
Uncertainty likely to overshadow fundamentals
Albeit the USA is now in a much better position, the Euro zone crisis still lingers.
With economists stating that a recession in Europe is inevitable, we wait to see the
repercussions of the ensuing news on GCC markets. There is a lot being said about
drastic softening in the growth of China and India, two leading EM markets.
Moreover, recent sanctions on Iran led it to retaliate with a threat to block off the
Strait of Hormuz, which if implemented would share headlines with vaporization of
investor sentiment. The implications of this standoff and the resulting geo-political
upheaval could be manifold, none of which can be viewed in positive light.
Re-rating still possible
If oil prices move in a positive direction, regional surpluses will swell further than
expectations, stringing along a wave of positive sentiments. Possible MSCI upgrade
of UAE and Qatar in 2012 would trigger sizeable interest followed by inflows into
these markets. Regulatory changes, like those relating to increasing of foreign
ownership limits (case in point: UAE and Qatar) and opening the market to foreign
owners (case in point: KSA) will lead to significant inflows into the market.
Banking offers numerous opportunities, telecom a mixed bag
During 2012, we expect the GCC banking sector to offer the highest earnings
growth. We suggest that investors should keep a close eye on Qatar (on dips) and
KSA for low risk banking sector investments. UAE banks offer substantially higher
upside potential but that does not come without exceptionally higher risk. We
reiterate our fondness of selective Abu Dhabi based banks. While we do not see
enticing upside coming from petrochemical stocks, the construction and cement
sectors should remain in the headlines on excessive infrastructure spending. The
telecom & real estate sectors does not earn a bullish stance from our side, we
remain opportunistic on the sector which offers some good picks.
Proposed strategy: Play the dividend game
If we were to somehow escape the list of risk factors affecting our valuation, KSA
and Qatar should stand out as the best performing markets in the GCC in 2012. We
would put more weight on KSA because of its size, its recent under-performance.
While UAE offers the highest growth potential, especially after the poor performance
in 2011 we believe that the country also has the highest probability to be bogged
down by negative news. We believe that given highly uncertain times and expected
market volatility, investors should stick to safe stocks (stocks with acceptable
recommendations to curtail downside risk) that offer good dividend yield.
Global Research – GCC GCC Investment Strategy
January 2012 2
Global Research - GCC Universe Bloomberg Ticker Mkt. Cap P/E P/BV ROAE ROAA EPS Current Target Upside / Rating
USD mn 1M 3M 12M 2012e 2012e 2012e 2012e 2012e Price Price (Downside)
UAE
Abu Dhabi Commercial Bank ADCB UH 4,204.8 -6.8% -1.1% 25.5% 8.1 0.9 10.8% 1.1% 0.34 2.76 3.62 31.0% STRONG BUY
Arkan Building Materials Company ARKAN UH 433.6 -22.2% -28.3% -47.4% 18.7 0.9 5.1% 3.1% 0.05 0.91 1.12 23.1% STRONG BUY
Dana Gas DANA UH 790.6 -15.4% -15.4% -42.9% 5.3 0.3 6.0% 4.5% 0.08 0.44 0.79 79.5% STRONG BUY
Emirates Telecommunications Corporation ETISALAT UH 19,846.1 -5.3% -10.5% -14.6% 9.9 1.7 17.4% 9.5% 0.93 9.22 11.10 20.4% STRONG BUY
National Bank of Abu Dhabi NBAD UH 8,517.1 -0.9% 7.9% 11.3% 8.0 1.2 16.0% 1.7% 1.36 10.90 12.63 15.9% BUY
Ras Al Khaimah Cement Company RAKCC UH 79.1 -13.0% -25.0% -30.2% na 0.4 0.0% 0.0% 0.00 0.60 0.69 15.0% BUY
Ras Al Khaimah Ceramics Co. RAKCEC UH 287.3 -5.3% -5.3% -36.2% 5.4 0.4 7.5% 3.4% 0.26 1.42 2.32 63.4% STRONG BUY
Abu Dhabi National Energy TAQA UH 2,050.7 0.8% 6.1% -18.8% 4.1 0.7 17.9% 1.6% 0.30 1.21 1.79 48.1% STRONG BUY
Union National Bank UNB UH 1,963.6 -0.7% -2.7% 1.2% 3.9 0.6 15.6% 2.3% 0.74 2.89 4.95 71.1% STRONG BUY
Air Arabia AIRARABI UH 754.7 -4.2% -3.4% -28.7% 10.1 0.5 5.2% 4.0% 0.06 0.59 0.76 28.7% STRONG BUY
Arabtec Holding PJSC ARTC UH 671.6 10.0% 26.9% 4.2% 16.7 0.8 5.1% 1.7% 0.10 1.65 1.27 -23.0% SELL
Dubai Financial Market DFM UH 1,829.6 -13.4% -18.4% -44.7% nm 0.9 1.0% 0.9% 0.01 0.84 0.81 -3.6% HOLD
Drake & Scull International DSI UH 462.5 -5.3% -2.0% -26.4% 7.9 0.6 8.1% 4.0% 0.10 0.78 1.00 28.2% STRONG BUY
Emirates NBD EMIRATES UH 4,267.1 -15.3% -25.8% -2.1% 8.2 0.5 6.1% 0.7% 0.34 2.82 3.83 35.8% STRONG BUY
Aramex ARMX UH 729.5 0.0% 2.8% -14.1% 11.6 na 12.0% 9.0% 0.16 1.83 2.00 9.3% HOLD
Emaar Properties EMAAR UH 4,162.5 -11.0% -0.8% -28.3% 9.6 0.5 4.9% 2.6% 0.26 2.51 3.25 29.5% STRONG BUY
Aldar Properties ALDAR UH 698.2 -11.0% -19.1% -61.6% 11.2 0.4 3.9% 0.6% 0.06 0.89 1.10 23.6% STRONG BUY
Sorouh Real Estate SOROUH UH 564.6 -15.1% -22.5% -51.8% 6.3 0.3 4.9% 2.4% 0.11 0.79 1.05 32.9% STRONG BUY
Total 8.12 0.87 11.0% 2.1%
Kuwait
Mobile Telecommunications Company ZAIN KK 13,297.2 -5.5% -7.5% -41.9% 11.2 1.6 15.0% 9.5% 0.08 0.86 0.86 0.3% HOLD
National Bank of Kuwait NBK KK 15,911.0 -1.8% 5.7% -15.6% 13.1 1.9 15.0% 2.6% 0.09 1.12 1.13 1.1% HOLD
Kuwait Finance House KFIN KK 8,494.0 -3.3% -2.2% -23.4% 20.1 1.9 9.4% 0.9% 0.04 0.88 0.92 4.0% HOLD
Commercial Bank of Kuwait CBK KK 3,515.8 -2.5% -6.1% -18.1% 21.1 1.8 8.5% 1.3% 0.04 0.77 0.73 -5.5% HOLD
National Mobile Telecommunications Company NMTC KK 3,509.9 2.1% 3.2% 1.0% 9.6 1.5 16.7% 8.9% 0.20 1.94 2.59 33.6% STRONG BUY
Jazeera Airways Company JAZEERA KK 323.8 -8.9% 32.3% 230.6% 5.1 2.0 49.2% 10.1% 0.08 0.41 0.61 49.7% STRONG BUY
Burgan Bank BURG KK 2,429.5 -2.1% -3.2% -13.8% 10.4 1.4 13.7% 1.5% 0.04 0.46 0.55 18.9% BUY
Mabanee MABANEE KK 1,715.2 -3.4% 3.6% 21.3% 14.3 2.6 20.3% 12.1% 0.06 0.86 0.98 14.0% BUY
Salhia Real Estate SRE KK 368.1 0.0% -2.9% -26.8% 14.9 0.7 5.2% 2.8% 0.01 0.20 0.25 25.0% STRONG BUY
Total 12.99 1.74 13.8% 2.6%
Oman
Oman Telecommunications Company OTEL OM 2,546.0 2.0% 14.1% 2.8% 8.5 1.8 22.4% 16.8% 0.15 1.31 1.45 11.3% BUY
Bank Muscat BKMB OM 3,068.5 7.8% 15.8% -11.9% 8.2 2.2 15.4% 2.2% 0.09 0.76 0.71 -6.8% HOLD
Bank Dhofar BKDB OM 1,309.8 8.0% 3.0% -17.1% 11.0 0.5 18.2% 2.6% 0.05 0.55 0.35 -36.9% SELL
National Bank of Oman NBOB OM 901.3 3.5% 3.5% -8.0% 8.0 1.3 14.7% 2.2% 0.04 0.32 0.33 3.7% HOLD
Raysut Cement Company RCCI OM 395.3 -9.4% -23.7% -38.9% 10.4 0.5 14.3% 7.6% 0.07 0.76 0.83 9.1% HOLD
Oman International Bank OIBB OM 731.7 4.3% 10.2% 8.6% 14.6 2.8 10.5% 1.7% 0.02 0.29 0.21 -27.8% SELL
Oman Cement Company OCOI OM 379.8 3.8% -0.7% -31.6% 10.8 0.8 9.4% 7.9% 0.04 0.44 0.47 6.6% HOLD
Ahli Bank ABOB OM 543.3 3.6% 0.4% -5.3% 8.2 1.4 19.4% 3.0% 0.03 0.26 0.28 6.3% HOLD
Total 9.00 1.42 17.4% 3.4%
Stock Performance
Global Research – GCC GCC Investment Strategy
January 2012 3
Global Research - GCC Universe Bloomberg Ticker Mkt. Cap P/E P/BV ROE ROA EPS Current Target Upside / Rating
USD mn 1M 3M 12M 2012e 2012e 2012e 2012e 2012e Price Price (Downside)
Qatar
Qatar National Bank QNBK QD 27,237.2 2.6% 11.8% 9.3% 11.4 2.4 21.8% 3.4% 13.63 155.90 169.04 8.4% HOLD
Industries Qatar IQCD QD 20,256.8 -1.1% 12.2% -6.2% 7.6 2.4 35.1% 28.6% 17.53 134.10 170.90 27.4% STRONG BUY
Qatar Telecom QTEL QD 6,989.7 -4.6% -0.5% -2.7% 8.6 1.1 13.4% 2.8% 16.73 144.60 197.17 36.4% STRONG BUY
Vodafone Qatar VFQS QD 1,750.7 -0.8% 2.6% -10.2% na 1.0 -4.1% -3.2% (0.32) 7.54 7.49 -0.7% HOLD
Qatar Islamic Bank QIBK QD 5,483.9 -0.4% 7.1% 0.4% 12.0 1.9 16.0% 3.1% 7.02 84.50 82.92 -1.9% HOLD
The Commercial Bank of Qatar CBQK QD 5,810.7 3.6% 15.4% -8.1% 9.2 1.6 17.5% 3.4% 9.28 85.50 98.03 14.7% BUY
Qatar Electricity & Water Company QEWS QD 3,913.8 2.3% 7.1% 6.7% 9.1 2.7 32.4% 7.1% 15.70 142.50 180.81 26.9% STRONG BUY
Doha Bank DHBK QD 3,746.8 1.5% 15.6% -0.5% 9.5 2.2 23.1% 2.9% 6.91 66.00 67.27 1.9% HOLD
Al Rayan Bank MARK QD 5,736.7 3.9% 15.3% 44.3% 14.3 2.5 18.1% 3.4% 1.94 27.85 27.24 -2.2% HOLD
Qatar National Cement Company QNCD QD 1,529.3 4.4% 5.0% 3.5% 12.4 2.3 19.2% 16.8% 9.12 113.40 125.40 10.6% BUY
Total 10.06 2.03 21.2% 4.6%
Saudi Arabia
Saudi Basic Industries Corporation SABIC AB 76,993.8 0.0% 9.7% -10.3% 9.2 1.7 20.2% 9.4% 10.43 96.25 118.60 23.2% STRONG BUY
Al Rajhi Bank RJHI AB 27,797.8 1.1% 2.6% -16.8% 11.3 3.3 30.2% 4.6% 6.13 69.50 73.27 5.4% HOLD
Saudi Telecom Company STC AB 18,025.2 1.5% -1.2% -21.8% 8.2 1.3 16.1% 7.1% 4.11 33.80 43.50 28.7% STRONG BUY
Samba Financial Group SAMBA AB 10,991.1 -2.3% 4.3% -23.7% 8.5 1.3 16.3% 2.5% 5.38 45.80 53.73 17.3% BUY
Saudi Electricity Company SECO AB 15,220.7 1.9% 2.6% -2.1% 19.2 1.0 5.5% 1.5% 0.71 13.70 13.80 0.7% HOLD
Riyad Bank RIBL AB 9,359.3 0.4% -0.6% -12.4% 9.9 1.2 12.0% 2.0% 2.37 23.40 26.18 11.9% BUY
The Saudi British Bank SABB AB 8,159.3 4.6% 6.8% 1.0% 10.0 1.6 17.0% 2.4% 4.08 40.80 43.13 5.7% HOLD
Banque Saudi Fransi BSFR AB 8,157.2 3.7% 12.2% -6.2% 8.5 1.4 18.0% 2.8% 4.99 42.30 47.32 11.9% BUY
Etihad Etisalat Company EEC AB 9,845.9 5.0% -0.9% -4.1% 7.0 1.7 26.6% 15.2% 7.53 52.75 71.10 34.8% STRONG BUY
Arab National Bank ARNB AB 6,243.8 -3.5% 3.0% -9.0% 8.4 1.3 16.4% 2.3% 3.27 27.50 32.60 18.5% BUY
Saudi Arabia Fertilizers Company SAFCO AB 11,582.4 -4.1% -5.3% 4.0% 11.1 5.4 49.2% 44.6% 15.67 173.75 182.70 5.2% HOLD
Yanbu National Petrochemicals Company YANSAB AB 6,569.5 -1.8% 0.5% -10.1% 7.1 1.8 28.7% 14.1% 6.18 43.80 57.80 32.0% STRONG BUY
Saudi Hollandi Bank AAAL AB 2,619.3 6.8% 15.6% 0.3% 8.3 1.2 15.7% 2.1% 3.58 29.70 32.00 7.7% HOLD
Saudi International Petrochemichal Company SIPCHEM AB 1,891.8 -0.3% 8.1% -22.9% 10.5 1.3 12.5% 5.5% 1.84 19.35 23.60 22.0% STRONG BUY
Yamama Saudi Cement Company YACCO AB 2,546.8 6.4% 14.1% 35.4% 12.8 2.7 21.7% 20.3% 5.52 70.75 71.20 0.6% HOLD
Arabian Cement Co. ARCCO AB 953.5 6.4% 10.9% 32.6% 7.5 1.1 15.8% 11.1% 5.96 44.70 59.20 32.4% STRONG BUY
Saudi Cement Company SACCO AB 3,008.8 15.2% 17.1% 47.5% 13.2 3.0 23.2% 18.4% 5.59 73.75 66.80 -9.4% HOLD
Dar Alarkan ALARKAN AB 2,059.0 12.6% 17.2% -22.3% 6.3 0.5 7.7% 5.1% 1.13 7.15 8.90 24.5% STRONG BUY
Emaar Economic City EMAAR AB 1,643.2 11.5% 13.3% 1.4% na 0.8 -0.5% -0.3% (0.04) 7.25 7.65 5.5% HOLD
Saudi Real Estate Co. (Akaria) SRECO AB 835.1 13.5% 12.0% -1.5% 25.7 1.0 3.8% 3.5% 1.02 26.10 28.95 10.9% BUY
Al Khodari Sons Company ALKHODAR AB 592.1 6.0% -13.6% -5.0% 12.8 2.9 24.4% 8.7% 4.07 52.25 65.10 24.6% STRONG BUY
Mohammad Al-Mojil Group MMG AB 801.6 18.2% 12.6% 23.3% 24.7 1.8 7.4% 3.7% 0.97 24.05 24.50 1.9% HOLD
Total 10.35 1.81 18.4% 4.9%
Bahrain
Bahrain Telecommunications Company BATELCO BI 1,504.9 0.0% 0.0% -21.2% 6.9 1.0 15.3% 12.3% 0.06 0.39 0.50 27.9% STRONG BUY
* All price in local currency as of 5 January 2012
Source: Bloomberg & Global Research
Stock Performance
Global Research – GCC GCC Investment Strategy
January 2012 4
Valuation & Outlook 5 Ras Al Khaimah Cement Company 85
Global Research - GCC Top Picks 11 Ras Al Khaimah Ceramics Co. 86
Macroeconomic Outlook 12
Market Performance 17 Construction Contracting Sector 87
Global Outlook 20 Arabtec Holding 88
Sectoral Outlook 22 Drake & Scull International 89
Company Profiles 45 Mohammad Al Mojil Group 90
Al Khodari Sons & Company 91
Aviation & Logistics Sector 46
Air Arabia 47 Energy & Petrochemicals Sector 92
Jazeera Airw ays Company 48 Saudi Basic Industries Corporation 93
Aramex 49 Saudi Arabia Fertilizers Company 94
Yanbu National Petrochemicals Co. 95
Banking Sector 50 Saudi International Petrochemichal Co. 96
Al Rajhi Bank 51 Industries Qatar 97
Samba Financial Group 52 Dana Gas 98
Riyad Bank 53
The Saudi British Bank 54 Real Estate Sector 99
Banque Saudi Fransi 55 Emaar Properties 100
Arab National Bank 56 Aldar Properties 101
Saudi Hollandi Bank 57 Sorouh Real Estate 102
Burgan Bank 58 Dar Al Arkan Real Estate 103
Commercial Bank of Kuw ait 59 Saudi Real Estate Company 104
Kuw ait Finance House 60 Emaar Economic City 105
National Bank of Kuw ait 61 Mabanee 106
Bank Muscat 62 Salhia Real Estate Company 107
National Bank of Oman 63
Bank Dhofar 64 Telecom Sector 108
Oman International Bank 65 Etihad Etisalat Company 109
Ahli Bank 66 Saudi Telecom Company 110
Al Rayan Bank 67 Bahrain Telecommunications Company 111
Qatar Islamic Bank 68 National Mobile Telecommunications Co. 112
Doha Bank 69 Mobile Telecommunications Company 113
Commercial Bank of Qatar 70 Qatar Telecom 114
Qatar National Bank 71 Vodafone Qatar 115
First Gulf Bank 72 Emirates Telecommunications Corporation 116
National Bank of Abu Dhabi 73 Omantel 117
Abu Dhabi Commercial Bank 74
Union National Bank 75 Utilities Sector 118
Emirates NBD 76 Qatar Electricity & Water Company 119
Abu Dhabi National Energy 120
Cement & Building Materials Sector 77 Saudi Electricity Company 121
Arabian Cement Co. 78
Saudi Cement Company 79 Others 122
Yamama Saudi Cement Company 80 Dubai Financial Market 123
Oman Cement Company 81
Raysut Cement Company 82 Appendix 124
Qatar National Cement Company 83
Arkan Building Materials Company 84 Disclosure 128
TABLE OF CONTENTS

Global Research – GCC GCC Investment Strategy
January 2012 5
Valuation & Outlook Earnings growth 2011: We were a tad optimistic in 2011, it seems Our expectations for earnings growth for 2011 (companies under coverage) have been toned down further, though only slightly in most cases, with Kuwait & UAE being the exceptions. Earnings expectations for Kuwait and UAE have been slashed sharply largely due to revised outlook of the banking sector for the former and high provision expectations for the latter (knocking out one-off gains from profits).
Earnings growth 2012: A slower year for GCC, growth rationalizing in effect Profit growth for GCC should normalize in 2012 after posting (still expectedly) 18%YoY rise in 2011. We see growth figures almost halving in 2012 to 10% after adjusting for one-offs posted by UAE banks against unadjusted figure of 7%YoY. Growth will decline due to shift of stellar growth from heavy weight countries (in terms of our coverage profits) to low weight ones. Oman and Kuwait should shine with high double digit growth; Qatar, though no longer in pole position, should see above average growth in 2012.
Source: Global Research
* Profit figures adjusted for Aldar, one-offs from ENBD and ADCB
Profit growth for UAE and GCC w/o adjustment for ENBD, ADCB is 13% &20% resp.
Figures pertain to Global Research's coverage universe only
GCC Coverage Earnings Growth 2011e - Revised vs Previous Estimates
22%
30%
17%
24%
3%
11%
18%
27%
9%
24%
0%1%
0%
5%
10%
15%
20%
25%
30%
35%
*GC
C
Qa
tar
*UA
E
KS
A
Om
an
Ku
wa
it
Previous: Strategy Report Aug-11 Revised
Source: Global Research, Bloomberg
* Profits adjusted for one off gains made by ENBD and ADCB in 2011
Figures pertain to Global Research's coverage universe only
GCC Coverage Earnings Growth 2012e
10%
15%
9%
6%
20%
23%
18%16%
20%
8%
5%
9%
3%
10%
0%
5%
10%
15%
20%
25%
GC
C
Qa
tar
*UA
E
KS
A
Om
an
Ku
wa
it
Ja
pa
n
Ch
ina
UK
Ind
ia
Ru
ssia
US
A
Bra
zil
Ge
rma
ny
Global Research – GCC GCC Investment Strategy
January 2012 6
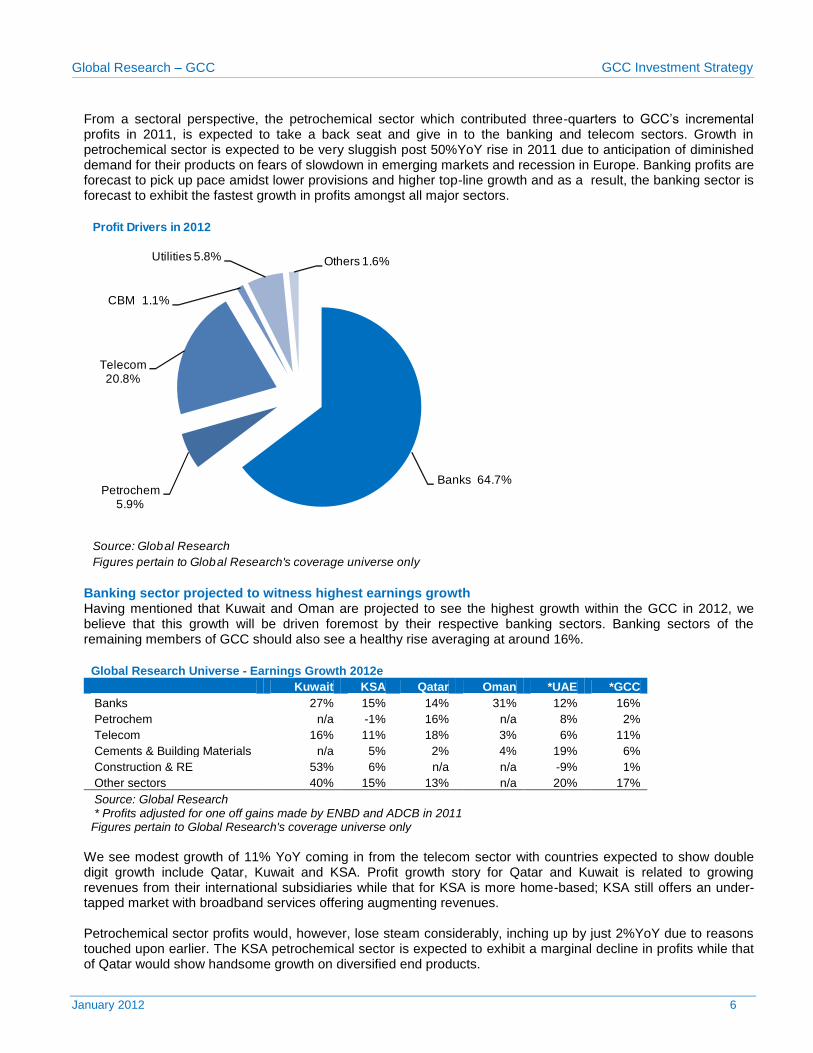
From a sectoral perspective, the petrochemical sector which contributed three-quarters to GCC’s incremental profits in 2011, is expected to take a back seat and give in to the banking and telecom sectors. Growth in petrochemical sector is expected to be very sluggish post 50%YoY rise in 2011 due to anticipation of diminished demand for their products on fears of slowdown in emerging markets and recession in Europe. Banking profits are forecast to pick up pace amidst lower provisions and higher top-line growth and as a result, the banking sector is forecast to exhibit the fastest growth in profits amongst all major sectors.
Banking sector projected to witness highest earnings growth Having mentioned that Kuwait and Oman are projected to see the highest growth within the GCC in 2012, we believe that this growth will be driven foremost by their respective banking sectors. Banking sectors of the remaining members of GCC should also see a healthy rise averaging at around 16%.
Global Research Universe - Earnings Growth 2012e
Kuwait KSA Qatar Oman *UAE *GCC
Banks 27% 15% 14% 31% 12% 16%
Petrochem n/a -1% 16% n/a 8% 2%
Telecom 16% 11% 18% 3% 6% 11%
Cements & Building Materials n/a 5% 2% 4% 19% 6%
Construction & RE 53% 6% n/a n/a -9% 1%
Other sectors 40% 15% 13% n/a 20% 17%
Source: Global Research * Profits adjusted for one off gains made by ENBD and ADCB in 2011 Figures pertain to Global Research's coverage universe only
We see modest growth of 11% YoY coming in from the telecom sector with countries expected to show double digit growth include Qatar, Kuwait and KSA. Profit growth story for Qatar and Kuwait is related to growing revenues from their international subsidiaries while that for KSA is more home-based; KSA still offers an under-tapped market with broadband services offering augmenting revenues. Petrochemical sector profits would, however, lose steam considerably, inching up by just 2%YoY due to reasons touched upon earlier. The KSA petrochemical sector is expected to exhibit a marginal decline in profits while that of Qatar would show handsome growth on diversified end products.
Profit Drivers in 2012
Source: Global Research
Figures pertain to Global Research's coverage universe only
Banks 64.7%Petrochem
5.9%
Telecom 20.8%
CBM 1.1%
Utilities 5.8% Others 1.6%
Global Research – GCC GCC Investment Strategy
January 2012 7
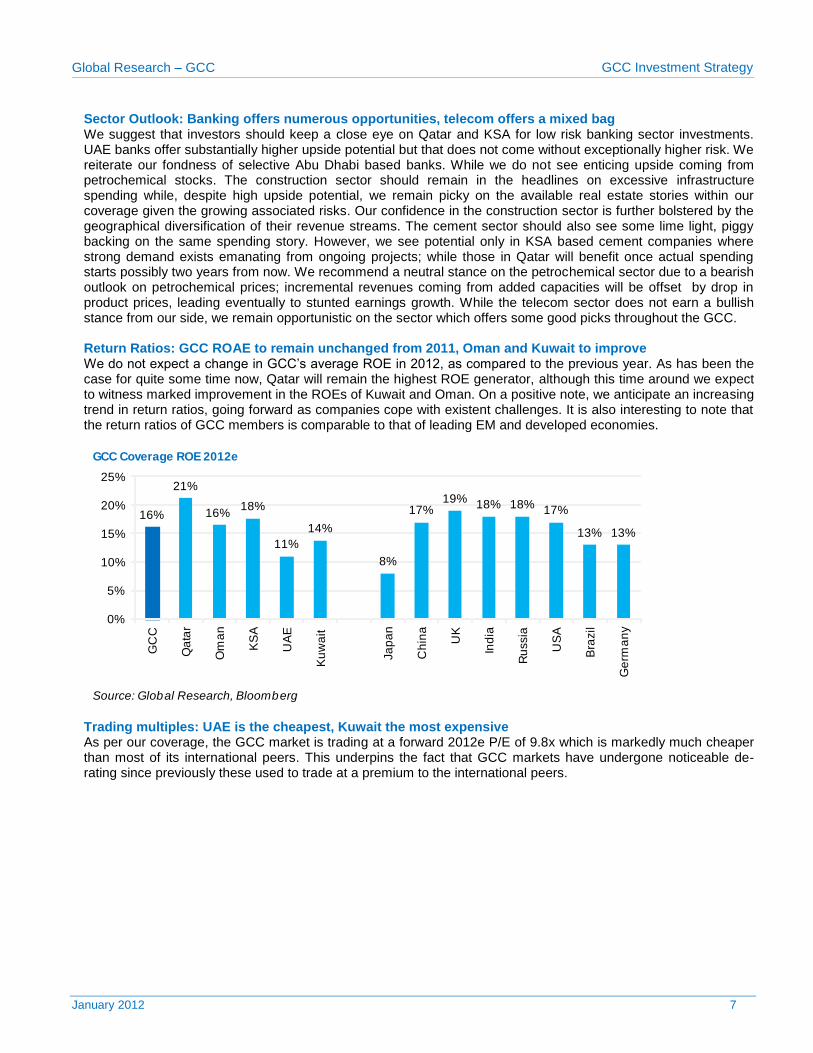
Sector Outlook: Banking offers numerous opportunities, telecom offers a mixed bag We suggest that investors should keep a close eye on Qatar and KSA for low risk banking sector investments. UAE banks offer substantially higher upside potential but that does not come without exceptionally higher risk. We reiterate our fondness of selective Abu Dhabi based banks. While we do not see enticing upside coming from petrochemical stocks. The construction sector should remain in the headlines on excessive infrastructure spending while, despite high upside potential, we remain picky on the available real estate stories within our coverage given the growing associated risks. Our confidence in the construction sector is further bolstered by the geographical diversification of their revenue streams. The cement sector should also see some lime light, piggy backing on the same spending story. However, we see potential only in KSA based cement companies where strong demand exists emanating from ongoing projects; while those in Qatar will benefit once actual spending starts possibly two years from now. We recommend a neutral stance on the petrochemical sector due to a bearish outlook on petrochemical prices; incremental revenues coming from added capacities will be offset by drop in product prices, leading eventually to stunted earnings growth. While the telecom sector does not earn a bullish stance from our side, we remain opportunistic on the sector which offers some good picks throughout the GCC. Return Ratios: GCC ROAE to remain unchanged from 2011, Oman and Kuwait to improve We do not expect a change in GCC’s average ROE in 2012, as compared to the previous year. As has been the case for quite some time now, Qatar will remain the highest ROE generator, although this time around we expect to witness marked improvement in the ROEs of Kuwait and Oman. On a positive note, we anticipate an increasing trend in return ratios, going forward as companies cope with existent challenges. It is also interesting to note that the return ratios of GCC members is comparable to that of leading EM and developed economies.
Trading multiples: UAE is the cheapest, Kuwait the most expensive As per our coverage, the GCC market is trading at a forward 2012e P/E of 9.8x which is markedly much cheaper than most of its international peers. This underpins the fact that GCC markets have undergone noticeable de-rating since previously these used to trade at a premium to the international peers.
GCC Coverage ROE 2012e
Source: Global Research, Bloomberg
16%
21%
16%18%
11%
14%
8%
17%19%
18% 18%17%
13% 13%
0%
5%
10%
15%
20%
25%
GC
C
Qa
tar
Om
an
KS
A
UA
E
Ku
wa
it
Ja
pa
n
Ch
ina
UK
Ind
ia
Ru
ssia
US
A
Bra
zil
Ge
rma
ny
Global Research – GCC GCC Investment Strategy
January 2012 8
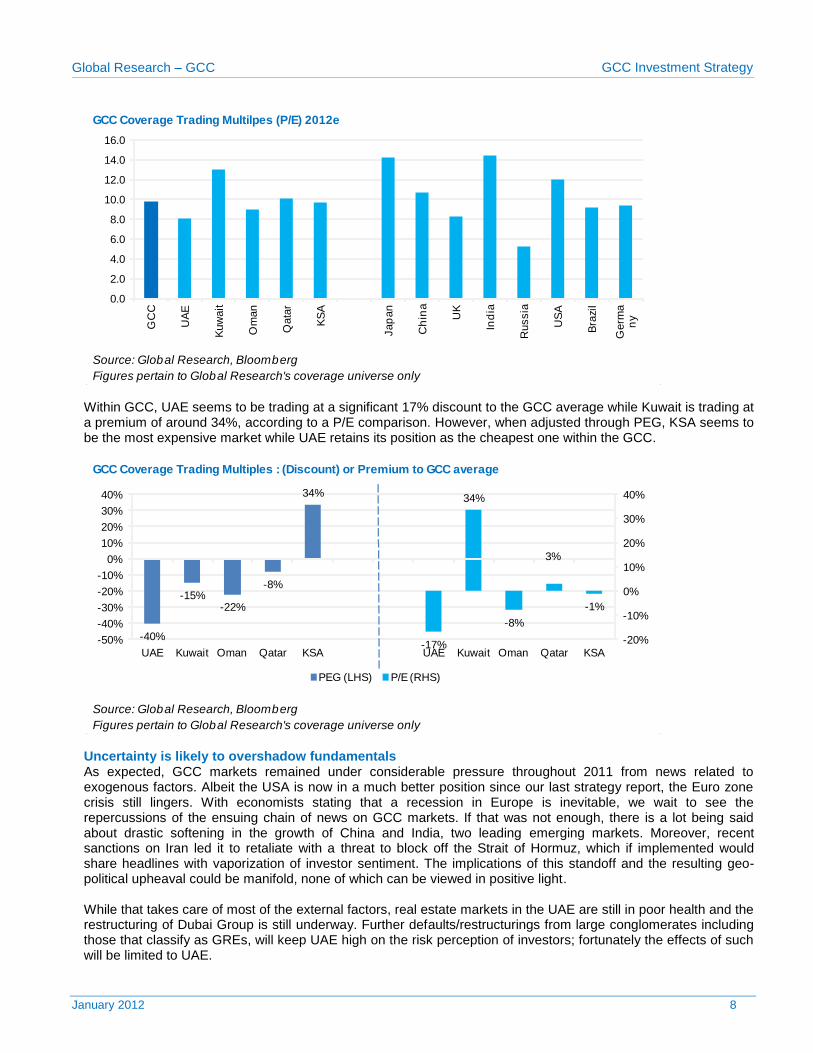
Within GCC, UAE seems to be trading at a significant 17% discount to the GCC average while Kuwait is trading at a premium of around 34%, according to a P/E comparison. However, when adjusted through PEG, KSA seems to be the most expensive market while UAE retains its position as the cheapest one within the GCC.
Uncertainty is likely to overshadow fundamentals As expected, GCC markets remained under considerable pressure throughout 2011 from news related to exogenous factors. Albeit the USA is now in a much better position since our last strategy report, the Euro zone crisis still lingers. With economists stating that a recession in Europe is inevitable, we wait to see the repercussions of the ensuing chain of news on GCC markets. If that was not enough, there is a lot being said about drastic softening in the growth of China and India, two leading emerging markets. Moreover, recent sanctions on Iran led it to retaliate with a threat to block off the Strait of Hormuz, which if implemented would share headlines with vaporization of investor sentiment. The implications of this standoff and the resulting geo-political upheaval could be manifold, none of which can be viewed in positive light. While that takes care of most of the external factors, real estate markets in the UAE are still in poor health and the restructuring of Dubai Group is still underway. Further defaults/restructurings from large conglomerates including those that classify as GREs, will keep UAE high on the risk perception of investors; fortunately the effects of such will be limited to UAE.
GCC Coverage Trading Multilpes (P/E) 2012e
Source: Global Research, Bloomberg
Figures pertain to Global Research's coverage universe only
0.0
2.0
4.0
6.0
8.0
10.0
12.0
14.0
16.0G
CC
UA
E
Kuw
ait
Om
an
Qata
r
KS
A
Jap
an
Ch
ina
UK
Ind
ia
Russia
US
A
Bra
zil
Germ
an
y
GCC Coverage Trading Multiples : (Discount) or Premium to GCC average
Source: Global Research, Bloomberg
Figures pertain to Global Research's coverage universe only
-40%
-15%-22%
-8%
34%
-17%
34%
-8%
3%
-1%
-20%
-10%
0%
10%
20%
30%
40%
-50%
-40%
-30%
-20%
-10%
0%
10%
20%
30%
40%
UAE Kuwait Oman Qatar KSA UAE Kuwait Oman Qatar KSA
PEG (LHS) P/E (RHS)
Global Research – GCC GCC Investment Strategy
January 2012 9
Re-rating is still possible Despite the gloomy picture, some events may still propel markets in the right direction. If oil prices move in a positive direction, say above USD120/barrel, regional surpluses will swell further than expectations creating positive sentiment in the market. The petrochemical sector will be the first and the largest beneficiary and has the capacity (market weight) to actually thrust the index forward. Possible MSCI upgrade of UAE and Qatar in 2012 would trigger sizeable interest followed by inflows into these markets. This comes at a very opportune time, when Taiwan and/or South Korea could see a possible upgrade into developed markets, leaving EM indexed funds to scramble for possible replacements. Regulatory changes, like those relating to increasing of foreign ownership limits (case in point: UAE and Qatar) and opening the market to foreign owners (case in point: KSA) will lead to significant inflows into the market, more so in the case of KSA which is the largest stock exchange in the GCC. The FOL of most stocks in Qatar and UAE are already maxed out and any relaxation in the limits will be met with cheer from foreign investors, not to mention that it is already a precondition to the MSCI status upgrade to EM. Resolution of asset quality issues of UAE based banks, a slow-down in corporate defaults and a confirmation from GREs that liquidity positions are in control, would send the right message across. Investors that draw immense riskiness from these factors will see their fears assuaged, inducing a fresh rally in the markets. Similarly, if developmental plans being carried out by governments accelerate and particularly in Kuwait’s case, any actual implementation of the announced projects would bring about a sudden and positive shift in our outlook of the country.
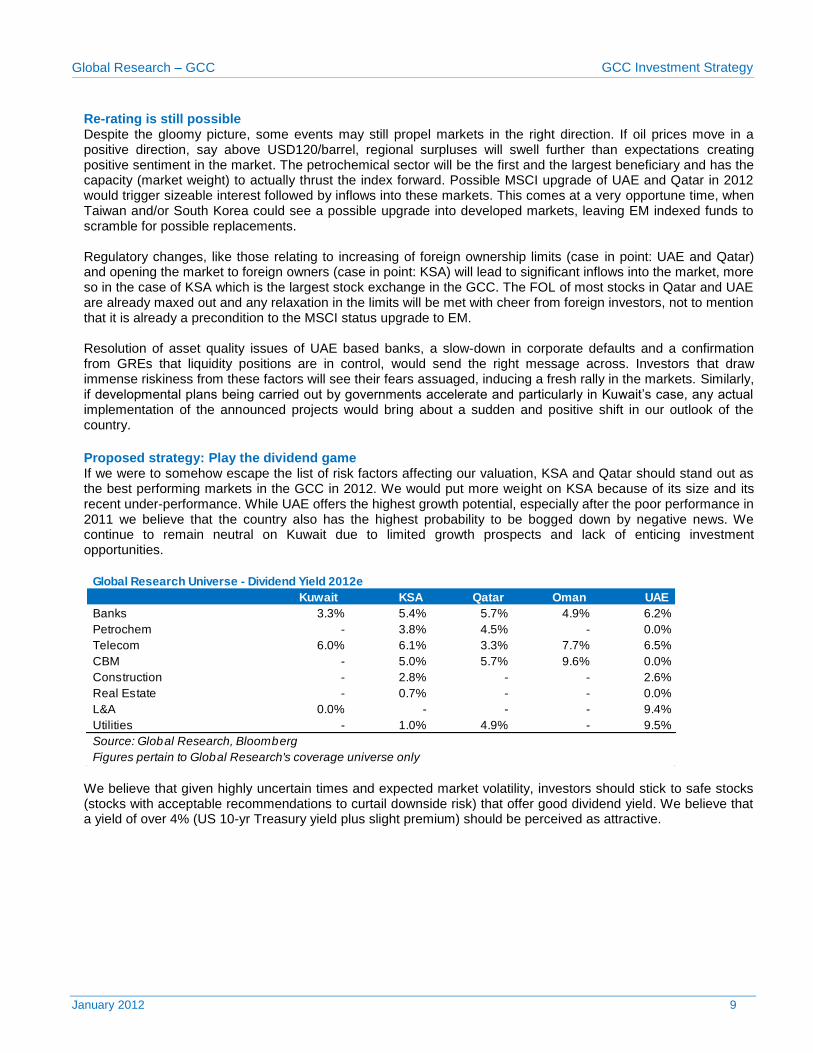
Proposed strategy: Play the dividend game If we were to somehow escape the list of risk factors affecting our valuation, KSA and Qatar should stand out as the best performing markets in the GCC in 2012. We would put more weight on KSA because of its size and its recent under-performance. While UAE offers the highest growth potential, especially after the poor performance in 2011 we believe that the country also has the highest probability to be bogged down by negative news. We continue to remain neutral on Kuwait due to limited growth prospects and lack of enticing investment opportunities.
We believe that given highly uncertain times and expected market volatility, investors should stick to safe stocks (stocks with acceptable recommendations to curtail downside risk) that offer good dividend yield. We believe that a yield of over 4% (US 10-yr Treasury yield plus slight premium) should be perceived as attractive.
Kuwait KSA Qatar Oman UAE
Banks 3.3% 5.4% 5.7% 4.9% 6.2%
Petrochem - 3.8% 4.5% - 0.0%
Telecom 6.0% 6.1% 3.3% 7.7% 6.5%
CBM - 5.0% 5.7% 9.6% 0.0%
Construction - 2.8% - - 2.6%
Real Estate - 0.7% - - 0.0%
L&A 0.0% - - - 9.4%
Utilities - 1.0% 4.9% - 9.5%
Figures pertain to Global Research's coverage universe only
Global Research Universe - Dividend Yield 2012e
Source: Global Research, Bloomberg
Global Research – GCC GCC Investment Strategy
January 2012 10
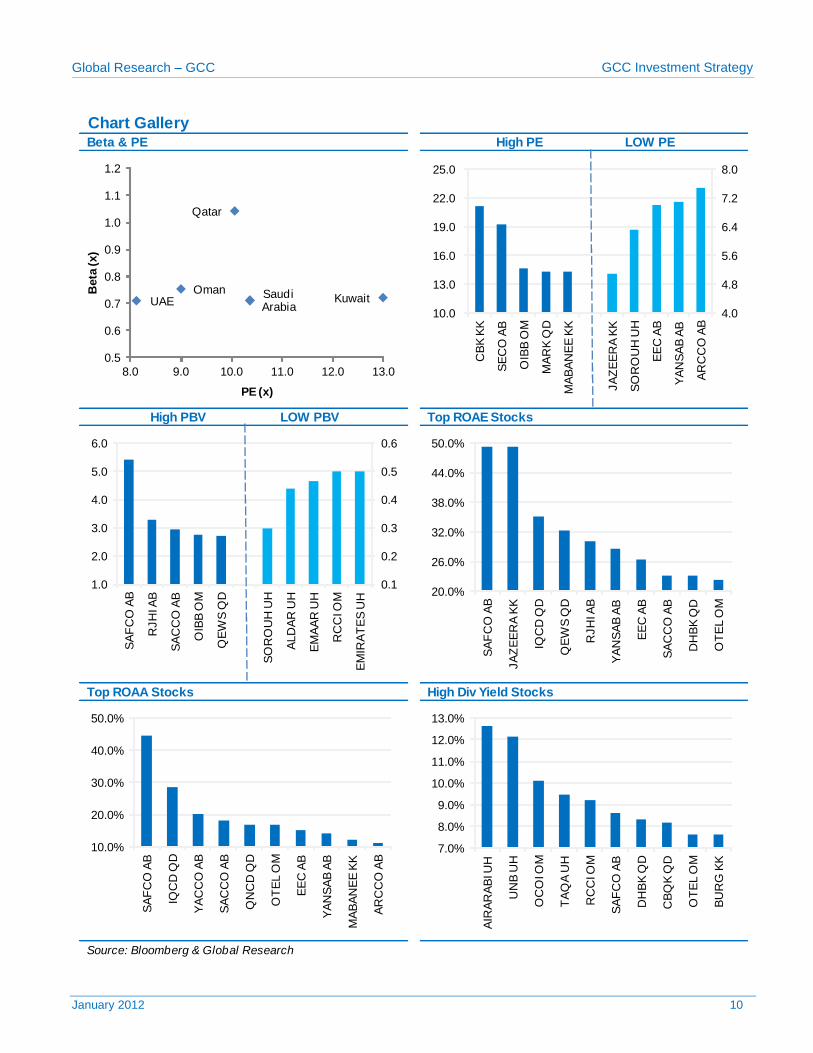
Chart GalleryBeta & PE High PE LOW PE
High PBV LOW PBV Top ROAE Stocks
Top ROAA Stocks High Div Yield Stocks
Source: Bloomberg & Global Research
0.1
0.2
0.3
0.4
0.5
0.6
1.0
2.0
3.0
4.0
5.0
6.0
SA
FC
O A
B
RJH
I AB
SA
CC
O A
B
OIB
B O
M
QE
WS
QD
SO
RO
UH
UH
ALD
AR
UH
EM
AA
R U
H
RC
CI O
M
EM
IRA
TE
S U
H 20.0%
26.0%
32.0%
38.0%
44.0%
50.0%
SA
FC
O A
B
JA
ZE
ER
A K
K
IQC
D Q
D
QE
WS
QD
RJH
I AB
YA
NS
AB
AB
EE
C A
B
SA
CC
O A
B
DH
BK
QD
OT
EL O
M
10.0%
20.0%
30.0%
40.0%
50.0%
SA
FC
O A
B
IQC
D Q
D
YA
CC
O A
B
SA
CC
O A
B
QN
CD
QD
OT
EL O
M
EE
C A
B
YA
NS
AB
AB
MA
BA
NE
E K
K
AR
CC
O A
B
7.0%
8.0%
9.0%
10.0%
11.0%
12.0%
13.0%
AIR
AR
AB
I UH
UN
B U
H
OC
OI O
M
TA
QA
UH
RC
CI O
M
SA
FC
O A
B
DH
BK
QD
CB
QK
QD
OT
EL O
M
BU
RG
KK
4.0
4.8
5.6
6.4
7.2
8.0
10.0
13.0
16.0
19.0
22.0
25.0
CB
K K
K
SE
CO
AB
OIB
B O
M
MA
RK
QD
MA
BA
NE
E K
K
JA
ZE
ER
A K
K
SO
RO
UH
UH
EE
C A
B
YA
NS
AB
AB
AR
CC
O A
B
OmanKuwait
Qatar
UAESaudi Arabia
0.5
0.6
0.7
0.8
0.9
1.0
1.1
1.2
8.0 9.0 10.0 11.0 12.0 13.0
Beta
(x)
PE (x)
Global Research – GCC GCC Investment Strategy
January 2012 11
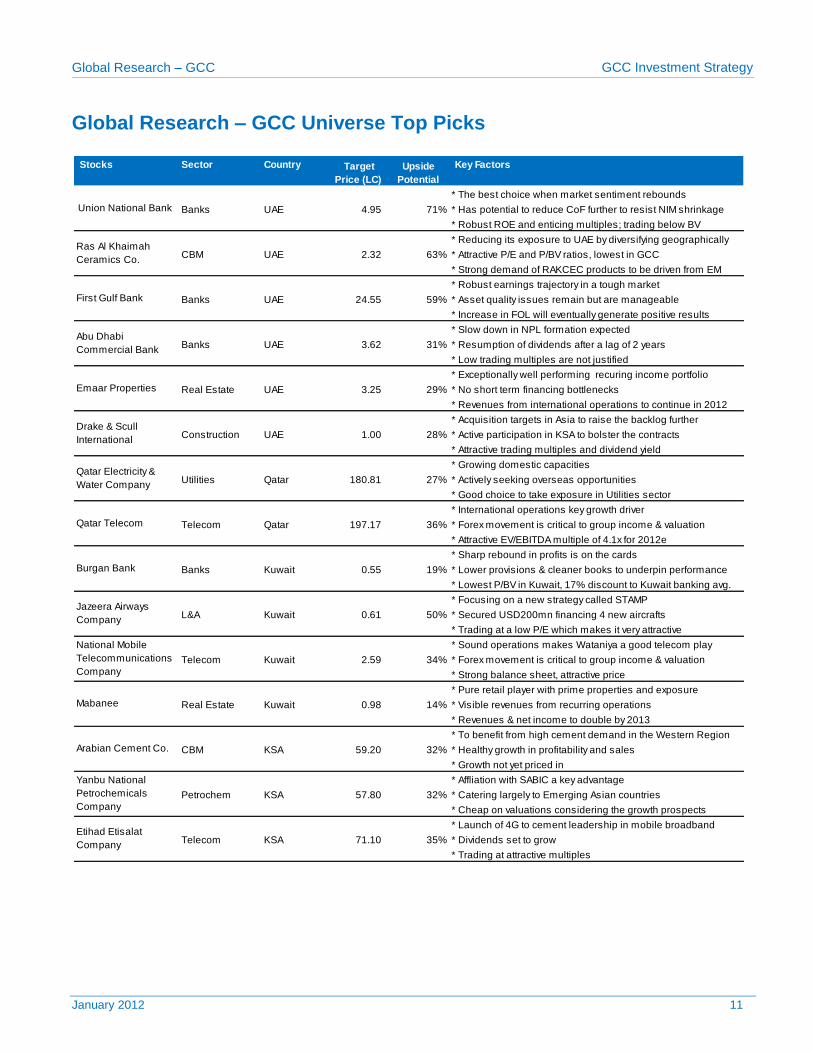
Global Research – GCC Universe Top Picks
Stocks Sector Country Key Factors
* The best choice when market sentiment rebounds
Banks UAE 4.95 71% * Has potential to reduce CoF further to resist NIM shrinkage
* Robust ROE and enticing multiples; trading below BV
* Reducing its exposure to UAE by diversifying geographically
CBM UAE 2.32 63% * Attractive P/E and P/BV ratios, lowest in GCC
* Strong demand of RAKCEC products to be driven from EM
* Robust earnings trajectory in a tough market
Banks UAE 24.55 59% * Asset quality issues remain but are manageable
* Increase in FOL will eventually generate positive results
* Slow down in NPL formation expected
Banks UAE 3.62 31% * Resumption of dividends after a lag of 2 years
* Low trading multiples are not justified
* Exceptionally well performing recuring income portfolio
Real Estate UAE 3.25 29% * No short term financing bottlenecks
* Revenues from international operations to continue in 2012
* Acquisition targets in Asia to raise the backlog further
Construction UAE 1.00 28% * Active participation in KSA to bolster the contracts
* Attractive trading multiples and dividend yield
* Growing domestic capacities
Utilities Qatar 180.81 27% * Actively seeking overseas opportunities
* Good choice to take exposure in Utilities sector
* International operations key growth driver
Telecom Qatar 197.17 36% * Forex movement is critical to group income & valuation
* Attractive EV/EBITDA multiple of 4.1x for 2012e
* Sharp rebound in profits is on the cards
Banks Kuwait 0.55 19% * Lower provisions & cleaner books to underpin performance
* Lowest P/BV in Kuwait, 17% discount to Kuwait banking avg.
* Focusing on a new strategy called STAMP
L&A Kuwait 0.61 50% * Secured USD200mn financing 4 new aircrafts
* Trading at a low P/E which makes it very attractive
* Sound operations makes Wataniya a good telecom play
Telecom Kuwait 2.59 34% * Forex movement is critical to group income & valuation
* Strong balance sheet, attractive price
* Pure retail player with prime properties and exposure
Real Estate Kuwait 0.98 14% * Visible revenues from recurring operations
* Revenues & net income to double by 2013
* To benefit from high cement demand in the Western Region
CBM KSA 59.20 32% * Healthy growth in profitability and sales
* Growth not yet priced in
* Affliation with SABIC a key advantage
Petrochem KSA 57.80 32% * Catering largely to Emerging Asian countries
* Cheap on valuations considering the growth prospects
* Launch of 4G to cement leadership in mobile broadband
Telecom KSA 71.10 35% * Dividends set to grow
* Trading at attractive multiples
Union National Bank
Ras Al Khaimah
Ceramics Co.
First Gulf Bank
Jazeera Airways
Company
Qatar Electricity &
Water Company
Qatar Telecom
Burgan Bank
Abu Dhabi
Commercial Bank
Emaar Properties
Drake & Scull
International
Etihad Etisalat
Company
National Mobile
Telecommunications
Company
Mabanee
Arabian Cement Co.
Yanbu National
Petrochemicals
Company
Target
Price (LC)
Upside
Potential
Global Research – GCC GCC Investment Strategy
January 2012 12
Macroeconomic Outlook
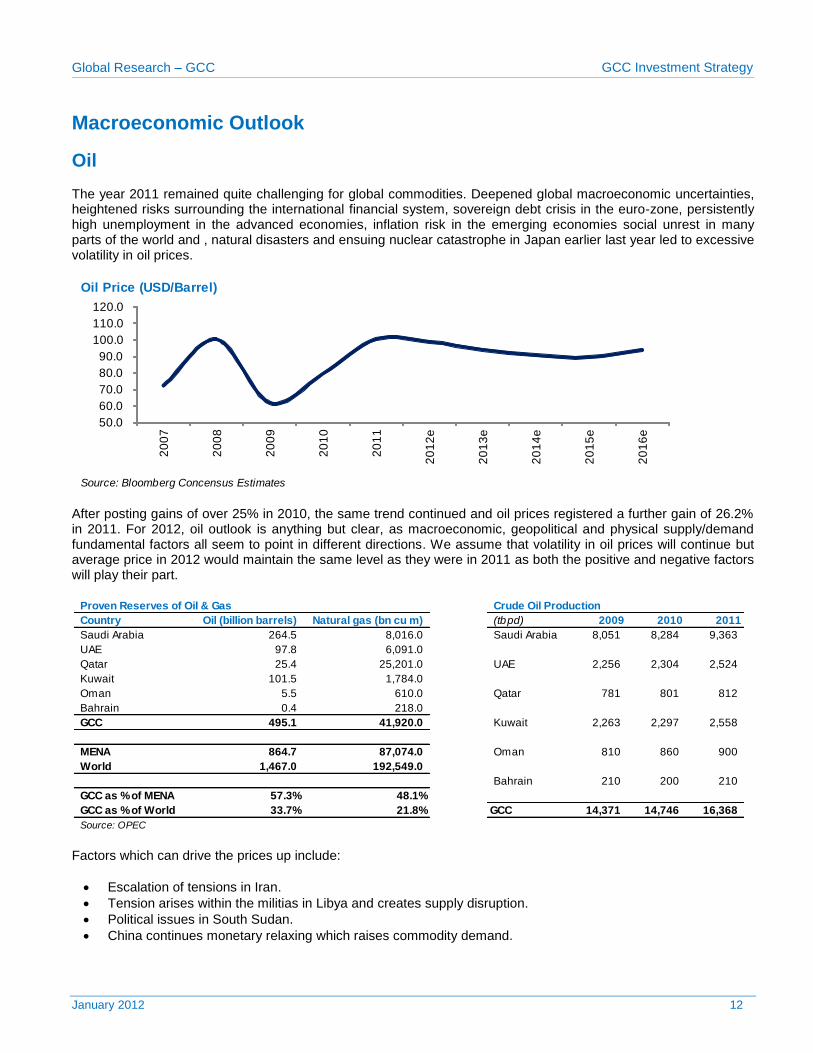
Oil The year 2011 remained quite challenging for global commodities. Deepened global macroeconomic uncertainties, heightened risks surrounding the international financial system, sovereign debt crisis in the euro-zone, persistently high unemployment in the advanced economies, inflation risk in the emerging economies social unrest in many parts of the world and , natural disasters and ensuing nuclear catastrophe in Japan earlier last year led to excessive volatility in oil prices.
After posting gains of over 25% in 2010, the same trend continued and oil prices registered a further gain of 26.2% in 2011. For 2012, oil outlook is anything but clear, as macroeconomic, geopolitical and physical supply/demand fundamental factors all seem to point in different directions. We assume that volatility in oil prices will continue but average price in 2012 would maintain the same level as they were in 2011 as both the positive and negative factors will play their part.
Factors which can drive the prices up include:
Escalation of tensions in Iran.
Tension arises within the militias in Libya and creates supply disruption.
Political issues in South Sudan.
China continues monetary relaxing which raises commodity demand.
Oil Price (USD/Barrel)
Source: Bloomberg Concensus Estimates
50.0
60.0
70.0
80.0
90.0
100.0
110.0
120.0
20
07
20
08
20
09
20
10
20
11
20
12
e
20
13
e
20
14
e
20
15
e
20
16
e
Proven Reserves of Oil & Gas Crude Oil Production
Country Oil (billion barrels) Natural gas (bn cu m) (tbpd) 2009 2010 2011
Saudi Arabia 264.5 8,016.0 Saudi Arabia 8,051 8,284 9,363
UAE 97.8 6,091.0
Qatar 25.4 25,201.0 UAE 2,256 2,304 2,524
Kuwait 101.5 1,784.0
Oman 5.5 610.0 Qatar 781 801 812
Bahrain 0.4 218.0
GCC 495.1 41,920.0 Kuwait 2,263 2,297 2,558
MENA 864.7 87,074.0 Oman 810 860 900
World 1,467.0 192,549.0
Bahrain 210 200 210
GCC as % of MENA 57.3% 48.1%
GCC as % of World 33.7% 21.8% GCC 14,371 14,746 16,368
Source: OPEC
Global Research – GCC GCC Investment Strategy
January 2012 13
Factors which may weigh upon oil prices are:
The likelihood of a European recession and the potential knock-on effects on the rest of the world could pressure crude oil prices.
Security situation eases in Iraq leading to increase in oil production.
Saudi Arabia increases its spare capacity to cover the shortcoming of other countries. Lately there was news that crude production by the Organization of Petroleum Exporting Countries rose to the highest level in three years in December 2011, led by surging Libyan output. Production increased 162,000bpd, or 0.5%, to an average 30.6mbpd from a revised 30.5mbpd. Daily output by the 11 members with quotas, all except Iraq, climbed 167,000 barrels to 27.9mn, 3.1mn barrels above their former target. Libyan output also rose by 100,000 barrels to 700,000 a day last month, the highest level since the uprising. Saudi Arabia, OPEC’s biggest producer, increased output by 50,000 barrels to 9.6mbpd.
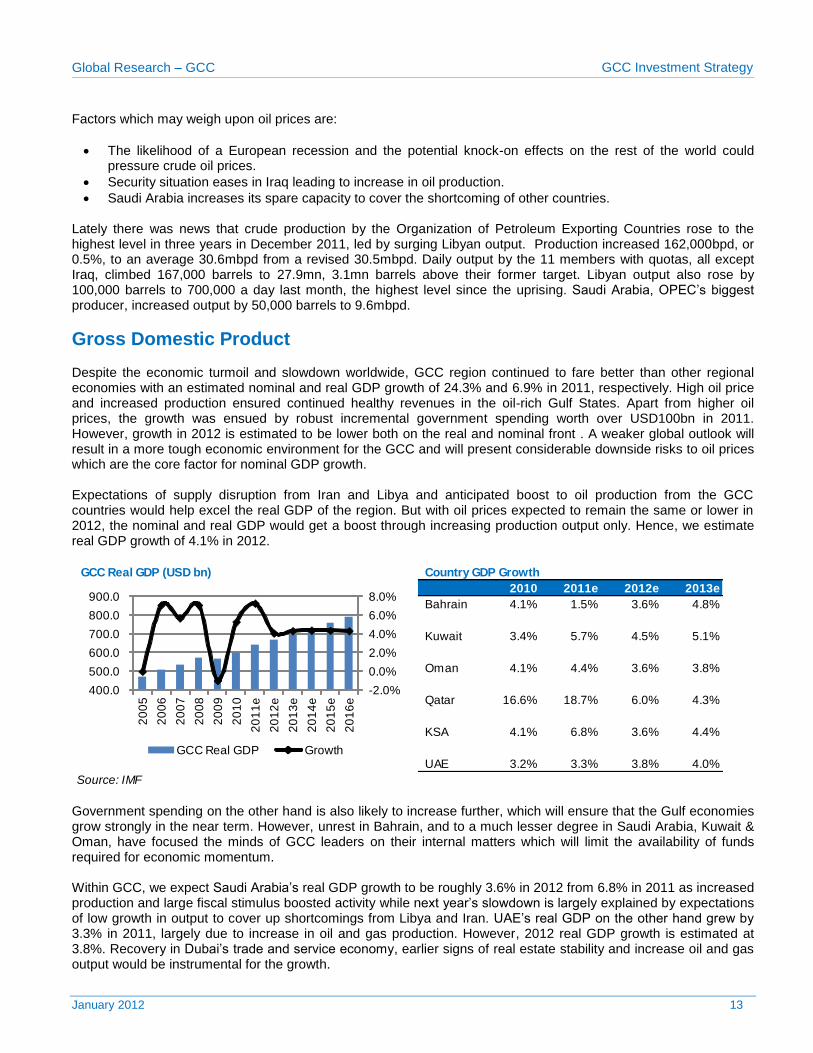
Gross Domestic Product Despite the economic turmoil and slowdown worldwide, GCC region continued to fare better than other regional economies with an estimated nominal and real GDP growth of 24.3% and 6.9% in 2011, respectively. High oil price and increased production ensured continued healthy revenues in the oil-rich Gulf States. Apart from higher oil prices, the growth was ensued by robust incremental government spending worth over USD100bn in 2011. However, growth in 2012 is estimated to be lower both on the real and nominal front . A weaker global outlook will result in a more tough economic environment for the GCC and will present considerable downside risks to oil prices which are the core factor for nominal GDP growth. Expectations of supply disruption from Iran and Libya and anticipated boost to oil production from the GCC countries would help excel the real GDP of the region. But with oil prices expected to remain the same or lower in 2012, the nominal and real GDP would get a boost through increasing production output only. Hence, we estimate real GDP growth of 4.1% in 2012.
Government spending on the other hand is also likely to increase further, which will ensure that the Gulf economies grow strongly in the near term. However, unrest in Bahrain, and to a much lesser degree in Saudi Arabia, Kuwait & Oman, have focused the minds of GCC leaders on their internal matters which will limit the availability of funds required for economic momentum. Within GCC, we expect Saudi Arabia’s real GDP growth to be roughly 3.6% in 2012 from 6.8% in 2011 as increased production and large fiscal stimulus boosted activity while next year’s slowdown is largely explained by expectations of low growth in output to cover up shortcomings from Libya and Iran. UAE’s real GDP on the other hand grew by 3.3% in 2011, largely due to increase in oil and gas production. However, 2012 real GDP growth is estimated at 3.8%. Recovery in Dubai’s trade and service economy, earlier signs of real estate stability and increase oil and gas output would be instrumental for the growth.
GCC Real GDP (USD bn) Country GDP Growth
2010 2011e 2012e 2013e
Bahrain 4.1% 1.5% 3.6% 4.8%
Kuwait 3.4% 5.7% 4.5% 5.1%
Oman 4.1% 4.4% 3.6% 3.8%
Qatar 16.6% 18.7% 6.0% 4.3%
KSA 4.1% 6.8% 3.6% 4.4%
UAE 3.2% 3.3% 3.8% 4.0%
Source: IMF
-2.0%
0.0%
2.0%
4.0%
6.0%
8.0%
400.0
500.0
600.0
700.0
800.0
900.0
20
05
20
06
20
07
20
08
20
09
20
10
20
11
e
20
12
e
20
13
e
20
14
e
20
15
e
20
16
e
GCC Real GDP Growth
Global Research – GCC GCC Investment Strategy
January 2012 14
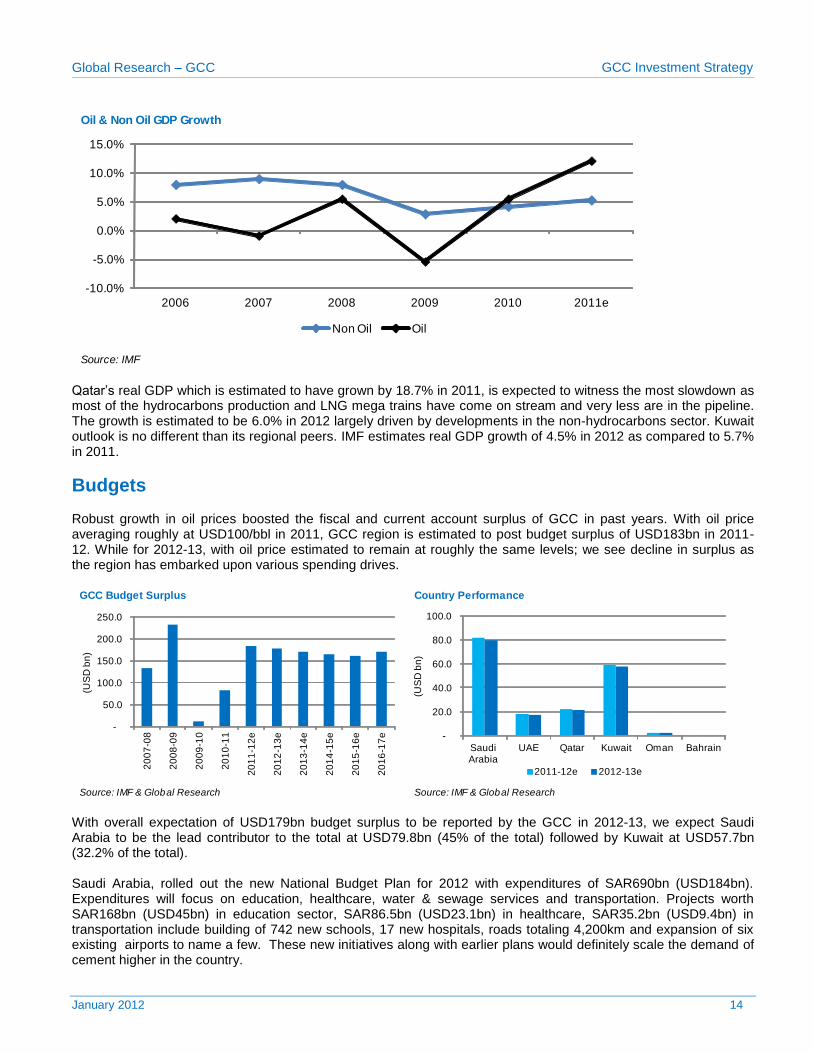
Qatar’s real GDP which is estimated to have grown by 18.7% in 2011, is expected to witness the most slowdown as most of the hydrocarbons production and LNG mega trains have come on stream and very less are in the pipeline. The growth is estimated to be 6.0% in 2012 largely driven by developments in the non-hydrocarbons sector. Kuwait outlook is no different than its regional peers. IMF estimates real GDP growth of 4.5% in 2012 as compared to 5.7% in 2011.
Budgets Robust growth in oil prices boosted the fiscal and current account surplus of GCC in past years. With oil price averaging roughly at USD100/bbl in 2011, GCC region is estimated to post budget surplus of USD183bn in 2011-12. While for 2012-13, with oil price estimated to remain at roughly the same levels; we see decline in surplus as the region has embarked upon various spending drives.
With overall expectation of USD179bn budget surplus to be reported by the GCC in 2012-13, we expect Saudi Arabia to be the lead contributor to the total at USD79.8bn (45% of the total) followed by Kuwait at USD57.7bn (32.2% of the total). Saudi Arabia, rolled out the new National Budget Plan for 2012 with expenditures of SAR690bn (USD184bn). Expenditures will focus on education, healthcare, water & sewage services and transportation. Projects worth SAR168bn (USD45bn) in education sector, SAR86.5bn (USD23.1bn) in healthcare, SAR35.2bn (USD9.4bn) in transportation include building of 742 new schools, 17 new hospitals, roads totaling 4,200km and expansion of six existing airports to name a few. These new initiatives along with earlier plans would definitely scale the demand of cement higher in the country.
Oil & Non Oil GDP Growth
Source: IMF
-10.0%
-5.0%
0.0%
5.0%
10.0%
15.0%
2006 2007 2008 2009 2010 2011e
Non Oil Oil
GCC Budget Surplus Country Performance
Source: IMF & Global Research Source: IMF & Global Research
-
50.0
100.0
150.0
200.0
250.0
20
07
-08
20
08
-09
20
09
-10
20
10
-11
20
11
-12
e
20
12
-13
e
20
13
-14
e
20
14
-15
e
20
15
-16
e
20
16
-17
e
(US
D b
n)
-
20.0
40.0
60.0
80.0
100.0
Saudi Arabia
UAE Qatar Kuwait Oman Bahrain
(US
D b
n)
2011-12e 2012-13e
Global Research – GCC GCC Investment Strategy
January 2012 15
Kuwait revenue is 68% lesser than that of Saudi Arabia but its surplus is 75% of the surplus of Saudi Arabia which is mostly because the Kuwaiti government has generally saved its oil revenues. Kuwait’s spending has mainly been on public sector salaries and subsidies rather than public investment. With the exception of Bahrain, the economic prospects for the other oil-rich Gulf States are strong in the next two to three years. In Qatar, government spending and investment was complemented by a relaxation of foreign ownership laws in the past year. However, double-digit growth rates are unlikely to be sustained but the country would continue to make handsome surplus on the back of its increased gas production levels.
Oman, which has already been affected by social unrest to some degree, will benefit from a 20% increase in government spending in the near term. The country is expected to make roughly USD3bn in surplus in 2011-12 and 5% lesser in 2012-13. In Bahrain, political conditions have improved since the uprising in first quarter of 2011. The country’s financial sector which accounts for 25% of GDP was hit hard and saw various banking and investment giants pulling their operations out of the country. We anticipate Bahrain’s nominal GDP to grow by 3.5% in 2012 and expect it to report a budget deficit as the country is expected to face tough competition from its more-stable neighbors for financial services and tourism business.
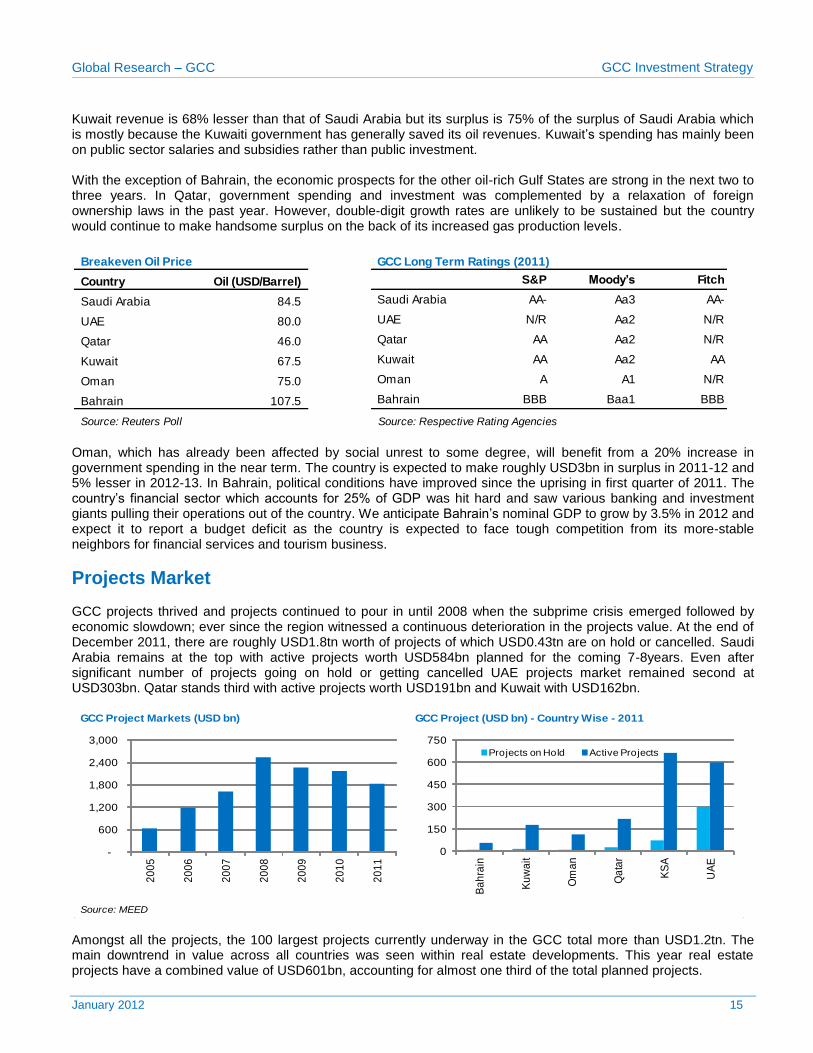
Projects Market GCC projects thrived and projects continued to pour in until 2008 when the subprime crisis emerged followed by economic slowdown; ever since the region witnessed a continuous deterioration in the projects value. At the end of December 2011, there are roughly USD1.8tn worth of projects of which USD0.43tn are on hold or cancelled. Saudi Arabia remains at the top with active projects worth USD584bn planned for the coming 7-8years. Even after significant number of projects going on hold or getting cancelled UAE projects market remained second at USD303bn. Qatar stands third with active projects worth USD191bn and Kuwait with USD162bn.
Amongst all the projects, the 100 largest projects currently underway in the GCC total more than USD1.2tn. The main downtrend in value across all countries was seen within real estate developments. This year real estate projects have a combined value of USD601bn, accounting for almost one third of the total planned projects.
Breakeven Oil Price
Country Oil (USD/Barrel) S&P Moody’s Fitch
Saudi Arabia 84.5 Saudi Arabia AA- Aa3 AA-
UAE 80.0 UAE N/R Aa2 N/R
Qatar 46.0 Qatar AA Aa2 N/R
Kuwait 67.5 Kuwait AA Aa2 AA
Oman 75.0 Oman A A1 N/R
Bahrain 107.5 Bahrain BBB Baa1 BBB
Source: Reuters Poll Source: Respective Rating Agencies
GCC Long Term Ratings (2011)
GCC Project Markets (USD bn) GCC Project (USD bn) - Country Wise - 2011
Source: MEED
-
600
1,200
1,800
2,400
3,000
20
05
20
06
20
07
20
08
20
09
20
10
20
11
0
150
300
450
600
750
Ba
hra
in
Ku
wa
it
Om
an
Qa
tar
KS
A
UA
E
Projects on Hold Active Projects
Global Research – GCC GCC Investment Strategy
January 2012 16
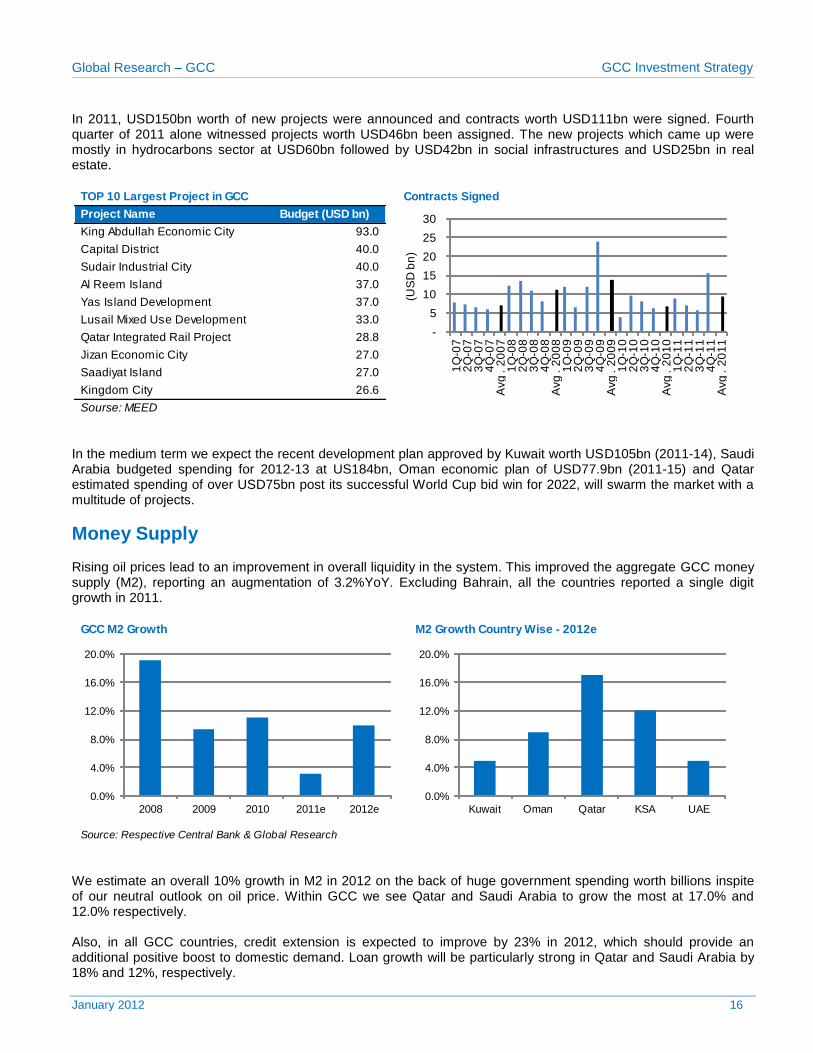
In 2011, USD150bn worth of new projects were announced and contracts worth USD111bn were signed. Fourth quarter of 2011 alone witnessed projects worth USD46bn been assigned. The new projects which came up were mostly in hydrocarbons sector at USD60bn followed by USD42bn in social infrastructures and USD25bn in real estate.
In the medium term we expect the recent development plan approved by Kuwait worth USD105bn (2011-14), Saudi Arabia budgeted spending for 2012-13 at US184bn, Oman economic plan of USD77.9bn (2011-15) and Qatar estimated spending of over USD75bn post its successful World Cup bid win for 2022, will swarm the market with a multitude of projects.
Money Supply Rising oil prices lead to an improvement in overall liquidity in the system. This improved the aggregate GCC money supply (M2), reporting an augmentation of 3.2%YoY. Excluding Bahrain, all the countries reported a single digit growth in 2011.
We estimate an overall 10% growth in M2 in 2012 on the back of huge government spending worth billions inspite of our neutral outlook on oil price. Within GCC we see Qatar and Saudi Arabia to grow the most at 17.0% and 12.0% respectively. Also, in all GCC countries, credit extension is expected to improve by 23% in 2012, which should provide an additional positive boost to domestic demand. Loan growth will be particularly strong in Qatar and Saudi Arabia by 18% and 12%, respectively.
TOP 10 Largest Project in GCC Contracts Signed
Project Name Budget (USD bn)
King Abdullah Economic City 93.0
Capital District 40.0
Sudair Industrial City 40.0
Al Reem Island 37.0
Yas Island Development 37.0
Lusail Mixed Use Development 33.0
Qatar Integrated Rail Project 28.8
Jizan Economic City 27.0
Saadiyat Island 27.0
Kingdom City 26.6
Sourse: MEED
-
5
10
15
20
25
30
1Q
-07
2Q
-07
3Q
-07
4Q
-07
Avg
. 2
00
71
Q-0
82
Q-0
83
Q-0
84
Q-0
8A
vg
. 2
00
81
Q-0
92
Q-0
93
Q-0
94
Q-0
9A
vg
. 2
00
91
Q-1
02
Q-1
03
Q-1
04
Q-1
0A
vg
. 2
01
01
Q-1
12
Q-1
13
Q-1
14
Q-1
1A
vg
. 2
01
1
(US
D b
n)
GCC M2 Growth M2 Growth Country Wise - 2012e
Source: Respective Central Bank & Global Research
0.0%
4.0%
8.0%
12.0%
16.0%
20.0%
2008 2009 2010 2011e 2012e0.0%
4.0%
8.0%
12.0%
16.0%
20.0%
Kuwait Oman Qatar KSA UAE
Global Research – GCC GCC Investment Strategy
January 2012 17
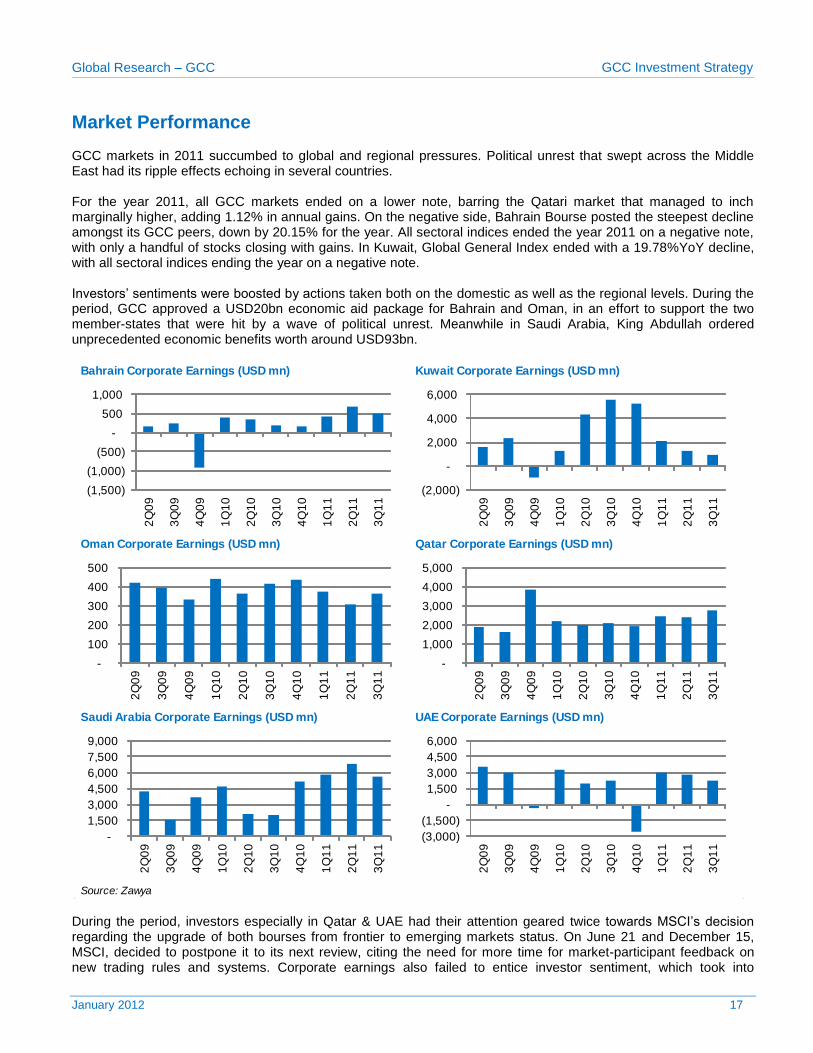
Market Performance GCC markets in 2011 succumbed to global and regional pressures. Political unrest that swept across the Middle East had its ripple effects echoing in several countries. For the year 2011, all GCC markets ended on a lower note, barring the Qatari market that managed to inch marginally higher, adding 1.12% in annual gains. On the negative side, Bahrain Bourse posted the steepest decline amongst its GCC peers, down by 20.15% for the year. All sectoral indices ended the year 2011 on a negative note, with only a handful of stocks closing with gains. In Kuwait, Global General Index ended with a 19.78%YoY decline, with all sectoral indices ending the year on a negative note. Investors’ sentiments were boosted by actions taken both on the domestic as well as the regional levels. During the period, GCC approved a USD20bn economic aid package for Bahrain and Oman, in an effort to support the two member-states that were hit by a wave of political unrest. Meanwhile in Saudi Arabia, King Abdullah ordered unprecedented economic benefits worth around USD93bn.
During the period, investors especially in Qatar & UAE had their attention geared twice towards MSCI’s decision regarding the upgrade of both bourses from frontier to emerging markets status. On June 21 and December 15, MSCI, decided to postpone it to its next review, citing the need for more time for market-participant feedback on new trading rules and systems. Corporate earnings also failed to entice investor sentiment, which took into
Bahrain Corporate Earnings (USD mn) Kuwait Corporate Earnings (USD mn)
Oman Corporate Earnings (USD mn) Qatar Corporate Earnings (USD mn)
Saudi Arabia Corporate Earnings (USD mn) UAE Corporate Earnings (USD mn)
Source: Zawya
(1,500)
(1,000)
(500)
-
500
1,000
2Q
09
3Q
09
4Q
09
1Q
10
2Q
10
3Q
10
4Q
10
1Q
11
2Q
11
3Q
11
(2,000)
-
2,000
4,000
6,000
2Q
09
3Q
09
4Q
09
1Q
10
2Q
10
3Q
10
4Q
10
1Q
11
2Q
11
3Q
11
-
100
200
300
400
500
2Q
09
3Q
09
4Q
09
1Q
10
2Q
10
3Q
10
4Q
10
1Q
11
2Q
11
3Q
11
-
1,000
2,000
3,000
4,000
5,000
2Q
09
3Q
09
4Q
09
1Q
10
2Q
10
3Q
10
4Q
10
1Q
11
2Q
11
3Q
11
-
1,500
3,000
4,500
6,000
7,500
9,000
2Q
09
3Q
09
4Q
09
1Q
10
2Q
10
3Q
10
4Q
10
1Q
11
2Q
11
3Q
11
(3,000)
(1,500)
-
1,500
3,000
4,500
6,000
2Q
09
3Q
09
4Q
09
1Q
10
2Q
10
3Q
10
4Q
10
1Q
11
2Q
11
3Q
11
Global Research – GCC GCC Investment Strategy
January 2012 18
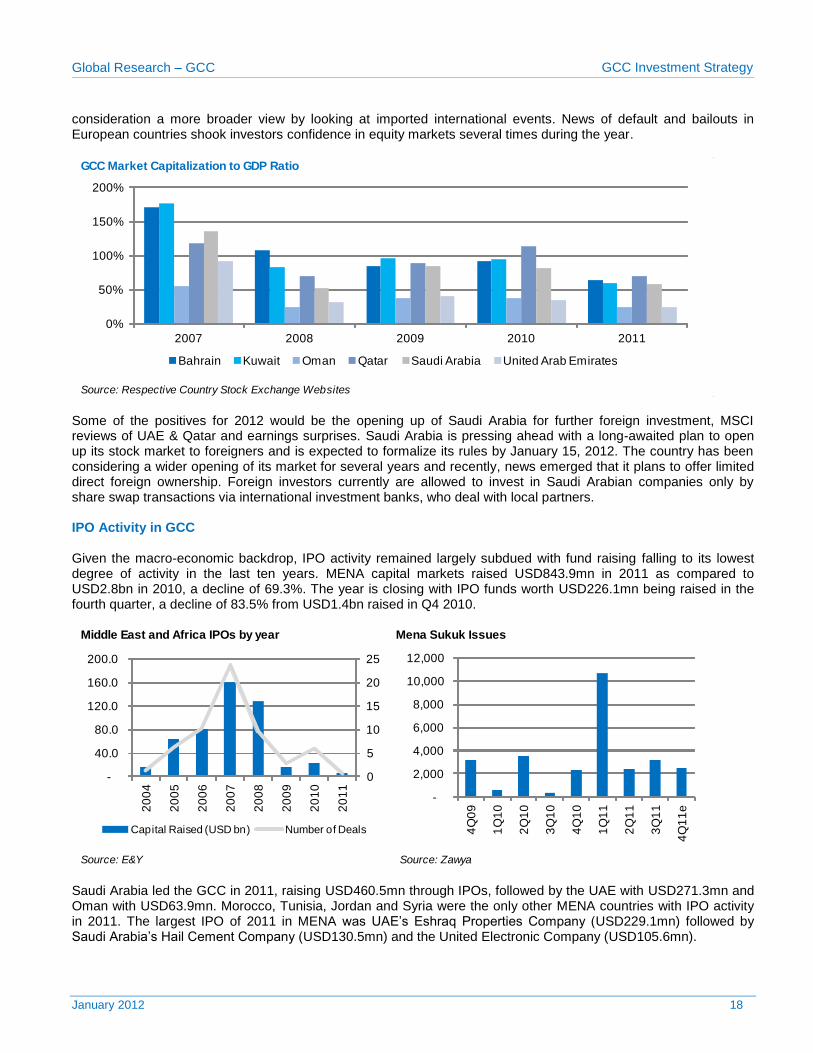
consideration a more broader view by looking at imported international events. News of default and bailouts in European countries shook investors confidence in equity markets several times during the year.
Some of the positives for 2012 would be the opening up of Saudi Arabia for further foreign investment, MSCI reviews of UAE & Qatar and earnings surprises. Saudi Arabia is pressing ahead with a long-awaited plan to open up its stock market to foreigners and is expected to formalize its rules by January 15, 2012. The country has been considering a wider opening of its market for several years and recently, news emerged that it plans to offer limited direct foreign ownership. Foreign investors currently are allowed to invest in Saudi Arabian companies only by share swap transactions via international investment banks, who deal with local partners. IPO Activity in GCC Given the macro-economic backdrop, IPO activity remained largely subdued with fund raising falling to its lowest degree of activity in the last ten years. MENA capital markets raised USD843.9mn in 2011 as compared to USD2.8bn in 2010, a decline of 69.3%. The year is closing with IPO funds worth USD226.1mn being raised in the fourth quarter, a decline of 83.5% from USD1.4bn raised in Q4 2010.
Saudi Arabia led the GCC in 2011, raising USD460.5mn through IPOs, followed by the UAE with USD271.3mn and Oman with USD63.9mn. Morocco, Tunisia, Jordan and Syria were the only other MENA countries with IPO activity in 2011. The largest IPO of 2011 in MENA was UAE’s Eshraq Properties Company (USD229.1mn) followed by Saudi Arabia’s Hail Cement Company (USD130.5mn) and the United Electronic Company (USD105.6mn).
GCC Market Capitalization to GDP Ratio
Source: Respective Country Stock Exchange Websites
0%
50%
100%
150%
200%
2007 2008 2009 2010 2011
Bahrain Kuwait Oman Qatar Saudi Arabia United Arab Emirates
Middle East and Africa IPOs by year Mena Sukuk Issues
Source: E&Y Source: Zawya
0
5
10
15
20
25
-
40.0
80.0
120.0
160.0
200.0
20
04
20
05
20
06
20
07
20
08
20
09
20
10
20
11
Capital Raised (USD bn) Number of Deals
-
2,000
4,000
6,000
8,000
10,000
12,000
4Q
09
1Q
10
2Q
10
3Q
10
4Q
10
1Q
11
2Q
11
3Q
11
4Q
11
e
Global Research – GCC GCC Investment Strategy
January 2012 19
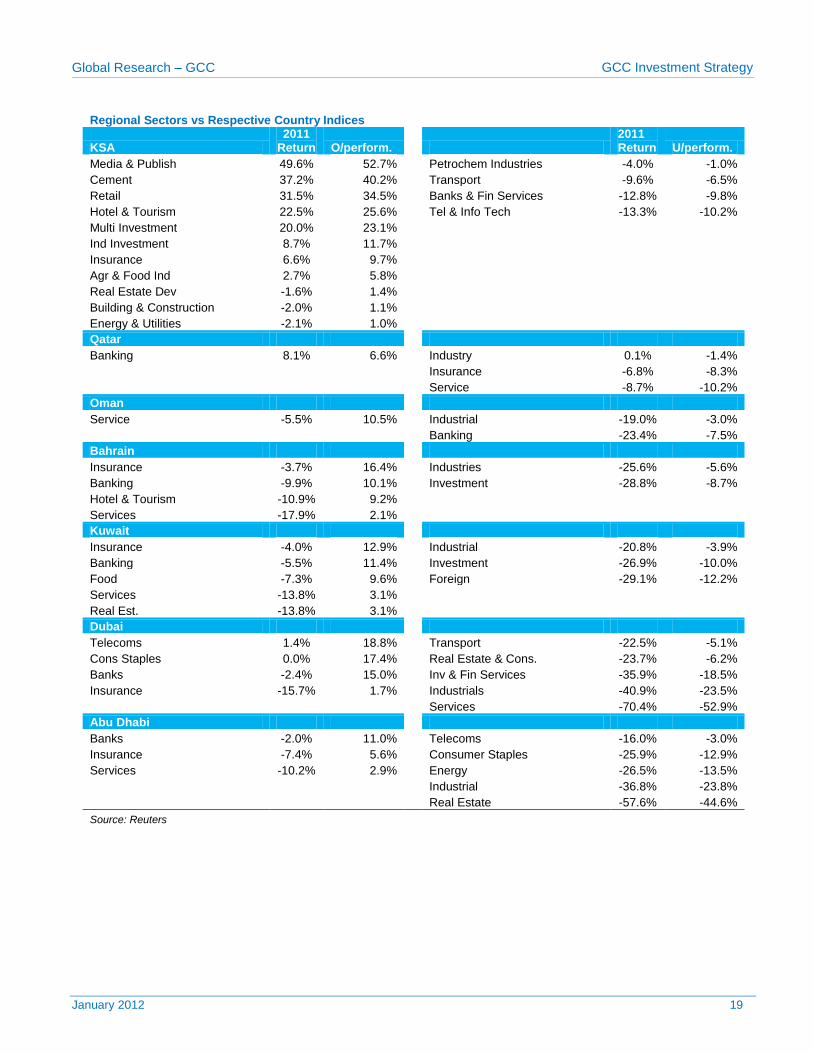
Regional Sectors vs Respective Country Indices
KSA 2011
Return O/perform.
2011 Return U/perform.
Media & Publish 49.6% 52.7% Petrochem Industries -4.0% -1.0%
Cement 37.2% 40.2% Transport -9.6% -6.5%
Retail 31.5% 34.5% Banks & Fin Services -12.8% -9.8%
Hotel & Tourism 22.5% 25.6% Tel & Info Tech -13.3% -10.2%
Multi Investment 20.0% 23.1%
Ind Investment 8.7% 11.7%
Insurance 6.6% 9.7%
Agr & Food Ind 2.7% 5.8%
Real Estate Dev -1.6% 1.4%
Building & Construction -2.0% 1.1%
Energy & Utilities -2.1% 1.0%
Qatar
Banking 8.1% 6.6% Industry 0.1% -1.4%
Insurance -6.8% -8.3%
Service -8.7% -10.2%
Oman
Service -5.5% 10.5% Industrial -19.0% -3.0%
Banking -23.4% -7.5%
Bahrain
Insurance -3.7% 16.4% Industries -25.6% -5.6%
Banking -9.9% 10.1% Investment -28.8% -8.7%
Hotel & Tourism -10.9% 9.2%
Services -17.9% 2.1%
Kuwait
Insurance -4.0% 12.9% Industrial -20.8% -3.9%
Banking -5.5% 11.4% Investment -26.9% -10.0%
Food -7.3% 9.6% Foreign -29.1% -12.2%
Services -13.8% 3.1%
Real Est. -13.8% 3.1%
Dubai
Telecoms 1.4% 18.8% Transport -22.5% -5.1%
Cons Staples 0.0% 17.4% Real Estate & Cons. -23.7% -6.2%
Banks -2.4% 15.0% Inv & Fin Services -35.9% -18.5%
Insurance -15.7% 1.7% Industrials -40.9% -23.5%
Services -70.4% -52.9%
Abu Dhabi
Banks -2.0% 11.0% Telecoms -16.0% -3.0%
Insurance -7.4% 5.6% Consumer Staples -25.9% -12.9%
Services -10.2% 2.9% Energy -26.5% -13.5%
Industrial -36.8% -23.8%
Real Estate -57.6% -44.6%
Source: Reuters
Global Research – GCC GCC Investment Strategy
January 2012 20
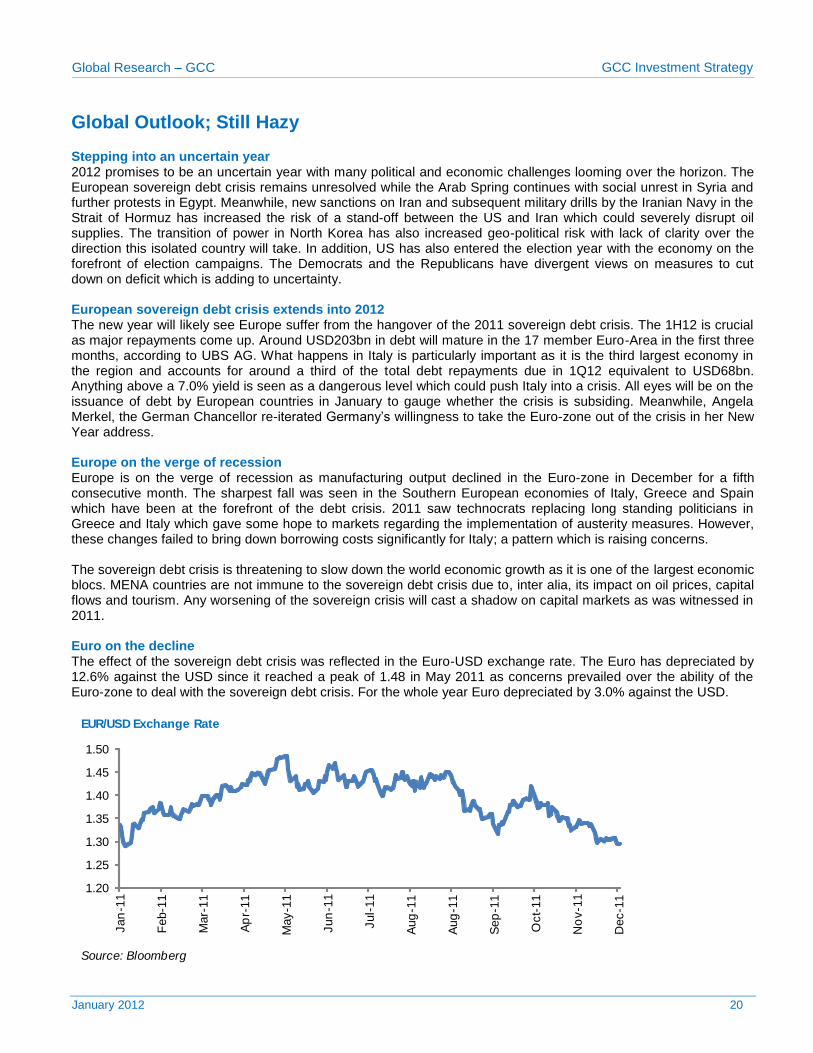
Global Outlook; Still Hazy Stepping into an uncertain year 2012 promises to be an uncertain year with many political and economic challenges looming over the horizon. The European sovereign debt crisis remains unresolved while the Arab Spring continues with social unrest in Syria and further protests in Egypt. Meanwhile, new sanctions on Iran and subsequent military drills by the Iranian Navy in the Strait of Hormuz has increased the risk of a stand-off between the US and Iran which could severely disrupt oil supplies. The transition of power in North Korea has also increased geo-political risk with lack of clarity over the direction this isolated country will take. In addition, US has also entered the election year with the economy on the forefront of election campaigns. The Democrats and the Republicans have divergent views on measures to cut down on deficit which is adding to uncertainty. European sovereign debt crisis extends into 2012 The new year will likely see Europe suffer from the hangover of the 2011 sovereign debt crisis. The 1H12 is crucial as major repayments come up. Around USD203bn in debt will mature in the 17 member Euro-Area in the first three months, according to UBS AG. What happens in Italy is particularly important as it is the third largest economy in the region and accounts for around a third of the total debt repayments due in 1Q12 equivalent to USD68bn. Anything above a 7.0% yield is seen as a dangerous level which could push Italy into a crisis. All eyes will be on the issuance of debt by European countries in January to gauge whether the crisis is subsiding. Meanwhile, Angela Merkel, the German Chancellor re-iterated Germany’s willingness to take the Euro-zone out of the crisis in her New Year address. Europe on the verge of recession Europe is on the verge of recession as manufacturing output declined in the Euro-zone in December for a fifth consecutive month. The sharpest fall was seen in the Southern European economies of Italy, Greece and Spain which have been at the forefront of the debt crisis. 2011 saw technocrats replacing long standing politicians in Greece and Italy which gave some hope to markets regarding the implementation of austerity measures. However, these changes failed to bring down borrowing costs significantly for Italy; a pattern which is raising concerns. The sovereign debt crisis is threatening to slow down the world economic growth as it is one of the largest economic blocs. MENA countries are not immune to the sovereign debt crisis due to, inter alia, its impact on oil prices, capital flows and tourism. Any worsening of the sovereign crisis will cast a shadow on capital markets as was witnessed in 2011. Euro on the decline The effect of the sovereign debt crisis was reflected in the Euro-USD exchange rate. The Euro has depreciated by 12.6% against the USD since it reached a peak of 1.48 in May 2011 as concerns prevailed over the ability of the Euro-zone to deal with the sovereign debt crisis. For the whole year Euro depreciated by 3.0% against the USD.
EUR/USD Exchange Rate
Source: Bloomberg
1.20
1.25
1.30
1.35
1.40
1.45
1.50
Jan
-11
Feb-1
1
Mar-
11
Ap
r-11
May-1
1
Jun
-11
Jul-
11
Aug
-11
Aug
-11
Sep
-11
Oct-
11
No
v-1
1
Dec-1
1
Global Research – GCC GCC Investment Strategy
January 2012 21
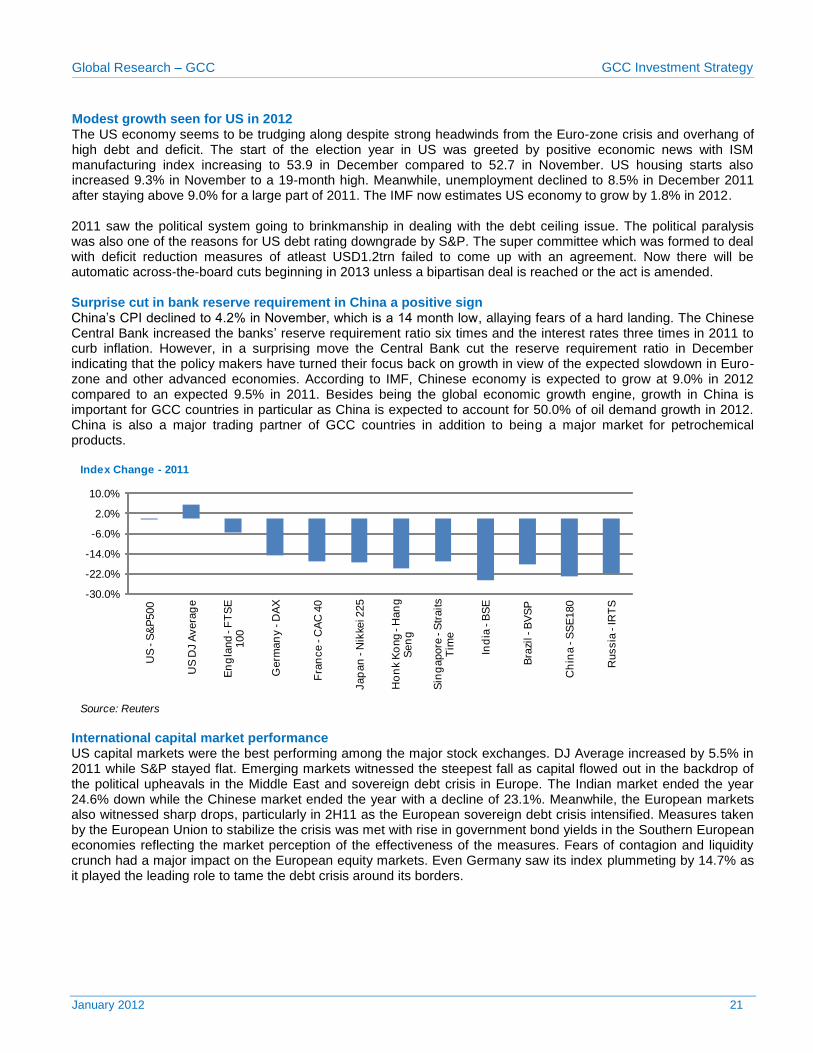
Modest growth seen for US in 2012 The US economy seems to be trudging along despite strong headwinds from the Euro-zone crisis and overhang of high debt and deficit. The start of the election year in US was greeted by positive economic news with ISM manufacturing index increasing to 53.9 in December compared to 52.7 in November. US housing starts also increased 9.3% in November to a 19-month high. Meanwhile, unemployment declined to 8.5% in December 2011 after staying above 9.0% for a large part of 2011. The IMF now estimates US economy to grow by 1.8% in 2012. 2011 saw the political system going to brinkmanship in dealing with the debt ceiling issue. The political paralysis was also one of the reasons for US debt rating downgrade by S&P. The super committee which was formed to deal with deficit reduction measures of atleast USD1.2trn failed to come up with an agreement. Now there will be automatic across-the-board cuts beginning in 2013 unless a bipartisan deal is reached or the act is amended. Surprise cut in bank reserve requirement in China a positive sign China’s CPI declined to 4.2% in November, which is a 14 month low, allaying fears of a hard landing. The Chinese Central Bank increased the banks’ reserve requirement ratio six times and the interest rates three times in 2011 to curb inflation. However, in a surprising move the Central Bank cut the reserve requirement ratio in December indicating that the policy makers have turned their focus back on growth in view of the expected slowdown in Euro-zone and other advanced economies. According to IMF, Chinese economy is expected to grow at 9.0% in 2012 compared to an expected 9.5% in 2011. Besides being the global economic growth engine, growth in China is important for GCC countries in particular as China is expected to account for 50.0% of oil demand growth in 2012. China is also a major trading partner of GCC countries in addition to being a major market for petrochemical products.
International capital market performance US capital markets were the best performing among the major stock exchanges. DJ Average increased by 5.5% in 2011 while S&P stayed flat. Emerging markets witnessed the steepest fall as capital flowed out in the backdrop of the political upheavals in the Middle East and sovereign debt crisis in Europe. The Indian market ended the year 24.6% down while the Chinese market ended the year with a decline of 23.1%. Meanwhile, the European markets also witnessed sharp drops, particularly in 2H11 as the European sovereign debt crisis intensified. Measures taken by the European Union to stabilize the crisis was met with rise in government bond yields in the Southern European economies reflecting the market perception of the effectiveness of the measures. Fears of contagion and liquidity crunch had a major impact on the European equity markets. Even Germany saw its index plummeting by 14.7% as it played the leading role to tame the debt crisis around its borders.
Index Change - 2011
Source: Reuters
-30.0%
-22.0%
-14.0%
-6.0%
2.0%
10.0%
US
-S
&P
500
US
DJ A
vera
ge
En
gla
nd -
FT
SE
100
Germ
an
y -
DA
X
Fra
nce -
CA
C 4
0
Jap
an
-N
ikke
i 225
Ho
nk K
ong -
Han
g
Sen
g
Sin
gapore
-S
traits
Tim
e
Ind
ia -
BS
E
Bra
zil -
BV
SP
Ch
ina -
SS
E180
Russia
-IR
TS
Global Research – GCC GCC Investment Strategy
January 2012 22
SECTOR OUTLOOK
Global Research – GCC GCC Investment Strategy
January 2012 23
Banking Sector
Investment Thesis
Key Risk to Valuation
2012 should see acceleration in top-line growth for GCC banks, healthy profit growth
KSA upgraded to POSITIVE on cheap valuations, low risk
Qatari story is still ripe, buy on dips
Qatar and KSA spending spree augers well for their banking sectors
We retain our neutral stance on Kuwait, UAE offers good opportunities but at considerable risk
Slow down in world economies, negatively impacting GCC economies and spending programs
Unaccounted for corporate defaults, inability of GREs to service debt specifically in UAE
Exposure to construction & real estate and contraction in government spending
Unexpected changes in the direction or magnitude of interest rates
Market sentiment goes for a toss
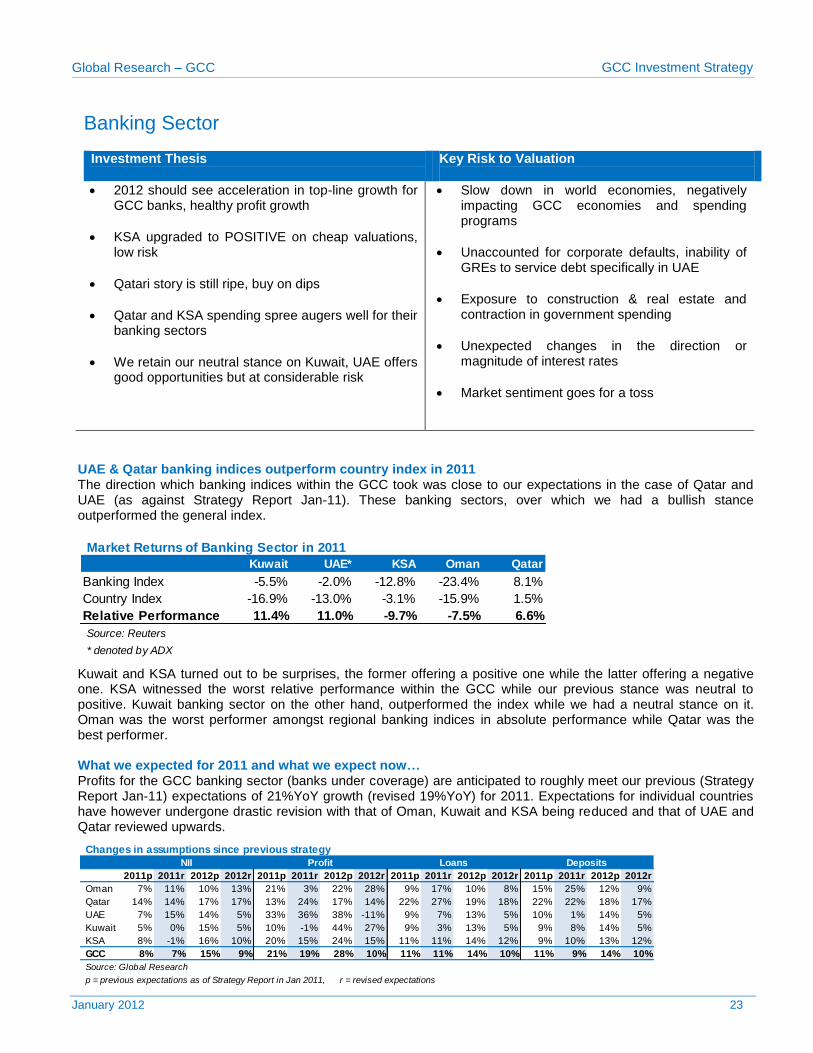
UAE & Qatar banking indices outperform country index in 2011 The direction which banking indices within the GCC took was close to our expectations in the case of Qatar and UAE (as against Strategy Report Jan-11). These banking sectors, over which we had a bullish stance outperformed the general index.
Kuwait and KSA turned out to be surprises, the former offering a positive one while the latter offering a negative one. KSA witnessed the worst relative performance within the GCC while our previous stance was neutral to positive. Kuwait banking sector on the other hand, outperformed the index while we had a neutral stance on it. Oman was the worst performer amongst regional banking indices in absolute performance while Qatar was the best performer. What we expected for 2011 and what we expect now… Profits for the GCC banking sector (banks under coverage) are anticipated to roughly meet our previous (Strategy Report Jan-11) expectations of 21%YoY growth (revised 19%YoY) for 2011. Expectations for individual countries have however undergone drastic revision with that of Oman, Kuwait and KSA being reduced and that of UAE and Qatar reviewed upwards.
Kuwait UAE* KSA Oman Qatar
Banking Index -5.5% -2.0% -12.8% -23.4% 8.1%
Country Index -16.9% -13.0% -3.1% -15.9% 1.5%
Relative Performance 11.4% 11.0% -9.7% -7.5% 6.6%
Source: Reuters
* denoted by ADX
Market Returns of Banking Sector in 2011
2011p 2011r 2012p 2012r 2011p 2011r 2012p 2012r 2011p 2011r 2012p 2012r 2011p 2011r 2012p 2012r
Oman 7% 11% 10% 13% 21% 3% 22% 28% 9% 17% 10% 8% 15% 25% 12% 9%
Qatar 14% 14% 17% 17% 13% 24% 17% 14% 22% 27% 19% 18% 22% 22% 18% 17%
UAE 7% 15% 14% 5% 33% 36% 38% -11% 9% 7% 13% 5% 10% 1% 14% 5%
Kuwait 5% 0% 15% 5% 10% -1% 44% 27% 9% 3% 13% 5% 9% 8% 14% 5%
KSA 8% -1% 16% 10% 20% 15% 24% 15% 11% 11% 14% 12% 9% 10% 13% 12%
GCC 8% 7% 15% 9% 21% 19% 28% 10% 11% 11% 14% 10% 11% 9% 14% 10%
p = previous expectations as of Strategy Report in Jan 2011, r = revised expectations
Changes in assumptions since previous strategy
Source: Global Research
DepositsNII Profit Loans
Global Research – GCC GCC Investment Strategy
January 2012 24
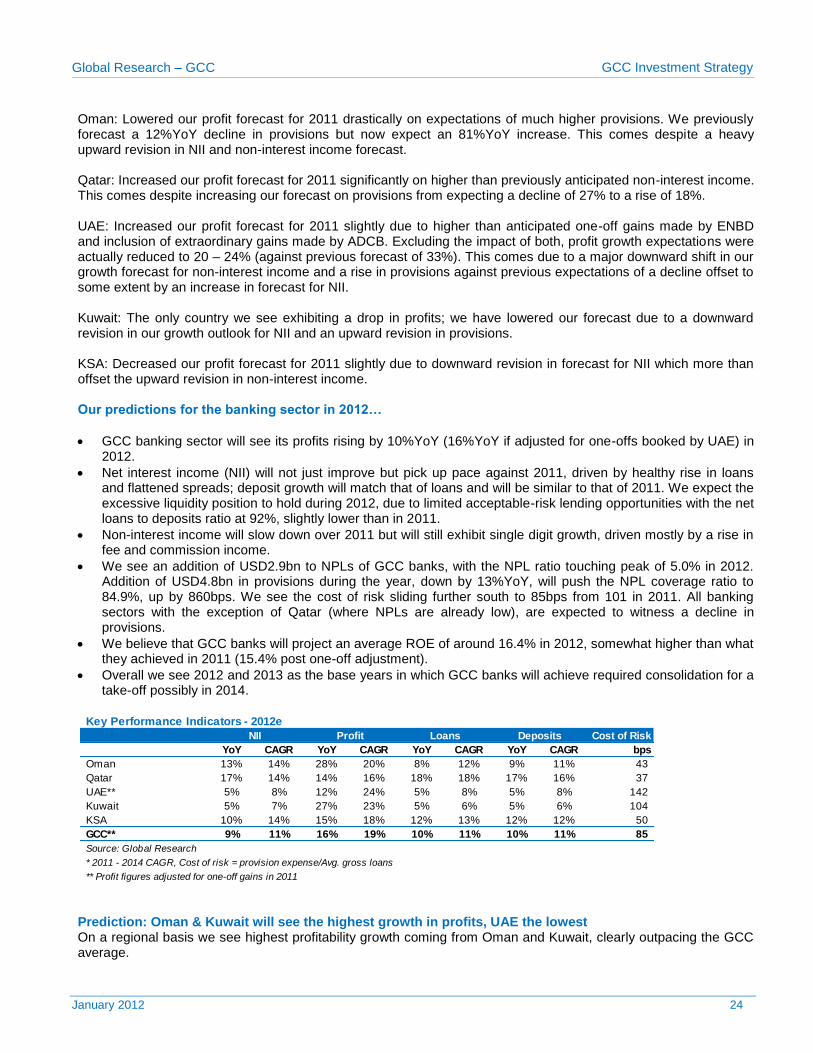
Oman: Lowered our profit forecast for 2011 drastically on expectations of much higher provisions. We previously forecast a 12%YoY decline in provisions but now expect an 81%YoY increase. This comes despite a heavy upward revision in NII and non-interest income forecast. Qatar: Increased our profit forecast for 2011 significantly on higher than previously anticipated non-interest income. This comes despite increasing our forecast on provisions from expecting a decline of 27% to a rise of 18%. UAE: Increased our profit forecast for 2011 slightly due to higher than anticipated one-off gains made by ENBD and inclusion of extraordinary gains made by ADCB. Excluding the impact of both, profit growth expectations were actually reduced to 20 – 24% (against previous forecast of 33%). This comes due to a major downward shift in our growth forecast for non-interest income and a rise in provisions against previous expectations of a decline offset to some extent by an increase in forecast for NII. Kuwait: The only country we see exhibiting a drop in profits; we have lowered our forecast due to a downward revision in our growth outlook for NII and an upward revision in provisions. KSA: Decreased our profit forecast for 2011 slightly due to downward revision in forecast for NII which more than offset the upward revision in non-interest income. Our predictions for the banking sector in 2012…
GCC banking sector will see its profits rising by 10%YoY (16%YoY if adjusted for one-offs booked by UAE) in 2012.
Net interest income (NII) will not just improve but pick up pace against 2011, driven by healthy rise in loans and flattened spreads; deposit growth will match that of loans and will be similar to that of 2011. We expect the excessive liquidity position to hold during 2012, due to limited acceptable-risk lending opportunities with the net loans to deposits ratio at 92%, slightly lower than in 2011.
Non-interest income will slow down over 2011 but will still exhibit single digit growth, driven mostly by a rise in fee and commission income.
We see an addition of USD2.9bn to NPLs of GCC banks, with the NPL ratio touching peak of 5.0% in 2012. Addition of USD4.8bn in provisions during the year, down by 13%YoY, will push the NPL coverage ratio to 84.9%, up by 860bps. We see the cost of risk sliding further south to 85bps from 101 in 2011. All banking sectors with the exception of Qatar (where NPLs are already low), are expected to witness a decline in provisions.
We believe that GCC banks will project an average ROE of around 16.4% in 2012, somewhat higher than what they achieved in 2011 (15.4% post one-off adjustment).
Overall we see 2012 and 2013 as the base years in which GCC banks will achieve required consolidation for a take-off possibly in 2014.
Prediction: Oman & Kuwait will see the highest growth in profits, UAE the lowest On a regional basis we see highest profitability growth coming from Oman and Kuwait, clearly outpacing the GCC average.
Cost of Risk
YoY CAGR YoY CAGR YoY CAGR YoY CAGR bps
Oman 13% 14% 28% 20% 8% 12% 9% 11% 43
Qatar 17% 14% 14% 16% 18% 18% 17% 16% 37
UAE** 5% 8% 12% 24% 5% 8% 5% 8% 142
Kuwait 5% 7% 27% 23% 5% 6% 5% 6% 104
KSA 10% 14% 15% 18% 12% 13% 12% 12% 50
GCC** 9% 11% 16% 19% 10% 11% 10% 11% 85
* 2011 - 2014 CAGR, Cost of risk = provision expense/Avg. gross loans
Key Performance Indicators - 2012e
NII Profit Loans Deposits
Source: Global Research
** Profit figures adjusted for one-off gains in 2011
Global Research – GCC GCC Investment Strategy
January 2012 25
Oman’s banking profits are expected to jump 28%YoY in 2012:
We see an acceleration in the top-line, up 13%YoY driven by an 8%YoY rise in loans and 35bps rise in spreads. We believe that benchmark interest rates in Oman will rise slightly, leading to improvement in the yields on assets. The effect of such on the cost of funds will, in the worst case be muted due to continuation of excessive liquidity in the system, giving the bank continued room to replace high-cost deposits with low cost ones.
A 37%YoY drop in provisions will be a important contributor to bottom-line growth during 2012, however overshadowed by improvement in operating performance.
We believe that new NPL formation will decelerate considerably, almost to a halt and NPL ratio which peaked in 2010, to shed off another 26bps during the year. Oman is projected to bear a cost of risk of 43bps, which will add considerably to the NPL coverage.
We believe that Omani banks will post a collective average ROE of 15.5%
Kuwait’s profits are forecast to outperform most regional peers with a growth of 27%YoY:
Unlike Oman, profit growth will not be led by operating performance. Top-line will grow by 5%YoY on stable spreads and dismal volumes. Loans growth will remain sluggish on limited lending opportunities and absence of any economic catalyst. Banks will mobilize just enough deposits to meet loan disbursement and keep their liquidity position largely intact.
We do not see any major shift in benchmark interest rates during the year, first on account of absence of any trigger from the US and secondly due to absence of fear for rising inflation. We also do not see benchmark rates dropping any further, on grounds that they seem to have touched bottom; they are currently the lowest in at least t he past 6 years. Given the outlook for interest rates and ruling out any major shift in asset or liability make-up, we see no reason why spreads should change.
Kuwait’s bottom-line growth is expected to be generated largely by a 34%YoY drop in provisions. NPL formation is expected to be slow with the country’s banking sector believed to touch peak in 2011. However, with one of the lowest asset quality in GCC and a low coverage, we believe that overall provisions will be high despite the YoY drop; with the cost of risk at 104bps, an addition of 11.9% to the coverage ratio is expected for 2012.
We see Kuwaiti banks posting a collective average ROE of 12.5%, one of the lowest in the region. Similar to 2011, KSA is projected to post a profit growth of 15%YoY:
KSA’s bottom-line is expected to be driven by improving operating performance with the top-line contributing the most with a 10%YoY surge. Net interest income is forecast to be driven by volumes (loans growth predicted to rise by 12%YoY) while spreads are seen to erode by 8bps due to shrinkage in interest earning yield and a rise in cost of funds.
Post a massive decline in 2011, provisions are seen to slide by a further 5%YoY, impacting the bottom-line marginally. NPL formation should slow down considerably, rising by just 8%YoY, though NPL ratio will decline by 11bps from 2011 and NPL coverage will see an addition of 7%, reaching 126%.
We see KSA banks posting a collective average ROE of 18.6%, one of the highest in the region and an improvement over the previous year.
Qatar is projected to record a 14%YoY rise in earnings:
Qatar’s NII is forecast to exhibit the strongest growth (17%YoY) within the GCC banking sector, propelling the bottom-line forward. The growth in the top-line will come from an 18%YoY rise in loans, widely outpacing other GCC countries. However, spreads will shrink by around 20bps, coming under pressure as banks mobilize deposits aggressively to cater to loan demand. Resultantly, we believe that cost of funds will outpace yield on assets leading to an erosion in spreads.
Qatar’s non-interest income is also anticipated to add to banking income, driven by a massive 28%YoY rise in fee & commission income.
Unlike other countries in the GCC, Qatar’s provision expense will rise; amounting to 13%YoY as per our projections. NPLs will rise by a massive 24%YoY, however NPL ratio will inch up by just 8bps, still remaining one of the lowest within the region.
We see Qatari banks recording collective average ROE of 20.0%, one of the highest in the region thought lower than the previous year.
Global Research – GCC GCC Investment Strategy
January 2012 26
UAE’s adjusted profits to pick up pace in 2012, to grow by 12%YoY:
UAE’s banking profits will decline by 11%YoY on un-adjusted basis due to one-off gains made by ENBD and ADCB in 2011 but jump by 12%YoY on adjusted basis.
Top-line growth will be sluggish, growing by 5%YoY mimicking loans growth expectations of 5%YoY while spreads remain relatively unchanged from levels seen in the previous year.
Non-interest income is not expected to fare any better with fee and commission income which is the main contributor, increasing by just 2%YoY due to the new retail regulations from the CBUAE.
Decline in provisions, will therefore be the next largest contributor to income after NII; we see provision expense decline by just 7%YoY. We believe that NPLs ratio will touch peak (addition of 66bps to reach 8.8%) during the year, with NPLs rising by 14%YoY (addition of AED7.7bn); a considerable slow-down from the previous years. The rise in NPLs will be fueled largely by recognition of exposure to Dubai Group, amalgamation of Dubai Bank into ENBD and possibly Al Jaber Group.
Challenges and Opportunities Qatar: Positive; the story of an amazing-growth-story is still ripe We continue to stand by our bullish stance on Qatar where the amazing-growth-story story still has not become stale. Albeit slightly expensive on relative valuation, Qatar’s burgeoning economy will trickle down quite favorably to its banking sector. Qatari banks are still expected to exhibit one of the strongest loans disbursement in the GCC especially as the major spending on FIFA World Cup inches closer. The pitch of heavy infrastructure spending driving banking volumes and profits, therefore still holds true and that comes on the back of a very dedicated government. The Qatari banking sector is expected to draw attention once again by posting the strongest top-line growth amongst GCC banks, as per our forecast and above average profit growth figures. Despite witnessing a rise in NPLs and consequently provisions in 2012, the Qatari banking sector should remain impervious. Valuations at current levels look rich, though a buying opportunity if created on dips, should be exploited. KSA: Upgraded to Positive; strong growth potential, cheap valuation multiples & low risk We have upgraded our previous stance of ‘neutral to positive’ to ‘positive’ on KSA on a plethora of reasons including improved lending opportunities and greater visibility on mega-infrastructure development projects. This is expected to resuscitate the flat-lining top-line and hold the basis of fresh investor interest into the sector. KSA banking is not anticipated to suffer from any new asset quality issues, with the repercussions of Saad & Algosaibi completely dealt with in the previous years and in fact portraying a 42% decline in provisions in 2011. Despite good news coming in, the KSA banking index dropped 13% during 2011, making banking stocks look extremely enticing; KSA’s banking sector which was once expensive, is currently one of the cheapest amongst its GCC counterparts, second only to UAE in terms of relative valuation yet offers a low-risk proposition.
P/BV vs ROAE P/E vs g (3-yr Earnings CAGR)
Source: Bloomberg & Global Research
KSA
Oman
UAE Kuwait
Qatar
GCC
10.0%
12.0%
14.0%
16.0%
18.0%
20.0%
22.0%
24.0%
0.5 1.0 1.5 2.0 2.5
20
12
e R
OA
E
2012e P/BV
KSA
Oman
UAEKuwait
Qatar
GCC
10%
12%
14%
16%
18%
20%
22%
24%
5.0 7.5 10.0 12.5 15.0
3-y
r C
AG
R
2012e P/E
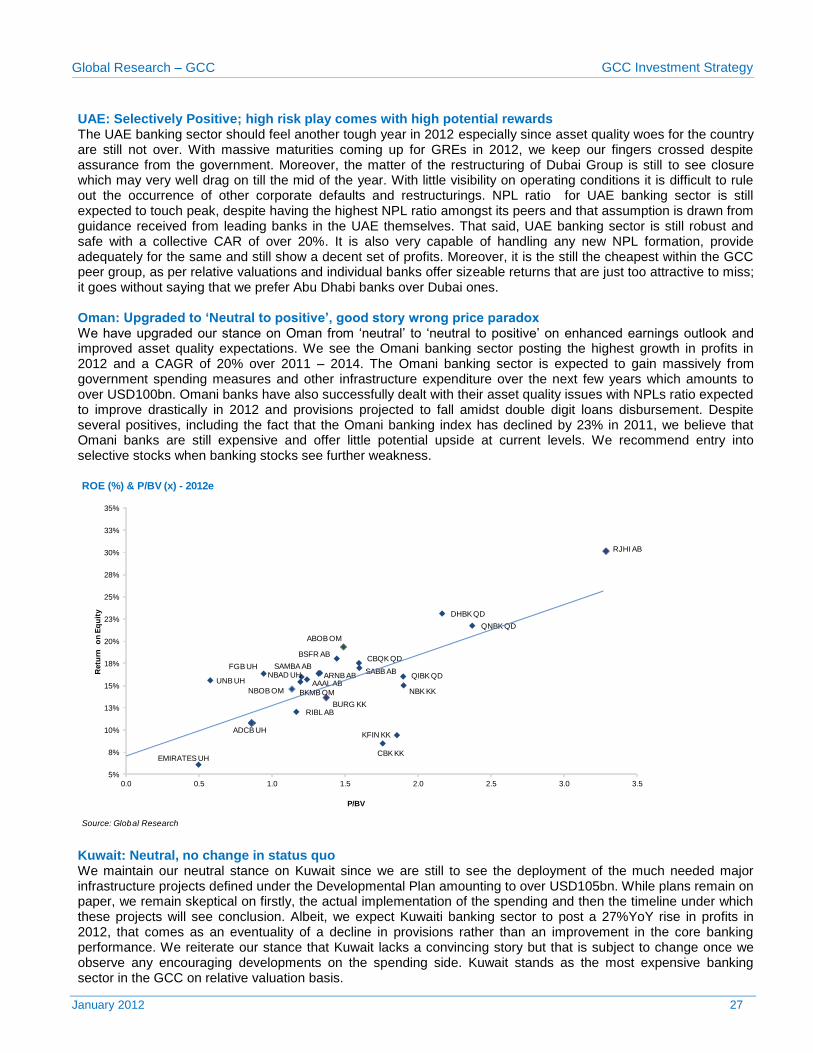
Global Research – GCC GCC Investment Strategy
January 2012 27
UAE: Selectively Positive; high risk play comes with high potential rewards The UAE banking sector should feel another tough year in 2012 especially since asset quality woes for the country are still not over. With massive maturities coming up for GREs in 2012, we keep our fingers crossed despite assurance from the government. Moreover, the matter of the restructuring of Dubai Group is still to see closure which may very well drag on till the mid of the year. With little visibility on operating conditions it is difficult to rule out the occurrence of other corporate defaults and restructurings. NPL ratio for UAE banking sector is still expected to touch peak, despite having the highest NPL ratio amongst its peers and that assumption is drawn from guidance received from leading banks in the UAE themselves. That said, UAE banking sector is still robust and safe with a collective CAR of over 20%. It is also very capable of handling any new NPL formation, provide adequately for the same and still show a decent set of profits. Moreover, it is the still the cheapest within the GCC peer group, as per relative valuations and individual banks offer sizeable returns that are just too attractive to miss; it goes without saying that we prefer Abu Dhabi banks over Dubai ones. Oman: Upgraded to ‘Neutral to positive’, good story wrong price paradox We have upgraded our stance on Oman from ‘neutral’ to ‘neutral to positive’ on enhanced earnings outlook and improved asset quality expectations. We see the Omani banking sector posting the highest growth in profits in 2012 and a CAGR of 20% over 2011 – 2014. The Omani banking sector is expected to gain massively from government spending measures and other infrastructure expenditure over the next few years which amounts to over USD100bn. Omani banks have also successfully dealt with their asset quality issues with NPLs ratio expected to improve drastically in 2012 and provisions projected to fall amidst double digit loans disbursement. Despite several positives, including the fact that the Omani banking index has declined by 23% in 2011, we believe that Omani banks are still expensive and offer little potential upside at current levels. We recommend entry into selective stocks when banking stocks see further weakness.
Kuwait: Neutral, no change in status quo We maintain our neutral stance on Kuwait since we are still to see the deployment of the much needed major infrastructure projects defined under the Developmental Plan amounting to over USD105bn. While plans remain on paper, we remain skeptical on firstly, the actual implementation of the spending and then the timeline under which these projects will see conclusion. Albeit, we expect Kuwaiti banking sector to post a 27%YoY rise in profits in 2012, that comes as an eventuality of a decline in provisions rather than an improvement in the core banking performance. We reiterate our stance that Kuwait lacks a convincing story but that is subject to change once we observe any encouraging developments on the spending side. Kuwait stands as the most expensive banking sector in the GCC on relative valuation basis.
ROE (%) & P/BV (x) - 2012e
Source: Global Research
ADCB UH
ABOB OM
RJHI AB
ARNB AB
BKMB OM
BSFR AB
BURG KK
CBK KK
DHBK QD
EMIRATES UH
FGB UH
KFIN KK
NBAD UH
NBK KKNBOB OM
QIBK QD
QNBK QD
RIBL AB
SAMBA AB
AAAL AB
CBQK QD
SABB AB
UNB UH
5%
8%
10%
13%
15%
18%
20%
23%
25%
28%
30%
33%
35%
0.0 0.5 1.0 1.5 2.0 2.5 3.0 3.5
Retu
rn
on
Eq
uit
y
P/BV
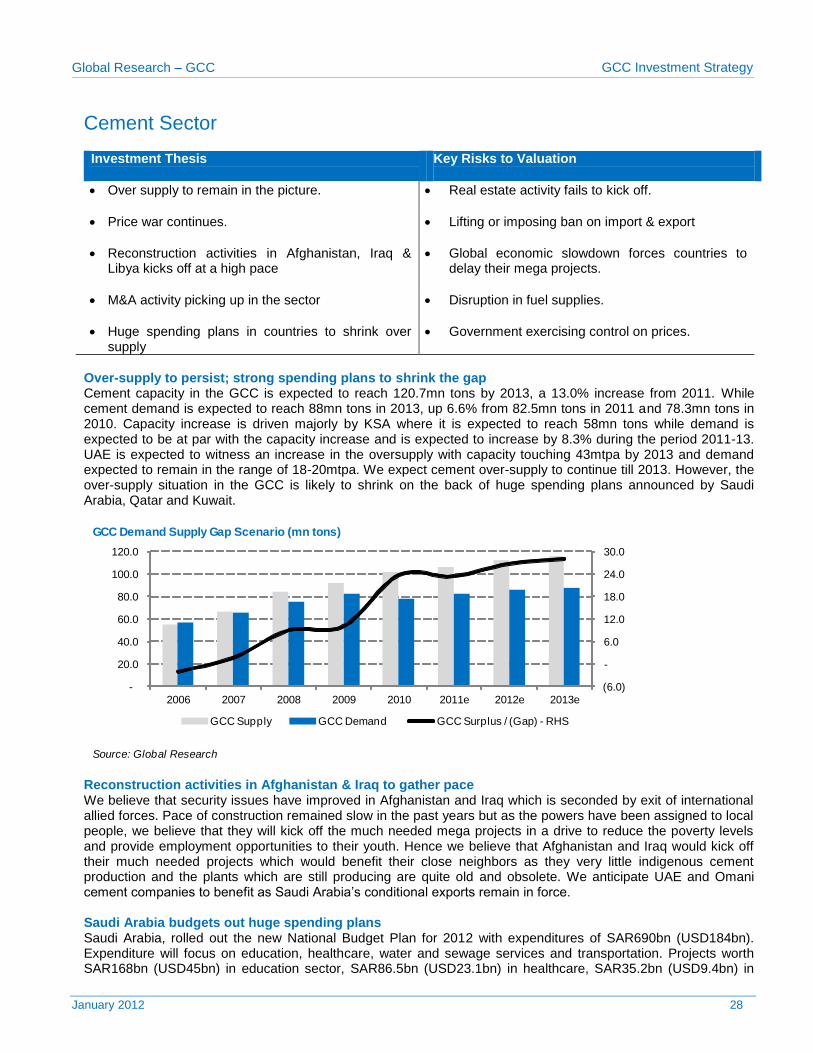
Global Research – GCC GCC Investment Strategy
January 2012 28
Cement Sector
Investment Thesis
Key Risks to Valuation
Over supply to remain in the picture.
Real estate activity fails to kick off.
Price war continues.
Lifting or imposing ban on import & export
Reconstruction activities in Afghanistan, Iraq & Libya kicks off at a high pace
Global economic slowdown forces countries to delay their mega projects.
M&A activity picking up in the sector
Disruption in fuel supplies.
Huge spending plans in countries to shrink over supply
Government exercising control on prices.
Over-supply to persist; strong spending plans to shrink the gap Cement capacity in the GCC is expected to reach 120.7mn tons by 2013, a 13.0% increase from 2011. While cement demand is expected to reach 88mn tons in 2013, up 6.6% from 82.5mn tons in 2011 and 78.3mn tons in 2010. Capacity increase is driven majorly by KSA where it is expected to reach 58mn tons while demand is expected to be at par with the capacity increase and is expected to increase by 8.3% during the period 2011-13. UAE is expected to witness an increase in the oversupply with capacity touching 43mtpa by 2013 and demand expected to remain in the range of 18-20mtpa. We expect cement over-supply to continue till 2013. However, the over-supply situation in the GCC is likely to shrink on the back of huge spending plans announced by Saudi Arabia, Qatar and Kuwait.
Reconstruction activities in Afghanistan & Iraq to gather pace We believe that security issues have improved in Afghanistan and Iraq which is seconded by exit of international allied forces. Pace of construction remained slow in the past years but as the powers have been assigned to local people, we believe that they will kick off the much needed mega projects in a drive to reduce the poverty levels and provide employment opportunities to their youth. Hence we believe that Afghanistan and Iraq would kick off their much needed projects which would benefit their close neighbors as they very little indigenous cement production and the plants which are still producing are quite old and obsolete. We anticipate UAE and Omani cement companies to benefit as Saudi Arabia’s conditional exports remain in force. Saudi Arabia budgets out huge spending plans Saudi Arabia, rolled out the new National Budget Plan for 2012 with expenditures of SAR690bn (USD184bn). Expenditure will focus on education, healthcare, water and sewage services and transportation. Projects worth SAR168bn (USD45bn) in education sector, SAR86.5bn (USD23.1bn) in healthcare, SAR35.2bn (USD9.4bn) in
GCC Demand Supply Gap Scenario (mn tons)
Source: Global Research
(6.0)
-
6.0
12.0
18.0
24.0
30.0
-
20.0
40.0
60.0
80.0
100.0
120.0
2006 2007 2008 2009 2010 2011e 2012e 2013e
GCC Supply GCC Demand GCC Surplus / (Gap) - RHS
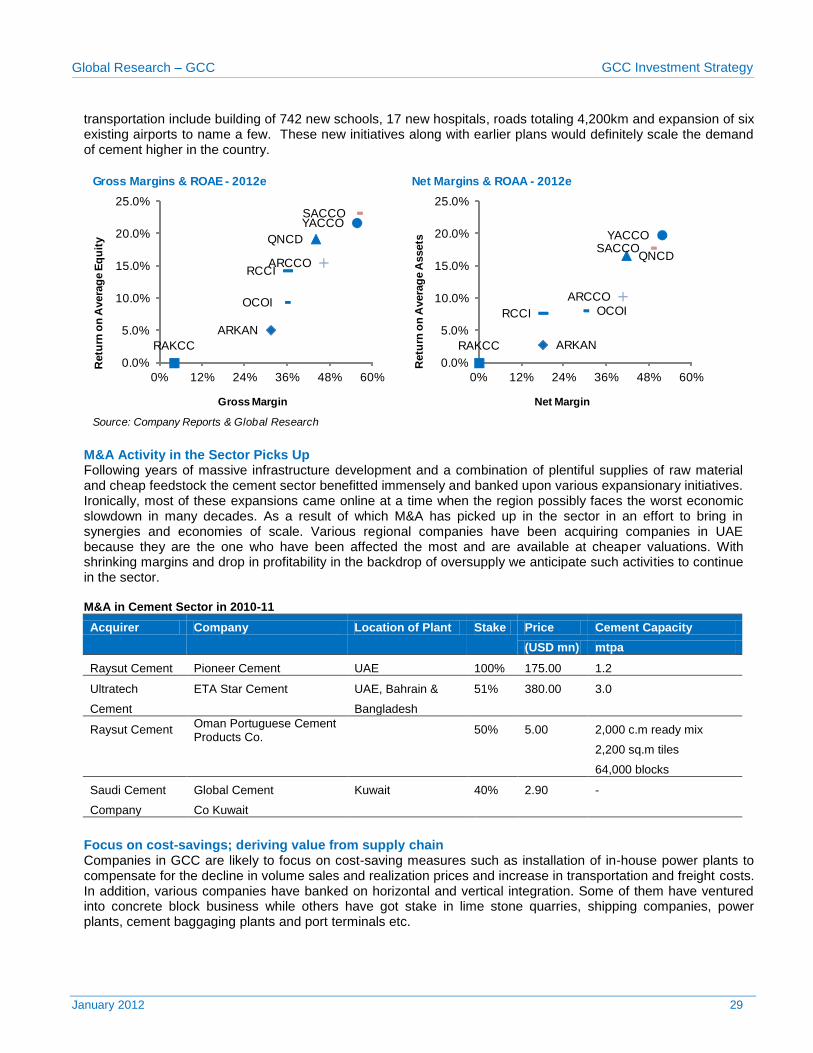
Global Research – GCC GCC Investment Strategy
January 2012 29
transportation include building of 742 new schools, 17 new hospitals, roads totaling 4,200km and expansion of six existing airports to name a few. These new initiatives along with earlier plans would definitely scale the demand of cement higher in the country.
M&A Activity in the Sector Picks Up Following years of massive infrastructure development and a combination of plentiful supplies of raw material and cheap feedstock the cement sector benefitted immensely and banked upon various expansionary initiatives. Ironically, most of these expansions came online at a time when the region possibly faces the worst economic slowdown in many decades. As a result of which M&A has picked up in the sector in an effort to bring in synergies and economies of scale. Various regional companies have been acquiring companies in UAE because they are the one who have been affected the most and are available at cheaper valuations. With shrinking margins and drop in profitability in the backdrop of oversupply we anticipate such activities to continue in the sector. M&A in Cement Sector in 2010-11
Acquirer Company Location of Plant Stake Price Cement Capacity
(USD mn) mtpa
Raysut Cement Pioneer Cement UAE 100% 175.00 1.2
Ultratech ETA Star Cement UAE, Bahrain & 51% 380.00 3.0
Cement
Bangladesh
Raysut Cement Oman Portuguese Cement Products Co.
50% 5.00 2,000 c.m ready mix
2,200 sq.m tiles
64,000 blocks
Saudi Cement Global Cement Kuwait 40% 2.90 -
Company Co Kuwait
Focus on cost-savings; deriving value from supply chain Companies in GCC are likely to focus on cost-saving measures such as installation of in-house power plants to compensate for the decline in volume sales and realization prices and increase in transportation and freight costs. In addition, various companies have banked on horizontal and vertical integration. Some of them have ventured into concrete block business while others have got stake in lime stone quarries, shipping companies, power plants, cement baggaging plants and port terminals etc.
Gross Margins & ROAE - 2012e Net Margins & ROAA - 2012e
Source: Company Reports & Global Research
ARKAN
RAKCC
QNCD
OCOI
RCCI
YACCO
ARCCO
SACCO
0.0%
5.0%
10.0%
15.0%
20.0%
25.0%
0% 12% 24% 36% 48% 60%
Retu
rn o
n A
vera
ge E
qu
ity
Gross Margin
ARKANRAKCC
QNCD
OCOIRCCI
YACCO
ARCCO
SACCO
0.0%
5.0%
10.0%
15.0%
20.0%
25.0%
0% 12% 24% 36% 48% 60%
Retu
rn o
n A
vera
ge A
ssets
Net Margin
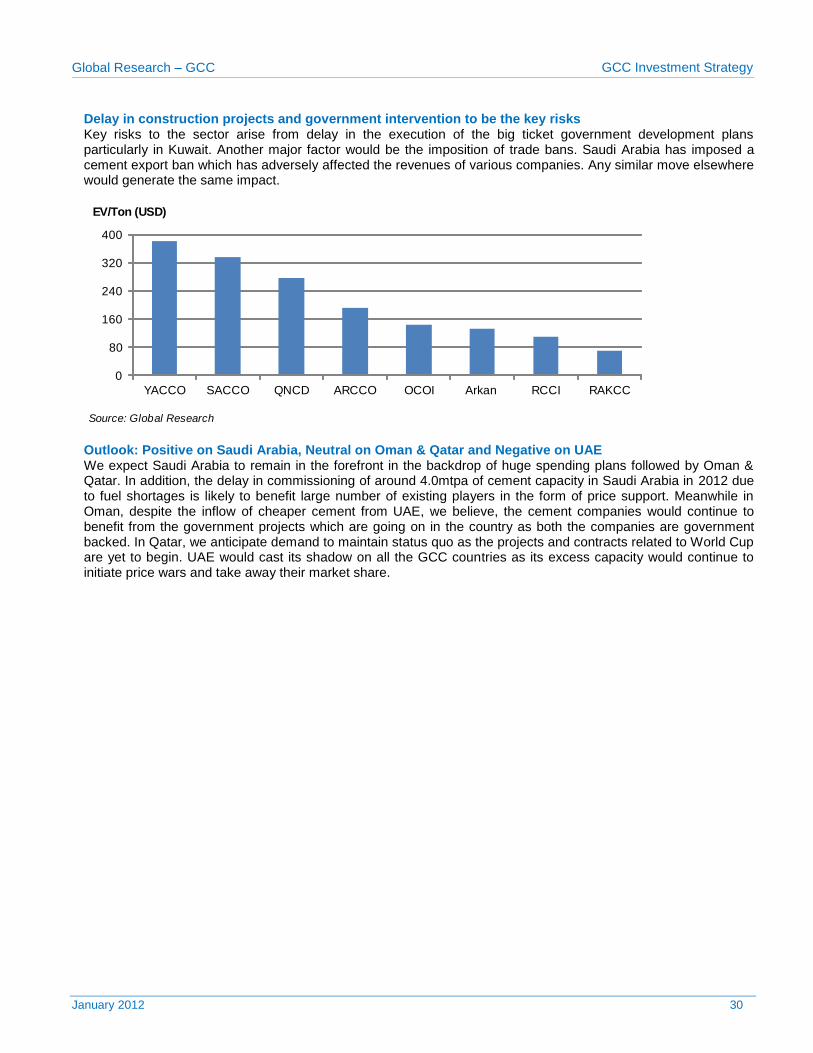
Global Research – GCC GCC Investment Strategy
January 2012 30
Delay in construction projects and government intervention to be the key risks Key risks to the sector arise from delay in the execution of the big ticket government development plans particularly in Kuwait. Another major factor would be the imposition of trade bans. Saudi Arabia has imposed a cement export ban which has adversely affected the revenues of various companies. Any similar move elsewhere would generate the same impact.
Outlook: Positive on Saudi Arabia, Neutral on Oman & Qatar and Negative on UAE We expect Saudi Arabia to remain in the forefront in the backdrop of huge spending plans followed by Oman & Qatar. In addition, the delay in commissioning of around 4.0mtpa of cement capacity in Saudi Arabia in 2012 due to fuel shortages is likely to benefit large number of existing players in the form of price support. Meanwhile in Oman, despite the inflow of cheaper cement from UAE, we believe, the cement companies would continue to benefit from the government projects which are going on in the country as both the companies are government backed. In Qatar, we anticipate demand to maintain status quo as the projects and contracts related to World Cup are yet to begin. UAE would cast its shadow on all the GCC countries as its excess capacity would continue to initiate price wars and take away their market share.
EV/Ton (USD)
Source: Global Research
0
80
160
240
320
400
YACCO SACCO QNCD ARCCO OCOI Arkan RCCI RAKCC
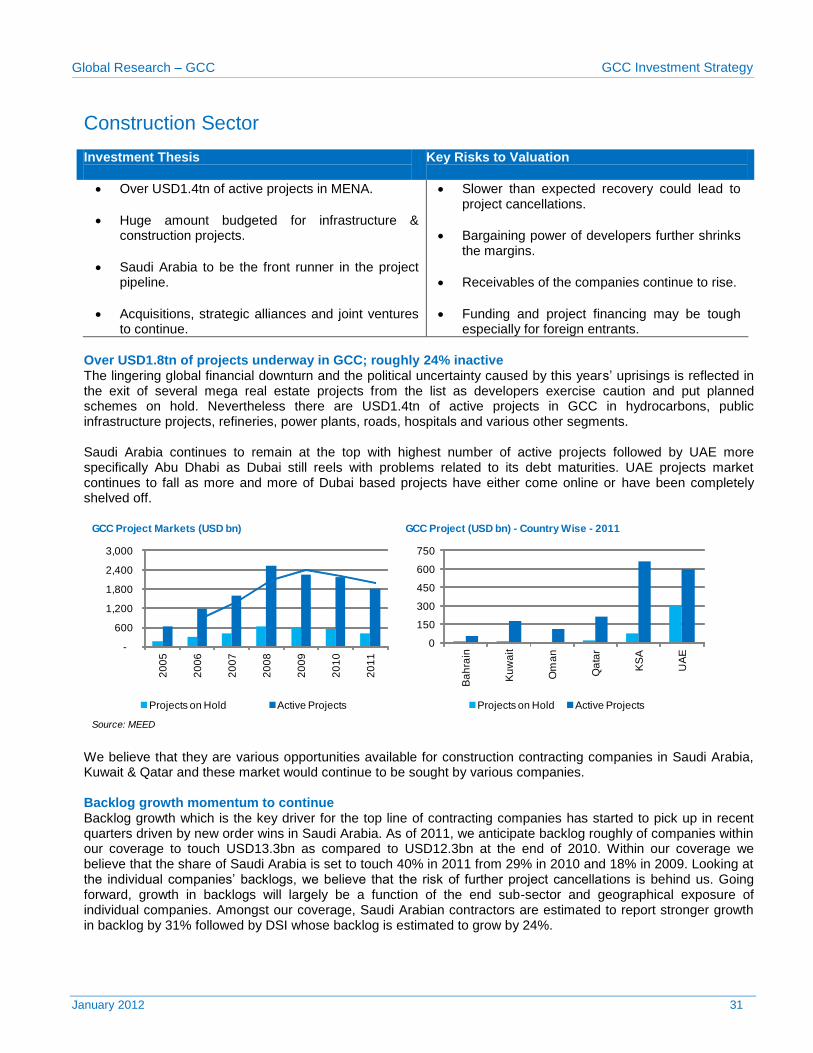
Global Research – GCC GCC Investment Strategy
January 2012 31
Construction Sector Investment Thesis
Key Risks to Valuation
Over USD1.4tn of active projects in MENA.
Huge amount budgeted for infrastructure & construction projects.
Saudi Arabia to be the front runner in the project pipeline.
Acquisitions, strategic alliances and joint ventures to continue.
Slower than expected recovery could lead to project cancellations.
Bargaining power of developers further shrinks the margins.
Receivables of the companies continue to rise.
Funding and project financing may be tough especially for foreign entrants.
Over USD1.8tn of projects underway in GCC; roughly 24% inactive The lingering global financial downturn and the political uncertainty caused by this years’ uprisings is reflected in the exit of several mega real estate projects from the list as developers exercise caution and put planned schemes on hold. Nevertheless there are USD1.4tn of active projects in GCC in hydrocarbons, public infrastructure projects, refineries, power plants, roads, hospitals and various other segments. Saudi Arabia continues to remain at the top with highest number of active projects followed by UAE more specifically Abu Dhabi as Dubai still reels with problems related to its debt maturities. UAE projects market continues to fall as more and more of Dubai based projects have either come online or have been completely shelved off.
We believe that they are various opportunities available for construction contracting companies in Saudi Arabia, Kuwait & Qatar and these market would continue to be sought by various companies. Backlog growth momentum to continue Backlog growth which is the key driver for the top line of contracting companies has started to pick up in recent quarters driven by new order wins in Saudi Arabia. As of 2011, we anticipate backlog roughly of companies within our coverage to touch USD13.3bn as compared to USD12.3bn at the end of 2010. Within our coverage we believe that the share of Saudi Arabia is set to touch 40% in 2011 from 29% in 2010 and 18% in 2009. Looking at the individual companies’ backlogs, we believe that the risk of further project cancellations is behind us. Going forward, growth in backlogs will largely be a function of the end sub-sector and geographical exposure of individual companies. Amongst our coverage, Saudi Arabian contractors are estimated to report stronger growth in backlog by 31% followed by DSI whose backlog is estimated to grow by 24%.
GCC Project Markets (USD bn) GCC Project (USD bn) - Country Wise - 2011
Source: MEED
-
600
1,200
1,800
2,400
3,000
20
05
20
06
20
07
20
08
20
09
20
10
20
11
Projects on Hold Active Projects
0
150
300
450
600
750
Ba
hra
in
Ku
wa
it
Om
an
Qa
tar
KS
A
UA
E
Projects on Hold Active Projects
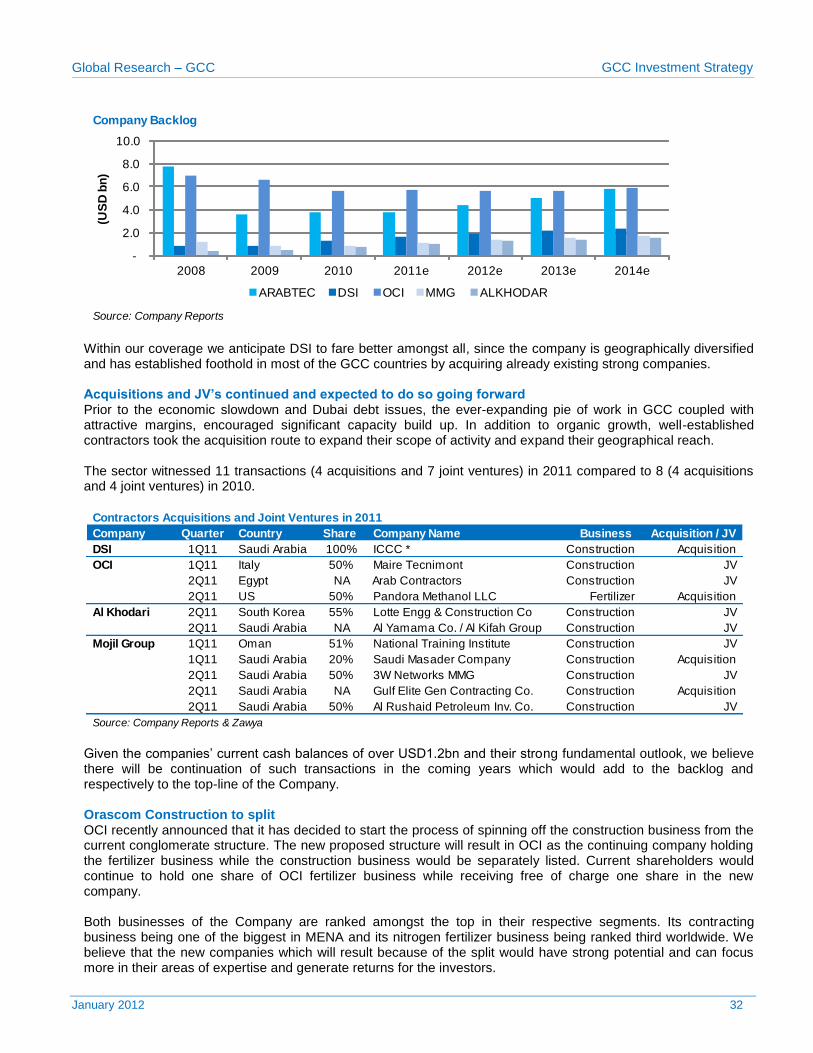
Global Research – GCC GCC Investment Strategy
January 2012 32
Within our coverage we anticipate DSI to fare better amongst all, since the company is geographically diversified and has established foothold in most of the GCC countries by acquiring already existing strong companies. Acquisitions and JV’s continued and expected to do so going forward Prior to the economic slowdown and Dubai debt issues, the ever-expanding pie of work in GCC coupled with attractive margins, encouraged significant capacity build up. In addition to organic growth, well-established contractors took the acquisition route to expand their scope of activity and expand their geographical reach. The sector witnessed 11 transactions (4 acquisitions and 7 joint ventures) in 2011 compared to 8 (4 acquisitions and 4 joint ventures) in 2010.
Given the companies’ current cash balances of over USD1.2bn and their strong fundamental outlook, we believe there will be continuation of such transactions in the coming years which would add to the backlog and respectively to the top-line of the Company. Orascom Construction to split OCI recently announced that it has decided to start the process of spinning off the construction business from the current conglomerate structure. The new proposed structure will result in OCI as the continuing company holding the fertilizer business while the construction business would be separately listed. Current shareholders would continue to hold one share of OCI fertilizer business while receiving free of charge one share in the new company. Both businesses of the Company are ranked amongst the top in their respective segments. Its contracting business being one of the biggest in MENA and its nitrogen fertilizer business being ranked third worldwide. We believe that the new companies which will result because of the split would have strong potential and can focus more in their areas of expertise and generate returns for the investors.
Company Backlog
Source: Company Reports
-
2.0
4.0
6.0
8.0
10.0
2008 2009 2010 2011e 2012e 2013e 2014e
(US
D b
n)
ARABTEC DSI OCI MMG ALKHODAR
Contractors Acquisitions and Joint Ventures in 2011
Company Quarter Country Share Company Name Business Acquisition / JV
DSI 1Q11 Saudi Arabia 100% ICCC * Construction Acquisition
OCI 1Q11 Italy 50% Maire Tecnimont Construction JV
2Q11 Egypt NA Arab Contractors Construction JV
2Q11 US 50% Pandora Methanol LLC Fertilizer Acquisition
Al Khodari 2Q11 South Korea 55% Lotte Engg & Construction Co Construction JV
2Q11 Saudi Arabia NA Al Yamama Co. / Al Kifah Group Construction JV
Mojil Group 1Q11 Oman 51% National Training Institute Construction JV
1Q11 Saudi Arabia 20% Saudi Masader Company Construction Acquisition
2Q11 Saudi Arabia 50% 3W Networks MMG Construction JV
2Q11 Saudi Arabia NA Gulf Elite Gen Contracting Co. Construction Acquisition
2Q11 Saudi Arabia 50% Al Rushaid Petroleum Inv. Co. Construction JV
Source: Company Reports & Zawya
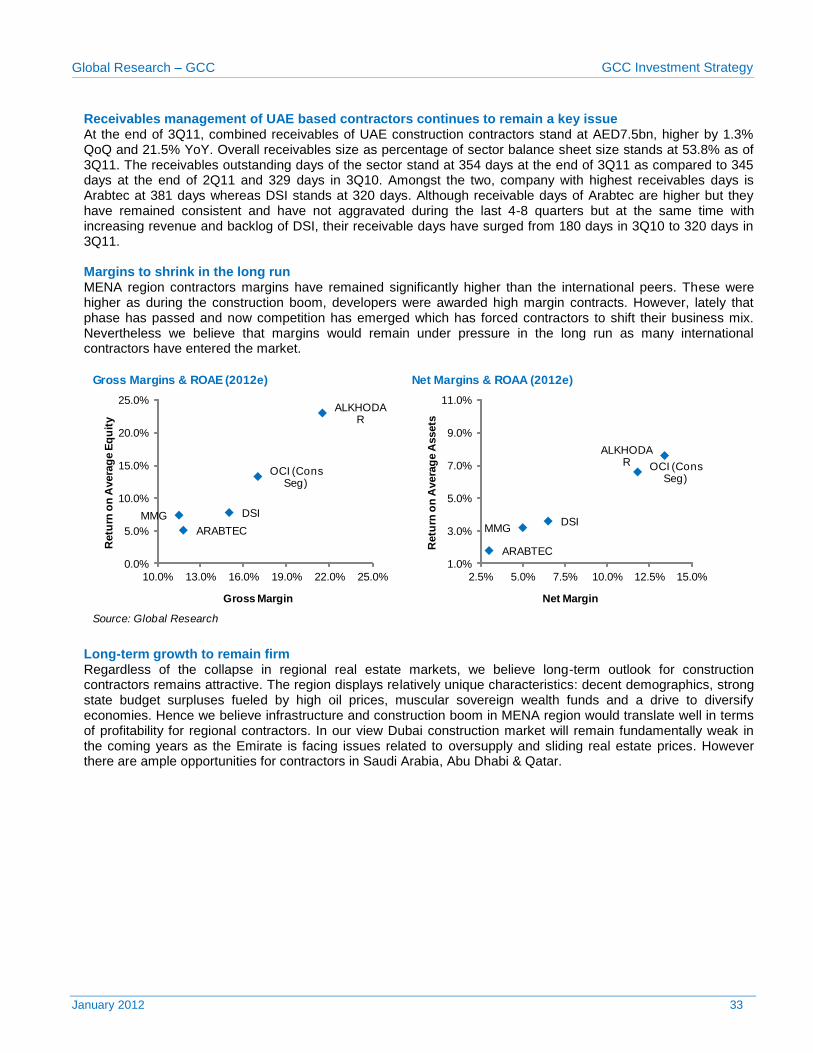
Global Research – GCC GCC Investment Strategy
January 2012 33
Receivables management of UAE based contractors continues to remain a key issue At the end of 3Q11, combined receivables of UAE construction contractors stand at AED7.5bn, higher by 1.3% QoQ and 21.5% YoY. Overall receivables size as percentage of sector balance sheet size stands at 53.8% as of 3Q11. The receivables outstanding days of the sector stand at 354 days at the end of 3Q11 as compared to 345 days at the end of 2Q11 and 329 days in 3Q10. Amongst the two, company with highest receivables days is Arabtec at 381 days whereas DSI stands at 320 days. Although receivable days of Arabtec are higher but they have remained consistent and have not aggravated during the last 4-8 quarters but at the same time with increasing revenue and backlog of DSI, their receivable days have surged from 180 days in 3Q10 to 320 days in 3Q11. Margins to shrink in the long run MENA region contractors margins have remained significantly higher than the international peers. These were higher as during the construction boom, developers were awarded high margin contracts. However, lately that phase has passed and now competition has emerged which has forced contractors to shift their business mix. Nevertheless we believe that margins would remain under pressure in the long run as many international contractors have entered the market.
Long-term growth to remain firm Regardless of the collapse in regional real estate markets, we believe long-term outlook for construction contractors remains attractive. The region displays relatively unique characteristics: decent demographics, strong state budget surpluses fueled by high oil prices, muscular sovereign wealth funds and a drive to diversify economies. Hence we believe infrastructure and construction boom in MENA region would translate well in terms of profitability for regional contractors. In our view Dubai construction market will remain fundamentally weak in the coming years as the Emirate is facing issues related to oversupply and sliding real estate prices. However there are ample opportunities for contractors in Saudi Arabia, Abu Dhabi & Qatar.
Gross Margins & ROAE (2012e) Net Margins & ROAA (2012e)
Source: Global Research
ARABTEC
DSI
OCI (Cons Seg)
MMG
ALKHODAR
0.0%
5.0%
10.0%
15.0%
20.0%
25.0%
10.0% 13.0% 16.0% 19.0% 22.0% 25.0%
Retu
rn o
n A
vera
ge E
qu
ity
Gross Margin
ARABTEC
DSI
OCI (Cons Seg)
MMG
ALKHODAR
1.0%
3.0%
5.0%
7.0%
9.0%
11.0%
2.5% 5.0% 7.5% 10.0% 12.5% 15.0%
Retu
rn o
n A
vera
ge A
ssets
Net Margin
Global Research – GCC GCC Investment Strategy
January 2012 34
Petrochemical Sector Investment Thesis
Key Risks to Valuation
Additional output from new ventures and product diversification to support revenue streams.
Increase/decrease in oil and related product prices.
Over USD700bn petrochemical projects in Middle East; over USD350bn in GCC.
Increase in price of feedstock
Advantage of getting undisrupted feedstock at highly subsidized prices.
Delays in the initiation of new complexes.
Decline in oil prices to be compensated by increasing output.
Gas supply to new plants remains getting stricter.
Oil prices expected to remain at current levels After posting gains of over 25% in 2010, the same trend continued and the oil prices registered a further gain of 26.2% in 2011. For 2012, oil outlook is anything but clear, as macroeconomic, geopolitical and physical supply/demand factors all seem to point in different directions. Economic turbulence is shaking oil demand as the slowdown hits manufacturing activities worldwide. Slow oil demand, initiated in the OECD region, has moved to China and India, leading to a downward revision in next year’s oil demand growth forecast. Other regions are also expected to experience an economic slowdown, including countries like Brazil and several Latin American economies. Hence we assume volatility in oil prices and expect average prices in 2012 would maintain at the same level as they were in 2011. GCC countries continue to pump money into petrochemical projects High oil prices and steady production levels fueled economic growth in the region. Energy sector continued to dominate GCC countries’ revenues despite rigorous diversification efforts made by these economies to develop the non-oil sectors. In order to continue to benefit from previous high oil prices, GCC countries are focused on expanding their output by adding various new products to their offerings. As of today total value of planned projects in the regional petroleum sector is estimated at USD353bn. Despite this optimistic scenario, project postponement and cancellation trend continues to plague the market. Saudi Arabia to lead the market with USD215bn worth of new investment Saudi Arabia currently has approximately 147 projects upcoming in the petroleum sector, with an estimated cumulative value of USD215bn. These projects are focused heavily on the upstream oil and gas segment. One of the major upcoming projects is the Yanbu Integrated Refinery & Petrochemicals Complex that is currently in the study phase and has an estimated budget of USD20bn. Another major upcoming project is the Jizan Refinery Project that has an estimated budget of USD7bn. UAE follows with 116 projects with an estimated cumulative value of USD98bn UAE currently has roughly 116 projects upcoming in the petroleum sector, at an estimated cumulative value of USD98bn. These projects are focused heavily on the upstream oil and gas segment. One of the major upcoming projects is the Tacaamol – Al-Gharbia Chemicals Industrial City project that is currently in planned phase, and has an estimated budget of USD20bn. Another major upcoming project is the Zadco and has an estimated budget of USD10bn. Asian region to raise the demand; America to follow & Europe to remain weak Emerging markets are increasingly becoming the drivers of growth in the global economy as mature and developed markets struggle with slow or even negative growth. This is especially true for the petrochemicals industry, which is banking on emerging markets in Asia and elsewhere absorbing new capacity due to come on stream in the next few years. We believe a major chunk of future demand growth will come from this region and should enable the GCC petrochemicals industry to find a ready market for the output of the aggressive capacity expansion projects currently underway at various locations. While we believe that America has gradually come
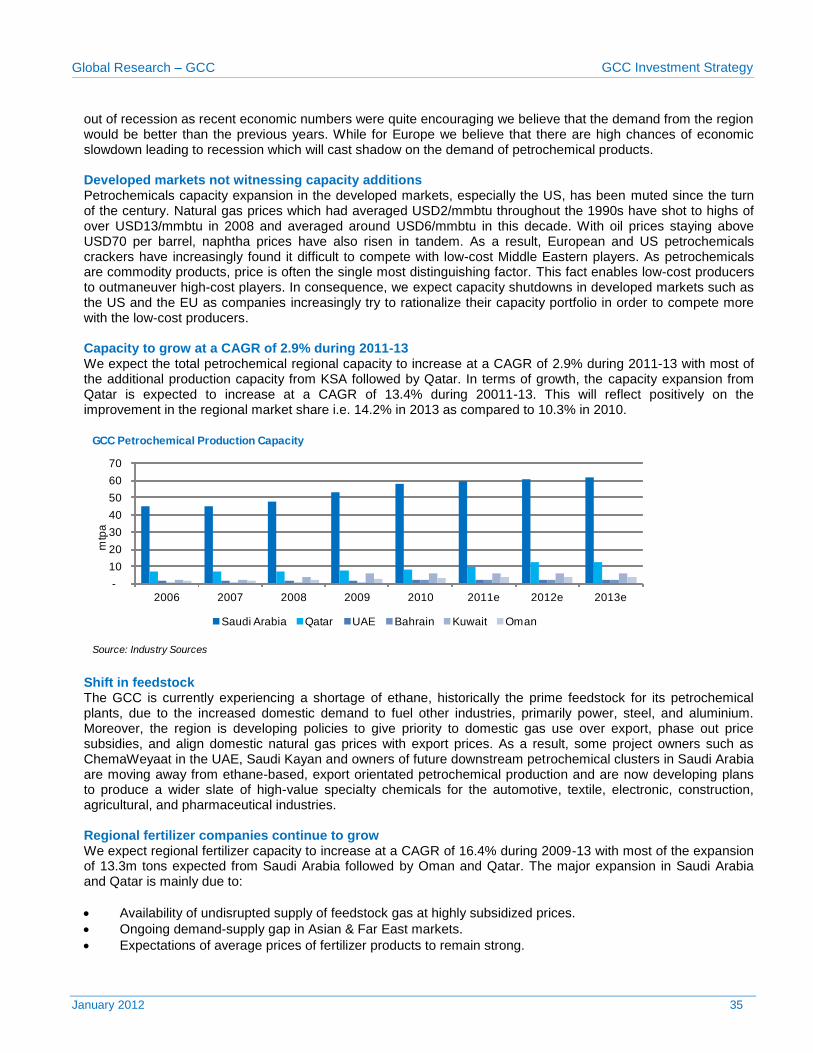
Global Research – GCC GCC Investment Strategy
January 2012 35
out of recession as recent economic numbers were quite encouraging we believe that the demand from the region would be better than the previous years. While for Europe we believe that there are high chances of economic slowdown leading to recession which will cast shadow on the demand of petrochemical products. Developed markets not witnessing capacity additions Petrochemicals capacity expansion in the developed markets, especially the US, has been muted since the turn of the century. Natural gas prices which had averaged USD2/mmbtu throughout the 1990s have shot to highs of over USD13/mmbtu in 2008 and averaged around USD6/mmbtu in this decade. With oil prices staying above USD70 per barrel, naphtha prices have also risen in tandem. As a result, European and US petrochemicals crackers have increasingly found it difficult to compete with low-cost Middle Eastern players. As petrochemicals are commodity products, price is often the single most distinguishing factor. This fact enables low-cost producers to outmaneuver high-cost players. In consequence, we expect capacity shutdowns in developed markets such as the US and the EU as companies increasingly try to rationalize their capacity portfolio in order to compete more with the low-cost producers. Capacity to grow at a CAGR of 2.9% during 2011-13 We expect the total petrochemical regional capacity to increase at a CAGR of 2.9% during 2011-13 with most of the additional production capacity from KSA followed by Qatar. In terms of growth, the capacity expansion from Qatar is expected to increase at a CAGR of 13.4% during 20011-13. This will reflect positively on the improvement in the regional market share i.e. 14.2% in 2013 as compared to 10.3% in 2010.
Shift in feedstock The GCC is currently experiencing a shortage of ethane, historically the prime feedstock for its petrochemical plants, due to the increased domestic demand to fuel other industries, primarily power, steel, and aluminium. Moreover, the region is developing policies to give priority to domestic gas use over export, phase out price subsidies, and align domestic natural gas prices with export prices. As a result, some project owners such as ChemaWeyaat in the UAE, Saudi Kayan and owners of future downstream petrochemical clusters in Saudi Arabia are moving away from ethane-based, export orientated petrochemical production and are now developing plans to produce a wider slate of high-value specialty chemicals for the automotive, textile, electronic, construction, agricultural, and pharmaceutical industries. Regional fertilizer companies continue to grow We expect regional fertilizer capacity to increase at a CAGR of 16.4% during 2009-13 with most of the expansion of 13.3m tons expected from Saudi Arabia followed by Oman and Qatar. The major expansion in Saudi Arabia and Qatar is mainly due to:
Availability of undisrupted supply of feedstock gas at highly subsidized prices.
Ongoing demand-supply gap in Asian & Far East markets.
Expectations of average prices of fertilizer products to remain strong.
GCC Petrochemical Production Capacity
Source: Industry Sources
-
10
20
30
40
50
60
70
2006 2007 2008 2009 2010 2011e 2012e 2013e
mtp
a
Saudi Arabia Qatar UAE Bahrain Kuwait Oman
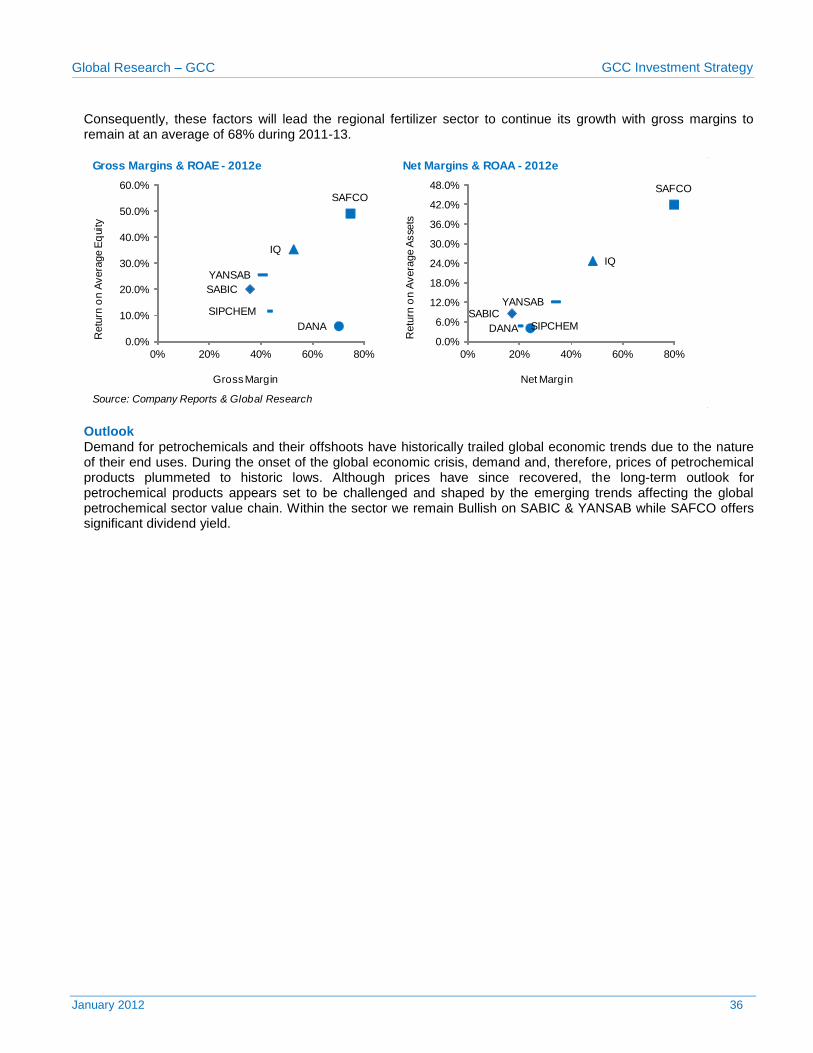
Global Research – GCC GCC Investment Strategy
January 2012 36
Consequently, these factors will lead the regional fertilizer sector to continue its growth with gross margins to remain at an average of 68% during 2011-13.
Outlook Demand for petrochemicals and their offshoots have historically trailed global economic trends due to the nature of their end uses. During the onset of the global economic crisis, demand and, therefore, prices of petrochemical products plummeted to historic lows. Although prices have since recovered, the long-term outlook for petrochemical products appears set to be challenged and shaped by the emerging trends affecting the global petrochemical sector value chain. Within the sector we remain Bullish on SABIC & YANSAB while SAFCO offers significant dividend yield.
Gross Margins & ROAE - 2012e Net Margins & ROAA - 2012e
Source: Company Reports & Global Research
SABIC
SAFCO
IQ
SIPCHEM
YANSAB
DANA
0.0%
10.0%
20.0%
30.0%
40.0%
50.0%
60.0%
0% 20% 40% 60% 80%
Retu
rn o
n A
vera
ge E
qui
ty
Gross Margin
SABIC
SAFCO
IQ
SIPCHEM
YANSAB
DANA
0.0%
6.0%
12.0%
18.0%
24.0%
30.0%
36.0%
42.0%
48.0%
0% 20% 40% 60% 80%
Retu
rn o
n A
vera
ge A
sse
ts
Net Margin
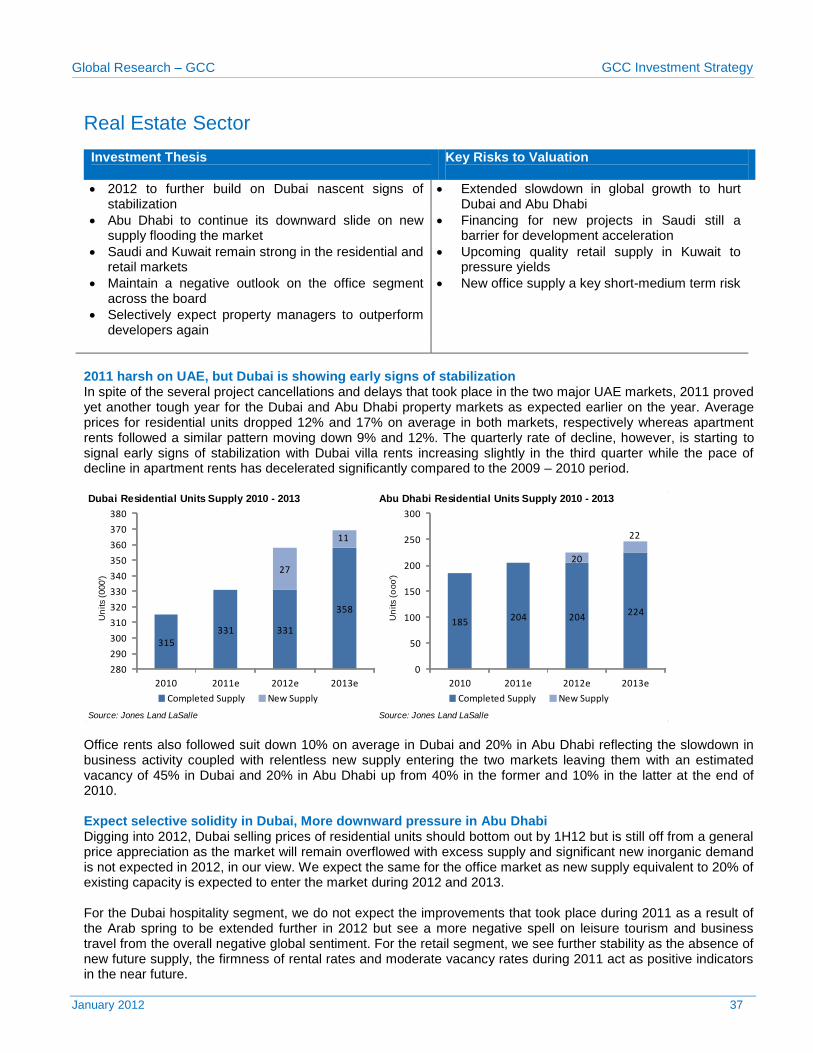
Global Research – GCC GCC Investment Strategy
January 2012 37
Real Estate Sector Investment Thesis
Key Risks to Valuation
2012 to further build on Dubai nascent signs of stabilization
Extended slowdown in global growth to hurt Dubai and Abu Dhabi
Abu Dhabi to continue its downward slide on new supply flooding the market
Financing for new projects in Saudi still a barrier for development acceleration
Saudi and Kuwait remain strong in the residential and retail markets
Upcoming quality retail supply in Kuwait to pressure yields
Maintain a negative outlook on the office segment across the board
Selectively expect property managers to outperform developers again
New office supply a key short-medium term risk
2011 harsh on UAE, but Dubai is showing early signs of stabilization In spite of the several project cancellations and delays that took place in the two major UAE markets, 2011 proved yet another tough year for the Dubai and Abu Dhabi property markets as expected earlier on the year. Average prices for residential units dropped 12% and 17% on average in both markets, respectively whereas apartment rents followed a similar pattern moving down 9% and 12%. The quarterly rate of decline, however, is starting to signal early signs of stabilization with Dubai villa rents increasing slightly in the third quarter while the pace of decline in apartment rents has decelerated significantly compared to the 2009 – 2010 period.
Office rents also followed suit down 10% on average in Dubai and 20% in Abu Dhabi reflecting the slowdown in business activity coupled with relentless new supply entering the two markets leaving them with an estimated vacancy of 45% in Dubai and 20% in Abu Dhabi up from 40% in the former and 10% in the latter at the end of 2010. Expect selective solidity in Dubai, More downward pressure in Abu Dhabi Digging into 2012, Dubai selling prices of residential units should bottom out by 1H12 but is still off from a general price appreciation as the market will remain overflowed with excess supply and significant new inorganic demand is not expected in 2012, in our view. We expect the same for the office market as new supply equivalent to 20% of existing capacity is expected to enter the market during 2012 and 2013. For the Dubai hospitality segment, we do not expect the improvements that took place during 2011 as a result of the Arab spring to be extended further in 2012 but see a more negative spell on leisure tourism and business travel from the overall negative global sentiment. For the retail segment, we see further stability as the absence of new future supply, the firmness of rental rates and moderate vacancy rates during 2011 act as positive indicators in the near future.
Dubai Residential Units Supply 2010 - 2013 Abu Dhabi Residential Units Supply 2010 - 2013
Source: Jones Land LaSalle Source: Jones Land LaSalle
315331 331
358
27
11
280
290
300
310
320
330
340
350
360
370
380
2010 2011e 2012e 2013e
Un
its (000')
Completed Supply New Supply
185 204 204224
20
22
0
50
100
150
200
250
300
2010 2011e 2012e 2013e
Un
its (o
oo')
Completed Supply New Supply
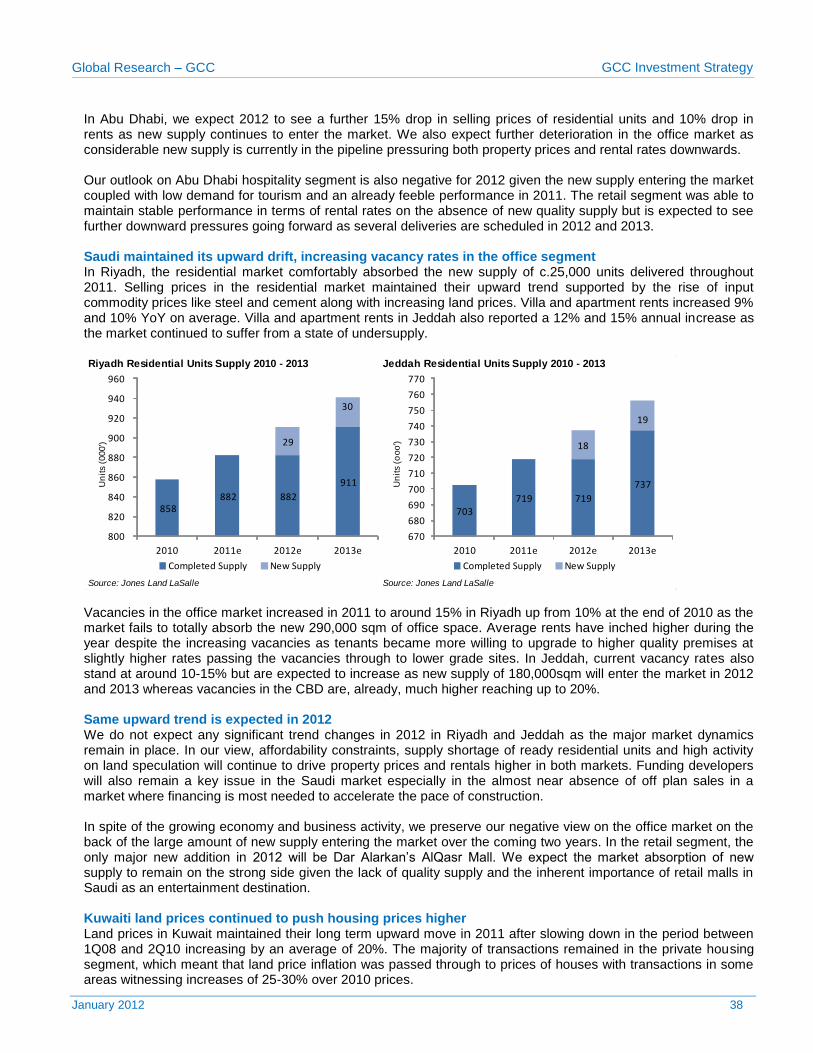
Global Research – GCC GCC Investment Strategy
January 2012 38
In Abu Dhabi, we expect 2012 to see a further 15% drop in selling prices of residential units and 10% drop in rents as new supply continues to enter the market. We also expect further deterioration in the office market as considerable new supply is currently in the pipeline pressuring both property prices and rental rates downwards. Our outlook on Abu Dhabi hospitality segment is also negative for 2012 given the new supply entering the market coupled with low demand for tourism and an already feeble performance in 2011. The retail segment was able to maintain stable performance in terms of rental rates on the absence of new quality supply but is expected to see further downward pressures going forward as several deliveries are scheduled in 2012 and 2013. Saudi maintained its upward drift, increasing vacancy rates in the office segment In Riyadh, the residential market comfortably absorbed the new supply of c.25,000 units delivered throughout 2011. Selling prices in the residential market maintained their upward trend supported by the rise of input commodity prices like steel and cement along with increasing land prices. Villa and apartment rents increased 9% and 10% YoY on average. Villa and apartment rents in Jeddah also reported a 12% and 15% annual increase as the market continued to suffer from a state of undersupply.
Vacancies in the office market increased in 2011 to around 15% in Riyadh up from 10% at the end of 2010 as the market fails to totally absorb the new 290,000 sqm of office space. Average rents have inched higher during the year despite the increasing vacancies as tenants became more willing to upgrade to higher quality premises at slightly higher rates passing the vacancies through to lower grade sites. In Jeddah, current vacancy rates also stand at around 10-15% but are expected to increase as new supply of 180,000sqm will enter the market in 2012 and 2013 whereas vacancies in the CBD are, already, much higher reaching up to 20%. Same upward trend is expected in 2012 We do not expect any significant trend changes in 2012 in Riyadh and Jeddah as the major market dynamics remain in place. In our view, affordability constraints, supply shortage of ready residential units and high activity on land speculation will continue to drive property prices and rentals higher in both markets. Funding developers will also remain a key issue in the Saudi market especially in the almost near absence of off plan sales in a market where financing is most needed to accelerate the pace of construction. In spite of the growing economy and business activity, we preserve our negative view on the office market on the back of the large amount of new supply entering the market over the coming two years. In the retail segment, the only major new addition in 2012 will be Dar Alarkan’s AlQasr Mall. We expect the market absorption of new supply to remain on the strong side given the lack of quality supply and the inherent importance of retail malls in Saudi as an entertainment destination. Kuwaiti land prices continued to push housing prices higher Land prices in Kuwait maintained their long term upward move in 2011 after slowing down in the period between 1Q08 and 2Q10 increasing by an average of 20%. The majority of transactions remained in the private housing segment, which meant that land price inflation was passed through to prices of houses with transactions in some areas witnessing increases of 25-30% over 2010 prices.
Riyadh Residential Units Supply 2010 - 2013 Jeddah Residential Units Supply 2010 - 2013
Source: Jones Land LaSalle Source: Jones Land LaSalle
858 882 882
911
29
30
800
820
840
860
880
900
920
940
960
2010 2011e 2012e 2013e
Un
its (000')
Completed Supply New Supply
703719 719
737
18
19
670
680
690
700
710
720
730
740
750
760
770
2010 2011e 2012e 2013e
Un
its (o
oo')
Completed Supply New Supply
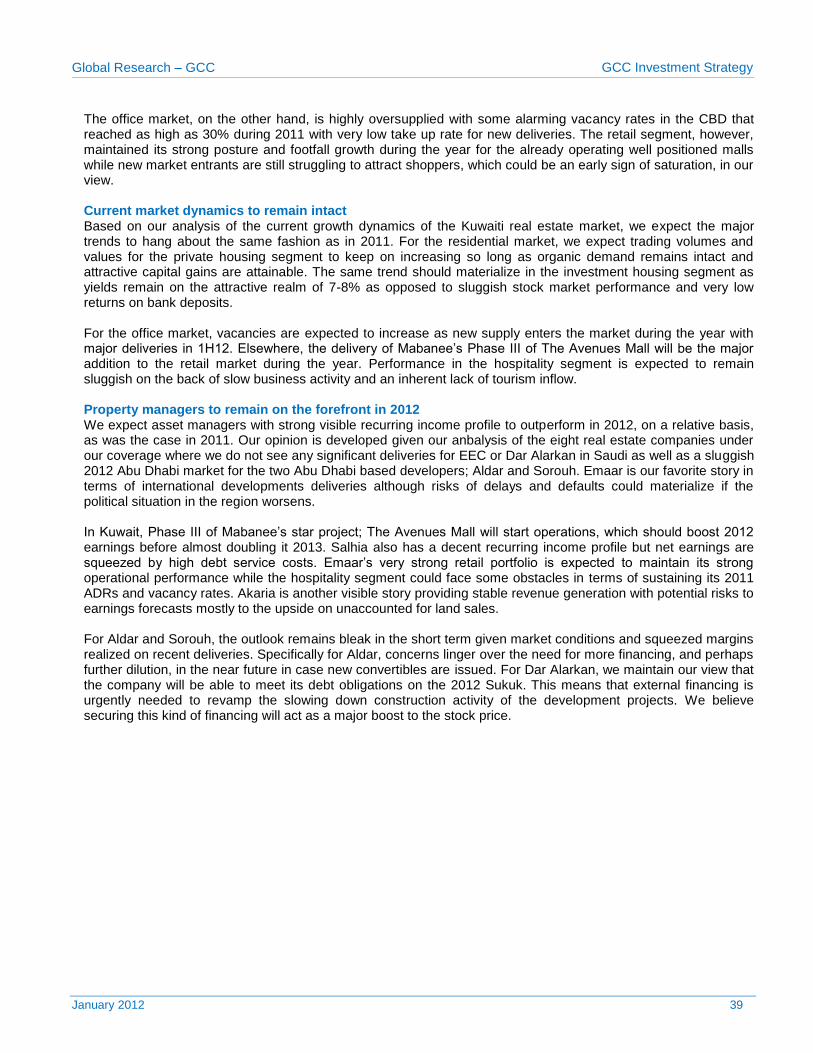
Global Research – GCC GCC Investment Strategy
January 2012 39
The office market, on the other hand, is highly oversupplied with some alarming vacancy rates in the CBD that reached as high as 30% during 2011 with very low take up rate for new deliveries. The retail segment, however, maintained its strong posture and footfall growth during the year for the already operating well positioned malls while new market entrants are still struggling to attract shoppers, which could be an early sign of saturation, in our view. Current market dynamics to remain intact Based on our analysis of the current growth dynamics of the Kuwaiti real estate market, we expect the major trends to hang about the same fashion as in 2011. For the residential market, we expect trading volumes and values for the private housing segment to keep on increasing so long as organic demand remains intact and attractive capital gains are attainable. The same trend should materialize in the investment housing segment as yields remain on the attractive realm of 7-8% as opposed to sluggish stock market performance and very low returns on bank deposits. For the office market, vacancies are expected to increase as new supply enters the market during the year with major deliveries in 1H12. Elsewhere, the delivery of Mabanee’s Phase III of The Avenues Mall will be the major addition to the retail market during the year. Performance in the hospitality segment is expected to remain sluggish on the back of slow business activity and an inherent lack of tourism inflow. Property managers to remain on the forefront in 2012 We expect asset managers with strong visible recurring income profile to outperform in 2012, on a relative basis, as was the case in 2011. Our opinion is developed given our anbalysis of the eight real estate companies under our coverage where we do not see any significant deliveries for EEC or Dar Alarkan in Saudi as well as a sluggish 2012 Abu Dhabi market for the two Abu Dhabi based developers; Aldar and Sorouh. Emaar is our favorite story in terms of international developments deliveries although risks of delays and defaults could materialize if the political situation in the region worsens. In Kuwait, Phase III of Mabanee’s star project; The Avenues Mall will start operations, which should boost 2012 earnings before almost doubling it 2013. Salhia also has a decent recurring income profile but net earnings are squeezed by high debt service costs. Emaar’s very strong retail portfolio is expected to maintain its strong operational performance while the hospitality segment could face some obstacles in terms of sustaining its 2011 ADRs and vacancy rates. Akaria is another visible story providing stable revenue generation with potential risks to earnings forecasts mostly to the upside on unaccounted for land sales. For Aldar and Sorouh, the outlook remains bleak in the short term given market conditions and squeezed margins realized on recent deliveries. Specifically for Aldar, concerns linger over the need for more financing, and perhaps further dilution, in the near future in case new convertibles are issued. For Dar Alarkan, we maintain our view that the company will be able to meet its debt obligations on the 2012 Sukuk. This means that external financing is urgently needed to revamp the slowing down construction activity of the development projects. We believe securing this kind of financing will act as a major boost to the stock price.
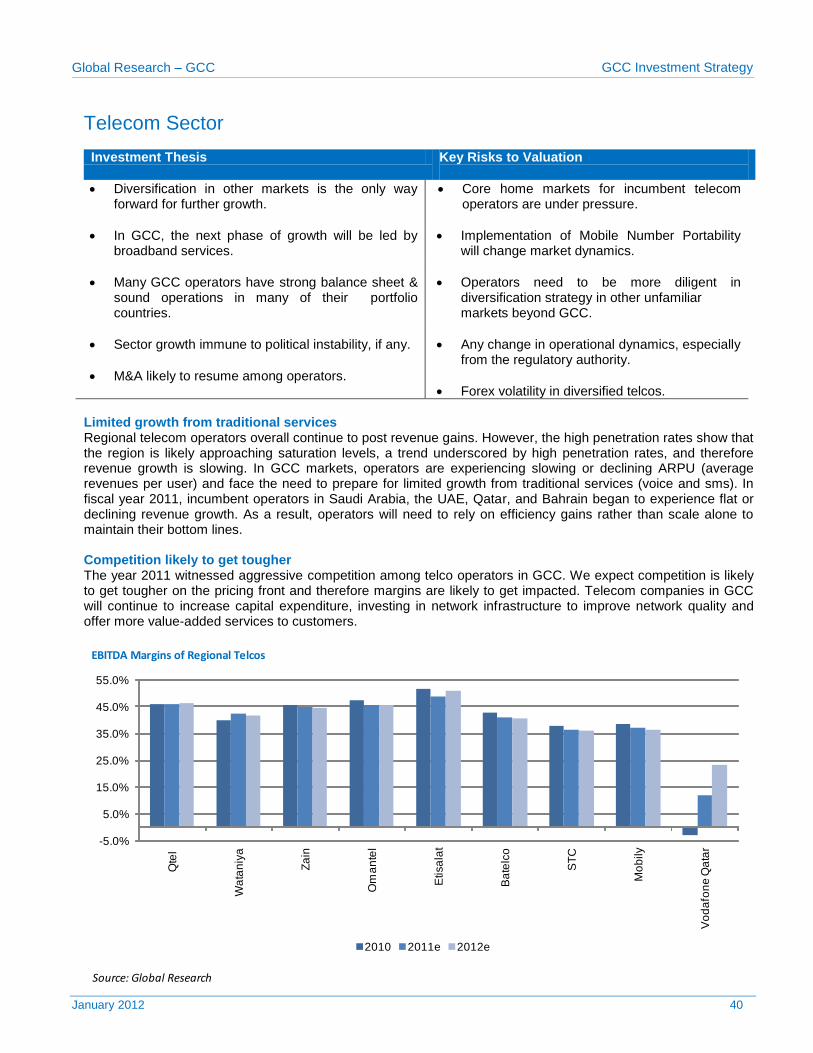
Global Research – GCC GCC Investment Strategy
January 2012 40
Telecom Sector Investment Thesis Key Risks to Valuation
Diversification in other markets is the only way forward for further growth.
Core home markets for incumbent telecom operators are under pressure.
In GCC, the next phase of growth will be led by broadband services.
Implementation of Mobile Number Portability will change market dynamics.
Many GCC operators have strong balance sheet & sound operations in many of their portfolio countries.
Operators need to be more diligent in diversification strategy in other unfamiliar markets beyond GCC.
Sector growth immune to political instability, if any.
M&A likely to resume among operators.
Any change in operational dynamics, especially from the regulatory authority.
Forex volatility in diversified telcos.
Limited growth from traditional services Regional telecom operators overall continue to post revenue gains. However, the high penetration rates show that the region is likely approaching saturation levels, a trend underscored by high penetration rates, and therefore revenue growth is slowing. In GCC markets, operators are experiencing slowing or declining ARPU (average revenues per user) and face the need to prepare for limited growth from traditional services (voice and sms). In fiscal year 2011, incumbent operators in Saudi Arabia, the UAE, Qatar, and Bahrain began to experience flat or declining revenue growth. As a result, operators will need to rely on efficiency gains rather than scale alone to maintain their bottom lines.
Competition likely to get tougher The year 2011 witnessed aggressive competition among telco operators in GCC. We expect competition is likely to get tougher on the pricing front and therefore margins are likely to get impacted. Telecom companies in GCC will continue to increase capital expenditure, investing in network infrastructure to improve network quality and offer more value-added services to customers.
Source: Global Research
EBITDA Margins of Regional Telcos
-5.0%
5.0%
15.0%
25.0%
35.0%
45.0%
55.0%
Qte
l
Wa
tan
iya
Za
in
Om
an
tel
Etisa
lat
Ba
telc
o
ST
C
Mo
bily
Vo
da
fon
e Q
ata
r
2010 2011e 2012e
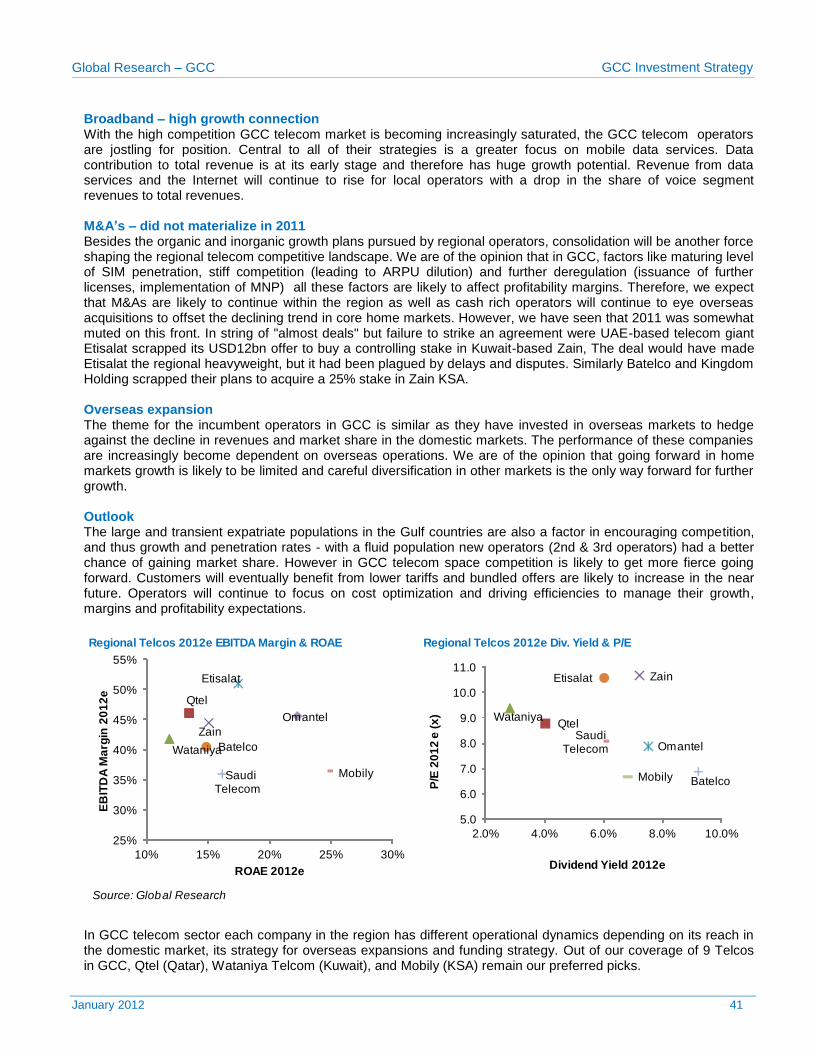
Global Research – GCC GCC Investment Strategy
January 2012 41
Broadband – high growth connection With the high competition GCC telecom market is becoming increasingly saturated, the GCC telecom operators are jostling for position. Central to all of their strategies is a greater focus on mobile data services. Data contribution to total revenue is at its early stage and therefore has huge growth potential. Revenue from data services and the Internet will continue to rise for local operators with a drop in the share of voice segment revenues to total revenues. M&A’s – did not materialize in 2011 Besides the organic and inorganic growth plans pursued by regional operators, consolidation will be another force shaping the regional telecom competitive landscape. We are of the opinion that in GCC, factors like maturing level of SIM penetration, stiff competition (leading to ARPU dilution) and further deregulation (issuance of further licenses, implementation of MNP) all these factors are likely to affect profitability margins. Therefore, we expect that M&As are likely to continue within the region as well as cash rich operators will continue to eye overseas acquisitions to offset the declining trend in core home markets. However, we have seen that 2011 was somewhat muted on this front. In string of "almost deals" but failure to strike an agreement were UAE-based telecom giant Etisalat scrapped its USD12bn offer to buy a controlling stake in Kuwait-based Zain, The deal would have made Etisalat the regional heavyweight, but it had been plagued by delays and disputes. Similarly Batelco and Kingdom Holding scrapped their plans to acquire a 25% stake in Zain KSA. Overseas expansion The theme for the incumbent operators in GCC is similar as they have invested in overseas markets to hedge against the decline in revenues and market share in the domestic markets. The performance of these companies are increasingly become dependent on overseas operations. We are of the opinion that going forward in home markets growth is likely to be limited and careful diversification in other markets is the only way forward for further growth. Outlook The large and transient expatriate populations in the Gulf countries are also a factor in encouraging competition, and thus growth and penetration rates - with a fluid population new operators (2nd & 3rd operators) had a better chance of gaining market share. However in GCC telecom space competition is likely to get more fierce going forward. Customers will eventually benefit from lower tariffs and bundled offers are likely to increase in the near future. Operators will continue to focus on cost optimization and driving efficiencies to manage their growth, margins and profitability expectations.
In GCC telecom sector each company in the region has different operational dynamics depending on its reach in the domestic market, its strategy for overseas expansions and funding strategy. Out of our coverage of 9 Telcos in GCC, Qtel (Qatar), Wataniya Telcom (Kuwait), and Mobily (KSA) remain our preferred picks.
Source: Global Research
Regional Telcos 2012e EBITDA Margin & ROAE Regional Telcos 2012e Div. Yield & P/E
Qtel Wataniya
Zain
Omantel
Etisalat
Batelco
Saudi Telecom
Mobily
5.0
6.0
7.0
8.0
9.0
10.0
11.0
2.0% 4.0% 6.0% 8.0% 10.0%
P/E
20
12
e (
x)
Dividend Yield 2012e
Qtel
Wataniya
Zain
Etisalat
Batelco
Saudi Telecom
Mobily
Omantel
25%
30%
35%
40%
45%
50%
55%
10% 15% 20% 25% 30%
EB
ITD
A M
arg
in 2
01
2e
ROAE 2012e
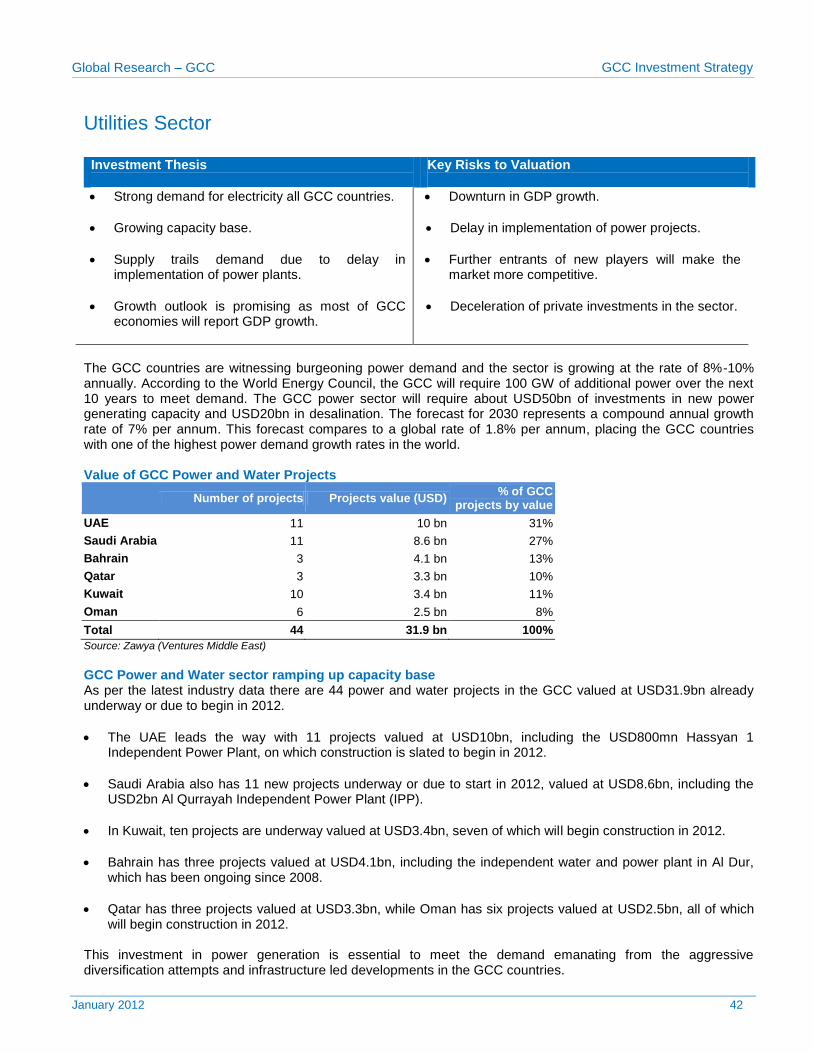
Global Research – GCC GCC Investment Strategy
January 2012 42
Utilities Sector Investment Thesis
Key Risks to Valuation
Strong demand for electricity all GCC countries.
Growing capacity base.
Supply trails demand due to delay in implementation of power plants.
Growth outlook is promising as most of GCC economies will report GDP growth.
Downturn in GDP growth.
Delay in implementation of power projects.
Further entrants of new players will make the market more competitive.
Deceleration of private investments in the sector.
The GCC countries are witnessing burgeoning power demand and the sector is growing at the rate of 8%-10% annually. According to the World Energy Council, the GCC will require 100 GW of additional power over the next 10 years to meet demand. The GCC power sector will require about USD50bn of investments in new power generating capacity and USD20bn in desalination. The forecast for 2030 represents a compound annual growth rate of 7% per annum. This forecast compares to a global rate of 1.8% per annum, placing the GCC countries with one of the highest power demand growth rates in the world. Value of GCC Power and Water Projects
Number of projects Projects value (USD)
% of GCC projects by value
UAE 11 10 bn 31%
Saudi Arabia 11 8.6 bn 27%
Bahrain 3 4.1 bn 13%
Qatar 3 3.3 bn 10%
Kuwait 10 3.4 bn 11%
Oman 6 2.5 bn 8%
Total 44 31.9 bn 100%
Source: Zawya (Ventures Middle East)
GCC Power and Water sector ramping up capacity base As per the latest industry data there are 44 power and water projects in the GCC valued at USD31.9bn already underway or due to begin in 2012.
The UAE leads the way with 11 projects valued at USD10bn, including the USD800mn Hassyan 1 Independent Power Plant, on which construction is slated to begin in 2012.
Saudi Arabia also has 11 new projects underway or due to start in 2012, valued at USD8.6bn, including the USD2bn Al Qurrayah Independent Power Plant (IPP).
In Kuwait, ten projects are underway valued at USD3.4bn, seven of which will begin construction in 2012.
Bahrain has three projects valued at USD4.1bn, including the independent water and power plant in Al Dur, which has been ongoing since 2008.
Qatar has three projects valued at USD3.3bn, while Oman has six projects valued at USD2.5bn, all of which will begin construction in 2012.
This investment in power generation is essential to meet the demand emanating from the aggressive diversification attempts and infrastructure led developments in the GCC countries.
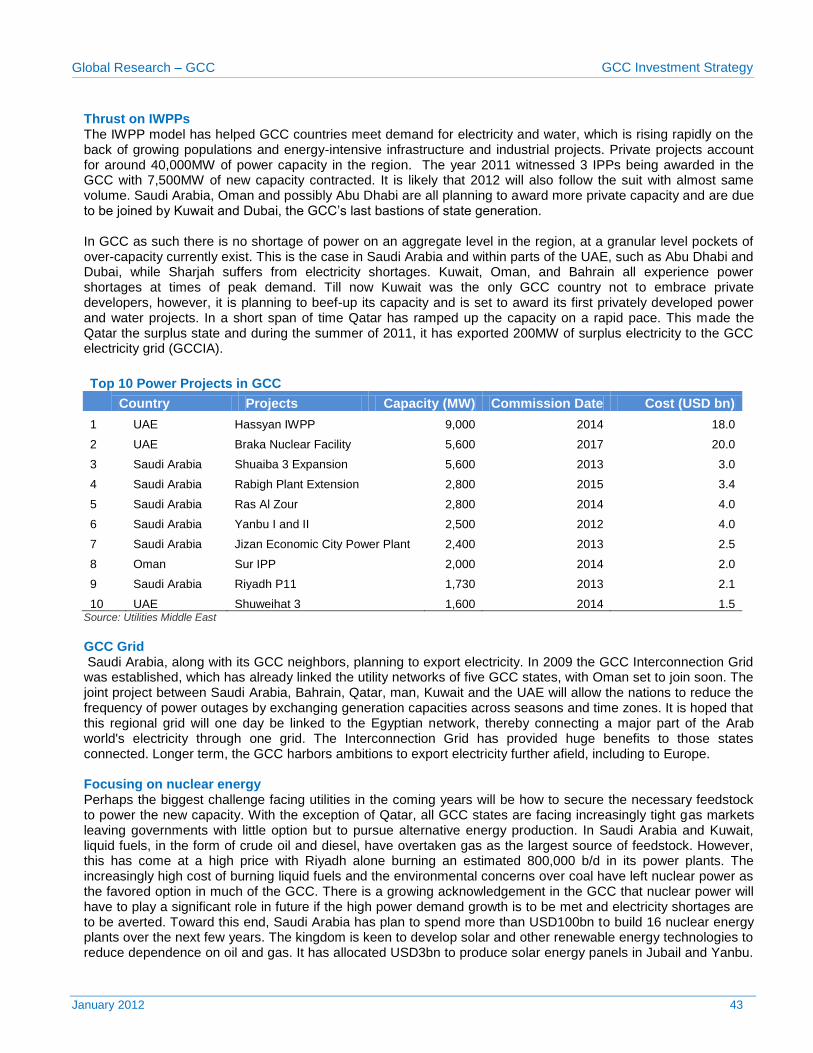
Global Research – GCC GCC Investment Strategy
January 2012 43
Thrust on IWPPs The IWPP model has helped GCC countries meet demand for electricity and water, which is rising rapidly on the back of growing populations and energy-intensive infrastructure and industrial projects. Private projects account for around 40,000MW of power capacity in the region. The year 2011 witnessed 3 IPPs being awarded in the GCC with 7,500MW of new capacity contracted. It is likely that 2012 will also follow the suit with almost same volume. Saudi Arabia, Oman and possibly Abu Dhabi are all planning to award more private capacity and are due to be joined by Kuwait and Dubai, the GCC’s last bastions of state generation. In GCC as such there is no shortage of power on an aggregate level in the region, at a granular level pockets of over-capacity currently exist. This is the case in Saudi Arabia and within parts of the UAE, such as Abu Dhabi and Dubai, while Sharjah suffers from electricity shortages. Kuwait, Oman, and Bahrain all experience power shortages at times of peak demand. Till now Kuwait was the only GCC country not to embrace private developers, however, it is planning to beef-up its capacity and is set to award its first privately developed power and water projects. In a short span of time Qatar has ramped up the capacity on a rapid pace. This made the Qatar the surplus state and during the summer of 2011, it has exported 200MW of surplus electricity to the GCC electricity grid (GCCIA).
Top 10 Power Projects in GCC
Country Projects Capacity (MW) Commission Date Cost (USD bn)
1 UAE Hassyan IWPP 9,000 2014 18.0
2 UAE Braka Nuclear Facility 5,600 2017 20.0
3 Saudi Arabia Shuaiba 3 Expansion 5,600 2013 3.0
4 Saudi Arabia Rabigh Plant Extension 2,800 2015 3.4
5 Saudi Arabia Ras Al Zour 2,800 2014 4.0
6 Saudi Arabia Yanbu I and II 2,500 2012 4.0
7 Saudi Arabia Jizan Economic City Power Plant 2,400 2013 2.5
8 Oman Sur IPP 2,000 2014 2.0
9 Saudi Arabia Riyadh P11 1,730 2013 2.1
10 UAE Shuweihat 3 1,600 2014 1.5 Source: Utilities Middle East
GCC Grid Saudi Arabia, along with its GCC neighbors, planning to export electricity. In 2009 the GCC Interconnection Grid was established, which has already linked the utility networks of five GCC states, with Oman set to join soon. The joint project between Saudi Arabia, Bahrain, Qatar, man, Kuwait and the UAE will allow the nations to reduce the frequency of power outages by exchanging generation capacities across seasons and time zones. It is hoped that this regional grid will one day be linked to the Egyptian network, thereby connecting a major part of the Arab world's electricity through one grid. The Interconnection Grid has provided huge benefits to those states connected. Longer term, the GCC harbors ambitions to export electricity further afield, including to Europe. Focusing on nuclear energy Perhaps the biggest challenge facing utilities in the coming years will be how to secure the necessary feedstock to power the new capacity. With the exception of Qatar, all GCC states are facing increasingly tight gas markets leaving governments with little option but to pursue alternative energy production. In Saudi Arabia and Kuwait, liquid fuels, in the form of crude oil and diesel, have overtaken gas as the largest source of feedstock. However, this has come at a high price with Riyadh alone burning an estimated 800,000 b/d in its power plants. The increasingly high cost of burning liquid fuels and the environmental concerns over coal have left nuclear power as the favored option in much of the GCC. There is a growing acknowledgement in the GCC that nuclear power will have to play a significant role in future if the high power demand growth is to be met and electricity shortages are to be averted. Toward this end, Saudi Arabia has plan to spend more than USD100bn to build 16 nuclear energy plants over the next few years. The kingdom is keen to develop solar and other renewable energy technologies to reduce dependence on oil and gas. It has allocated USD3bn to produce solar energy panels in Jubail and Yanbu.
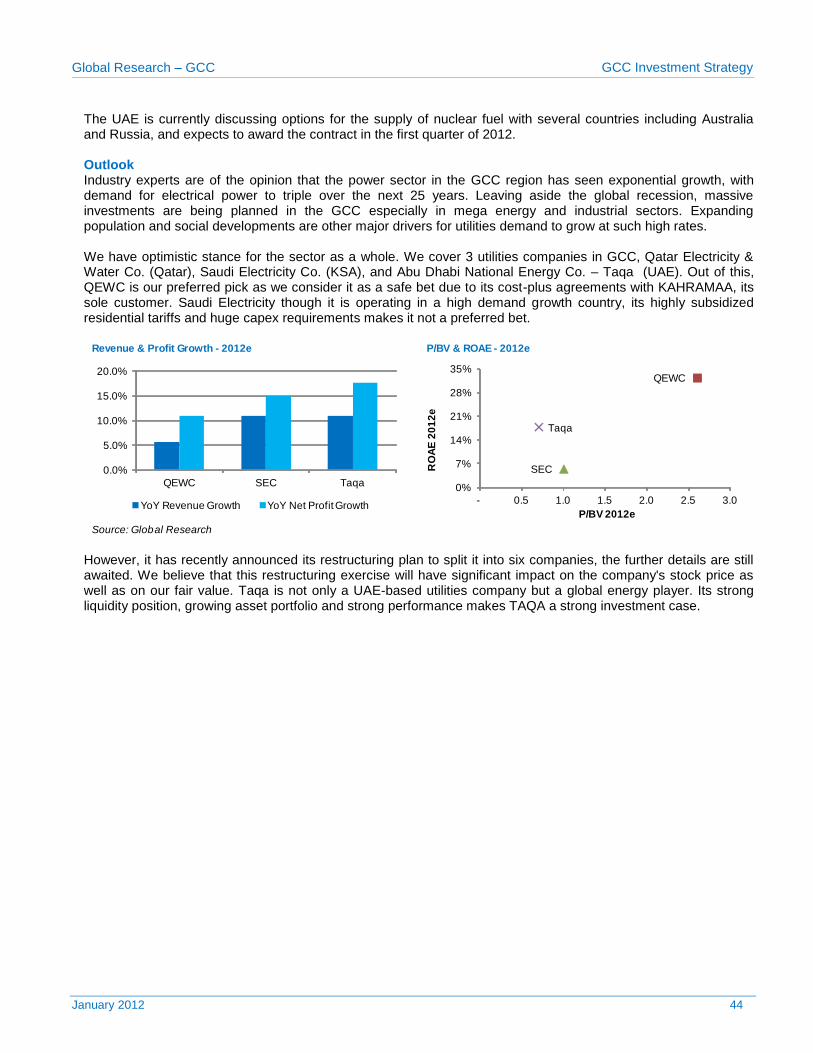
Global Research – GCC GCC Investment Strategy
January 2012 44
The UAE is currently discussing options for the supply of nuclear fuel with several countries including Australia and Russia, and expects to award the contract in the first quarter of 2012. Outlook Industry experts are of the opinion that the power sector in the GCC region has seen exponential growth, with demand for electrical power to triple over the next 25 years. Leaving aside the global recession, massive investments are being planned in the GCC especially in mega energy and industrial sectors. Expanding population and social developments are other major drivers for utilities demand to grow at such high rates. We have optimistic stance for the sector as a whole. We cover 3 utilities companies in GCC, Qatar Electricity & Water Co. (Qatar), Saudi Electricity Co. (KSA), and Abu Dhabi National Energy Co. – Taqa (UAE). Out of this, QEWC is our preferred pick as we consider it as a safe bet due to its cost-plus agreements with KAHRAMAA, its sole customer. Saudi Electricity though it is operating in a high demand growth country, its highly subsidized residential tariffs and huge capex requirements makes it not a preferred bet.
However, it has recently announced its restructuring plan to split it into six companies, the further details are still awaited. We believe that this restructuring exercise will have significant impact on the company's stock price as well as on our fair value. Taqa is not only a UAE-based utilities company but a global energy player. Its strong liquidity position, growing asset portfolio and strong performance makes TAQA a strong investment case.
Revenue & Profit Growth - 2012e P/BV & ROAE - 2012e
Source: Global Research
QEWC
SEC
Taqa
0%
7%
14%
21%
28%
35%
- 0.5 1.0 1.5 2.0 2.5 3.0
RO
AE
20
12
e
P/BV 2012e
0.0%
5.0%
10.0%
15.0%
20.0%
QEWC SEC Taqa
YoY Revenue Growth YoY Net Profit Growth
Global Research – GCC GCC Investment Strategy
January 2012 45
COMPANY PROFILES
Global Research – GCC GCC Investment Strategy
January 2012 46
AVIATION & LOGISTICS
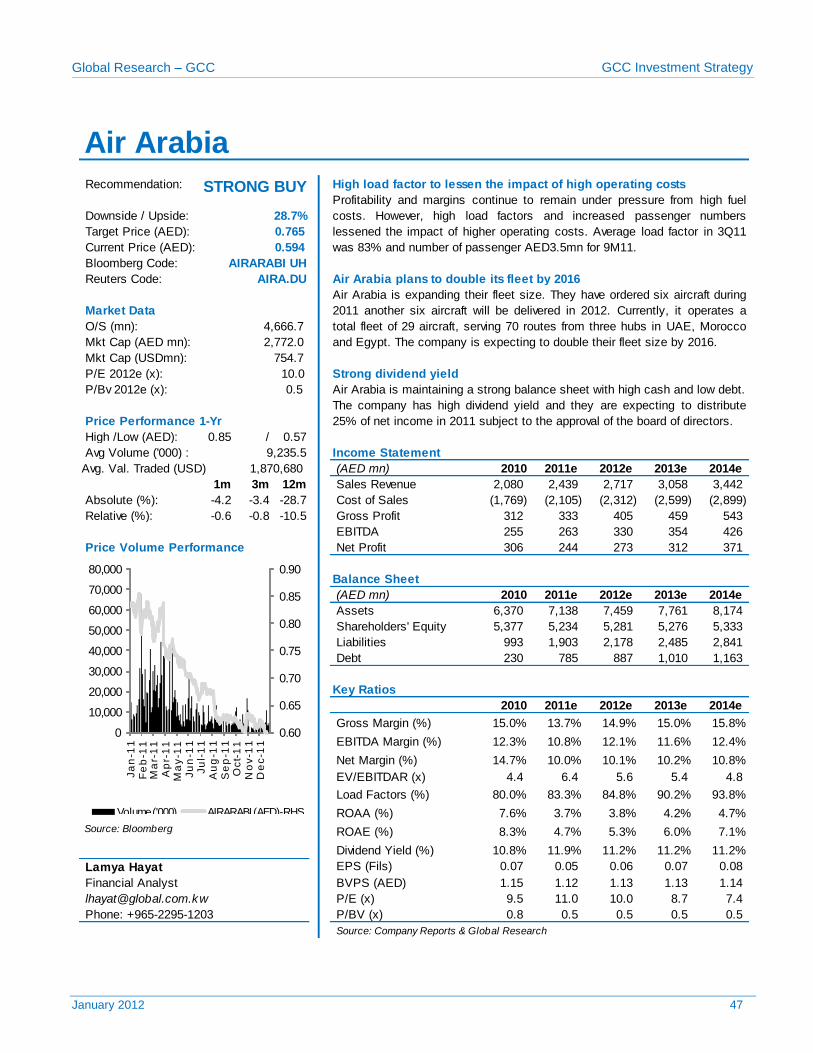
Global Research – GCC GCC Investment Strategy
January 2012 47
Recommendation: High load factor to lessen the impact of high operating costs
Bloomberg Code:
Reuters Code: Air Arabia plans to double its fleet by 2016
O/S (mn):
Mkt Cap (USDmn):
P/E 2012e (x): Strong dividend yield
P/Bv 2012e (x):
High /Low (AED): 0.85 / 0.57
Avg Volume ('000) :
(AED mn) 2010 2011e 2012e 2013e 2014e
1m 3m 12m Sales Revenue 2,080 2,439 2,717 3,058 3,442
Absolute (%): -4.2 -3.4 -28.7 Cost of Sales (1,769) (2,105) (2,312) (2,599) (2,899)
Relative (%): -0.6 -0.8 -10.5 Gross Profit 312 333 405 459 543
EBITDA 255 263 330 354 426
Price Volume Performance Net Profit 306 244 273 312 371
Balance Sheet
(AED mn) 2010 2011e 2012e 2013e 2014e
Assets 6,370 7,138 7,459 7,761 8,174
Shareholders' Equity 5,377 5,234 5,281 5,276 5,333
Liabilities 993 1,903 2,178 2,485 2,841
Debt 230 785 887 1,010 1,163
Key Ratios
2010 2011e 2012e 2013e 2014e
Gross Margin (%) 15.0% 13.7% 14.9% 15.0% 15.8%
EBITDA Margin (%) 12.3% 10.8% 12.1% 11.6% 12.4%
Net Margin (%) 14.7% 10.0% 10.1% 10.2% 10.8%
EV/EBITDAR (x) 4.4 6.4 5.6 5.4 4.8
Load Factors (%) 80.0% 83.3% 84.8% 90.2% 93.8%
ROAA (%) 7.6% 3.7% 3.8% 4.2% 4.7%
Source: Bloomberg ROAE (%) 8.3% 4.7% 5.3% 6.0% 7.1%
Dividend Yield (%) 10.8% 11.9% 11.2% 11.2% 11.2%
Lamya Hayat EPS (Fils) 0.07 0.05 0.06 0.07 0.08
BVPS (AED) 1.15 1.12 1.13 1.13 1.14
P/E (x) 9.5 11.0 10.0 8.7 7.4
P/BV (x) 0.8 0.5 0.5 0.5 0.5
Source: Company Reports & Global Research
Phone: +965-2295-1203
754.7
10.0
0.5 Air Arabia is maintaining a strong balance sheet with high cash and low debt.
The company has high dividend yield and they are expecting to distribute
25% of net income in 2011 subject to the approval of the board of directors. Price Performance 1-Yr
9,235.5 Income Statement
Financial Analyst
1,870,680 Avg. Val. Traded (USD)
AIRARABI UH
AIRA.DU
Air Arabia is expanding their fleet size. They have ordered six aircraft during
2011 another six aircraft will be delivered in 2012. Currently, it operates a
total fleet of 29 aircraft, serving 70 routes from three hubs in UAE, Morocco
and Egypt. The company is expecting to double their fleet size by 2016.
Market Data
4,666.7
Mkt Cap (AED mn): 2,772.0
Air Arabia
STRONG BUY Profitability and margins continue to remain under pressure from high fuel
costs. However, high load factors and increased passenger numbers
lessened the impact of higher operating costs. Average load factor in 3Q11
was 83% and number of passenger AED3.5mn for 9M11.
Downside / Upside: 28.7%
Target Price (AED): 0.765
Current Price (AED): 0.594
0.60
0.65
0.70
0.75
0.80
0.85
0.90
0
10,000
20,000
30,000
40,000
50,000
60,000
70,000
80,000
Ja
n-1
1F
eb
-11
Ma
r-1
1A
pr-
11
Ma
y-1
1J
un
-11
Ju
l-1
1A
ug
-11
Se
p-1
1O
ct-
11
No
v-1
1D
ec
-11
Volume ('000) AIRARABI (AED)-RHS
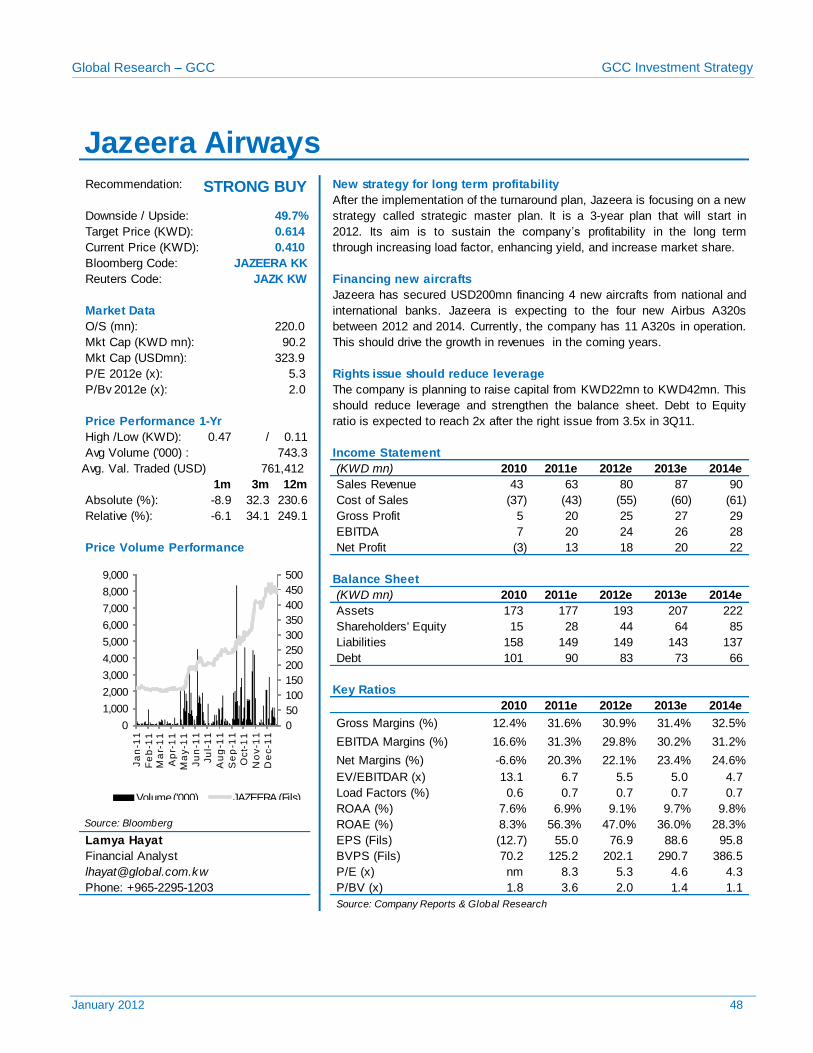
Global Research – GCC GCC Investment Strategy
January 2012 48
Recommendation: New strategy for long term profitability
Bloomberg Code:
Reuters Code: Financing new aircrafts
O/S (mn):
Mkt Cap (USDmn):
P/E 2012e (x): Rights issue should reduce leverage
P/Bv 2012e (x):
High /Low (KWD): 0.47 / 0.11
Avg Volume ('000) :
(KWD mn) 2010 2011e 2012e 2013e 2014e
1m 3m 12m Sales Revenue 43 63 80 87 90
Absolute (%): -8.9 32.3 230.6 Cost of Sales (37) (43) (55) (60) (61)
Relative (%): -6.1 34.1 249.1 Gross Profit 5 20 25 27 29
EBITDA 7 20 24 26 28
Price Volume Performance Net Profit (3) 13 18 20 22
Balance Sheet
(KWD mn) 2010 2011e 2012e 2013e 2014e
Assets 173 177 193 207 222
Shareholders' Equity 15 28 44 64 85
Liabilities 158 149 149 143 137
Debt 101 90 83 73 66
Key Ratios
2010 2011e 2012e 2013e 2014e
Gross Margins (%) 12.4% 31.6% 30.9% 31.4% 32.5%
EBITDA Margins (%) 16.6% 31.3% 29.8% 30.2% 31.2%
Net Margins (%) -6.6% 20.3% 22.1% 23.4% 24.6%
EV/EBITDAR (x) 13.1 6.7 5.5 5.0 4.7
Load Factors (%) 0.6 0.7 0.7 0.7 0.7
ROAA (%) 7.6% 6.9% 9.1% 9.7% 9.8% Source: Bloomberg ROAE (%) 8.3% 56.3% 47.0% 36.0% 28.3%
Lamya Hayat EPS (Fils) (12.7) 55.0 76.9 88.6 95.8
BVPS (Fils) 70.2 125.2 202.1 290.7 386.5
P/E (x) nm 8.3 5.3 4.6 4.3
P/BV (x) 1.8 3.6 2.0 1.4 1.1
Source: Company Reports & Global Research
Phone: +965-2295-1203
323.9
5.3
2.0 The company is planning to raise capital from KWD22mn to KWD42mn. This
should reduce leverage and strengthen the balance sheet. Debt to Equity
ratio is expected to reach 2x after the right issue from 3.5x in 3Q11. Price Performance 1-Yr
743.3 Income Statement
Financial Analyst
761,412 Avg. Val. Traded (USD)
JAZEERA KK
JAZK KW
Jazeera has secured USD200mn financing 4 new aircrafts from national and
international banks. Jazeera is expecting to the four new Airbus A320s
between 2012 and 2014. Currently, the company has 11 A320s in operation.
This should drive the growth in revenues in the coming years.
Market Data
220.0
90.2 Mkt Cap (KWD mn):
Jazeera Airways
After the implementation of the turnaround plan, Jazeera is focusing on a new
strategy called strategic master plan. It is a 3-year plan that will start in
2012. Its aim is to sustain the company’s profitability in the long term
through increasing load factor, enhancing yield, and increase market share.
Downside / Upside: 49.7%
0.614
0.410
Target Price (KWD):
Current Price (KWD):
STRONG BUY
0
50
100
150
200
250
300
350
400
450
500
0
1,000
2,000
3,000
4,000
5,000
6,000
7,000
8,000
9,000
Ja
n-1
1
Fe
b-1
1M
ar-
11
Ap
r-1
1
Ma
y-1
1
Ju
n-1
1
Ju
l-1
1
Au
g-1
1
Se
p-1
1
Oc
t-1
1
No
v-1
1
De
c-1
1
Volume ('000) JAZEERA (Fils)
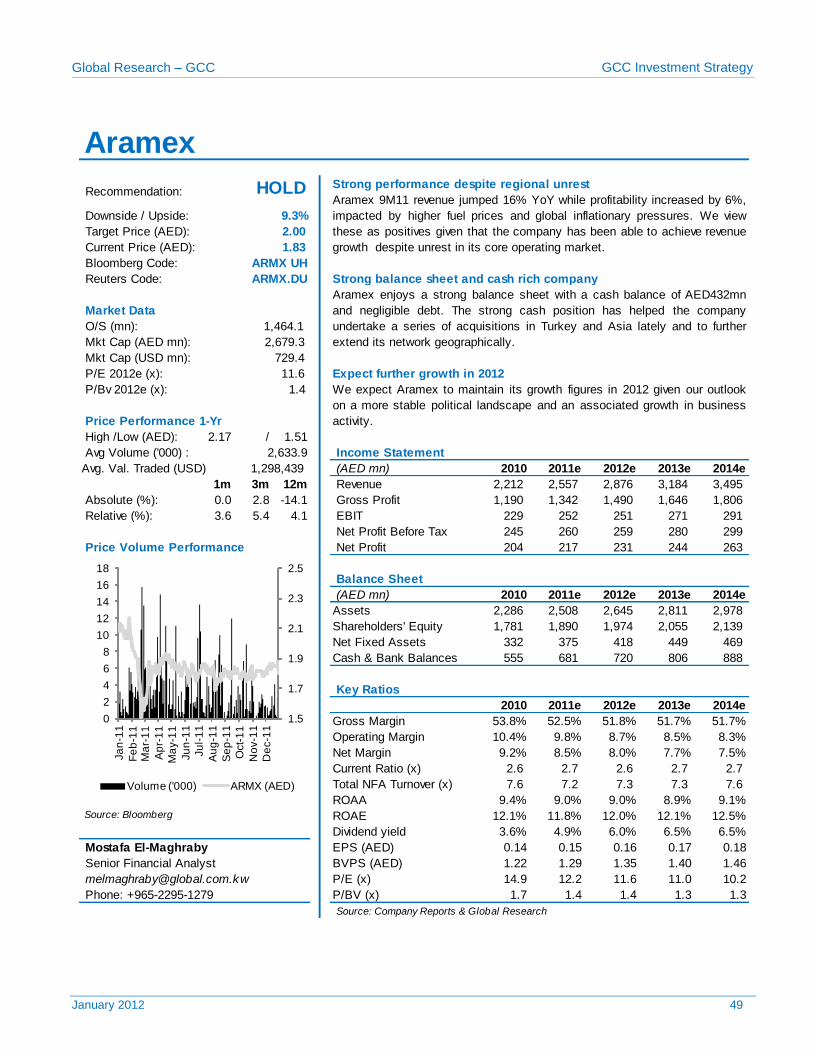
Global Research – GCC GCC Investment Strategy
January 2012 49
Strong performance despite regional unrest
Bloomberg Code:
Reuters Code: Strong balance sheet and cash rich company
O/S (mn):
Mkt Cap (USD mn):
P/E 2012e (x): Expect further growth in 2012
P/Bv 2012e (x):
High /Low (AED): 2.17 / 1.51
Avg Volume ('000) : Income Statement
(AED mn) 2010 2011e 2012e 2013e 2014e
1m 3m 12m Revenue 2,212 2,557 2,876 3,184 3,495
Absolute (%): 0.0 2.8 -14.1 Gross Profit 1,190 1,342 1,490 1,646 1,806
Relative (%): 3.6 5.4 4.1 EBIT 229 252 251 271 291
Net Profit Before Tax 245 260 259 280 299
Price Volume Performance Net Profit 204 217 231 244 263
Balance Sheet
(AED mn) 2010 2011e 2012e 2013e 2014e
Assets 2,286 2,508 2,645 2,811 2,978
Shareholders' Equity 1,781 1,890 1,974 2,055 2,139
Net Fixed Assets 332 375 418 449 469
Cash & Bank Balances 555 681 720 806 888
Key Ratios
2010 2011e 2012e 2013e 2014e
Gross Margin 53.8% 52.5% 51.8% 51.7% 51.7%
Operating Margin 10.4% 9.8% 8.7% 8.5% 8.3%
Net Margin 9.2% 8.5% 8.0% 7.7% 7.5%
Current Ratio (x) 2.6 2.7 2.6 2.7 2.7
Total NFA Turnover (x) 7.6 7.2 7.3 7.3 7.6
ROAA 9.4% 9.0% 9.0% 8.9% 9.1% Source: Bloomberg ROAE 12.1% 11.8% 12.0% 12.1% 12.5%
Dividend yield 3.6% 4.9% 6.0% 6.5% 6.5%
Mostafa El-Maghraby EPS (AED) 0.14 0.15 0.16 0.17 0.18
BVPS (AED) 1.22 1.29 1.35 1.40 1.46
P/E (x) 14.9 12.2 11.6 11.0 10.2
P/BV (x) 1.7 1.4 1.4 1.3 1.3
Source: Company Reports & Global Research
Phone: +965-2295-1279
Senior Financial Analyst
729.4
11.6
1.4 We expect Aramex to maintain its growth figures in 2012 given our outlook
on a more stable political landscape and an associated growth in business
activity. Price Performance 1-Yr
ARMX.DU
Aramex enjoys a strong balance sheet with a cash balance of AED432mn
and negligible debt. The strong cash position has helped the company
undertake a series of acquisitions in Turkey and Asia lately and to further
extend its network geographically.
Market Data
1,464.1
1,298,439 Avg. Val. Traded (USD)
2,679.3 Mkt Cap (AED mn):
Aramex
Recommendation: HOLD Aramex 9M11 revenue jumped 16% YoY while profitability increased by 6%,
impacted by higher fuel prices and global inflationary pressures. We view
these as positives given that the company has been able to achieve revenue
growth despite unrest in its core operating market.
Downside / Upside: 9.3%
Target Price (AED): 2.00
Current Price (AED): 1.83
2,633.9
ARMX UH
1.5
1.7
1.9
2.1
2.3
2.5
0
2
4
6
8
10
12
14
16
18
Ja
n-1
1
Fe
b-1
1M
ar-
11
Ap
r-1
1
Ma
y-1
1
Ju
n-1
1
Ju
l-1
1
Au
g-1
1
Se
p-1
1
Oct-
11
No
v-1
1
De
c-1
1
Volume ('000) ARMX (AED)
Global Research – GCC GCC Investment Strategy
January 2012 50
BANKING SECTOR
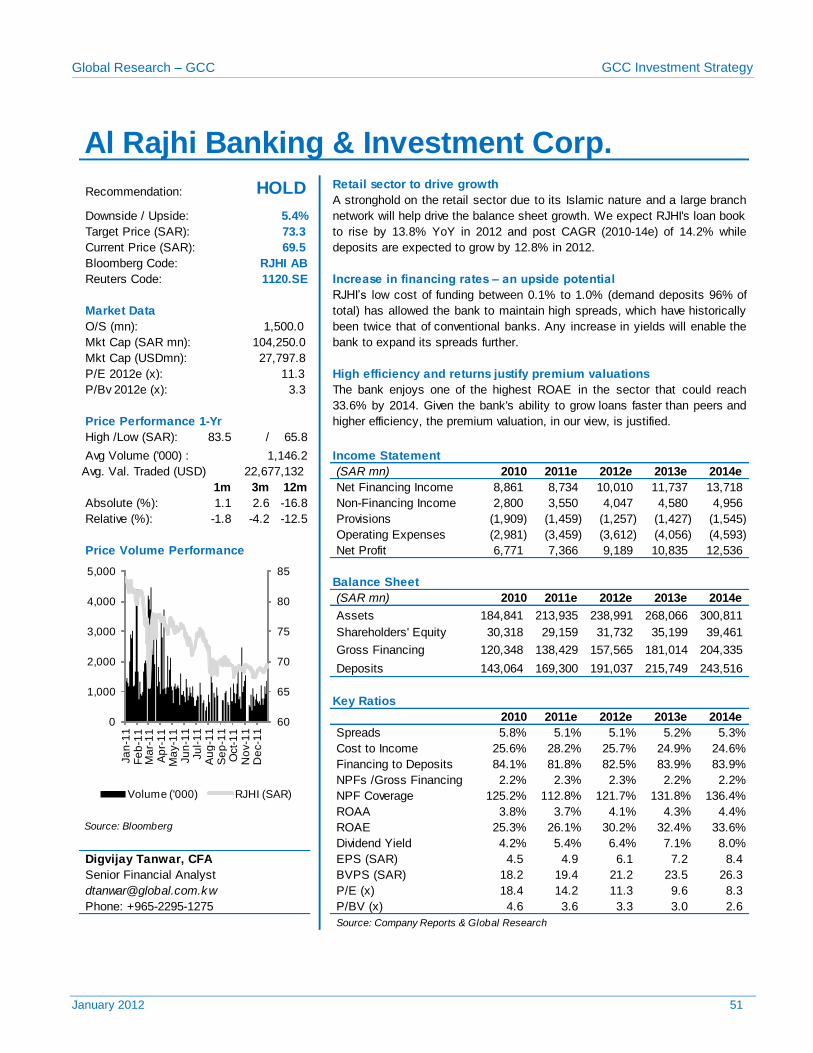
Global Research – GCC GCC Investment Strategy
January 2012 51
Retail sector to drive growth
Bloomberg Code:
Reuters Code: Increase in financing rates – an upside potential
O/S (mn):
Mkt Cap (USDmn):
P/E 2012e (x): High efficiency and returns justify premium valuations
P/Bv 2012e (x):
High /Low (SAR): 83.5 / 65.8
Avg Volume ('000) :
(SAR mn) 2010 2011e 2012e 2013e 2014e
1m 3m 12m Net Financing Income 8,861 8,734 10,010 11,737 13,718
Absolute (%): 1.1 2.6 -16.8 Non-Financing Income 2,800 3,550 4,047 4,580 4,956
Relative (%): -1.8 -4.2 -12.5 Provisions (1,909) (1,459) (1,257) (1,427) (1,545)
Operating Expenses (2,981) (3,459) (3,612) (4,056) (4,593)
Price Volume Performance Net Profit 6,771 7,366 9,189 10,835 12,536
Balance Sheet
(SAR mn) 2010 2011e 2012e 2013e 2014e
Assets 184,841 213,935 238,991 268,066 300,811
Shareholders' Equity 30,318 29,159 31,732 35,199 39,461
Gross Financing 120,348 138,429 157,565 181,014 204,335
Deposits 143,064 169,300 191,037 215,749 243,516
Key Ratios
2010 2011e 2012e 2013e 2014e
Spreads 5.8% 5.1% 5.1% 5.2% 5.3%
Cost to Income 25.6% 28.2% 25.7% 24.9% 24.6%
Financing to Deposits 84.1% 81.8% 82.5% 83.9% 83.9%
NPFs /Gross Financing 2.2% 2.3% 2.3% 2.2% 2.2%
NPF Coverage 125.2% 112.8% 121.7% 131.8% 136.4%
ROAA 3.8% 3.7% 4.1% 4.3% 4.4% Source: Bloomberg ROAE 25.3% 26.1% 30.2% 32.4% 33.6%
Dividend Yield 4.2% 5.4% 6.4% 7.1% 8.0%
Digvijay Tanwar, CFA EPS (SAR) 4.5 4.9 6.1 7.2 8.4
BVPS (SAR) 18.2 19.4 21.2 23.5 26.3
P/E (x) 18.4 14.2 11.3 9.6 8.3
P/BV (x) 4.6 3.6 3.3 3.0 2.6
Source: Company Reports & Global Research
Phone: +965-2295-1275
Senior Financial Analyst
Income Statement
RJHI AB
1120.SE
RJHI’s low cost of funding between 0.1% to 1.0% (demand deposits 96% of
total) has allowed the bank to maintain high spreads, which have historically
been twice that of conventional banks. Any increase in yields will enable the
bank to expand its spreads further.
Market Data
1,500.0
27,797.8
11.3
3.3 The bank enjoys one of the highest ROAE in the sector that could reach
33.6% by 2014. Given the bank's ability to grow loans faster than peers and
higher efficiency, the premium valuation, in our view, is justified. Price Performance 1-Yr
Al Rajhi Banking & Investment Corp.
Recommendation: HOLD A stronghold on the retail sector due to its Islamic nature and a large branch
network will help drive the balance sheet growth. We expect RJHI's loan book
to rise by 13.8% YoY in 2012 and post CAGR (2010-14e) of 14.2% while
deposits are expected to grow by 12.8% in 2012.
Downside / Upside: 5.4%
73.3
69.5
22,677,132 Avg. Val. Traded (USD)
Target Price (SAR):
Current Price (SAR):
104,250.0 Mkt Cap (SAR mn):
1,146.2
60
65
70
75
80
85
0
1,000
2,000
3,000
4,000
5,000
Ja
n-1
1F
eb
-11
Ma
r-1
1A
pr-
11
Ma
y-1
1Ju
n-1
1Ju
l-1
1A
ug
-11
Se
p-1
1O
ct-
11
No
v-1
1D
ec-1
1
Volume ('000) RJHI (SAR)
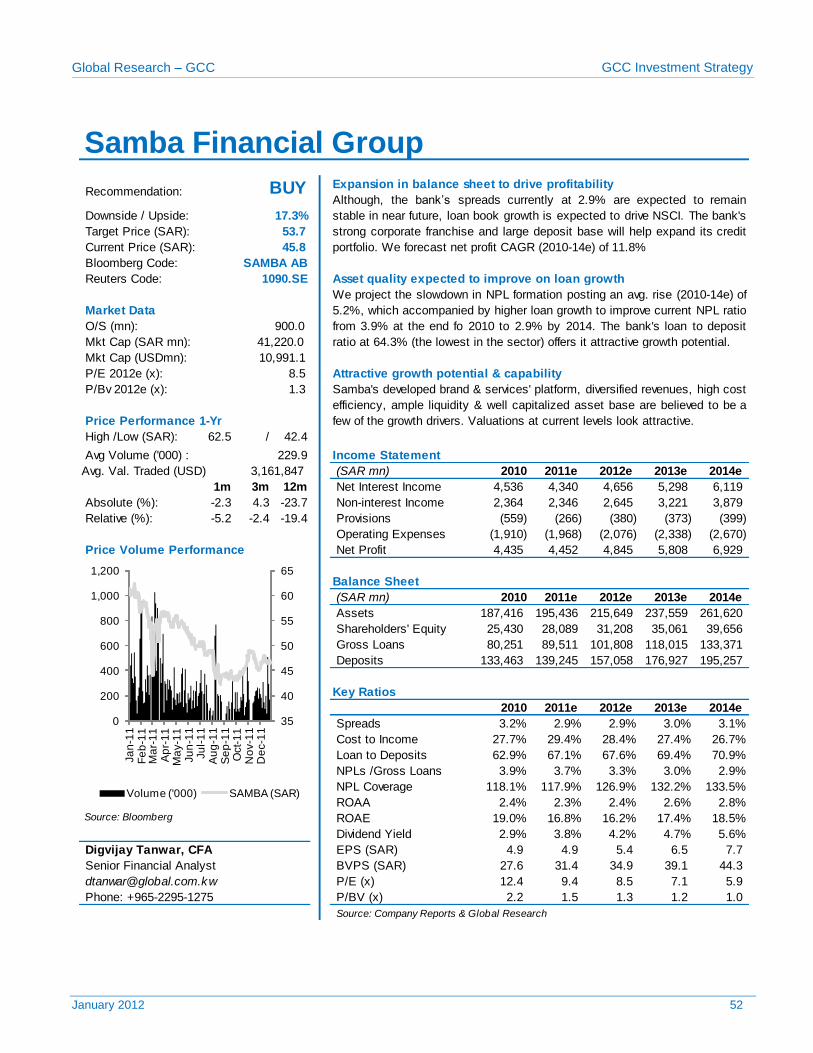
Global Research – GCC GCC Investment Strategy
January 2012 52
Expansion in balance sheet to drive profitability
Bloomberg Code:
Reuters Code: Asset quality expected to improve on loan growth
O/S (mn):
Mkt Cap (USDmn):
P/E 2012e (x): Attractive growth potential & capability
P/Bv 2012e (x):
High /Low (SAR): 62.5 / 42.4
Avg Volume ('000) :
(SAR mn) 2010 2011e 2012e 2013e 2014e
1m 3m 12m Net Interest Income 4,536 4,340 4,656 5,298 6,119
Absolute (%): -2.3 4.3 -23.7 Non-interest Income 2,364 2,346 2,645 3,221 3,879
Relative (%): -5.2 -2.4 -19.4 Provisions (559) (266) (380) (373) (399)
Operating Expenses (1,910) (1,968) (2,076) (2,338) (2,670)
Price Volume Performance Net Profit 4,435 4,452 4,845 5,808 6,929
Balance Sheet
(SAR mn) 2010 2011e 2012e 2013e 2014e
Assets 187,416 195,436 215,649 237,559 261,620
Shareholders' Equity 25,430 28,089 31,208 35,061 39,656
Gross Loans 80,251 89,511 101,808 118,015 133,371
Deposits 133,463 139,245 157,058 176,927 195,257
Key Ratios
2010 2011e 2012e 2013e 2014e
Spreads 3.2% 2.9% 2.9% 3.0% 3.1%
Cost to Income 27.7% 29.4% 28.4% 27.4% 26.7%
Loan to Deposits 62.9% 67.1% 67.6% 69.4% 70.9%
NPLs /Gross Loans 3.9% 3.7% 3.3% 3.0% 2.9%
NPL Coverage 118.1% 117.9% 126.9% 132.2% 133.5%
ROAA 2.4% 2.3% 2.4% 2.6% 2.8% Source: Bloomberg ROAE 19.0% 16.8% 16.2% 17.4% 18.5%
Dividend Yield 2.9% 3.8% 4.2% 4.7% 5.6%
Digvijay Tanwar, CFA EPS (SAR) 4.9 4.9 5.4 6.5 7.7
BVPS (SAR) 27.6 31.4 34.9 39.1 44.3
P/E (x) 12.4 9.4 8.5 7.1 5.9
P/BV (x) 2.2 1.5 1.3 1.2 1.0
Source: Company Reports & Global Research
Phone: +965-2295-1275
Senior Financial Analyst
Income Statement
SAMBA AB
1090.SE
We project the slowdown in NPL formation posting an avg. rise (2010-14e) of
5.2%, which accompanied by higher loan growth to improve current NPL ratio
from 3.9% at the end fo 2010 to 2.9% by 2014. The bank's loan to deposit
ratio at 64.3% (the lowest in the sector) offers it attractive growth potential.
Market Data
900.0
10,991.1
8.5
1.3 Samba's developed brand & services' platform, diversified revenues, high cost
efficiency, ample liquidity & well capitalized asset base are believed to be a
few of the growth drivers. Valuations at current levels look attractive. Price Performance 1-Yr
Samba Financial Group
Recommendation: BUY Although, the bank’s spreads currently at 2.9% are expected to remain
stable in near future, loan book growth is expected to drive NSCI. The bank's
strong corporate franchise and large deposit base will help expand its credit
portfolio. We forecast net profit CAGR (2010-14e) of 11.8%
Downside / Upside: 17.3%
53.7
45.8
3,161,847 Avg. Val. Traded (USD)
Target Price (SAR):
Current Price (SAR):
41,220.0 Mkt Cap (SAR mn):
229.9
35
40
45
50
55
60
65
0
200
400
600
800
1,000
1,200
Ja
n-1
1F
eb
-11
Ma
r-1
1A
pr-
11
Ma
y-1
1Ju
n-1
1Ju
l-1
1A
ug
-11
Se
p-1
1O
ct-
11
No
v-1
1D
ec-1
1
Volume ('000) SAMBA (SAR)
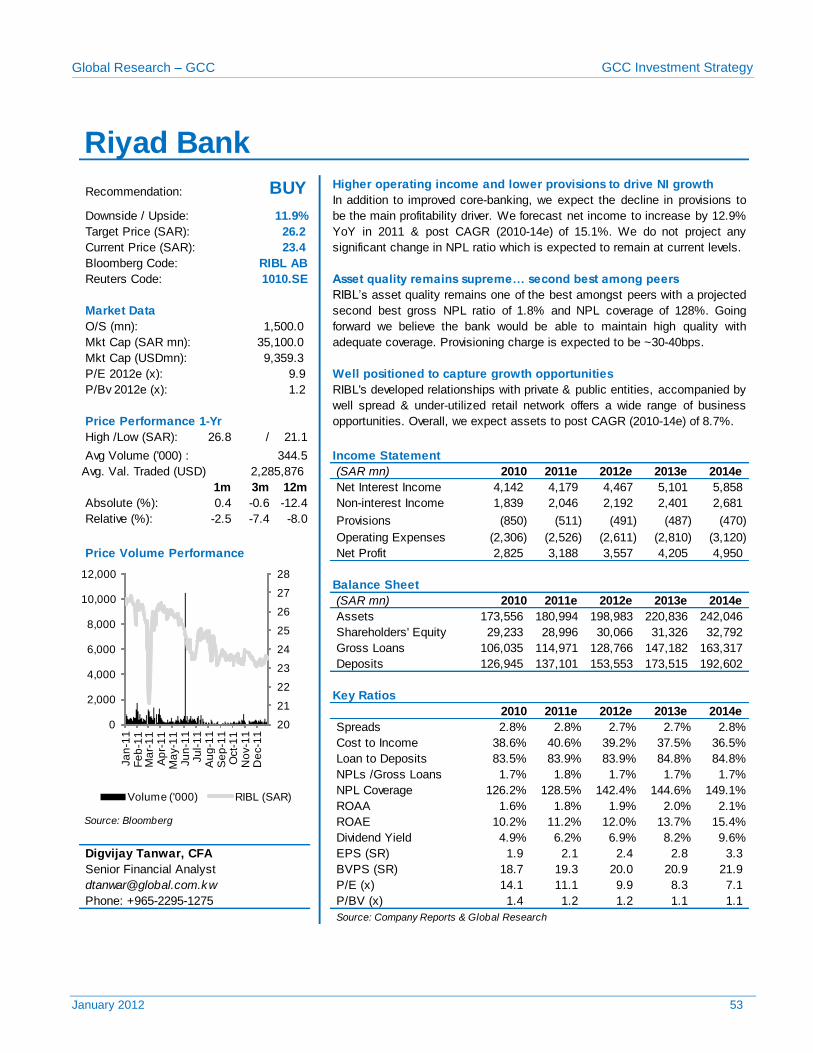
Global Research – GCC GCC Investment Strategy
January 2012 53
Higher operating income and lower provisions to drive NI growth
Bloomberg Code:
Reuters Code: Asset quality remains supreme… second best among peers
O/S (mn):
Mkt Cap (USDmn):
P/E 2012e (x): Well positioned to capture growth opportunities
P/Bv 2012e (x):
High /Low (SAR): 26.8 / 21.1
Avg Volume ('000) :
(SAR mn) 2010 2011e 2012e 2013e 2014e
1m 3m 12m Net Interest Income 4,142 4,179 4,467 5,101 5,858
Absolute (%): 0.4 -0.6 -12.4 Non-interest Income 1,839 2,046 2,192 2,401 2,681
Relative (%): -2.5 -7.4 -8.0 Provisions (850) (511) (491) (487) (470)
Operating Expenses (2,306) (2,526) (2,611) (2,810) (3,120)
Price Volume Performance Net Profit 2,825 3,188 3,557 4,205 4,950
Balance Sheet
(SAR mn) 2010 2011e 2012e 2013e 2014e
Assets 173,556 180,994 198,983 220,836 242,046
Shareholders' Equity 29,233 28,996 30,066 31,326 32,792
Gross Loans 106,035 114,971 128,766 147,182 163,317
Deposits 126,945 137,101 153,553 173,515 192,602
Key Ratios
2010 2011e 2012e 2013e 2014e
Spreads 2.8% 2.8% 2.7% 2.7% 2.8%
Cost to Income 38.6% 40.6% 39.2% 37.5% 36.5%
Loan to Deposits 83.5% 83.9% 83.9% 84.8% 84.8%
NPLs /Gross Loans 1.7% 1.8% 1.7% 1.7% 1.7%
NPL Coverage 126.2% 128.5% 142.4% 144.6% 149.1%
ROAA 1.6% 1.8% 1.9% 2.0% 2.1% Source: Bloomberg ROAE 10.2% 11.2% 12.0% 13.7% 15.4%
Dividend Yield 4.9% 6.2% 6.9% 8.2% 9.6%
Digvijay Tanwar, CFA EPS (SR) 1.9 2.1 2.4 2.8 3.3
BVPS (SR) 18.7 19.3 20.0 20.9 21.9
P/E (x) 14.1 11.1 9.9 8.3 7.1
P/BV (x) 1.4 1.2 1.2 1.1 1.1
Source: Company Reports & Global Research
Phone: +965-2295-1275
Senior Financial Analyst
Income Statement
RIBL AB
1010.SE
RIBL’s asset quality remains one of the best amongst peers with a projected
second best gross NPL ratio of 1.8% and NPL coverage of 128%. Going
forward we believe the bank would be able to maintain high quality with
adequate coverage. Provisioning charge is expected to be ~30-40bps.
Market Data
1,500.0
9,359.3
9.9
1.2 RIBL's developed relationships with private & public entities, accompanied by
well spread & under-utilized retail network offers a wide range of business
opportunities. Overall, we expect assets to post CAGR (2010-14e) of 8.7%. Price Performance 1-Yr
Riyad Bank
Recommendation: BUY In addition to improved core-banking, we expect the decline in provisions to
be the main profitability driver. We forecast net income to increase by 12.9%
YoY in 2011 & post CAGR (2010-14e) of 15.1%. We do not project any
significant change in NPL ratio which is expected to remain at current levels.
Downside / Upside: 11.9%
26.2
23.4
2,285,876 Avg. Val. Traded (USD)
Target Price (SAR):
Current Price (SAR):
35,100.0 Mkt Cap (SAR mn):
344.5
20
21
22
23
24
25
26
27
28
0
2,000
4,000
6,000
8,000
10,000
12,000
Ja
n-1
1F
eb
-11
Ma
r-1
1A
pr-
11
Ma
y-1
1Ju
n-1
1Ju
l-1
1A
ug
-11
Se
p-1
1O
ct-
11
No
v-1
1D
ec-1
1
Volume ('000) RIBL (SAR)
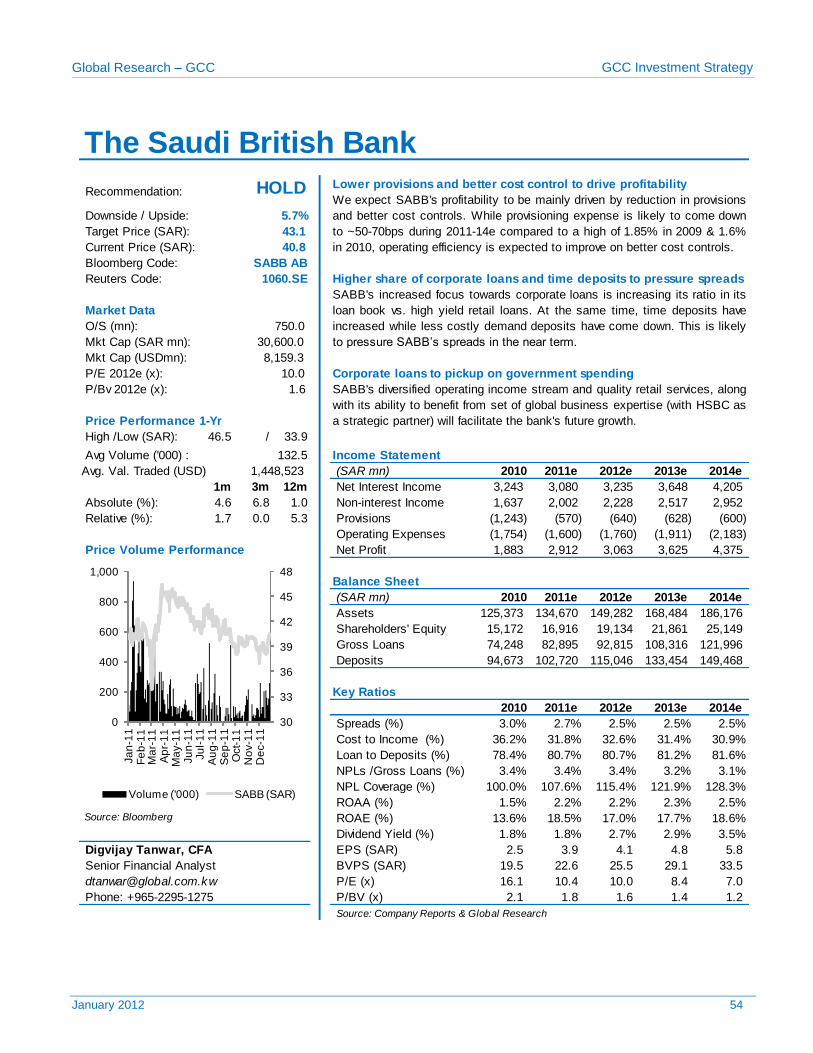
Global Research – GCC GCC Investment Strategy
January 2012 54
Lower provisions and better cost control to drive profitability
Bloomberg Code:
Reuters Code: Higher share of corporate loans and time deposits to pressure spreads
O/S (mn):
Mkt Cap (USDmn):
P/E 2012e (x): Corporate loans to pickup on government spending
P/Bv 2012e (x):
High /Low (SAR): 46.5 / 33.9
Avg Volume ('000) :
(SAR mn) 2010 2011e 2012e 2013e 2014e
1m 3m 12m Net Interest Income 3,243 3,080 3,235 3,648 4,205
Absolute (%): 4.6 6.8 1.0 Non-interest Income 1,637 2,002 2,228 2,517 2,952
Relative (%): 1.7 0.0 5.3 Provisions (1,243) (570) (640) (628) (600)
Operating Expenses (1,754) (1,600) (1,760) (1,911) (2,183)
Price Volume Performance Net Profit 1,883 2,912 3,063 3,625 4,375
Balance Sheet
(SAR mn) 2010 2011e 2012e 2013e 2014e
Assets 125,373 134,670 149,282 168,484 186,176
Shareholders' Equity 15,172 16,916 19,134 21,861 25,149
Gross Loans 74,248 82,895 92,815 108,316 121,996
Deposits 94,673 102,720 115,046 133,454 149,468
Key Ratios
2010 2011e 2012e 2013e 2014e
Spreads (%) 3.0% 2.7% 2.5% 2.5% 2.5%
Cost to Income (%) 36.2% 31.8% 32.6% 31.4% 30.9%
Loan to Deposits (%) 78.4% 80.7% 80.7% 81.2% 81.6%
NPLs /Gross Loans (%) 3.4% 3.4% 3.4% 3.2% 3.1%
NPL Coverage (%) 100.0% 107.6% 115.4% 121.9% 128.3%
ROAA (%) 1.5% 2.2% 2.2% 2.3% 2.5% Source: Bloomberg ROAE (%) 13.6% 18.5% 17.0% 17.7% 18.6%
Dividend Yield (%) 1.8% 1.8% 2.7% 2.9% 3.5%
Digvijay Tanwar, CFA EPS (SAR) 2.5 3.9 4.1 4.8 5.8
BVPS (SAR) 19.5 22.6 25.5 29.1 33.5
P/E (x) 16.1 10.4 10.0 8.4 7.0
P/BV (x) 2.1 1.8 1.6 1.4 1.2
Source: Company Reports & Global Research
Phone: +965-2295-1275
Senior Financial Analyst
Income Statement
SABB AB
1060.SE
SABB's increased focus towards corporate loans is increasing its ratio in its
loan book vs. high yield retail loans. At the same time, time deposits have
increased while less costly demand deposits have come down. This is likely
to pressure SABB’s spreads in the near term.
Market Data
750.0
8,159.3
10.0
1.6 SABB's diversified operating income stream and quality retail services, along
with its ability to benefit from set of global business expertise (with HSBC as
a strategic partner) will facilitate the bank's future growth. Price Performance 1-Yr
The Saudi British Bank
Recommendation: HOLD We expect SABB's profitability to be mainly driven by reduction in provisions
and better cost controls. While provisioning expense is likely to come down
to ~50-70bps during 2011-14e compared to a high of 1.85% in 2009 & 1.6%
in 2010, operating efficiency is expected to improve on better cost controls.
Downside / Upside: 5.7%
43.1
40.8
1,448,523 Avg. Val. Traded (USD)
Target Price (SAR):
Current Price (SAR):
30,600.0 Mkt Cap (SAR mn):
132.5
30
33
36
39
42
45
48
0
200
400
600
800
1,000
Ja
n-1
1F
eb
-11
Ma
r-1
1A
pr-
11
Ma
y-1
1Ju
n-1
1Ju
l-1
1A
ug
-11
Se
p-1
1O
ct-
11
No
v-1
1D
ec-1
1
Volume ('000) SABB (SAR)
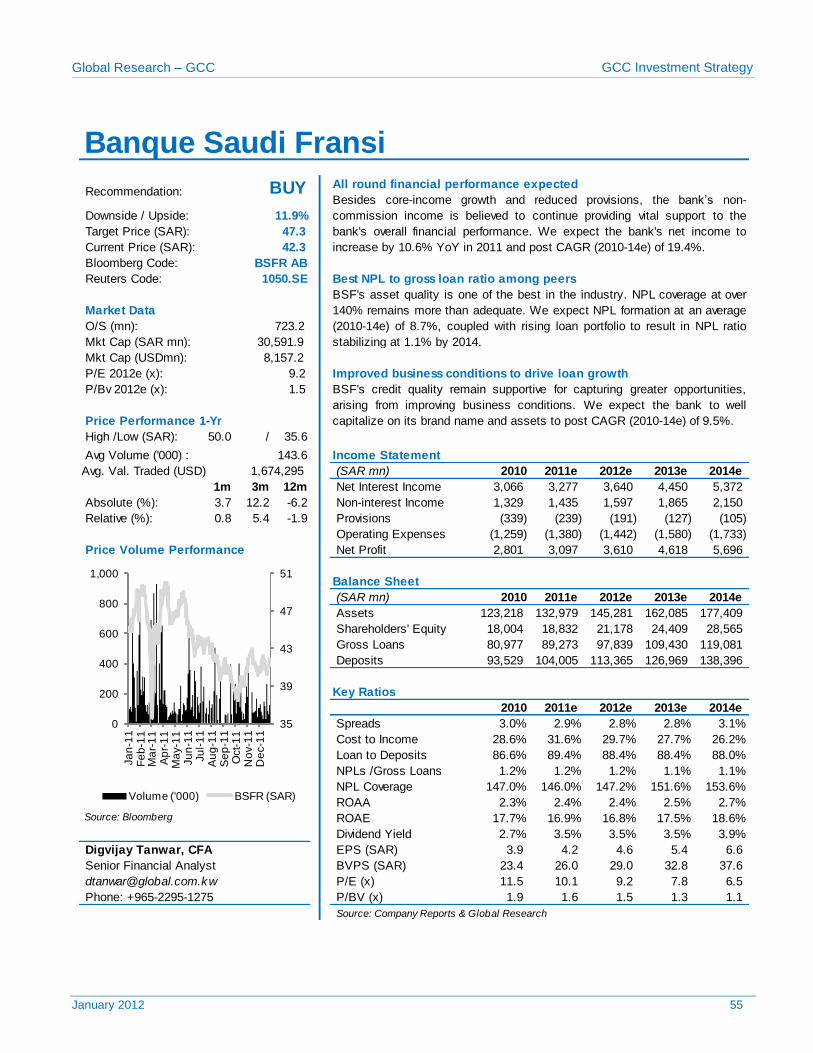
Global Research – GCC GCC Investment Strategy
January 2012 55
All round financial performance expected
Bloomberg Code:
Reuters Code: Best NPL to gross loan ratio among peers
O/S (mn):
Mkt Cap (USDmn):
P/E 2012e (x): Improved business conditions to drive loan growth
P/Bv 2012e (x):
High /Low (SAR): 50.0 / 35.6
Avg Volume ('000) :
(SAR mn) 2010 2011e 2012e 2013e 2014e
1m 3m 12m Net Interest Income 3,066 3,277 3,640 4,450 5,372
Absolute (%): 3.7 12.2 -6.2 Non-interest Income 1,329 1,435 1,597 1,865 2,150
Relative (%): 0.8 5.4 -1.9 Provisions (339) (239) (191) (127) (105)
Operating Expenses (1,259) (1,380) (1,442) (1,580) (1,733)
Price Volume Performance Net Profit 2,801 3,097 3,610 4,618 5,696
Balance Sheet
(SAR mn) 2010 2011e 2012e 2013e 2014e
Assets 123,218 132,979 145,281 162,085 177,409
Shareholders' Equity 18,004 18,832 21,178 24,409 28,565
Gross Loans 80,977 89,273 97,839 109,430 119,081
Deposits 93,529 104,005 113,365 126,969 138,396
Key Ratios
2010 2011e 2012e 2013e 2014e
Spreads 3.0% 2.9% 2.8% 2.8% 3.1%
Cost to Income 28.6% 31.6% 29.7% 27.7% 26.2%
Loan to Deposits 86.6% 89.4% 88.4% 88.4% 88.0%
NPLs /Gross Loans 1.2% 1.2% 1.2% 1.1% 1.1%
NPL Coverage 147.0% 146.0% 147.2% 151.6% 153.6%
ROAA 2.3% 2.4% 2.4% 2.5% 2.7% Source: Bloomberg ROAE 17.7% 16.9% 16.8% 17.5% 18.6%
Dividend Yield 2.7% 3.5% 3.5% 3.5% 3.9%
Digvijay Tanwar, CFA EPS (SAR) 3.9 4.2 4.6 5.4 6.6
BVPS (SAR) 23.4 26.0 29.0 32.8 37.6
P/E (x) 11.5 10.1 9.2 7.8 6.5
P/BV (x) 1.9 1.6 1.5 1.3 1.1
Source: Company Reports & Global Research
Phone: +965-2295-1275
Senior Financial Analyst
Income Statement
BSFR AB
1050.SE
BSF's asset quality is one of the best in the industry. NPL coverage at over
140% remains more than adequate. We expect NPL formation at an average
(2010-14e) of 8.7%, coupled with rising loan portfolio to result in NPL ratio
stabilizing at 1.1% by 2014.
Market Data
723.2
8,157.2
9.2
1.5 BSF's credit quality remain supportive for capturing greater opportunities,
arising from improving business conditions. We expect the bank to well
capitalize on its brand name and assets to post CAGR (2010-14e) of 9.5%. Price Performance 1-Yr
Banque Saudi Fransi
Recommendation: BUY Besides core-income growth and reduced provisions, the bank’s non-
commission income is believed to continue providing vital support to the
bank's overall financial performance. We expect the bank's net income to
increase by 10.6% YoY in 2011 and post CAGR (2010-14e) of 19.4%.
Downside / Upside: 11.9%
47.3
42.3
1,674,295 Avg. Val. Traded (USD)
Target Price (SAR):
Current Price (SAR):
30,591.9 Mkt Cap (SAR mn):
143.6
35
39
43
47
51
0
200
400
600
800
1,000
Ja
n-1
1F
eb
-11
Ma
r-1
1A
pr-
11
Ma
y-1
1Ju
n-1
1Ju
l-1
1A
ug
-11
Se
p-1
1O
ct-
11
No
v-1
1D
ec-1
1
Volume ('000) BSFR (SAR)
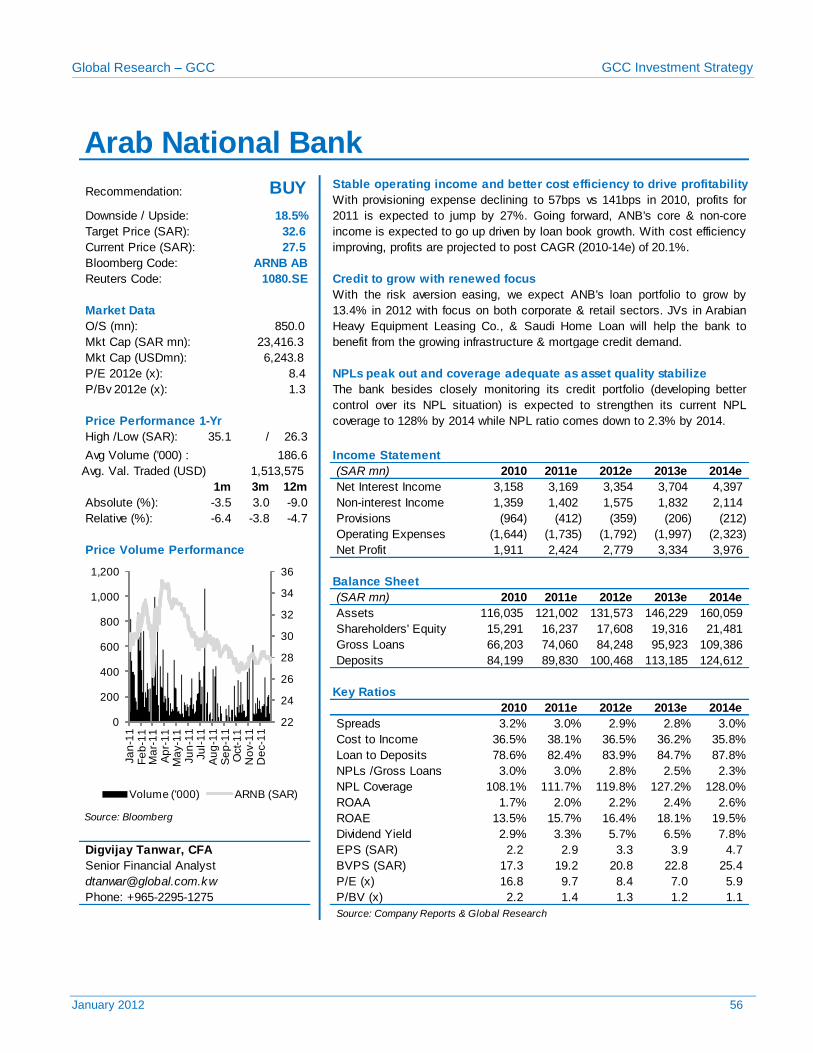
Global Research – GCC GCC Investment Strategy
January 2012 56
Stable operating income and better cost efficiency to drive profitability
Bloomberg Code:
Reuters Code: Credit to grow with renewed focus
O/S (mn):
Mkt Cap (USDmn):
P/E 2012e (x): NPLs peak out and coverage adequate as asset quality stabilize
P/Bv 2012e (x):
High /Low (SAR): 35.1 / 26.3
Avg Volume ('000) :
(SAR mn) 2010 2011e 2012e 2013e 2014e
1m 3m 12m Net Interest Income 3,158 3,169 3,354 3,704 4,397
Absolute (%): -3.5 3.0 -9.0 Non-interest Income 1,359 1,402 1,575 1,832 2,114
Relative (%): -6.4 -3.8 -4.7 Provisions (964) (412) (359) (206) (212)
Operating Expenses (1,644) (1,735) (1,792) (1,997) (2,323)
Price Volume Performance Net Profit 1,911 2,424 2,779 3,334 3,976
Balance Sheet
(SAR mn) 2010 2011e 2012e 2013e 2014e
Assets 116,035 121,002 131,573 146,229 160,059
Shareholders' Equity 15,291 16,237 17,608 19,316 21,481
Gross Loans 66,203 74,060 84,248 95,923 109,386
Deposits 84,199 89,830 100,468 113,185 124,612
Key Ratios
2010 2011e 2012e 2013e 2014e
Spreads 3.2% 3.0% 2.9% 2.8% 3.0%
Cost to Income 36.5% 38.1% 36.5% 36.2% 35.8%
Loan to Deposits 78.6% 82.4% 83.9% 84.7% 87.8%
NPLs /Gross Loans 3.0% 3.0% 2.8% 2.5% 2.3%
NPL Coverage 108.1% 111.7% 119.8% 127.2% 128.0%
ROAA 1.7% 2.0% 2.2% 2.4% 2.6% Source: Bloomberg ROAE 13.5% 15.7% 16.4% 18.1% 19.5%
Dividend Yield 2.9% 3.3% 5.7% 6.5% 7.8%
Digvijay Tanwar, CFA EPS (SAR) 2.2 2.9 3.3 3.9 4.7
BVPS (SAR) 17.3 19.2 20.8 22.8 25.4
P/E (x) 16.8 9.7 8.4 7.0 5.9
P/BV (x) 2.2 1.4 1.3 1.2 1.1
Source: Company Reports & Global Research
Phone: +965-2295-1275
Senior Financial Analyst
Income Statement
ARNB AB
1080.SE
With the risk aversion easing, we expect ANB's loan portfolio to grow by
13.4% in 2012 with focus on both corporate & retail sectors. JVs in Arabian
Heavy Equipment Leasing Co., & Saudi Home Loan will help the bank to
benefit from the growing infrastructure & mortgage credit demand.
Market Data
850.0
6,243.8
8.4
1.3 The bank besides closely monitoring its credit portfolio (developing better
control over its NPL situation) is expected to strengthen its current NPL
coverage to 128% by 2014 while NPL ratio comes down to 2.3% by 2014. Price Performance 1-Yr
Arab National Bank
Recommendation: BUY With provisioning expense declining to 57bps vs 141bps in 2010, profits for
2011 is expected to jump by 27%. Going forward, ANB's core & non-core
income is expected to go up driven by loan book growth. With cost efficiency
improving, profits are projected to post CAGR (2010-14e) of 20.1%.
Downside / Upside: 18.5%
32.6
27.5
1,513,575 Avg. Val. Traded (USD)
Target Price (SAR):
Current Price (SAR):
23,416.3 Mkt Cap (SAR mn):
186.6
22
24
26
28
30
32
34
36
0
200
400
600
800
1,000
1,200
Ja
n-1
1F
eb
-11
Ma
r-1
1A
pr-
11
Ma
y-1
1Ju
n-1
1Ju
l-1
1A
ug
-11
Se
p-1
1O
ct-
11
No
v-1
1D
ec-1
1
Volume ('000) ARNB (SAR)
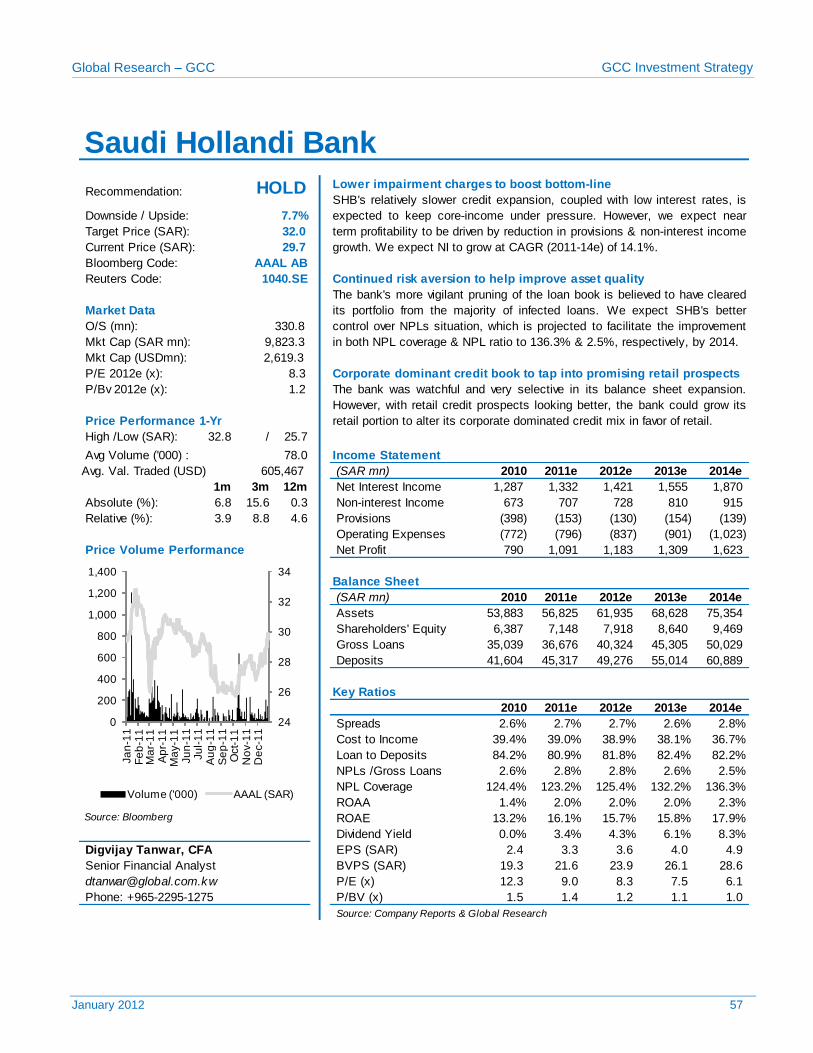
Global Research – GCC GCC Investment Strategy
January 2012 57
Lower impairment charges to boost bottom-line
Bloomberg Code:
Reuters Code: Continued risk aversion to help improve asset quality
O/S (mn):
Mkt Cap (USDmn):
P/E 2012e (x): Corporate dominant credit book to tap into promising retail prospects
P/Bv 2012e (x):
High /Low (SAR): 32.8 / 25.7
Avg Volume ('000) :
(SAR mn) 2010 2011e 2012e 2013e 2014e
1m 3m 12m Net Interest Income 1,287 1,332 1,421 1,555 1,870
Absolute (%): 6.8 15.6 0.3 Non-interest Income 673 707 728 810 915
Relative (%): 3.9 8.8 4.6 Provisions (398) (153) (130) (154) (139)
Operating Expenses (772) (796) (837) (901) (1,023)
Price Volume Performance Net Profit 790 1,091 1,183 1,309 1,623
Balance Sheet
(SAR mn) 2010 2011e 2012e 2013e 2014e
Assets 53,883 56,825 61,935 68,628 75,354
Shareholders' Equity 6,387 7,148 7,918 8,640 9,469
Gross Loans 35,039 36,676 40,324 45,305 50,029
Deposits 41,604 45,317 49,276 55,014 60,889
Key Ratios
2010 2011e 2012e 2013e 2014e
Spreads 2.6% 2.7% 2.7% 2.6% 2.8%
Cost to Income 39.4% 39.0% 38.9% 38.1% 36.7%
Loan to Deposits 84.2% 80.9% 81.8% 82.4% 82.2%
NPLs /Gross Loans 2.6% 2.8% 2.8% 2.6% 2.5%
NPL Coverage 124.4% 123.2% 125.4% 132.2% 136.3%
ROAA 1.4% 2.0% 2.0% 2.0% 2.3% Source: Bloomberg ROAE 13.2% 16.1% 15.7% 15.8% 17.9%
Dividend Yield 0.0% 3.4% 4.3% 6.1% 8.3%
Digvijay Tanwar, CFA EPS (SAR) 2.4 3.3 3.6 4.0 4.9
BVPS (SAR) 19.3 21.6 23.9 26.1 28.6
P/E (x) 12.3 9.0 8.3 7.5 6.1
P/BV (x) 1.5 1.4 1.2 1.1 1.0
Source: Company Reports & Global Research
Phone: +965-2295-1275
Senior Financial Analyst
Income Statement
AAAL AB
1040.SE
The bank's more vigilant pruning of the loan book is believed to have cleared
its portfolio from the majority of infected loans. We expect SHB's better
control over NPLs situation, which is projected to facilitate the improvement
in both NPL coverage & NPL ratio to 136.3% & 2.5%, respectively, by 2014.
Market Data
330.8
2,619.3
8.3
1.2 The bank was watchful and very selective in its balance sheet expansion.
However, with retail credit prospects looking better, the bank could grow its
retail portion to alter its corporate dominated credit mix in favor of retail. Price Performance 1-Yr
Saudi Hollandi Bank
Recommendation: HOLD SHB's relatively slower credit expansion, coupled with low interest rates, is
expected to keep core-income under pressure. However, we expect near
term profitability to be driven by reduction in provisions & non-interest income
growth. We expect NI to grow at CAGR (2011-14e) of 14.1%.
Downside / Upside: 7.7%
32.0
29.7
605,467 Avg. Val. Traded (USD)
Target Price (SAR):
Current Price (SAR):
9,823.3 Mkt Cap (SAR mn):
78.0
24
26
28
30
32
34
0
200
400
600
800
1,000
1,200
1,400
Ja
n-1
1F
eb
-11
Ma
r-1
1A
pr-
11
Ma
y-1
1Ju
n-1
1Ju
l-1
1A
ug
-11
Se
p-1
1O
ct-
11
No
v-1
1D
ec-1
1
Volume ('000) AAAL (SAR)
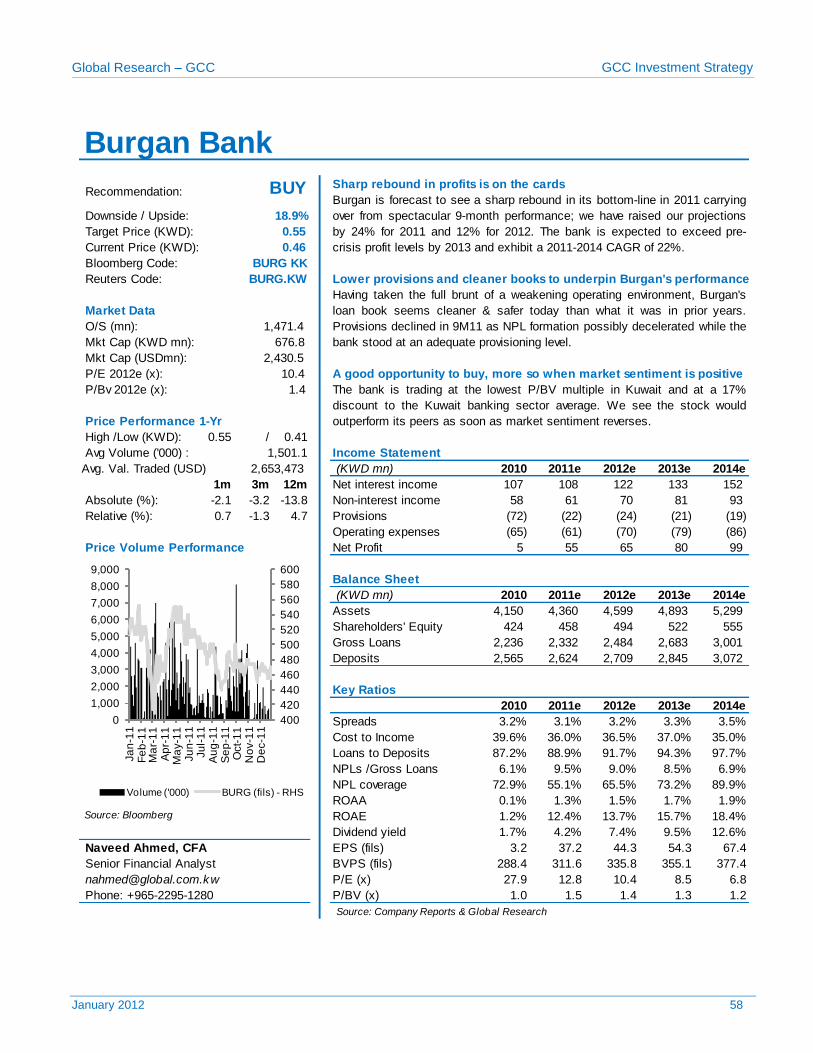
Global Research – GCC GCC Investment Strategy
January 2012 58
Sharp rebound in profits is on the cards
Bloomberg Code:
Reuters Code: Lower provisions and cleaner books to underpin Burgan's performance
O/S (mn):
Mkt Cap (USDmn):
P/E 2012e (x): A good opportunity to buy, more so when market sentiment is positive
P/Bv 2012e (x):
High /Low (KWD): 0.55 / 0.41
Avg Volume ('000) :
(KWD mn) 2010 2011e 2012e 2013e 2014e
1m 3m 12m Net interest income 107 108 122 133 152
Absolute (%): -2.1 -3.2 -13.8 Non-interest income 58 61 70 81 93
Relative (%): 0.7 -1.3 4.7 Provisions (72) (22) (24) (21) (19)
Operating expenses (65) (61) (70) (79) (86)
Price Volume Performance Net Profit 5 55 65 80 99
(KWD mn) 2010 2011e 2012e 2013e 2014e
Assets 4,150 4,360 4,599 4,893 5,299
Shareholders' Equity 424 458 494 522 555
Gross Loans 2,236 2,332 2,484 2,683 3,001
Deposits 2,565 2,624 2,709 2,845 3,072
2010 2011e 2012e 2013e 2014e
Spreads 3.2% 3.1% 3.2% 3.3% 3.5%
Cost to Income 39.6% 36.0% 36.5% 37.0% 35.0%
Loans to Deposits 87.2% 88.9% 91.7% 94.3% 97.7%
NPLs /Gross Loans 6.1% 9.5% 9.0% 8.5% 6.9%
NPL coverage 72.9% 55.1% 65.5% 73.2% 89.9%
ROAA 0.1% 1.3% 1.5% 1.7% 1.9% Source: Bloomberg ROAE 1.2% 12.4% 13.7% 15.7% 18.4%
Dividend yield 1.7% 4.2% 7.4% 9.5% 12.6%
EPS (fils) 3.2 37.2 44.3 54.3 67.4
BVPS (fils) 288.4 311.6 335.8 355.1 377.4
P/E (x) 27.9 12.8 10.4 8.5 6.8
P/BV (x) 1.0 1.5 1.4 1.3 1.2
Source: Company Reports & Global Research
Phone: +965-2295-1280
Balance Sheet
Key Ratios
Senior Financial Analyst
Naveed Ahmed, CFA
Income Statement
BURG KK
BURG.KW
Having taken the full brunt of a weakening operating environment, Burgan's
loan book seems cleaner & safer today than what it was in prior years.
Provisions declined in 9M11 as NPL formation possibly decelerated while the
bank stood at an adequate provisioning level.
Market Data
1,471.4
2,430.5
10.4
1.4 The bank is trading at the lowest P/BV multiple in Kuwait and at a 17%
discount to the Kuwait banking sector average. We see the stock would
outperform its peers as soon as market sentiment reverses. Price Performance 1-Yr
Burgan Bank
Recommendation: BUY Burgan is forecast to see a sharp rebound in its bottom-line in 2011 carrying
over from spectacular 9-month performance; we have raised our projections
by 24% for 2011 and 12% for 2012. The bank is expected to exceed pre-
crisis profit levels by 2013 and exhibit a 2011-2014 CAGR of 22%.
Downside / Upside: 18.9%
0.55
0.46
2,653,473 Avg. Val. Traded (USD)
Target Price (KWD):
Current Price (KWD):
676.8 Mkt Cap (KWD mn):
1,501.1
400
420
440
460
480
500
520
540
560
580
600
0
1,000
2,000
3,000
4,000
5,000
6,000
7,000
8,000
9,000
Ja
n-1
1F
eb
-11
Ma
r-1
1A
pr-
11
Ma
y-1
1Ju
n-1
1Ju
l-1
1A
ug
-11
Se
p-1
1O
ct-
11
No
v-1
1D
ec-1
1
Volume ('000) BURG (fils) - RHS
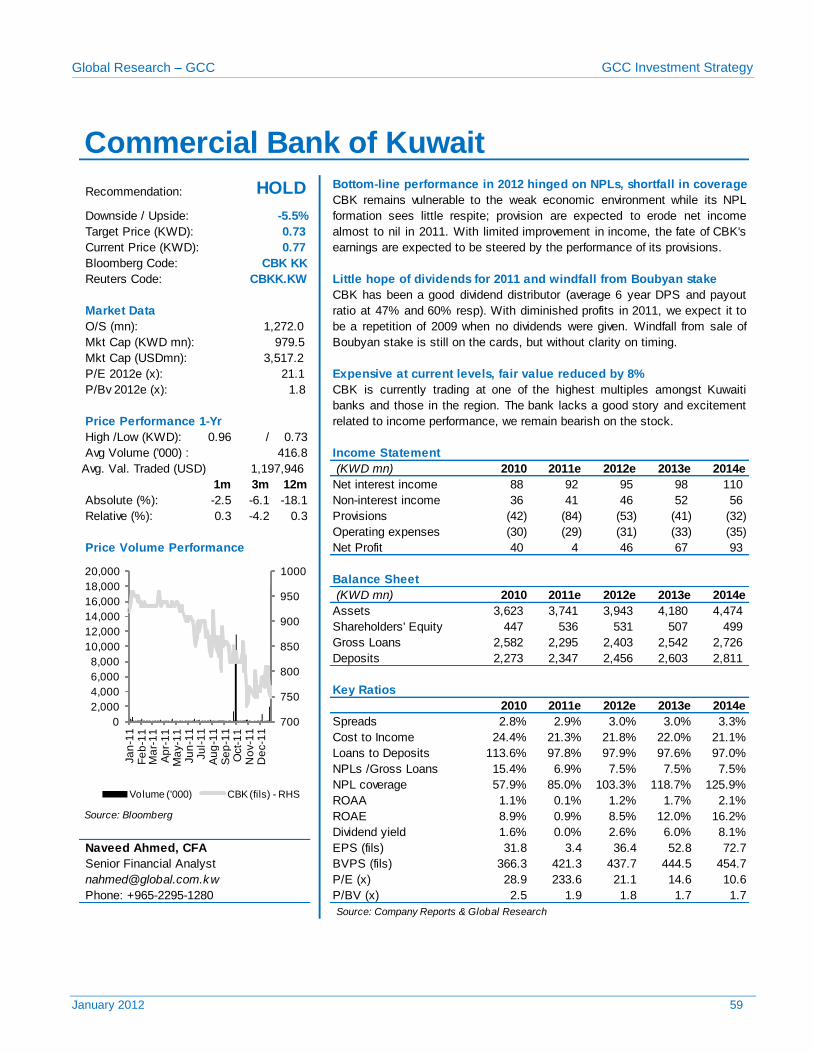
Global Research – GCC GCC Investment Strategy
January 2012 59
Bottom-line performance in 2012 hinged on NPLs, shortfall in coverage
Bloomberg Code:
Reuters Code: Little hope of dividends for 2011 and windfall from Boubyan stake
O/S (mn):
Mkt Cap (USDmn):
P/E 2012e (x): Expensive at current levels, fair value reduced by 8%
P/Bv 2012e (x):
High /Low (KWD): 0.96 / 0.73
Avg Volume ('000) :
(KWD mn) 2010 2011e 2012e 2013e 2014e
1m 3m 12m Net interest income 88 92 95 98 110
Absolute (%): -2.5 -6.1 -18.1 Non-interest income 36 41 46 52 56
Relative (%): 0.3 -4.2 0.3 Provisions (42) (84) (53) (41) (32)
Operating expenses (30) (29) (31) (33) (35)
Price Volume Performance Net Profit 40 4 46 67 93
(KWD mn) 2010 2011e 2012e 2013e 2014e
Assets 3,623 3,741 3,943 4,180 4,474
Shareholders' Equity 447 536 531 507 499
Gross Loans 2,582 2,295 2,403 2,542 2,726
Deposits 2,273 2,347 2,456 2,603 2,811
2010 2011e 2012e 2013e 2014e
Spreads 2.8% 2.9% 3.0% 3.0% 3.3%
Cost to Income 24.4% 21.3% 21.8% 22.0% 21.1%
Loans to Deposits 113.6% 97.8% 97.9% 97.6% 97.0%
NPLs /Gross Loans 15.4% 6.9% 7.5% 7.5% 7.5%
NPL coverage 57.9% 85.0% 103.3% 118.7% 125.9%
ROAA 1.1% 0.1% 1.2% 1.7% 2.1% Source: Bloomberg ROAE 8.9% 0.9% 8.5% 12.0% 16.2%
Dividend yield 1.6% 0.0% 2.6% 6.0% 8.1%
EPS (fils) 31.8 3.4 36.4 52.8 72.7
BVPS (fils) 366.3 421.3 437.7 444.5 454.7
P/E (x) 28.9 233.6 21.1 14.6 10.6
P/BV (x) 2.5 1.9 1.8 1.7 1.7
Source: Company Reports & Global Research
Phone: +965-2295-1280
Balance Sheet
Key Ratios
Senior Financial Analyst
Naveed Ahmed, CFA
Income Statement
CBK KK
CBKK.KW
CBK has been a good dividend distributor (average 6 year DPS and payout
ratio at 47% and 60% resp). With diminished profits in 2011, we expect it to
be a repetition of 2009 when no dividends were given. Windfall from sale of
Boubyan stake is still on the cards, but without clarity on timing.
Market Data
1,272.0
3,517.2
21.1
1.8 CBK is currently trading at one of the highest multiples amongst Kuwaiti
banks and those in the region. The bank lacks a good story and excitement
related to income performance, we remain bearish on the stock. Price Performance 1-Yr
Commercial Bank of Kuwait
Recommendation: HOLD CBK remains vulnerable to the weak economic environment while its NPL
formation sees little respite; provision are expected to erode net income
almost to nil in 2011. With limited improvement in income, the fate of CBK's
earnings are expected to be steered by the performance of its provisions.
Downside / Upside: -5.5%
0.73
0.77
1,197,946 Avg. Val. Traded (USD)
Target Price (KWD):
Current Price (KWD):
979.5 Mkt Cap (KWD mn):
416.8
700
750
800
850
900
950
1000
0
2,000
4,000
6,000
8,000
10,000
12,000
14,000
16,000
18,000
20,000
Ja
n-1
1F
eb
-11
Ma
r-1
1A
pr-
11
Ma
y-1
1Ju
n-1
1Ju
l-1
1A
ug
-11
Se
p-1
1O
ct-
11
No
v-1
1D
ec-1
1
Volume ('000) CBK (fils) - RHS
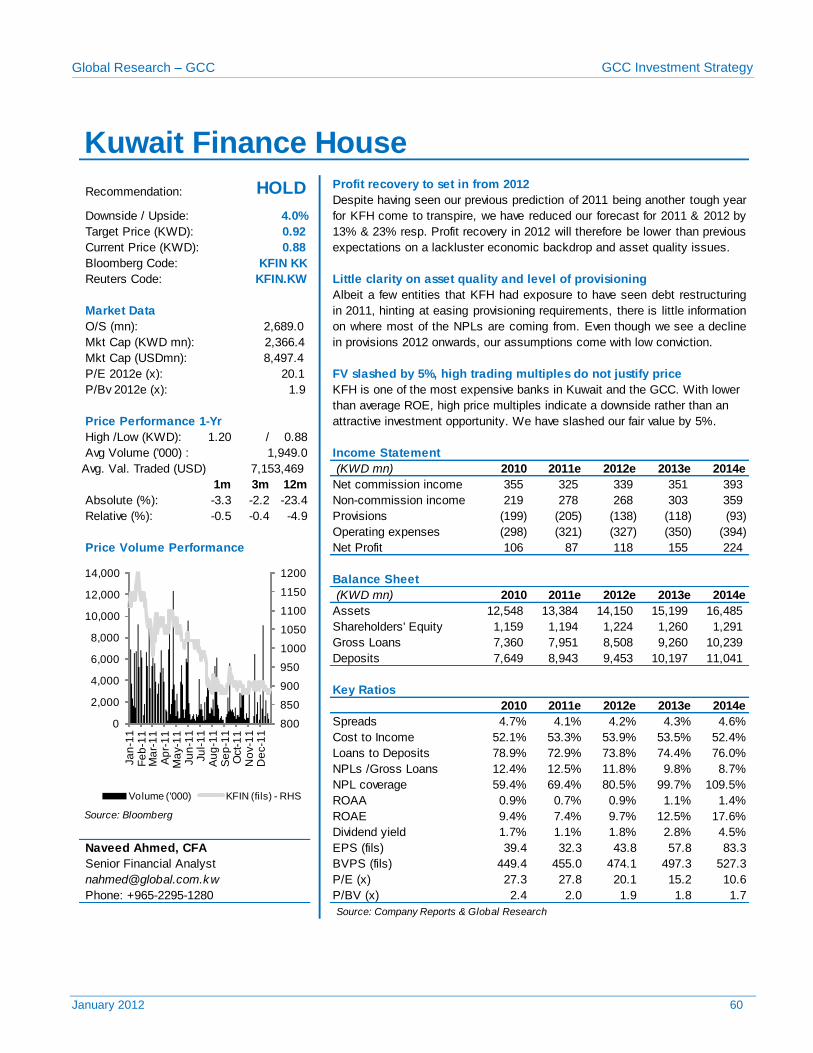
Global Research – GCC GCC Investment Strategy
January 2012 60
Profit recovery to set in from 2012
Bloomberg Code:
Reuters Code: Little clarity on asset quality and level of provisioning
O/S (mn):
Mkt Cap (USDmn):
P/E 2012e (x): FV slashed by 5%, high trading multiples do not justify price
P/Bv 2012e (x):
High /Low (KWD): 1.20 / 0.88
Avg Volume ('000) :
(KWD mn) 2010 2011e 2012e 2013e 2014e
1m 3m 12m Net commission income 355 325 339 351 393
Absolute (%): -3.3 -2.2 -23.4 Non-commission income 219 278 268 303 359
Relative (%): -0.5 -0.4 -4.9 Provisions (199) (205) (138) (118) (93)
Operating expenses (298) (321) (327) (350) (394)
Price Volume Performance Net Profit 106 87 118 155 224
(KWD mn) 2010 2011e 2012e 2013e 2014e
Assets 12,548 13,384 14,150 15,199 16,485
Shareholders' Equity 1,159 1,194 1,224 1,260 1,291
Gross Loans 7,360 7,951 8,508 9,260 10,239
Deposits 7,649 8,943 9,453 10,197 11,041
2010 2011e 2012e 2013e 2014e
Spreads 4.7% 4.1% 4.2% 4.3% 4.6%
Cost to Income 52.1% 53.3% 53.9% 53.5% 52.4%
Loans to Deposits 78.9% 72.9% 73.8% 74.4% 76.0%
NPLs /Gross Loans 12.4% 12.5% 11.8% 9.8% 8.7%
NPL coverage 59.4% 69.4% 80.5% 99.7% 109.5%
ROAA 0.9% 0.7% 0.9% 1.1% 1.4% Source: Bloomberg ROAE 9.4% 7.4% 9.7% 12.5% 17.6%
Dividend yield 1.7% 1.1% 1.8% 2.8% 4.5%
EPS (fils) 39.4 32.3 43.8 57.8 83.3
BVPS (fils) 449.4 455.0 474.1 497.3 527.3
P/E (x) 27.3 27.8 20.1 15.2 10.6
P/BV (x) 2.4 2.0 1.9 1.8 1.7
Source: Company Reports & Global Research
Phone: +965-2295-1280
Balance Sheet
Key Ratios
Senior Financial Analyst
Naveed Ahmed, CFA
Income Statement
KFIN KK
KFIN.KW
Albeit a few entities that KFH had exposure to have seen debt restructuring
in 2011, hinting at easing provisioning requirements, there is little information
on where most of the NPLs are coming from. Even though we see a decline
in provisions 2012 onwards, our assumptions come with low conviction.
Market Data
2,689.0
8,497.4
20.1
1.9 KFH is one of the most expensive banks in Kuwait and the GCC. With lower
than average ROE, high price multiples indicate a downside rather than an
attractive investment opportunity. We have slashed our fair value by 5%. Price Performance 1-Yr
Kuwait Finance House
Recommendation: HOLD Despite having seen our previous prediction of 2011 being another tough year
for KFH come to transpire, we have reduced our forecast for 2011 & 2012 by
13% & 23% resp. Profit recovery in 2012 will therefore be lower than previous
expectations on a lackluster economic backdrop and asset quality issues.
Downside / Upside: 4.0%
0.92
0.88
7,153,469 Avg. Val. Traded (USD)
Target Price (KWD):
Current Price (KWD):
2,366.4 Mkt Cap (KWD mn):
1,949.0
800
850
900
950
1000
1050
1100
1150
1200
0
2,000
4,000
6,000
8,000
10,000
12,000
14,000
Ja
n-1
1F
eb
-11
Ma
r-1
1A
pr-
11
Ma
y-1
1Ju
n-1
1Ju
l-1
1A
ug
-11
Se
p-1
1O
ct-
11
No
v-1
1D
ec-1
1
Volume ('000) KFIN (fils) - RHS
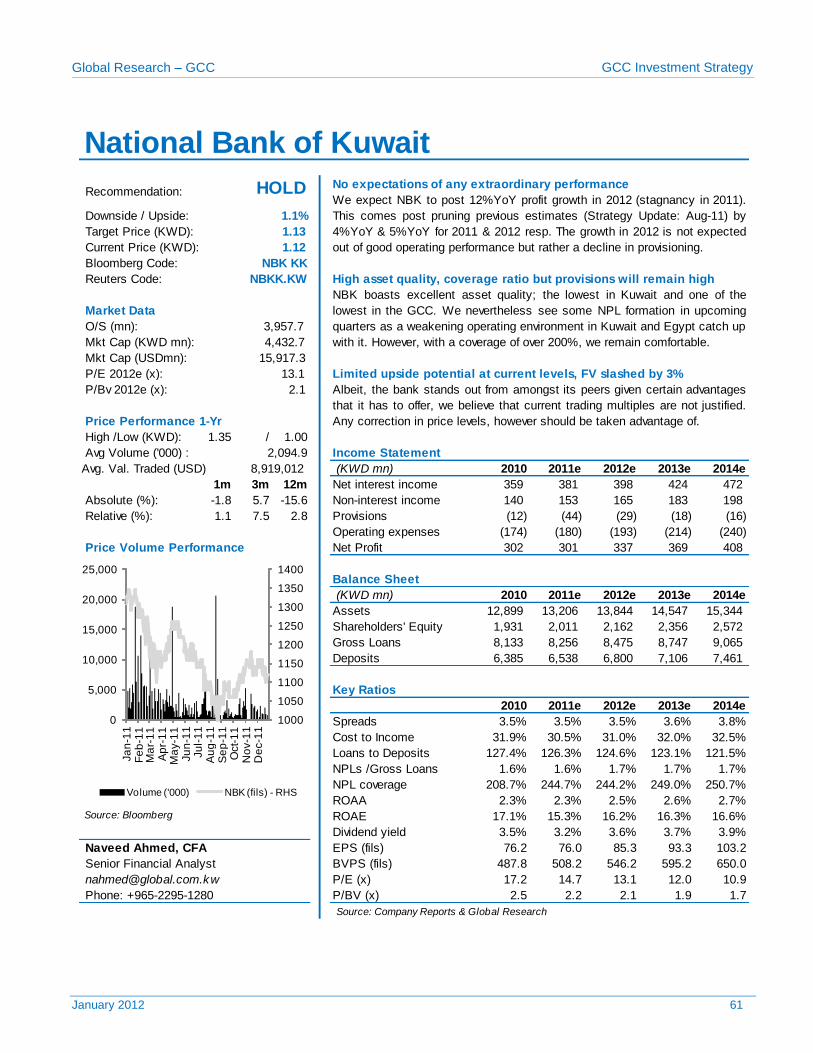
Global Research – GCC GCC Investment Strategy
January 2012 61
No expectations of any extraordinary performance
Bloomberg Code:
Reuters Code: High asset quality, coverage ratio but provisions will remain high
O/S (mn):
Mkt Cap (USDmn):
P/E 2012e (x): Limited upside potential at current levels, FV slashed by 3%
P/Bv 2012e (x):
High /Low (KWD): 1.35 / 1.00
Avg Volume ('000) :
(KWD mn) 2010 2011e 2012e 2013e 2014e
1m 3m 12m Net interest income 359 381 398 424 472
Absolute (%): -1.8 5.7 -15.6 Non-interest income 140 153 165 183 198
Relative (%): 1.1 7.5 2.8 Provisions (12) (44) (29) (18) (16)
Operating expenses (174) (180) (193) (214) (240)
Price Volume Performance Net Profit 302 301 337 369 408
(KWD mn) 2010 2011e 2012e 2013e 2014e
Assets 12,899 13,206 13,844 14,547 15,344
Shareholders' Equity 1,931 2,011 2,162 2,356 2,572
Gross Loans 8,133 8,256 8,475 8,747 9,065
Deposits 6,385 6,538 6,800 7,106 7,461
2010 2011e 2012e 2013e 2014e
Spreads 3.5% 3.5% 3.5% 3.6% 3.8%
Cost to Income 31.9% 30.5% 31.0% 32.0% 32.5%
Loans to Deposits 127.4% 126.3% 124.6% 123.1% 121.5%
NPLs /Gross Loans 1.6% 1.6% 1.7% 1.7% 1.7%
NPL coverage 208.7% 244.7% 244.2% 249.0% 250.7%
ROAA 2.3% 2.3% 2.5% 2.6% 2.7% Source: Bloomberg ROAE 17.1% 15.3% 16.2% 16.3% 16.6%
Dividend yield 3.5% 3.2% 3.6% 3.7% 3.9%
EPS (fils) 76.2 76.0 85.3 93.3 103.2
BVPS (fils) 487.8 508.2 546.2 595.2 650.0
P/E (x) 17.2 14.7 13.1 12.0 10.9
P/BV (x) 2.5 2.2 2.1 1.9 1.7
Source: Company Reports & Global Research
Phone: +965-2295-1280
Balance Sheet
Key Ratios
Senior Financial Analyst
Naveed Ahmed, CFA
Income Statement
NBK KK
NBKK.KW
NBK boasts excellent asset quality; the lowest in Kuwait and one of the
lowest in the GCC. We nevertheless see some NPL formation in upcoming
quarters as a weakening operating environment in Kuwait and Egypt catch up
with it. However, with a coverage of over 200%, we remain comfortable.
Market Data
3,957.7
15,917.3
13.1
2.1 Albeit, the bank stands out from amongst its peers given certain advantages
that it has to offer, we believe that current trading multiples are not justified.
Any correction in price levels, however should be taken advantage of. Price Performance 1-Yr
National Bank of Kuwait
Recommendation: HOLD We expect NBK to post 12%YoY profit growth in 2012 (stagnancy in 2011).
This comes post pruning previous estimates (Strategy Update: Aug-11) by
4%YoY & 5%YoY for 2011 & 2012 resp. The growth in 2012 is not expected
out of good operating performance but rather a decline in provisioning.
Downside / Upside: 1.1%
1.13
1.12
8,919,012 Avg. Val. Traded (USD)
Target Price (KWD):
Current Price (KWD):
4,432.7 Mkt Cap (KWD mn):
2,094.9
1000
1050
1100
1150
1200
1250
1300
1350
1400
0
5,000
10,000
15,000
20,000
25,000
Ja
n-1
1F
eb
-11
Ma
r-1
1A
pr-
11
Ma
y-1
1Ju
n-1
1Ju
l-1
1A
ug
-11
Se
p-1
1O
ct-
11
No
v-1
1D
ec-1
1
Volume ('000) NBK (fils) - RHS
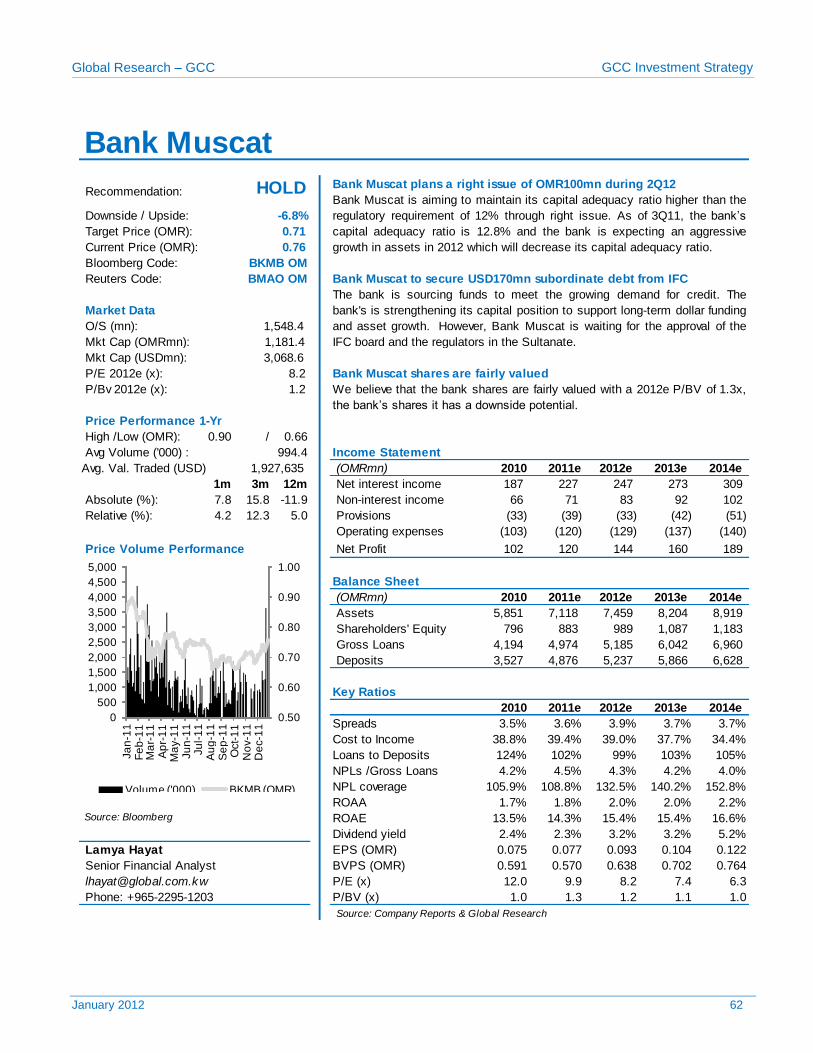
Global Research – GCC GCC Investment Strategy
January 2012 62
Bank Muscat plans a right issue of OMR100mn during 2Q12
Bloomberg Code:
Reuters Code: Bank Muscat to secure USD170mn subordinate debt from IFC
O/S (mn):
Mkt Cap (USDmn):
P/E 2012e (x): Bank Muscat shares are fairly valued
P/Bv 2012e (x):
High /Low (OMR): 0.90 / 0.66
Avg Volume ('000) :
(OMRmn) 2010 2011e 2012e 2013e 2014e
1m 3m 12m Net interest income 187 227 247 273 309
Absolute (%): 7.8 15.8 -11.9 Non-interest income 66 71 83 92 102
Relative (%): 4.2 12.3 5.0 Provisions (33) (39) (33) (42) (51)
Operating expenses (103) (120) (129) (137) (140)
Price Volume Performance Net Profit 102 120 144 160 189
Balance Sheet
(OMRmn) 2010 2011e 2012e 2013e 2014e
Assets 5,851 7,118 7,459 8,204 8,919
Shareholders' Equity 796 883 989 1,087 1,183
Gross Loans 4,194 4,974 5,185 6,042 6,960
Deposits 3,527 4,876 5,237 5,866 6,628
Key Ratios
2010 2011e 2012e 2013e 2014e
Spreads 3.5% 3.6% 3.9% 3.7% 3.7%
Cost to Income 38.8% 39.4% 39.0% 37.7% 34.4%
Loans to Deposits 124% 102% 99% 103% 105%
NPLs /Gross Loans 4.2% 4.5% 4.3% 4.2% 4.0%
NPL coverage 105.9% 108.8% 132.5% 140.2% 152.8%
ROAA 1.7% 1.8% 2.0% 2.0% 2.2% Source: Bloomberg ROAE 13.5% 14.3% 15.4% 15.4% 16.6%
Dividend yield 2.4% 2.3% 3.2% 3.2% 5.2%
Lamya Hayat EPS (OMR) 0.075 0.077 0.093 0.104 0.122
BVPS (OMR) 0.591 0.570 0.638 0.702 0.764
P/E (x) 12.0 9.9 8.2 7.4 6.3
P/BV (x) 1.0 1.3 1.2 1.1 1.0
Source: Company Reports & Global Research
Phone: +965-2295-1203
3,068.6
8.2
1.2 We believe that the bank shares are fairly valued with a 2012e P/BV of 1.3x,
the bank’s shares it has a downside potential.
Price Performance 1-Yr
994.4 Income Statement
Senior Financial Analyst
1,927,635 Avg. Val. Traded (USD)
BKMB OM
BMAO OM
The bank is sourcing funds to meet the growing demand for credit. The
bank's is strengthening its capital position to support long-term dollar funding
and asset growth. However, Bank Muscat is waiting for the approval of the
IFC board and the regulators in the Sultanate.
Market Data
1,548.4
1,181.4 Mkt Cap (OMRmn):
Bank Muscat
Recommendation: HOLD Bank Muscat is aiming to maintain its capital adequacy ratio higher than the
regulatory requirement of 12% through right issue. As of 3Q11, the bank’s
capital adequacy ratio is 12.8% and the bank is expecting an aggressive
growth in assets in 2012 which will decrease its capital adequacy ratio.
Downside / Upside: -6.8%
0.71
0.76
Target Price (OMR):
Current Price (OMR):
0.50
0.60
0.70
0.80
0.90
1.00
0
500
1,000
1,500
2,000
2,500
3,000
3,500
4,000
4,500
5,000
Ja
n-1
1F
eb
-11
Ma
r-1
1A
pr-
11
Ma
y-1
1Ju
n-1
1Ju
l-1
1A
ug
-11
Se
p-1
1O
ct-
11
No
v-1
1D
ec-1
1
Volume ('000) BKMB (OMR)
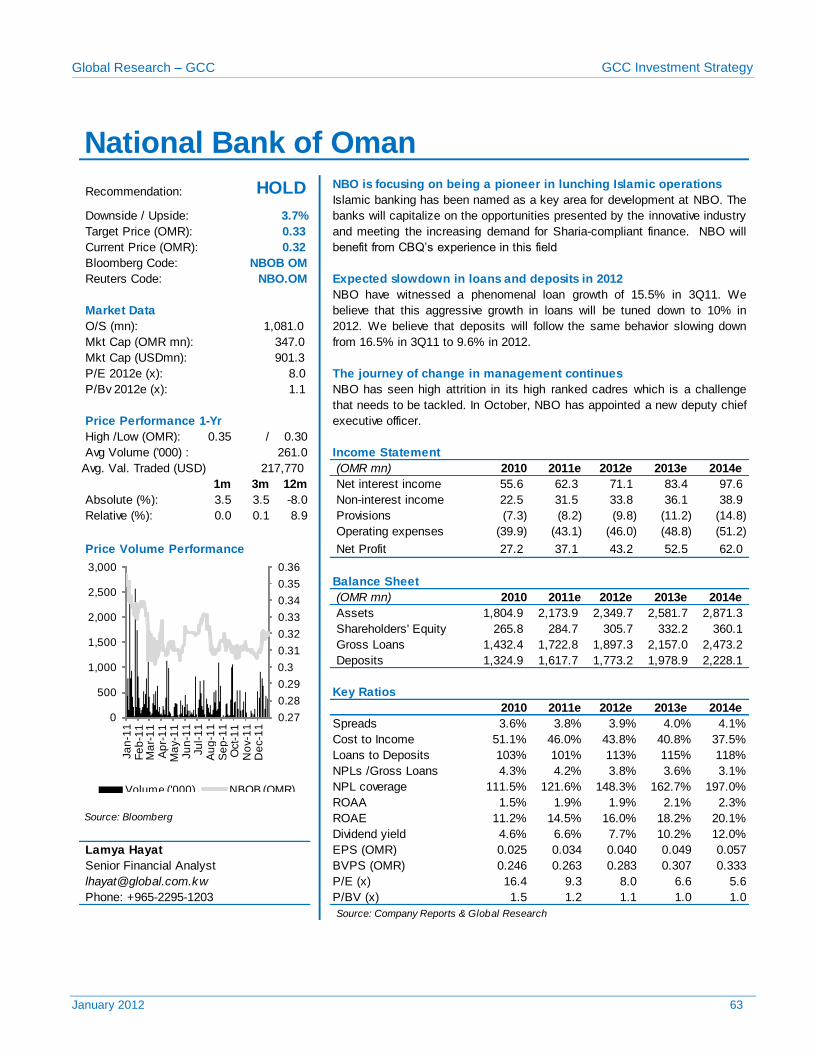
Global Research – GCC GCC Investment Strategy
January 2012 63
NBO is focusing on being a pioneer in lunching Islamic operations
Bloomberg Code:
Reuters Code: Expected slowdown in loans and deposits in 2012
O/S (mn):
Mkt Cap (USDmn):
P/E 2012e (x): The journey of change in management continues
P/Bv 2012e (x):
High /Low (OMR): 0.35 / 0.30
Avg Volume ('000) :
(OMR mn) 2010 2011e 2012e 2013e 2014e
1m 3m 12m Net interest income 55.6 62.3 71.1 83.4 97.6
Absolute (%): 3.5 3.5 -8.0 Non-interest income 22.5 31.5 33.8 36.1 38.9
Relative (%): 0.0 0.1 8.9 Provisions (7.3) (8.2) (9.8) (11.2) (14.8)
Operating expenses (39.9) (43.1) (46.0) (48.8) (51.2)
Price Volume Performance Net Profit 27.2 37.1 43.2 52.5 62.0
Balance Sheet
(OMR mn) 2010 2011e 2012e 2013e 2014e
Assets 1,804.9 2,173.9 2,349.7 2,581.7 2,871.3
Shareholders' Equity 265.8 284.7 305.7 332.2 360.1
Gross Loans 1,432.4 1,722.8 1,897.3 2,157.0 2,473.2
Deposits 1,324.9 1,617.7 1,773.2 1,978.9 2,228.1
Key Ratios
2010 2011e 2012e 2013e 2014e
Spreads 3.6% 3.8% 3.9% 4.0% 4.1%
Cost to Income 51.1% 46.0% 43.8% 40.8% 37.5%
Loans to Deposits 103% 101% 113% 115% 118%
NPLs /Gross Loans 4.3% 4.2% 3.8% 3.6% 3.1%
NPL coverage 111.5% 121.6% 148.3% 162.7% 197.0%
ROAA 1.5% 1.9% 1.9% 2.1% 2.3% Source: Bloomberg ROAE 11.2% 14.5% 16.0% 18.2% 20.1%
Dividend yield 4.6% 6.6% 7.7% 10.2% 12.0%
Lamya Hayat EPS (OMR) 0.025 0.034 0.040 0.049 0.057
BVPS (OMR) 0.246 0.263 0.283 0.307 0.333
P/E (x) 16.4 9.3 8.0 6.6 5.6
P/BV (x) 1.5 1.2 1.1 1.0 1.0
Source: Company Reports & Global Research
Phone: +965-2295-1203
901.3
8.0
1.1 NBO has seen high attrition in its high ranked cadres which is a challenge
that needs to be tackled. In October, NBO has appointed a new deputy chief
executive officer. Price Performance 1-Yr
261.0 Income Statement
Senior Financial Analyst
217,770 Avg. Val. Traded (USD)
NBOB OM
NBO.OM
NBO have witnessed a phenomenal loan growth of 15.5% in 3Q11. We
believe that this aggressive growth in loans will be tuned down to 10% in
2012. We believe that deposits will follow the same behavior slowing down
from 16.5% in 3Q11 to 9.6% in 2012.
Market Data
1,081.0
347.0 Mkt Cap (OMR mn):
National Bank of Oman
Recommendation: HOLD Islamic banking has been named as a key area for development at NBO. The
banks will capitalize on the opportunities presented by the innovative industry
and meeting the increasing demand for Sharia-compliant finance. NBO will
benefit from CBQ’s experience in this field
Downside / Upside: 3.7%
0.33
0.32
Target Price (OMR):
Current Price (OMR):
0.27
0.28
0.29
0.3
0.31
0.32
0.33
0.34
0.35
0.36
0
500
1,000
1,500
2,000
2,500
3,000
Ja
n-1
1F
eb
-11
Ma
r-1
1A
pr-
11
Ma
y-1
1Ju
n-1
1Ju
l-1
1A
ug
-11
Se
p-1
1O
ct-
11
No
v-1
1D
ec-1
1
Volume ('000) NBOB (OMR)
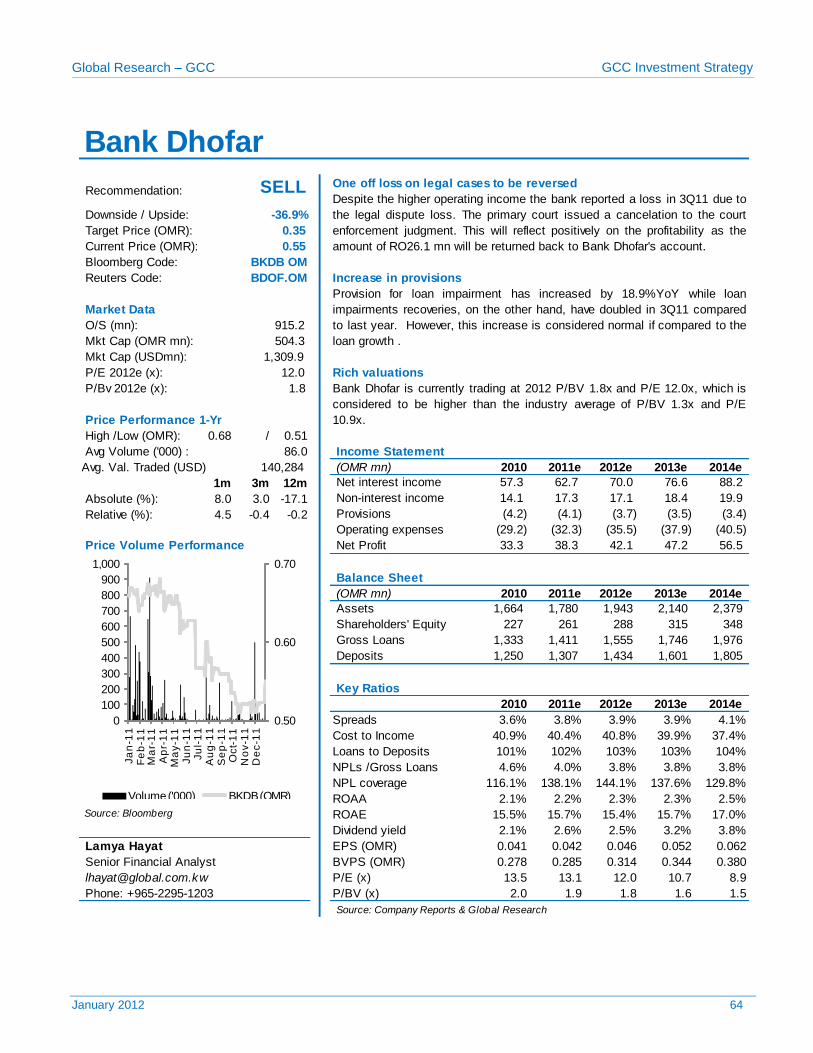
Global Research – GCC GCC Investment Strategy
January 2012 64
One off loss on legal cases to be reversed
Bloomberg Code:
Reuters Code: Increase in provisions
O/S (mn):
Mkt Cap (USDmn):
P/E 2012e (x): Rich valuations
P/Bv 2012e (x):
High /Low (OMR): 0.68 / 0.51
Avg Volume ('000) :
(OMR mn) 2010 2011e 2012e 2013e 2014e
1m 3m 12m Net interest income 57.3 62.7 70.0 76.6 88.2
Absolute (%): 8.0 3.0 -17.1 Non-interest income 14.1 17.3 17.1 18.4 19.9
Relative (%): 4.5 -0.4 -0.2 Provisions (4.2) (4.1) (3.7) (3.5) (3.4)
Operating expenses (29.2) (32.3) (35.5) (37.9) (40.5)
Price Volume Performance Net Profit 33.3 38.3 42.1 47.2 56.5
Balance Sheet
(OMR mn) 2010 2011e 2012e 2013e 2014e
Assets 1,664 1,780 1,943 2,140 2,379
Shareholders' Equity 227 261 288 315 348
Gross Loans 1,333 1,411 1,555 1,746 1,976
Deposits 1,250 1,307 1,434 1,601 1,805
Key Ratios
2010 2011e 2012e 2013e 2014e
Spreads 3.6% 3.8% 3.9% 3.9% 4.1%
Cost to Income 40.9% 40.4% 40.8% 39.9% 37.4%
Loans to Deposits 101% 102% 103% 103% 104%
NPLs /Gross Loans 4.6% 4.0% 3.8% 3.8% 3.8%
NPL coverage 116.1% 138.1% 144.1% 137.6% 129.8%
ROAA 2.1% 2.2% 2.3% 2.3% 2.5% Source: Bloomberg ROAE 15.5% 15.7% 15.4% 15.7% 17.0%
Dividend yield 2.1% 2.6% 2.5% 3.2% 3.8%
Lamya Hayat EPS (OMR) 0.041 0.042 0.046 0.052 0.062
BVPS (OMR) 0.278 0.285 0.314 0.344 0.380
P/E (x) 13.5 13.1 12.0 10.7 8.9
P/BV (x) 2.0 1.9 1.8 1.6 1.5
Source: Company Reports & Global Research
Phone: +965-2295-1203
1,309.9
12.0
1.8 Bank Dhofar is currently trading at 2012 P/BV 1.8x and P/E 12.0x, which is
considered to be higher than the industry average of P/BV 1.3x and P/E
10.9x. Price Performance 1-Yr
86.0 Income Statement
Senior Financial Analyst
140,284 Avg. Val. Traded (USD)
BKDB OM
BDOF.OM
Provision for loan impairment has increased by 18.9%YoY while loan
impairments recoveries, on the other hand, have doubled in 3Q11 compared
to last year. However, this increase is considered normal if compared to the
loan growth .
Market Data
915.2
504.3 Mkt Cap (OMR mn):
Bank Dhofar
Recommendation: SELL Despite the higher operating income the bank reported a loss in 3Q11 due to
the legal dispute loss. The primary court issued a cancelation to the court
enforcement judgment. This will reflect positively on the profitability as the
amount of RO26.1 mn will be returned back to Bank Dhofar's account.
Downside / Upside: -36.9%
0.35
0.55
Target Price (OMR):
Current Price (OMR):
0.50
0.60
0.70
0
100
200
300
400
500
600
700
800
900
1,000
Ja
n-1
1F
eb
-11
Ma
r-1
1A
pr-
11
Ma
y-1
1Ju
n-1
1Ju
l-1
1A
ug
-11
Se
p-1
1O
ct-
11
No
v-1
1D
ec-1
1
Volume ('000) BKDB (OMR)
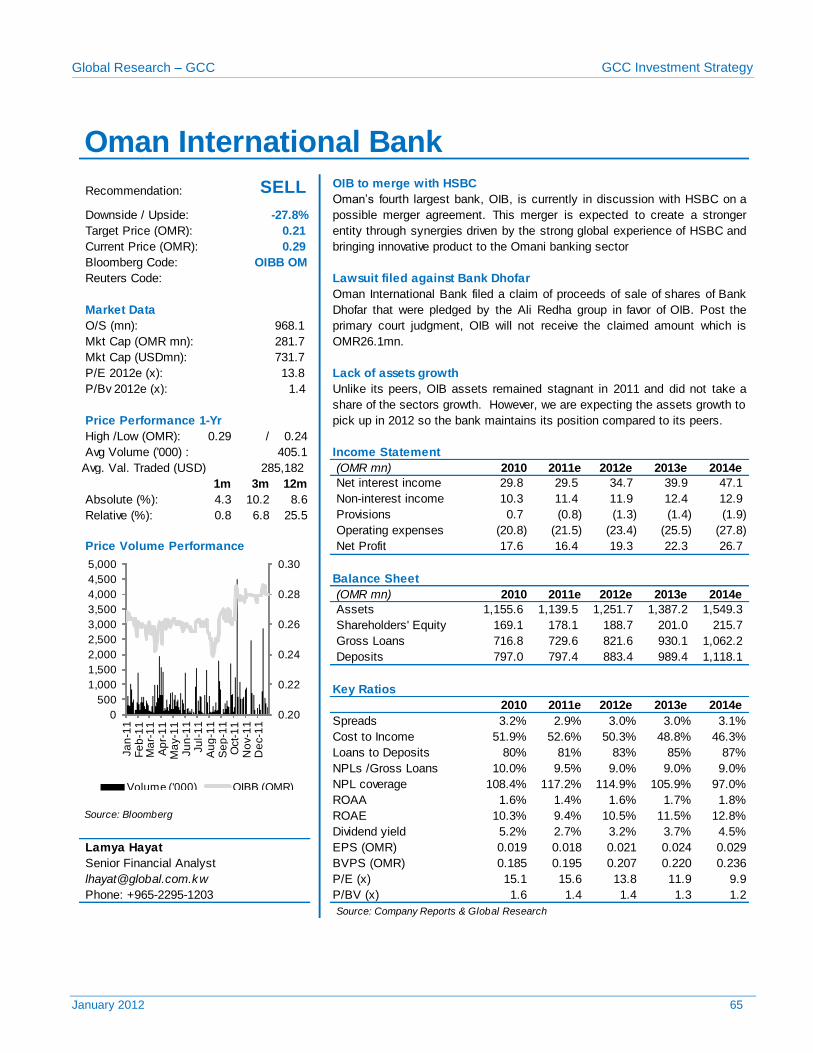
Global Research – GCC GCC Investment Strategy
January 2012 65
OIB to merge with HSBC
Bloomberg Code:
Reuters Code: Lawsuit filed against Bank Dhofar
O/S (mn):
Mkt Cap (USDmn):
P/E 2012e (x): Lack of assets growth
P/Bv 2012e (x):
High /Low (OMR): 0.29 / 0.24
Avg Volume ('000) :
(OMR mn) 2010 2011e 2012e 2013e 2014e
1m 3m 12m Net interest income 29.8 29.5 34.7 39.9 47.1
Absolute (%): 4.3 10.2 8.6 Non-interest income 10.3 11.4 11.9 12.4 12.9
Relative (%): 0.8 6.8 25.5 Provisions 0.7 (0.8) (1.3) (1.4) (1.9)
Operating expenses (20.8) (21.5) (23.4) (25.5) (27.8)
Price Volume Performance Net Profit 17.6 16.4 19.3 22.3 26.7
Balance Sheet
(OMR mn) 2010 2011e 2012e 2013e 2014e
Assets 1,155.6 1,139.5 1,251.7 1,387.2 1,549.3
Shareholders' Equity 169.1 178.1 188.7 201.0 215.7
Gross Loans 716.8 729.6 821.6 930.1 1,062.2
Deposits 797.0 797.4 883.4 989.4 1,118.1
Key Ratios
2010 2011e 2012e 2013e 2014e
Spreads 3.2% 2.9% 3.0% 3.0% 3.1%
Cost to Income 51.9% 52.6% 50.3% 48.8% 46.3%
Loans to Deposits 80% 81% 83% 85% 87%
NPLs /Gross Loans 10.0% 9.5% 9.0% 9.0% 9.0%
NPL coverage 108.4% 117.2% 114.9% 105.9% 97.0%
ROAA 1.6% 1.4% 1.6% 1.7% 1.8% Source: Bloomberg ROAE 10.3% 9.4% 10.5% 11.5% 12.8%
Dividend yield 5.2% 2.7% 3.2% 3.7% 4.5%
Lamya Hayat EPS (OMR) 0.019 0.018 0.021 0.024 0.029
BVPS (OMR) 0.185 0.195 0.207 0.220 0.236
P/E (x) 15.1 15.6 13.8 11.9 9.9
P/BV (x) 1.6 1.4 1.4 1.3 1.2
Source: Company Reports & Global Research
Oman International Bank
Recommendation: SELL Oman’s fourth largest bank, OIB, is currently in discussion with HSBC on a
possible merger agreement. This merger is expected to create a stronger
entity through synergies driven by the strong global experience of HSBC and
bringing innovative product to the Omani banking sector
Downside / Upside: -27.8%
0.21
0.29
Target Price (OMR):
Current Price (OMR):
OIBB OM
Oman International Bank filed a claim of proceeds of sale of shares of Bank
Dhofar that were pledged by the Ali Redha group in favor of OIB. Post the
primary court judgment, OIB will not receive the claimed amount which is
OMR26.1mn.
Market Data
968.1
281.7 Mkt Cap (OMR mn):
Phone: +965-2295-1203
731.7
13.8
1.4 Unlike its peers, OIB assets remained stagnant in 2011 and did not take a
share of the sectors growth. However, we are expecting the assets growth to
pick up in 2012 so the bank maintains its position compared to its peers. Price Performance 1-Yr
405.1 Income Statement
Senior Financial Analyst
285,182 Avg. Val. Traded (USD)
0.20
0.22
0.24
0.26
0.28
0.30
0
500
1,000
1,500
2,000
2,500
3,000
3,500
4,000
4,500
5,000
Ja
n-1
1F
eb
-11
Ma
r-1
1A
pr-
11
Ma
y-1
1Ju
n-1
1Ju
l-1
1A
ug
-11
Se
p-1
1O
ct-
11
No
v-1
1D
ec-1
1
Volume ('000) OIBB (OMR)
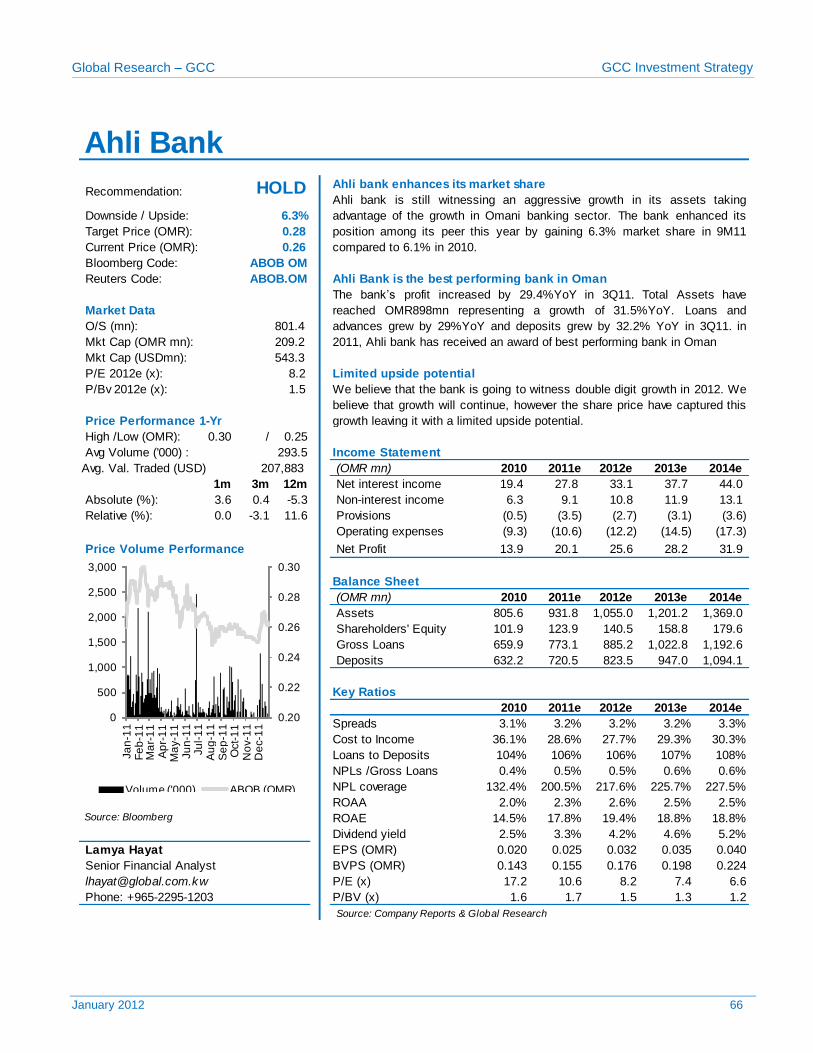
Global Research – GCC GCC Investment Strategy
January 2012 66
Ahli bank enhances its market share
Bloomberg Code:
Reuters Code: Ahli Bank is the best performing bank in Oman
O/S (mn):
Mkt Cap (USDmn):
P/E 2012e (x): Limited upside potential
P/Bv 2012e (x):
High /Low (OMR): 0.30 / 0.25
Avg Volume ('000) :
(OMR mn) 2010 2011e 2012e 2013e 2014e
1m 3m 12m Net interest income 19.4 27.8 33.1 37.7 44.0
Absolute (%): 3.6 0.4 -5.3 Non-interest income 6.3 9.1 10.8 11.9 13.1
Relative (%): 0.0 -3.1 11.6 Provisions (0.5) (3.5) (2.7) (3.1) (3.6)
Operating expenses (9.3) (10.6) (12.2) (14.5) (17.3)
Price Volume Performance Net Profit 13.9 20.1 25.6 28.2 31.9
Balance Sheet
(OMR mn) 2010 2011e 2012e 2013e 2014e
Assets 805.6 931.8 1,055.0 1,201.2 1,369.0
Shareholders' Equity 101.9 123.9 140.5 158.8 179.6
Gross Loans 659.9 773.1 885.2 1,022.8 1,192.6
Deposits 632.2 720.5 823.5 947.0 1,094.1
Key Ratios
2010 2011e 2012e 2013e 2014e
Spreads 3.1% 3.2% 3.2% 3.2% 3.3%
Cost to Income 36.1% 28.6% 27.7% 29.3% 30.3%
Loans to Deposits 104% 106% 106% 107% 108%
NPLs /Gross Loans 0.4% 0.5% 0.5% 0.6% 0.6%
NPL coverage 132.4% 200.5% 217.6% 225.7% 227.5%
ROAA 2.0% 2.3% 2.6% 2.5% 2.5% Source: Bloomberg ROAE 14.5% 17.8% 19.4% 18.8% 18.8%
Dividend yield 2.5% 3.3% 4.2% 4.6% 5.2%
Lamya Hayat EPS (OMR) 0.020 0.025 0.032 0.035 0.040
BVPS (OMR) 0.143 0.155 0.176 0.198 0.224
P/E (x) 17.2 10.6 8.2 7.4 6.6
P/BV (x) 1.6 1.7 1.5 1.3 1.2
Source: Company Reports & Global Research
Phone: +965-2295-1203
543.3
8.2
1.5 We believe that the bank is going to witness double digit growth in 2012. We
believe that growth will continue, however the share price have captured this
growth leaving it with a limited upside potential. Price Performance 1-Yr
293.5 Income Statement
Senior Financial Analyst
207,883 Avg. Val. Traded (USD)
ABOB OM
ABOB.OM
The bank’s profit increased by 29.4%YoY in 3Q11. Total Assets have
reached OMR898mn representing a growth of 31.5%YoY. Loans and
advances grew by 29%YoY and deposits grew by 32.2% YoY in 3Q11. in
2011, Ahli bank has received an award of best performing bank in Oman
Market Data
801.4
209.2 Mkt Cap (OMR mn):
Ahli Bank
Recommendation: HOLD Ahli bank is still witnessing an aggressive growth in its assets taking
advantage of the growth in Omani banking sector. The bank enhanced its
position among its peer this year by gaining 6.3% market share in 9M11
compared to 6.1% in 2010.
Downside / Upside: 6.3%
0.28
0.26
Target Price (OMR):
Current Price (OMR):
0.20
0.22
0.24
0.26
0.28
0.30
0
500
1,000
1,500
2,000
2,500
3,000
Ja
n-1
1F
eb
-11
Ma
r-1
1A
pr-
11
Ma
y-1
1Ju
n-1
1Ju
l-1
1A
ug
-11
Se
p-1
1O
ct-
11
No
v-1
1D
ec-1
1
Volume ('000) ABOB (OMR)
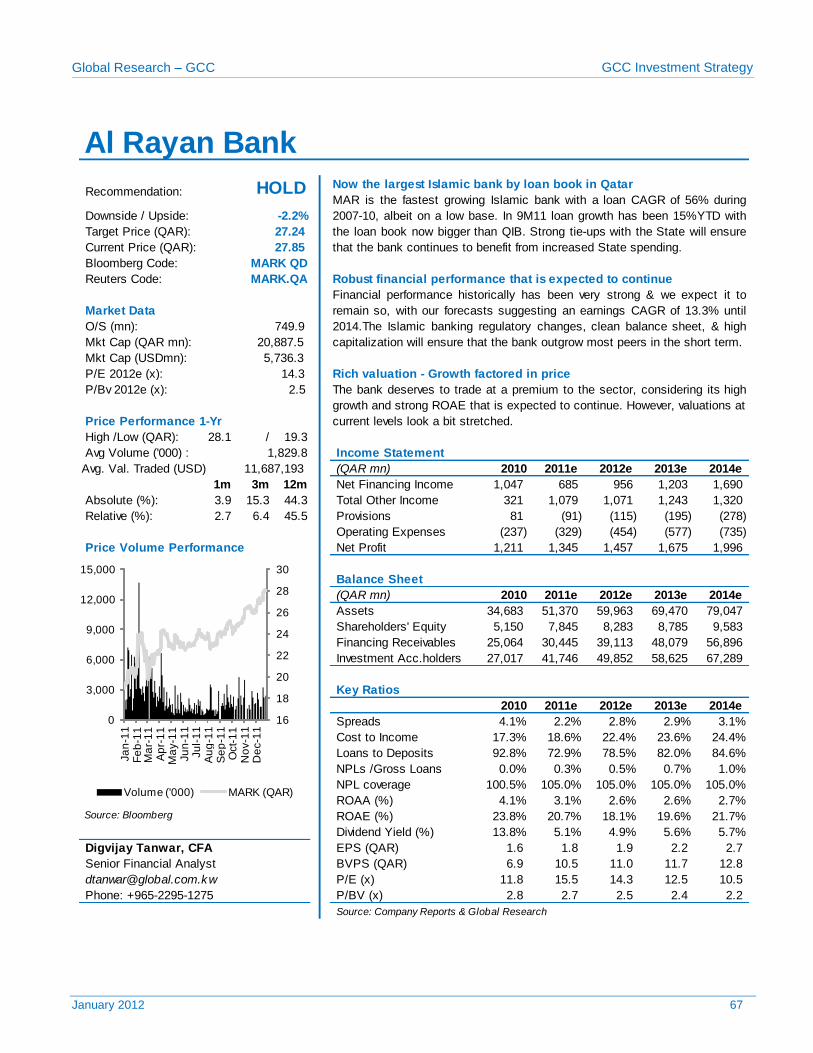
Global Research – GCC GCC Investment Strategy
January 2012 67
Now the largest Islamic bank by loan book in Qatar
Bloomberg Code:
Reuters Code: Robust financial performance that is expected to continue
O/S (mn):
Mkt Cap (USDmn):
P/E 2012e (x): Rich valuation - Growth factored in price
P/Bv 2012e (x):
High /Low (QAR): 28.1 / 19.3
Avg Volume ('000) : Income Statement
(QAR mn) 2010 2011e 2012e 2013e 2014e
1m 3m 12m Net Financing Income 1,047 685 956 1,203 1,690
Absolute (%): 3.9 15.3 44.3 Total Other Income 321 1,079 1,071 1,243 1,320
Relative (%): 2.7 6.4 45.5 Provisions 81 (91) (115) (195) (278)
Operating Expenses (237) (329) (454) (577) (735)
Price Volume Performance Net Profit 1,211 1,345 1,457 1,675 1,996
Balance Sheet
(QAR mn) 2010 2011e 2012e 2013e 2014e
Assets 34,683 51,370 59,963 69,470 79,047
Shareholders' Equity 5,150 7,845 8,283 8,785 9,583
Financing Receivables 25,064 30,445 39,113 48,079 56,896
Investment Acc.holders 27,017 41,746 49,852 58,625 67,289
Key Ratios
2010 2011e 2012e 2013e 2014e
Spreads 4.1% 2.2% 2.8% 2.9% 3.1%
Cost to Income 17.3% 18.6% 22.4% 23.6% 24.4%
Loans to Deposits 92.8% 72.9% 78.5% 82.0% 84.6%
NPLs /Gross Loans 0.0% 0.3% 0.5% 0.7% 1.0%
NPL coverage 100.5% 105.0% 105.0% 105.0% 105.0%
ROAA (%) 4.1% 3.1% 2.6% 2.6% 2.7% Source: Bloomberg ROAE (%) 23.8% 20.7% 18.1% 19.6% 21.7%
Dividend Yield (%) 13.8% 5.1% 4.9% 5.6% 5.7%
Digvijay Tanwar, CFA EPS (QAR) 1.6 1.8 1.9 2.2 2.7
BVPS (QAR) 6.9 10.5 11.0 11.7 12.8
P/E (x) 11.8 15.5 14.3 12.5 10.5
P/BV (x) 2.8 2.7 2.5 2.4 2.2
Source: Company Reports & Global Research
The bank deserves to trade at a premium to the sector, considering its high
growth and strong ROAE that is expected to continue. However, valuations at
current levels look a bit stretched.
749.9
20,887.5 Mkt Cap (QAR mn):
Phone: +965-2295-1275
5,736.3
14.3
2.5
Price Performance 1-Yr
1,829.8
Senior Financial Analyst
11,687,193 Avg. Val. Traded (USD)
MARK QD
MARK.QA
Market Data
Financial performance historically has been very strong & we expect it to
remain so, with our forecasts suggesting an earnings CAGR of 13.3% until
2014.The Islamic banking regulatory changes, clean balance sheet, & high
capitalization will ensure that the bank outgrow most peers in the short term.
Al Rayan Bank
Recommendation: HOLD MAR is the fastest growing Islamic bank with a loan CAGR of 56% during
2007-10, albeit on a low base. In 9M11 loan growth has been 15%YTD with
the loan book now bigger than QIB. Strong tie-ups with the State will ensure
that the bank continues to benefit from increased State spending.
Downside / Upside: -2.2%
27.24
27.85
Target Price (QAR):
Current Price (QAR):
16
18
20
22
24
26
28
30
0
3,000
6,000
9,000
12,000
15,000
Ja
n-1
1F
eb
-11
Ma
r-1
1A
pr-
11
Ma
y-1
1Ju
n-1
1Ju
l-1
1A
ug
-11
Se
p-1
1O
ct-
11
No
v-1
1D
ec-1
1
Volume ('000) MARK (QAR)
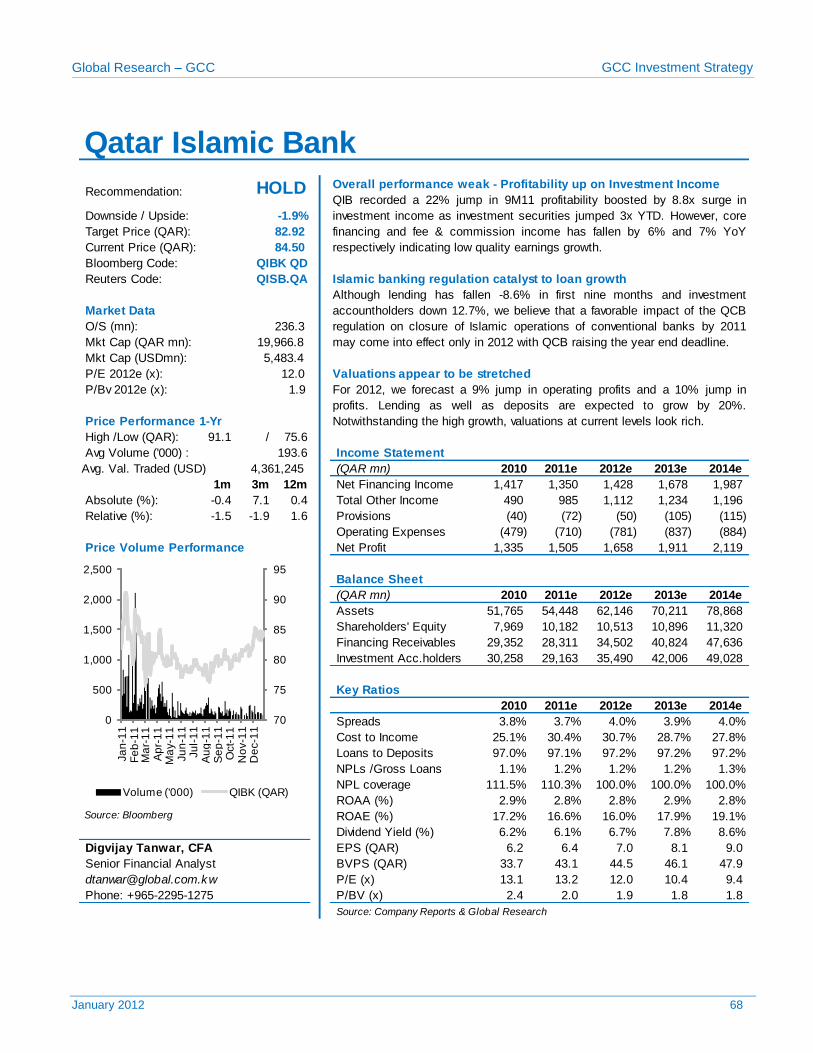
Global Research – GCC GCC Investment Strategy
January 2012 68
Overall performance weak - Profitability up on Investment Income
Bloomberg Code:
Reuters Code: Islamic banking regulation catalyst to loan growth
O/S (mn):
Mkt Cap (USDmn):
P/E 2012e (x): Valuations appear to be stretched
P/Bv 2012e (x):
High /Low (QAR): 91.1 / 75.6
Avg Volume ('000) : Income Statement
(QAR mn) 2010 2011e 2012e 2013e 2014e
1m 3m 12m Net Financing Income 1,417 1,350 1,428 1,678 1,987
Absolute (%): -0.4 7.1 0.4 Total Other Income 490 985 1,112 1,234 1,196
Relative (%): -1.5 -1.9 1.6 Provisions (40) (72) (50) (105) (115)
Operating Expenses (479) (710) (781) (837) (884)
Price Volume Performance Net Profit 1,335 1,505 1,658 1,911 2,119
Balance Sheet
(QAR mn) 2010 2011e 2012e 2013e 2014e
Assets 51,765 54,448 62,146 70,211 78,868
Shareholders' Equity 7,969 10,182 10,513 10,896 11,320
Financing Receivables 29,352 28,311 34,502 40,824 47,636
Investment Acc.holders 30,258 29,163 35,490 42,006 49,028
Key Ratios
2010 2011e 2012e 2013e 2014e
Spreads 3.8% 3.7% 4.0% 3.9% 4.0%
Cost to Income 25.1% 30.4% 30.7% 28.7% 27.8%
Loans to Deposits 97.0% 97.1% 97.2% 97.2% 97.2%
NPLs /Gross Loans 1.1% 1.2% 1.2% 1.2% 1.3%
NPL coverage 111.5% 110.3% 100.0% 100.0% 100.0%
ROAA (%) 2.9% 2.8% 2.8% 2.9% 2.8% Source: Bloomberg ROAE (%) 17.2% 16.6% 16.0% 17.9% 19.1%
Dividend Yield (%) 6.2% 6.1% 6.7% 7.8% 8.6%
Digvijay Tanwar, CFA EPS (QAR) 6.2 6.4 7.0 8.1 9.0
BVPS (QAR) 33.7 43.1 44.5 46.1 47.9
P/E (x) 13.1 13.2 12.0 10.4 9.4
P/BV (x) 2.4 2.0 1.9 1.8 1.8
Source: Company Reports & Global Research
Although lending has fallen -8.6% in first nine months and investment
accountholders down 12.7%, we believe that a favorable impact of the QCB
regulation on closure of Islamic operations of conventional banks by 2011
may come into effect only in 2012 with QCB raising the year end deadline.
For 2012, we forecast a 9% jump in operating profits and a 10% jump in
profits. Lending as well as deposits are expected to grow by 20%.
Notwithstanding the high growth, valuations at current levels look rich.
19,966.8 Mkt Cap (QAR mn):
Phone: +965-2295-1275
5,483.4
12.0
1.9
Price Performance 1-Yr
193.6
Senior Financial Analyst
4,361,245 Avg. Val. Traded (USD)
QIBK QD
QISB.QA
Market Data
236.3
Qatar Islamic Bank
Recommendation: HOLD QIB recorded a 22% jump in 9M11 profitability boosted by 8.8x surge in
investment income as investment securities jumped 3x YTD. However, core
financing and fee & commission income has fallen by 6% and 7% YoY
respectively indicating low quality earnings growth.
Downside / Upside: -1.9%
82.92
84.50
Target Price (QAR):
Current Price (QAR):
70
75
80
85
90
95
0
500
1,000
1,500
2,000
2,500
Ja
n-1
1F
eb
-11
Ma
r-1
1A
pr-
11
Ma
y-1
1Ju
n-1
1Ju
l-1
1A
ug
-11
Se
p-1
1O
ct-
11
No
v-1
1D
ec-1
1
Volume ('000) QIBK (QAR)
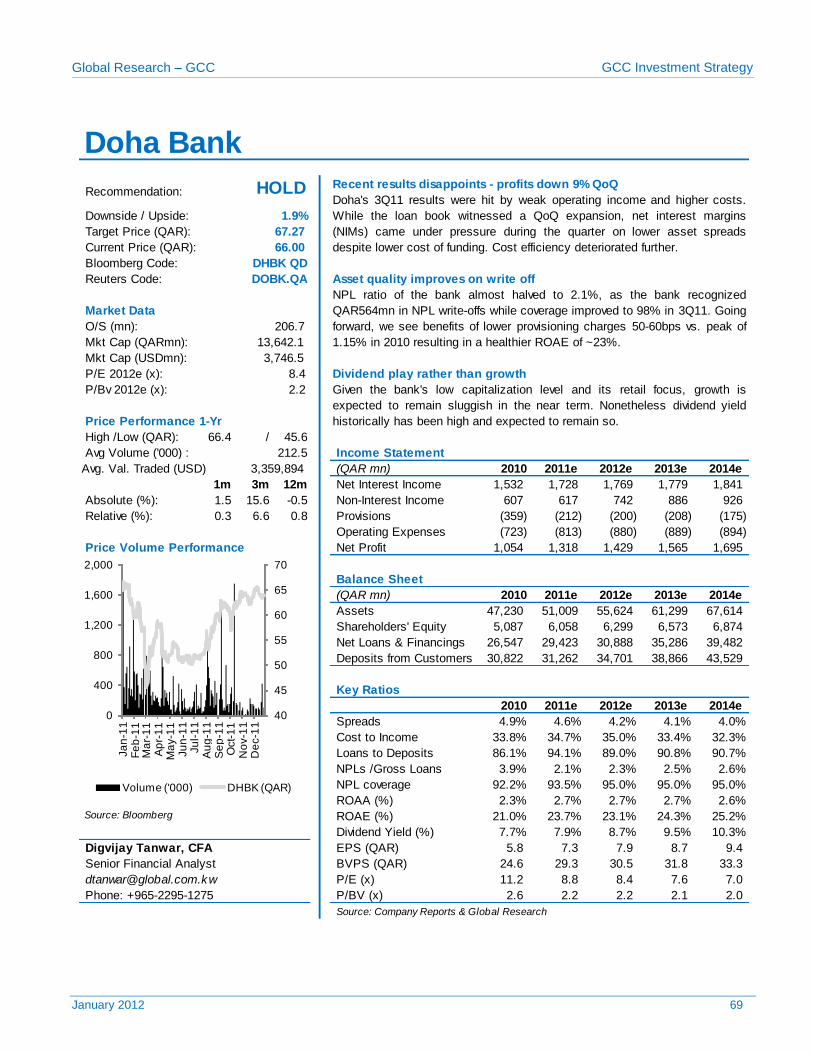
Global Research – GCC GCC Investment Strategy
January 2012 69
Recent results disappoints - profits down 9% QoQ
Bloomberg Code:
Reuters Code: Asset quality improves on write off
O/S (mn):
Mkt Cap (USDmn):
P/E 2012e (x): Dividend play rather than growth
P/Bv 2012e (x):
High /Low (QAR): 66.4 / 45.6
Avg Volume ('000) : Income Statement
(QAR mn) 2010 2011e 2012e 2013e 2014e
1m 3m 12m Net Interest Income 1,532 1,728 1,769 1,779 1,841
Absolute (%): 1.5 15.6 -0.5 Non-Interest Income 607 617 742 886 926
Relative (%): 0.3 6.6 0.8 Provisions (359) (212) (200) (208) (175)
Operating Expenses (723) (813) (880) (889) (894)
Price Volume Performance Net Profit 1,054 1,318 1,429 1,565 1,695
Balance Sheet
(QAR mn) 2010 2011e 2012e 2013e 2014e
Assets 47,230 51,009 55,624 61,299 67,614
Shareholders' Equity 5,087 6,058 6,299 6,573 6,874
Net Loans & Financings 26,547 29,423 30,888 35,286 39,482
Deposits from Customers 30,822 31,262 34,701 38,866 43,529
Key Ratios
2010 2011e 2012e 2013e 2014e
Spreads 4.9% 4.6% 4.2% 4.1% 4.0%
Cost to Income 33.8% 34.7% 35.0% 33.4% 32.3%
Loans to Deposits 86.1% 94.1% 89.0% 90.8% 90.7%
NPLs /Gross Loans 3.9% 2.1% 2.3% 2.5% 2.6%
NPL coverage 92.2% 93.5% 95.0% 95.0% 95.0%
ROAA (%) 2.3% 2.7% 2.7% 2.7% 2.6% Source: Bloomberg ROAE (%) 21.0% 23.7% 23.1% 24.3% 25.2%
Dividend Yield (%) 7.7% 7.9% 8.7% 9.5% 10.3%
Digvijay Tanwar, CFA EPS (QAR) 5.8 7.3 7.9 8.7 9.4
BVPS (QAR) 24.6 29.3 30.5 31.8 33.3
P/E (x) 11.2 8.8 8.4 7.6 7.0
P/BV (x) 2.6 2.2 2.2 2.1 2.0
Source: Company Reports & Global Research
NPL ratio of the bank almost halved to 2.1%, as the bank recognized
QAR564mn in NPL write-offs while coverage improved to 98% in 3Q11. Going
forward, we see benefits of lower provisioning charges 50-60bps vs. peak of
1.15% in 2010 resulting in a healthier ROAE of ~23%.
Given the bank's low capitalization level and its retail focus, growth is
expected to remain sluggish in the near term. Nonetheless dividend yield
historically has been high and expected to remain so.
13,642.1 Mkt Cap (QARmn):
Phone: +965-2295-1275
3,746.5
8.4
2.2
Price Performance 1-Yr
212.5
Senior Financial Analyst
3,359,894 Avg. Val. Traded (USD)
DHBK QD
DOBK.QA
Market Data
206.7
Doha Bank
Recommendation: HOLD Doha's 3Q11 results were hit by weak operating income and higher costs.
While the loan book witnessed a QoQ expansion, net interest margins
(NIMs) came under pressure during the quarter on lower asset spreads
despite lower cost of funding. Cost efficiency deteriorated further.
Downside / Upside: 1.9%
67.27
66.00
Target Price (QAR):
Current Price (QAR):
40
45
50
55
60
65
70
0
400
800
1,200
1,600
2,000
Ja
n-1
1F
eb
-11
Ma
r-1
1A
pr-
11
Ma
y-1
1Ju
n-1
1Ju
l-1
1A
ug
-11
Se
p-1
1O
ct-
11
No
v-1
1D
ec-1
1
Volume ('000) DHBK (QAR)
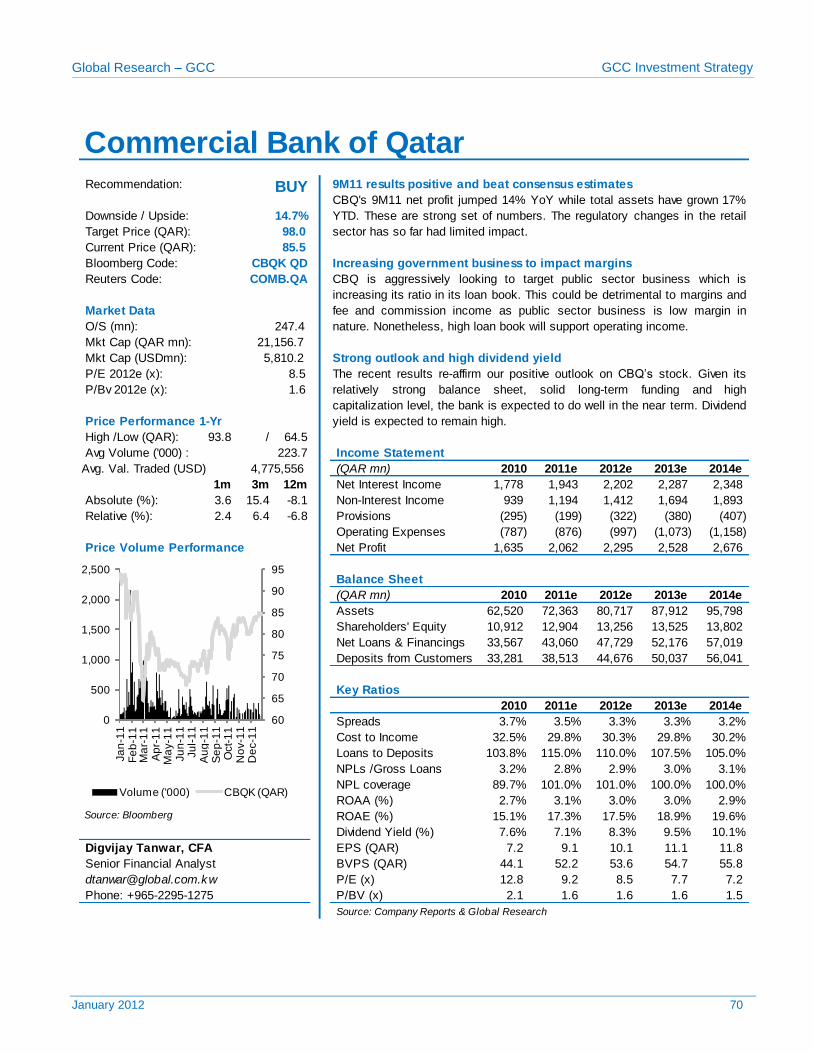
Global Research – GCC GCC Investment Strategy
January 2012 70
Recommendation: 9M11 results positive and beat consensus estimates
Bloomberg Code: Increasing government business to impact margins
Reuters Code:
O/S (mn):
Mkt Cap (USDmn): Strong outlook and high dividend yield
P/E 2012e (x):
P/Bv 2012e (x):
High /Low (QAR): 93.8 / 64.5
Avg Volume ('000) : Income Statement
(QAR mn) 2010 2011e 2012e 2013e 2014e
1m 3m 12m Net Interest Income 1,778 1,943 2,202 2,287 2,348
Absolute (%): 3.6 15.4 -8.1 Non-Interest Income 939 1,194 1,412 1,694 1,893
Relative (%): 2.4 6.4 -6.8 Provisions (295) (199) (322) (380) (407)
Operating Expenses (787) (876) (997) (1,073) (1,158)
Price Volume Performance Net Profit 1,635 2,062 2,295 2,528 2,676
Balance Sheet
(QAR mn) 2010 2011e 2012e 2013e 2014e
Assets 62,520 72,363 80,717 87,912 95,798
Shareholders' Equity 10,912 12,904 13,256 13,525 13,802
Net Loans & Financings 33,567 43,060 47,729 52,176 57,019
Deposits from Customers 33,281 38,513 44,676 50,037 56,041
Key Ratios
2010 2011e 2012e 2013e 2014e
Spreads 3.7% 3.5% 3.3% 3.3% 3.2%
Cost to Income 32.5% 29.8% 30.3% 29.8% 30.2%
Loans to Deposits 103.8% 115.0% 110.0% 107.5% 105.0%
NPLs /Gross Loans 3.2% 2.8% 2.9% 3.0% 3.1%
NPL coverage 89.7% 101.0% 101.0% 100.0% 100.0%
ROAA (%) 2.7% 3.1% 3.0% 3.0% 2.9% Source: Bloomberg ROAE (%) 15.1% 17.3% 17.5% 18.9% 19.6%
Dividend Yield (%) 7.6% 7.1% 8.3% 9.5% 10.1%
Digvijay Tanwar, CFA EPS (QAR) 7.2 9.1 10.1 11.1 11.8
BVPS (QAR) 44.1 52.2 53.6 54.7 55.8
P/E (x) 12.8 9.2 8.5 7.7 7.2
P/BV (x) 2.1 1.6 1.6 1.6 1.5
Source: Company Reports & Global Research
21,156.7 Mkt Cap (QAR mn):
Phone: +965-2295-1275
5,810.2
8.5
1.6
Price Performance 1-Yr
223.7
Senior Financial Analyst
4,775,556 Avg. Val. Traded (USD)
CBQ is aggressively looking to target public sector business which is
increasing its ratio in its loan book. This could be detrimental to margins and
fee and commission income as public sector business is low margin in
nature. Nonetheless, high loan book will support operating income.
The recent results re-affirm our positive outlook on CBQ’s stock. Given its
relatively strong balance sheet, solid long-term funding and high
capitalization level, the bank is expected to do well in the near term. Dividend
yield is expected to remain high.
Commercial Bank of Qatar
Downside / Upside: 14.7%
98.0
85.5
Target Price (QAR):
Current Price (QAR):
BUY CBQ's 9M11 net profit jumped 14% YoY while total assets have grown 17%
YTD. These are strong set of numbers. The regulatory changes in the retail
sector has so far had limited impact.
CBQK QD
COMB.QA
Market Data
247.4
60
65
70
75
80
85
90
95
0
500
1,000
1,500
2,000
2,500
Ja
n-1
1F
eb
-11
Ma
r-1
1A
pr-
11
Ma
y-1
1Ju
n-1
1Ju
l-1
1A
ug
-11
Se
p-1
1O
ct-
11
No
v-1
1D
ec-1
1
Volume ('000) CBQK (QAR)
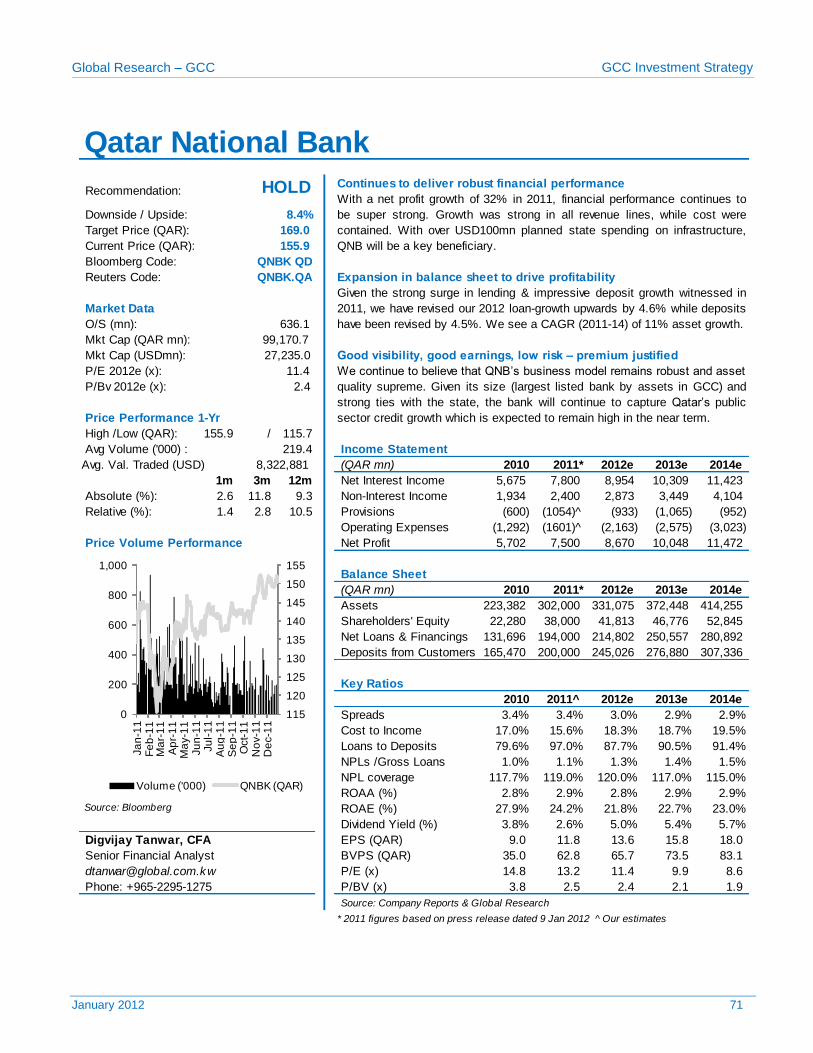
Global Research – GCC GCC Investment Strategy
January 2012 71
Continues to deliver robust financial performance
Bloomberg Code:
Reuters Code: Expansion in balance sheet to drive profitability
O/S (mn):
Mkt Cap (USDmn): Good visibility, good earnings, low risk – premium justified
P/E 2012e (x):
P/Bv 2012e (x):
High /Low (QAR): 155.9 / 115.7
Avg Volume ('000) : Income Statement
(QAR mn) 2010 2011* 2012e 2013e 2014e
1m 3m 12m Net Interest Income 5,675 7,800 8,954 10,309 11,423
Absolute (%): 2.6 11.8 9.3 Non-Interest Income 1,934 2,400 2,873 3,449 4,104
Relative (%): 1.4 2.8 10.5 Provisions (600) (1054)^ (933) (1,065) (952)
Operating Expenses (1,292) (1601)^ (2,163) (2,575) (3,023)
Price Volume Performance Net Profit 5,702 7,500 8,670 10,048 11,472
Balance Sheet
(QAR mn) 2010 2011* 2012e 2013e 2014e
Assets 223,382 302,000 331,075 372,448 414,255
Shareholders' Equity 22,280 38,000 41,813 46,776 52,845
Net Loans & Financings 131,696 194,000 214,802 250,557 280,892
Deposits from Customers 165,470 200,000 245,026 276,880 307,336
Key Ratios
2010 2011^ 2012e 2013e 2014e
Spreads 3.4% 3.4% 3.0% 2.9% 2.9%
Cost to Income 17.0% 15.6% 18.3% 18.7% 19.5%
Loans to Deposits 79.6% 97.0% 87.7% 90.5% 91.4%
NPLs /Gross Loans 1.0% 1.1% 1.3% 1.4% 1.5%
NPL coverage 117.7% 119.0% 120.0% 117.0% 115.0%
ROAA (%) 2.8% 2.9% 2.8% 2.9% 2.9% Source: Bloomberg ROAE (%) 27.9% 24.2% 21.8% 22.7% 23.0%
Dividend Yield (%) 3.8% 2.6% 5.0% 5.4% 5.7%
Digvijay Tanwar, CFA EPS (QAR) 9.0 11.8 13.6 15.8 18.0
BVPS (QAR) 35.0 62.8 65.7 73.5 83.1
P/E (x) 14.8 13.2 11.4 9.9 8.6
P/BV (x) 3.8 2.5 2.4 2.1 1.9
Source: Company Reports & Global Research
* 2011 figures based on press release dated 9 Jan 2012 ^ Our estimates
We continue to believe that QNB’s business model remains robust and asset
quality supreme. Given its size (largest listed bank by assets in GCC) and
strong ties with the state, the bank will continue to capture Qatar’s public
sector credit growth which is expected to remain high in the near term.
Given the strong surge in lending & impressive deposit growth witnessed in
2011, we have revised our 2012 loan-growth upwards by 4.6% while deposits
have been revised by 4.5%. We see a CAGR (2011-14) of 11% asset growth.
99,170.7 Mkt Cap (QAR mn):
Phone: +965-2295-1275
27,235.0
11.4
2.4
Price Performance 1-Yr
219.4
Senior Financial Analyst
8,322,881 Avg. Val. Traded (USD)
QNBK QD
QNBK.QA
Market Data
636.1
Qatar National Bank
Recommendation: HOLD
Downside / Upside: 8.4%
169.0
155.9
Target Price (QAR):
Current Price (QAR):
With a net profit growth of 32% in 2011, financial performance continues to
be super strong. Growth was strong in all revenue lines, while cost were
contained. With over USD100mn planned state spending on infrastructure,
QNB will be a key beneficiary.
115
120
125
130
135
140
145
150
155
0
200
400
600
800
1,000
Ja
n-1
1F
eb
-11
Ma
r-1
1A
pr-
11
Ma
y-1
1Ju
n-1
1Ju
l-1
1A
ug
-11
Se
p-1
1O
ct-
11
No
v-1
1D
ec-1
1
Volume ('000) QNBK (QAR)
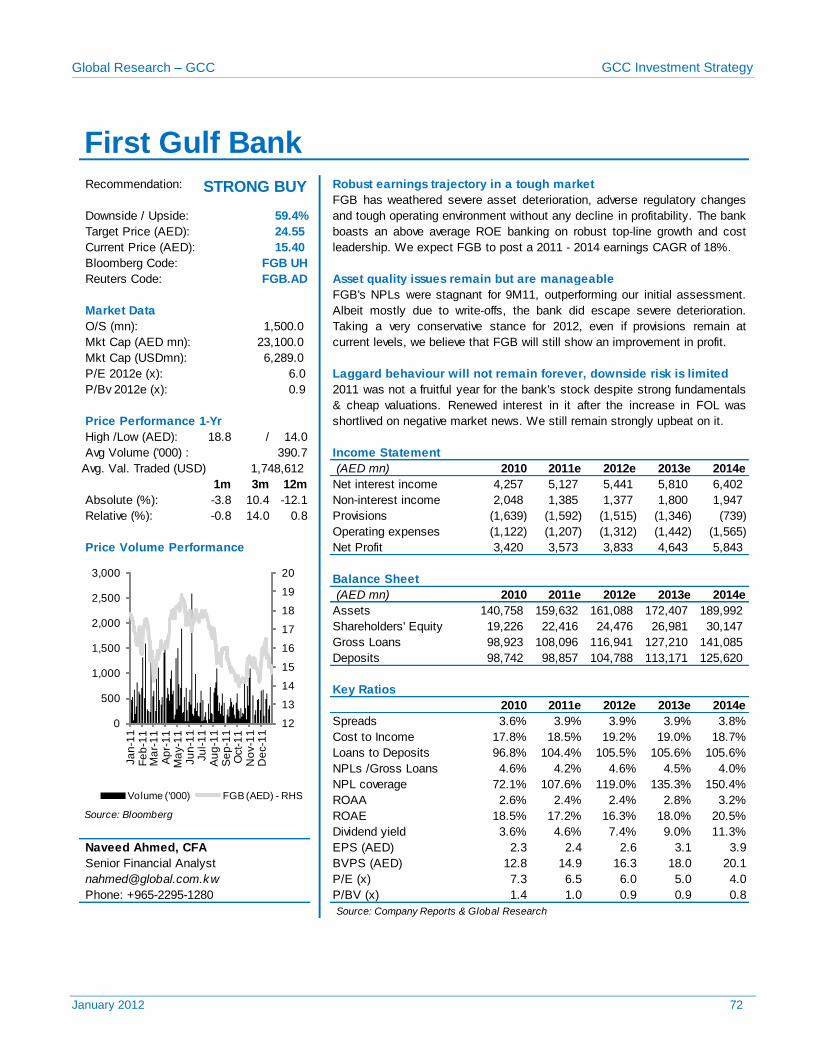
Global Research – GCC GCC Investment Strategy
January 2012 72
Recommendation: Robust earnings trajectory in a tough market
Bloomberg Code:
Reuters Code: Asset quality issues remain but are manageable
O/S (mn):
Mkt Cap (USDmn):
P/E 2012e (x): Laggard behaviour will not remain forever, downside risk is limited
P/Bv 2012e (x):
High /Low (AED): 18.8 / 14.0
Avg Volume ('000) :
(AED mn) 2010 2011e 2012e 2013e 2014e
1m 3m 12m Net interest income 4,257 5,127 5,441 5,810 6,402
Absolute (%): -3.8 10.4 -12.1 Non-interest income 2,048 1,385 1,377 1,800 1,947
Relative (%): -0.8 14.0 0.8 Provisions (1,639) (1,592) (1,515) (1,346) (739)
Operating expenses (1,122) (1,207) (1,312) (1,442) (1,565)
Price Volume Performance Net Profit 3,420 3,573 3,833 4,643 5,843
(AED mn) 2010 2011e 2012e 2013e 2014e
Assets 140,758 159,632 161,088 172,407 189,992
Shareholders' Equity 19,226 22,416 24,476 26,981 30,147
Gross Loans 98,923 108,096 116,941 127,210 141,085
Deposits 98,742 98,857 104,788 113,171 125,620
2010 2011e 2012e 2013e 2014e
Spreads 3.6% 3.9% 3.9% 3.9% 3.8%
Cost to Income 17.8% 18.5% 19.2% 19.0% 18.7%
Loans to Deposits 96.8% 104.4% 105.5% 105.6% 105.6%
NPLs /Gross Loans 4.6% 4.2% 4.6% 4.5% 4.0%
NPL coverage 72.1% 107.6% 119.0% 135.3% 150.4%
ROAA 2.6% 2.4% 2.4% 2.8% 3.2% Source: Bloomberg ROAE 18.5% 17.2% 16.3% 18.0% 20.5%
Dividend yield 3.6% 4.6% 7.4% 9.0% 11.3%
EPS (AED) 2.3 2.4 2.6 3.1 3.9
BVPS (AED) 12.8 14.9 16.3 18.0 20.1
P/E (x) 7.3 6.5 6.0 5.0 4.0
P/BV (x) 1.4 1.0 0.9 0.9 0.8
Source: Company Reports & Global Research
Phone: +965-2295-1280
Balance Sheet
Key Ratios
Senior Financial Analyst
Naveed Ahmed, CFA
6,289.0
6.0
0.9 2011 was not a fruitful year for the bank's stock despite strong fundamentals
& cheap valuations. Renewed interest in it after the increase in FOL was
shortlived on negative market news. We still remain strongly upbeat on it. Price Performance 1-Yr
FGB.AD
FGB's NPLs were stagnant for 9M11, outperforming our initial assessment.
Albeit mostly due to write-offs, the bank did escape severe deterioration.
Taking a very conservative stance for 2012, even if provisions remain at
current levels, we believe that FGB will still show an improvement in profit.
Market Data
1,500.0
1,748,612 Avg. Val. Traded (USD)
23,100.0 Mkt Cap (AED mn):
First Gulf Bank
FGB has weathered severe asset deterioration, adverse regulatory changes
and tough operating environment without any decline in profitability. The bank
boasts an above average ROE banking on robust top-line growth and cost
leadership. We expect FGB to post a 2011 - 2014 earnings CAGR of 18%.
Downside / Upside: 59.4%
Target Price (AED): 24.55
Current Price (AED): 15.40
STRONG BUY
390.7 Income Statement
FGB UH
12
13
14
15
16
17
18
19
20
0
500
1,000
1,500
2,000
2,500
3,000
Ja
n-1
1F
eb
-11
Ma
r-1
1A
pr-
11
Ma
y-1
1Ju
n-1
1Ju
l-1
1A
ug
-11
Se
p-1
1O
ct-
11
No
v-1
1D
ec-1
1
Volume ('000) FGB (AED) - RHS
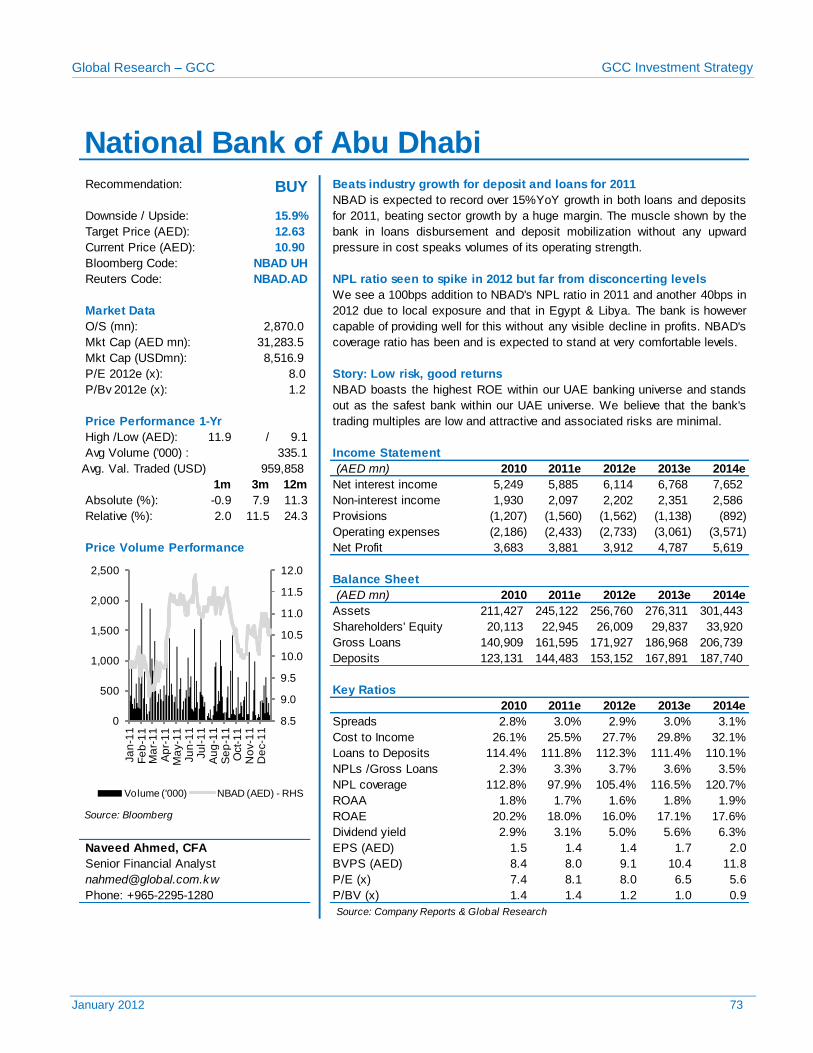
Global Research – GCC GCC Investment Strategy
January 2012 73
Recommendation: Beats industry growth for deposit and loans for 2011
Bloomberg Code:
Reuters Code: NPL ratio seen to spike in 2012 but far from disconcerting levels
O/S (mn):
Mkt Cap (USDmn):
P/E 2012e (x): Story: Low risk, good returns
P/Bv 2012e (x):
High /Low (AED): 11.9 / 9.1
Avg Volume ('000) :
(AED mn) 2010 2011e 2012e 2013e 2014e
1m 3m 12m Net interest income 5,249 5,885 6,114 6,768 7,652
Absolute (%): -0.9 7.9 11.3 Non-interest income 1,930 2,097 2,202 2,351 2,586
Relative (%): 2.0 11.5 24.3 Provisions (1,207) (1,560) (1,562) (1,138) (892)
Operating expenses (2,186) (2,433) (2,733) (3,061) (3,571)
Price Volume Performance Net Profit 3,683 3,881 3,912 4,787 5,619
(AED mn) 2010 2011e 2012e 2013e 2014e
Assets 211,427 245,122 256,760 276,311 301,443
Shareholders' Equity 20,113 22,945 26,009 29,837 33,920
Gross Loans 140,909 161,595 171,927 186,968 206,739
Deposits 123,131 144,483 153,152 167,891 187,740
2010 2011e 2012e 2013e 2014e
Spreads 2.8% 3.0% 2.9% 3.0% 3.1%
Cost to Income 26.1% 25.5% 27.7% 29.8% 32.1%
Loans to Deposits 114.4% 111.8% 112.3% 111.4% 110.1%
NPLs /Gross Loans 2.3% 3.3% 3.7% 3.6% 3.5%
NPL coverage 112.8% 97.9% 105.4% 116.5% 120.7%
ROAA 1.8% 1.7% 1.6% 1.8% 1.9% Source: Bloomberg ROAE 20.2% 18.0% 16.0% 17.1% 17.6%
Dividend yield 2.9% 3.1% 5.0% 5.6% 6.3%
EPS (AED) 1.5 1.4 1.4 1.7 2.0
BVPS (AED) 8.4 8.0 9.1 10.4 11.8
P/E (x) 7.4 8.1 8.0 6.5 5.6
P/BV (x) 1.4 1.4 1.2 1.0 0.9
Source: Company Reports & Global Research
Phone: +965-2295-1280
Balance Sheet
Key Ratios
Senior Financial Analyst
Naveed Ahmed, CFA
8,516.9
8.0
1.2 NBAD boasts the highest ROE within our UAE banking universe and stands
out as the safest bank within our UAE universe. We believe that the bank's
trading multiples are low and attractive and associated risks are minimal. Price Performance 1-Yr
NBAD.AD
We see a 100bps addition to NBAD's NPL ratio in 2011 and another 40bps in
2012 due to local exposure and that in Egypt & Libya. The bank is however
capable of providing well for this without any visible decline in profits. NBAD's
coverage ratio has been and is expected to stand at very comfortable levels.
Market Data
2,870.0
959,858 Avg. Val. Traded (USD)
31,283.5 Mkt Cap (AED mn):
National Bank of Abu Dhabi
NBAD is expected to record over 15%YoY growth in both loans and deposits
for 2011, beating sector growth by a huge margin. The muscle shown by the
bank in loans disbursement and deposit mobilization without any upward
pressure in cost speaks volumes of its operating strength.
Downside / Upside: 15.9%
Target Price (AED): 12.63
Current Price (AED): 10.90
BUY
335.1 Income Statement
NBAD UH
8.5
9.0
9.5
10.0
10.5
11.0
11.5
12.0
0
500
1,000
1,500
2,000
2,500
Ja
n-1
1F
eb
-11
Ma
r-1
1A
pr-
11
Ma
y-1
1Ju
n-1
1Ju
l-1
1A
ug
-11
Se
p-1
1O
ct-
11
No
v-1
1D
ec-1
1
Volume ('000) NBAD (AED) - RHS
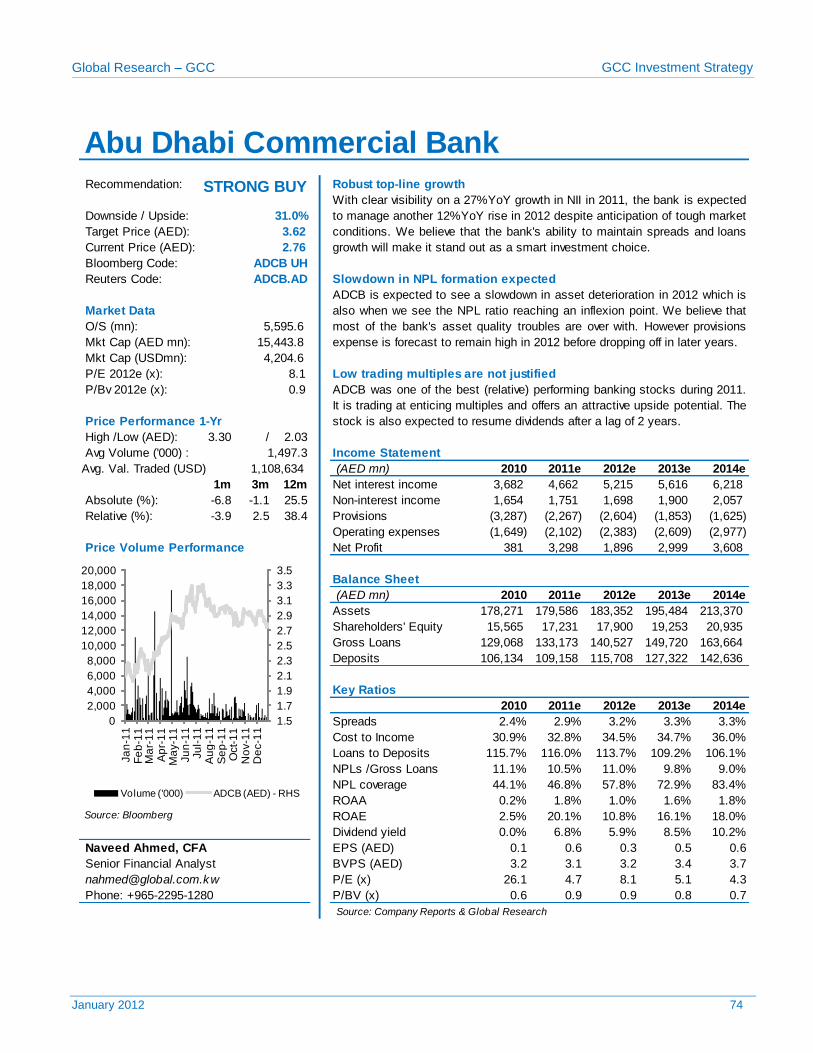
Global Research – GCC GCC Investment Strategy
January 2012 74
Recommendation: Robust top-line growth
Bloomberg Code:
Reuters Code: Slowdown in NPL formation expected
O/S (mn):
Mkt Cap (USDmn):
P/E 2012e (x): Low trading multiples are not justified
P/Bv 2012e (x):
High /Low (AED): 3.30 / 2.03
Avg Volume ('000) :
(AED mn) 2010 2011e 2012e 2013e 2014e
1m 3m 12m Net interest income 3,682 4,662 5,215 5,616 6,218
Absolute (%): -6.8 -1.1 25.5 Non-interest income 1,654 1,751 1,698 1,900 2,057
Relative (%): -3.9 2.5 38.4 Provisions (3,287) (2,267) (2,604) (1,853) (1,625)
Operating expenses (1,649) (2,102) (2,383) (2,609) (2,977)
Price Volume Performance Net Profit 381 3,298 1,896 2,999 3,608
(AED mn) 2010 2011e 2012e 2013e 2014e
Assets 178,271 179,586 183,352 195,484 213,370
Shareholders' Equity 15,565 17,231 17,900 19,253 20,935
Gross Loans 129,068 133,173 140,527 149,720 163,664
Deposits 106,134 109,158 115,708 127,322 142,636
2010 2011e 2012e 2013e 2014e
Spreads 2.4% 2.9% 3.2% 3.3% 3.3%
Cost to Income 30.9% 32.8% 34.5% 34.7% 36.0%
Loans to Deposits 115.7% 116.0% 113.7% 109.2% 106.1%
NPLs /Gross Loans 11.1% 10.5% 11.0% 9.8% 9.0%
NPL coverage 44.1% 46.8% 57.8% 72.9% 83.4%
ROAA 0.2% 1.8% 1.0% 1.6% 1.8% Source: Bloomberg ROAE 2.5% 20.1% 10.8% 16.1% 18.0%
Dividend yield 0.0% 6.8% 5.9% 8.5% 10.2%
EPS (AED) 0.1 0.6 0.3 0.5 0.6
BVPS (AED) 3.2 3.1 3.2 3.4 3.7
P/E (x) 26.1 4.7 8.1 5.1 4.3
P/BV (x) 0.6 0.9 0.9 0.8 0.7
Source: Company Reports & Global Research
Phone: +965-2295-1280
Balance Sheet
Key Ratios
Senior Financial Analyst
Naveed Ahmed, CFA
4,204.6
8.1
0.9 ADCB was one of the best (relative) performing banking stocks during 2011.
It is trading at enticing multiples and offers an attractive upside potential. The
stock is also expected to resume dividends after a lag of 2 years. Price Performance 1-Yr
ADCB.AD
ADCB is expected to see a slowdown in asset deterioration in 2012 which is
also when we see the NPL ratio reaching an inflexion point. We believe that
most of the bank's asset quality troubles are over with. However provisions
expense is forecast to remain high in 2012 before dropping off in later years.
Market Data
5,595.6
1,108,634 Avg. Val. Traded (USD)
15,443.8 Mkt Cap (AED mn):
Abu Dhabi Commercial Bank
With clear visibility on a 27%YoY growth in NII in 2011, the bank is expected
to manage another 12%YoY rise in 2012 despite anticipation of tough market
conditions. We believe that the bank's ability to maintain spreads and loans
growth will make it stand out as a smart investment choice.
Downside / Upside: 31.0%
Target Price (AED): 3.62
Current Price (AED): 2.76
STRONG BUY
1,497.3 Income Statement
ADCB UH
1.5
1.7
1.9
2.1
2.3
2.5
2.7
2.9
3.1
3.3
3.5
0
2,000
4,000
6,000
8,000
10,000
12,000
14,000
16,000
18,000
20,000
Ja
n-1
1F
eb
-11
Ma
r-1
1A
pr-
11
Ma
y-1
1Ju
n-1
1Ju
l-1
1A
ug
-11
Se
p-1
1O
ct-
11
No
v-1
1D
ec-1
1
Volume ('000) ADCB (AED) - RHS
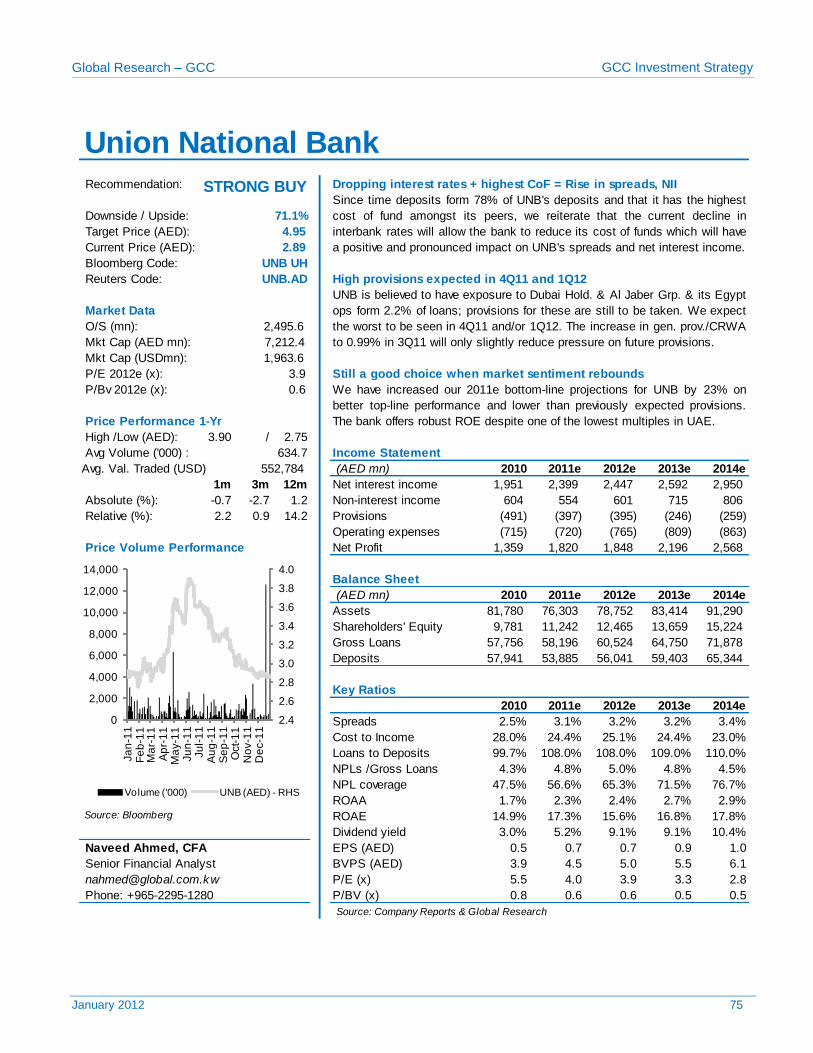
Global Research – GCC GCC Investment Strategy
January 2012 75
Recommendation: Dropping interest rates + highest CoF = Rise in spreads, NII
Bloomberg Code:
Reuters Code: High provisions expected in 4Q11 and 1Q12
O/S (mn):
Mkt Cap (USDmn):
P/E 2012e (x): Still a good choice when market sentiment rebounds
P/Bv 2012e (x):
High /Low (AED): 3.90 / 2.75
Avg Volume ('000) :
(AED mn) 2010 2011e 2012e 2013e 2014e
1m 3m 12m Net interest income 1,951 2,399 2,447 2,592 2,950
Absolute (%): -0.7 -2.7 1.2 Non-interest income 604 554 601 715 806
Relative (%): 2.2 0.9 14.2 Provisions (491) (397) (395) (246) (259)
Operating expenses (715) (720) (765) (809) (863)
Price Volume Performance Net Profit 1,359 1,820 1,848 2,196 2,568
(AED mn) 2010 2011e 2012e 2013e 2014e
Assets 81,780 76,303 78,752 83,414 91,290
Shareholders' Equity 9,781 11,242 12,465 13,659 15,224
Gross Loans 57,756 58,196 60,524 64,750 71,878
Deposits 57,941 53,885 56,041 59,403 65,344
2010 2011e 2012e 2013e 2014e
Spreads 2.5% 3.1% 3.2% 3.2% 3.4%
Cost to Income 28.0% 24.4% 25.1% 24.4% 23.0%
Loans to Deposits 99.7% 108.0% 108.0% 109.0% 110.0%
NPLs /Gross Loans 4.3% 4.8% 5.0% 4.8% 4.5%
NPL coverage 47.5% 56.6% 65.3% 71.5% 76.7%
ROAA 1.7% 2.3% 2.4% 2.7% 2.9% Source: Bloomberg ROAE 14.9% 17.3% 15.6% 16.8% 17.8%
Dividend yield 3.0% 5.2% 9.1% 9.1% 10.4%
EPS (AED) 0.5 0.7 0.7 0.9 1.0
BVPS (AED) 3.9 4.5 5.0 5.5 6.1
P/E (x) 5.5 4.0 3.9 3.3 2.8
P/BV (x) 0.8 0.6 0.6 0.5 0.5
Source: Company Reports & Global Research
Phone: +965-2295-1280
Balance Sheet
Key Ratios
Senior Financial Analyst
Naveed Ahmed, CFA
1,963.6
3.9
0.6 We have increased our 2011e bottom-line projections for UNB by 23% on
better top-line performance and lower than previously expected provisions.
The bank offers robust ROE despite one of the lowest multiples in UAE. Price Performance 1-Yr
UNB.AD
UNB is believed to have exposure to Dubai Hold. & Al Jaber Grp. & its Egypt
ops form 2.2% of loans; provisions for these are still to be taken. We expect
the worst to be seen in 4Q11 and/or 1Q12. The increase in gen. prov./CRWA
to 0.99% in 3Q11 will only slightly reduce pressure on future provisions.
Market Data
2,495.6
552,784 Avg. Val. Traded (USD)
7,212.4 Mkt Cap (AED mn):
Union National Bank
Since time deposits form 78% of UNB's deposits and that it has the highest
cost of fund amongst its peers, we reiterate that the current decline in
interbank rates will allow the bank to reduce its cost of funds which will have
a positive and pronounced impact on UNB's spreads and net interest income.
Downside / Upside: 71.1%
Target Price (AED): 4.95
Current Price (AED): 2.89
STRONG BUY
634.7 Income Statement
UNB UH
2.4
2.6
2.8
3.0
3.2
3.4
3.6
3.8
4.0
0
2,000
4,000
6,000
8,000
10,000
12,000
14,000
Ja
n-1
1F
eb
-11
Ma
r-1
1A
pr-
11
Ma
y-1
1Ju
n-1
1Ju
l-1
1A
ug
-11
Se
p-1
1O
ct-
11
No
v-1
1D
ec-1
1
Volume ('000) UNB (AED) - RHS
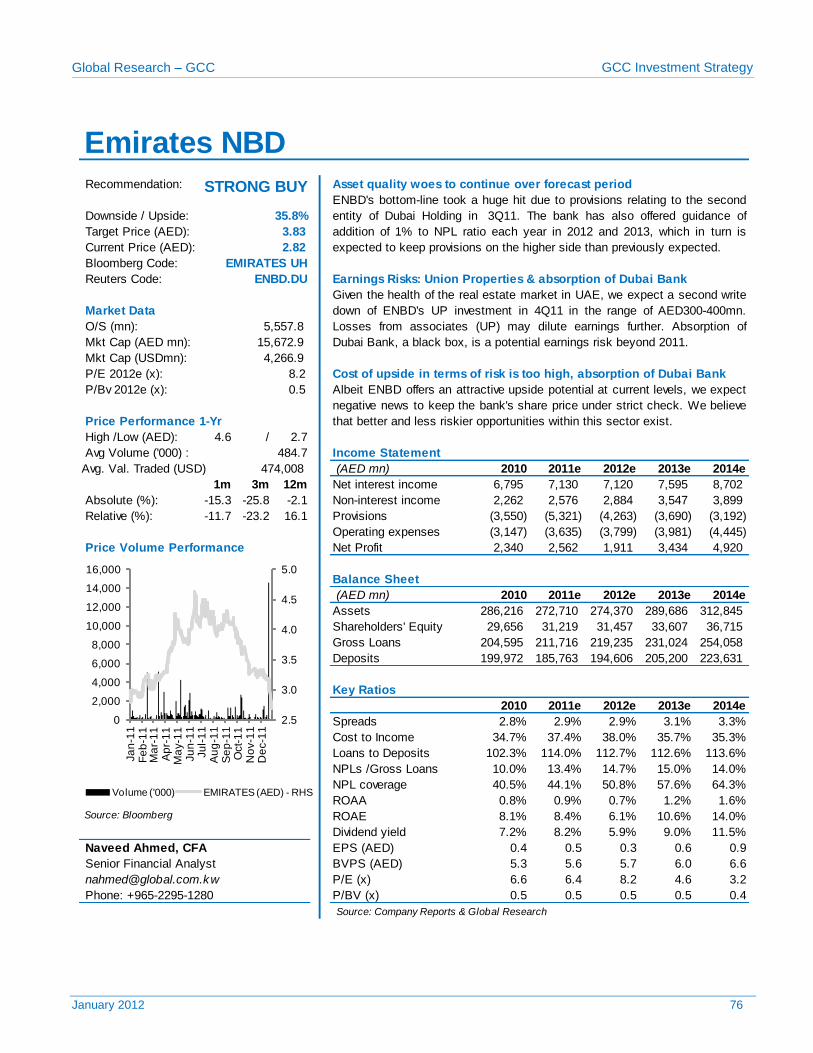
Global Research – GCC GCC Investment Strategy
January 2012 76
Recommendation: Asset quality woes to continue over forecast period
Bloomberg Code:
Reuters Code: Earnings Risks: Union Properties & absorption of Dubai Bank
O/S (mn):
Mkt Cap (USDmn):
P/E 2012e (x): Cost of upside in terms of risk is too high, absorption of Dubai Bank
P/Bv 2012e (x):
High /Low (AED): 4.6 / 2.7
Avg Volume ('000) :
(AED mn) 2010 2011e 2012e 2013e 2014e
1m 3m 12m Net interest income 6,795 7,130 7,120 7,595 8,702
Absolute (%): -15.3 -25.8 -2.1 Non-interest income 2,262 2,576 2,884 3,547 3,899
Relative (%): -11.7 -23.2 16.1 Provisions (3,550) (5,321) (4,263) (3,690) (3,192)
Operating expenses (3,147) (3,635) (3,799) (3,981) (4,445)
Price Volume Performance Net Profit 2,340 2,562 1,911 3,434 4,920
(AED mn) 2010 2011e 2012e 2013e 2014e
Assets 286,216 272,710 274,370 289,686 312,845
Shareholders' Equity 29,656 31,219 31,457 33,607 36,715
Gross Loans 204,595 211,716 219,235 231,024 254,058
Deposits 199,972 185,763 194,606 205,200 223,631
2010 2011e 2012e 2013e 2014e
Spreads 2.8% 2.9% 2.9% 3.1% 3.3%
Cost to Income 34.7% 37.4% 38.0% 35.7% 35.3%
Loans to Deposits 102.3% 114.0% 112.7% 112.6% 113.6%
NPLs /Gross Loans 10.0% 13.4% 14.7% 15.0% 14.0%
NPL coverage 40.5% 44.1% 50.8% 57.6% 64.3%
ROAA 0.8% 0.9% 0.7% 1.2% 1.6% Source: Bloomberg ROAE 8.1% 8.4% 6.1% 10.6% 14.0%
Dividend yield 7.2% 8.2% 5.9% 9.0% 11.5%
EPS (AED) 0.4 0.5 0.3 0.6 0.9
BVPS (AED) 5.3 5.6 5.7 6.0 6.6
P/E (x) 6.6 6.4 8.2 4.6 3.2
P/BV (x) 0.5 0.5 0.5 0.5 0.4
Source: Company Reports & Global Research
Phone: +965-2295-1280
Balance Sheet
Key Ratios
Senior Financial Analyst
Naveed Ahmed, CFA
4,266.9
8.2
0.5 Albeit ENBD offers an attractive upside potential at current levels, we expect
negative news to keep the bank's share price under strict check. We believe
that better and less riskier opportunities within this sector exist. Price Performance 1-Yr
ENBD.DU
Given the health of the real estate market in UAE, we expect a second write
down of ENBD's UP investment in 4Q11 in the range of AED300-400mn.
Losses from associates (UP) may dilute earnings further. Absorption of
Dubai Bank, a black box, is a potential earnings risk beyond 2011.
Market Data
5,557.8
474,008 Avg. Val. Traded (USD)
15,672.9 Mkt Cap (AED mn):
Emirates NBD
ENBD's bottom-line took a huge hit due to provisions relating to the second
entity of Dubai Holding in 3Q11. The bank has also offered guidance of
addition of 1% to NPL ratio each year in 2012 and 2013, which in turn is
expected to keep provisions on the higher side than previously expected.
Downside / Upside: 35.8%
Target Price (AED): 3.83
Current Price (AED): 2.82
STRONG BUY
484.7 Income Statement
EMIRATES UH
2.5
3.0
3.5
4.0
4.5
5.0
0
2,000
4,000
6,000
8,000
10,000
12,000
14,000
16,000
Ja
n-1
1F
eb
-11
Ma
r-1
1A
pr-
11
Ma
y-1
1Ju
n-1
1Ju
l-1
1A
ug
-11
Se
p-1
1O
ct-
11
No
v-1
1D
ec-1
1
Volume ('000) EMIRATES (AED) - RHS
Global Research – GCC GCC Investment Strategy
January 2012 77
CEMENT & BUILDING MATERIALS
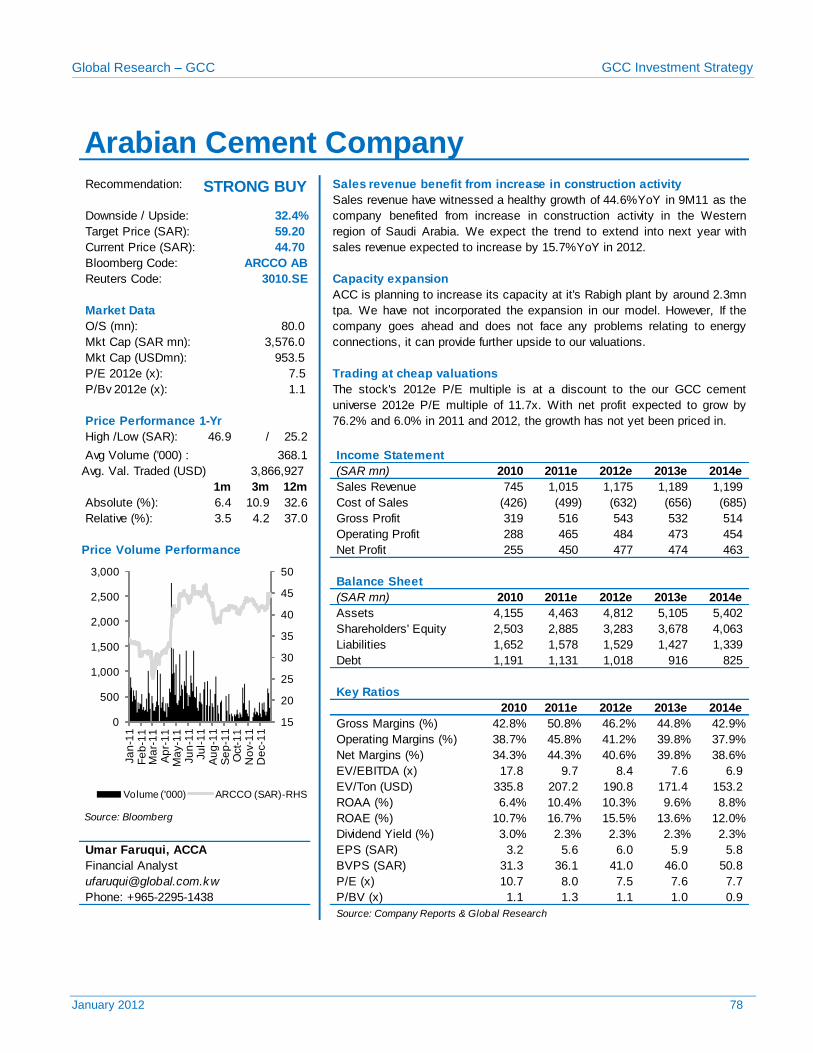
Global Research – GCC GCC Investment Strategy
January 2012 78
Recommendation: Sales revenue benefit from increase in construction activity
Bloomberg Code:
Reuters Code: Capacity expansion
O/S (mn):
Mkt Cap (USDmn):
P/E 2012e (x): Trading at cheap valuations
P/Bv 2012e (x):
High /Low (SAR): 46.9 / 25.2
Avg Volume ('000) :
(SAR mn) 2010 2011e 2012e 2013e 2014e
1m 3m 12m Sales Revenue 745 1,015 1,175 1,189 1,199
Absolute (%): 6.4 10.9 32.6 Cost of Sales (426) (499) (632) (656) (685)
Relative (%): 3.5 4.2 37.0 Gross Profit 319 516 543 532 514
Operating Profit 288 465 484 473 454
Price Volume Performance Net Profit 255 450 477 474 463
Balance Sheet
(SAR mn) 2010 2011e 2012e 2013e 2014e
Assets 4,155 4,463 4,812 5,105 5,402
Shareholders' Equity 2,503 2,885 3,283 3,678 4,063
Liabilities 1,652 1,578 1,529 1,427 1,339
Debt 1,191 1,131 1,018 916 825
Key Ratios
2010 2011e 2012e 2013e 2014e
Gross Margins (%) 42.8% 50.8% 46.2% 44.8% 42.9%
Operating Margins (%) 38.7% 45.8% 41.2% 39.8% 37.9%
Net Margins (%) 34.3% 44.3% 40.6% 39.8% 38.6%
EV/EBITDA (x) 17.8 9.7 8.4 7.6 6.9
EV/Ton (USD) 335.8 207.2 190.8 171.4 153.2
ROAA (%) 6.4% 10.4% 10.3% 9.6% 8.8% Source: Bloomberg ROAE (%) 10.7% 16.7% 15.5% 13.6% 12.0%
Dividend Yield (%) 3.0% 2.3% 2.3% 2.3% 2.3%
EPS (SAR) 3.2 5.6 6.0 5.9 5.8
BVPS (SAR) 31.3 36.1 41.0 46.0 50.8
P/E (x) 10.7 8.0 7.5 7.6 7.7
P/BV (x) 1.1 1.3 1.1 1.0 0.9
Source: Company Reports & Global Research
Phone: +965-2295-1438
953.5
7.5
1.1 The stock's 2012e P/E multiple is at a discount to the our GCC cement
universe 2012e P/E multiple of 11.7x. With net profit expected to grow by
76.2% and 6.0% in 2011 and 2012, the growth has not yet been priced in. Price Performance 1-Yr
368.1 Income Statement
Financial Analyst
3,866,927 Avg. Val. Traded (USD)
Umar Faruqui, ACCA
ARCCO AB
3010.SE
ACC is planning to increase its capacity at it's Rabigh plant by around 2.3mn
tpa. We have not incorporated the expansion in our model. However, If the
company goes ahead and does not face any problems relating to energy
connections, it can provide further upside to our valuations.
Market Data
80.0
3,576.0 Mkt Cap (SAR mn):
Arabian Cement Company
Sales revenue have witnessed a healthy growth of 44.6%YoY in 9M11 as the
company benefited from increase in construction activity in the Western
region of Saudi Arabia. We expect the trend to extend into next year with
sales revenue expected to increase by 15.7%YoY in 2012.
Downside / Upside: 32.4%
59.20
44.70
Target Price (SAR):
Current Price (SAR):
STRONG BUY
15
20
25
30
35
40
45
50
0
500
1,000
1,500
2,000
2,500
3,000
Ja
n-1
1F
eb
-11
Ma
r-1
1A
pr-
11
Ma
y-1
1Ju
n-1
1Ju
l-1
1A
ug
-11
Se
p-1
1O
ct-
11
No
v-1
1D
ec-1
1
Volume ('000) ARCCO (SAR)-RHS
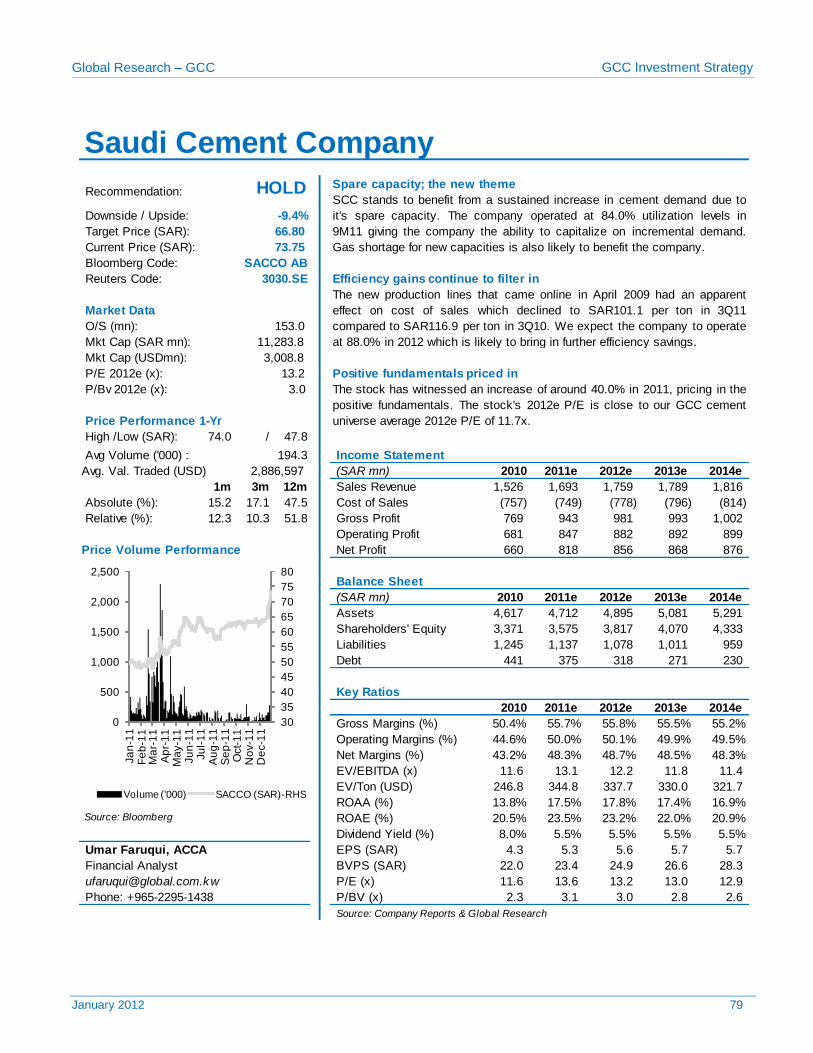
Global Research – GCC GCC Investment Strategy
January 2012 79
Spare capacity; the new theme
Bloomberg Code:
Reuters Code: Efficiency gains continue to filter in
O/S (mn):
Mkt Cap (USDmn):
P/E 2012e (x): Positive fundamentals priced in
P/Bv 2012e (x):
High /Low (SAR): 74.0 / 47.8
Avg Volume ('000) :
(SAR mn) 2010 2011e 2012e 2013e 2014e
1m 3m 12m Sales Revenue 1,526 1,693 1,759 1,789 1,816
Absolute (%): 15.2 17.1 47.5 Cost of Sales (757) (749) (778) (796) (814)
Relative (%): 12.3 10.3 51.8 Gross Profit 769 943 981 993 1,002
Operating Profit 681 847 882 892 899
Price Volume Performance Net Profit 660 818 856 868 876
Balance Sheet
(SAR mn) 2010 2011e 2012e 2013e 2014e
Assets 4,617 4,712 4,895 5,081 5,291
Shareholders' Equity 3,371 3,575 3,817 4,070 4,333
Liabilities 1,245 1,137 1,078 1,011 959
Debt 441 375 318 271 230
Key Ratios
2010 2011e 2012e 2013e 2014e
Gross Margins (%) 50.4% 55.7% 55.8% 55.5% 55.2%
Operating Margins (%) 44.6% 50.0% 50.1% 49.9% 49.5%
Net Margins (%) 43.2% 48.3% 48.7% 48.5% 48.3%
EV/EBITDA (x) 11.6 13.1 12.2 11.8 11.4
EV/Ton (USD) 246.8 344.8 337.7 330.0 321.7
ROAA (%) 13.8% 17.5% 17.8% 17.4% 16.9% Source: Bloomberg ROAE (%) 20.5% 23.5% 23.2% 22.0% 20.9%
Dividend Yield (%) 8.0% 5.5% 5.5% 5.5% 5.5%
EPS (SAR) 4.3 5.3 5.6 5.7 5.7
BVPS (SAR) 22.0 23.4 24.9 26.6 28.3
P/E (x) 11.6 13.6 13.2 13.0 12.9
P/BV (x) 2.3 3.1 3.0 2.8 2.6
Source: Company Reports & Global Research
Phone: +965-2295-1438
3,008.8
13.2
3.0 The stock has witnessed an increase of around 40.0% in 2011, pricing in the
positive fundamentals. The stock's 2012e P/E is close to our GCC cement
universe average 2012e P/E of 11.7x. Price Performance 1-Yr
194.3 Income Statement
Financial Analyst
2,886,597 Avg. Val. Traded (USD)
Umar Faruqui, ACCA
SACCO AB
3030.SE
The new production lines that came online in April 2009 had an apparent
effect on cost of sales which declined to SAR101.1 per ton in 3Q11
compared to SAR116.9 per ton in 3Q10. We expect the company to operate
at 88.0% in 2012 which is likely to bring in further efficiency savings.
Market Data
153.0
11,283.8 Mkt Cap (SAR mn):
Saudi Cement Company
Recommendation: HOLD SCC stands to benefit from a sustained increase in cement demand due to
it's spare capacity. The company operated at 84.0% utilization levels in
9M11 giving the company the ability to capitalize on incremental demand.
Gas shortage for new capacities is also likely to benefit the company.
Downside / Upside: -9.4%
66.80
73.75
Target Price (SAR):
Current Price (SAR):
30
35
40
45
50
55
60
65
70
75
80
0
500
1,000
1,500
2,000
2,500
Ja
n-1
1F
eb
-11
Ma
r-1
1A
pr-
11
Ma
y-1
1Ju
n-1
1Ju
l-1
1A
ug
-11
Se
p-1
1O
ct-
11
No
v-1
1D
ec-1
1
Volume ('000) SACCO (SAR)-RHS
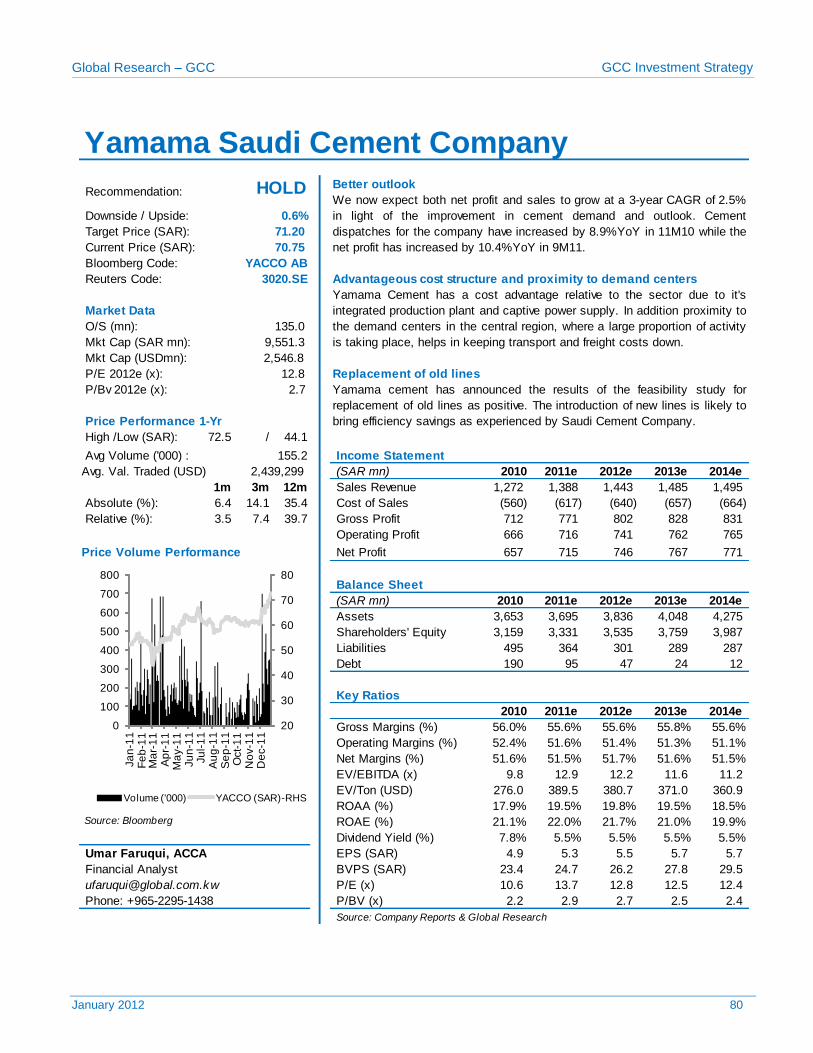
Global Research – GCC GCC Investment Strategy
January 2012 80
Better outlook
Bloomberg Code:
Reuters Code: Advantageous cost structure and proximity to demand centers
O/S (mn):
Mkt Cap (USDmn):
P/E 2012e (x): Replacement of old lines
P/Bv 2012e (x):
High /Low (SAR): 72.5 / 44.1
Avg Volume ('000) :
(SAR mn) 2010 2011e 2012e 2013e 2014e
1m 3m 12m Sales Revenue 1,272 1,388 1,443 1,485 1,495
Absolute (%): 6.4 14.1 35.4 Cost of Sales (560) (617) (640) (657) (664)
Relative (%): 3.5 7.4 39.7 Gross Profit 712 771 802 828 831
Operating Profit 666 716 741 762 765
Price Volume Performance Net Profit 657 715 746 767 771
Balance Sheet
(SAR mn) 2010 2011e 2012e 2013e 2014e
Assets 3,653 3,695 3,836 4,048 4,275
Shareholders' Equity 3,159 3,331 3,535 3,759 3,987
Liabilities 495 364 301 289 287
Debt 190 95 47 24 12
Key Ratios
2010 2011e 2012e 2013e 2014e
Gross Margins (%) 56.0% 55.6% 55.6% 55.8% 55.6%
Operating Margins (%) 52.4% 51.6% 51.4% 51.3% 51.1%
Net Margins (%) 51.6% 51.5% 51.7% 51.6% 51.5%
EV/EBITDA (x) 9.8 12.9 12.2 11.6 11.2
EV/Ton (USD) 276.0 389.5 380.7 371.0 360.9
ROAA (%) 17.9% 19.5% 19.8% 19.5% 18.5% Source: Bloomberg ROAE (%) 21.1% 22.0% 21.7% 21.0% 19.9%
Dividend Yield (%) 7.8% 5.5% 5.5% 5.5% 5.5%
EPS (SAR) 4.9 5.3 5.5 5.7 5.7
BVPS (SAR) 23.4 24.7 26.2 27.8 29.5
P/E (x) 10.6 13.7 12.8 12.5 12.4
P/BV (x) 2.2 2.9 2.7 2.5 2.4
Source: Company Reports & Global Research
Phone: +965-2295-1438
2,546.8
12.8
2.7 Yamama cement has announced the results of the feasibility study for
replacement of old lines as positive. The introduction of new lines is likely to
bring efficiency savings as experienced by Saudi Cement Company. Price Performance 1-Yr
155.2 Income Statement
Financial Analyst
2,439,299 Avg. Val. Traded (USD)
Umar Faruqui, ACCA
YACCO AB
3020.SE
Yamama Cement has a cost advantage relative to the sector due to it's
integrated production plant and captive power supply. In addition proximity to
the demand centers in the central region, where a large proportion of activity
is taking place, helps in keeping transport and freight costs down.
Market Data
135.0
9,551.3 Mkt Cap (SAR mn):
Yamama Saudi Cement Company
Recommendation: HOLD We now expect both net profit and sales to grow at a 3-year CAGR of 2.5%
in light of the improvement in cement demand and outlook. Cement
dispatches for the company have increased by 8.9%YoY in 11M10 while the
net profit has increased by 10.4%YoY in 9M11.
Downside / Upside: 0.6%
71.20
70.75
Target Price (SAR):
Current Price (SAR):
20
30
40
50
60
70
80
0
100
200
300
400
500
600
700
800
Ja
n-1
1F
eb
-11
Ma
r-1
1A
pr-
11
Ma
y-1
1Ju
n-1
1Ju
l-1
1A
ug
-11
Se
p-1
1O
ct-
11
No
v-1
1D
ec-1
1
Volume ('000) YACCO (SAR)-RHS
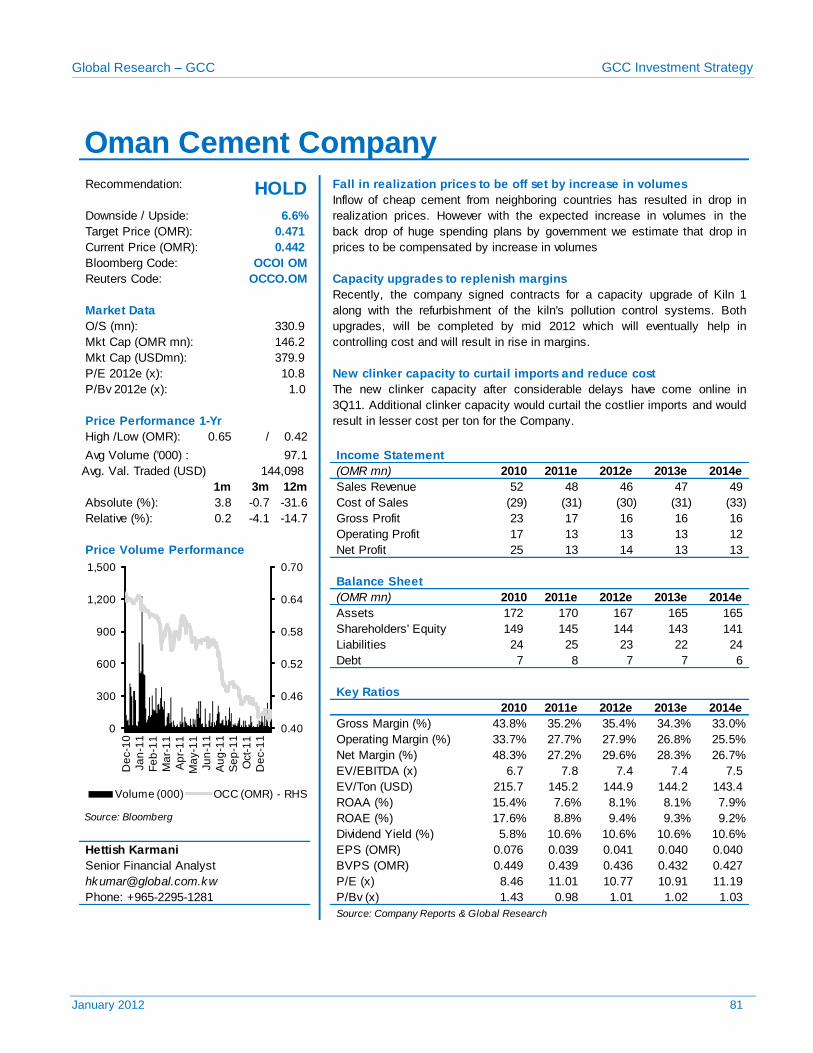
Global Research – GCC GCC Investment Strategy
January 2012 81
Recommendation: Fall in realization prices to be off set by increase in volumes
Bloomberg Code:
Reuters Code: Capacity upgrades to replenish margins
O/S (mn):
Mkt Cap (USDmn):
P/E 2012e (x): New clinker capacity to curtail imports and reduce cost
P/Bv 2012e (x):
High /Low (OMR): 0.65 / 0.42
Avg Volume ('000) :
(OMR mn) 2010 2011e 2012e 2013e 2014e
1m 3m 12m Sales Revenue 52 48 46 47 49
Absolute (%): 3.8 -0.7 -31.6 Cost of Sales (29) (31) (30) (31) (33)
Relative (%): 0.2 -4.1 -14.7 Gross Profit 23 17 16 16 16
Operating Profit 17 13 13 13 12
Price Volume Performance Net Profit 25 13 14 13 13
Balance Sheet
(OMR mn) 2010 2011e 2012e 2013e 2014e
Assets 172 170 167 165 165
Shareholders' Equity 149 145 144 143 141
Liabilities 24 25 23 22 24
Debt 7 8 7 7 6
Key Ratios
2010 2011e 2012e 2013e 2014e
Gross Margin (%) 43.8% 35.2% 35.4% 34.3% 33.0%
Operating Margin (%) 33.7% 27.7% 27.9% 26.8% 25.5%
Net Margin (%) 48.3% 27.2% 29.6% 28.3% 26.7%
EV/EBITDA (x) 6.7 7.8 7.4 7.4 7.5
EV/Ton (USD) 215.7 145.2 144.9 144.2 143.4
ROAA (%) 15.4% 7.6% 8.1% 8.1% 7.9% Source: Bloomberg ROAE (%) 17.6% 8.8% 9.4% 9.3% 9.2%
Dividend Yield (%) 5.8% 10.6% 10.6% 10.6% 10.6%
Hettish Karmani EPS (OMR) 0.076 0.039 0.041 0.040 0.040
BVPS (OMR) 0.449 0.439 0.436 0.432 0.427
P/E (x) 8.46 11.01 10.77 10.91 11.19
P/Bv (x) 1.43 0.98 1.01 1.02 1.03
Source: Company Reports & Global Research
Phone: +965-2295-1281
379.9
10.8
1.0 The new clinker capacity after considerable delays have come online in
3Q11. Additional clinker capacity would curtail the costlier imports and would
result in lesser cost per ton for the Company. Price Performance 1-Yr
97.1 Income Statement
Senior Financial Analyst
144,098 Avg. Val. Traded (USD)
OCOI OM
OCCO.OM
Recently, the company signed contracts for a capacity upgrade of Kiln 1
along with the refurbishment of the kiln's pollution control systems. Both
upgrades, will be completed by mid 2012 which will eventually help in
controlling cost and will result in rise in margins.
Market Data
330.9
146.2 Mkt Cap (OMR mn):
Oman Cement Company
HOLD Inflow of cheap cement from neighboring countries has resulted in drop in
realization prices. However with the expected increase in volumes in the
back drop of huge spending plans by government we estimate that drop in
prices to be compensated by increase in volumes
Downside / Upside: 6.6%
0.471
0.442
Target Price (OMR):
Current Price (OMR):
0.40
0.46
0.52
0.58
0.64
0.70
0
300
600
900
1,200
1,500
De
c-1
0
Ja
n-1
1
Fe
b-1
1
Ma
r-1
1
Ap
r-1
1
Ma
y-1
1
Ju
n-1
1
Au
g-1
1
Se
p-1
1
Oct-
11
De
c-1
1
Volume (000) OCC (OMR) - RHS
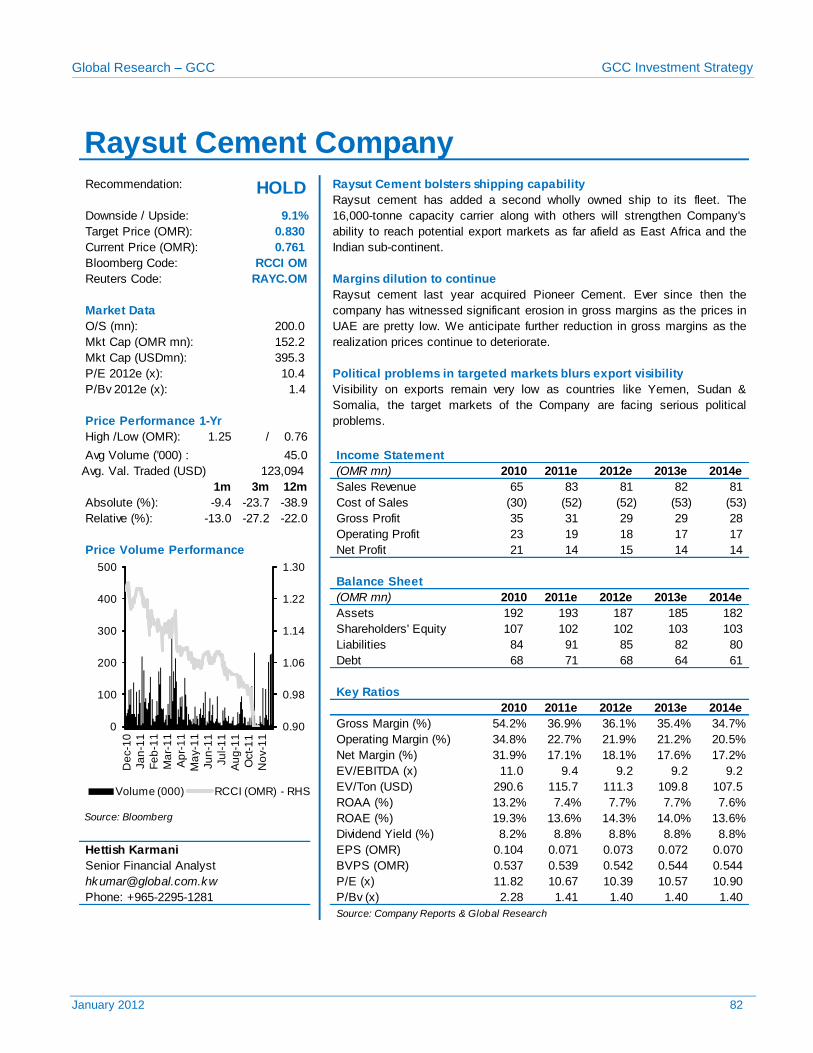
Global Research – GCC GCC Investment Strategy
January 2012 82
Recommendation:
Bloomberg Code:
Reuters Code:
O/S (mn):
Mkt Cap (USDmn):
P/E 2012e (x): Political problems in targeted markets blurs export visibility
P/Bv 2012e (x):
High /Low (OMR): 1.25 / 0.76
Avg Volume ('000) :
(OMR mn) 2010 2011e 2012e 2013e 2014e
1m 3m 12m Sales Revenue 65 83 81 82 81
Absolute (%): -9.4 -23.7 -38.9 Cost of Sales (30) (52) (52) (53) (53)
Relative (%): -13.0 -27.2 -22.0 Gross Profit 35 31 29 29 28
Operating Profit 23 19 18 17 17
Price Volume Performance Net Profit 21 14 15 14 14
Balance Sheet
(OMR mn) 2010 2011e 2012e 2013e 2014e
Assets 192 193 187 185 182
Shareholders' Equity 107 102 102 103 103
Liabilities 84 91 85 82 80
Debt 68 71 68 64 61
Key Ratios
2010 2011e 2012e 2013e 2014e
Gross Margin (%) 54.2% 36.9% 36.1% 35.4% 34.7%
Operating Margin (%) 34.8% 22.7% 21.9% 21.2% 20.5%
Net Margin (%) 31.9% 17.1% 18.1% 17.6% 17.2%
EV/EBITDA (x) 11.0 9.4 9.2 9.2 9.2
EV/Ton (USD) 290.6 115.7 111.3 109.8 107.5
ROAA (%) 13.2% 7.4% 7.7% 7.7% 7.6% Source: Bloomberg ROAE (%) 19.3% 13.6% 14.3% 14.0% 13.6%
Dividend Yield (%) 8.2% 8.8% 8.8% 8.8% 8.8%
Hettish Karmani EPS (OMR) 0.104 0.071 0.073 0.072 0.070
BVPS (OMR) 0.537 0.539 0.542 0.544 0.544
P/E (x) 11.82 10.67 10.39 10.57 10.90
P/Bv (x) 2.28 1.41 1.40 1.40 1.40
Source: Company Reports & Global Research
Phone: +965-2295-1281
395.3
10.4
1.4
Price Performance 1-Yr
45.0
Income Statement
Senior Financial Analyst
123,094 Avg. Val. Traded (USD)
152.2 Mkt Cap (OMR mn):
Margins dilution to continue
Raysut cement last year acquired Pioneer Cement. Ever since then the
company has witnessed significant erosion in gross margins as the prices in
UAE are pretty low. We anticipate further reduction in gross margins as the
realization prices continue to deteriorate.
Visibility on exports remain very low as countries like Yemen, Sudan &
Somalia, the target markets of the Company are facing serious political
problems.
RCCI OM
RAYC.OM
Market Data
200.0
Raysut Cement Company
HOLD Raysut cement has added a second wholly owned ship to its fleet. The
16,000-tonne capacity carrier along with others will strengthen Company's
ability to reach potential export markets as far afield as East Africa and the
Indian sub-continent.
Downside / Upside: 9.1%
0.830
0.761
Target Price (OMR):
Current Price (OMR):
Raysut Cement bolsters shipping capability
0.90
0.98
1.06
1.14
1.22
1.30
0
100
200
300
400
500
De
c-1
0
Ja
n-1
1
Fe
b-1
1
Ma
r-1
1
Ap
r-1
1
Ma
y-1
1
Ju
n-1
1
Ju
l-1
1
Au
g-1
1
Oct-
11
No
v-1
1
Volume (000) RCCI (OMR) - RHS
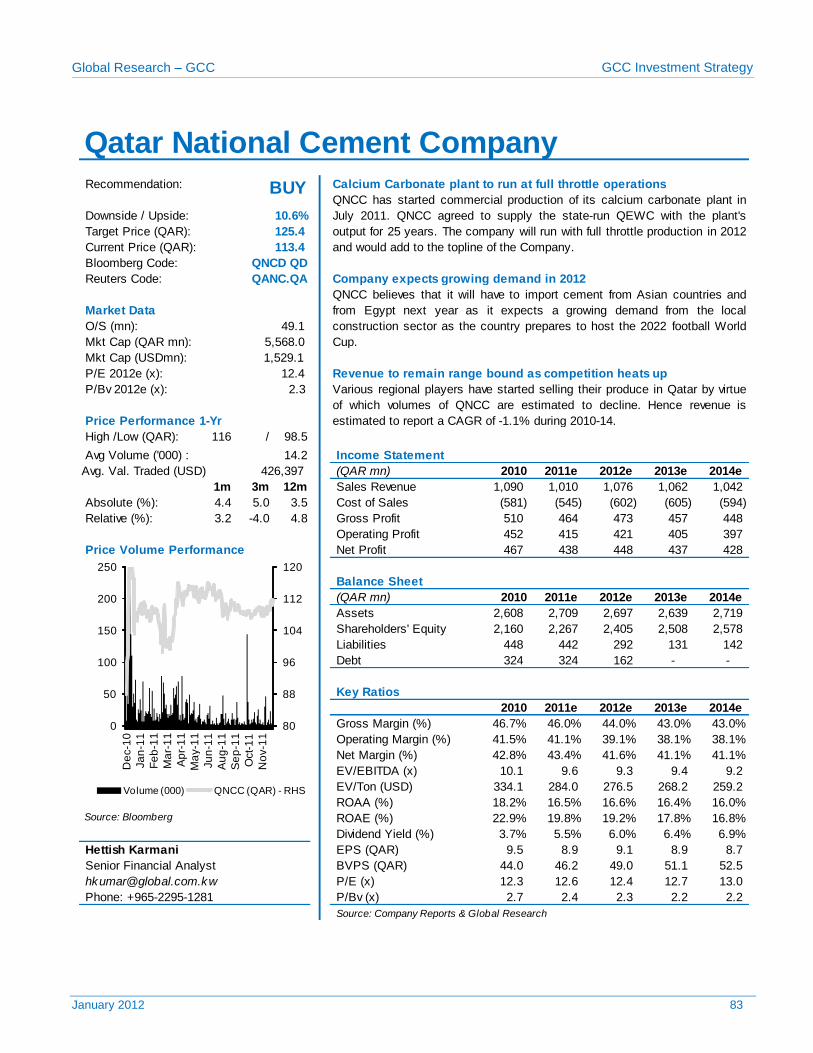
Global Research – GCC GCC Investment Strategy
January 2012 83
Recommendation: Calcium Carbonate plant to run at full throttle operations
Bloomberg Code:
Reuters Code: Company expects growing demand in 2012
O/S (mn):
Mkt Cap (USDmn):
P/E 2012e (x): Revenue to remain range bound as competition heats up
P/Bv 2012e (x):
High /Low (QAR): 116 / 98.5
Avg Volume ('000) :
(QAR mn) 2010 2011e 2012e 2013e 2014e
1m 3m 12m Sales Revenue 1,090 1,010 1,076 1,062 1,042
Absolute (%): 4.4 5.0 3.5 Cost of Sales (581) (545) (602) (605) (594)
Relative (%): 3.2 -4.0 4.8 Gross Profit 510 464 473 457 448
Operating Profit 452 415 421 405 397
Price Volume Performance Net Profit 467 438 448 437 428
Balance Sheet
(QAR mn) 2010 2011e 2012e 2013e 2014e
Assets 2,608 2,709 2,697 2,639 2,719
Shareholders' Equity 2,160 2,267 2,405 2,508 2,578
Liabilities 448 442 292 131 142
Debt 324 324 162 - -
Key Ratios
2010 2011e 2012e 2013e 2014e
Gross Margin (%) 46.7% 46.0% 44.0% 43.0% 43.0%
Operating Margin (%) 41.5% 41.1% 39.1% 38.1% 38.1%
Net Margin (%) 42.8% 43.4% 41.6% 41.1% 41.1%
EV/EBITDA (x) 10.1 9.6 9.3 9.4 9.2
EV/Ton (USD) 334.1 284.0 276.5 268.2 259.2
ROAA (%) 18.2% 16.5% 16.6% 16.4% 16.0% Source: Bloomberg ROAE (%) 22.9% 19.8% 19.2% 17.8% 16.8%
Dividend Yield (%) 3.7% 5.5% 6.0% 6.4% 6.9%
Hettish Karmani EPS (QAR) 9.5 8.9 9.1 8.9 8.7
BVPS (QAR) 44.0 46.2 49.0 51.1 52.5
P/E (x) 12.3 12.6 12.4 12.7 13.0
P/Bv (x) 2.7 2.4 2.3 2.2 2.2
Source: Company Reports & Global Research
Phone: +965-2295-1281
1,529.1
12.4
2.3 Various regional players have started selling their produce in Qatar by virtue
of which volumes of QNCC are estimated to decline. Hence revenue is
estimated to report a CAGR of -1.1% during 2010-14. Price Performance 1-Yr
14.2 Income Statement
Senior Financial Analyst
426,397 Avg. Val. Traded (USD)
QNCD QD
QANC.QA
QNCC believes that it will have to import cement from Asian countries and
from Egypt next year as it expects a growing demand from the local
construction sector as the country prepares to host the 2022 football World
Cup.
Market Data
49.1
5,568.0 Mkt Cap (QAR mn):
Qatar National Cement Company
BUY QNCC has started commercial production of its calcium carbonate plant in
July 2011. QNCC agreed to supply the state-run QEWC with the plant's
output for 25 years. The company will run with full throttle production in 2012
and would add to the topline of the Company.
Downside / Upside: 10.6%
125.4
113.4
Target Price (QAR):
Current Price (QAR):
80
88
96
104
112
120
0
50
100
150
200
250
De
c-1
0
Ja
n-1
1
Fe
b-1
1
Ma
r-1
1
Ap
r-1
1
Ma
y-1
1
Ju
n-1
1
Au
g-1
1
Se
p-1
1
Oct-
11
No
v-1
1
Volume (000) QNCC (QAR) - RHS
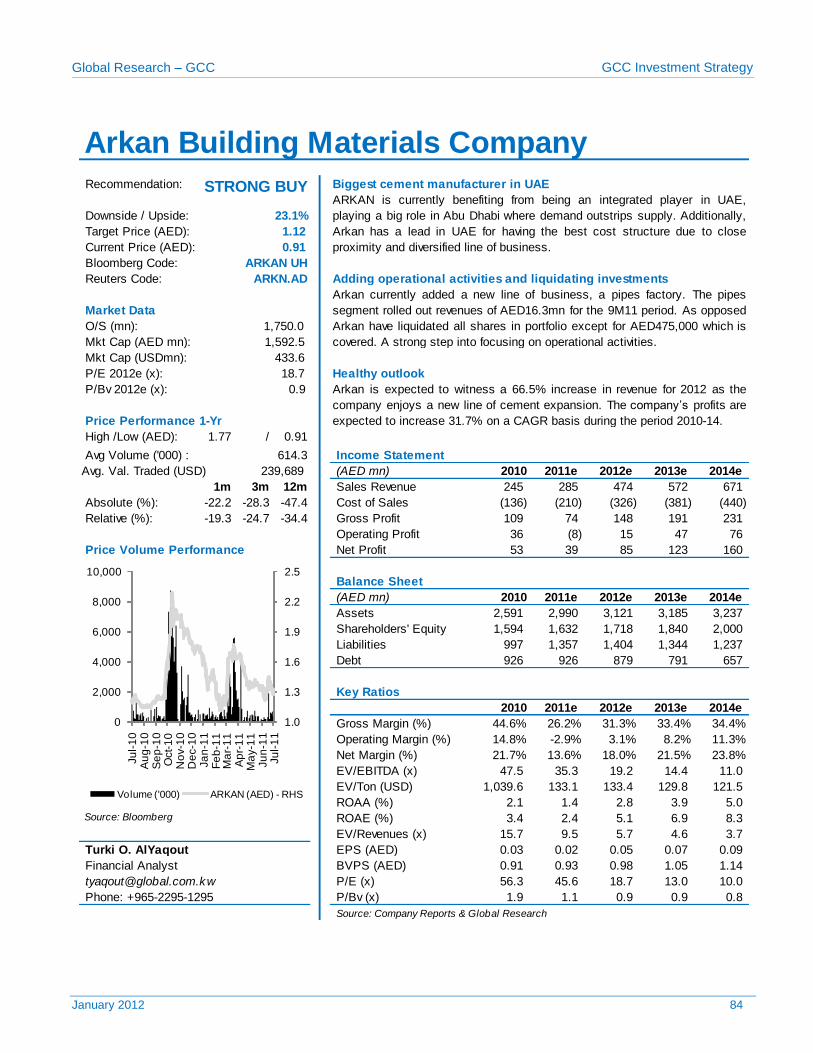
Global Research – GCC GCC Investment Strategy
January 2012 84
Recommendation: Biggest cement manufacturer in UAE
Bloomberg Code:
Reuters Code: Adding operational activities and liquidating investments
O/S (mn):
Mkt Cap (USDmn):
P/E 2012e (x): Healthy outlook
P/Bv 2012e (x):
High /Low (AED): 1.77 / 0.91
Avg Volume ('000) :
(AED mn) 2010 2011e 2012e 2013e 2014e
1m 3m 12m Sales Revenue 245 285 474 572 671
Absolute (%): -22.2 -28.3 -47.4 Cost of Sales (136) (210) (326) (381) (440)
Relative (%): -19.3 -24.7 -34.4 Gross Profit 109 74 148 191 231
Operating Profit 36 (8) 15 47 76
Price Volume Performance Net Profit 53 39 85 123 160
Balance Sheet
(AED mn) 2010 2011e 2012e 2013e 2014e
Assets 2,591 2,990 3,121 3,185 3,237
Shareholders' Equity 1,594 1,632 1,718 1,840 2,000
Liabilities 997 1,357 1,404 1,344 1,237
Debt 926 926 879 791 657
Key Ratios
2010 2011e 2012e 2013e 2014e
Gross Margin (%) 44.6% 26.2% 31.3% 33.4% 34.4%
Operating Margin (%) 14.8% -2.9% 3.1% 8.2% 11.3%
Net Margin (%) 21.7% 13.6% 18.0% 21.5% 23.8%
EV/EBITDA (x) 47.5 35.3 19.2 14.4 11.0
EV/Ton (USD) 1,039.6 133.1 133.4 129.8 121.5
ROAA (%) 2.1 1.4 2.8 3.9 5.0 Source: Bloomberg ROAE (%) 3.4 2.4 5.1 6.9 8.3
EV/Revenues (x) 15.7 9.5 5.7 4.6 3.7
Turki O. AlYaqout EPS (AED) 0.03 0.02 0.05 0.07 0.09
BVPS (AED) 0.91 0.93 0.98 1.05 1.14
P/E (x) 56.3 45.6 18.7 13.0 10.0
P/Bv (x) 1.9 1.1 0.9 0.9 0.8
Source: Company Reports & Global Research
Phone: +965-2295-1295
433.6
18.7
0.9 Arkan is expected to witness a 66.5% increase in revenue for 2012 as the
company enjoys a new line of cement expansion. The company’s profits are
expected to increase 31.7% on a CAGR basis during the period 2010-14. Price Performance 1-Yr
614.3 Income Statement
239,689 Avg. Val. Traded (USD)
Financial Analyst
ARKAN UH
ARKN.AD
Arkan currently added a new line of business, a pipes factory. The pipes
segment rolled out revenues of AED16.3mn for the 9M11 period. As opposed
Arkan have liquidated all shares in portfolio except for AED475,000 which is
covered. A strong step into focusing on operational activities.
Market Data
1,750.0
1,592.5 Mkt Cap (AED mn):
Arkan Building Materials Company
STRONG BUY ARKAN is currently benefiting from being an integrated player in UAE,
playing a big role in Abu Dhabi where demand outstrips supply. Additionally,
Arkan has a lead in UAE for having the best cost structure due to close
proximity and diversified line of business.
Downside / Upside: 23.1%
Target Price (AED): 1.12
Current Price (AED): 0.91
1.0
1.3
1.6
1.9
2.2
2.5
0
2,000
4,000
6,000
8,000
10,000
Ju
l-1
0A
ug
-10
Se
p-1
0O
ct-
10
No
v-1
0D
ec-1
0Ja
n-1
1F
eb
-11
Ma
r-1
1A
pr-
11
Ma
y-1
1Ju
n-1
1Ju
l-1
1
Volume ('000) ARKAN (AED) - RHS
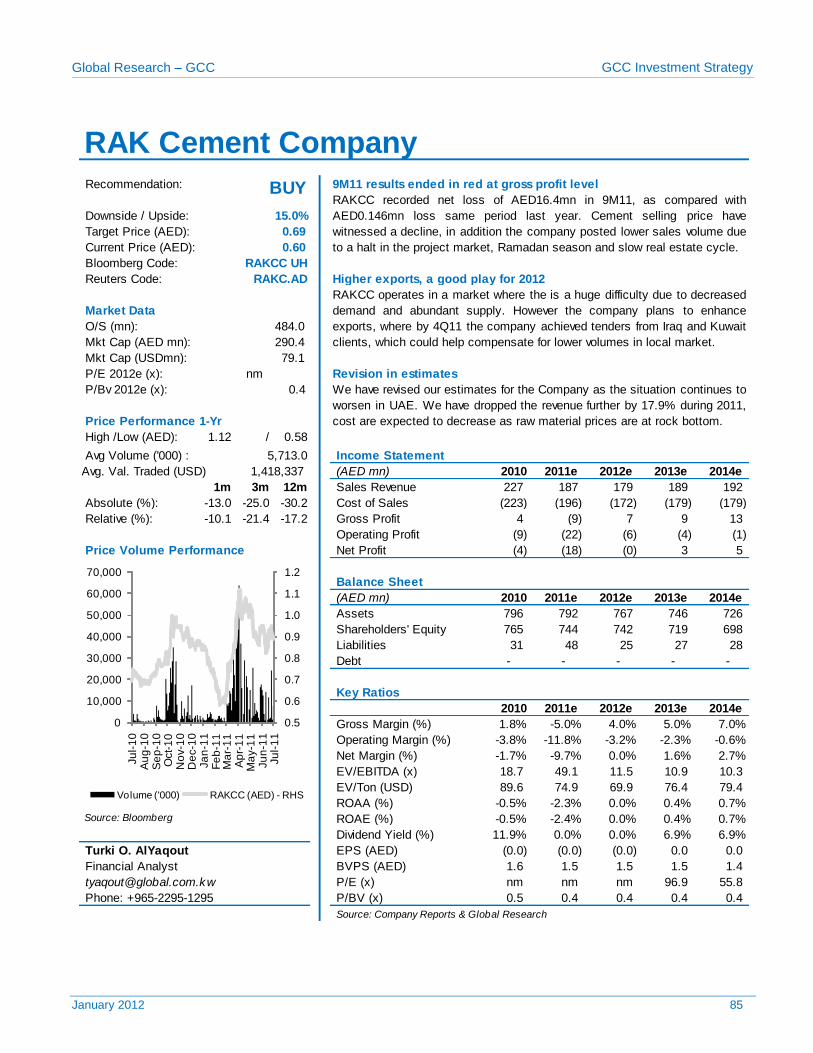
Global Research – GCC GCC Investment Strategy
January 2012 85
Recommendation: 9M11 results ended in red at gross profit level
Bloomberg Code:
Reuters Code: Higher exports, a good play for 2012
O/S (mn):
Mkt Cap (USDmn):
P/E 2012e (x): Revision in estimates
P/Bv 2012e (x):
High /Low (AED): 1.12 / 0.58
Avg Volume ('000) :
(AED mn) 2010 2011e 2012e 2013e 2014e
1m 3m 12m Sales Revenue 227 187 179 189 192
Absolute (%): -13.0 -25.0 -30.2 Cost of Sales (223) (196) (172) (179) (179)
Relative (%): -10.1 -21.4 -17.2 Gross Profit 4 (9) 7 9 13
Operating Profit (9) (22) (6) (4) (1)
Price Volume Performance Net Profit (4) (18) (0) 3 5
Balance Sheet
(AED mn) 2010 2011e 2012e 2013e 2014e
Assets 796 792 767 746 726
Shareholders' Equity 765 744 742 719 698
Liabilities 31 48 25 27 28
Debt - - - - -
Key Ratios
2010 2011e 2012e 2013e 2014e
Gross Margin (%) 1.8% -5.0% 4.0% 5.0% 7.0%
Operating Margin (%) -3.8% -11.8% -3.2% -2.3% -0.6%
Net Margin (%) -1.7% -9.7% 0.0% 1.6% 2.7%
EV/EBITDA (x) 18.7 49.1 11.5 10.9 10.3
EV/Ton (USD) 89.6 74.9 69.9 76.4 79.4
ROAA (%) -0.5% -2.3% 0.0% 0.4% 0.7% Source: Bloomberg ROAE (%) -0.5% -2.4% 0.0% 0.4% 0.7%
Dividend Yield (%) 11.9% 0.0% 0.0% 6.9% 6.9%
Turki O. AlYaqout EPS (AED) (0.0) (0.0) (0.0) 0.0 0.0
BVPS (AED) 1.6 1.5 1.5 1.5 1.4
P/E (x) nm nm nm 96.9 55.8
P/BV (x) 0.5 0.4 0.4 0.4 0.4
Source: Company Reports & Global Research
RAK Cement Company
BUY RAKCC recorded net loss of AED16.4mn in 9M11, as compared with
AED0.146mn loss same period last year. Cement selling price have
witnessed a decline, in addition the company posted lower sales volume due
to a halt in the project market, Ramadan season and slow real estate cycle.
Downside / Upside: 15.0%
Target Price (AED): 0.69
Current Price (AED): 0.60
RAKCC UH
RAKC.AD
RAKCC operates in a market where the is a huge difficulty due to decreased
demand and abundant supply. However the company plans to enhance
exports, where by 4Q11 the company achieved tenders from Iraq and Kuwait
clients, which could help compensate for lower volumes in local market.
Market Data
484.0
290.4 Mkt Cap (AED mn):
Phone: +965-2295-1295
79.1
nm
0.4 We have revised our estimates for the Company as the situation continues to
worsen in UAE. We have dropped the revenue further by 17.9% during 2011,
cost are expected to decrease as raw material prices are at rock bottom. Price Performance 1-Yr
5,713.0 Income Statement
1,418,337 Avg. Val. Traded (USD)
Financial Analyst
0.5
0.6
0.7
0.8
0.9
1.0
1.1
1.2
0
10,000
20,000
30,000
40,000
50,000
60,000
70,000
Ju
l-1
0A
ug
-10
Se
p-1
0O
ct-
10
No
v-1
0D
ec-1
0Ja
n-1
1F
eb
-11
Ma
r-1
1A
pr-
11
Ma
y-1
1Ju
n-1
1Ju
l-1
1
Volume ('000) RAKCC (AED) - RHS
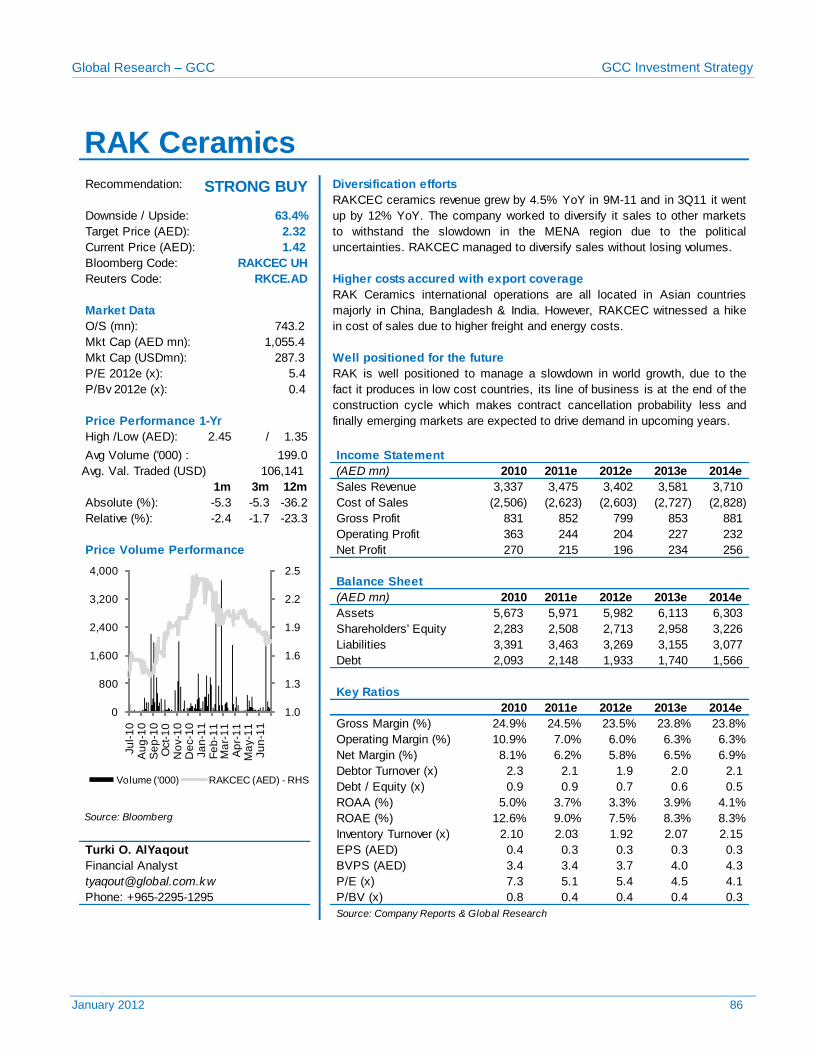
Global Research – GCC GCC Investment Strategy
January 2012 86
Recommendation: Diversification efforts
Bloomberg Code:
Reuters Code: Higher costs accured with export coverage
O/S (mn):
Mkt Cap (USDmn): Well positioned for the future
P/E 2012e (x):
P/Bv 2012e (x):
High /Low (AED): 2.45 / 1.35
Avg Volume ('000) :
(AED mn) 2010 2011e 2012e 2013e 2014e
1m 3m 12m Sales Revenue 3,337 3,475 3,402 3,581 3,710
Absolute (%): -5.3 -5.3 -36.2 Cost of Sales (2,506) (2,623) (2,603) (2,727) (2,828)
Relative (%): -2.4 -1.7 -23.3 Gross Profit 831 852 799 853 881
Operating Profit 363 244 204 227 232
Price Volume Performance Net Profit 270 215 196 234 256
Balance Sheet
(AED mn) 2010 2011e 2012e 2013e 2014e
Assets 5,673 5,971 5,982 6,113 6,303
Shareholders' Equity 2,283 2,508 2,713 2,958 3,226
Liabilities 3,391 3,463 3,269 3,155 3,077
Debt 2,093 2,148 1,933 1,740 1,566
Key Ratios
2010 2011e 2012e 2013e 2014e
Gross Margin (%) 24.9% 24.5% 23.5% 23.8% 23.8%
Operating Margin (%) 10.9% 7.0% 6.0% 6.3% 6.3%
Net Margin (%) 8.1% 6.2% 5.8% 6.5% 6.9%
Debtor Turnover (x) 2.3 2.1 1.9 2.0 2.1
Debt / Equity (x) 0.9 0.9 0.7 0.6 0.5
ROAA (%) 5.0% 3.7% 3.3% 3.9% 4.1% Source: Bloomberg ROAE (%) 12.6% 9.0% 7.5% 8.3% 8.3%
Inventory Turnover (x) 2.10 2.03 1.92 2.07 2.15
Turki O. AlYaqout EPS (AED) 0.4 0.3 0.3 0.3 0.3
BVPS (AED) 3.4 3.4 3.7 4.0 4.3
P/E (x) 7.3 5.1 5.4 4.5 4.1
P/BV (x) 0.8 0.4 0.4 0.4 0.3
Source: Company Reports & Global Research
Financial Analyst
Phone: +965-2295-1295
287.3
5.4
0.4
Price Performance 1-Yr
199.0
Income Statement
106,141 Avg. Val. Traded (USD)
RAK is well positioned to manage a slowdown in world growth, due to the
fact it produces in low cost countries, its line of business is at the end of the
construction cycle which makes contract cancellation probability less and
finally emerging markets are expected to drive demand in upcoming years.
RAKCEC UH
RKCE.AD
Market Data
743.2
1,055.4 Mkt Cap (AED mn):
RAK Ceramics international operations are all located in Asian countries
majorly in China, Bangladesh & India. However, RAKCEC witnessed a hike
in cost of sales due to higher freight and energy costs.
RAK Ceramics
STRONG BUY RAKCEC ceramics revenue grew by 4.5% YoY in 9M-11 and in 3Q11 it went
up by 12% YoY. The company worked to diversify it sales to other markets
to withstand the slowdown in the MENA region due to the political
uncertainties. RAKCEC managed to diversify sales without losing volumes.
Downside / Upside: 63.4%
Target Price (AED): 2.32
Current Price (AED): 1.42
1.0
1.3
1.6
1.9
2.2
2.5
0
800
1,600
2,400
3,200
4,000
Ju
l-1
0A
ug
-10
Se
p-1
0O
ct-
10
No
v-1
0D
ec-1
0Ja
n-1
1F
eb
-11
Ma
r-1
1A
pr-
11
Ma
y-1
1Ju
n-1
1
Volume ('000) RAKCEC (AED) - RHS
Global Research – GCC GCC Investment Strategy
January 2012 87
CONSTRUCTION CONTRACTORS
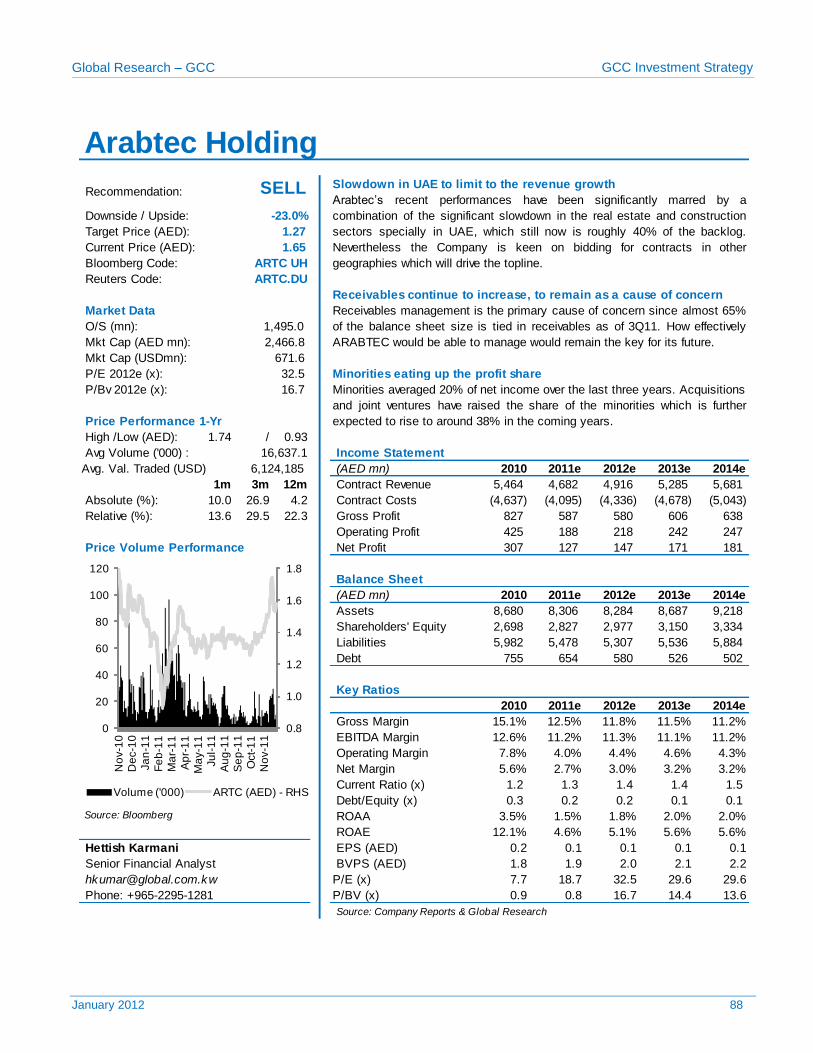
Global Research – GCC GCC Investment Strategy
January 2012 88
Slowdown in UAE to limit to the revenue growth
Bloomberg Code:
Reuters Code:
Receivables continue to increase, to remain as a cause of concern
O/S (mn):
Mkt Cap (USDmn):
P/E 2012e (x): Minorities eating up the profit share
P/Bv 2012e (x):
High /Low (AED): 1.74 / 0.93
Avg Volume ('000) : Income Statement
(AED mn) 2010 2011e 2012e 2013e 2014e
1m 3m 12m Contract Revenue 5,464 4,682 4,916 5,285 5,681
Absolute (%): 10.0 26.9 4.2 Contract Costs (4,637) (4,095) (4,336) (4,678) (5,043)
Relative (%): 13.6 29.5 22.3 Gross Profit 827 587 580 606 638
Operating Profit 425 188 218 242 247
Price Volume Performance Net Profit 307 127 147 171 181
Balance Sheet
(AED mn) 2010 2011e 2012e 2013e 2014e
Assets 8,680 8,306 8,284 8,687 9,218
Shareholders' Equity 2,698 2,827 2,977 3,150 3,334
Liabilities 5,982 5,478 5,307 5,536 5,884
Debt 755 654 580 526 502
Key Ratios
2010 2011e 2012e 2013e 2014e
Gross Margin 15.1% 12.5% 11.8% 11.5% 11.2%
EBITDA Margin 12.6% 11.2% 11.3% 11.1% 11.2%
Operating Margin 7.8% 4.0% 4.4% 4.6% 4.3%
Net Margin 5.6% 2.7% 3.0% 3.2% 3.2%
Current Ratio (x) 1.2 1.3 1.4 1.4 1.5
Debt/Equity (x) 0.3 0.2 0.2 0.1 0.1 Source: Bloomberg ROAA 3.5% 1.5% 1.8% 2.0% 2.0%
ROAE 12.1% 4.6% 5.1% 5.6% 5.6%
Hettish Karmani EPS (AED) 0.2 0.1 0.1 0.1 0.1
BVPS (AED) 1.8 1.9 2.0 2.1 2.2
P/E (x) 7.7 18.7 32.5 29.6 29.6
P/BV (x) 0.9 0.8 16.7 14.4 13.6
Source: Company Reports & Global Research
Senior Financial Analyst
Phone: +965-2295-1281
2,466.8 Mkt Cap (AED mn):
Receivables management is the primary cause of concern since almost 65%
of the balance sheet size is tied in receivables as of 3Q11. How effectively
ARABTEC would be able to manage would remain the key for its future.
16,637.1
6,124,185 Avg. Val. Traded (USD)
671.6
32.5
16.7
Price Performance 1-Yr
Minorities averaged 20% of net income over the last three years. Acquisitions
and joint ventures have raised the share of the minorities which is further
expected to rise to around 38% in the coming years.
ARTC.DU
Market Data
1,495.0
Target Price (AED): 1.27
Arabtec Holding
Recommendation: SELL
Downside / Upside: -23.0%
Arabtec’s recent performances have been significantly marred by a
combination of the significant slowdown in the real estate and construction
sectors specially in UAE, which still now is roughly 40% of the backlog.
Nevertheless the Company is keen on bidding for contracts in other
geographies which will drive the topline.
Current Price (AED): 1.65
ARTC UH
0.8
1.0
1.2
1.4
1.6
1.8
0
20
40
60
80
100
120
No
v-1
0
De
c-1
0
Ja
n-1
1
Fe
b-1
1
Ma
r-1
1
Ap
r-1
1
Ma
y-1
1
Ju
l-1
1
Au
g-1
1
Se
p-1
1
Oct-
11
No
v-1
1
Volume ('000) ARTC (AED) - RHS
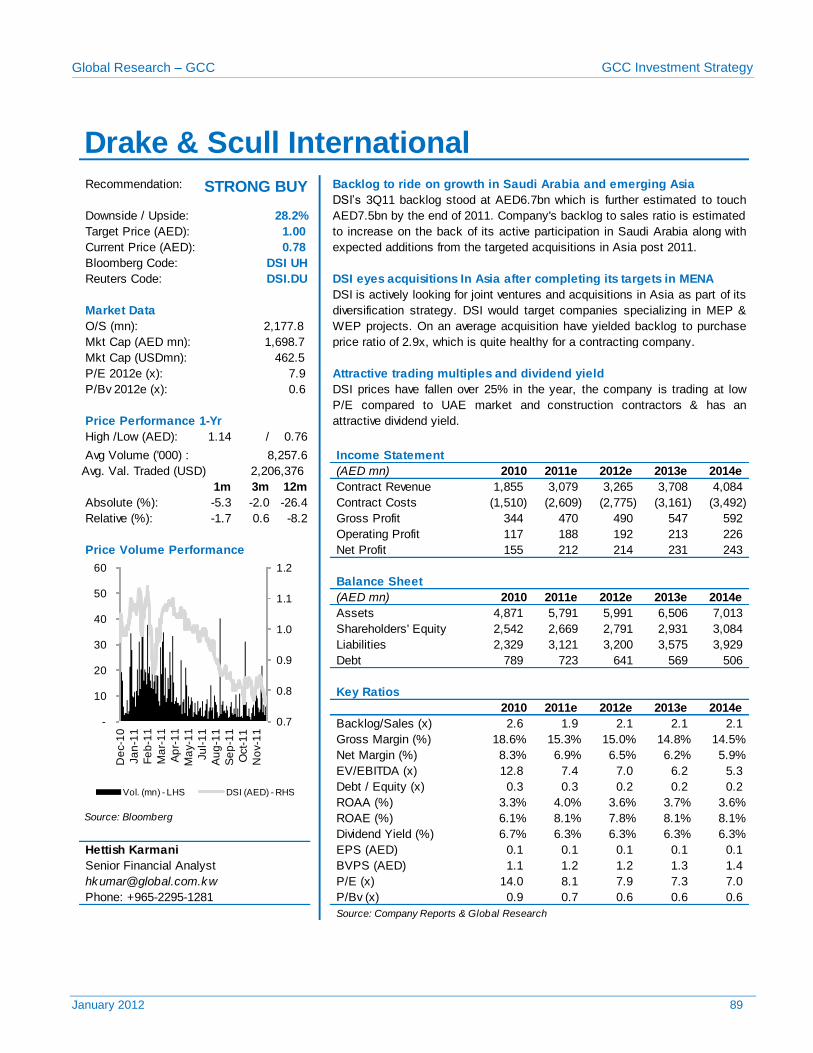
Global Research – GCC GCC Investment Strategy
January 2012 89
Recommendation: Backlog to ride on growth in Saudi Arabia and emerging Asia
Bloomberg Code:
Reuters Code:
O/S (mn):
Mkt Cap (USDmn):
P/E 2012e (x): Attractive trading multiples and dividend yield
P/Bv 2012e (x):
High /Low (AED): 1.14 / 0.76
Avg Volume ('000) :
(AED mn) 2010 2011e 2012e 2013e 2014e
1m 3m 12m Contract Revenue 1,855 3,079 3,265 3,708 4,084
Absolute (%): -5.3 -2.0 -26.4 Contract Costs (1,510) (2,609) (2,775) (3,161) (3,492)
Relative (%): -1.7 0.6 -8.2 Gross Profit 344 470 490 547 592
Operating Profit 117 188 192 213 226
Price Volume Performance Net Profit 155 212 214 231 243
Balance Sheet
(AED mn) 2010 2011e 2012e 2013e 2014e
Assets 4,871 5,791 5,991 6,506 7,013
Shareholders' Equity 2,542 2,669 2,791 2,931 3,084
Liabilities 2,329 3,121 3,200 3,575 3,929
Debt 789 723 641 569 506
Key Ratios
2010 2011e 2012e 2013e 2014e
Backlog/Sales (x) 2.6 1.9 2.1 2.1 2.1
Gross Margin (%) 18.6% 15.3% 15.0% 14.8% 14.5%
Net Margin (%) 8.3% 6.9% 6.5% 6.2% 5.9%
EV/EBITDA (x) 12.8 7.4 7.0 6.2 5.3
Debt / Equity (x) 0.3 0.3 0.2 0.2 0.2
ROAA (%) 3.3% 4.0% 3.6% 3.7% 3.6% Source: Bloomberg ROAE (%) 6.1% 8.1% 7.8% 8.1% 8.1%
Dividend Yield (%) 6.7% 6.3% 6.3% 6.3% 6.3%
Hettish Karmani EPS (AED) 0.1 0.1 0.1 0.1 0.1
BVPS (AED) 1.1 1.2 1.2 1.3 1.4
P/E (x) 14.0 8.1 7.9 7.3 7.0
P/Bv (x) 0.9 0.7 0.6 0.6 0.6
Source: Company Reports & Global Research
Phone: +965-2295-1281
462.5
7.9
0.6 DSI prices have fallen over 25% in the year, the company is trading at low
P/E compared to UAE market and construction contractors & has an
attractive dividend yield. Price Performance 1-Yr
8,257.6 Income Statement
Senior Financial Analyst
2,206,376 Avg. Val. Traded (USD)
DSI UH
DSI.DU
DSI is actively looking for joint ventures and acquisitions in Asia as part of its
diversification strategy. DSI would target companies specializing in MEP &
WEP projects. On an average acquisition have yielded backlog to purchase
price ratio of 2.9x, which is quite healthy for a contracting company.
Market Data
2,177.8
1,698.7 Mkt Cap (AED mn):
DSI eyes acquisitions In Asia after completing its targets in MENA
Drake & Scull International
STRONG BUY DSI’s 3Q11 backlog stood at AED6.7bn which is further estimated to touch
AED7.5bn by the end of 2011. Company's backlog to sales ratio is estimated
to increase on the back of its active participation in Saudi Arabia along with
expected additions from the targeted acquisitions in Asia post 2011.
Downside / Upside: 28.2%
Target Price (AED): 1.00
Current Price (AED): 0.78
0.7
0.8
0.9
1.0
1.1
1.2
-
10
20
30
40
50
60
De
c-1
0
Ja
n-1
1
Fe
b-1
1
Ma
r-1
1
Ap
r-1
1
Ma
y-1
1
Ju
l-1
1
Au
g-1
1
Se
p-1
1
Oct-
11
No
v-1
1
Vol. (mn) - LHS DSI (AED) - RHS
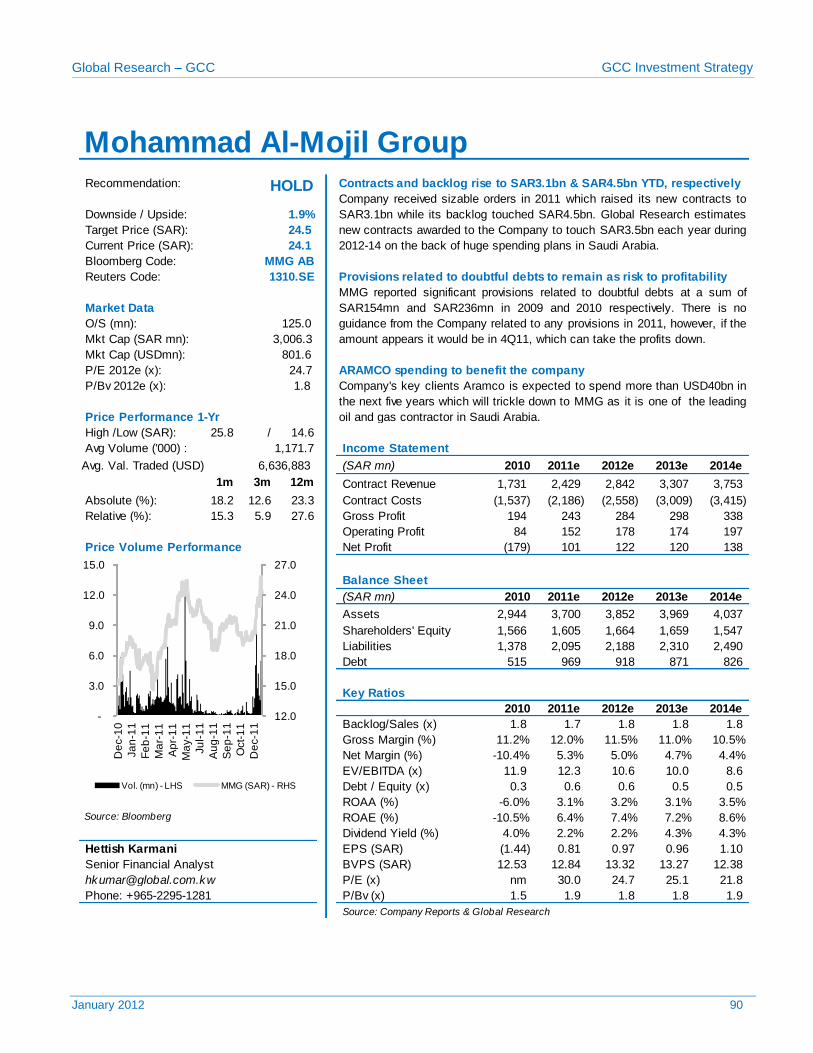
Global Research – GCC GCC Investment Strategy
January 2012 90
Recommendation: Contracts and backlog rise to SAR3.1bn & SAR4.5bn YTD, respectively
Bloomberg Code:
Reuters Code: Provisions related to doubtful debts to remain as risk to profitability
O/S (mn):
Mkt Cap (USDmn):
P/E 2012e (x): ARAMCO spending to benefit the company
P/Bv 2012e (x):
High /Low (SAR): 25.8 / 14.6
Avg Volume ('000) :
(SAR mn) 2010 2011e 2012e 2013e 2014e
1m 3m 12m Contract Revenue 1,731 2,429 2,842 3,307 3,753
Absolute (%): 18.2 12.6 23.3 Contract Costs (1,537) (2,186) (2,558) (3,009) (3,415)
Relative (%): 15.3 5.9 27.6 Gross Profit 194 243 284 298 338
Operating Profit 84 152 178 174 197
Price Volume Performance Net Profit (179) 101 122 120 138
Balance Sheet
(SAR mn) 2010 2011e 2012e 2013e 2014e
Assets 2,944 3,700 3,852 3,969 4,037
Shareholders' Equity 1,566 1,605 1,664 1,659 1,547
Liabilities 1,378 2,095 2,188 2,310 2,490
Debt 515 969 918 871 826
Key Ratios
2010 2011e 2012e 2013e 2014e
Backlog/Sales (x) 1.8 1.7 1.8 1.8 1.8
Gross Margin (%) 11.2% 12.0% 11.5% 11.0% 10.5%
Net Margin (%) -10.4% 5.3% 5.0% 4.7% 4.4%
EV/EBITDA (x) 11.9 12.3 10.6 10.0 8.6
Debt / Equity (x) 0.3 0.6 0.6 0.5 0.5
ROAA (%) -6.0% 3.1% 3.2% 3.1% 3.5% Source: Bloomberg ROAE (%) -10.5% 6.4% 7.4% 7.2% 8.6%
Dividend Yield (%) 4.0% 2.2% 2.2% 4.3% 4.3%
Hettish Karmani EPS (SAR) (1.44) 0.81 0.97 0.96 1.10
BVPS (SAR) 12.53 12.84 13.32 13.27 12.38
P/E (x) nm 30.0 24.7 25.1 21.8
P/Bv (x) 1.5 1.9 1.8 1.8 1.9
Source: Company Reports & Global Research
6,636,883 Avg. Val. Traded (USD)
Phone: +965-2295-1281
Senior Financial Analyst
3,006.3 Mkt Cap (SAR mn):
MMG reported significant provisions related to doubtful debts at a sum of
SAR154mn and SAR236mn in 2009 and 2010 respectively. There is no
guidance from the Company related to any provisions in 2011, however, if the
amount appears it would be in 4Q11, which can take the profits down.
Company's key clients Aramco is expected to spend more than USD40bn in
the next five years which will trickle down to MMG as it is one of the leading
oil and gas contractor in Saudi Arabia.
Income Statement
801.6
24.7
1.8
Price Performance 1-Yr
1,171.7
MMG AB
1310.SE
Market Data
125.0
Mohammad Al-Mojil Group
Company received sizable orders in 2011 which raised its new contracts to
SAR3.1bn while its backlog touched SAR4.5bn. Global Research estimates
new contracts awarded to the Company to touch SAR3.5bn each year during
2012-14 on the back of huge spending plans in Saudi Arabia.
Downside / Upside: 1.9%
24.5
24.1
Target Price (SAR):
Current Price (SAR):
HOLD
12.0
15.0
18.0
21.0
24.0
27.0
-
3.0
6.0
9.0
12.0
15.0
De
c-1
0
Ja
n-1
1
Fe
b-1
1
Ma
r-1
1
Ap
r-1
1
Ma
y-1
1
Ju
l-1
1
Au
g-1
1
Se
p-1
1
Oct-
11
De
c-1
1
Vol. (mn) - LHS MMG (SAR) - RHS
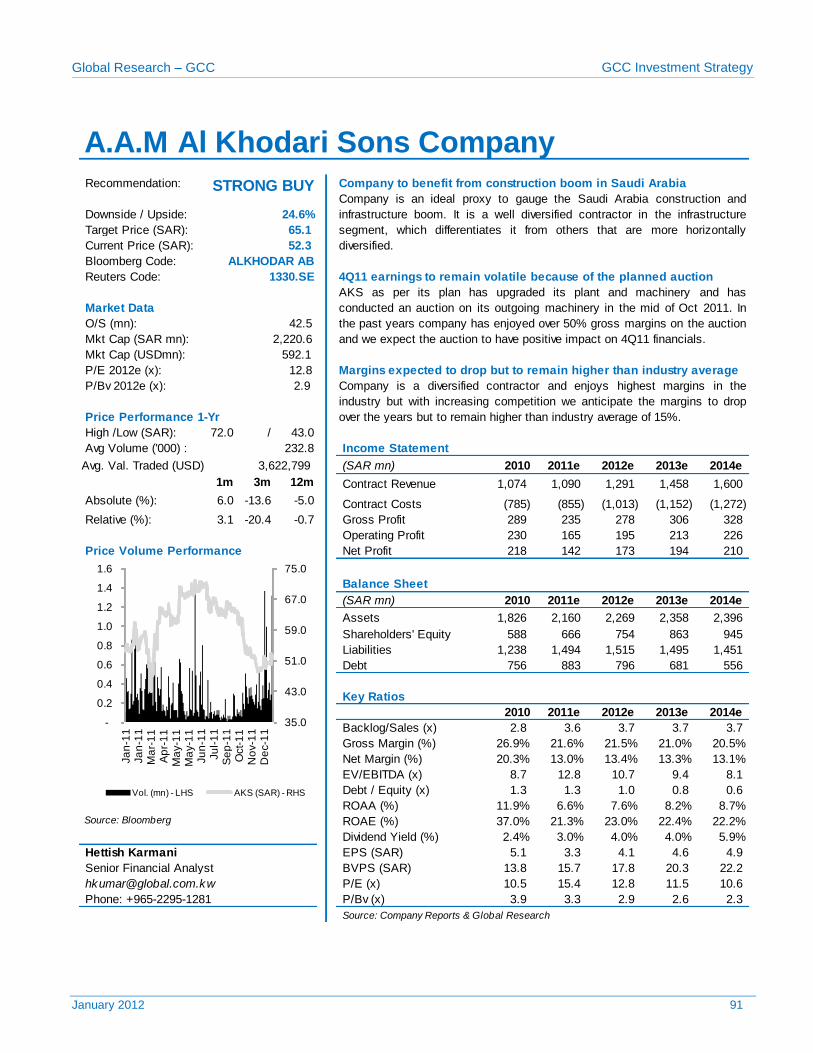
Global Research – GCC GCC Investment Strategy
January 2012 91
Recommendation: Company to benefit from construction boom in Saudi Arabia
Bloomberg Code:
Reuters Code: 4Q11 earnings to remain volatile because of the planned auction
O/S (mn):
Mkt Cap (USDmn):
P/E 2012e (x): Margins expected to drop but to remain higher than industry average
P/Bv 2012e (x):
High /Low (SAR): 72.0 / 43.0
Avg Volume ('000) :
(SAR mn) 2010 2011e 2012e 2013e 2014e
1m 3m 12m Contract Revenue 1,074 1,090 1,291 1,458 1,600
Absolute (%): 6.0 -13.6 -5.0 Contract Costs (785) (855) (1,013) (1,152) (1,272)
Relative (%): 3.1 -20.4 -0.7 Gross Profit 289 235 278 306 328
Operating Profit 230 165 195 213 226
Price Volume Performance Net Profit 218 142 173 194 210
Balance Sheet
(SAR mn) 2010 2011e 2012e 2013e 2014e
Assets 1,826 2,160 2,269 2,358 2,396
Shareholders' Equity 588 666 754 863 945
Liabilities 1,238 1,494 1,515 1,495 1,451
Debt 756 883 796 681 556
Key Ratios
2010 2011e 2012e 2013e 2014e
Backlog/Sales (x) 2.8 3.6 3.7 3.7 3.7
Gross Margin (%) 26.9% 21.6% 21.5% 21.0% 20.5%
Net Margin (%) 20.3% 13.0% 13.4% 13.3% 13.1%
EV/EBITDA (x) 8.7 12.8 10.7 9.4 8.1
Debt / Equity (x) 1.3 1.3 1.0 0.8 0.6
ROAA (%) 11.9% 6.6% 7.6% 8.2% 8.7% Source: Bloomberg ROAE (%) 37.0% 21.3% 23.0% 22.4% 22.2%
Dividend Yield (%) 2.4% 3.0% 4.0% 4.0% 5.9%
Hettish Karmani EPS (SAR) 5.1 3.3 4.1 4.6 4.9
BVPS (SAR) 13.8 15.7 17.8 20.3 22.2
P/E (x) 10.5 15.4 12.8 11.5 10.6
P/Bv (x) 3.9 3.3 2.9 2.6 2.3
Source: Company Reports & Global Research
Phone: +965-2295-1281
592.1
12.8
2.9 Company is a diversified contractor and enjoys highest margins in the
industry but with increasing competition we anticipate the margins to drop
over the years but to remain higher than industry average of 15%. Price Performance 1-Yr
232.8 Income Statement
3,622,799 Avg. Val. Traded (USD)
Senior Financial Analyst
ALKHODAR AB
1330.SE
AKS as per its plan has upgraded its plant and machinery and has
conducted an auction on its outgoing machinery in the mid of Oct 2011. In
the past years company has enjoyed over 50% gross margins on the auction
and we expect the auction to have positive impact on 4Q11 financials.
Market Data
42.5
2,220.6 Mkt Cap (SAR mn):
A.A.M Al Khodari Sons Company
Company is an ideal proxy to gauge the Saudi Arabia construction and
infrastructure boom. It is a well diversified contractor in the infrastructure
segment, which differentiates it from others that are more horizontally
diversified.
Downside / Upside: 24.6%
65.1
52.3
Target Price (SAR):
Current Price (SAR):
STRONG BUY
35.0
43.0
51.0
59.0
67.0
75.0
-
0.2
0.4
0.6
0.8
1.0
1.2
1.4
1.6
Ja
n-1
1Ja
n-1
1M
ar-
11
Ap
r-1
1M
ay-1
1M
ay-1
1Ju
n-1
1Ju
l-1
1S
ep
-11
Oct-
11
No
v-1
1D
ec-1
1
Vol. (mn) - LHS AKS (SAR) - RHS
Global Research – GCC GCC Investment Strategy
January 2012 92
ENERGY & PETROCHEMICAL SECTOR
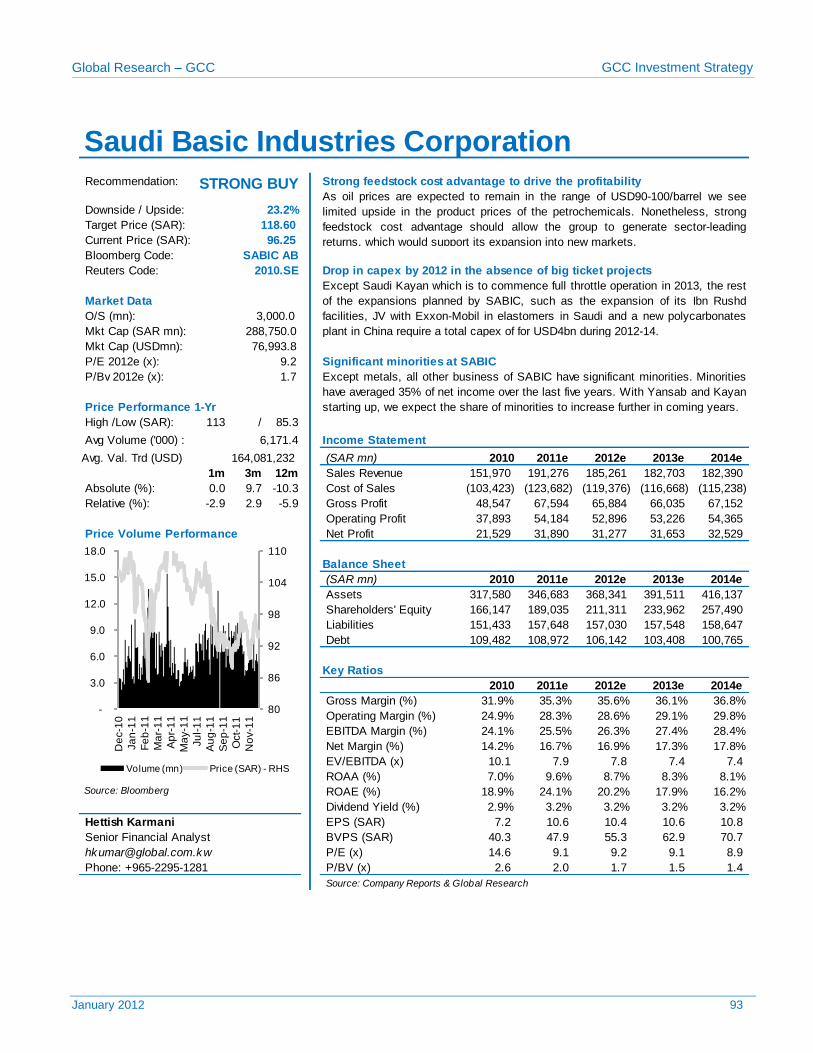
Global Research – GCC GCC Investment Strategy
January 2012 93
Recommendation: Strong feedstock cost advantage to drive the profitability
Bloomberg Code:
Reuters Code: Drop in capex by 2012 in the absence of big ticket projects
O/S (mn):
Mkt Cap (USDmn):
P/E 2012e (x): Significant minorities at SABIC
P/Bv 2012e (x):
High /Low (SAR): 113 / 85.3
Avg Volume ('000) :
Avg. Val. Trd (USD) (SAR mn) 2010 2011e 2012e 2013e 2014e
1m 3m 12m Sales Revenue 151,970 191,276 185,261 182,703 182,390
Absolute (%): 0.0 9.7 -10.3 Cost of Sales (103,423) (123,682) (119,376) (116,668) (115,238)
Relative (%): -2.9 2.9 -5.9 Gross Profit 48,547 67,594 65,884 66,035 67,152
Operating Profit 37,893 54,184 52,896 53,226 54,365
Price Volume Performance Net Profit 21,529 31,890 31,277 31,653 32,529
Balance Sheet
(SAR mn) 2010 2011e 2012e 2013e 2014e
Assets 317,580 346,683 368,341 391,511 416,137
Shareholders' Equity 166,147 189,035 211,311 233,962 257,490
Liabilities 151,433 157,648 157,030 157,548 158,647
Debt 109,482 108,972 106,142 103,408 100,765
Key Ratios
2010 2011e 2012e 2013e 2014e
Gross Margin (%) 31.9% 35.3% 35.6% 36.1% 36.8%
Operating Margin (%) 24.9% 28.3% 28.6% 29.1% 29.8%
EBITDA Margin (%) 24.1% 25.5% 26.3% 27.4% 28.4%
Net Margin (%) 14.2% 16.7% 16.9% 17.3% 17.8%
EV/EBITDA (x) 10.1 7.9 7.8 7.4 7.4
ROAA (%) 7.0% 9.6% 8.7% 8.3% 8.1% Source: Bloomberg ROAE (%) 18.9% 24.1% 20.2% 17.9% 16.2%
Dividend Yield (%) 2.9% 3.2% 3.2% 3.2% 3.2%
Hettish Karmani EPS (SAR) 7.2 10.6 10.4 10.6 10.8
BVPS (SAR) 40.3 47.9 55.3 62.9 70.7
P/E (x) 14.6 9.1 9.2 9.1 8.9
P/BV (x) 2.6 2.0 1.7 1.5 1.4
Source: Company Reports & Global Research
164,081,232
SABIC AB
2010.SE
Phone: +965-2295-1281
Senior Financial Analyst
Except metals, all other business of SABIC have significant minorities. Minorities
have averaged 35% of net income over the last five years. With Yansab and Kayan
starting up, we expect the share of minorities to increase further in coming years. Price Performance 1-Yr
288,750.0 Mkt Cap (SAR mn):
6,171.4
76,993.8
9.2
1.7
Income Statement
Except Saudi Kayan which is to commence full throttle operation in 2013, the rest
of the expansions planned by SABIC, such as the expansion of its Ibn Rushd
facilities, JV with Exxon-Mobil in elastomers in Saudi and a new polycarbonates
plant in China require a total capex of for USD4bn during 2012-14.
Market Data
3,000.0
Saudi Basic Industries Corporation
As oil prices are expected to remain in the range of USD90-100/barrel we see
limited upside in the product prices of the petrochemicals. Nonetheless, strong
feedstock cost advantage should allow the group to generate sector-leading
returns, which would support its expansion into new markets.
Downside / Upside: 23.2%
118.60
96.25
Target Price (SAR):
Current Price (SAR):
STRONG BUY
80
86
92
98
104
110
-
3.0
6.0
9.0
12.0
15.0
18.0
De
c-1
0
Ja
n-1
1
Fe
b-1
1
Ma
r-1
1
Ap
r-1
1
Ma
y-1
1
Ju
l-1
1
Au
g-1
1
Se
p-1
1
Oct-
11
No
v-1
1
Volume (mn) Price (SAR) - RHS
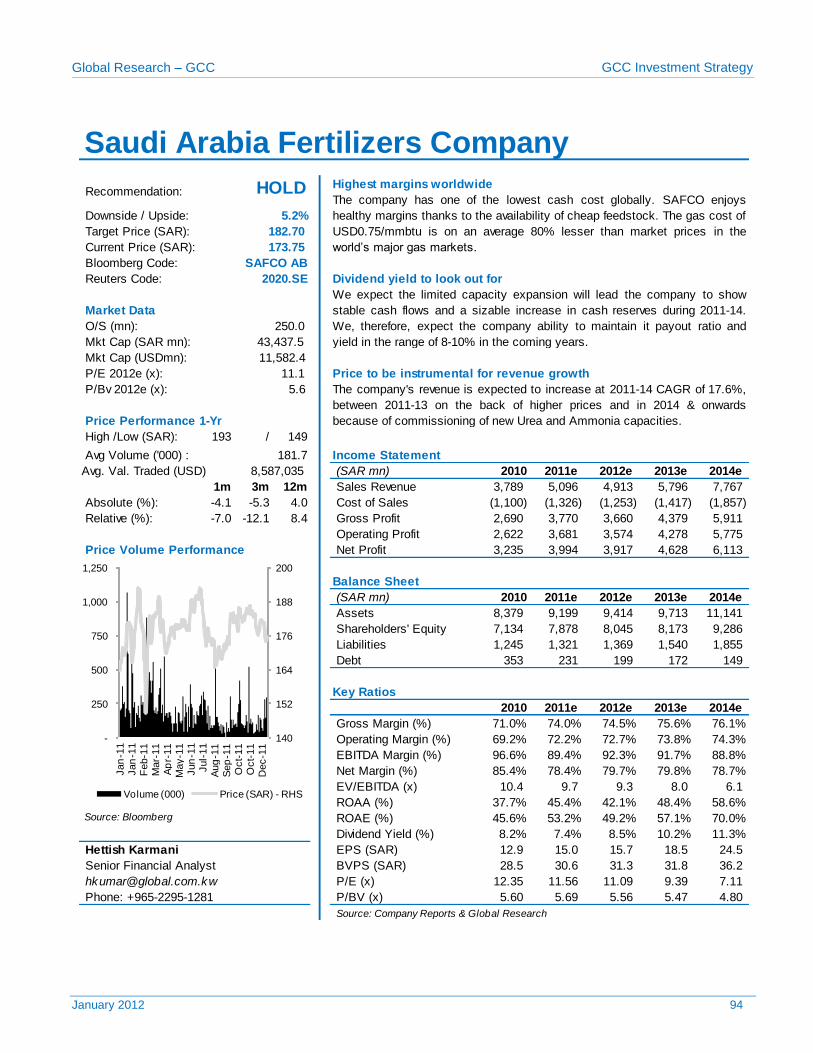
Global Research – GCC GCC Investment Strategy
January 2012 94
Highest margins worldwide
Bloomberg Code:
Reuters Code: Dividend yield to look out for
O/S (mn):
Mkt Cap (USDmn):
P/E 2012e (x): Price to be instrumental for revenue growth
P/Bv 2012e (x):
High /Low (SAR): 193 / 149
Avg Volume ('000) :
(SAR mn) 2010 2011e 2012e 2013e 2014e
1m 3m 12m Sales Revenue 3,789 5,096 4,913 5,796 7,767
Absolute (%): -4.1 -5.3 4.0 Cost of Sales (1,100) (1,326) (1,253) (1,417) (1,857)
Relative (%): -7.0 -12.1 8.4 Gross Profit 2,690 3,770 3,660 4,379 5,911
Operating Profit 2,622 3,681 3,574 4,278 5,775
Price Volume Performance Net Profit 3,235 3,994 3,917 4,628 6,113
Balance Sheet
(SAR mn) 2010 2011e 2012e 2013e 2014e
Assets 8,379 9,199 9,414 9,713 11,141
Shareholders' Equity 7,134 7,878 8,045 8,173 9,286
Liabilities 1,245 1,321 1,369 1,540 1,855
Debt 353 231 199 172 149
Key Ratios
2010 2011e 2012e 2013e 2014e
Gross Margin (%) 71.0% 74.0% 74.5% 75.6% 76.1%
Operating Margin (%) 69.2% 72.2% 72.7% 73.8% 74.3%
EBITDA Margin (%) 96.6% 89.4% 92.3% 91.7% 88.8%
Net Margin (%) 85.4% 78.4% 79.7% 79.8% 78.7%
EV/EBITDA (x) 10.4 9.7 9.3 8.0 6.1
ROAA (%) 37.7% 45.4% 42.1% 48.4% 58.6% Source: Bloomberg ROAE (%) 45.6% 53.2% 49.2% 57.1% 70.0%
Dividend Yield (%) 8.2% 7.4% 8.5% 10.2% 11.3%
Hettish Karmani EPS (SAR) 12.9 15.0 15.7 18.5 24.5
BVPS (SAR) 28.5 30.6 31.3 31.8 36.2
P/E (x) 12.35 11.56 11.09 9.39 7.11
P/BV (x) 5.60 5.69 5.56 5.47 4.80
Source: Company Reports & Global Research
Phone: +965-2295-1281
Senior Financial Analyst
Income Statement
SAFCO AB
2020.SE
We expect the limited capacity expansion will lead the company to show
stable cash flows and a sizable increase in cash reserves during 2011-14.
We, therefore, expect the company ability to maintain it payout ratio and
yield in the range of 8-10% in the coming years.
Market Data
250.0
11,582.4
11.1
5.6 The company's revenue is expected to increase at 2011-14 CAGR of 17.6%,
between 2011-13 on the back of higher prices and in 2014 & onwards
because of commissioning of new Urea and Ammonia capacities. Price Performance 1-Yr
Saudi Arabia Fertilizers Company
Recommendation: HOLD The company has one of the lowest cash cost globally. SAFCO enjoys
healthy margins thanks to the availability of cheap feedstock. The gas cost of
USD0.75/mmbtu is on an average 80% lesser than market prices in the
world’s major gas markets.
Downside / Upside: 5.2%
182.70
173.75
8,587,035 Avg. Val. Traded (USD)
Target Price (SAR):
Current Price (SAR):
43,437.5 Mkt Cap (SAR mn):
181.7
140
152
164
176
188
200
-
250
500
750
1,000
1,250
Jan
-11
Jan
-11
Feb-1
1M
ar-
11
Ap
r-11
May-1
1Jun
-11
Jul-
11
Aug
-11
Sep
-11
Oct-
11
Oct-
11
Dec-1
1
Volume (000) Price (SAR) - RHS
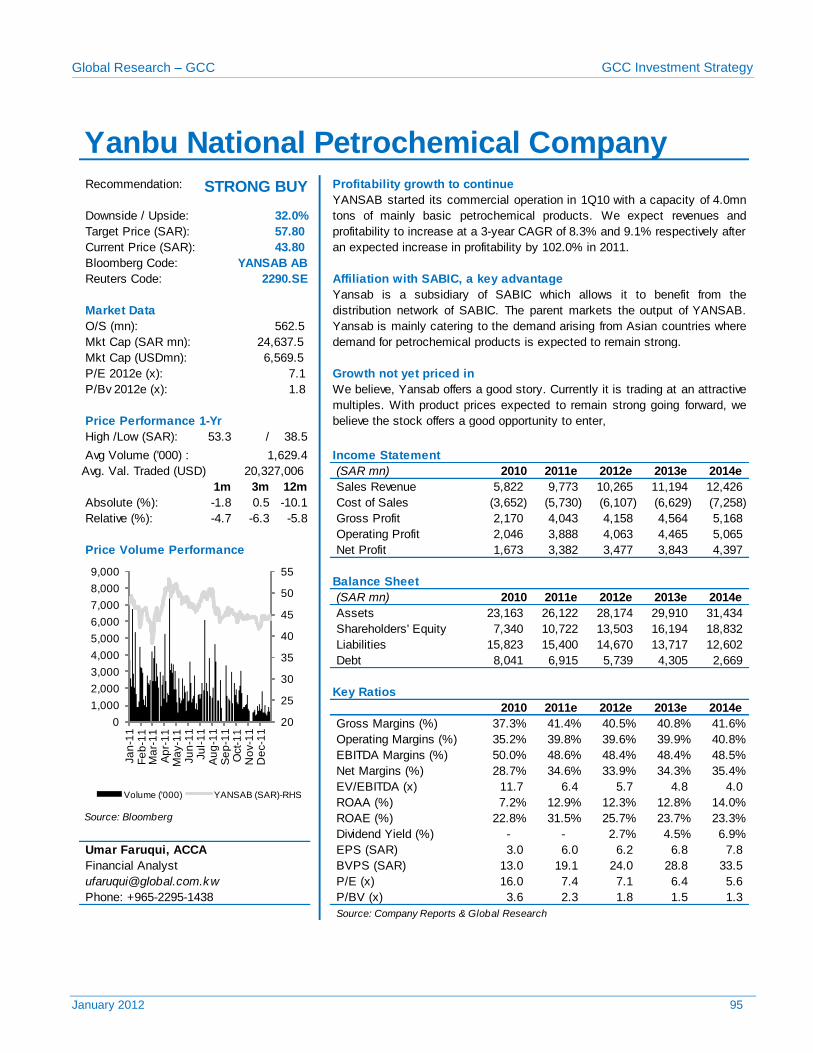
Global Research – GCC GCC Investment Strategy
January 2012 95
Recommendation: Profitability growth to continue
Bloomberg Code:
Reuters Code: Affiliation with SABIC, a key advantage
O/S (mn):
Mkt Cap (USDmn):
P/E 2012e (x): Growth not yet priced in
P/Bv 2012e (x):
High /Low (SAR): 53.3 / 38.5
Avg Volume ('000) :
(SAR mn) 2010 2011e 2012e 2013e 2014e
1m 3m 12m Sales Revenue 5,822 9,773 10,265 11,194 12,426
Absolute (%): -1.8 0.5 -10.1 Cost of Sales (3,652) (5,730) (6,107) (6,629) (7,258)
Relative (%): -4.7 -6.3 -5.8 Gross Profit 2,170 4,043 4,158 4,564 5,168
Operating Profit 2,046 3,888 4,063 4,465 5,065
Price Volume Performance Net Profit 1,673 3,382 3,477 3,843 4,397
Balance Sheet
(SAR mn) 2010 2011e 2012e 2013e 2014e
Assets 23,163 26,122 28,174 29,910 31,434
Shareholders' Equity 7,340 10,722 13,503 16,194 18,832
Liabilities 15,823 15,400 14,670 13,717 12,602
Debt 8,041 6,915 5,739 4,305 2,669
Key Ratios
2010 2011e 2012e 2013e 2014e
Gross Margins (%) 37.3% 41.4% 40.5% 40.8% 41.6%
Operating Margins (%) 35.2% 39.8% 39.6% 39.9% 40.8%
EBITDA Margins (%) 50.0% 48.6% 48.4% 48.4% 48.5%
Net Margins (%) 28.7% 34.6% 33.9% 34.3% 35.4%
EV/EBITDA (x) 11.7 6.4 5.7 4.8 4.0
ROAA (%) 7.2% 12.9% 12.3% 12.8% 14.0% Source: Bloomberg ROAE (%) 22.8% 31.5% 25.7% 23.7% 23.3%
Dividend Yield (%) - - 2.7% 4.5% 6.9%
EPS (SAR) 3.0 6.0 6.2 6.8 7.8
BVPS (SAR) 13.0 19.1 24.0 28.8 33.5
P/E (x) 16.0 7.4 7.1 6.4 5.6
P/BV (x) 3.6 2.3 1.8 1.5 1.3
Source: Company Reports & Global Research
Phone: +965-2295-1438
Umar Faruqui, ACCA
Financial Analyst
Income Statement
YANSAB AB
2290.SE
Yansab is a subsidiary of SABIC which allows it to benefit from the
distribution network of SABIC. The parent markets the output of YANSAB.
Yansab is mainly catering to the demand arising from Asian countries where
demand for petrochemical products is expected to remain strong.
Market Data
562.5
6,569.5
7.1
1.8 We believe, Yansab offers a good story. Currently it is trading at an attractive
multiples. With product prices expected to remain strong going forward, we
believe the stock offers a good opportunity to enter, Price Performance 1-Yr
Yanbu National Petrochemical Company
YANSAB started its commercial operation in 1Q10 with a capacity of 4.0mn
tons of mainly basic petrochemical products. We expect revenues and
profitability to increase at a 3-year CAGR of 8.3% and 9.1% respectively after
an expected increase in profitability by 102.0% in 2011.
Downside / Upside: 32.0%
57.80
43.80
STRONG BUY
20,327,006 Avg. Val. Traded (USD)
Target Price (SAR):
Current Price (SAR):
24,637.5 Mkt Cap (SAR mn):
1,629.4
20
25
30
35
40
45
50
55
0
1,000
2,000
3,000
4,000
5,000
6,000
7,000
8,000
9,000
Ja
n-1
1F
eb
-11
Ma
r-1
1A
pr-
11
Ma
y-1
1Ju
n-1
1Ju
l-1
1A
ug
-11
Se
p-1
1O
ct-
11
No
v-1
1D
ec-1
1
Volume ('000) YANSAB (SAR)-RHS
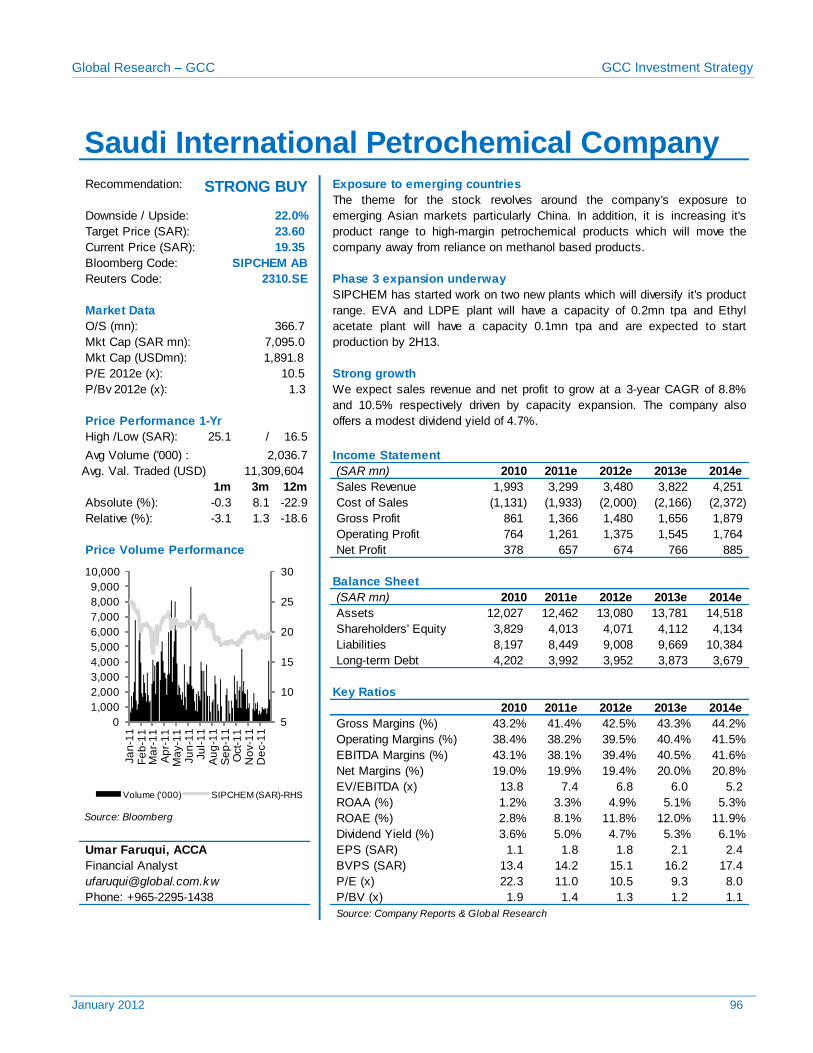
Global Research – GCC GCC Investment Strategy
January 2012 96
Recommendation: Exposure to emerging countries
Bloomberg Code:
Reuters Code: Phase 3 expansion underway
O/S (mn):
Mkt Cap (USDmn):
P/E 2012e (x): Strong growth
P/Bv 2012e (x):
High /Low (SAR): 25.1 / 16.5
Avg Volume ('000) :
(SAR mn) 2010 2011e 2012e 2013e 2014e
1m 3m 12m Sales Revenue 1,993 3,299 3,480 3,822 4,251
Absolute (%): -0.3 8.1 -22.9 Cost of Sales (1,131) (1,933) (2,000) (2,166) (2,372)
Relative (%): -3.1 1.3 -18.6 Gross Profit 861 1,366 1,480 1,656 1,879
Operating Profit 764 1,261 1,375 1,545 1,764
Price Volume Performance Net Profit 378 657 674 766 885
Balance Sheet
(SAR mn) 2010 2011e 2012e 2013e 2014e
Assets 12,027 12,462 13,080 13,781 14,518
Shareholders' Equity 3,829 4,013 4,071 4,112 4,134
Liabilities 8,197 8,449 9,008 9,669 10,384
Long-term Debt 4,202 3,992 3,952 3,873 3,679
Key Ratios
2010 2011e 2012e 2013e 2014e
Gross Margins (%) 43.2% 41.4% 42.5% 43.3% 44.2%
Operating Margins (%) 38.4% 38.2% 39.5% 40.4% 41.5%
EBITDA Margins (%) 43.1% 38.1% 39.4% 40.5% 41.6%
Net Margins (%) 19.0% 19.9% 19.4% 20.0% 20.8%
EV/EBITDA (x) 13.8 7.4 6.8 6.0 5.2
ROAA (%) 1.2% 3.3% 4.9% 5.1% 5.3% Source: Bloomberg ROAE (%) 2.8% 8.1% 11.8% 12.0% 11.9%
Dividend Yield (%) 3.6% 5.0% 4.7% 5.3% 6.1%
EPS (SAR) 1.1 1.8 1.8 2.1 2.4
BVPS (SAR) 13.4 14.2 15.1 16.2 17.4
P/E (x) 22.3 11.0 10.5 9.3 8.0
P/BV (x) 1.9 1.4 1.3 1.2 1.1
Source: Company Reports & Global Research
Phone: +965-2295-1438
Umar Faruqui, ACCA
Financial Analyst
Income Statement
SIPCHEM AB
2310.SE
SIPCHEM has started work on two new plants which will diversify it's product
range. EVA and LDPE plant will have a capacity of 0.2mn tpa and Ethyl
acetate plant will have a capacity 0.1mn tpa and are expected to start
production by 2H13.
Market Data
366.7
1,891.8
10.5
1.3 We expect sales revenue and net profit to grow at a 3-year CAGR of 8.8%
and 10.5% respectively driven by capacity expansion. The company also
offers a modest dividend yield of 4.7%. Price Performance 1-Yr
Saudi International Petrochemical Company
The theme for the stock revolves around the company's exposure to
emerging Asian markets particularly China. In addition, it is increasing it's
product range to high-margin petrochemical products which will move the
company away from reliance on methanol based products.
Downside / Upside: 22.0%
23.60
19.35
STRONG BUY
11,309,604 Avg. Val. Traded (USD)
Target Price (SAR):
Current Price (SAR):
7,095.0 Mkt Cap (SAR mn):
2,036.7
5
10
15
20
25
30
0
1,000
2,000
3,000
4,000
5,000
6,000
7,000
8,000
9,000
10,000
Ja
n-1
1F
eb
-11
Ma
r-1
1A
pr-
11
Ma
y-1
1Ju
n-1
1Ju
l-1
1A
ug
-11
Se
p-1
1O
ct-
11
No
v-1
1D
ec-1
1
Volume ('000) SIPCHEM (SAR)-RHS
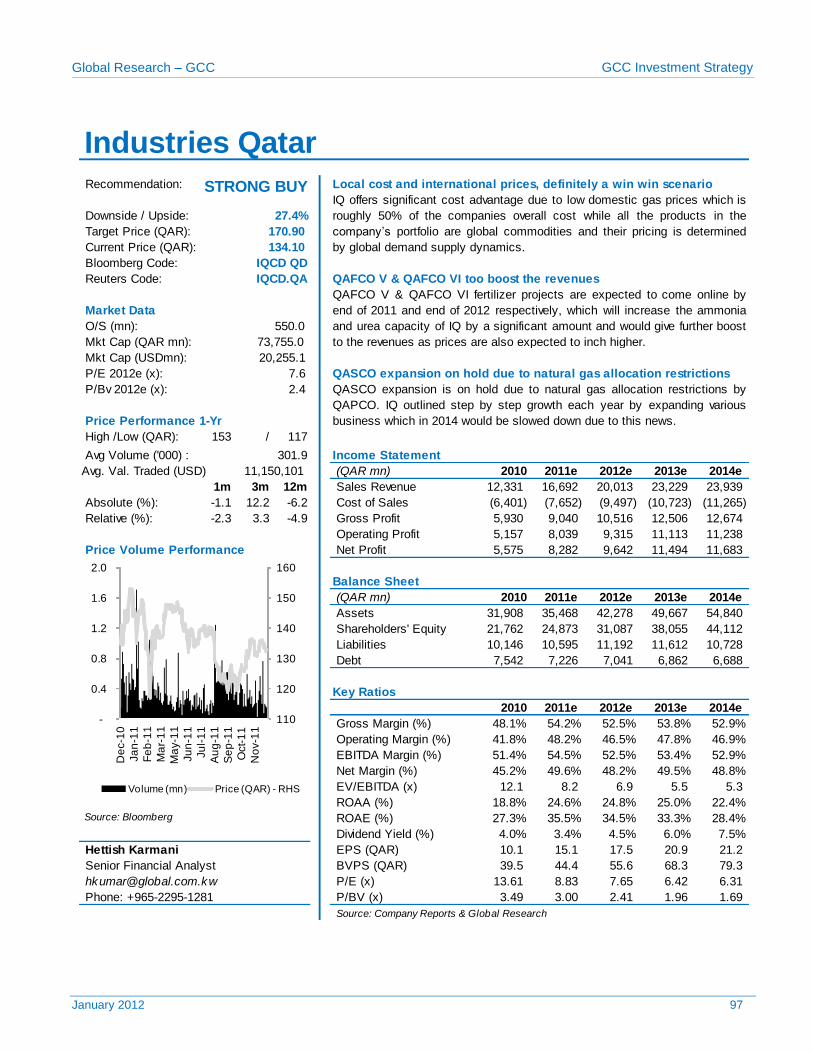
Global Research – GCC GCC Investment Strategy
January 2012 97
Recommendation: Local cost and international prices, definitely a win win scenario
Bloomberg Code:
Reuters Code: QAFCO V & QAFCO VI too boost the revenues
O/S (mn):
Mkt Cap (USDmn):
P/E 2012e (x): QASCO expansion on hold due to natural gas allocation restrictions
P/Bv 2012e (x):
High /Low (QAR): 153 / 117
Avg Volume ('000) :
(QAR mn) 2010 2011e 2012e 2013e 2014e
1m 3m 12m Sales Revenue 12,331 16,692 20,013 23,229 23,939
Absolute (%): -1.1 12.2 -6.2 Cost of Sales (6,401) (7,652) (9,497) (10,723) (11,265)
Relative (%): -2.3 3.3 -4.9 Gross Profit 5,930 9,040 10,516 12,506 12,674
Operating Profit 5,157 8,039 9,315 11,113 11,238
Price Volume Performance Net Profit 5,575 8,282 9,642 11,494 11,683
Balance Sheet
(QAR mn) 2010 2011e 2012e 2013e 2014e
Assets 31,908 35,468 42,278 49,667 54,840
Shareholders' Equity 21,762 24,873 31,087 38,055 44,112
Liabilities 10,146 10,595 11,192 11,612 10,728
Debt 7,542 7,226 7,041 6,862 6,688
Key Ratios
2010 2011e 2012e 2013e 2014e
Gross Margin (%) 48.1% 54.2% 52.5% 53.8% 52.9%
Operating Margin (%) 41.8% 48.2% 46.5% 47.8% 46.9%
EBITDA Margin (%) 51.4% 54.5% 52.5% 53.4% 52.9%
Net Margin (%) 45.2% 49.6% 48.2% 49.5% 48.8%
EV/EBITDA (x) 12.1 8.2 6.9 5.5 5.3
ROAA (%) 18.8% 24.6% 24.8% 25.0% 22.4% Source: Bloomberg ROAE (%) 27.3% 35.5% 34.5% 33.3% 28.4%
Dividend Yield (%) 4.0% 3.4% 4.5% 6.0% 7.5%
Hettish Karmani EPS (QAR) 10.1 15.1 17.5 20.9 21.2
BVPS (QAR) 39.5 44.4 55.6 68.3 79.3
P/E (x) 13.61 8.83 7.65 6.42 6.31
P/BV (x) 3.49 3.00 2.41 1.96 1.69
Source: Company Reports & Global Research
Phone: +965-2295-1281
Senior Financial Analyst
Income Statement
IQCD QD
IQCD.QA
QAFCO V & QAFCO VI fertilizer projects are expected to come online by
end of 2011 and end of 2012 respectively, which will increase the ammonia
and urea capacity of IQ by a significant amount and would give further boost
to the revenues as prices are also expected to inch higher.
Market Data
550.0
20,255.1
7.6
2.4 QASCO expansion is on hold due to natural gas allocation restrictions by
QAPCO. IQ outlined step by step growth each year by expanding various
business which in 2014 would be slowed down due to this news. Price Performance 1-Yr
Industries Qatar
IQ offers significant cost advantage due to low domestic gas prices which is
roughly 50% of the companies overall cost while all the products in the
company’s portfolio are global commodities and their pricing is determined
by global demand supply dynamics.
Downside / Upside: 27.4%
170.90
134.10
STRONG BUY
11,150,101 Avg. Val. Traded (USD)
Target Price (QAR):
Current Price (QAR):
73,755.0 Mkt Cap (QAR mn):
301.9
110
120
130
140
150
160
-
0.4
0.8
1.2
1.6
2.0
De
c-1
0
Ja
n-1
1
Fe
b-1
1
Ma
r-1
1
Ma
y-1
1
Ju
n-1
1
Ju
l-1
1
Au
g-1
1
Se
p-1
1
Oct-
11
No
v-1
1
Volume (mn) Price (QAR) - RHS
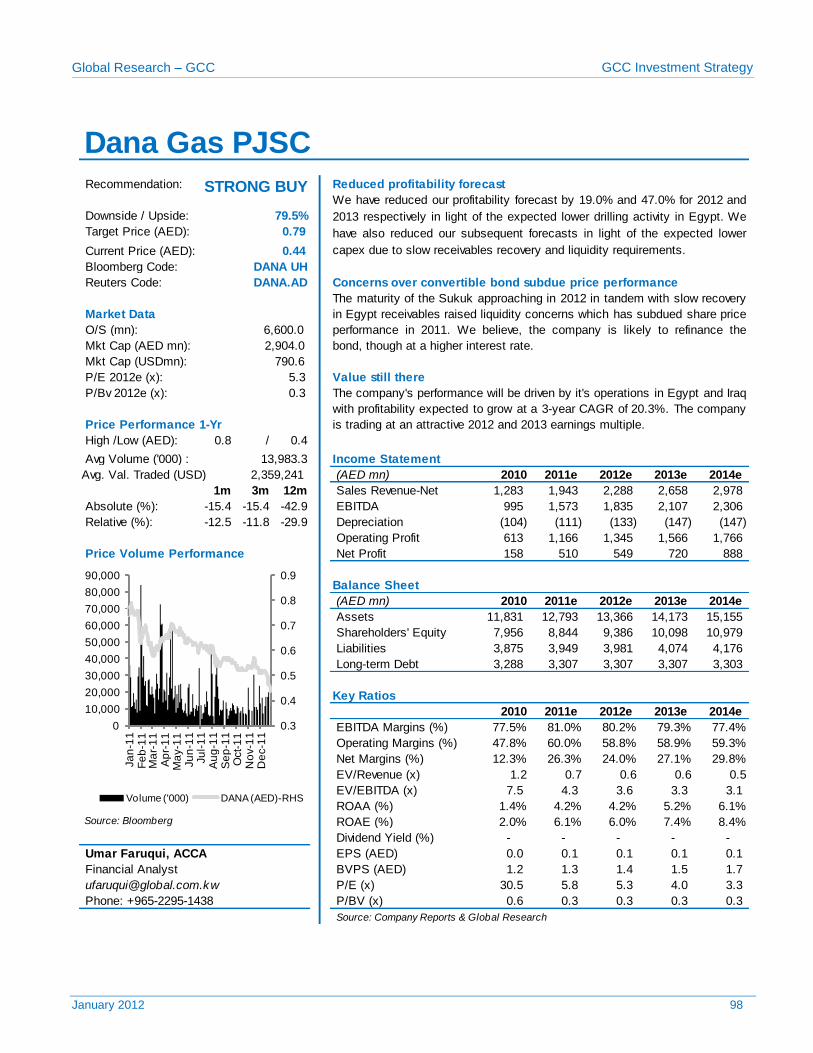
Global Research – GCC GCC Investment Strategy
January 2012 98
Recommendation: Reduced profitability forecast
Bloomberg Code:
Reuters Code: Concerns over convertible bond subdue price performance
O/S (mn):
Mkt Cap (USDmn):
P/E 2012e (x): Value still there
P/Bv 2012e (x):
High /Low (AED): 0.8 / 0.4
Avg Volume ('000) :
(AED mn) 2010 2011e 2012e 2013e 2014e
1m 3m 12m Sales Revenue-Net 1,283 1,943 2,288 2,658 2,978
Absolute (%): -15.4 -15.4 -42.9 EBITDA 995 1,573 1,835 2,107 2,306
Relative (%): -12.5 -11.8 -29.9 Depreciation (104) (111) (133) (147) (147)
Operating Profit 613 1,166 1,345 1,566 1,766
Price Volume Performance Net Profit 158 510 549 720 888
Balance Sheet
(AED mn) 2010 2011e 2012e 2013e 2014e
Assets 11,831 12,793 13,366 14,173 15,155
Shareholders' Equity 7,956 8,844 9,386 10,098 10,979
Liabilities 3,875 3,949 3,981 4,074 4,176
Long-term Debt 3,288 3,307 3,307 3,307 3,303
Key Ratios
2010 2011e 2012e 2013e 2014e
EBITDA Margins (%) 77.5% 81.0% 80.2% 79.3% 77.4%
Operating Margins (%) 47.8% 60.0% 58.8% 58.9% 59.3%
Net Margins (%) 12.3% 26.3% 24.0% 27.1% 29.8%
EV/Revenue (x) 1.2 0.7 0.6 0.6 0.5
EV/EBITDA (x) 7.5 4.3 3.6 3.3 3.1
ROAA (%) 1.4% 4.2% 4.2% 5.2% 6.1% Source: Bloomberg ROAE (%) 2.0% 6.1% 6.0% 7.4% 8.4%
Dividend Yield (%) - - - - -
EPS (AED) 0.0 0.1 0.1 0.1 0.1
BVPS (AED) 1.2 1.3 1.4 1.5 1.7
P/E (x) 30.5 5.8 5.3 4.0 3.3
P/BV (x) 0.6 0.3 0.3 0.3 0.3
Source: Company Reports & Global Research
Phone: +965-2295-1438
Umar Faruqui, ACCA
Financial Analyst
Income Statement
DANA UH
DANA.AD
The maturity of the Sukuk approaching in 2012 in tandem with slow recovery
in Egypt receivables raised liquidity concerns which has subdued share price
performance in 2011. We believe, the company is likely to refinance the
bond, though at a higher interest rate.
Market Data
6,600.0
790.6
5.3
0.3 The company's performance will be driven by it's operations in Egypt and Iraq
with profitability expected to grow at a 3-year CAGR of 20.3%. The company
is trading at an attractive 2012 and 2013 earnings multiple. Price Performance 1-Yr
Dana Gas PJSC
We have reduced our profitability forecast by 19.0% and 47.0% for 2012 and
2013 respectively in light of the expected lower drilling activity in Egypt. We
have also reduced our subsequent forecasts in light of the expected lower
capex due to slow receivables recovery and liquidity requirements.
Downside / Upside: 79.5%
0.79
0.44
STRONG BUY
2,359,241 Avg. Val. Traded (USD)
Target Price (AED):
Current Price (AED):
2,904.0 Mkt Cap (AED mn):
13,983.3
0.3
0.4
0.5
0.6
0.7
0.8
0.9
0
10,000
20,000
30,000
40,000
50,000
60,000
70,000
80,000
90,000
Ja
n-1
1F
eb
-11
Ma
r-1
1A
pr-
11
Ma
y-1
1Ju
n-1
1Ju
l-1
1A
ug
-11
Se
p-1
1O
ct-
11
No
v-1
1D
ec-1
1
Volume ('000) DANA (AED)-RHS

Global Research – GCC GCC Investment Strategy
January 2012 99
REAL ESTATE SECTOR
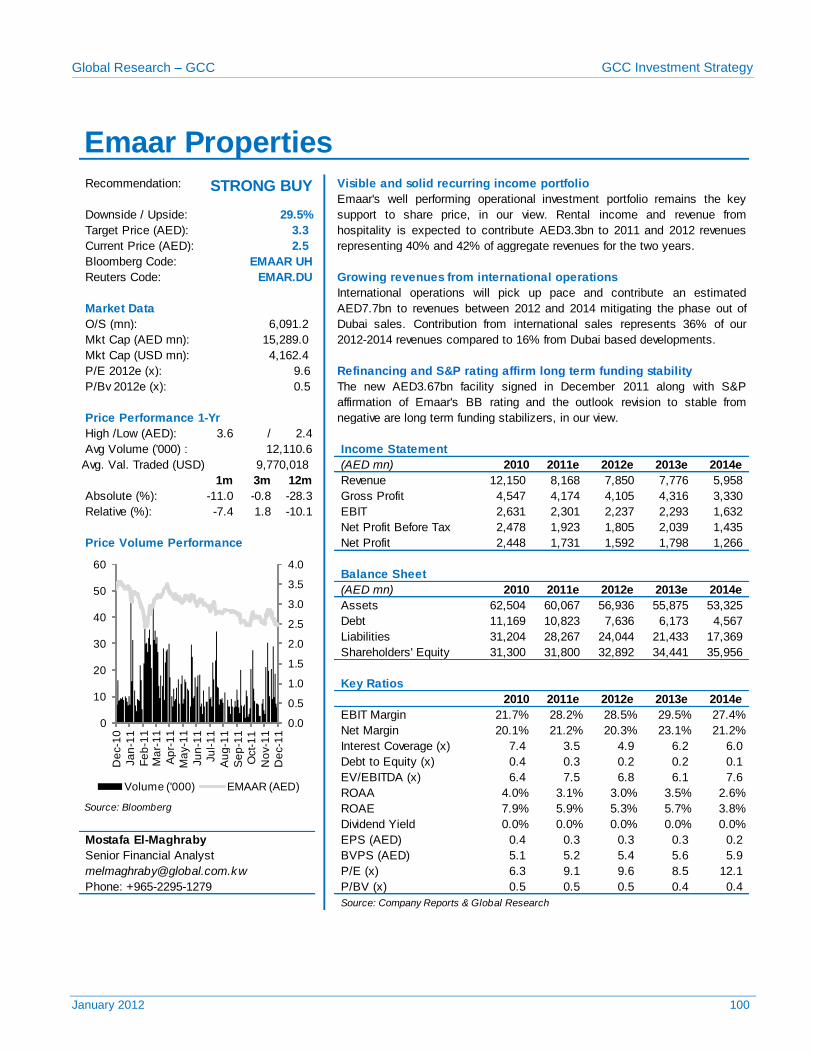
Global Research – GCC GCC Investment Strategy
January 2012 100
Recommendation: Visible and solid recurring income portfolio
Bloomberg Code:
Reuters Code: Growing revenues from international operations
O/S (mn):
Mkt Cap (USD mn):
P/E 2012e (x): Refinancing and S&P rating affirm long term funding stability
P/Bv 2012e (x):
High /Low (AED): 3.6 / 2.4
Avg Volume ('000) :
(AED mn) 2010 2011e 2012e 2013e 2014e
1m 3m 12m Revenue 12,150 8,168 7,850 7,776 5,958
Absolute (%): -11.0 -0.8 -28.3 Gross Profit 4,547 4,174 4,105 4,316 3,330
Relative (%): -7.4 1.8 -10.1 EBIT 2,631 2,301 2,237 2,293 1,632
Net Profit Before Tax 2,478 1,923 1,805 2,039 1,435
Price Volume Performance Net Profit 2,448 1,731 1,592 1,798 1,266
Balance Sheet
(AED mn) 2010 2011e 2012e 2013e 2014e
Assets 62,504 60,067 56,936 55,875 53,325
Debt 11,169 10,823 7,636 6,173 4,567
Liabilities 31,204 28,267 24,044 21,433 17,369
Shareholders' Equity 31,300 31,800 32,892 34,441 35,956
Key Ratios
2010 2011e 2012e 2013e 2014e
EBIT Margin 21.7% 28.2% 28.5% 29.5% 27.4%
Net Margin 20.1% 21.2% 20.3% 23.1% 21.2%
Interest Coverage (x) 7.4 3.5 4.9 6.2 6.0
Debt to Equity (x) 0.4 0.3 0.2 0.2 0.1
EV/EBITDA (x) 6.4 7.5 6.8 6.1 7.6
ROAA 4.0% 3.1% 3.0% 3.5% 2.6% Source: Bloomberg ROAE 7.9% 5.9% 5.3% 5.7% 3.8%
Dividend Yield 0.0% 0.0% 0.0% 0.0% 0.0%
EPS (AED) 0.4 0.3 0.3 0.3 0.2
BVPS (AED) 5.1 5.2 5.4 5.6 5.9
[email protected] P/E (x) 6.3 9.1 9.6 8.5 12.1
P/BV (x) 0.5 0.5 0.5 0.4 0.4
Source: Company Reports & Global Research
Phone: +965-2295-1279
Mostafa El-Maghraby
4,162.4
9.6
0.5
Senior Financial Analyst
9,770,018 Avg. Val. Traded (USD)
The new AED3.67bn facility signed in December 2011 along with S&P
affirmation of Emaar's BB rating and the outlook revision to stable from
negative are long term funding stabilizers, in our view. Price Performance 1-Yr
12,110.6 Income Statement
EMAAR UH
EMAR.DU
International operations will pick up pace and contribute an estimated
AED7.7bn to revenues between 2012 and 2014 mitigating the phase out of
Dubai sales. Contribution from international sales represents 36% of our
2012-2014 revenues compared to 16% from Dubai based developments.
Market Data
6,091.2
15,289.0 Mkt Cap (AED mn):
Emaar Properties
Emaar's well performing operational investment portfolio remains the key
support to share price, in our view. Rental income and revenue from
hospitality is expected to contribute AED3.3bn to 2011 and 2012 revenues
representing 40% and 42% of aggregate revenues for the two years.
Downside / Upside: 29.5%
3.3
2.5
Target Price (AED):
Current Price (AED):
STRONG BUY
0.0
0.5
1.0
1.5
2.0
2.5
3.0
3.5
4.0
0
10
20
30
40
50
60
De
c-1
0
Ja
n-1
1
Fe
b-1
1M
ar-
11
Ap
r-1
1
Ma
y-1
1
Ju
n-1
1
Ju
l-1
1
Au
g-1
1
Se
p-1
1
Oct-
11
No
v-1
1
De
c-1
1
Volume ('000) EMAAR (AED)
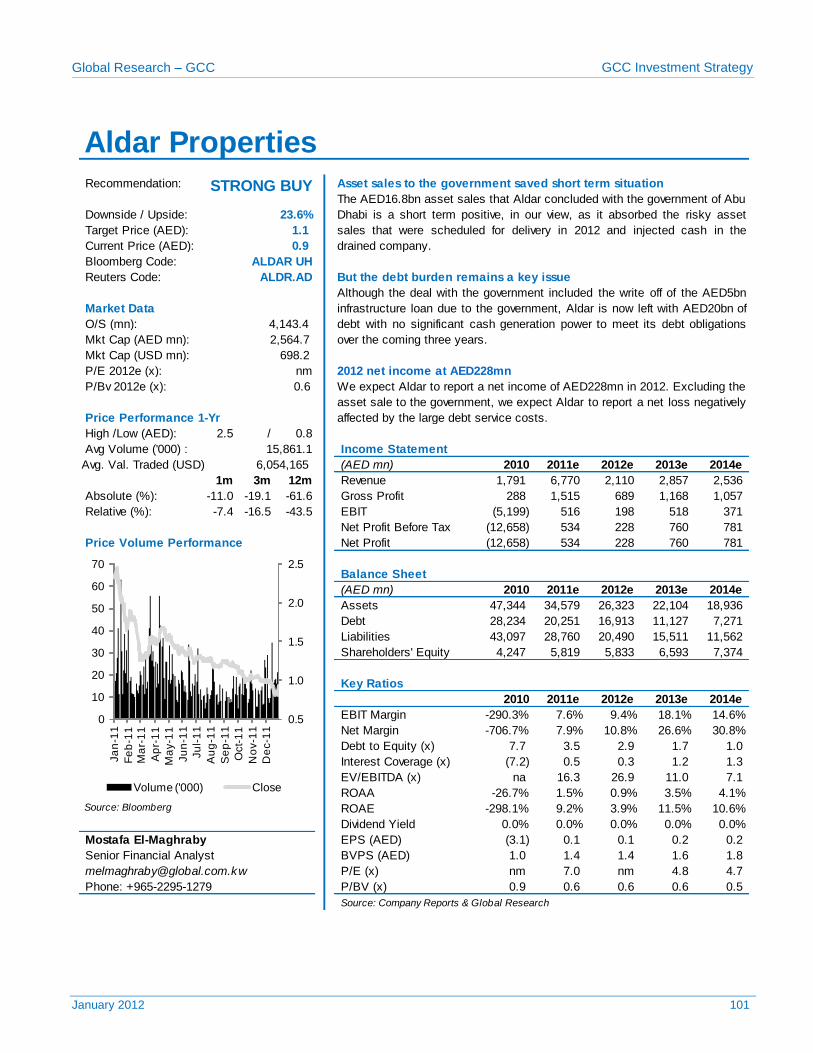
Global Research – GCC GCC Investment Strategy
January 2012 101
Recommendation: Asset sales to the government saved short term situation
Bloomberg Code:
Reuters Code: But the debt burden remains a key issue
O/S (mn):
Mkt Cap (USD mn):
P/E 2012e (x): 2012 net income at AED228mn
P/Bv 2012e (x):
High /Low (AED): 2.5 / 0.8
Avg Volume ('000) :
(AED mn) 2010 2011e 2012e 2013e 2014e
1m 3m 12m Revenue 1,791 6,770 2,110 2,857 2,536
Absolute (%): -11.0 -19.1 -61.6 Gross Profit 288 1,515 689 1,168 1,057
Relative (%): -7.4 -16.5 -43.5 EBIT (5,199) 516 198 518 371
Net Profit Before Tax (12,658) 534 228 760 781
Price Volume Performance Net Profit (12,658) 534 228 760 781
Balance Sheet
(AED mn) 2010 2011e 2012e 2013e 2014e
Assets 47,344 34,579 26,323 22,104 18,936
Debt 28,234 20,251 16,913 11,127 7,271
Liabilities 43,097 28,760 20,490 15,511 11,562
Shareholders' Equity 4,247 5,819 5,833 6,593 7,374
Key Ratios
2010 2011e 2012e 2013e 2014e
EBIT Margin -290.3% 7.6% 9.4% 18.1% 14.6%
Net Margin -706.7% 7.9% 10.8% 26.6% 30.8%
Debt to Equity (x) 7.7 3.5 2.9 1.7 1.0
Interest Coverage (x) (7.2) 0.5 0.3 1.2 1.3
EV/EBITDA (x) na 16.3 26.9 11.0 7.1
ROAA -26.7% 1.5% 0.9% 3.5% 4.1% Source: Bloomberg ROAE -298.1% 9.2% 3.9% 11.5% 10.6%
Dividend Yield 0.0% 0.0% 0.0% 0.0% 0.0%
EPS (AED) (3.1) 0.1 0.1 0.2 0.2
BVPS (AED) 1.0 1.4 1.4 1.6 1.8
[email protected] P/E (x) nm 7.0 nm 4.8 4.7
P/BV (x) 0.9 0.6 0.6 0.6 0.5
Source: Company Reports & Global Research
Aldar Properties
The AED16.8bn asset sales that Aldar concluded with the government of Abu
Dhabi is a short term positive, in our view, as it absorbed the risky asset
sales that were scheduled for delivery in 2012 and injected cash in the
drained company.
Downside / Upside: 23.6%
1.1
0.9
Target Price (AED):
Current Price (AED):
STRONG BUY
We expect Aldar to report a net income of AED228mn in 2012. Excluding the
asset sale to the government, we expect Aldar to report a net loss negatively
affected by the large debt service costs. Price Performance 1-Yr
15,861.1 Income Statement
ALDAR UH
ALDR.AD
Although the deal with the government included the write off of the AED5bn
infrastructure loan due to the government, Aldar is now left with AED20bn of
debt with no significant cash generation power to meet its debt obligations
over the coming three years.
Market Data
4,143.4
2,564.7 Mkt Cap (AED mn):
Phone: +965-2295-1279
Mostafa El-Maghraby
698.2
nm
0.6
Senior Financial Analyst
6,054,165 Avg. Val. Traded (USD)
0.5
1.0
1.5
2.0
2.5
0
10
20
30
40
50
60
70
Ja
n-1
1
Fe
b-1
1M
ar-
11
Ap
r-1
1
Ma
y-1
1
Ju
n-1
1
Ju
l-1
1
Au
g-1
1
Se
p-1
1
Oct-
11
No
v-1
1
De
c-1
1
Volume ('000) Close
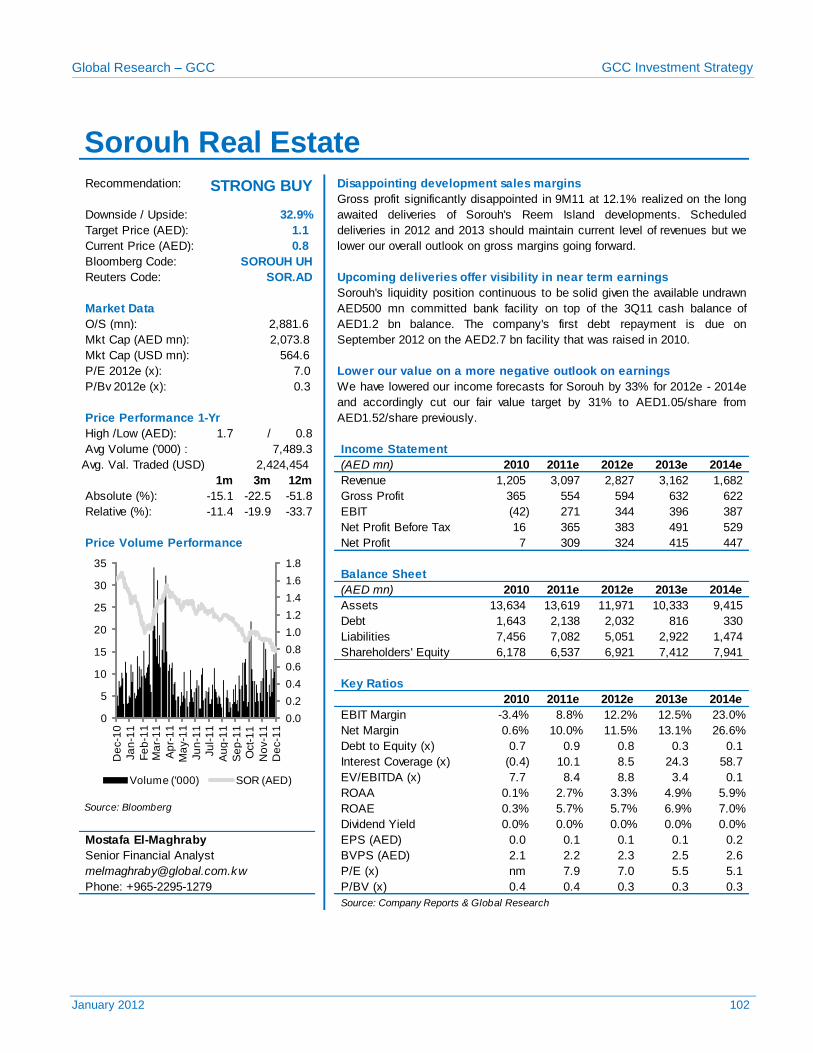
Global Research – GCC GCC Investment Strategy
January 2012 102
Recommendation: Disappointing development sales margins
Bloomberg Code:
Reuters Code: Upcoming deliveries offer visibility in near term earnings
O/S (mn):
Mkt Cap (USD mn):
P/E 2012e (x): Lower our value on a more negative outlook on earnings
P/Bv 2012e (x):
High /Low (AED): 1.7 / 0.8
Avg Volume ('000) :
(AED mn) 2010 2011e 2012e 2013e 2014e
1m 3m 12m Revenue 1,205 3,097 2,827 3,162 1,682
Absolute (%): -15.1 -22.5 -51.8 Gross Profit 365 554 594 632 622
Relative (%): -11.4 -19.9 -33.7 EBIT (42) 271 344 396 387
Net Profit Before Tax 16 365 383 491 529
Price Volume Performance Net Profit 7 309 324 415 447
Balance Sheet
(AED mn) 2010 2011e 2012e 2013e 2014e
Assets 13,634 13,619 11,971 10,333 9,415
Debt 1,643 2,138 2,032 816 330
Liabilities 7,456 7,082 5,051 2,922 1,474
Shareholders' Equity 6,178 6,537 6,921 7,412 7,941
Key Ratios
2010 2011e 2012e 2013e 2014e
EBIT Margin -3.4% 8.8% 12.2% 12.5% 23.0%
Net Margin 0.6% 10.0% 11.5% 13.1% 26.6%
Debt to Equity (x) 0.7 0.9 0.8 0.3 0.1
Interest Coverage (x) (0.4) 10.1 8.5 24.3 58.7
EV/EBITDA (x) 7.7 8.4 8.8 3.4 0.1
ROAA 0.1% 2.7% 3.3% 4.9% 5.9% Source: Bloomberg ROAE 0.3% 5.7% 5.7% 6.9% 7.0%
Dividend Yield 0.0% 0.0% 0.0% 0.0% 0.0%
EPS (AED) 0.0 0.1 0.1 0.1 0.2
BVPS (AED) 2.1 2.2 2.3 2.5 2.6
[email protected] P/E (x) nm 7.9 7.0 5.5 5.1
P/BV (x) 0.4 0.4 0.3 0.3 0.3
Source: Company Reports & Global Research
SOROUH UH
SOR.AD
Sorouh's liquidity position continuous to be solid given the available undrawn
AED500 mn committed bank facility on top of the 3Q11 cash balance of
AED1.2 bn balance. The company's first debt repayment is due on
September 2012 on the AED2.7 bn facility that was raised in 2010.
Market Data
2,881.6
2,073.8 Mkt Cap (AED mn):
Sorouh Real Estate
Gross profit significantly disappointed in 9M11 at 12.1% realized on the long
awaited deliveries of Sorouh's Reem Island developments. Scheduled
deliveries in 2012 and 2013 should maintain current level of revenues but we
lower our overall outlook on gross margins going forward.
Downside / Upside: 32.9%
1.1
0.8
Target Price (AED):
Current Price (AED):
STRONG BUY
Phone: +965-2295-1279
Mostafa El-Maghraby
Senior Financial Analyst
Avg. Val. Traded (USD) 2,424,454
Income Statement
564.6
7.0
0.3 We have lowered our income forecasts for Sorouh by 33% for 2012e - 2014e
and accordingly cut our fair value target by 31% to AED1.05/share from
AED1.52/share previously.
7,489.3
Price Performance 1-Yr
0.0
0.2
0.4
0.6
0.8
1.0
1.2
1.4
1.6
1.8
0
5
10
15
20
25
30
35
De
c-1
0
Ja
n-1
1
Fe
b-1
1M
ar-
11
Ap
r-1
1
Ma
y-1
1
Ju
n-1
1
Ju
l-1
1
Au
g-1
1
Se
p-1
1
Oct-
11
No
v-1
1
De
c-1
1
Volume ('000) SOR (AED)
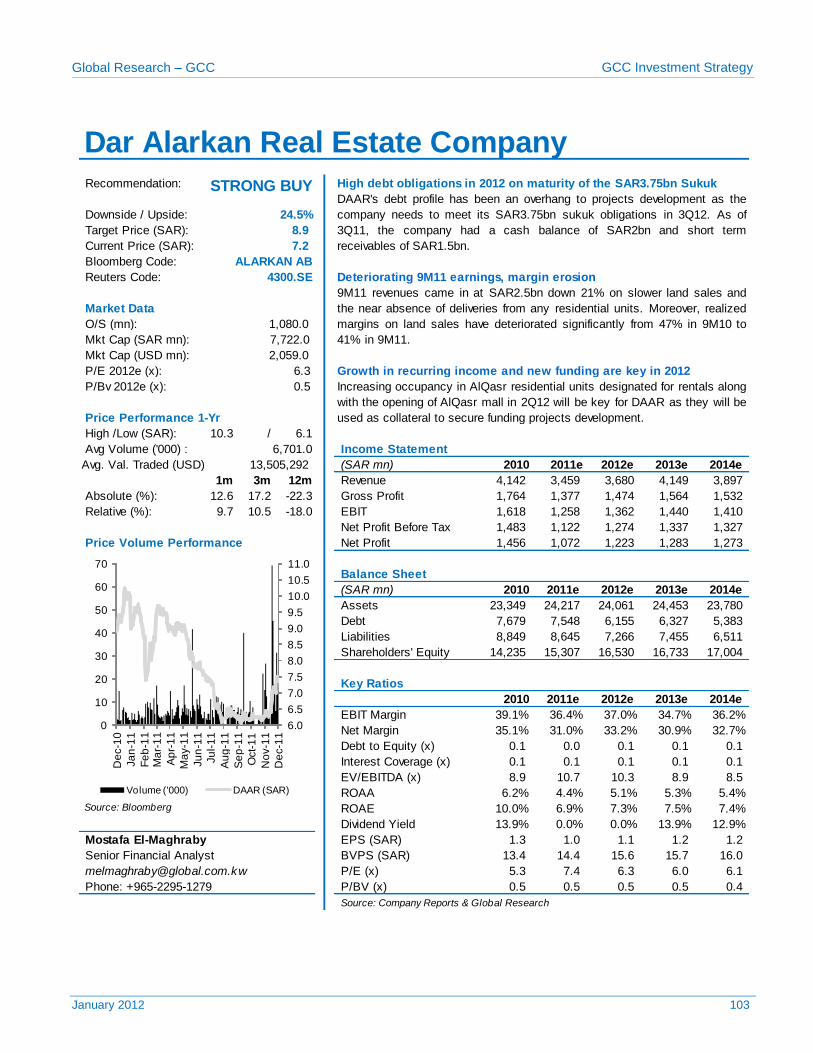
Global Research – GCC GCC Investment Strategy
January 2012 103
Recommendation: High debt obligations in 2012 on maturity of the SAR3.75bn Sukuk
Bloomberg Code:
Reuters Code: Deteriorating 9M11 earnings, margin erosion
O/S (mn):
Mkt Cap (USD mn):
P/E 2012e (x): Growth in recurring income and new funding are key in 2012
P/Bv 2012e (x):
High /Low (SAR): 10.3 / 6.1
Avg Volume ('000) :
(SAR mn) 2010 2011e 2012e 2013e 2014e
1m 3m 12m Revenue 4,142 3,459 3,680 4,149 3,897
Absolute (%): 12.6 17.2 -22.3 Gross Profit 1,764 1,377 1,474 1,564 1,532
Relative (%): 9.7 10.5 -18.0 EBIT 1,618 1,258 1,362 1,440 1,410
Net Profit Before Tax 1,483 1,122 1,274 1,337 1,327
Price Volume Performance Net Profit 1,456 1,072 1,223 1,283 1,273
Balance Sheet
(SAR mn) 2010 2011e 2012e 2013e 2014e
Assets 23,349 24,217 24,061 24,453 23,780
Debt 7,679 7,548 6,155 6,327 5,383
Liabilities 8,849 8,645 7,266 7,455 6,511
Shareholders' Equity 14,235 15,307 16,530 16,733 17,004
Key Ratios
2010 2011e 2012e 2013e 2014e
EBIT Margin 39.1% 36.4% 37.0% 34.7% 36.2%
Net Margin 35.1% 31.0% 33.2% 30.9% 32.7%
Debt to Equity (x) 0.1 0.0 0.1 0.1 0.1
Interest Coverage (x) 0.1 0.1 0.1 0.1 0.1
EV/EBITDA (x) 8.9 10.7 10.3 8.9 8.5
ROAA 6.2% 4.4% 5.1% 5.3% 5.4% Source: Bloomberg ROAE 10.0% 6.9% 7.3% 7.5% 7.4%
Dividend Yield 13.9% 0.0% 0.0% 13.9% 12.9%
EPS (SAR) 1.3 1.0 1.1 1.2 1.2
BVPS (SAR) 13.4 14.4 15.6 15.7 16.0
[email protected] P/E (x) 5.3 7.4 6.3 6.0 6.1
P/BV (x) 0.5 0.5 0.5 0.5 0.4
Source: Company Reports & Global Research
Dar Alarkan Real Estate Company
DAAR's debt profile has been an overhang to projects development as the
company needs to meet its SAR3.75bn sukuk obligations in 3Q12. As of
3Q11, the company had a cash balance of SAR2bn and short term
receivables of SAR1.5bn.
Downside / Upside: 24.5%
8.9
7.2
STRONG BUY
Target Price (SAR):
Current Price (SAR):
2,059.0
6.3
0.5 Increasing occupancy in AlQasr residential units designated for rentals along
with the opening of AlQasr mall in 2Q12 will be key for DAAR as they will be
used as collateral to secure funding projects development. Price Performance 1-Yr
ALARKAN AB
4300.SE
9M11 revenues came in at SAR2.5bn down 21% on slower land sales and
the near absence of deliveries from any residential units. Moreover, realized
margins on land sales have deteriorated significantly from 47% in 9M10 to
41% in 9M11.
Market Data
1,080.0
7,722.0 Mkt Cap (SAR mn):
Phone: +965-2295-1279
Mostafa El-Maghraby
Senior Financial Analyst
Source: Zawya
Income Statement
13,505,292 Avg. Val. Traded (USD)
6,701.0
6.0
6.5
7.0
7.5
8.0
8.5
9.0
9.5
10.0
10.5
11.0
0
10
20
30
40
50
60
70
De
c-1
0
Ja
n-1
1
Fe
b-1
1M
ar-
11
Ap
r-1
1
Ma
y-1
1
Ju
n-1
1
Ju
l-1
1
Au
g-1
1
Se
p-1
1
Oct-
11
No
v-1
1
De
c-1
1
Volume ('000) DAAR (SAR)
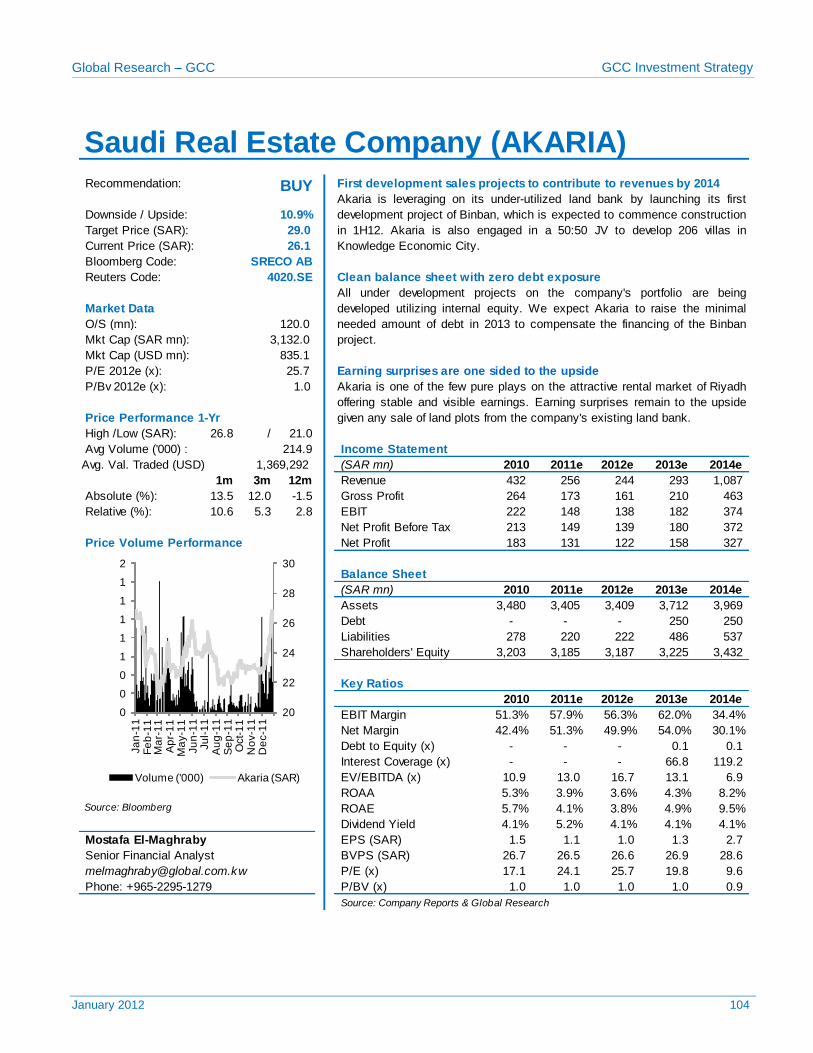
Global Research – GCC GCC Investment Strategy
January 2012 104
Recommendation: First development sales projects to contribute to revenues by 2014
Bloomberg Code:
Reuters Code: Clean balance sheet with zero debt exposure
O/S (mn):
Mkt Cap (USD mn):
P/E 2012e (x): Earning surprises are one sided to the upside
P/Bv 2012e (x):
High /Low (SAR): 26.8 / 21.0
Avg Volume ('000) :
(SAR mn) 2010 2011e 2012e 2013e 2014e
1m 3m 12m Revenue 432 256 244 293 1,087
Absolute (%): 13.5 12.0 -1.5 Gross Profit 264 173 161 210 463
Relative (%): 10.6 5.3 2.8 EBIT 222 148 138 182 374
Net Profit Before Tax 213 149 139 180 372
Price Volume Performance Net Profit 183 131 122 158 327
Balance Sheet
(SAR mn) 2010 2011e 2012e 2013e 2014e
Assets 3,480 3,405 3,409 3,712 3,969
Debt - - - 250 250
Liabilities 278 220 222 486 537
Shareholders' Equity 3,203 3,185 3,187 3,225 3,432
Key Ratios
2010 2011e 2012e 2013e 2014e
EBIT Margin 51.3% 57.9% 56.3% 62.0% 34.4%
Net Margin 42.4% 51.3% 49.9% 54.0% 30.1%
Debt to Equity (x) - - - 0.1 0.1
Interest Coverage (x) - - - 66.8 119.2
EV/EBITDA (x) 10.9 13.0 16.7 13.1 6.9
ROAA 5.3% 3.9% 3.6% 4.3% 8.2% Source: Bloomberg ROAE 5.7% 4.1% 3.8% 4.9% 9.5%
Dividend Yield 4.1% 5.2% 4.1% 4.1% 4.1%
EPS (SAR) 1.5 1.1 1.0 1.3 2.7
BVPS (SAR) 26.7 26.5 26.6 26.9 28.6
[email protected] P/E (x) 17.1 24.1 25.7 19.8 9.6
P/BV (x) 1.0 1.0 1.0 1.0 0.9
Source: Company Reports & Global Research
835.1
Akaria is one of the few pure plays on the attractive rental market of Riyadh
offering stable and visible earnings. Earning surprises remain to the upside
given any sale of land plots from the company's existing land bank. Price Performance 1-Yr
Saudi Real Estate Company (AKARIA)
Akaria is leveraging on its under-utilized land bank by launching its first
development project of Binban, which is expected to commence construction
in 1H12. Akaria is also engaged in a 50:50 JV to develop 206 villas in
Knowledge Economic City.
Downside / Upside: 10.9%
29.0
26.1
BUY
Target Price (SAR):
Current Price (SAR):
3,132.0 Mkt Cap (SAR mn):
25.7
1.0
SRECO AB
4020.SE
All under development projects on the company's portfolio are being
developed utilizing internal equity. We expect Akaria to raise the minimal
needed amount of debt in 2013 to compensate the financing of the Binban
project.
Market Data
120.0
Phone: +965-2295-1279
Mostafa El-Maghraby
Senior Financial Analyst
Income Statement
1,369,292 Avg. Val. Traded (USD)
214.9
20
22
24
26
28
30
0
0
0
1
1
1
1
1
2
Ja
n-1
1F
eb
-11
Ma
r-1
1A
pr-
11
Ma
y-1
1Ju
n-1
1Ju
l-1
1A
ug
-11
Se
p-1
1O
ct-
11
No
v-1
1D
ec-1
1
Volume ('000) Akaria (SAR)
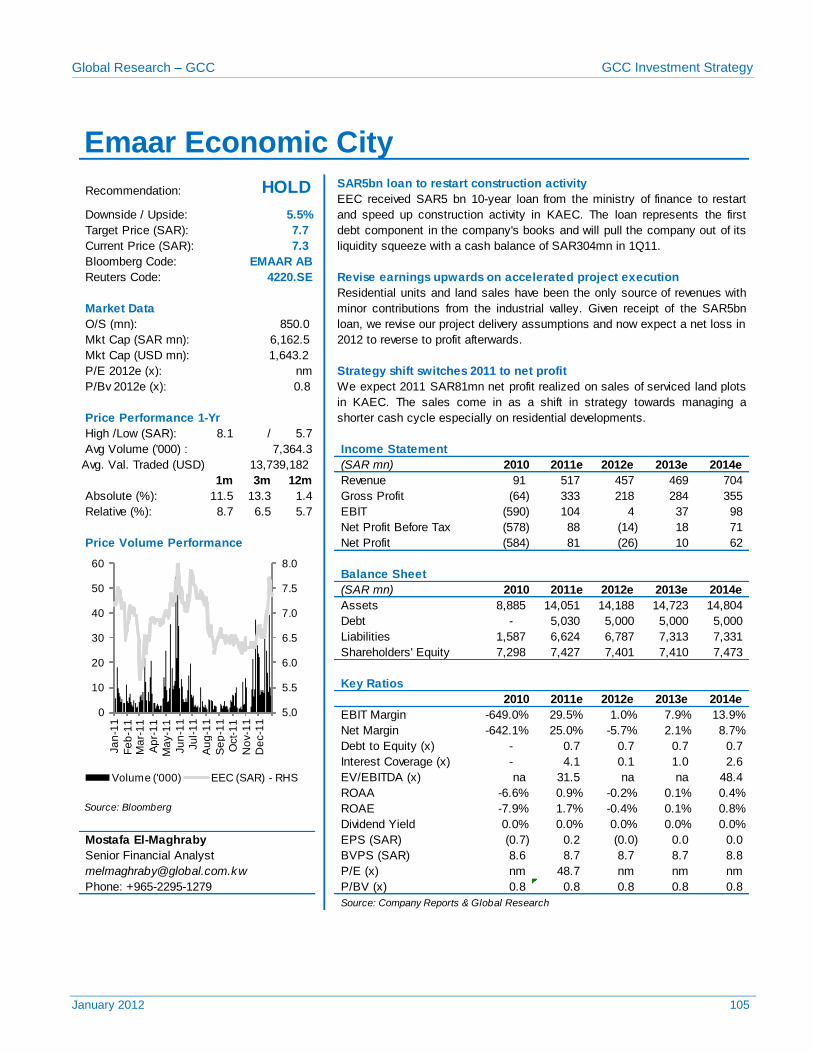
Global Research – GCC GCC Investment Strategy
January 2012 105
SAR5bn loan to restart construction activity
Bloomberg Code:
Reuters Code: Revise earnings upwards on accelerated project execution
O/S (mn):
Mkt Cap (USD mn):
P/E 2012e (x): Strategy shift switches 2011 to net profit
P/Bv 2012e (x):
High /Low (SAR): 8.1 / 5.7
Avg Volume ('000) :
(SAR mn) 2010 2011e 2012e 2013e 2014e
1m 3m 12m Revenue 91 517 457 469 704
Absolute (%): 11.5 13.3 1.4 Gross Profit (64) 333 218 284 355
Relative (%): 8.7 6.5 5.7 EBIT (590) 104 4 37 98
Net Profit Before Tax (578) 88 (14) 18 71
Price Volume Performance Net Profit (584) 81 (26) 10 62
Balance Sheet
(SAR mn) 2010 2011e 2012e 2013e 2014e
Assets 8,885 14,051 14,188 14,723 14,804
Debt - 5,030 5,000 5,000 5,000
Liabilities 1,587 6,624 6,787 7,313 7,331
Shareholders' Equity 7,298 7,427 7,401 7,410 7,473
Key Ratios
2010 2011e 2012e 2013e 2014e
EBIT Margin -649.0% 29.5% 1.0% 7.9% 13.9%
Net Margin -642.1% 25.0% -5.7% 2.1% 8.7%
Debt to Equity (x) - 0.7 0.7 0.7 0.7
Interest Coverage (x) - 4.1 0.1 1.0 2.6
EV/EBITDA (x) na 31.5 na na 48.4
ROAA -6.6% 0.9% -0.2% 0.1% 0.4% Source: Bloomberg ROAE -7.9% 1.7% -0.4% 0.1% 0.8%
Dividend Yield 0.0% 0.0% 0.0% 0.0% 0.0%
EPS (SAR) (0.7) 0.2 (0.0) 0.0 0.0
BVPS (SAR) 8.6 8.7 8.7 8.7 8.8
[email protected] P/E (x) nm 48.7 nm nm nm
P/BV (x) 0.8 0.8 0.8 0.8 0.8
Source: Company Reports & Global Research
Emaar Economic City
Recommendation: HOLD EEC received SAR5 bn 10-year loan from the ministry of finance to restart
and speed up construction activity in KAEC. The loan represents the first
debt component in the company's books and will pull the company out of its
liquidity squeeze with a cash balance of SAR304mn in 1Q11.
Downside / Upside: 5.5%
7.7
7.3
Target Price (SAR):
Current Price (SAR):
1,643.2
nm
0.8 We expect 2011 SAR81mn net profit realized on sales of serviced land plots
in KAEC. The sales come in as a shift in strategy towards managing a
shorter cash cycle especially on residential developments. Price Performance 1-Yr
EMAAR AB
4220.SE
Residential units and land sales have been the only source of revenues with
minor contributions from the industrial valley. Given receipt of the SAR5bn
loan, we revise our project delivery assumptions and now expect a net loss in
2012 to reverse to profit afterwards.
Market Data
850.0
6,162.5 Mkt Cap (SAR mn):
Phone: +965-2295-1279
Mostafa El-Maghraby
Senior Financial Analyst
Income Statement
13,739,182 Avg. Val. Traded (USD)
7,364.3
5.0
5.5
6.0
6.5
7.0
7.5
8.0
0
10
20
30
40
50
60
Ja
n-1
1
Fe
b-1
1M
ar-
11
Ap
r-1
1
Ma
y-1
1
Ju
n-1
1
Ju
l-1
1
Au
g-1
1
Se
p-1
1
Oct-
11
No
v-1
1
De
c-1
1
Volume ('000) EEC (SAR) - RHS
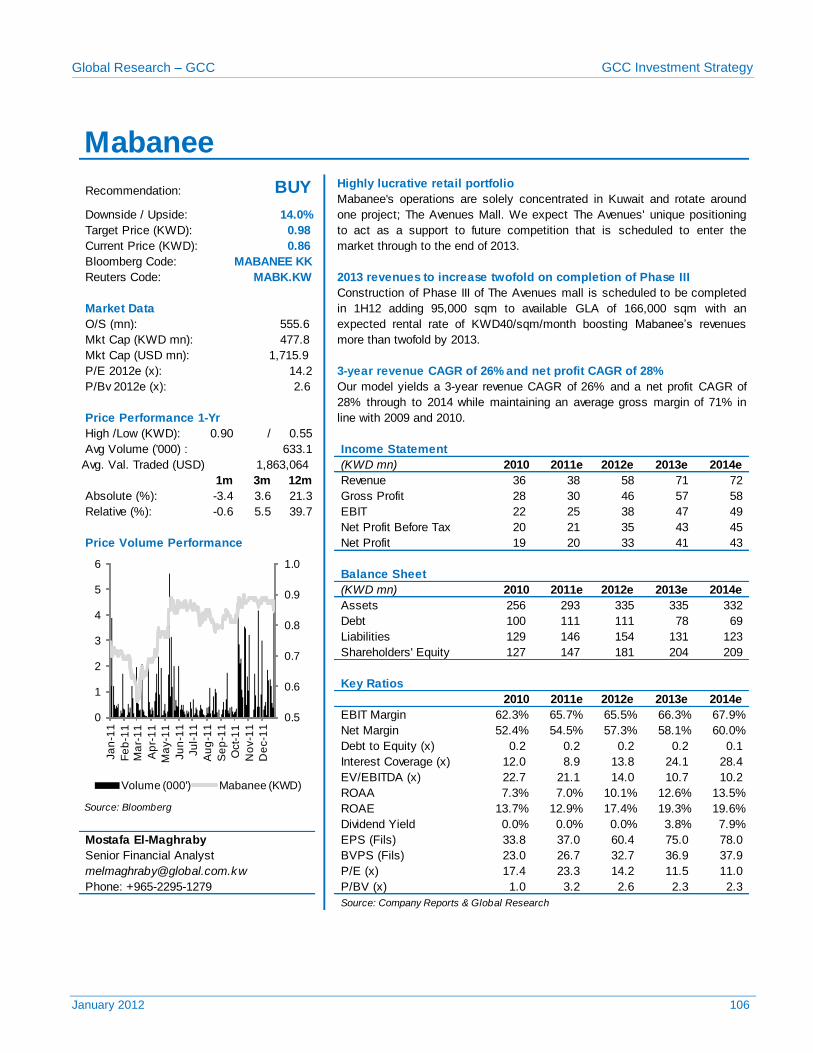
Global Research – GCC GCC Investment Strategy
January 2012 106
Highly lucrative retail portfolio
Bloomberg Code:
Reuters Code: 2013 revenues to increase twofold on completion of Phase III
O/S (mn):
Mkt Cap (USD mn):
P/E 2012e (x):
P/Bv 2012e (x):
High /Low (KWD): 0.90 / 0.55
Avg Volume ('000) :
(KWD mn) 2010 2011e 2012e 2013e 2014e
1m 3m 12m Revenue 36 38 58 71 72
Absolute (%): -3.4 3.6 21.3 Gross Profit 28 30 46 57 58
Relative (%): -0.6 5.5 39.7 EBIT 22 25 38 47 49
Net Profit Before Tax 20 21 35 43 45
Price Volume Performance Net Profit 19 20 33 41 43
Balance Sheet
(KWD mn) 2010 2011e 2012e 2013e 2014e
Assets 256 293 335 335 332
Debt 100 111 111 78 69
Liabilities 129 146 154 131 123
Shareholders' Equity 127 147 181 204 209
Key Ratios
2010 2011e 2012e 2013e 2014e
EBIT Margin 62.3% 65.7% 65.5% 66.3% 67.9%
Net Margin 52.4% 54.5% 57.3% 58.1% 60.0%
Debt to Equity (x) 0.2 0.2 0.2 0.2 0.1
Interest Coverage (x) 12.0 8.9 13.8 24.1 28.4
EV/EBITDA (x) 22.7 21.1 14.0 10.7 10.2
ROAA 7.3% 7.0% 10.1% 12.6% 13.5% Source: Bloomberg ROAE 13.7% 12.9% 17.4% 19.3% 19.6%
Dividend Yield 0.0% 0.0% 0.0% 3.8% 7.9%
EPS (Fils) 33.8 37.0 60.4 75.0 78.0
BVPS (Fils) 23.0 26.7 32.7 36.9 37.9
[email protected] P/E (x) 17.4 23.3 14.2 11.5 11.0
P/BV (x) 1.0 3.2 2.6 2.3 2.3
Source: Company Reports & Global Research
Mabanee
Recommendation: BUY Mabanee's operations are solely concentrated in Kuwait and rotate around
one project; The Avenues Mall. We expect The Avenues' unique positioning
to act as a support to future competition that is scheduled to enter the
market through to the end of 2013.
Downside / Upside: 14.0%
Target Price (KWD): 0.98
Current Price (KWD): 0.86
MABANEE KK
MABK.KW
Construction of Phase III of The Avenues mall is scheduled to be completed
in 1H12 adding 95,000 sqm to available GLA of 166,000 sqm with an
expected rental rate of KWD40/sqm/month boosting Mabanee’s revenues
more than twofold by 2013.
Market Data
555.6
Mkt Cap (KWD mn): 477.8
Phone: +965-2295-1279
1,715.9
14.2
2.6 Our model yields a 3-year revenue CAGR of 26% and a net profit CAGR of
28% through to 2014 while maintaining an average gross margin of 71% in
line with 2009 and 2010. Price Performance 1-Yr
633.1 Income Statement
Avg. Val. Traded (USD) 1,863,064
Mostafa El-Maghraby
Senior Financial Analyst
3-year revenue CAGR of 26% and net profit CAGR of 28%
0.5
0.6
0.7
0.8
0.9
1.0
0
1
2
3
4
5
6
Ja
n-1
1
Fe
b-1
1M
ar-
11
Ap
r-1
1
Ma
y-1
1
Ju
n-1
1
Ju
l-1
1
Au
g-1
1
Se
p-1
1
Oct-
11
No
v-1
1
De
c-1
1
Volume (000') Mabanee (KWD)
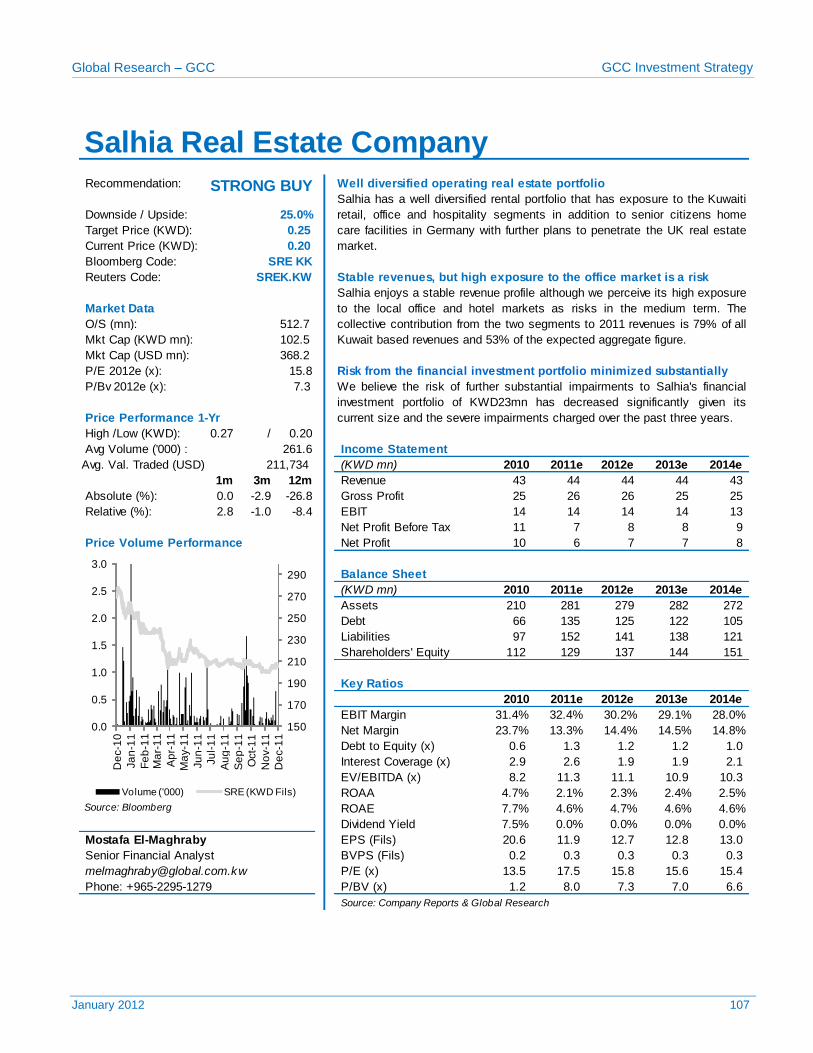
Global Research – GCC GCC Investment Strategy
January 2012 107
Recommendation: Well diversified operating real estate portfolio
Bloomberg Code:
Reuters Code: Stable revenues, but high exposure to the office market is a risk
O/S (mn):
Mkt Cap (USD mn):
P/E 2012e (x): Risk from the financial investment portfolio minimized substantially
P/Bv 2012e (x):
High /Low (KWD): 0.27 / 0.20
Avg Volume ('000) :
(KWD mn) 2010 2011e 2012e 2013e 2014e
1m 3m 12m Revenue 43 44 44 44 43
Absolute (%): 0.0 -2.9 -26.8 Gross Profit 25 26 26 25 25
Relative (%): 2.8 -1.0 -8.4 EBIT 14 14 14 14 13
Net Profit Before Tax 11 7 8 8 9
Price Volume Performance Net Profit 10 6 7 7 8
Balance Sheet
(KWD mn) 2010 2011e 2012e 2013e 2014e
Assets 210 281 279 282 272
Debt 66 135 125 122 105
Liabilities 97 152 141 138 121
Shareholders' Equity 112 129 137 144 151
Key Ratios
2010 2011e 2012e 2013e 2014e
EBIT Margin 31.4% 32.4% 30.2% 29.1% 28.0%
Net Margin 23.7% 13.3% 14.4% 14.5% 14.8%
Debt to Equity (x) 0.6 1.3 1.2 1.2 1.0
Interest Coverage (x) 2.9 2.6 1.9 1.9 2.1
EV/EBITDA (x) 8.2 11.3 11.1 10.9 10.3
ROAA 4.7% 2.1% 2.3% 2.4% 2.5% Source: Bloomberg ROAE 7.7% 4.6% 4.7% 4.6% 4.6%
Dividend Yield 7.5% 0.0% 0.0% 0.0% 0.0%
EPS (Fils) 20.6 11.9 12.7 12.8 13.0
BVPS (Fils) 0.2 0.3 0.3 0.3 0.3
[email protected] P/E (x) 13.5 17.5 15.8 15.6 15.4
P/BV (x) 1.2 8.0 7.3 7.0 6.6
Source: Company Reports & Global Research
Salhia Real Estate Company
Salhia has a well diversified rental portfolio that has exposure to the Kuwaiti
retail, office and hospitality segments in addition to senior citizens home
care facilities in Germany with further plans to penetrate the UK real estate
market.
Downside / Upside: 25.0%
Target Price (KWD): 0.25
Current Price (KWD): 0.20
STRONG BUY
SRE KK
SREK.KW
Salhia enjoys a stable revenue profile although we perceive its high exposure
to the local office and hotel markets as risks in the medium term. The
collective contribution from the two segments to 2011 revenues is 79% of all
Kuwait based revenues and 53% of the expected aggregate figure.
Market Data
512.7
Mkt Cap (KWD mn): 102.5
Phone: +965-2295-1279
368.2
15.8
7.3 We believe the risk of further substantial impairments to Salhia's financial
investment portfolio of KWD23mn has decreased significantly given its
current size and the severe impairments charged over the past three years. Price Performance 1-Yr
261.6 Income Statement
Avg. Val. Traded (USD) 211,734
Mostafa El-Maghraby
Senior Financial Analyst
150
170
190
210
230
250
270
290
0.0
0.5
1.0
1.5
2.0
2.5
3.0
De
c-1
0
Ja
n-1
1
Fe
b-1
1M
ar-
11
Ap
r-1
1
Ma
y-1
1
Ju
n-1
1
Ju
l-1
1
Au
g-1
1
Se
p-1
1
Oct-
11
No
v-1
1
De
c-1
1
Volume ('000) SRE (KWD Fils)
Global Research – GCC GCC Investment Strategy
January 2012 108
TELECOM SECTOR
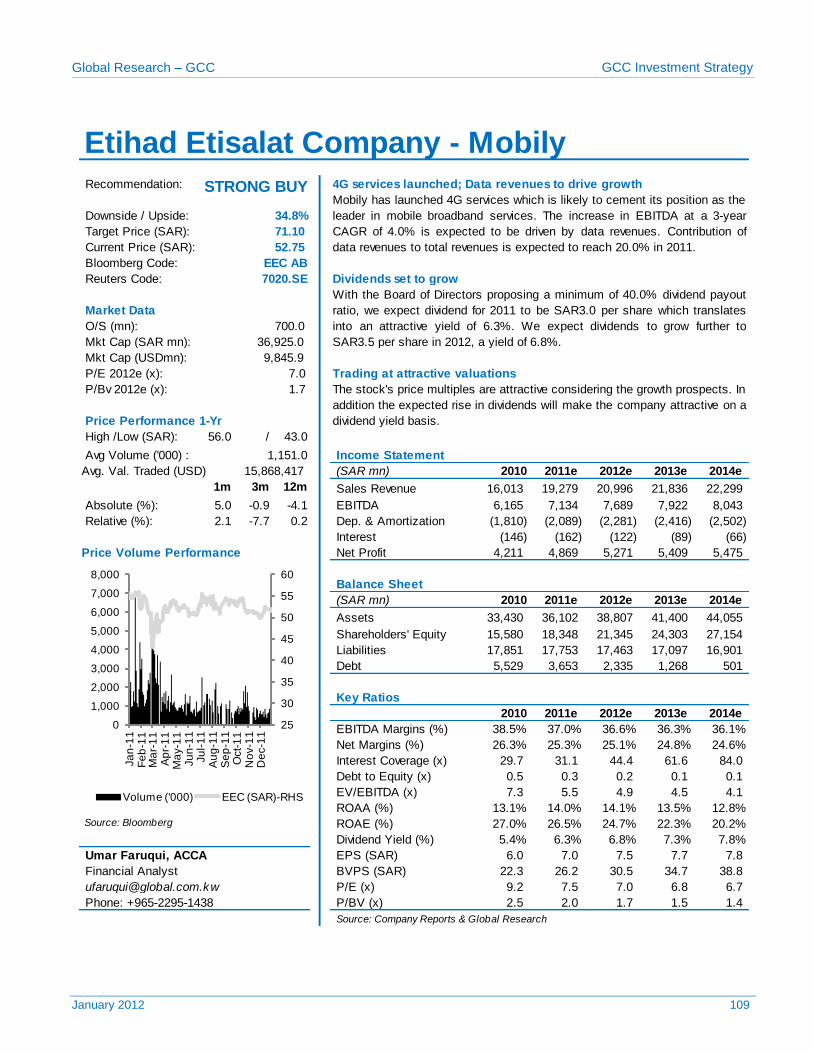
Global Research – GCC GCC Investment Strategy
January 2012 109
Recommendation: 4G services launched; Data revenues to drive growth
Bloomberg Code:
Reuters Code: Dividends set to grow
O/S (mn):
Mkt Cap (USDmn):
P/E 2012e (x): Trading at attractive valuations
P/Bv 2012e (x):
High /Low (SAR): 56.0 / 43.0
Avg Volume ('000) :
(SAR mn) 2010 2011e 2012e 2013e 2014e
1m 3m 12m Sales Revenue 16,013 19,279 20,996 21,836 22,299
Absolute (%): 5.0 -0.9 -4.1 EBITDA 6,165 7,134 7,689 7,922 8,043
Relative (%): 2.1 -7.7 0.2 Dep. & Amortization (1,810) (2,089) (2,281) (2,416) (2,502)
Interest (146) (162) (122) (89) (66)
Price Volume Performance Net Profit 4,211 4,869 5,271 5,409 5,475
Balance Sheet
(SAR mn) 2010 2011e 2012e 2013e 2014e
Assets 33,430 36,102 38,807 41,400 44,055
Shareholders' Equity 15,580 18,348 21,345 24,303 27,154
Liabilities 17,851 17,753 17,463 17,097 16,901
Debt 5,529 3,653 2,335 1,268 501
Key Ratios
2010 2011e 2012e 2013e 2014e
EBITDA Margins (%) 38.5% 37.0% 36.6% 36.3% 36.1%
Net Margins (%) 26.3% 25.3% 25.1% 24.8% 24.6%
Interest Coverage (x) 29.7 31.1 44.4 61.6 84.0
Debt to Equity (x) 0.5 0.3 0.2 0.1 0.1
EV/EBITDA (x) 7.3 5.5 4.9 4.5 4.1
ROAA (%) 13.1% 14.0% 14.1% 13.5% 12.8% Source: Bloomberg ROAE (%) 27.0% 26.5% 24.7% 22.3% 20.2%
Dividend Yield (%) 5.4% 6.3% 6.8% 7.3% 7.8%
EPS (SAR) 6.0 7.0 7.5 7.7 7.8
BVPS (SAR) 22.3 26.2 30.5 34.7 38.8
P/E (x) 9.2 7.5 7.0 6.8 6.7
P/BV (x) 2.5 2.0 1.7 1.5 1.4
Source: Company Reports & Global Research
Phone: +965-2295-1438
9,845.9
7.0
1.7 The stock's price multiples are attractive considering the growth prospects. In
addition the expected rise in dividends will make the company attractive on a
dividend yield basis. Price Performance 1-Yr
1,151.0 Income Statement
Financial Analyst
15,868,417 Avg. Val. Traded (USD)
Umar Faruqui, ACCA
EEC AB
7020.SE
With the Board of Directors proposing a minimum of 40.0% dividend payout
ratio, we expect dividend for 2011 to be SAR3.0 per share which translates
into an attractive yield of 6.3%. We expect dividends to grow further to
SAR3.5 per share in 2012, a yield of 6.8%.
Market Data
700.0
36,925.0 Mkt Cap (SAR mn):
Etihad Etisalat Company - Mobily
Mobily has launched 4G services which is likely to cement its position as the
leader in mobile broadband services. The increase in EBITDA at a 3-year
CAGR of 4.0% is expected to be driven by data revenues. Contribution of
data revenues to total revenues is expected to reach 20.0% in 2011.
Downside / Upside: 34.8%
71.10
52.75
Target Price (SAR):
Current Price (SAR):
STRONG BUY
25
30
35
40
45
50
55
60
0
1,000
2,000
3,000
4,000
5,000
6,000
7,000
8,000
Ja
n-1
1F
eb
-11
Ma
r-1
1A
pr-
11
Ma
y-1
1Ju
n-1
1Ju
l-1
1A
ug
-11
Se
p-1
1O
ct-
11
No
v-1
1D
ec-1
1
Volume ('000) EEC (SAR)-RHS
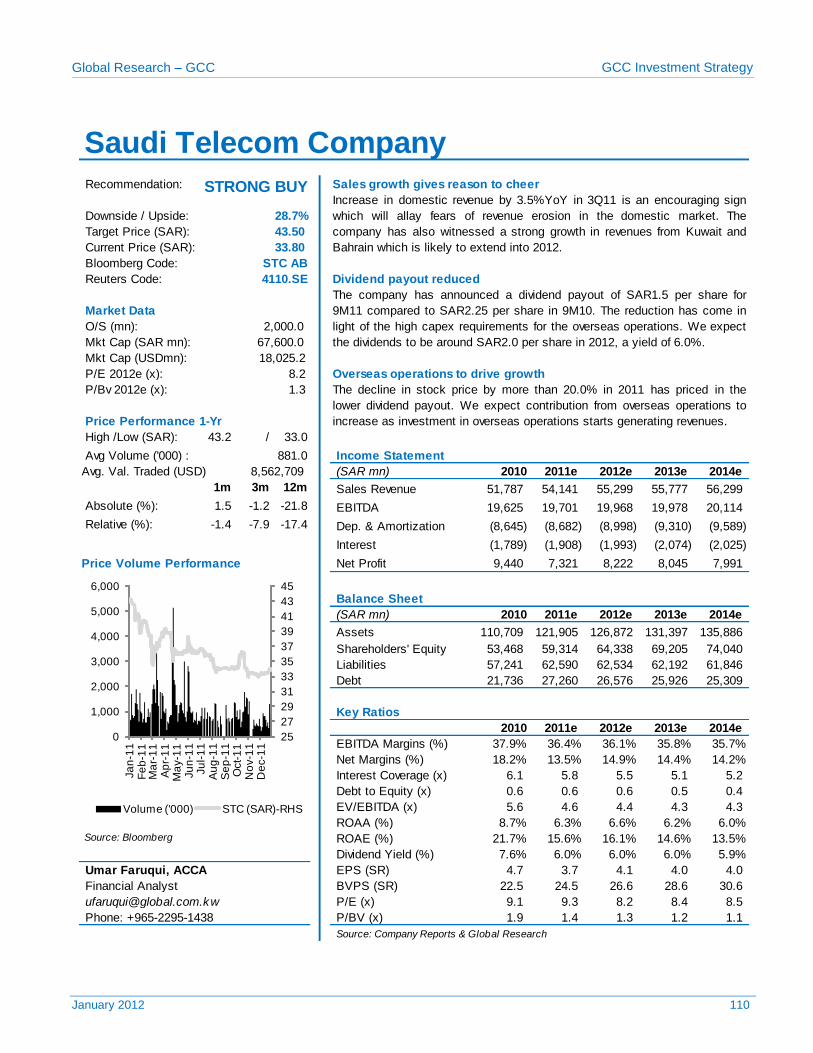
Global Research – GCC GCC Investment Strategy
January 2012 110
Recommendation: Sales growth gives reason to cheer
Bloomberg Code:
Reuters Code: Dividend payout reduced
O/S (mn):
Mkt Cap (USDmn):
P/E 2012e (x): Overseas operations to drive growth
P/Bv 2012e (x):
High /Low (SAR): 43.2 / 33.0
Avg Volume ('000) :
(SAR mn) 2010 2011e 2012e 2013e 2014e
1m 3m 12m Sales Revenue 51,787 54,141 55,299 55,777 56,299
Absolute (%): 1.5 -1.2 -21.8 EBITDA 19,625 19,701 19,968 19,978 20,114
Relative (%): -1.4 -7.9 -17.4 Dep. & Amortization (8,645) (8,682) (8,998) (9,310) (9,589)
Interest (1,789) (1,908) (1,993) (2,074) (2,025)
Price Volume Performance Net Profit 9,440 7,321 8,222 8,045 7,991
Balance Sheet
(SAR mn) 2010 2011e 2012e 2013e 2014e
Assets 110,709 121,905 126,872 131,397 135,886
Shareholders' Equity 53,468 59,314 64,338 69,205 74,040
Liabilities 57,241 62,590 62,534 62,192 61,846
Debt 21,736 27,260 26,576 25,926 25,309
Key Ratios
2010 2011e 2012e 2013e 2014e
EBITDA Margins (%) 37.9% 36.4% 36.1% 35.8% 35.7%
Net Margins (%) 18.2% 13.5% 14.9% 14.4% 14.2%
Interest Coverage (x) 6.1 5.8 5.5 5.1 5.2
Debt to Equity (x) 0.6 0.6 0.6 0.5 0.4
EV/EBITDA (x) 5.6 4.6 4.4 4.3 4.3
ROAA (%) 8.7% 6.3% 6.6% 6.2% 6.0% Source: Bloomberg ROAE (%) 21.7% 15.6% 16.1% 14.6% 13.5%
Dividend Yield (%) 7.6% 6.0% 6.0% 6.0% 5.9%
EPS (SR) 4.7 3.7 4.1 4.0 4.0
BVPS (SR) 22.5 24.5 26.6 28.6 30.6
P/E (x) 9.1 9.3 8.2 8.4 8.5
P/BV (x) 1.9 1.4 1.3 1.2 1.1
Source: Company Reports & Global Research
Phone: +965-2295-1438
18,025.2
8.2
1.3 The decline in stock price by more than 20.0% in 2011 has priced in the
lower dividend payout. We expect contribution from overseas operations to
increase as investment in overseas operations starts generating revenues. Price Performance 1-Yr
881.0 Income Statement
Financial Analyst
8,562,709 Avg. Val. Traded (USD)
Umar Faruqui, ACCA
STC AB
4110.SE
The company has announced a dividend payout of SAR1.5 per share for
9M11 compared to SAR2.25 per share in 9M10. The reduction has come in
light of the high capex requirements for the overseas operations. We expect
the dividends to be around SAR2.0 per share in 2012, a yield of 6.0%.
Market Data
2,000.0
67,600.0 Mkt Cap (SAR mn):
Saudi Telecom Company
Increase in domestic revenue by 3.5%YoY in 3Q11 is an encouraging sign
which will allay fears of revenue erosion in the domestic market. The
company has also witnessed a strong growth in revenues from Kuwait and
Bahrain which is likely to extend into 2012.
Downside / Upside: 28.7%
43.50
33.80
Target Price (SAR):
Current Price (SAR):
STRONG BUY
25
27
29
31
33
35
37
39
41
43
45
0
1,000
2,000
3,000
4,000
5,000
6,000
Ja
n-1
1F
eb
-11
Ma
r-1
1A
pr-
11
Ma
y-1
1Ju
n-1
1Ju
l-1
1A
ug
-11
Se
p-1
1O
ct-
11
No
v-1
1D
ec-1
1
Volume ('000) STC (SAR)-RHS
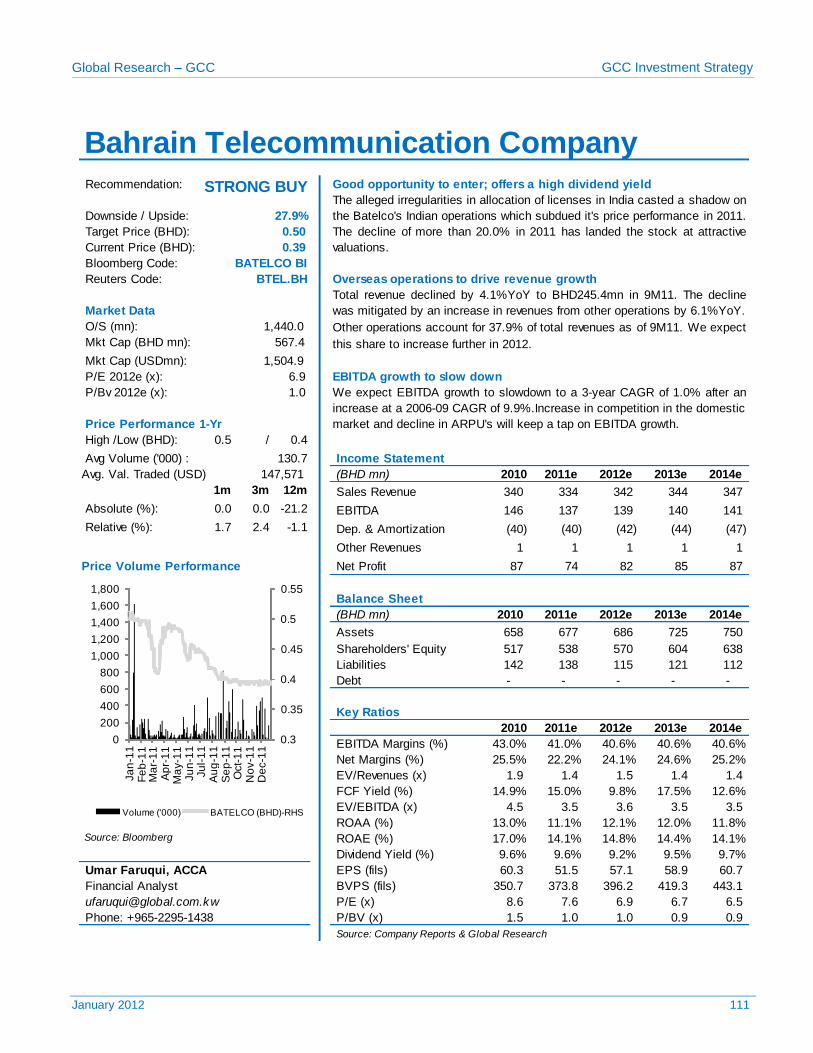
Global Research – GCC GCC Investment Strategy
January 2012 111
Recommendation: Good opportunity to enter; offers a high dividend yield
Bloomberg Code:
Reuters Code: Overseas operations to drive revenue growth
O/S (mn):
Mkt Cap (USDmn):
P/E 2012e (x): EBITDA growth to slow down
P/Bv 2012e (x):
High /Low (BHD): 0.5 / 0.4
Avg Volume ('000) :
(BHD mn) 2010 2011e 2012e 2013e 2014e
1m 3m 12m Sales Revenue 340 334 342 344 347
Absolute (%): 0.0 0.0 -21.2 EBITDA 146 137 139 140 141
Relative (%): 1.7 2.4 -1.1 Dep. & Amortization (40) (40) (42) (44) (47)
Other Revenues 1 1 1 1 1
Price Volume Performance Net Profit 87 74 82 85 87
Balance Sheet
(BHD mn) 2010 2011e 2012e 2013e 2014e
Assets 658 677 686 725 750
Shareholders' Equity 517 538 570 604 638
Liabilities 142 138 115 121 112
Debt - - - - -
Key Ratios
2010 2011e 2012e 2013e 2014e
EBITDA Margins (%) 43.0% 41.0% 40.6% 40.6% 40.6%
Net Margins (%) 25.5% 22.2% 24.1% 24.6% 25.2%
EV/Revenues (x) 1.9 1.4 1.5 1.4 1.4
FCF Yield (%) 14.9% 15.0% 9.8% 17.5% 12.6%
EV/EBITDA (x) 4.5 3.5 3.6 3.5 3.5
ROAA (%) 13.0% 11.1% 12.1% 12.0% 11.8% Source: Bloomberg ROAE (%) 17.0% 14.1% 14.8% 14.4% 14.1%
Dividend Yield (%) 9.6% 9.6% 9.2% 9.5% 9.7%
EPS (fils) 60.3 51.5 57.1 58.9 60.7
BVPS (fils) 350.7 373.8 396.2 419.3 443.1
P/E (x) 8.6 7.6 6.9 6.7 6.5
P/BV (x) 1.5 1.0 1.0 0.9 0.9
Source: Company Reports & Global Research
Phone: +965-2295-1438
1,504.9
6.9
1.0 We expect EBITDA growth to slowdown to a 3-year CAGR of 1.0% after an
increase at a 2006-09 CAGR of 9.9%.Increase in competition in the domestic
market and decline in ARPU's will keep a tap on EBITDA growth. Price Performance 1-Yr
130.7 Income Statement
Financial Analyst
147,571 Avg. Val. Traded (USD)
Umar Faruqui, ACCA
BATELCO BI
BTEL.BH
Total revenue declined by 4.1%YoY to BHD245.4mn in 9M11. The decline
was mitigated by an increase in revenues from other operations by 6.1%YoY.
Other operations account for 37.9% of total revenues as of 9M11. We expect
this share to increase further in 2012.
Market Data
1,440.0
567.4 Mkt Cap (BHD mn):
Bahrain Telecommunication Company
The alleged irregularities in allocation of licenses in India casted a shadow on
the Batelco's Indian operations which subdued it's price performance in 2011.
The decline of more than 20.0% in 2011 has landed the stock at attractive
valuations.
Downside / Upside: 27.9%
0.50
0.39
Target Price (BHD):
Current Price (BHD):
STRONG BUY
0.3
0.35
0.4
0.45
0.5
0.55
0
200
400
600
800
1,000
1,200
1,400
1,600
1,800
Ja
n-1
1F
eb
-11
Ma
r-1
1A
pr-
11
Ma
y-1
1Ju
n-1
1Ju
l-1
1A
ug
-11
Se
p-1
1O
ct-
11
No
v-1
1D
ec-1
1
Volume ('000) BATELCO (BHD)-RHS
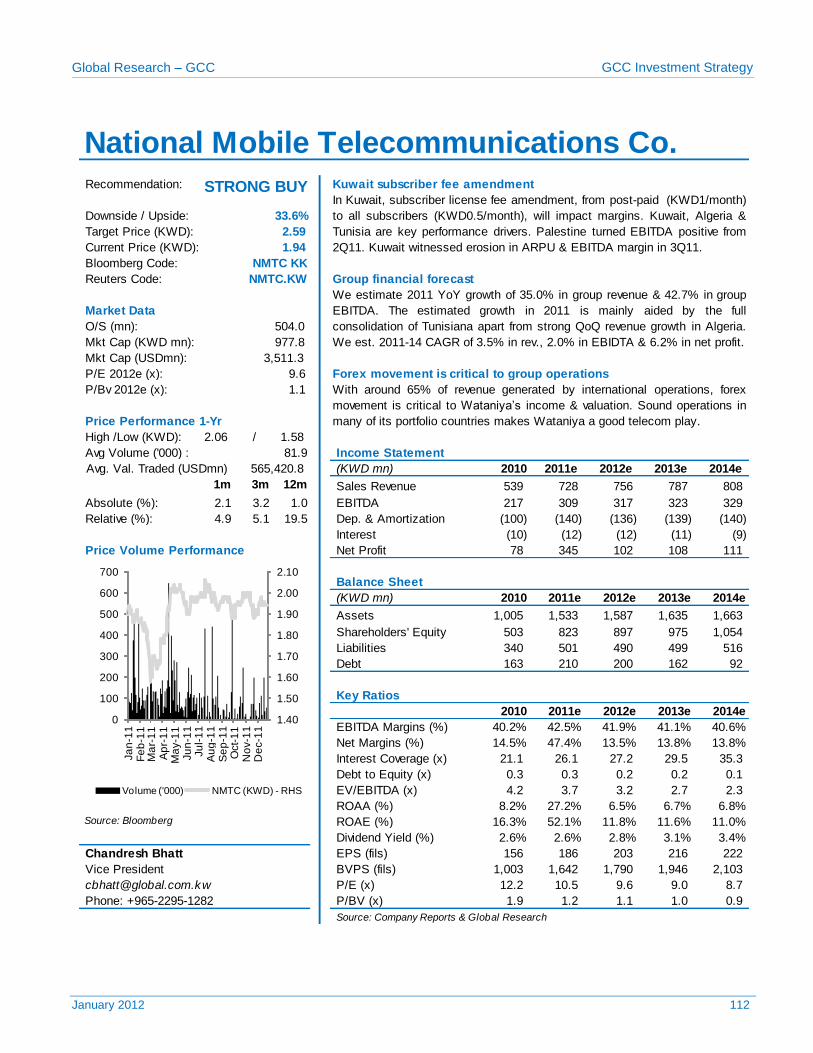
Global Research – GCC GCC Investment Strategy
January 2012 112
Recommendation: Kuwait subscriber fee amendment
Bloomberg Code:
Reuters Code: Group financial forecast
O/S (mn):
Mkt Cap (USDmn):
P/E 2012e (x): Forex movement is critical to group operations
P/Bv 2012e (x):
High /Low (KWD): 2.06 / 1.58
Avg Volume ('000) :
(KWD mn) 2010 2011e 2012e 2013e 2014e
1m 3m 12m Sales Revenue 539 728 756 787 808
Absolute (%): 2.1 3.2 1.0 EBITDA 217 309 317 323 329
Relative (%): 4.9 5.1 19.5 Dep. & Amortization (100) (140) (136) (139) (140)
Interest (10) (12) (12) (11) (9)
Price Volume Performance Net Profit 78 345 102 108 111
Balance Sheet
(KWD mn) 2010 2011e 2012e 2013e 2014e
Assets 1,005 1,533 1,587 1,635 1,663
Shareholders' Equity 503 823 897 975 1,054
Liabilities 340 501 490 499 516
Debt 163 210 200 162 92
Key Ratios
2010 2011e 2012e 2013e 2014e
EBITDA Margins (%) 40.2% 42.5% 41.9% 41.1% 40.6%
Net Margins (%) 14.5% 47.4% 13.5% 13.8% 13.8%
Interest Coverage (x) 21.1 26.1 27.2 29.5 35.3
Debt to Equity (x) 0.3 0.3 0.2 0.2 0.1
EV/EBITDA (x) 4.2 3.7 3.2 2.7 2.3
ROAA (%) 8.2% 27.2% 6.5% 6.7% 6.8% Source: Bloomberg ROAE (%) 16.3% 52.1% 11.8% 11.6% 11.0%
Dividend Yield (%) 2.6% 2.6% 2.8% 3.1% 3.4%
Chandresh Bhatt EPS (fils) 156 186 203 216 222
BVPS (fils) 1,003 1,642 1,790 1,946 2,103
P/E (x) 12.2 10.5 9.6 9.0 8.7
P/BV (x) 1.9 1.2 1.1 1.0 0.9
Source: Company Reports & Global Research
National Mobile Telecommunications Co.
In Kuwait, subscriber license fee amendment, from post-paid (KWD1/month)
to all subscribers (KWD0.5/month), will impact margins. Kuwait, Algeria &
Tunisia are key performance drivers. Palestine turned EBITDA positive from
2Q11. Kuwait witnessed erosion in ARPU & EBITDA margin in 3Q11.
Downside / Upside: 33.6%
Target Price (KWD): 2.59
Current Price (KWD): 1.94
STRONG BUY
81.9 Income Statement
NMTC KK
NMTC.KW
We estimate 2011 YoY growth of 35.0% in group revenue & 42.7% in group
EBITDA. The estimated growth in 2011 is mainly aided by the full
consolidation of Tunisiana apart from strong QoQ revenue growth in Algeria.
We est. 2011-14 CAGR of 3.5% in rev., 2.0% in EBIDTA & 6.2% in net profit.
Market Data
504.0
Mkt Cap (KWD mn): 977.8
3,511.3
9.6
1.1 With around 65% of revenue generated by international operations, forex
movement is critical to Wataniya’s income & valuation. Sound operations in
many of its portfolio countries makes Wataniya a good telecom play. Price Performance 1-Yr
Phone: +965-2295-1282
Avg. Val. Traded (USDmn) 565,420.8
Vice President
1.40
1.50
1.60
1.70
1.80
1.90
2.00
2.10
0
100
200
300
400
500
600
700
Ja
n-1
1F
eb
-11
Ma
r-1
1A
pr-
11
Ma
y-1
1Ju
n-1
1Ju
l-1
1A
ug
-11
Se
p-1
1O
ct-
11
No
v-1
1D
ec-1
1
Volume ('000) NMTC (KWD) - RHS
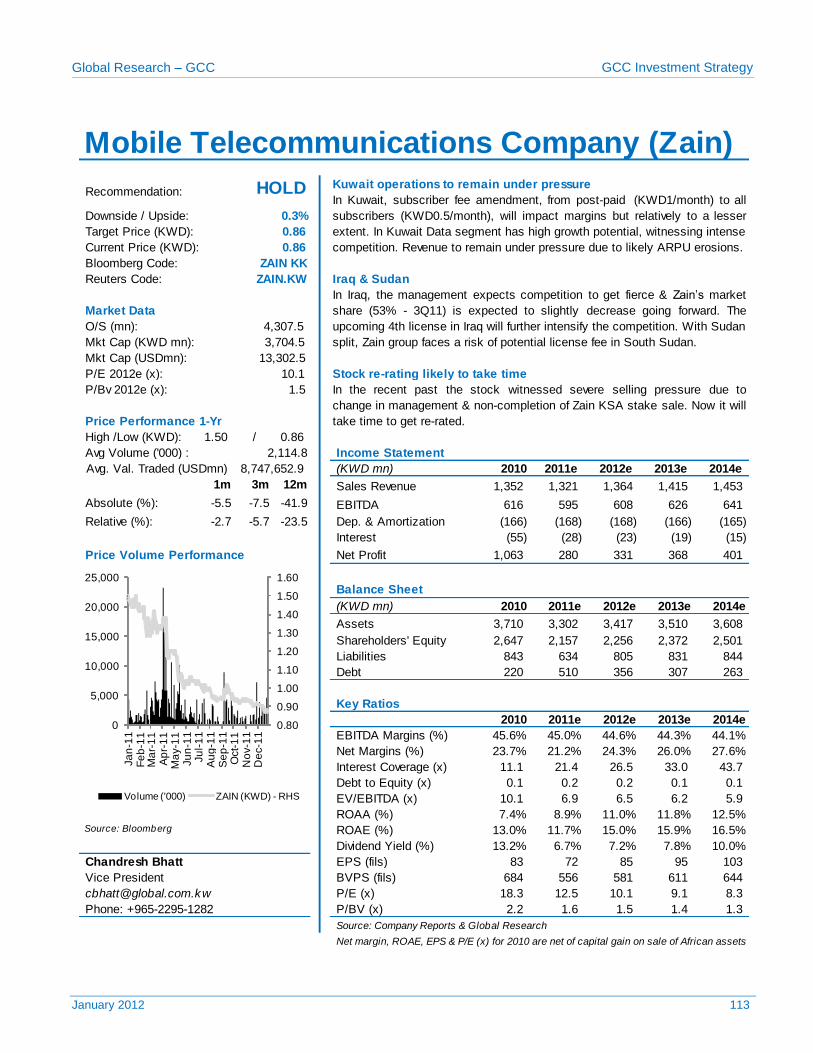
Global Research – GCC GCC Investment Strategy
January 2012 113
Kuwait operations to remain under pressure
Bloomberg Code:
Reuters Code: Iraq & Sudan
O/S (mn):
Mkt Cap (USDmn):
P/E 2012e (x): Stock re-rating likely to take time
P/Bv 2012e (x):
High /Low (KWD): 1.50 / 0.86
Avg Volume ('000) :
(KWD mn) 2010 2011e 2012e 2013e 2014e
1m 3m 12m Sales Revenue 1,352 1,321 1,364 1,415 1,453
Absolute (%): -5.5 -7.5 -41.9 EBITDA 616 595 608 626 641
Relative (%): -2.7 -5.7 -23.5 Dep. & Amortization (166) (168) (168) (166) (165)
Interest (55) (28) (23) (19) (15)
Price Volume Performance Net Profit 1,063 280 331 368 401
Balance Sheet
(KWD mn) 2010 2011e 2012e 2013e 2014e
Assets 3,710 3,302 3,417 3,510 3,608
Shareholders' Equity 2,647 2,157 2,256 2,372 2,501
Liabilities 843 634 805 831 844
Debt 220 510 356 307 263
Key Ratios
2010 2011e 2012e 2013e 2014e
EBITDA Margins (%) 45.6% 45.0% 44.6% 44.3% 44.1%
Net Margins (%) 23.7% 21.2% 24.3% 26.0% 27.6%
Interest Coverage (x) 11.1 21.4 26.5 33.0 43.7
Debt to Equity (x) 0.1 0.2 0.2 0.1 0.1
EV/EBITDA (x) 10.1 6.9 6.5 6.2 5.9
ROAA (%) 7.4% 8.9% 11.0% 11.8% 12.5%
ROAE (%) 13.0% 11.7% 15.0% 15.9% 16.5%
Dividend Yield (%) 13.2% 6.7% 7.2% 7.8% 10.0%
Chandresh Bhatt EPS (fils) 83 72 85 95 103
BVPS (fils) 684 556 581 611 644
P/E (x) 18.3 12.5 10.1 9.1 8.3
P/BV (x) 2.2 1.6 1.5 1.4 1.3
Source: Company Reports & Global Research
Net margin, ROAE, EPS & P/E (x) for 2010 are net of capital gain on sale of African assets
Mobile Telecommunications Company (Zain)
Recommendation: HOLD In Kuwait, subscriber fee amendment, from post-paid (KWD1/month) to all
subscribers (KWD0.5/month), will impact margins but relatively to a lesser
extent. In Kuwait Data segment has high growth potential, witnessing intense
competition. Revenue to remain under pressure due to likely ARPU erosions.
Downside / Upside: 0.3%
Target Price (KWD): 0.86
Current Price (KWD): 0.86
2,114.8 Income Statement
ZAIN KK
ZAIN.KW
In Iraq, the management expects competition to get fierce & Zain’s market
share (53% - 3Q11) is expected to slightly decrease going forward. The
upcoming 4th license in Iraq will further intensify the competition. With Sudan
split, Zain group faces a risk of potential license fee in South Sudan.
Market Data
4,307.5
Mkt Cap (KWD mn): 3,704.5
13,302.5
10.1
1.5 In the recent past the stock witnessed severe selling pressure due to
change in management & non-completion of Zain KSA stake sale. Now it will
take time to get re-rated. Price Performance 1-Yr
Phone: +965-2295-1282
Avg. Val. Traded (USDmn) 8,747,652.9
Source: Bloomberg
Vice President
0.80
0.90
1.00
1.10
1.20
1.30
1.40
1.50
1.60
0
5,000
10,000
15,000
20,000
25,000
Ja
n-1
1F
eb
-11
Ma
r-1
1A
pr-
11
Ma
y-1
1Ju
n-1
1Ju
l-1
1A
ug
-11
Se
p-1
1O
ct-
11
No
v-1
1D
ec-1
1
Volume ('000) ZAIN (KWD) - RHS
Source: Bloomberg
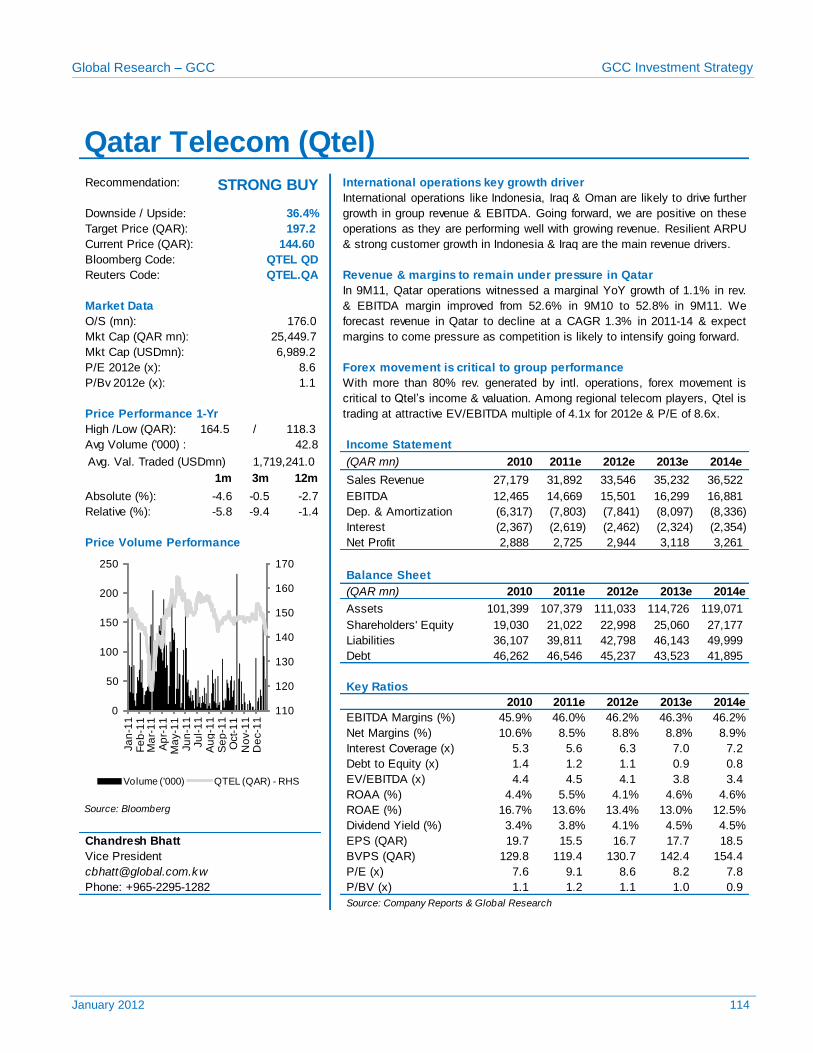
Global Research – GCC GCC Investment Strategy
January 2012 114
Recommendation: International operations key growth driver
Bloomberg Code:
Reuters Code: Revenue & margins to remain under pressure in Qatar
O/S (mn):
Mkt Cap (USDmn):
P/E 2012e (x): Forex movement is critical to group performance
P/Bv 2012e (x):
High /Low (QAR): 164.5 / 118.3
Avg Volume ('000) :
(QAR mn) 2010 2011e 2012e 2013e 2014e
1m 3m 12m Sales Revenue 27,179 31,892 33,546 35,232 36,522
Absolute (%): -4.6 -0.5 -2.7 EBITDA 12,465 14,669 15,501 16,299 16,881
Relative (%): -5.8 -9.4 -1.4 Dep. & Amortization (6,317) (7,803) (7,841) (8,097) (8,336)
Interest (2,367) (2,619) (2,462) (2,324) (2,354)
Price Volume Performance Net Profit 2,888 2,725 2,944 3,118 3,261
Balance Sheet
(QAR mn) 2010 2011e 2012e 2013e 2014e
Assets 101,399 107,379 111,033 114,726 119,071
Shareholders' Equity 19,030 21,022 22,998 25,060 27,177
Liabilities 36,107 39,811 42,798 46,143 49,999
Debt 46,262 46,546 45,237 43,523 41,895
Key Ratios
2010 2011e 2012e 2013e 2014e
EBITDA Margins (%) 45.9% 46.0% 46.2% 46.3% 46.2%
Net Margins (%) 10.6% 8.5% 8.8% 8.8% 8.9%
Interest Coverage (x) 5.3 5.6 6.3 7.0 7.2
Debt to Equity (x) 1.4 1.2 1.1 0.9 0.8
EV/EBITDA (x) 4.4 4.5 4.1 3.8 3.4
ROAA (%) 4.4% 5.5% 4.1% 4.6% 4.6% Source: Bloomberg ROAE (%) 16.7% 13.6% 13.4% 13.0% 12.5%
Dividend Yield (%) 3.4% 3.8% 4.1% 4.5% 4.5%
Chandresh Bhatt EPS (QAR) 19.7 15.5 16.7 17.7 18.5
BVPS (QAR) 129.8 119.4 130.7 142.4 154.4
P/E (x) 7.6 9.1 8.6 8.2 7.8
P/BV (x) 1.1 1.2 1.1 1.0 0.9
Source: Company Reports & Global Research
Qatar Telecom (Qtel)
International operations like Indonesia, Iraq & Oman are likely to drive further
growth in group revenue & EBITDA. Going forward, we are positive on these
operations as they are performing well with growing revenue. Resilient ARPU
& strong customer growth in Indonesia & Iraq are the main revenue drivers.
Downside / Upside: 36.4%
Target Price (QAR): 197.2
Current Price (QAR): 144.60
STRONG BUY
42.8 Income Statement
QTEL QD
QTEL.QA
In 9M11, Qatar operations witnessed a marginal YoY growth of 1.1% in rev.
& EBITDA margin improved from 52.6% in 9M10 to 52.8% in 9M11. We
forecast revenue in Qatar to decline at a CAGR 1.3% in 2011-14 & expect
margins to come pressure as competition is likely to intensify going forward.
Market Data
176.0
Mkt Cap (QAR mn): 25,449.7
6,989.2
8.6
1.1 With more than 80% rev. generated by intl. operations, forex movement is
critical to Qtel’s income & valuation. Among regional telecom players, Qtel is
trading at attractive EV/EBITDA multiple of 4.1x for 2012e & P/E of 8.6x. Price Performance 1-Yr
Phone: +965-2295-1282
Avg. Val. Traded (USDmn) 1,719,241.0
Vice President
110
120
130
140
150
160
170
0
50
100
150
200
250
Ja
n-1
1F
eb
-11
Ma
r-1
1A
pr-
11
Ma
y-1
1Ju
n-1
1Ju
l-1
1A
ug
-11
Se
p-1
1O
ct-
11
No
v-1
1D
ec-1
1
Volume ('000) QTEL (QAR) - RHS
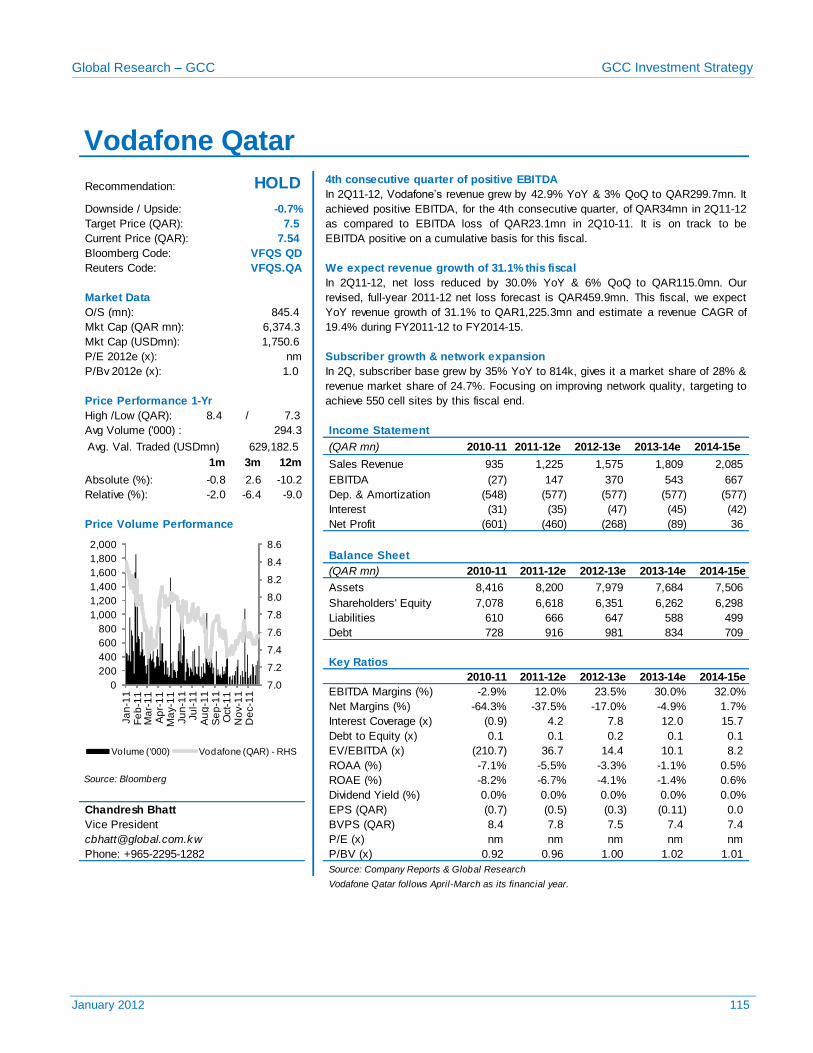
Global Research – GCC GCC Investment Strategy
January 2012 115
4th consecutive quarter of positive EBITDA
Bloomberg Code:
Reuters Code: We expect revenue growth of 31.1% this fiscal
O/S (mn):
Mkt Cap (USDmn):
P/E 2012e (x): Subscriber growth & network expansion
P/Bv 2012e (x):
High /Low (QAR): 8.4 / 7.3
Avg Volume ('000) :
(QAR mn) 2010-11 2011-12e 2012-13e 2013-14e 2014-15e
1m 3m 12m Sales Revenue 935 1,225 1,575 1,809 2,085
Absolute (%): -0.8 2.6 -10.2 EBITDA (27) 147 370 543 667
Relative (%): -2.0 -6.4 -9.0 Dep. & Amortization (548) (577) (577) (577) (577)
Interest (31) (35) (47) (45) (42)
Price Volume Performance Net Profit (601) (460) (268) (89) 36
Balance Sheet
(QAR mn) 2010-11 2011-12e 2012-13e 2013-14e 2014-15e
Assets 8,416 8,200 7,979 7,684 7,506
Shareholders' Equity 7,078 6,618 6,351 6,262 6,298
Liabilities 610 666 647 588 499
Debt 728 916 981 834 709
Key Ratios
2010-11 2011-12e 2012-13e 2013-14e 2014-15e
EBITDA Margins (%) -2.9% 12.0% 23.5% 30.0% 32.0%
Net Margins (%) -64.3% -37.5% -17.0% -4.9% 1.7%
Interest Coverage (x) (0.9) 4.2 7.8 12.0 15.7
Debt to Equity (x) 0.1 0.1 0.2 0.1 0.1
EV/EBITDA (x) (210.7) 36.7 14.4 10.1 8.2
ROAA (%) -7.1% -5.5% -3.3% -1.1% 0.5% Source: Bloomberg ROAE (%) -8.2% -6.7% -4.1% -1.4% 0.6%
Dividend Yield (%) 0.0% 0.0% 0.0% 0.0% 0.0%
Chandresh Bhatt EPS (QAR) (0.7) (0.5) (0.3) (0.11) 0.0
BVPS (QAR) 8.4 7.8 7.5 7.4 7.4
P/E (x) nm nm nm nm nm
P/BV (x) 0.92 0.96 1.00 1.02 1.01
Source: Company Reports & Global Research
Vodafone Qatar follows April-March as its financial year.
Phone: +965-2295-1282
Avg. Val. Traded (USDmn) 629,182.5
Vice President
294.3 Income Statement
VFQS QD
VFQS.QA
In 2Q11-12, net loss reduced by 30.0% YoY & 6% QoQ to QAR115.0mn. Our
revised, full-year 2011-12 net loss forecast is QAR459.9mn. This fiscal, we expect
YoY revenue growth of 31.1% to QAR1,225.3mn and estimate a revenue CAGR of
19.4% during FY2011-12 to FY2014-15.
Market Data
845.4
Mkt Cap (QAR mn): 6,374.3
1,750.6
nm
1.0 In 2Q, subscriber base grew by 35% YoY to 814k, gives it a market share of 28% &
revenue market share of 24.7%. Focusing on improving network quality, targeting to
achieve 550 cell sites by this fiscal end. Price Performance 1-Yr
Vodafone Qatar
Recommendation: HOLD In 2Q11-12, Vodafone’s revenue grew by 42.9% YoY & 3% QoQ to QAR299.7mn. It
achieved positive EBITDA, for the 4th consecutive quarter, of QAR34mn in 2Q11-12
as compared to EBITDA loss of QAR23.1mn in 2Q10-11. It is on track to be
EBITDA positive on a cumulative basis for this fiscal.
Downside / Upside: -0.7%
Target Price (QAR): 7.5
Current Price (QAR): 7.54
7.0
7.2
7.4
7.6
7.8
8.0
8.2
8.4
8.6
0
200
400
600
800
1,000
1,200
1,400
1,600
1,800
2,000
Ja
n-1
1F
eb
-11
Ma
r-1
1A
pr-
11
Ma
y-1
1Ju
n-1
1Ju
l-1
1A
ug
-11
Se
p-1
1O
ct-
11
No
v-1
1D
ec-1
1
Volume ('000) Vodafone (QAR) - RHS
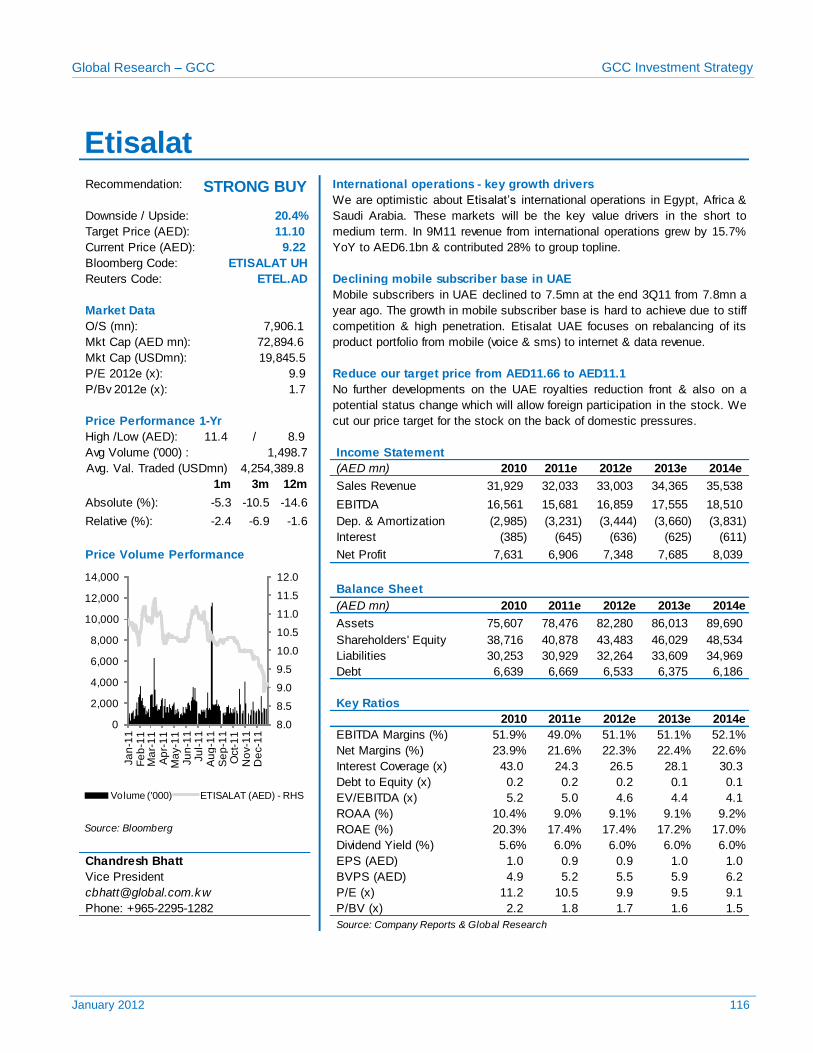
Global Research – GCC GCC Investment Strategy
January 2012 116
Recommendation: International operations - key growth drivers
Bloomberg Code:
Reuters Code: Declining mobile subscriber base in UAE
O/S (mn):
Mkt Cap (USDmn):
P/E 2012e (x): Reduce our target price from AED11.66 to AED11.1
P/Bv 2012e (x):
High /Low (AED): 11.4 / 8.9
Avg Volume ('000) :
(AED mn) 2010 2011e 2012e 2013e 2014e
1m 3m 12m Sales Revenue 31,929 32,033 33,003 34,365 35,538
Absolute (%): -5.3 -10.5 -14.6 EBITDA 16,561 15,681 16,859 17,555 18,510
Relative (%): -2.4 -6.9 -1.6 Dep. & Amortization (2,985) (3,231) (3,444) (3,660) (3,831)
Interest (385) (645) (636) (625) (611)
Price Volume Performance Net Profit 7,631 6,906 7,348 7,685 8,039
Balance Sheet
(AED mn) 2010 2011e 2012e 2013e 2014e
Assets 75,607 78,476 82,280 86,013 89,690
Shareholders' Equity 38,716 40,878 43,483 46,029 48,534
Liabilities 30,253 30,929 32,264 33,609 34,969
Debt 6,639 6,669 6,533 6,375 6,186
Key Ratios
2010 2011e 2012e 2013e 2014e
EBITDA Margins (%) 51.9% 49.0% 51.1% 51.1% 52.1%
Net Margins (%) 23.9% 21.6% 22.3% 22.4% 22.6%
Interest Coverage (x) 43.0 24.3 26.5 28.1 30.3
Debt to Equity (x) 0.2 0.2 0.2 0.1 0.1
EV/EBITDA (x) 5.2 5.0 4.6 4.4 4.1
ROAA (%) 10.4% 9.0% 9.1% 9.1% 9.2% Source: Bloomberg ROAE (%) 20.3% 17.4% 17.4% 17.2% 17.0%
Dividend Yield (%) 5.6% 6.0% 6.0% 6.0% 6.0%
Chandresh Bhatt EPS (AED) 1.0 0.9 0.9 1.0 1.0
BVPS (AED) 4.9 5.2 5.5 5.9 6.2
P/E (x) 11.2 10.5 9.9 9.5 9.1
P/BV (x) 2.2 1.8 1.7 1.6 1.5
Source: Company Reports & Global Research
Etisalat
We are optimistic about Etisalat’s international operations in Egypt, Africa &
Saudi Arabia. These markets will be the key value drivers in the short to
medium term. In 9M11 revenue from international operations grew by 15.7%
YoY to AED6.1bn & contributed 28% to group topline.
Downside / Upside: 20.4%
Target Price (AED): 11.10
Current Price (AED): 9.22
STRONG BUY
1,498.7 Income Statement
ETISALAT UH
ETEL.AD
Mobile subscribers in UAE declined to 7.5mn at the end 3Q11 from 7.8mn a
year ago. The growth in mobile subscriber base is hard to achieve due to stiff
competition & high penetration. Etisalat UAE focuses on rebalancing of its
product portfolio from mobile (voice & sms) to internet & data revenue.
Market Data
7,906.1
Mkt Cap (AED mn): 72,894.6
19,845.5
9.9
1.7 No further developments on the UAE royalties reduction front & also on a
potential status change which will allow foreign participation in the stock. We
cut our price target for the stock on the back of domestic pressures. Price Performance 1-Yr
Phone: +965-2295-1282
Avg. Val. Traded (USDmn) 4,254,389.8
Vice President
8.0
8.5
9.0
9.5
10.0
10.5
11.0
11.5
12.0
0
2,000
4,000
6,000
8,000
10,000
12,000
14,000
Ja
n-1
1F
eb
-11
Ma
r-1
1A
pr-
11
Ma
y-1
1Ju
n-1
1Ju
l-1
1A
ug
-11
Se
p-1
1O
ct-
11
No
v-1
1D
ec-1
1
Volume ('000) ETISALAT (AED) - RHS
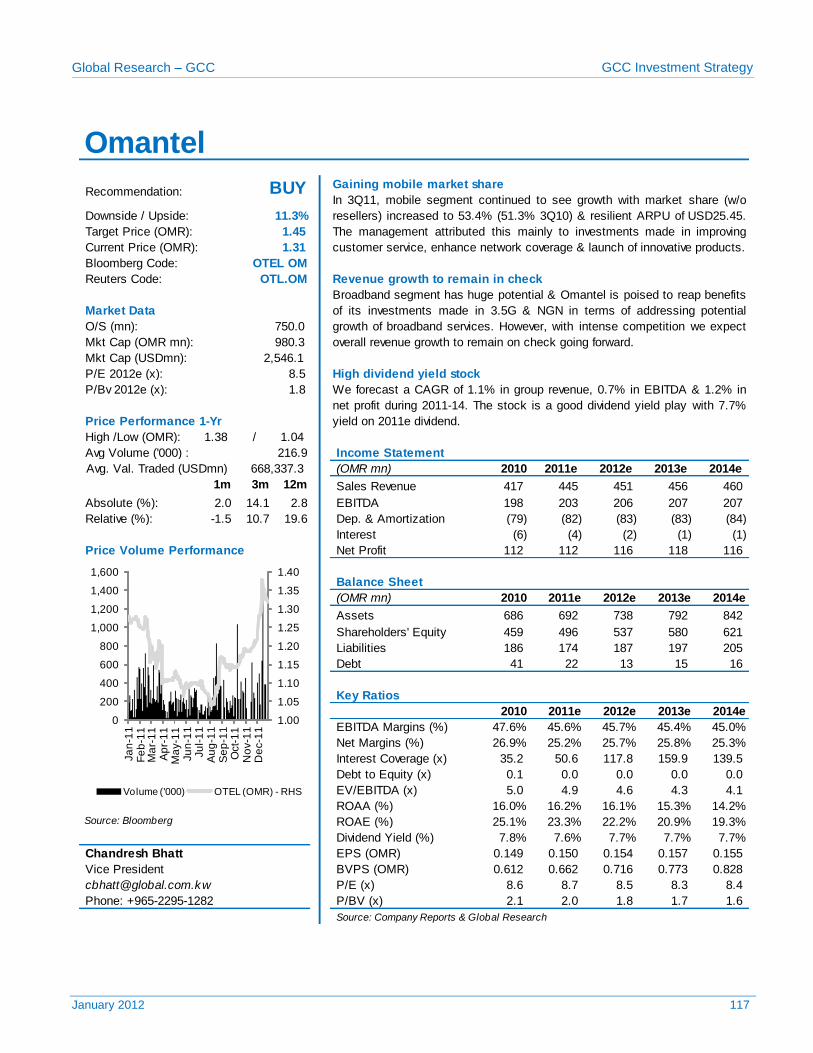
Global Research – GCC GCC Investment Strategy
January 2012 117
Gaining mobile market share
Bloomberg Code:
Reuters Code: Revenue growth to remain in check
O/S (mn):
Mkt Cap (USDmn):
P/E 2012e (x): High dividend yield stock
P/Bv 2012e (x):
High /Low (OMR): 1.38 / 1.04
Avg Volume ('000) :
(OMR mn) 2010 2011e 2012e 2013e 2014e
1m 3m 12m Sales Revenue 417 445 451 456 460
Absolute (%): 2.0 14.1 2.8 EBITDA 198 203 206 207 207
Relative (%): -1.5 10.7 19.6 Dep. & Amortization (79) (82) (83) (83) (84)
Interest (6) (4) (2) (1) (1)
Price Volume Performance Net Profit 112 112 116 118 116
Balance Sheet
(OMR mn) 2010 2011e 2012e 2013e 2014e
Assets 686 692 738 792 842
Shareholders' Equity 459 496 537 580 621
Liabilities 186 174 187 197 205
Debt 41 22 13 15 16
Key Ratios
2010 2011e 2012e 2013e 2014e
EBITDA Margins (%) 47.6% 45.6% 45.7% 45.4% 45.0%
Net Margins (%) 26.9% 25.2% 25.7% 25.8% 25.3%
Interest Coverage (x) 35.2 50.6 117.8 159.9 139.5
Debt to Equity (x) 0.1 0.0 0.0 0.0 0.0
EV/EBITDA (x) 5.0 4.9 4.6 4.3 4.1
ROAA (%) 16.0% 16.2% 16.1% 15.3% 14.2% Source: Bloomberg ROAE (%) 25.1% 23.3% 22.2% 20.9% 19.3%
Dividend Yield (%) 7.8% 7.6% 7.7% 7.7% 7.7%
Chandresh Bhatt EPS (OMR) 0.149 0.150 0.154 0.157 0.155
BVPS (OMR) 0.612 0.662 0.716 0.773 0.828
P/E (x) 8.6 8.7 8.5 8.3 8.4
P/BV (x) 2.1 2.0 1.8 1.7 1.6
Source: Company Reports & Global Research
Omantel
Recommendation: BUY In 3Q11, mobile segment continued to see growth with market share (w/o
resellers) increased to 53.4% (51.3% 3Q10) & resilient ARPU of USD25.45.
The management attributed this mainly to investments made in improving
customer service, enhance network coverage & launch of innovative products.
Downside / Upside: 11.3%
Target Price (OMR): 1.45
Current Price (OMR): 1.31
216.9 Income Statement
OTEL OM
OTL.OM
Broadband segment has huge potential & Omantel is poised to reap benefits
of its investments made in 3.5G & NGN in terms of addressing potential
growth of broadband services. However, with intense competition we expect
overall revenue growth to remain on check going forward.
Market Data
750.0
Mkt Cap (OMR mn): 980.3
2,546.1
8.5
1.8 We forecast a CAGR of 1.1% in group revenue, 0.7% in EBITDA & 1.2% in
net profit during 2011-14. The stock is a good dividend yield play with 7.7%
yield on 2011e dividend. Price Performance 1-Yr
Phone: +965-2295-1282
Avg. Val. Traded (USDmn) 668,337.3
Vice President
1.00
1.05
1.10
1.15
1.20
1.25
1.30
1.35
1.40
0
200
400
600
800
1,000
1,200
1,400
1,600
Ja
n-1
1F
eb
-11
Ma
r-1
1A
pr-
11
Ma
y-1
1Ju
n-1
1Ju
l-1
1A
ug
-11
Se
p-1
1O
ct-
11
No
v-1
1D
ec-1
1
Volume ('000) OTEL (OMR) - RHS

Global Research – GCC GCC Investment Strategy
January 2012 118
UTILITIES SECTOR
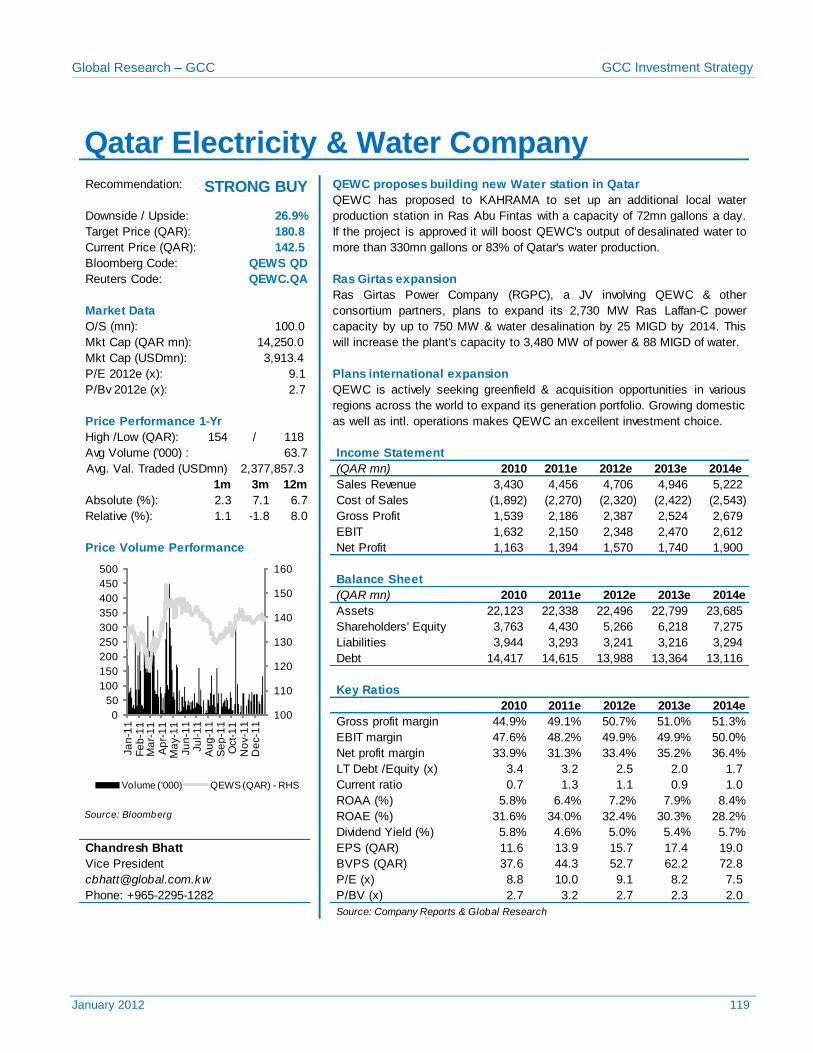
Global Research – GCC GCC Investment Strategy
January 2012 119
Recommendation: QEWC proposes building new Water station in Qatar
Bloomberg Code:
Reuters Code: Ras Girtas expansion
O/S (mn):
Mkt Cap (USDmn):
P/E 2012e (x): Plans international expansion
P/Bv 2012e (x):
High /Low (QAR): 154 / 118
Avg Volume ('000) :
(QAR mn) 2010 2011e 2012e 2013e 2014e
1m 3m 12m Sales Revenue 3,430 4,456 4,706 4,946 5,222
Absolute (%): 2.3 7.1 6.7 Cost of Sales (1,892) (2,270) (2,320) (2,422) (2,543)
Relative (%): 1.1 -1.8 8.0 Gross Profit 1,539 2,186 2,387 2,524 2,679
EBIT 1,632 2,150 2,348 2,470 2,612
Price Volume Performance Net Profit 1,163 1,394 1,570 1,740 1,900
Balance Sheet
(QAR mn) 2010 2011e 2012e 2013e 2014e
Assets 22,123 22,338 22,496 22,799 23,685
Shareholders' Equity 3,763 4,430 5,266 6,218 7,275
Liabilities 3,944 3,293 3,241 3,216 3,294
Debt 14,417 14,615 13,988 13,364 13,116
Key Ratios
2010 2011e 2012e 2013e 2014e
Gross profit margin 44.9% 49.1% 50.7% 51.0% 51.3%
EBIT margin 47.6% 48.2% 49.9% 49.9% 50.0%
Net profit margin 33.9% 31.3% 33.4% 35.2% 36.4%
LT Debt /Equity (x) 3.4 3.2 2.5 2.0 1.7
Current ratio 0.7 1.3 1.1 0.9 1.0
ROAA (%) 5.8% 6.4% 7.2% 7.9% 8.4%
ROAE (%) 31.6% 34.0% 32.4% 30.3% 28.2%
Dividend Yield (%) 5.8% 4.6% 5.0% 5.4% 5.7%
Chandresh Bhatt EPS (QAR) 11.6 13.9 15.7 17.4 19.0
BVPS (QAR) 37.6 44.3 52.7 62.2 72.8
P/E (x) 8.8 10.0 9.1 8.2 7.5
P/BV (x) 2.7 3.2 2.7 2.3 2.0
Source: Company Reports & Global Research
Phone: +965-2295-1282
3,913.4
9.1
2.7 QEWC is actively seeking greenfield & acquisition opportunities in various
regions across the world to expand its generation portfolio. Growing domestic
as well as intl. operations makes QEWC an excellent investment choice. Price Performance 1-Yr
63.7 Income Statement
Source: Bloomberg
Vice President
2,377,857.3 Avg. Val. Traded (USDmn)
QEWS QD
QEWC.QA
Ras Girtas Power Company (RGPC), a JV involving QEWC & other
consortium partners, plans to expand its 2,730 MW Ras Laffan-C power
capacity by up to 750 MW & water desalination by 25 MIGD by 2014. This
will increase the plant's capacity to 3,480 MW of power & 88 MIGD of water.
Market Data
100.0
14,250.0 Mkt Cap (QAR mn):
Qatar Electricity & Water Company
QEWC has proposed to KAHRAMA to set up an additional local water
production station in Ras Abu Fintas with a capacity of 72mn gallons a day.
If the project is approved it will boost QEWC's output of desalinated water to
more than 330mn gallons or 83% of Qatar's water production.
Downside / Upside: 26.9%
180.8
142.5
Target Price (QAR):
Current Price (QAR):
STRONG BUY
100
110
120
130
140
150
160
0
50
100
150
200
250
300
350
400
450
500
Ja
n-1
1F
eb
-11
Ma
r-1
1A
pr-
11
Ma
y-1
1Ju
n-1
1Ju
l-1
1A
ug
-11
Se
p-1
1O
ct-
11
No
v-1
1D
ec-1
1
Volume ('000) QEWS (QAR) - RHS
Source: Bloomberg
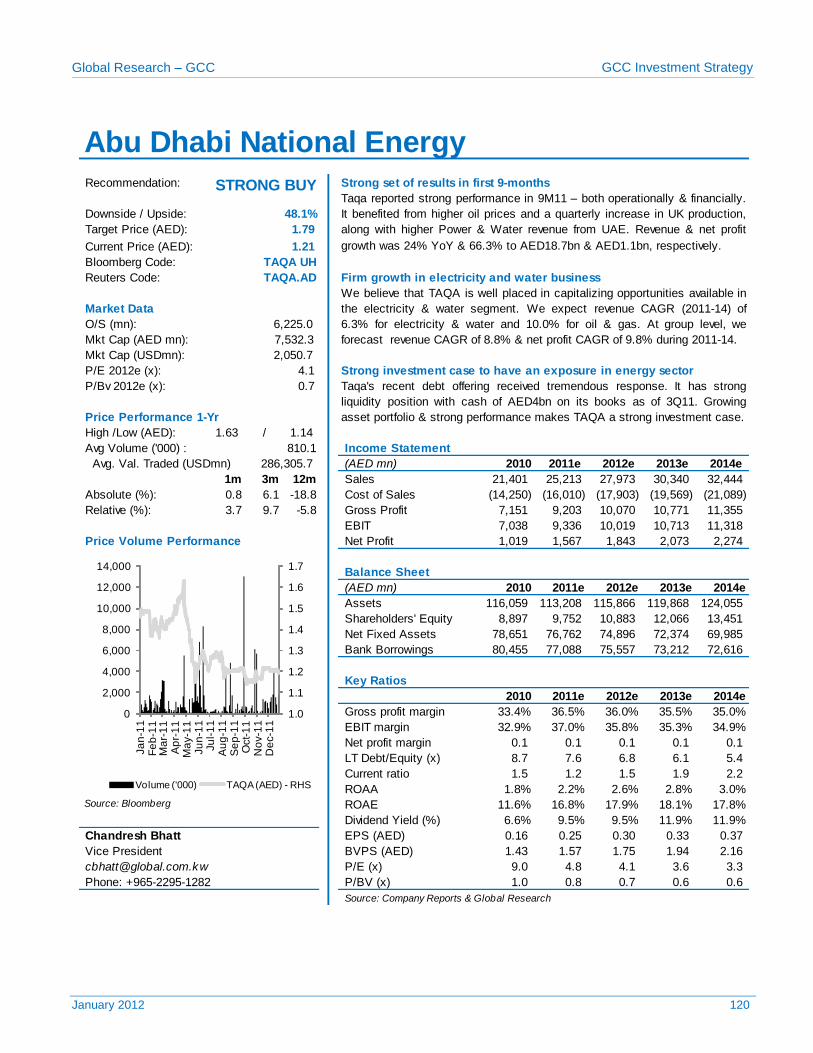
Global Research – GCC GCC Investment Strategy
January 2012 120
Recommendation: Strong set of results in first 9-months
Bloomberg Code:
Reuters Code: Firm growth in electricity and water business
O/S (mn):
Mkt Cap (USDmn):
P/E 2012e (x): Strong investment case to have an exposure in energy sector
P/Bv 2012e (x):
High /Low (AED): 1.63 / 1.14
Avg Volume ('000) :
(AED mn) 2010 2011e 2012e 2013e 2014e
1m 3m 12m Sales 21,401 25,213 27,973 30,340 32,444
Absolute (%): 0.8 6.1 -18.8 Cost of Sales (14,250) (16,010) (17,903) (19,569) (21,089)
Relative (%): 3.7 9.7 -5.8 Gross Profit 7,151 9,203 10,070 10,771 11,355
EBIT 7,038 9,336 10,019 10,713 11,318
Price Volume Performance Net Profit 1,019 1,567 1,843 2,073 2,274
Balance Sheet
(AED mn) 2010 2011e 2012e 2013e 2014e
Assets 116,059 113,208 115,866 119,868 124,055
Shareholders' Equity 8,897 9,752 10,883 12,066 13,451
Net Fixed Assets 78,651 76,762 74,896 72,374 69,985
Bank Borrowings 80,455 77,088 75,557 73,212 72,616
Key Ratios
2010 2011e 2012e 2013e 2014e
Gross profit margin 33.4% 36.5% 36.0% 35.5% 35.0%
EBIT margin 32.9% 37.0% 35.8% 35.3% 34.9%
Net profit margin 0.1 0.1 0.1 0.1 0.1
LT Debt/Equity (x) 8.7 7.6 6.8 6.1 5.4
Current ratio 1.5 1.2 1.5 1.9 2.2
ROAA 1.8% 2.2% 2.6% 2.8% 3.0% Source: Bloomberg ROAE 11.6% 16.8% 17.9% 18.1% 17.8%
Dividend Yield (%) 6.6% 9.5% 9.5% 11.9% 11.9%
Chandresh Bhatt EPS (AED) 0.16 0.25 0.30 0.33 0.37
BVPS (AED) 1.43 1.57 1.75 1.94 2.16
P/E (x) 9.0 4.8 4.1 3.6 3.3
P/BV (x) 1.0 0.8 0.7 0.6 0.6
Source: Company Reports & Global Research
Phone: +965-2295-1282
2,050.7
4.1
0.7 Taqa's recent debt offering received tremendous response. It has strong
liquidity position with cash of AED4bn on its books as of 3Q11. Growing
asset portfolio & strong performance makes TAQA a strong investment case. Price Performance 1-Yr
810.1 Income Statement
Vice President
286,305.7 Avg. Val. Traded (USDmn)
TAQA UH
TAQA.AD
We believe that TAQA is well placed in capitalizing opportunities available in
the electricity & water segment. We expect revenue CAGR (2011-14) of
6.3% for electricity & water and 10.0% for oil & gas. At group level, we
forecast revenue CAGR of 8.8% & net profit CAGR of 9.8% during 2011-14.
Market Data
6,225.0
7,532.3 Mkt Cap (AED mn):
Abu Dhabi National Energy
Taqa reported strong performance in 9M11 – both operationally & financially.
It benefited from higher oil prices and a quarterly increase in UK production,
along with higher Power & Water revenue from UAE. Revenue & net profit
growth was 24% YoY & 66.3% to AED18.7bn & AED1.1bn, respectively.
Downside / Upside: 48.1%
1.79
1.21
Target Price (AED):
Current Price (AED):
STRONG BUY
1.0
1.1
1.2
1.3
1.4
1.5
1.6
1.7
0
2,000
4,000
6,000
8,000
10,000
12,000
14,000
Ja
n-1
1F
eb
-11
Ma
r-1
1A
pr-
11
Ma
y-1
1Ju
n-1
1Ju
l-1
1A
ug
-11
Se
p-1
1O
ct-
11
No
v-1
1D
ec-1
1
Volume ('000) TAQA (AED) - RHS
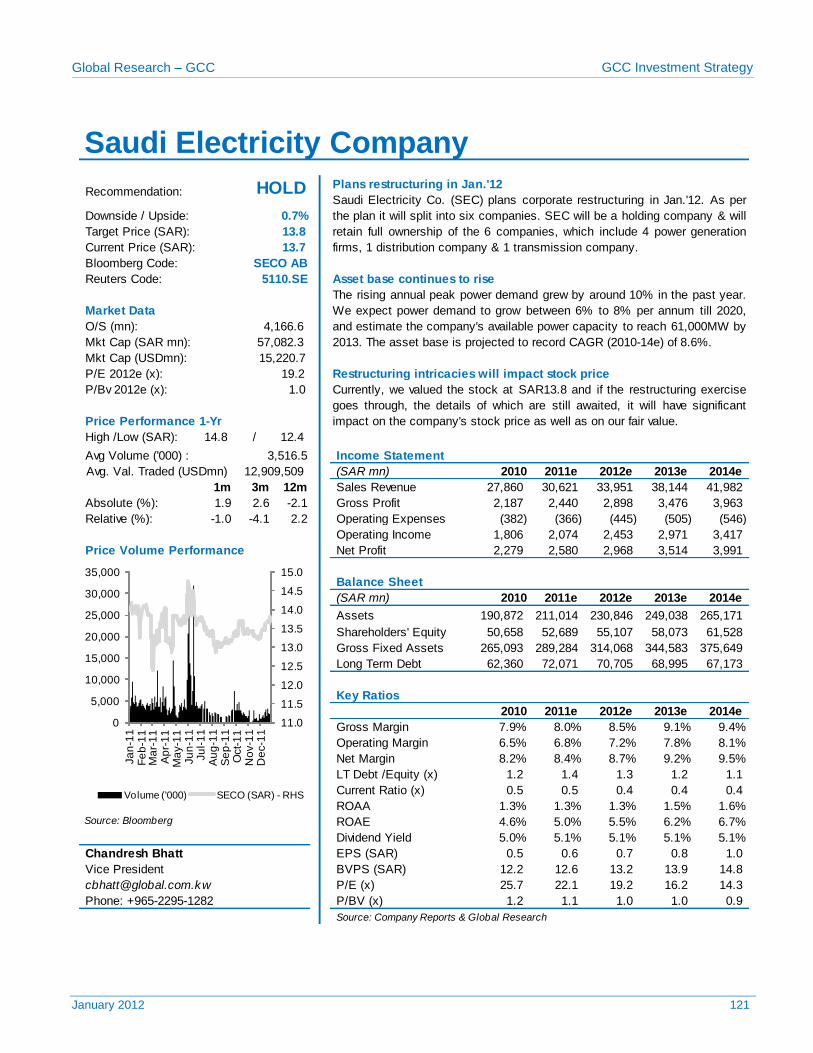
Global Research – GCC GCC Investment Strategy
January 2012 121
Plans restructuring in Jan.'12
Bloomberg Code:
Reuters Code: Asset base continues to rise
O/S (mn):
Mkt Cap (USDmn):
P/E 2012e (x): Restructuring intricacies will impact stock price
P/Bv 2012e (x):
High /Low (SAR): 14.8 / 12.4
Avg Volume ('000) :
(SAR mn) 2010 2011e 2012e 2013e 2014e
1m 3m 12m Sales Revenue 27,860 30,621 33,951 38,144 41,982
Absolute (%): 1.9 2.6 -2.1 Gross Profit 2,187 2,440 2,898 3,476 3,963
Relative (%): -1.0 -4.1 2.2 Operating Expenses (382) (366) (445) (505) (546)
Operating Income 1,806 2,074 2,453 2,971 3,417
Price Volume Performance Net Profit 2,279 2,580 2,968 3,514 3,991
Balance Sheet
(SAR mn) 2010 2011e 2012e 2013e 2014e
Assets 190,872 211,014 230,846 249,038 265,171
Shareholders' Equity 50,658 52,689 55,107 58,073 61,528
Gross Fixed Assets 265,093 289,284 314,068 344,583 375,649
Long Term Debt 62,360 72,071 70,705 68,995 67,173
Key Ratios
2010 2011e 2012e 2013e 2014e
Gross Margin 7.9% 8.0% 8.5% 9.1% 9.4%
Operating Margin 6.5% 6.8% 7.2% 7.8% 8.1%
Net Margin 8.2% 8.4% 8.7% 9.2% 9.5%
LT Debt /Equity (x) 1.2 1.4 1.3 1.2 1.1
Current Ratio (x) 0.5 0.5 0.4 0.4 0.4
ROAA 1.3% 1.3% 1.3% 1.5% 1.6%
ROAE 4.6% 5.0% 5.5% 6.2% 6.7%
Dividend Yield 5.0% 5.1% 5.1% 5.1% 5.1%
Chandresh Bhatt EPS (SAR) 0.5 0.6 0.7 0.8 1.0
BVPS (SAR) 12.2 12.6 13.2 13.9 14.8
P/E (x) 25.7 22.1 19.2 16.2 14.3
P/BV (x) 1.2 1.1 1.0 1.0 0.9
Source: Company Reports & Global Research
Phone: +965-2295-1282
Source: Bloomberg
Vice President
Income Statement
SECO AB
5110.SE
The rising annual peak power demand grew by around 10% in the past year.
We expect power demand to grow between 6% to 8% per annum till 2020,
and estimate the company's available power capacity to reach 61,000MW by
2013. The asset base is projected to record CAGR (2010-14e) of 8.6%.
Market Data
4,166.6
15,220.7
19.2
1.0 Currently, we valued the stock at SAR13.8 and if the restructuring exercise
goes through, the details of which are still awaited, it will have significant
impact on the company's stock price as well as on our fair value. Price Performance 1-Yr
Saudi Electricity Company
Recommendation: HOLD Saudi Electricity Co. (SEC) plans corporate restructuring in Jan.'12. As per
the plan it will split into six companies. SEC will be a holding company & will
retain full ownership of the 6 companies, which include 4 power generation
firms, 1 distribution company & 1 transmission company.
Downside / Upside: 0.7%
13.8
13.7
12,909,509 Avg. Val. Traded (USDmn)
Target Price (SAR):
Current Price (SAR):
57,082.3 Mkt Cap (SAR mn):
3,516.5
11.0
11.5
12.0
12.5
13.0
13.5
14.0
14.5
15.0
0
5,000
10,000
15,000
20,000
25,000
30,000
35,000
Ja
n-1
1F
eb
-11
Ma
r-1
1A
pr-
11
Ma
y-1
1Ju
n-1
1Ju
l-1
1A
ug
-11
Se
p-1
1O
ct-
11
No
v-1
1D
ec-1
1
Volume ('000) SECO (SAR) - RHS
Global Research – GCC GCC Investment Strategy
January 2012 122
OTHERS
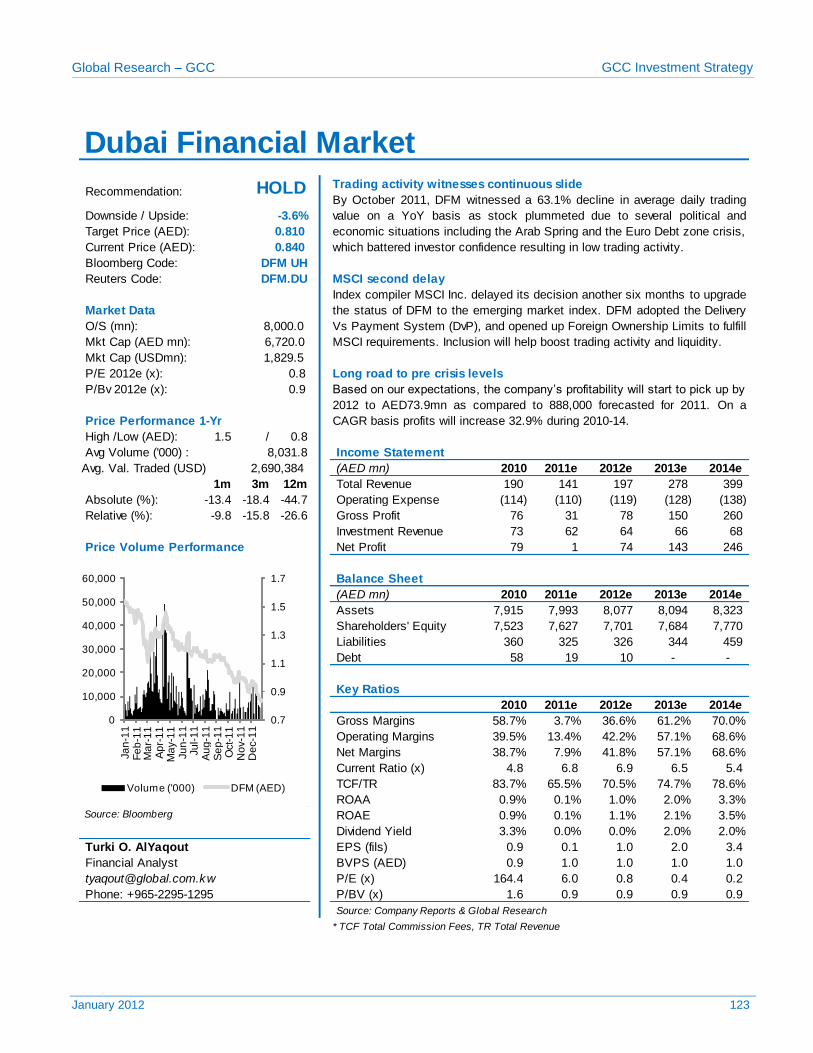
Global Research – GCC GCC Investment Strategy
January 2012 123
Trading activity witnesses continuous slide
Bloomberg Code:
Reuters Code: MSCI second delay
O/S (mn):
Mkt Cap (USDmn):
P/E 2012e (x): Long road to pre crisis levels
P/Bv 2012e (x):
High /Low (AED): 1.5 / 0.8
Avg Volume ('000) :
(AED mn) 2010 2011e 2012e 2013e 2014e
1m 3m 12m Total Revenue 190 141 197 278 399
Absolute (%): -13.4 -18.4 -44.7 Operating Expense (114) (110) (119) (128) (138)
Relative (%): -9.8 -15.8 -26.6 Gross Profit 76 31 78 150 260
Investment Revenue 73 62 64 66 68
Price Volume Performance Net Profit 79 1 74 143 246
Balance Sheet
(AED mn) 2010 2011e 2012e 2013e 2014e
Assets 7,915 7,993 8,077 8,094 8,323
Shareholders' Equity 7,523 7,627 7,701 7,684 7,770
Liabilities 360 325 326 344 459
Debt 58 19 10 - -
Key Ratios
2010 2011e 2012e 2013e 2014e
Gross Margins 58.7% 3.7% 36.6% 61.2% 70.0%
Operating Margins 39.5% 13.4% 42.2% 57.1% 68.6%
Net Margins 38.7% 7.9% 41.8% 57.1% 68.6%
Current Ratio (x) 4.8 6.8 6.9 6.5 5.4
TCF/TR 83.7% 65.5% 70.5% 74.7% 78.6%
ROAA 0.9% 0.1% 1.0% 2.0% 3.3%
ROAE 0.9% 0.1% 1.1% 2.1% 3.5%
Dividend Yield 3.3% 0.0% 0.0% 2.0% 2.0%
Turki O. AlYaqout EPS (fils) 0.9 0.1 1.0 2.0 3.4
BVPS (AED) 0.9 1.0 1.0 1.0 1.0
P/E (x) 164.4 6.0 0.8 0.4 0.2
P/BV (x) 1.6 0.9 0.9 0.9 0.9
Source: Company Reports & Global Research
* TCF Total Commission Fees, TR Total Revenue
Phone: +965-2295-1295
1,829.5
0.8
0.9 Based on our expectations, the company’s profitability will start to pick up by
2012 to AED73.9mn as compared to 888,000 forecasted for 2011. On a
CAGR basis profits will increase 32.9% during 2010-14. Price Performance 1-Yr
8,031.8 Income Statement
Source: Bloomberg
Financial Analyst
2,690,384 Avg. Val. Traded (USD)
DFM UH
DFM.DU
Index compiler MSCI Inc. delayed its decision another six months to upgrade
the status of DFM to the emerging market index. DFM adopted the Delivery
Vs Payment System (DvP), and opened up Foreign Ownership Limits to fulfill
MSCI requirements. Inclusion will help boost trading activity and liquidity.
Market Data
8,000.0
6,720.0 Mkt Cap (AED mn):
Dubai Financial Market
Recommendation: HOLD By October 2011, DFM witnessed a 63.1% decline in average daily trading
value on a YoY basis as stock plummeted due to several political and
economic situations including the Arab Spring and the Euro Debt zone crisis,
which battered investor confidence resulting in low trading activity.
Downside / Upside: -3.6%
Target Price (AED): 0.810
Current Price (AED): 0.840
0.7
0.9
1.1
1.3
1.5
1.7
0
10,000
20,000
30,000
40,000
50,000
60,000
Ja
n-1
1F
eb
-11
Ma
r-1
1A
pr-
11
Ma
y-1
1Ju
n-1
1Ju
l-1
1A
ug
-11
Se
p-1
1O
ct-
11
No
v-1
1D
ec-1
1
Volume ('000) DFM (AED)
Global Research – GCC GCC Investment Strategy
January 2012 124
APPENDIX
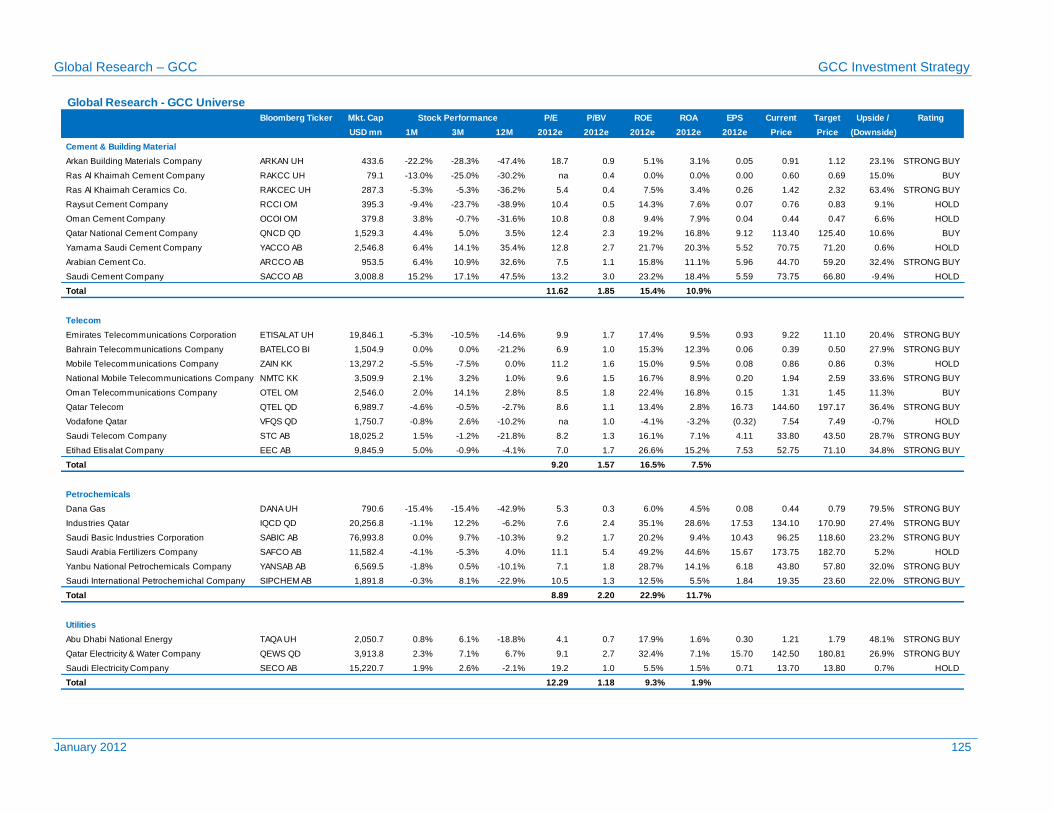
Global Research – GCC GCC Investment Strategy
January 2012 125
Global Research - GCC Universe
Bloomberg Ticker Mkt. Cap P/E P/BV ROE ROA EPS Current Target Upside / Rating
USD mn 1M 3M 12M 2012e 2012e 2012e 2012e 2012e Price Price (Downside)
Cement & Building Material
Arkan Building Materials Company ARKAN UH 433.6 -22.2% -28.3% -47.4% 18.7 0.9 5.1% 3.1% 0.05 0.91 1.12 23.1% STRONG BUY
Ras Al Khaimah Cement Company RAKCC UH 79.1 -13.0% -25.0% -30.2% na 0.4 0.0% 0.0% 0.00 0.60 0.69 15.0% BUY
Ras Al Khaimah Ceramics Co. RAKCEC UH 287.3 -5.3% -5.3% -36.2% 5.4 0.4 7.5% 3.4% 0.26 1.42 2.32 63.4% STRONG BUY
Raysut Cement Company RCCI OM 395.3 -9.4% -23.7% -38.9% 10.4 0.5 14.3% 7.6% 0.07 0.76 0.83 9.1% HOLD
Oman Cement Company OCOI OM 379.8 3.8% -0.7% -31.6% 10.8 0.8 9.4% 7.9% 0.04 0.44 0.47 6.6% HOLD
Qatar National Cement Company QNCD QD 1,529.3 4.4% 5.0% 3.5% 12.4 2.3 19.2% 16.8% 9.12 113.40 125.40 10.6% BUY
Yamama Saudi Cement Company YACCO AB 2,546.8 6.4% 14.1% 35.4% 12.8 2.7 21.7% 20.3% 5.52 70.75 71.20 0.6% HOLD
Arabian Cement Co. ARCCO AB 953.5 6.4% 10.9% 32.6% 7.5 1.1 15.8% 11.1% 5.96 44.70 59.20 32.4% STRONG BUY
Saudi Cement Company SACCO AB 3,008.8 15.2% 17.1% 47.5% 13.2 3.0 23.2% 18.4% 5.59 73.75 66.80 -9.4% HOLD
Total 11.62 1.85 15.4% 10.9%
Telecom
Emirates Telecommunications Corporation ETISALAT UH 19,846.1 -5.3% -10.5% -14.6% 9.9 1.7 17.4% 9.5% 0.93 9.22 11.10 20.4% STRONG BUY
Bahrain Telecommunications Company BATELCO BI 1,504.9 0.0% 0.0% -21.2% 6.9 1.0 15.3% 12.3% 0.06 0.39 0.50 27.9% STRONG BUY
Mobile Telecommunications Company ZAIN KK 13,297.2 -5.5% -7.5% 0.0% 11.2 1.6 15.0% 9.5% 0.08 0.86 0.86 0.3% HOLD
National Mobile Telecommunications Company NMTC KK 3,509.9 2.1% 3.2% 1.0% 9.6 1.5 16.7% 8.9% 0.20 1.94 2.59 33.6% STRONG BUY
Oman Telecommunications Company OTEL OM 2,546.0 2.0% 14.1% 2.8% 8.5 1.8 22.4% 16.8% 0.15 1.31 1.45 11.3% BUY
Qatar Telecom QTEL QD 6,989.7 -4.6% -0.5% -2.7% 8.6 1.1 13.4% 2.8% 16.73 144.60 197.17 36.4% STRONG BUY
Vodafone Qatar VFQS QD 1,750.7 -0.8% 2.6% -10.2% na 1.0 -4.1% -3.2% (0.32) 7.54 7.49 -0.7% HOLD
Saudi Telecom Company STC AB 18,025.2 1.5% -1.2% -21.8% 8.2 1.3 16.1% 7.1% 4.11 33.80 43.50 28.7% STRONG BUY
Etihad Etisalat Company EEC AB 9,845.9 5.0% -0.9% -4.1% 7.0 1.7 26.6% 15.2% 7.53 52.75 71.10 34.8% STRONG BUY
Total 9.20 1.57 16.5% 7.5%
Petrochemicals
Dana Gas DANA UH 790.6 -15.4% -15.4% -42.9% 5.3 0.3 6.0% 4.5% 0.08 0.44 0.79 79.5% STRONG BUY
Industries Qatar IQCD QD 20,256.8 -1.1% 12.2% -6.2% 7.6 2.4 35.1% 28.6% 17.53 134.10 170.90 27.4% STRONG BUY
Saudi Basic Industries Corporation SABIC AB 76,993.8 0.0% 9.7% -10.3% 9.2 1.7 20.2% 9.4% 10.43 96.25 118.60 23.2% STRONG BUY
Saudi Arabia Fertilizers Company SAFCO AB 11,582.4 -4.1% -5.3% 4.0% 11.1 5.4 49.2% 44.6% 15.67 173.75 182.70 5.2% HOLD
Yanbu National Petrochemicals Company YANSAB AB 6,569.5 -1.8% 0.5% -10.1% 7.1 1.8 28.7% 14.1% 6.18 43.80 57.80 32.0% STRONG BUY
Saudi International Petrochemichal Company SIPCHEM AB 1,891.8 -0.3% 8.1% -22.9% 10.5 1.3 12.5% 5.5% 1.84 19.35 23.60 22.0% STRONG BUY
Total 8.89 2.20 22.9% 11.7%
Utilities
Abu Dhabi National Energy TAQA UH 2,050.7 0.8% 6.1% -18.8% 4.1 0.7 17.9% 1.6% 0.30 1.21 1.79 48.1% STRONG BUY
Qatar Electricity & Water Company QEWS QD 3,913.8 2.3% 7.1% 6.7% 9.1 2.7 32.4% 7.1% 15.70 142.50 180.81 26.9% STRONG BUY
Saudi Electricity Company SECO AB 15,220.7 1.9% 2.6% -2.1% 19.2 1.0 5.5% 1.5% 0.71 13.70 13.80 0.7% HOLD
Total 12.29 1.18 9.3% 1.9%
Stock Performance
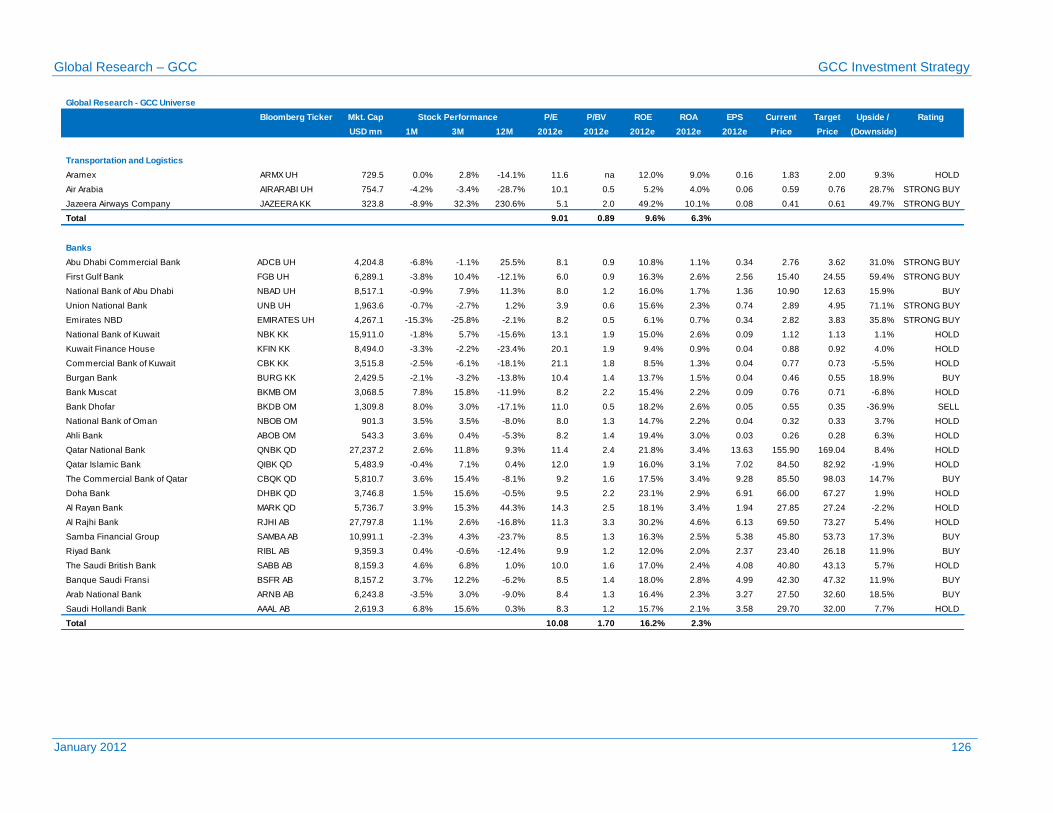
Global Research – GCC GCC Investment Strategy
January 2012 126
Global Research - GCC Universe
Bloomberg Ticker Mkt. Cap P/E P/BV ROE ROA EPS Current Target Upside / Rating
USD mn 1M 3M 12M 2012e 2012e 2012e 2012e 2012e Price Price (Downside)
Transportation and Logistics
Aramex ARMX UH 729.5 0.0% 2.8% -14.1% 11.6 na 12.0% 9.0% 0.16 1.83 2.00 9.3% HOLD
Air Arabia AIRARABI UH 754.7 -4.2% -3.4% -28.7% 10.1 0.5 5.2% 4.0% 0.06 0.59 0.76 28.7% STRONG BUY
Jazeera Airways Company JAZEERA KK 323.8 -8.9% 32.3% 230.6% 5.1 2.0 49.2% 10.1% 0.08 0.41 0.61 49.7% STRONG BUY
Total 9.01 0.89 9.6% 6.3%
Banks
Abu Dhabi Commercial Bank ADCB UH 4,204.8 -6.8% -1.1% 25.5% 8.1 0.9 10.8% 1.1% 0.34 2.76 3.62 31.0% STRONG BUY
First Gulf Bank FGB UH 6,289.1 -3.8% 10.4% -12.1% 6.0 0.9 16.3% 2.6% 2.56 15.40 24.55 59.4% STRONG BUY
National Bank of Abu Dhabi NBAD UH 8,517.1 -0.9% 7.9% 11.3% 8.0 1.2 16.0% 1.7% 1.36 10.90 12.63 15.9% BUY
Union National Bank UNB UH 1,963.6 -0.7% -2.7% 1.2% 3.9 0.6 15.6% 2.3% 0.74 2.89 4.95 71.1% STRONG BUY
Emirates NBD EMIRATES UH 4,267.1 -15.3% -25.8% -2.1% 8.2 0.5 6.1% 0.7% 0.34 2.82 3.83 35.8% STRONG BUY
National Bank of Kuwait NBK KK 15,911.0 -1.8% 5.7% -15.6% 13.1 1.9 15.0% 2.6% 0.09 1.12 1.13 1.1% HOLD
Kuwait Finance House KFIN KK 8,494.0 -3.3% -2.2% -23.4% 20.1 1.9 9.4% 0.9% 0.04 0.88 0.92 4.0% HOLD
Commercial Bank of Kuwait CBK KK 3,515.8 -2.5% -6.1% -18.1% 21.1 1.8 8.5% 1.3% 0.04 0.77 0.73 -5.5% HOLD
Burgan Bank BURG KK 2,429.5 -2.1% -3.2% -13.8% 10.4 1.4 13.7% 1.5% 0.04 0.46 0.55 18.9% BUY
Bank Muscat BKMB OM 3,068.5 7.8% 15.8% -11.9% 8.2 2.2 15.4% 2.2% 0.09 0.76 0.71 -6.8% HOLD
Bank Dhofar BKDB OM 1,309.8 8.0% 3.0% -17.1% 11.0 0.5 18.2% 2.6% 0.05 0.55 0.35 -36.9% SELL
National Bank of Oman NBOB OM 901.3 3.5% 3.5% -8.0% 8.0 1.3 14.7% 2.2% 0.04 0.32 0.33 3.7% HOLD
Ahli Bank ABOB OM 543.3 3.6% 0.4% -5.3% 8.2 1.4 19.4% 3.0% 0.03 0.26 0.28 6.3% HOLD
Qatar National Bank QNBK QD 27,237.2 2.6% 11.8% 9.3% 11.4 2.4 21.8% 3.4% 13.63 155.90 169.04 8.4% HOLD
Qatar Islamic Bank QIBK QD 5,483.9 -0.4% 7.1% 0.4% 12.0 1.9 16.0% 3.1% 7.02 84.50 82.92 -1.9% HOLD
The Commercial Bank of Qatar CBQK QD 5,810.7 3.6% 15.4% -8.1% 9.2 1.6 17.5% 3.4% 9.28 85.50 98.03 14.7% BUY
Doha Bank DHBK QD 3,746.8 1.5% 15.6% -0.5% 9.5 2.2 23.1% 2.9% 6.91 66.00 67.27 1.9% HOLD
Al Rayan Bank MARK QD 5,736.7 3.9% 15.3% 44.3% 14.3 2.5 18.1% 3.4% 1.94 27.85 27.24 -2.2% HOLD
Al Rajhi Bank RJHI AB 27,797.8 1.1% 2.6% -16.8% 11.3 3.3 30.2% 4.6% 6.13 69.50 73.27 5.4% HOLD
Samba Financial Group SAMBA AB 10,991.1 -2.3% 4.3% -23.7% 8.5 1.3 16.3% 2.5% 5.38 45.80 53.73 17.3% BUY
Riyad Bank RIBL AB 9,359.3 0.4% -0.6% -12.4% 9.9 1.2 12.0% 2.0% 2.37 23.40 26.18 11.9% BUY
The Saudi British Bank SABB AB 8,159.3 4.6% 6.8% 1.0% 10.0 1.6 17.0% 2.4% 4.08 40.80 43.13 5.7% HOLD
Banque Saudi Fransi BSFR AB 8,157.2 3.7% 12.2% -6.2% 8.5 1.4 18.0% 2.8% 4.99 42.30 47.32 11.9% BUY
Arab National Bank ARNB AB 6,243.8 -3.5% 3.0% -9.0% 8.4 1.3 16.4% 2.3% 3.27 27.50 32.60 18.5% BUY
Saudi Hollandi Bank AAAL AB 2,619.3 6.8% 15.6% 0.3% 8.3 1.2 15.7% 2.1% 3.58 29.70 32.00 7.7% HOLD
Total 10.08 1.70 16.2% 2.3%
Stock Performance
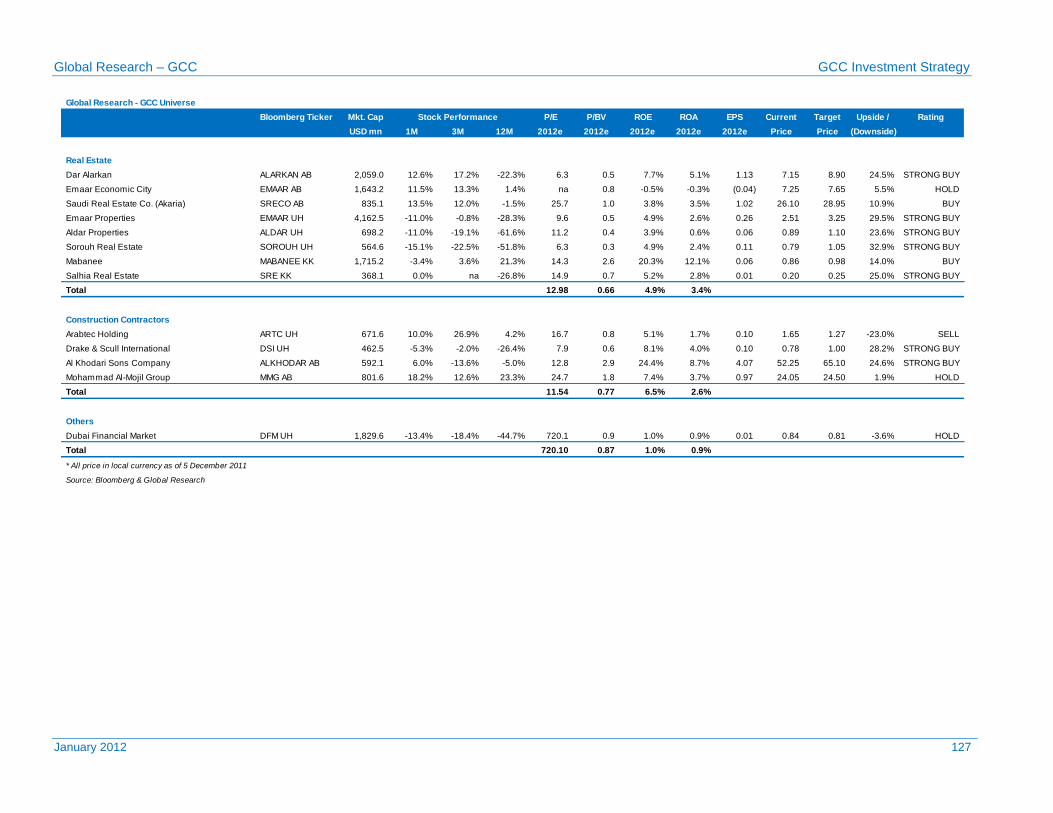
Global Research – GCC GCC Investment Strategy
January 2012 127
Global Research - GCC Universe
Bloomberg Ticker Mkt. Cap P/E P/BV ROE ROA EPS Current Target Upside / Rating
USD mn 1M 3M 12M 2012e 2012e 2012e 2012e 2012e Price Price (Downside)
Real Estate
Dar Alarkan ALARKAN AB 2,059.0 12.6% 17.2% -22.3% 6.3 0.5 7.7% 5.1% 1.13 7.15 8.90 24.5% STRONG BUY
Emaar Economic City EMAAR AB 1,643.2 11.5% 13.3% 1.4% na 0.8 -0.5% -0.3% (0.04) 7.25 7.65 5.5% HOLD
Saudi Real Estate Co. (Akaria) SRECO AB 835.1 13.5% 12.0% -1.5% 25.7 1.0 3.8% 3.5% 1.02 26.10 28.95 10.9% BUY
Emaar Properties EMAAR UH 4,162.5 -11.0% -0.8% -28.3% 9.6 0.5 4.9% 2.6% 0.26 2.51 3.25 29.5% STRONG BUY
Aldar Properties ALDAR UH 698.2 -11.0% -19.1% -61.6% 11.2 0.4 3.9% 0.6% 0.06 0.89 1.10 23.6% STRONG BUY
Sorouh Real Estate SOROUH UH 564.6 -15.1% -22.5% -51.8% 6.3 0.3 4.9% 2.4% 0.11 0.79 1.05 32.9% STRONG BUY
Mabanee MABANEE KK 1,715.2 -3.4% 3.6% 21.3% 14.3 2.6 20.3% 12.1% 0.06 0.86 0.98 14.0% BUY
Salhia Real Estate SRE KK 368.1 0.0% na -26.8% 14.9 0.7 5.2% 2.8% 0.01 0.20 0.25 25.0% STRONG BUY
Total 12.98 0.66 4.9% 3.4%
Construction Contractors
Arabtec Holding ARTC UH 671.6 10.0% 26.9% 4.2% 16.7 0.8 5.1% 1.7% 0.10 1.65 1.27 -23.0% SELL
Drake & Scull International DSI UH 462.5 -5.3% -2.0% -26.4% 7.9 0.6 8.1% 4.0% 0.10 0.78 1.00 28.2% STRONG BUY
Al Khodari Sons Company ALKHODAR AB 592.1 6.0% -13.6% -5.0% 12.8 2.9 24.4% 8.7% 4.07 52.25 65.10 24.6% STRONG BUY
Mohammad Al-Mojil Group MMG AB 801.6 18.2% 12.6% 23.3% 24.7 1.8 7.4% 3.7% 0.97 24.05 24.50 1.9% HOLD
Total 11.54 0.77 6.5% 2.6%
Others
Dubai Financial Market DFM UH 1,829.6 -13.4% -18.4% -44.7% 720.1 0.9 1.0% 0.9% 0.01 0.84 0.81 -3.6% HOLD
Total 720.10 0.87 1.0% 0.9%
* All price in local currency as of 5 December 2011
Source: Bloomberg & Global Research
Stock Performance
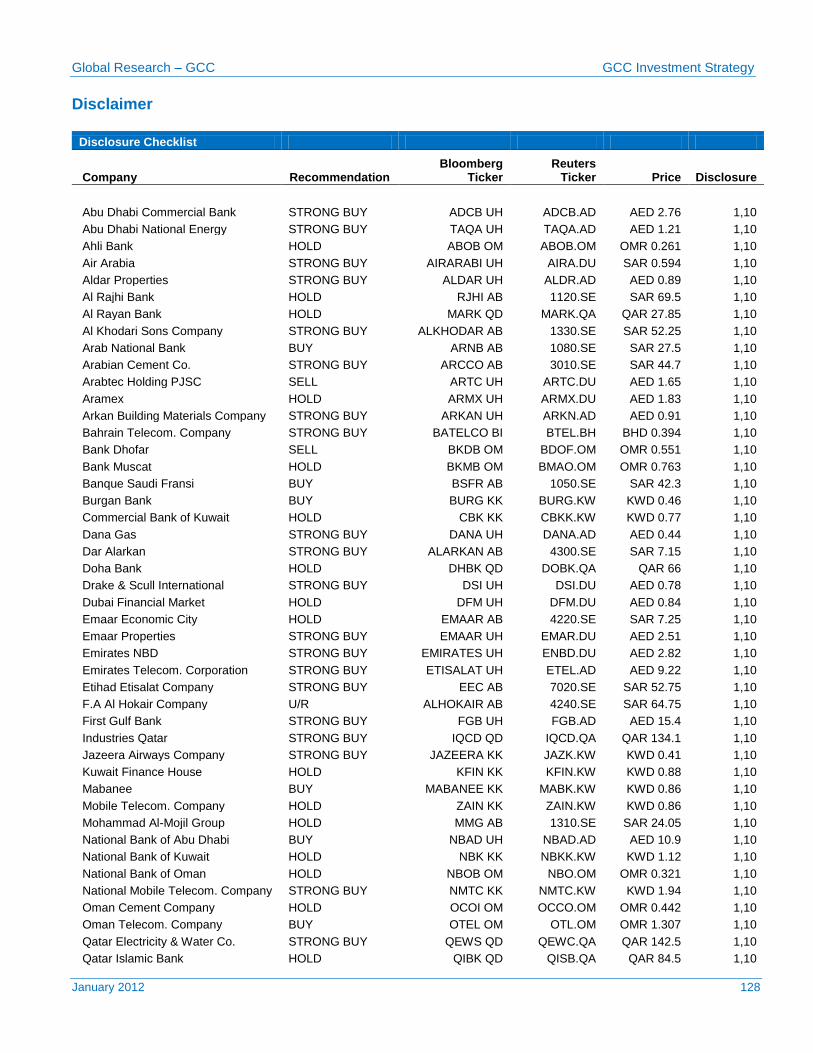
Global Research – GCC GCC Investment Strategy
January 2012 128 128
Disclaimer
Disclosure Checklist
Recommendation
Bloomberg Ticker
Reuters Ticker Price
Disclosure Company
Abu Dhabi Commercial Bank STRONG BUY ADCB UH ADCB.AD AED 2.76 1,10
Abu Dhabi National Energy STRONG BUY TAQA UH TAQA.AD AED 1.21 1,10
Ahli Bank HOLD ABOB OM ABOB.OM OMR 0.261 1,10
Air Arabia STRONG BUY AIRARABI UH AIRA.DU SAR 0.594 1,10
Aldar Properties STRONG BUY ALDAR UH ALDR.AD AED 0.89 1,10
Al Rajhi Bank HOLD RJHI AB 1120.SE SAR 69.5 1,10
Al Rayan Bank HOLD MARK QD MARK.QA QAR 27.85 1,10
Al Khodari Sons Company STRONG BUY ALKHODAR AB 1330.SE SAR 52.25 1,10
Arab National Bank BUY ARNB AB 1080.SE SAR 27.5 1,10
Arabian Cement Co. STRONG BUY ARCCO AB 3010.SE SAR 44.7 1,10
Arabtec Holding PJSC SELL ARTC UH ARTC.DU AED 1.65 1,10
Aramex HOLD ARMX UH ARMX.DU AED 1.83 1,10
Arkan Building Materials Company STRONG BUY ARKAN UH ARKN.AD AED 0.91 1,10
Bahrain Telecom. Company STRONG BUY BATELCO BI BTEL.BH BHD 0.394 1,10
Bank Dhofar SELL BKDB OM BDOF.OM OMR 0.551 1,10
Bank Muscat HOLD BKMB OM BMAO.OM OMR 0.763 1,10
Banque Saudi Fransi BUY BSFR AB 1050.SE SAR 42.3 1,10
Burgan Bank BUY BURG KK BURG.KW KWD 0.46 1,10
Commercial Bank of Kuwait HOLD CBK KK CBKK.KW KWD 0.77 1,10
Dana Gas STRONG BUY DANA UH DANA.AD AED 0.44 1,10
Dar Alarkan STRONG BUY ALARKAN AB 4300.SE SAR 7.15 1,10
Doha Bank HOLD DHBK QD DOBK.QA QAR 66 1,10
Drake & Scull International STRONG BUY DSI UH DSI.DU AED 0.78 1,10
Dubai Financial Market HOLD DFM UH DFM.DU AED 0.84 1,10
Emaar Economic City HOLD EMAAR AB 4220.SE SAR 7.25 1,10
Emaar Properties STRONG BUY EMAAR UH EMAR.DU AED 2.51 1,10
Emirates NBD STRONG BUY EMIRATES UH ENBD.DU AED 2.82 1,10
Emirates Telecom. Corporation STRONG BUY ETISALAT UH ETEL.AD AED 9.22 1,10
Etihad Etisalat Company STRONG BUY EEC AB 7020.SE SAR 52.75 1,10
F.A Al Hokair Company U/R ALHOKAIR AB 4240.SE SAR 64.75 1,10
First Gulf Bank STRONG BUY FGB UH FGB.AD AED 15.4 1,10
Industries Qatar STRONG BUY IQCD QD IQCD.QA QAR 134.1 1,10
Jazeera Airways Company STRONG BUY JAZEERA KK JAZK.KW KWD 0.41 1,10
Kuwait Finance House HOLD KFIN KK KFIN.KW KWD 0.88 1,10
Mabanee BUY MABANEE KK MABK.KW KWD 0.86 1,10
Mobile Telecom. Company HOLD ZAIN KK ZAIN.KW KWD 0.86 1,10
Mohammad Al-Mojil Group HOLD MMG AB 1310.SE SAR 24.05 1,10
National Bank of Abu Dhabi BUY NBAD UH NBAD.AD AED 10.9 1,10
National Bank of Kuwait HOLD NBK KK NBKK.KW KWD 1.12 1,10
National Bank of Oman HOLD NBOB OM NBO.OM OMR 0.321 1,10
National Mobile Telecom. Company STRONG BUY NMTC KK NMTC.KW KWD 1.94 1,10
Oman Cement Company HOLD OCOI OM OCCO.OM OMR 0.442 1,10
Oman Telecom. Company BUY OTEL OM OTL.OM OMR 1.307 1,10
Qatar Electricity & Water Co. STRONG BUY QEWS QD QEWC.QA QAR 142.5 1,10
Qatar Islamic Bank HOLD QIBK QD QISB.QA QAR 84.5 1,10

Global Research – GCC GCC Investment Strategy
January 2012 129
Qatar National Bank HOLD QNBK QD QNBK.QA QAR 155.9 1,10
Qatar National Cement Company BUY QNCD QD QANC.QA QAR 113.4 1,10
Qatar Telecom STRONG BUY QTEL QD QTEL.QA QAR 144.6 1,10
Ras Al Khaimah Cement Company BUY RAKCC UH RAKC.AD AED 0.6 1,10
Ras Al Khaimah Ceramics Co. STRONG BUY RAKCEC UH RKCE.AD AED 1.42 1,10
Raysut Cement Company HOLD RCCI OM RAYC.OM OMR 0.761 1,10
Riyad Bank BUY RIBL AB 1010.SE SAR 23.4 1,10
Samba Financial Group BUY SAMBA AB 1090.SE SAR 45.8 1,10
Salhia Real Estate STRONG BUY SRE KK SREK.KW KWD 0.2 1,10
Saudi Arabia Fertilizers Company HOLD SAFCO AB 2020.SE SAR 173.75 1,10
Saudi Basic Industries Corporation STRONG BUY SABIC AB 2010.SE SAR 96.25 1,10
Saudi Cement Company HOLD SACCO AB 3030.SE SAR 73.75 1,10
Saudi Electricity Company HOLD SECO AB 5110.SE SAR 13.7 1,10
Saudi Hollandi Bank HOLD AAAL AB 1040.SE SAR 29.7 1,10
Saudi International Petrochem. Co. STRONG BUY SIPCHEM AB 2310.SE SAR 19.35 1,10
Saudi Real Estate Co. (Akaria) BUY SRECO AB 4020.SE SAR 26.1 1,10
Saudi Telecom Company STRONG BUY STC AB 4110.SE SAR 33.8 1,10
Sorouh Real Estate STRONG BUY SOROUH UH SOR.AD AED 0.79 1,10
The Commercial Bank of Qatar BUY CBQK QD COMB.QA QAR 85.5 1,10
The Saudi British Bank HOLD SABB AB 1060.SE SAR 40.8 1,10
Union National Bank STRONG BUY UNB UH UNB.AD AED 2.89 1,10
Vodafone Qatar HOLD VFQS QD VFQS.QA QAR 7.54 1,10
Yamama Saudi Cement Company HOLD YACCO AB 3020.SE SAR 70.75 1,10
Yanbu National Petrochem. Co. STRONG BUY YANSAB AB 2290.SE SAR 43.8 1,10
1. Global Investment House did not receive and will not receive any compensation from the company or anyone else for the
preparation of this report.
2. The company being researched holds more than 5% stake in Global Investment House.
3. Global Investment House makes a market in securities issued by this company.
4. Global Investment House acts as a corporate broker or sponsor to this company.
5. The author of or an individual who assisted in the preparation of this report (or a member of his/her household) has a direct
ownership position in securities issued by this company.
6. An employee of Global Investment House serves on the board of directors of this company.
7. Within the past year , Global Investment House has managed or co-managed a public offering for this company, for which it
received fees.
8. Global Investment House has received compensation from this company for the provision of investment banking or financial
advisory services within the past year.
9. Global Investment House expects to receive or intends to seek compensation for investment banking services from this
company in the next three months.
10. Please see special footnote below for other relevant disclosures.
Global Research: Equity Ratings Definitions
Global Rating Defination
STRONG BUY Fair value of the stock is >20% from the current market price
BUY Fair value of the stock is between +10% and +20% from the current market price
HOLD Fair value of the stock is between +10% and -10% from the current market price
SELL Fair value of the stock is < -10% from the current market price
Global Research – GCC GCC Investment Strategy
January 2012 130
Disclaimer This material was produced by Global Investment House KSCC (‘Global’),a firm regulated by the Central Bank of Kuwait. This document is not to be used or considered as an offer to sell or a solicitation of an offer to buy any securities. Global may, from time to time to the extent permitted by law, participate or invest in other financing transactions with the issuers of the securities (‘securities’), perform services for or solicit business from such issuer, and/or have a position or effect transactions in the securities or options thereof. Global may, to the extent permitted by applicable Kuwaiti law or other applicable laws or regulations, effect transactions in the securities before this material is published to recipients. Information and opinions contained herein have been compiled or arrived by Global from sources believed to be reliable, but Global has not independently verified the contents of this document. Accordingly, no representation or warranty, express or implied, is made as to and no reliance should be placed on the fairness, accuracy, completeness or correctness of the information and opinions contained in this document. Global accepts no liability for any loss arising from the use of this document or its contents or otherwise arising in connection therewith. This document is not to be relied upon or used in substitution for the exercise of independent judgment. Global shall have no responsibility or liability whatsoever in respect of any inaccuracy in or omission from this or any other document prepared by Global for, or sent by Global to any person and any such person shall be responsible for conducting his own investigation and analysis of the information contained or referred to in this document and of evaluating the merits and risks involved in the securities forming the subject matter of this or other such document. Opinions and estimates constitute our judgment and are subject to change without prior notice. Past performance is not indicative of future results. This document does not constitute an offer or invitation to subscribe for or purchase any securities, and neither this document nor anything contained herein shall form the basis of any contract or commitment whatsoever. It is being furnished to you solely for your information and may not be reproduced or redistributed to any other person. Neither this report nor any copy hereof may be distributed in any jurisdiction outside Kuwait where its distribution may be restricted by law. Persons who receive this report should make themselves aware of and adhere to any such restrictions. By accepting this report you agree to be bound by the foregoing limitations.
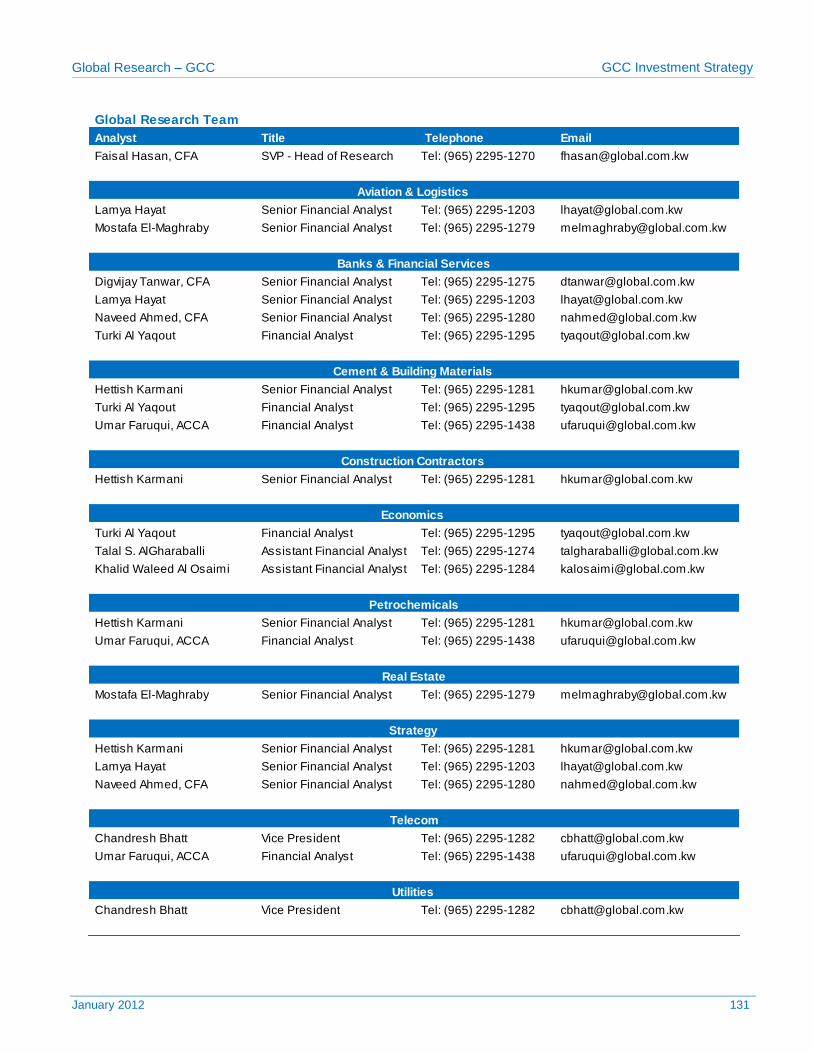
Global Research – GCC GCC Investment Strategy
January 2012 131
Global Research Team
Analyst Title Telephone Email
Faisal Hasan, CFA SVP - Head of Research Tel: (965) 2295-1270 [email protected]
Lamya Hayat Senior Financial Analyst Tel: (965) 2295-1203 [email protected]
Mostafa El-Maghraby Senior Financial Analyst Tel: (965) 2295-1279 [email protected]
Digvijay Tanwar, CFA Senior Financial Analyst Tel: (965) 2295-1275 [email protected]
Lamya Hayat Senior Financial Analyst Tel: (965) 2295-1203 [email protected]
Naveed Ahmed, CFA Senior Financial Analyst Tel: (965) 2295-1280 [email protected]
Turki Al Yaqout Financial Analyst Tel: (965) 2295-1295 [email protected]
Hettish Karmani Senior Financial Analyst Tel: (965) 2295-1281 [email protected]
Turki Al Yaqout Financial Analyst Tel: (965) 2295-1295 [email protected]
Umar Faruqui, ACCA Financial Analyst Tel: (965) 2295-1438 [email protected]
Hettish Karmani Senior Financial Analyst Tel: (965) 2295-1281 [email protected]
Turki Al Yaqout Financial Analyst Tel: (965) 2295-1295 [email protected]
Talal S. AlGharaballi Assistant Financial Analyst Tel: (965) 2295-1274 [email protected]
Khalid Waleed Al Osaimi Assistant Financial Analyst Tel: (965) 2295-1284 [email protected]
Hettish Karmani Senior Financial Analyst Tel: (965) 2295-1281 [email protected]
Umar Faruqui, ACCA Financial Analyst Tel: (965) 2295-1438 [email protected]
Mostafa El-Maghraby Senior Financial Analyst Tel: (965) 2295-1279 [email protected]
Hettish Karmani Senior Financial Analyst Tel: (965) 2295-1281 [email protected]
Lamya Hayat Senior Financial Analyst Tel: (965) 2295-1203 [email protected]
Naveed Ahmed, CFA Senior Financial Analyst Tel: (965) 2295-1280 [email protected]
Chandresh Bhatt Vice President Tel: (965) 2295-1282 [email protected]
Umar Faruqui, ACCA Financial Analyst Tel: (965) 2295-1438 [email protected]
Chandresh Bhatt Vice President Tel: (965) 2295-1282 [email protected]
Aviation & Logistics
Banks & Financial Services
Cement & Building Materials
Construction Contractors
Petrochemicals
Utilities
Real Estate
Economics
Telecom
Strategy
Global Investment House
Website: www.globalinv.net Global Tower
Sharq, Al-Shuhada Str. Tel. + (965) 2 295 1000
Fax. + (965) 2 295 1005 P.O. Box: 28807 Safat, 13149 Kuwait
Research
Faisal Hasan, CFA (965) 2295-1270 [email protected]
Index
Rasha Al-Huneidi (965) 2295-1285 [email protected]
Brokerage
Fouad Fahmi Darwish (965) 2295-1700 [email protected]
Wealth Management - Kuwait
Rasha Al-Qenaei (965) 2295-1380 [email protected]
Wealth Management - International
Fahad Al-Ibrahim (965) 2295-1400 [email protected]
Global Kuwait
Tel: (965) 2 295 1000 Fax: (965) 2 295 1005 P.O.Box 28807 Safat, 13149 Kuwait
Global Bahrain
Tel: (973) 17 210011 Fax: (973) 17 210222 P.O.Box 855 Manama, Bahrain
Global UAE
Tel: (971) 4 4477066 Fax: (971) 4 4477067 P.O.Box 121227 Dubai, UAE
Global Egypt
Tel: (202) 24189705/06 Fax: (202) 22905972 24 Cleopatra St., Heliopolis, Cairo
Global Saudi Arabia
Tel: (966) 1 2994100 Fax: (966) 1 2994199 P.O. Box 66930 Riyadh 11586, Kingdom of Saudi Arabia
Global Jordan
Tel: (962) 6 5005060 Fax: (962) 6 5005066 P.O.Box 3268 Amman 11180, Jordan
Global Wealth Manager
E-mail: [email protected] Tel: (965) 1-804-242