Embed Size (px)
Citation preview
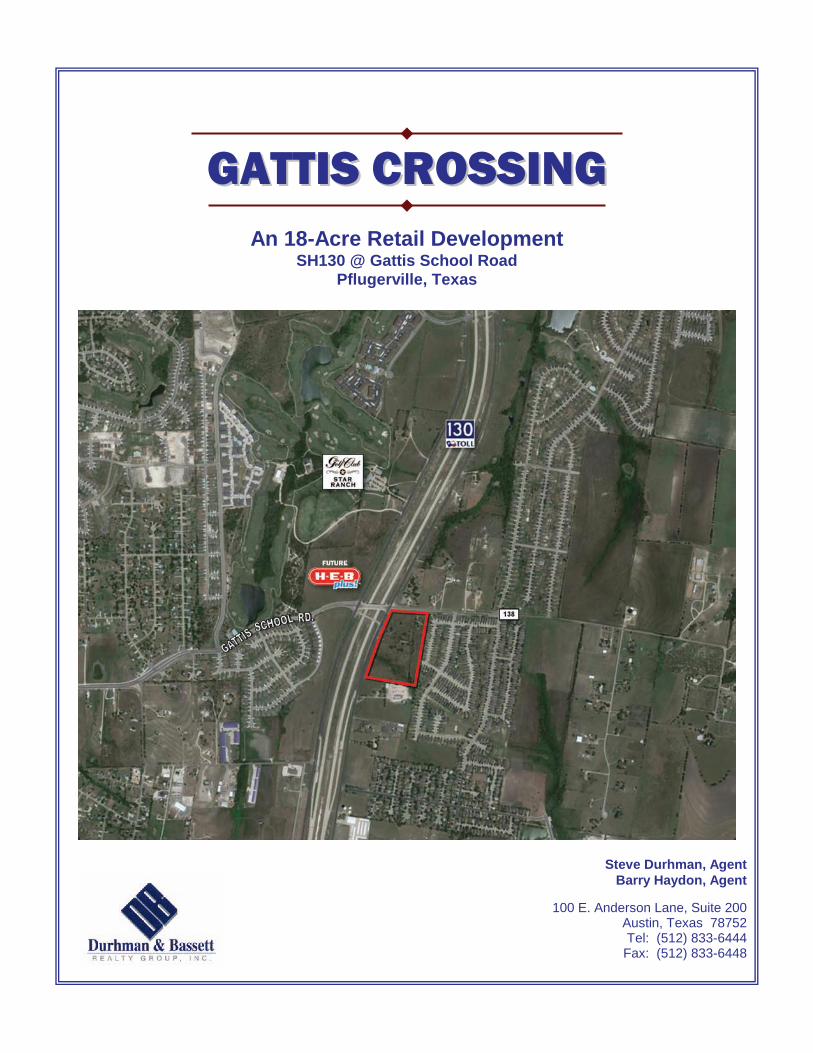
GGAATTTTIISS CCRROOSSSSIINNGG
An 18-Acre Retail Development SH130 @ Gattis School Road
Pflugerville, Texas
Steve Durhman, Agent
Barry Haydon, Agent
100 E. Anderson Lane, Suite 200 Austin, Texas 78752 Tel: (512) 833-6444 Fax: (512) 833-6448
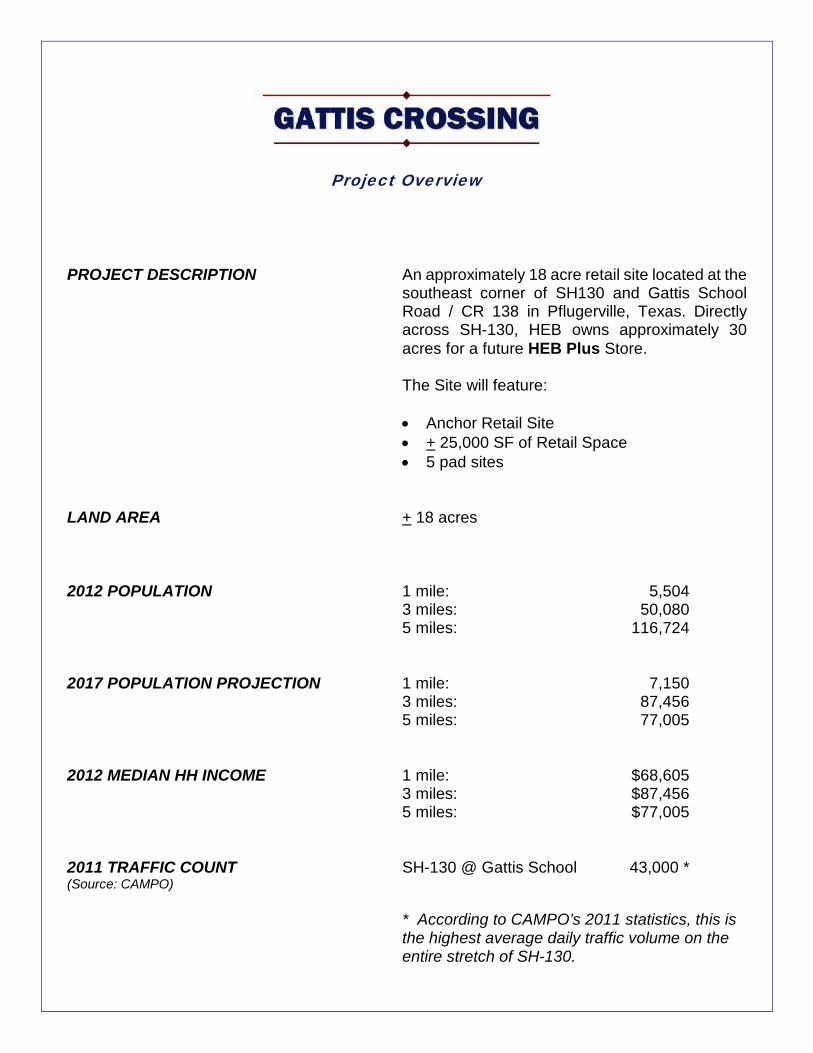
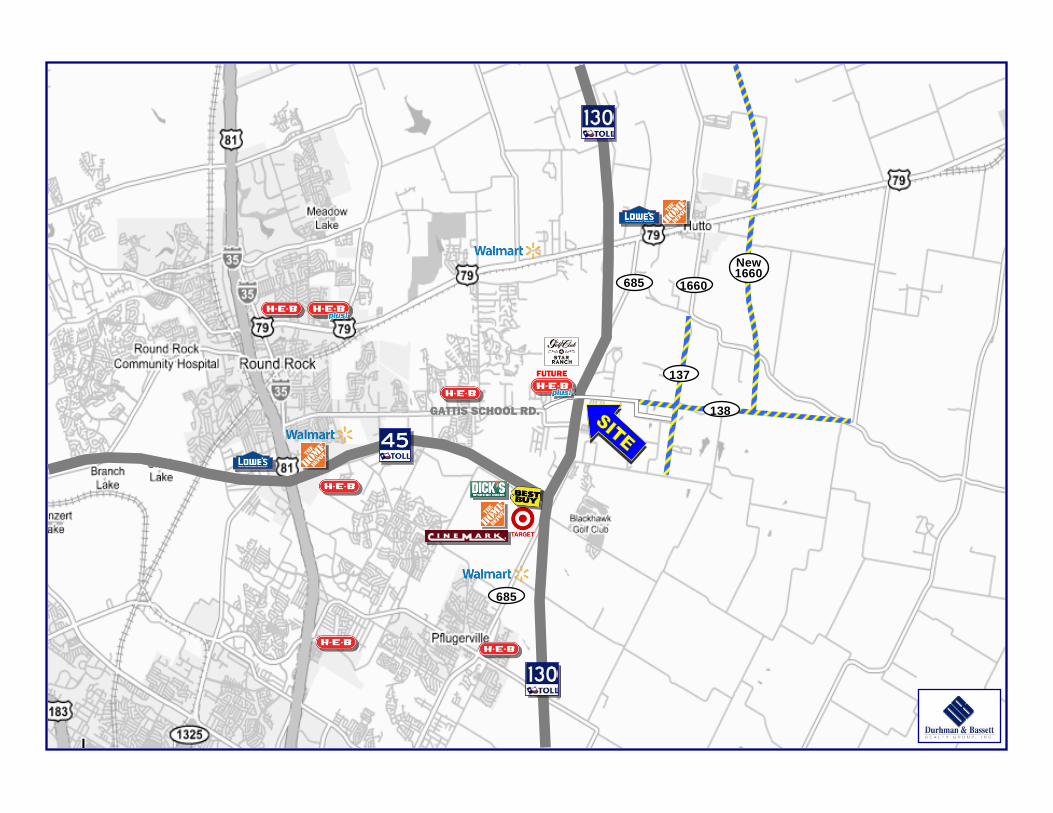
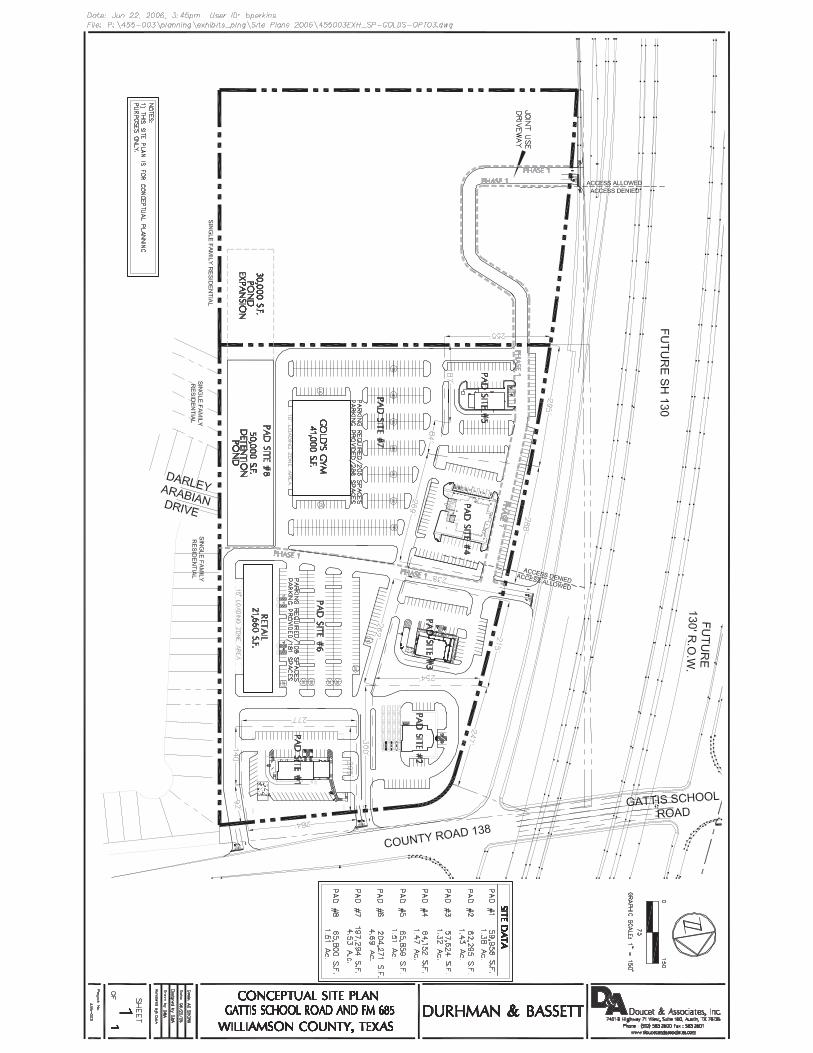
Project Overview PROJECT DESCRIPTION An approximately 18 acre retail site located at the
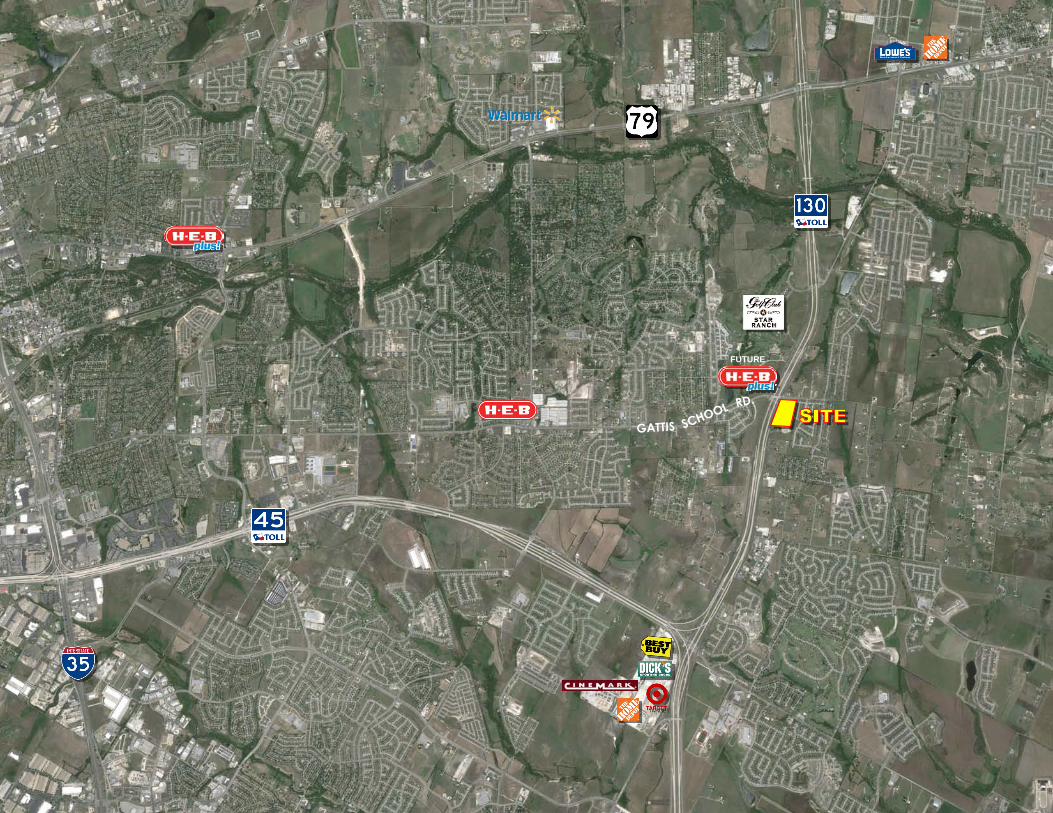
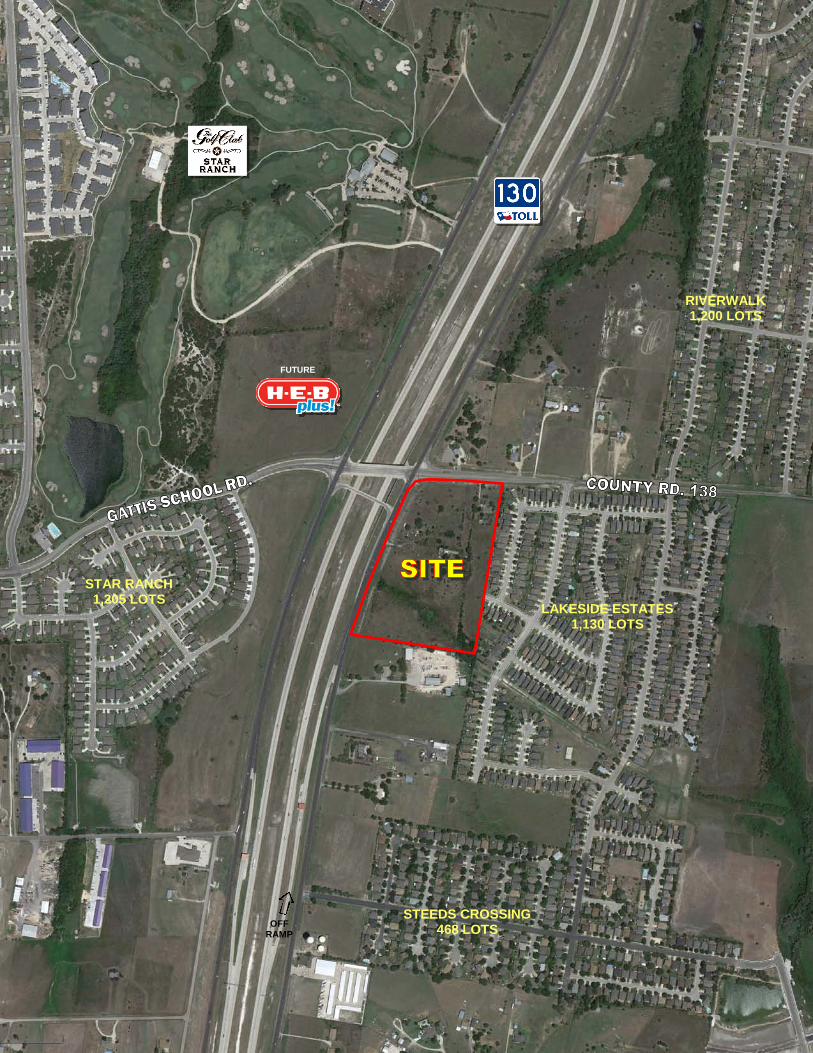
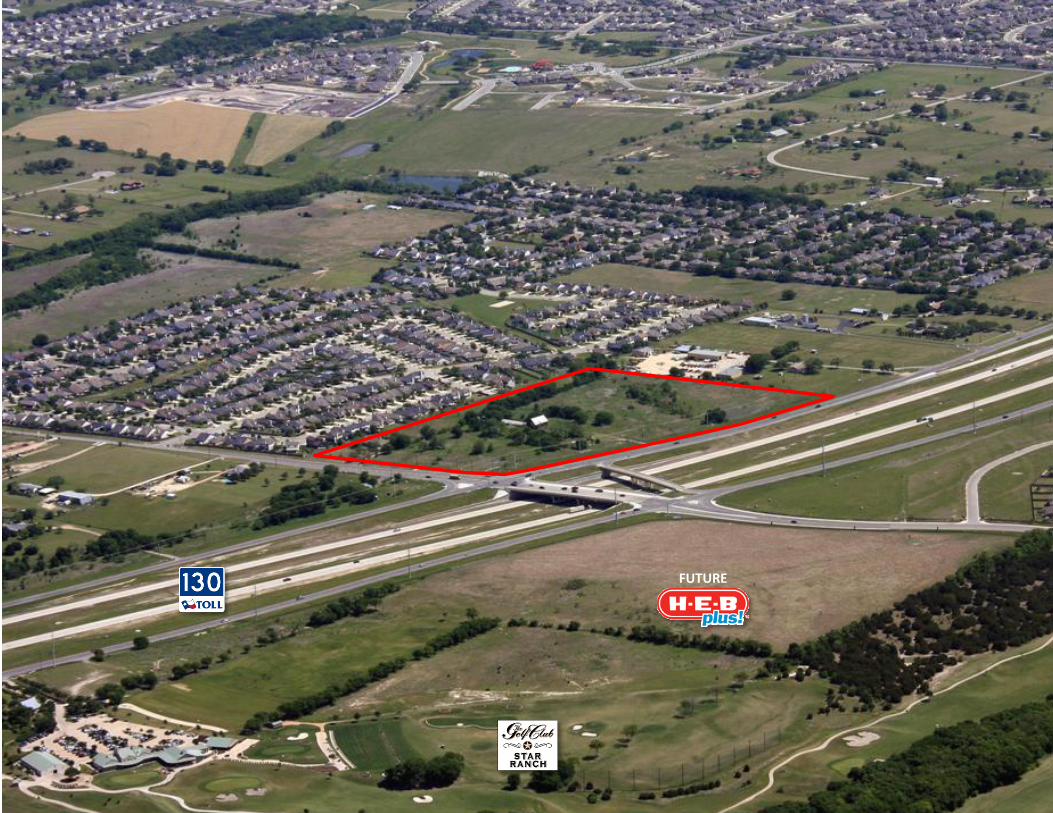
southeast corner of SH130 and Gattis School Road / CR 138 in Pflugerville, Texas. Directly across SH-130, HEB owns approximately 30 acres for a future HEB Plus Store.
The Site will feature:
• Anchor Retail Site • + 25,000 SF of Retail Space • 5 pad sites
LAND AREA + 18 acres 2012 POPULATION 1 mile: 5,504 3 miles: 50,080 5 miles: 116,724 2017 POPULATION PROJECTION 1 mile: 7,150 3 miles: 87,456 5 miles: 77,005 2012 MEDIAN HH INCOME 1 mile: $68,605 3 miles: $87,456 5 miles: $77,005 2011 TRAFFIC COUNT SH-130 @ Gattis School 43,000 * (Source: CAMPO)
* According to CAMPO’s 2011 statistics, this is the highest average daily traffic volume on the entire stretch of SH-130.
FUTURE
GATTIS SCHOOL RD.
OFF RAMP
FUTURE
LAKESIDE ESTATES 1,130 LOTS
RIVERWALK 1,200 LOTS
STAR RANCH 1,205 LOTS
STEEDS CROSSING 468 LOTS
FUTURE
GATTIS SCHOOL RD.
685
685 1660
137
New 1660
138
FUTURE
100
1
8
14
4
6
2
5
3
7
13
12
11
26
25
98
24
31
38
40
41
42
43
46
61
62
63
64
65
67
68
69
70
72
73
74
75
77
78
79
80
81
83
84
85
87
88
89
90
91
92
93
94
95
96
97
99
137
1660 NEW
138
101
104
82
122
109
107
108
105
106
114
124
115
111
112
22
116
19
122
59
58
57
56 55
54
47
44
45
119
118
121
52
53
113
86
123
76
120
102
15
1660
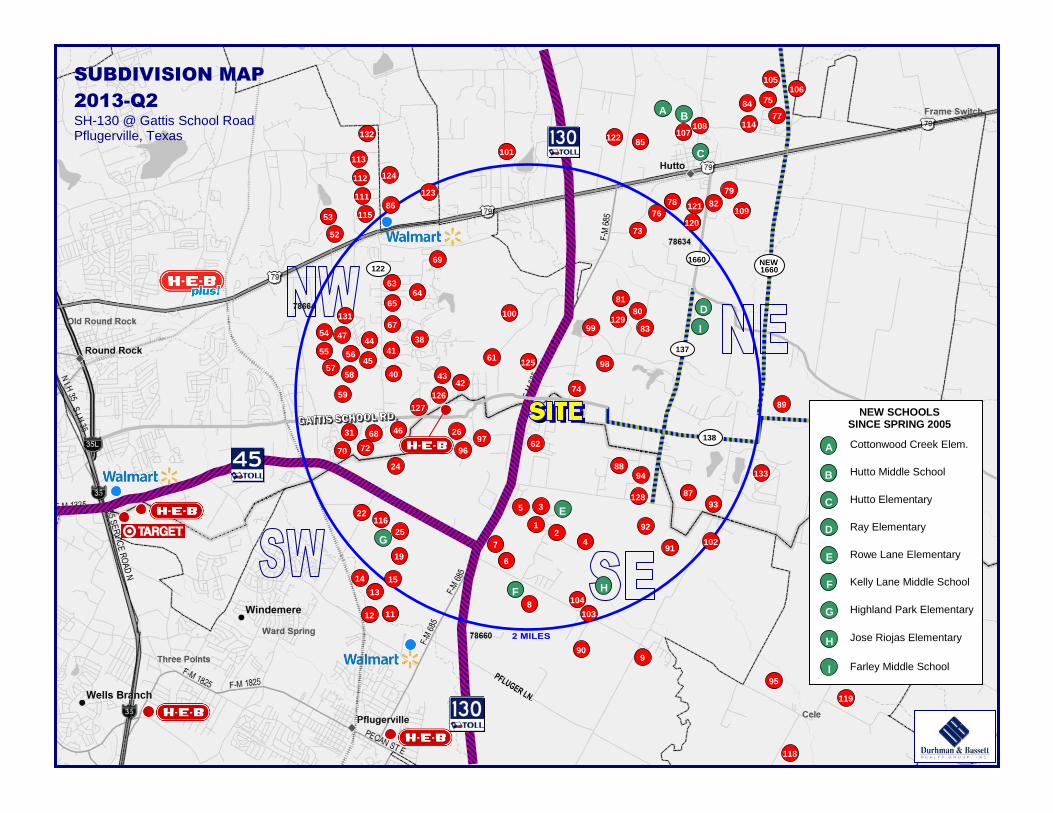
SUBDIVISION MAP
2013-Q2
SH-130 @ Gattis School Road Pflugerville, Texas
103
9
125
126
127
128
129
G
G
H
I
132
131
133
E
F H
G
C
B A
D
I
NEW SCHOOLS SINCE SPRING 2005
Cottonwood Creek Elem.
Hutto Middle School
Hutto Elementary
Ray Elementary
Rowe Lane Elementary
Kelly Lane Middle School
Highland Park Elementary
Jose Riojas Elementary
Farley Middle School
A
B
C
D
E
F
G
H
I
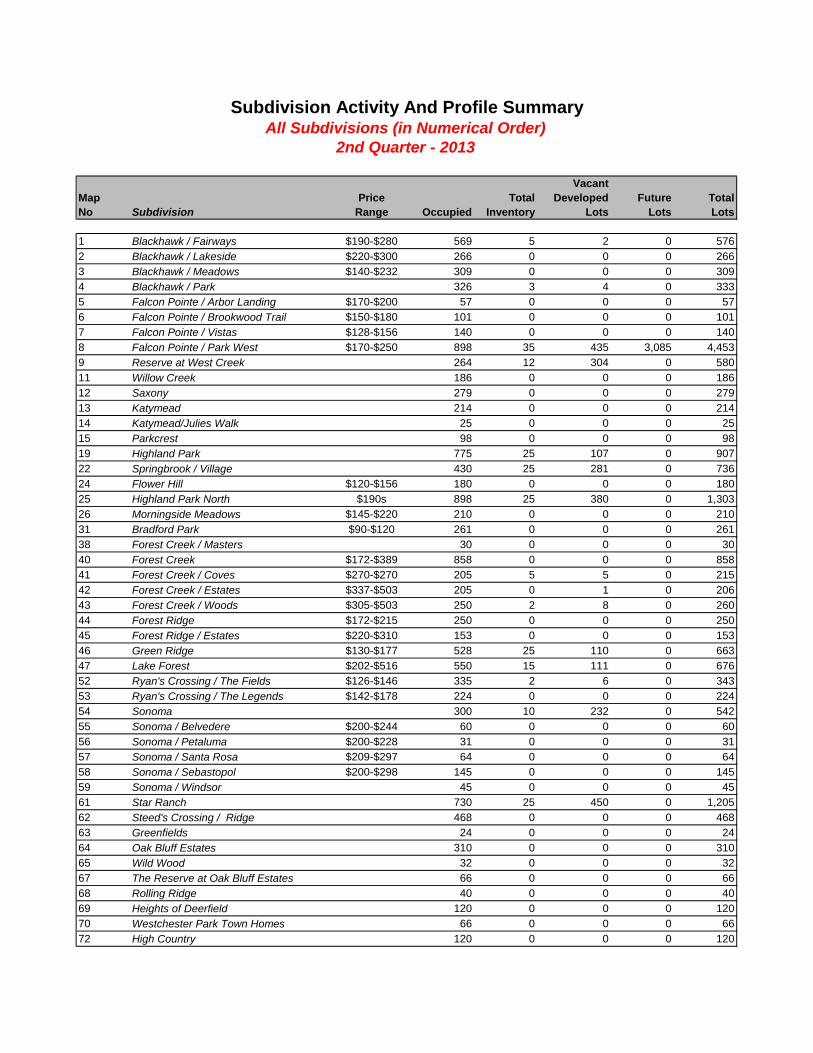
Vacant
Map Price Total Developed Future Total
No Subdivision Range Occupied Inventory Lots Lots Lots
1 Blackhawk / Fairways $190-$280 569 5 2 0 576
2 Blackhawk / Lakeside $220-$300 266 0 0 0 266
3 Blackhawk / Meadows $140-$232 309 0 0 0 309
4 Blackhawk / Park 326 3 4 0 333
5 Falcon Pointe / Arbor Landing $170-$200 57 0 0 0 57
6 Falcon Pointe / Brookwood Trail $150-$180 101 0 0 0 101
7 Falcon Pointe / Vistas $128-$156 140 0 0 0 140
8 Falcon Pointe / Park West $170-$250 898 35 435 3,085 4,453
9 Reserve at West Creek 264 12 304 0 580
11 Willow Creek 186 0 0 0 186
12 Saxony 279 0 0 0 279
13 Katymead 214 0 0 0 214
14 Katymead/Julies Walk 25 0 0 0 25
15 Parkcrest 98 0 0 0 98
19 Highland Park 775 25 107 0 907
22 Springbrook / Village 430 25 281 0 736
24 Flower Hill $120-$156 180 0 0 0 180
25 Highland Park North $190s 898 25 380 0 1,303
26 Morningside Meadows $145-$220 210 0 0 0 210
31 Bradford Park $90-$120 261 0 0 0 261
38 Forest Creek / Masters 30 0 0 0 30
40 Forest Creek $172-$389 858 0 0 0 858
41 Forest Creek / Coves $270-$270 205 5 5 0 215
42 Forest Creek / Estates $337-$503 205 0 1 0 206
43 Forest Creek / Woods $305-$503 250 2 8 0 260
44 Forest Ridge $172-$215 250 0 0 0 250
45 Forest Ridge / Estates $220-$310 153 0 0 0 153
46 Green Ridge $130-$177 528 25 110 0 663
47 Lake Forest $202-$516 550 15 111 0 676
52 Ryan's Crossing / The Fields $126-$146 335 2 6 0 343
53 Ryan's Crossing / The Legends $142-$178 224 0 0 0 224
54 Sonoma 300 10 232 0 542
55 Sonoma / Belvedere $200-$244 60 0 0 0 60
56 Sonoma / Petaluma $200-$228 31 0 0 0 31
57 Sonoma / Santa Rosa $209-$297 64 0 0 0 64
58 Sonoma / Sebastopol $200-$298 145 0 0 0 145
59 Sonoma / Windsor 45 0 0 0 45
61 Star Ranch 730 25 450 0 1,205
62 Steed's Crossing / Ridge 468 0 0 0 468
63 Greenfields 24 0 0 0 24
64 Oak Bluff Estates 310 0 0 0 310
65 Wild Wood 32 0 0 0 32
67 The Reserve at Oak Bluff Estates 66 0 0 0 66
68 Rolling Ridge 40 0 0 0 40
69 Heights of Deerfield 120 0 0 0 120
70 Westchester Park Town Homes 66 0 0 0 66
72 High Country 120 0 0 0 120
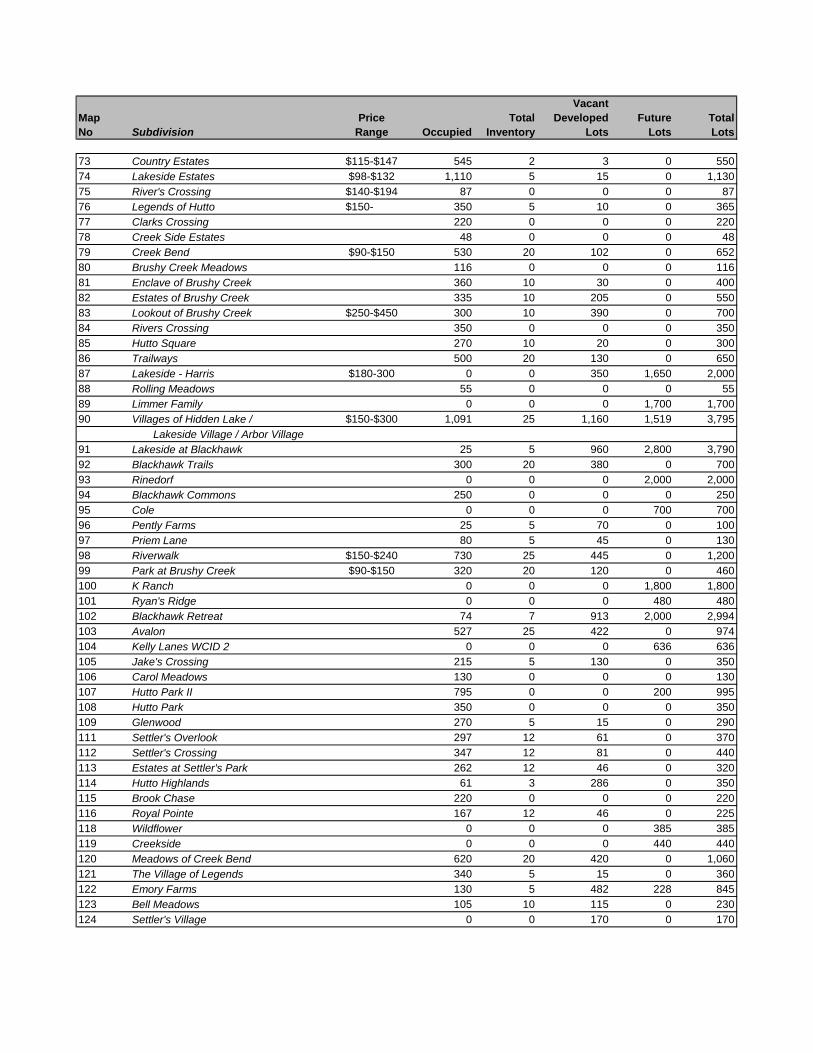
Subdivision Activity And Profile SummaryAll Subdivisions (in Numerical Order)
2nd Quarter - 2013
Vacant
Map Price Total Developed Future Total
No Subdivision Range Occupied Inventory Lots Lots Lots
73 Country Estates $115-$147 545 2 3 0 550
74 Lakeside Estates $98-$132 1,110 5 15 0 1,130
75 River's Crossing $140-$194 87 0 0 0 87
76 Legends of Hutto $150- 350 5 10 0 365
77 Clarks Crossing 220 0 0 0 220
78 Creek Side Estates 48 0 0 0 48
79 Creek Bend $90-$150 530 20 102 0 652
80 Brushy Creek Meadows 116 0 0 0 116
81 Enclave of Brushy Creek 360 10 30 0 400
82 Estates of Brushy Creek 335 10 205 0 550
83 Lookout of Brushy Creek $250-$450 300 10 390 0 700
84 Rivers Crossing 350 0 0 0 350
85 Hutto Square 270 10 20 0 300
86 Trailways 500 20 130 0 650
87 Lakeside - Harris $180-300 0 0 350 1,650 2,000
88 Rolling Meadows 55 0 0 0 55
89 Limmer Family 0 0 0 1,700 1,700
90 Villages of Hidden Lake / $150-$300 1,091 25 1,160 1,519 3,795
Lakeside Village / Arbor Village
91 Lakeside at Blackhawk 25 5 960 2,800 3,790
92 Blackhawk Trails 300 20 380 0 700
93 Rinedorf 0 0 0 2,000 2,000
94 Blackhawk Commons 250 0 0 0 250
95 Cole 0 0 0 700 700
96 Pently Farms 25 5 70 0 100
97 Priem Lane 80 5 45 0 130
98 Riverwalk $150-$240 730 25 445 0 1,200
99 Park at Brushy Creek $90-$150 320 20 120 0 460
100 K Ranch 0 0 0 1,800 1,800
101 Ryan's Ridge 0 0 0 480 480
102 Blackhawk Retreat 74 7 913 2,000 2,994
103 Avalon 527 25 422 0 974
104 Kelly Lanes WCID 2 0 0 0 636 636
105 Jake's Crossing 215 5 130 0 350
106 Carol Meadows 130 0 0 0 130
107 Hutto Park II 795 0 0 200 995
108 Hutto Park 350 0 0 0 350
109 Glenwood 270 5 15 0 290
111 Settler's Overlook 297 12 61 0 370
112 Settler's Crossing 347 12 81 0 440
113 Estates at Settler's Park 262 12 46 0 320
114 Hutto Highlands 61 3 286 0 350
115 Brook Chase 220 0 0 0 220
116 Royal Pointe 167 12 46 0 225
118 Wildflower 0 0 0 385 385
119 Creekside 0 0 0 440 440
120 Meadows of Creek Bend 620 20 420 0 1,060
121 The Village of Legends 340 5 15 0 360
122 Emory Farms 130 5 482 228 845
123 Bell Meadows 105 10 115 0 230
124 Settler's Village 0 0 170 0 170
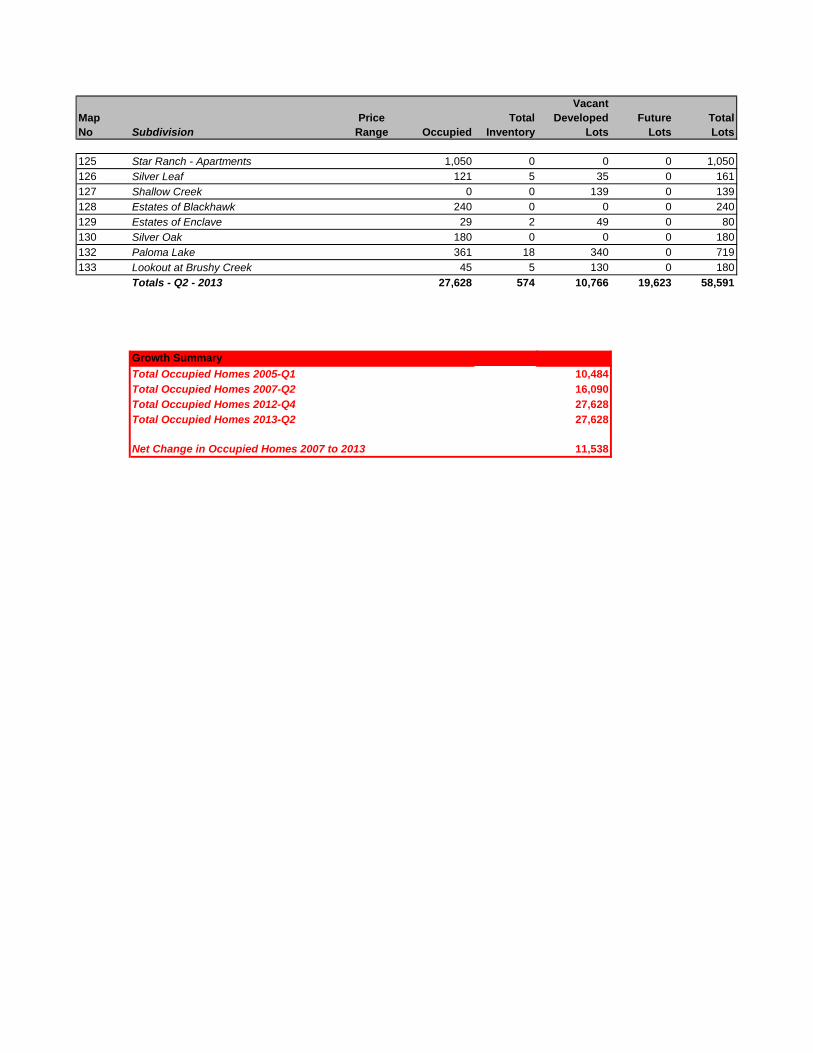
Vacant
Map Price Total Developed Future Total
No Subdivision Range Occupied Inventory Lots Lots Lots
125 Star Ranch - Apartments 1,050 0 0 0 1,050
126 Silver Leaf 121 5 35 0 161
127 Shallow Creek 0 0 139 0 139
128 Estates of Blackhawk 240 0 0 0 240
129 Estates of Enclave 29 2 49 0 80
130 Silver Oak 180 0 0 0 180
132 Paloma Lake 361 18 340 0 719
133 Lookout at Brushy Creek 45 5 130 0 180
Totals - Q2 - 2013 27,628 574 10,766 19,623 58,591
Growth Summary
Total Occupied Homes 2005-Q1 10,484
Total Occupied Homes 2007-Q2 16,090
Total Occupied Homes 2012-Q4 27,628
Total Occupied Homes 2013-Q2 27,628
Net Change in Occupied Homes 2007 to 2013 11,538
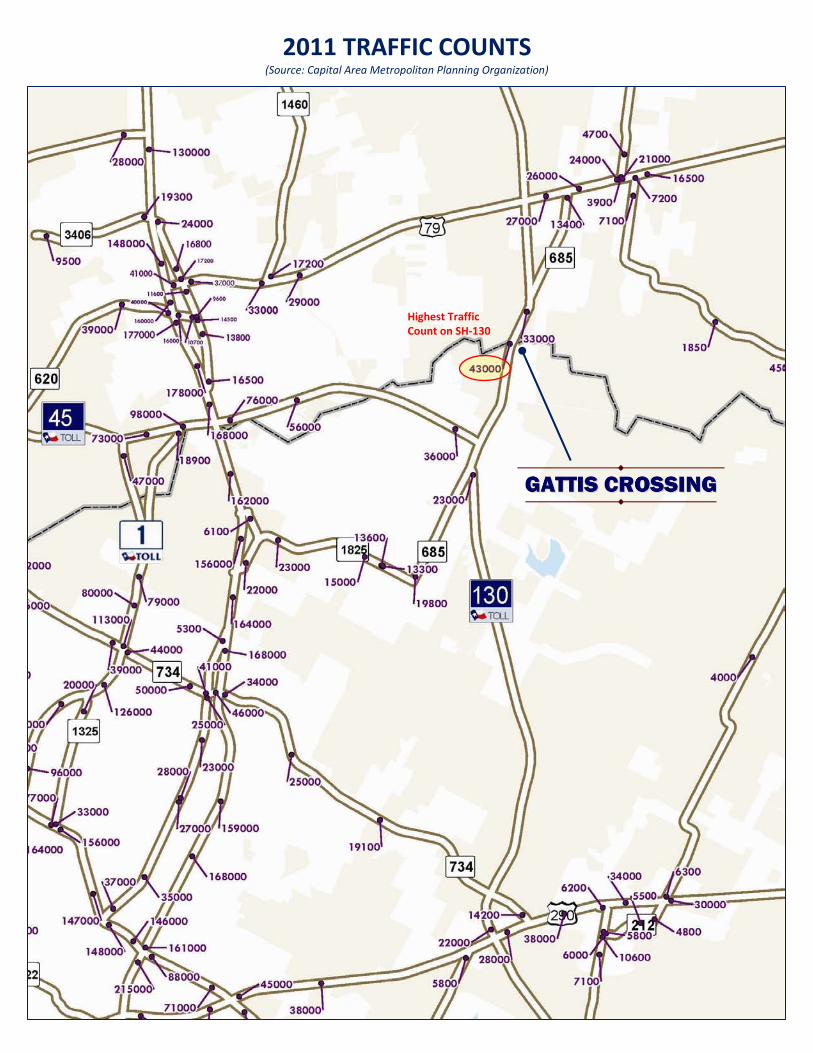
2011 TRAFFIC COUNTS (Source: Capital Area Metropolitan Planning Organization)
Highest Traffic Count on SH-130

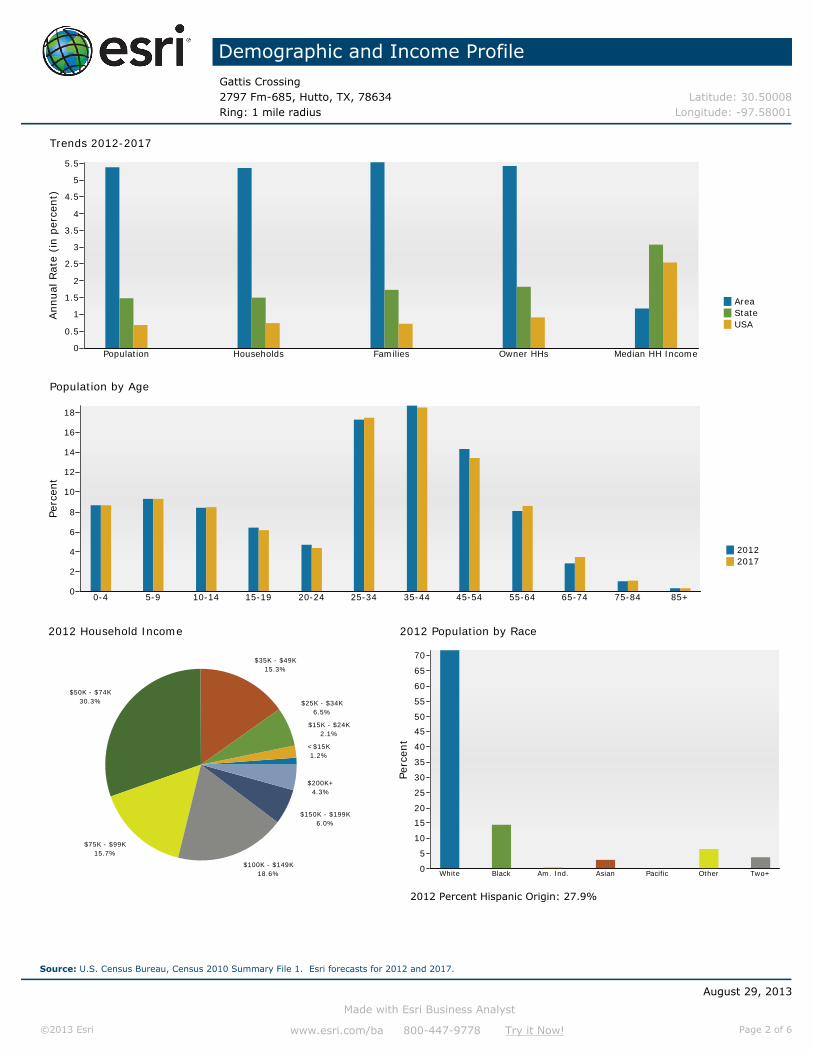
Demographic and Income ProfileGattis Crossing2797 Fm-685, Hutto, TX, 78634 Latitude: 30.50008Ring: 1 mile radius Longitude: -97.58001
Summary Census 2010 2012 2017Population 4,570 5,504 7,150Households 1,554 1,850 2,401Families 1,228 1,443 1,889Average Household Size 2.94 2.98 2.98Owner Occupied Housing Units 1,226 1,423 1,852Renter Occupied Housing Units 328 427 549Median Age 32.5 32.6 32.8
Trends: 2012 - 2017 Annual Rate Area State NationalPopulation 5.37% 1.49% 0.68%Households 5.35% 1.51% 0.74%Families 5.53% 1.73% 0.72%Owner HHs 5.41% 1.82% 0.91%Median Household Income 1.18% 3.07% 2.55%
2012 2017 Households by Income Number Percent Number Percent
<$15,000 22 1.2% 23 1.0%$15,000 - $24,999 38 2.1% 32 1.3%$25,000 - $34,999 121 6.5% 95 4.0%$35,000 - $49,999 283 15.3% 263 11.0%$50,000 - $74,999 560 30.3% 835 34.8%$75,000 - $99,999 291 15.7% 451 18.8%$100,000 - $149,999 344 18.6% 461 19.2%$150,000 - $199,999 111 6.0% 136 5.7%$200,000+ 79 4.3% 104 4.3%
Median Household Income $68,605 $72,757Average Household Income $88,503 $94,721Per Capita Income $30,401 $32,661
Census 2010 2012 2017 Population by Age Number Percent Number Percent Number Percent
0 - 4 404 8.8% 479 8.7% 623 8.7%5 - 9 427 9.3% 511 9.3% 665 9.3%10 - 14 396 8.7% 464 8.4% 609 8.5%15 - 19 309 6.8% 354 6.4% 441 6.2%20 - 24 205 4.5% 260 4.7% 315 4.4%25 - 34 771 16.9% 951 17.3% 1,250 17.5%35 - 44 872 19.1% 1,030 18.7% 1,324 18.5%45 - 54 663 14.5% 786 14.3% 958 13.4%55 - 64 346 7.6% 444 8.1% 615 8.6%
65 - 74 121 2.6% 156 2.8% 249 3.5%75 - 84 43 0.9% 54 1.0% 79 1.1%
85+ 12 0.3% 16 0.3% 22 0.3%Census 2010 2012 2017
Race and Ethnicity Number Percent Number Percent Number PercentWhite Alone 3,270 71.6% 3,945 71.7% 4,973 69.6%Black Alone 671 14.7% 796 14.5% 1,111 15.5%American Indian Alone 25 0.5% 30 0.5% 44 0.6%Asian Alone 138 3.0% 164 3.0% 234 3.3%Pacific Islander Alone 5 0.1% 6 0.1% 10 0.1%Some Other Race Alone 286 6.3% 351 6.4% 487 6.8%Two or More Races 175 3.8% 210 3.8% 291 4.1%
Hispanic Origin (Any Race) 1,265 27.7% 1,538 27.9% 2,194 30.7%Data Note: Income is expressed in current dollars.
August 29, 2013
Made with Esri Business Analyst
©2013 Esri www.esri.com/ba 800-447-9778 Try it Now! Page 1 of 6
Source: U.S. Census Bureau, Census 2010 Summary File 1. Esri forecasts for 2012 and 2017.
Demographic and Income ProfileGattis Crossing2797 Fm-685, Hutto, TX, 78634 Latitude: 30.50008Ring: 1 mile radius Longitude: -97.58001
AreaStateUSA
Trends 2012-2017
Population Households Families Owner HHs Median HH Income
Annual
Rat
e (i
n p
erce
nt)
5.5
5
4.5
4
3.5
3
2.5
2
1.5
1
0.5
0
20122017
Population by Age
0-4 5-9 10-14 15-19 20-24 25-34 35-44 45-54 55-64 65-74 75-84 85+
Per
cent
18
16
14
12
10
8
6
4
2
0
2012 Household Income
<$15K1.2%
$15K - $24K2.1%
$25K - $34K6.5%
$35K - $49K15.3%
$50K - $74K30.3%
$75K - $99K15.7%
$100K - $149K18.6%
$150K - $199K6.0%
$200K+4.3%
2012 Population by Race
White Black Am. Ind. Asian Pacific Other Two+
Perc
ent
70
65
60
55
50
45
40
35
30
25
20
15
10
5
0
2012 Percent Hispanic Origin: 27.9%
August 29, 2013
Made with Esri Business Analyst
©2013 Esri www.esri.com/ba 800-447-9778 Try it Now! Page 2 of 6
Source: U.S. Census Bureau, Census 2010 Summary File 1. Esri forecasts for 2012 and 2017.
Demographic and Income ProfileGattis Crossing2797 Fm-685, Hutto, TX, 78634 Latitude: 30.50008Ring: 3 mile radius Longitude: -97.58001
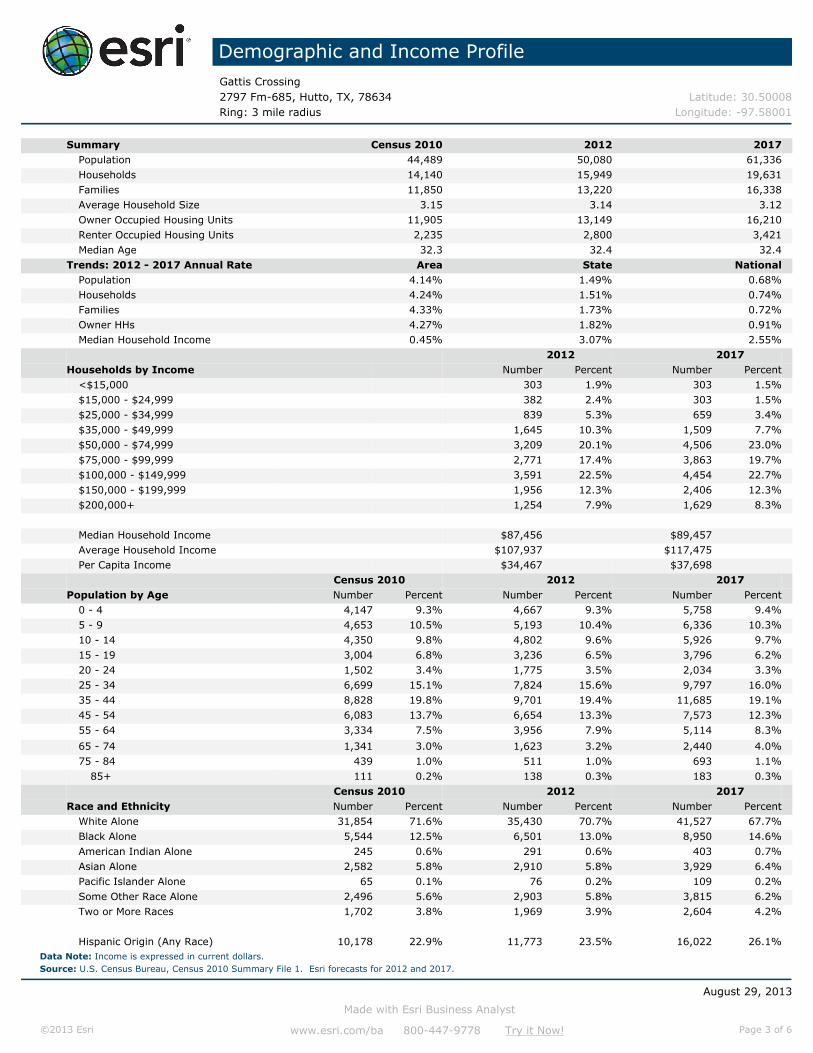
Summary Census 2010 2012 2017Population 44,489 50,080 61,336Households 14,140 15,949 19,631Families 11,850 13,220 16,338Average Household Size 3.15 3.14 3.12Owner Occupied Housing Units 11,905 13,149 16,210Renter Occupied Housing Units 2,235 2,800 3,421Median Age 32.3 32.4 32.4
Trends: 2012 - 2017 Annual Rate Area State NationalPopulation 4.14% 1.49% 0.68%Households 4.24% 1.51% 0.74%Families 4.33% 1.73% 0.72%Owner HHs 4.27% 1.82% 0.91%Median Household Income 0.45% 3.07% 2.55%
2012 2017 Households by Income Number Percent Number Percent
<$15,000 303 1.9% 303 1.5%$15,000 - $24,999 382 2.4% 303 1.5%$25,000 - $34,999 839 5.3% 659 3.4%$35,000 - $49,999 1,645 10.3% 1,509 7.7%$50,000 - $74,999 3,209 20.1% 4,506 23.0%$75,000 - $99,999 2,771 17.4% 3,863 19.7%$100,000 - $149,999 3,591 22.5% 4,454 22.7%$150,000 - $199,999 1,956 12.3% 2,406 12.3%$200,000+ 1,254 7.9% 1,629 8.3%
Median Household Income $87,456 $89,457Average Household Income $107,937 $117,475Per Capita Income $34,467 $37,698
Census 2010 2012 2017 Population by Age Number Percent Number Percent Number Percent
0 - 4 4,147 9.3% 4,667 9.3% 5,758 9.4%5 - 9 4,653 10.5% 5,193 10.4% 6,336 10.3%10 - 14 4,350 9.8% 4,802 9.6% 5,926 9.7%15 - 19 3,004 6.8% 3,236 6.5% 3,796 6.2%20 - 24 1,502 3.4% 1,775 3.5% 2,034 3.3%25 - 34 6,699 15.1% 7,824 15.6% 9,797 16.0%35 - 44 8,828 19.8% 9,701 19.4% 11,685 19.1%45 - 54 6,083 13.7% 6,654 13.3% 7,573 12.3%55 - 64 3,334 7.5% 3,956 7.9% 5,114 8.3%
65 - 74 1,341 3.0% 1,623 3.2% 2,440 4.0%75 - 84 439 1.0% 511 1.0% 693 1.1%
85+ 111 0.2% 138 0.3% 183 0.3%Census 2010 2012 2017
Race and Ethnicity Number Percent Number Percent Number PercentWhite Alone 31,854 71.6% 35,430 70.7% 41,527 67.7%Black Alone 5,544 12.5% 6,501 13.0% 8,950 14.6%American Indian Alone 245 0.6% 291 0.6% 403 0.7%Asian Alone 2,582 5.8% 2,910 5.8% 3,929 6.4%Pacific Islander Alone 65 0.1% 76 0.2% 109 0.2%Some Other Race Alone 2,496 5.6% 2,903 5.8% 3,815 6.2%Two or More Races 1,702 3.8% 1,969 3.9% 2,604 4.2%
Hispanic Origin (Any Race) 10,178 22.9% 11,773 23.5% 16,022 26.1%Data Note: Income is expressed in current dollars.
August 29, 2013
Made with Esri Business Analyst
©2013 Esri www.esri.com/ba 800-447-9778 Try it Now! Page 3 of 6
Source: U.S. Census Bureau, Census 2010 Summary File 1. Esri forecasts for 2012 and 2017.
Demographic and Income ProfileGattis Crossing2797 Fm-685, Hutto, TX, 78634 Latitude: 30.50008Ring: 3 mile radius Longitude: -97.58001
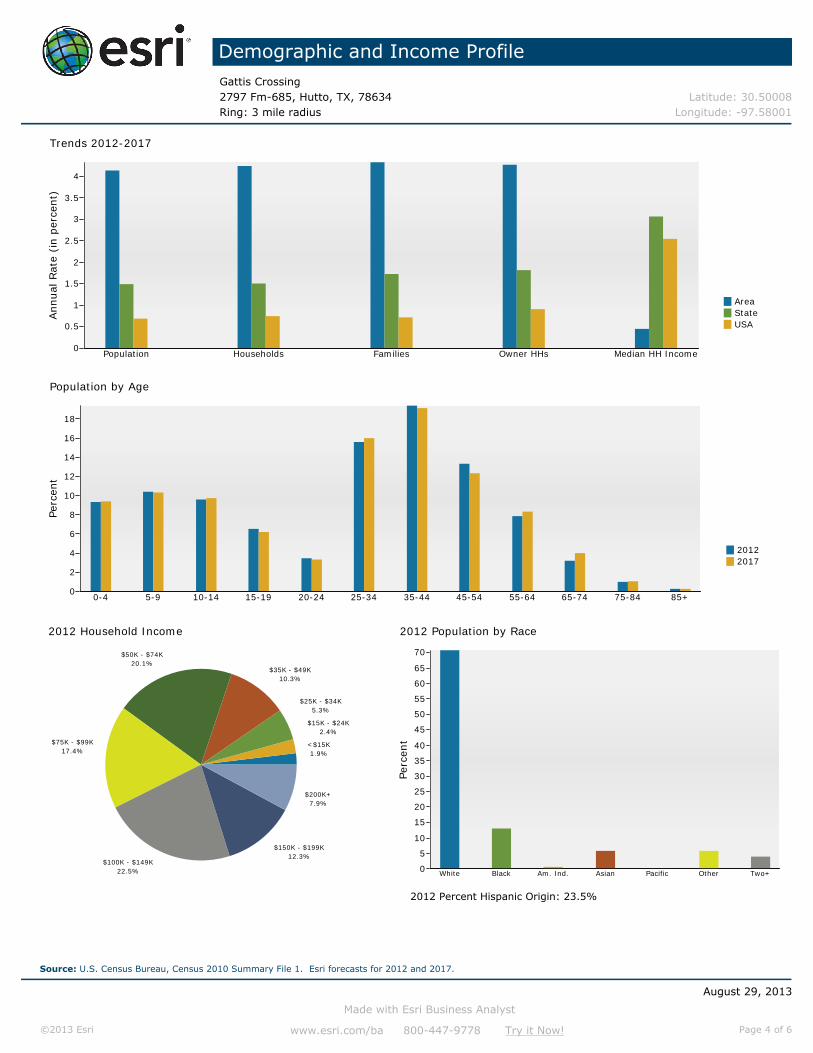
AreaStateUSA
Trends 2012-2017
Population Households Families Owner HHs Median HH Income
Annual
Rat
e (i
n p
erce
nt)
4
3.5
3
2.5
2
1.5
1
0.5
0
20122017
Population by Age
0-4 5-9 10-14 15-19 20-24 25-34 35-44 45-54 55-64 65-74 75-84 85+
Per
cent
18
16
14
12
10
8
6
4
2
0
2012 Household Income
<$15K1.9%
$15K - $24K2.4%
$25K - $34K5.3%
$35K - $49K10.3%
$50K - $74K20.1%
$75K - $99K17.4%
$100K - $149K22.5%
$150K - $199K12.3%
$200K+7.9%
2012 Population by Race
White Black Am. Ind. Asian Pacific Other Two+
Perc
ent
70
65
60
55
50
45
40
35
30
25
20
15
10
5
0
2012 Percent Hispanic Origin: 23.5%
August 29, 2013
Made with Esri Business Analyst
©2013 Esri www.esri.com/ba 800-447-9778 Try it Now! Page 4 of 6
Source: U.S. Census Bureau, Census 2010 Summary File 1. Esri forecasts for 2012 and 2017.
Demographic and Income ProfileGattis Crossing2797 Fm-685, Hutto, TX, 78634 Latitude: 30.50008Ring: 5 mile radius Longitude: -97.58001
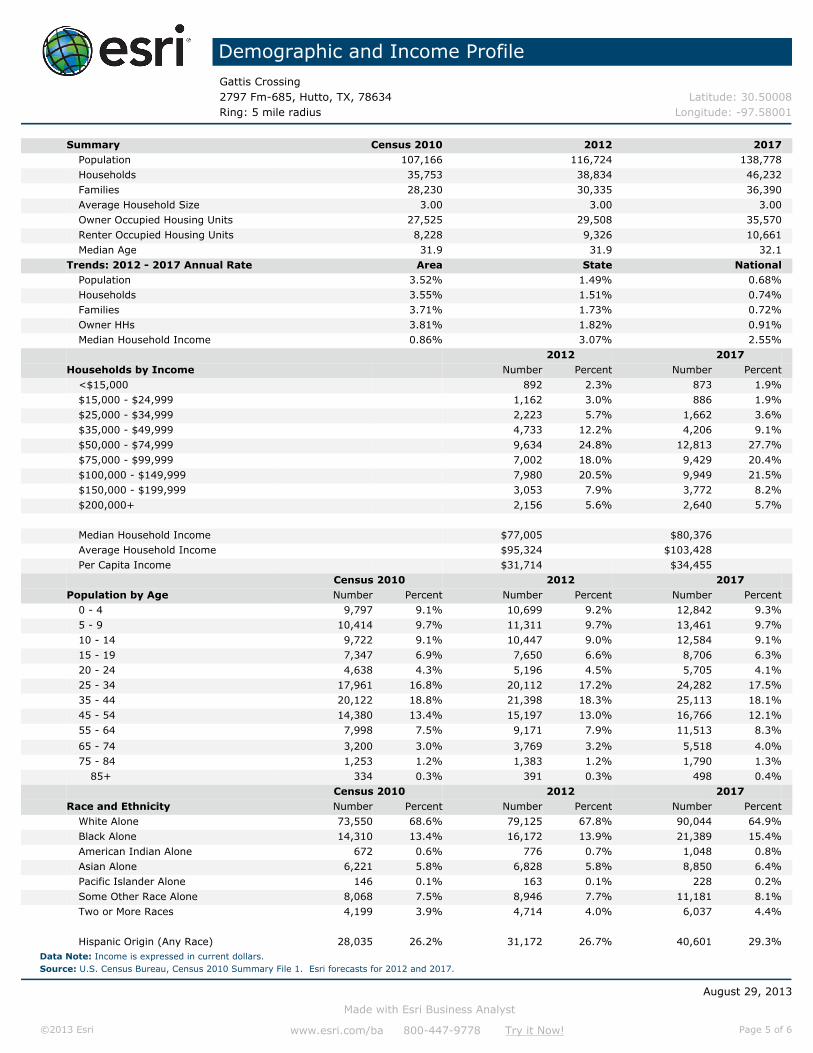
Summary Census 2010 2012 2017Population 107,166 116,724 138,778Households 35,753 38,834 46,232Families 28,230 30,335 36,390Average Household Size 3.00 3.00 3.00Owner Occupied Housing Units 27,525 29,508 35,570Renter Occupied Housing Units 8,228 9,326 10,661Median Age 31.9 31.9 32.1
Trends: 2012 - 2017 Annual Rate Area State NationalPopulation 3.52% 1.49% 0.68%Households 3.55% 1.51% 0.74%Families 3.71% 1.73% 0.72%Owner HHs 3.81% 1.82% 0.91%Median Household Income 0.86% 3.07% 2.55%
2012 2017 Households by Income Number Percent Number Percent
<$15,000 892 2.3% 873 1.9%$15,000 - $24,999 1,162 3.0% 886 1.9%$25,000 - $34,999 2,223 5.7% 1,662 3.6%$35,000 - $49,999 4,733 12.2% 4,206 9.1%$50,000 - $74,999 9,634 24.8% 12,813 27.7%$75,000 - $99,999 7,002 18.0% 9,429 20.4%$100,000 - $149,999 7,980 20.5% 9,949 21.5%$150,000 - $199,999 3,053 7.9% 3,772 8.2%$200,000+ 2,156 5.6% 2,640 5.7%
Median Household Income $77,005 $80,376Average Household Income $95,324 $103,428Per Capita Income $31,714 $34,455
Census 2010 2012 2017 Population by Age Number Percent Number Percent Number Percent
0 - 4 9,797 9.1% 10,699 9.2% 12,842 9.3%5 - 9 10,414 9.7% 11,311 9.7% 13,461 9.7%10 - 14 9,722 9.1% 10,447 9.0% 12,584 9.1%15 - 19 7,347 6.9% 7,650 6.6% 8,706 6.3%20 - 24 4,638 4.3% 5,196 4.5% 5,705 4.1%25 - 34 17,961 16.8% 20,112 17.2% 24,282 17.5%35 - 44 20,122 18.8% 21,398 18.3% 25,113 18.1%45 - 54 14,380 13.4% 15,197 13.0% 16,766 12.1%55 - 64 7,998 7.5% 9,171 7.9% 11,513 8.3%
65 - 74 3,200 3.0% 3,769 3.2% 5,518 4.0%75 - 84 1,253 1.2% 1,383 1.2% 1,790 1.3%
85+ 334 0.3% 391 0.3% 498 0.4%Census 2010 2012 2017
Race and Ethnicity Number Percent Number Percent Number PercentWhite Alone 73,550 68.6% 79,125 67.8% 90,044 64.9%Black Alone 14,310 13.4% 16,172 13.9% 21,389 15.4%American Indian Alone 672 0.6% 776 0.7% 1,048 0.8%Asian Alone 6,221 5.8% 6,828 5.8% 8,850 6.4%Pacific Islander Alone 146 0.1% 163 0.1% 228 0.2%Some Other Race Alone 8,068 7.5% 8,946 7.7% 11,181 8.1%Two or More Races 4,199 3.9% 4,714 4.0% 6,037 4.4%
Hispanic Origin (Any Race) 28,035 26.2% 31,172 26.7% 40,601 29.3%Data Note: Income is expressed in current dollars.
August 29, 2013
Made with Esri Business Analyst
©2013 Esri www.esri.com/ba 800-447-9778 Try it Now! Page 5 of 6
Source: U.S. Census Bureau, Census 2010 Summary File 1. Esri forecasts for 2012 and 2017.
Demographic and Income ProfileGattis Crossing2797 Fm-685, Hutto, TX, 78634 Latitude: 30.50008Ring: 5 mile radius Longitude: -97.58001
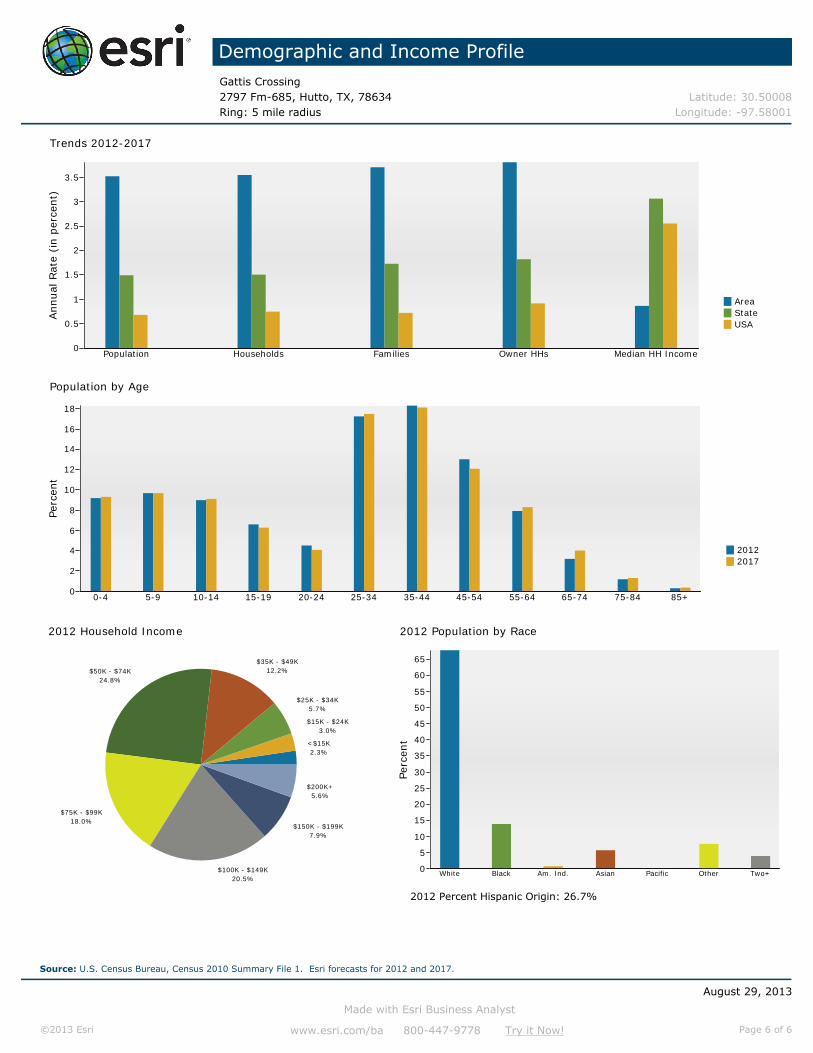
AreaStateUSA
Trends 2012-2017
Population Households Families Owner HHs Median HH Income
Annual
Rat
e (i
n p
erce
nt)
3.5
3
2.5
2
1.5
1
0.5
0
20122017
Population by Age
0-4 5-9 10-14 15-19 20-24 25-34 35-44 45-54 55-64 65-74 75-84 85+
Per
cent
18
16
14
12
10
8
6
4
2
0
2012 Household Income
<$15K2.3%
$15K - $24K3.0%
$25K - $34K5.7%
$35K - $49K12.2%$50K - $74K
24.8%
$75K - $99K18.0%
$100K - $149K20.5%
$150K - $199K7.9%
$200K+5.6%
2012 Population by Race
White Black Am. Ind. Asian Pacific Other Two+
Perc
ent
65
60
55
50
45
40
35
30
25
20
15
10
5
0
2012 Percent Hispanic Origin: 26.7%
August 29, 2013
Made with Esri Business Analyst
©2013 Esri www.esri.com/ba 800-447-9778 Try it Now! Page 6 of 6
Source: U.S. Census Bureau, Census 2010 Summary File 1. Esri forecasts for 2012 and 2017.
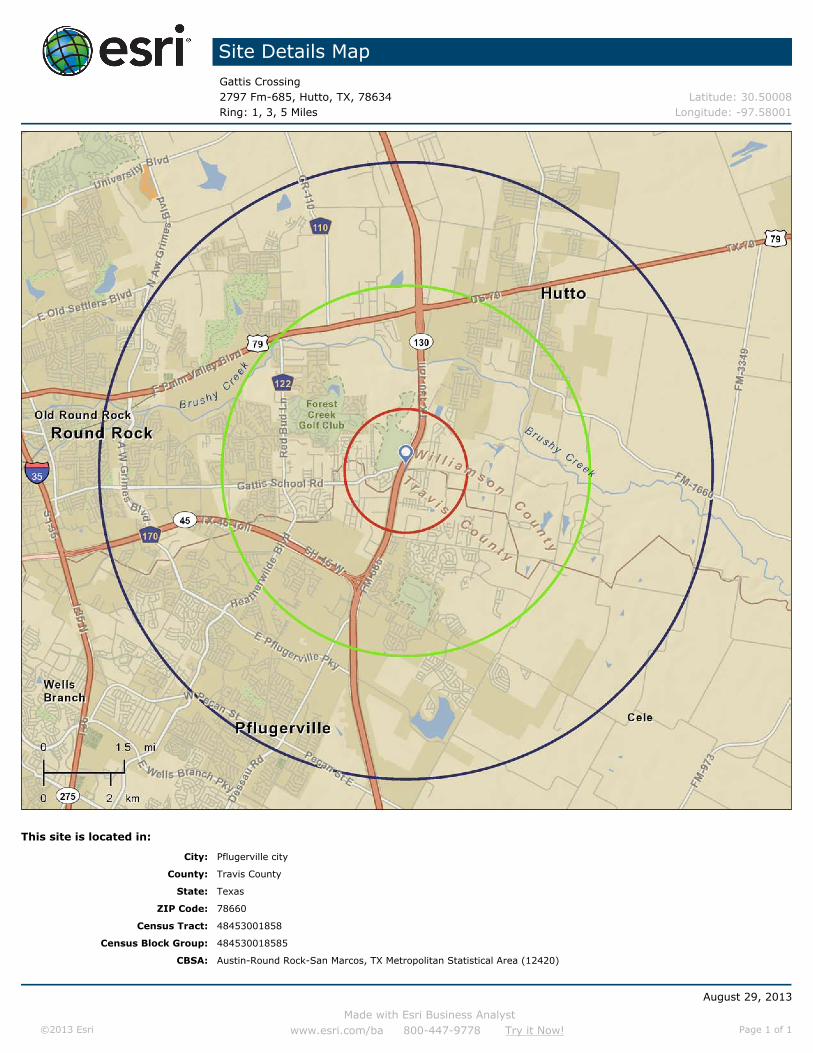
Site Details MapGattis Crossing2797 Fm-685, Hutto, TX, 78634 Latitude: 30.50008Ring: 1, 3, 5 Miles Longitude: -97.58001
This site is located in:
City: Pflugerville city
County: Travis County
State: Texas
ZIP Code: 78660
Census Tract: 48453001858
Census Block Group: 484530018585
CBSA: Austin-Round Rock-San Marcos, TX Metropolitan Statistical Area (12420)
August 29, 2013
Made with Esri Business Analyst©2013 Esri www.esri.com/ba 800-447-9778 Try it Now! Page 1 of 1
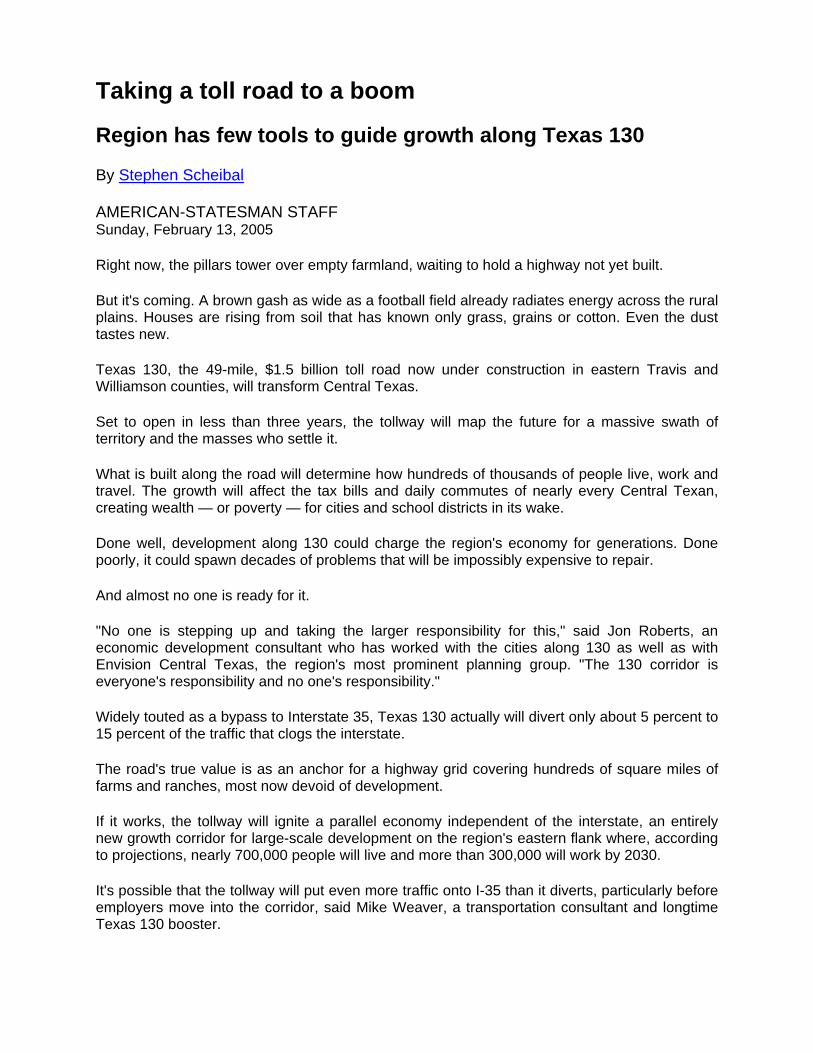
Taking a toll road to a boom
Region has few tools to guide growth along Texas 130
By Stephen Scheibal
AMERICAN-STATESMAN STAFF Sunday, February 13, 2005
Right now, the pillars tower over empty farmland, waiting to hold a highway not yet built.
But it's coming. A brown gash as wide as a football field already radiates energy across the rural plains. Houses are rising from soil that has known only grass, grains or cotton. Even the dust tastes new.
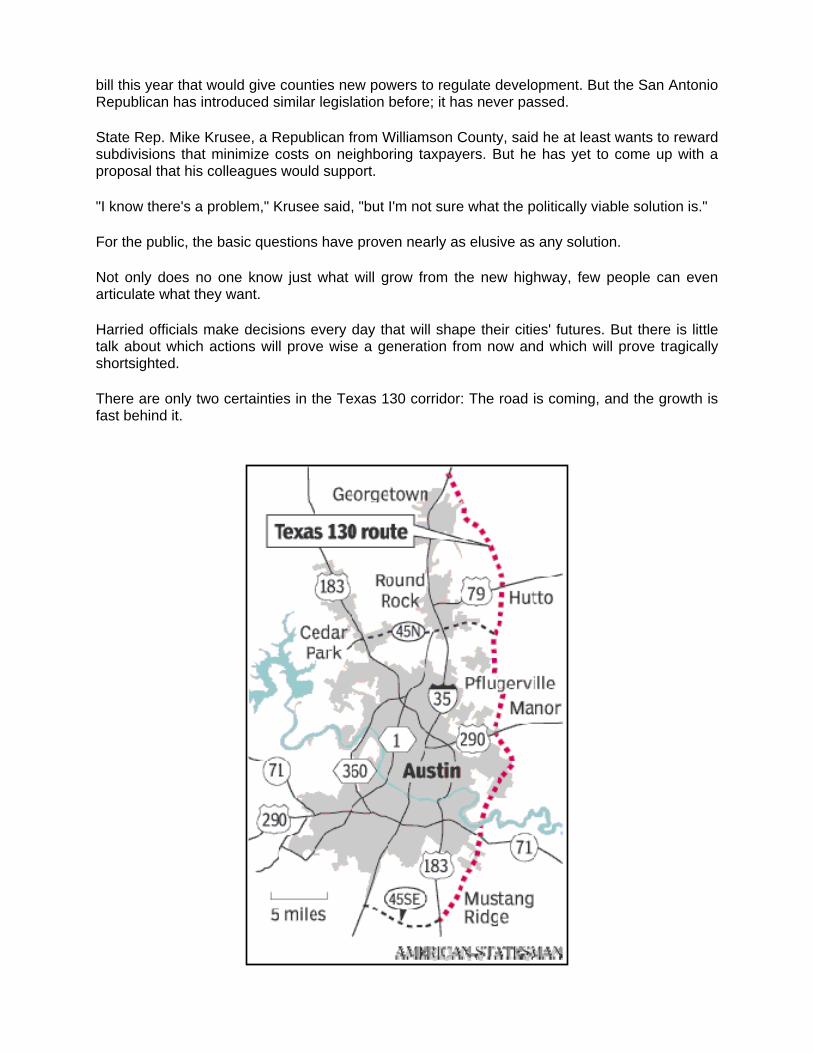
Texas 130, the 49-mile, $1.5 billion toll road now under construction in eastern Travis and Williamson counties, will transform Central Texas.
Set to open in less than three years, the tollway will map the future for a massive swath of territory and the masses who settle it.
What is built along the road will determine how hundreds of thousands of people live, work and travel. The growth will affect the tax bills and daily commutes of nearly every Central Texan, creating wealth — or poverty — for cities and school districts in its wake.
Done well, development along 130 could charge the region's economy for generations. Done poorly, it could spawn decades of problems that will be impossibly expensive to repair.
And almost no one is ready for it.
"No one is stepping up and taking the larger responsibility for this," said Jon Roberts, an economic development consultant who has worked with the cities along 130 as well as with Envision Central Texas, the region's most prominent planning group. "The 130 corridor is everyone's responsibility and no one's responsibility."
Widely touted as a bypass to Interstate 35, Texas 130 actually will divert only about 5 percent to 15 percent of the traffic that clogs the interstate.
The road's true value is as an anchor for a highway grid covering hundreds of square miles of farms and ranches, most now devoid of development.
If it works, the tollway will ignite a parallel economy independent of the interstate, an entirely new growth corridor for large-scale development on the region's eastern flank where, according to projections, nearly 700,000 people will live and more than 300,000 will work by 2030.
It's possible that the tollway will put even more traffic onto I-35 than it diverts, particularly before employers move into the corridor, said Mike Weaver, a transportation consultant and longtime Texas 130 booster.
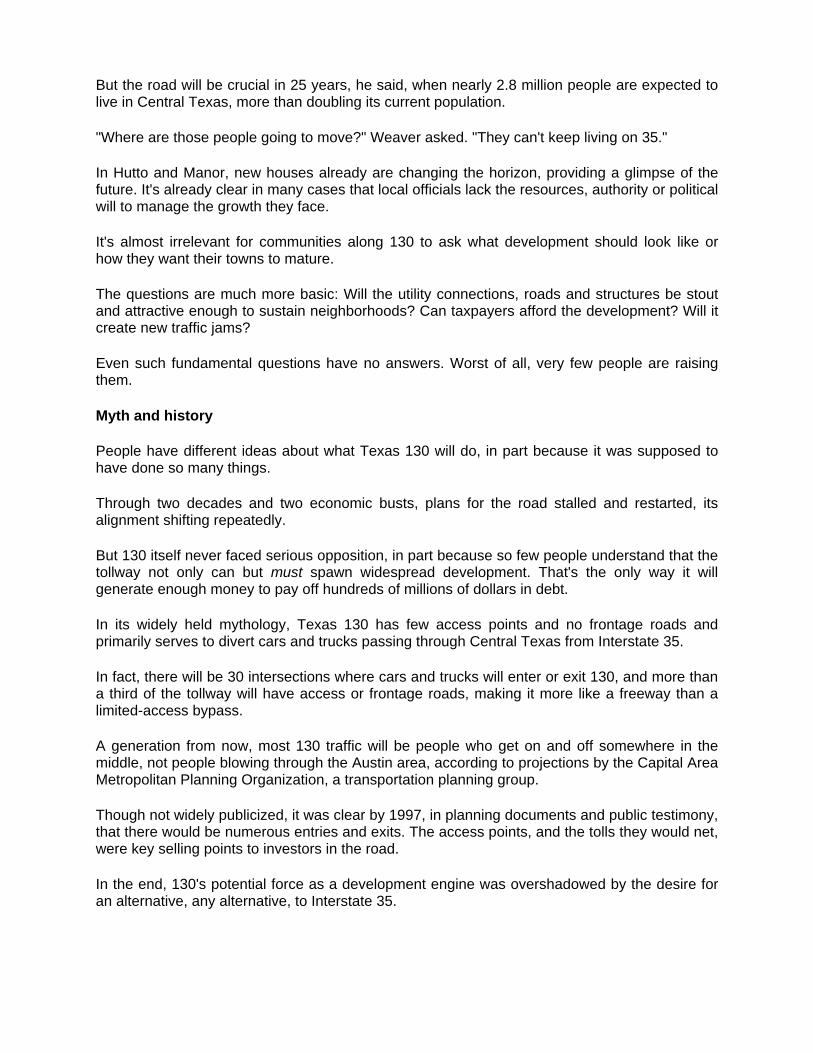
But the road will be crucial in 25 years, he said, when nearly 2.8 million people are expected to live in Central Texas, more than doubling its current population.
"Where are those people going to move?" Weaver asked. "They can't keep living on 35."
In Hutto and Manor, new houses already are changing the horizon, providing a glimpse of the future. It's already clear in many cases that local officials lack the resources, authority or political will to manage the growth they face.
It's almost irrelevant for communities along 130 to ask what development should look like or how they want their towns to mature.
The questions are much more basic: Will the utility connections, roads and structures be stout and attractive enough to sustain neighborhoods? Can taxpayers afford the development? Will it create new traffic jams?
Even such fundamental questions have no answers. Worst of all, very few people are raising them.
Myth and history
People have different ideas about what Texas 130 will do, in part because it was supposed to have done so many things.
Through two decades and two economic busts, plans for the road stalled and restarted, its alignment shifting repeatedly.
But 130 itself never faced serious opposition, in part because so few people understand that the tollway not only can but must spawn widespread development. That's the only way it will generate enough money to pay off hundreds of millions of dollars in debt.
In its widely held mythology, Texas 130 has few access points and no frontage roads and primarily serves to divert cars and trucks passing through Central Texas from Interstate 35.
In fact, there will be 30 intersections where cars and trucks will enter or exit 130, and more than a third of the tollway will have access or frontage roads, making it more like a freeway than a limited-access bypass.
A generation from now, most 130 traffic will be people who get on and off somewhere in the middle, not people blowing through the Austin area, according to projections by the Capital Area Metropolitan Planning Organization, a transportation planning group.
Though not widely publicized, it was clear by 1997, in planning documents and public testimony, that there would be numerous entries and exits. The access points, and the tolls they would net, were key selling points to investors in the road.
In the end, 130's potential force as a development engine was overshadowed by the desire for an alternative, any alternative, to Interstate 35.
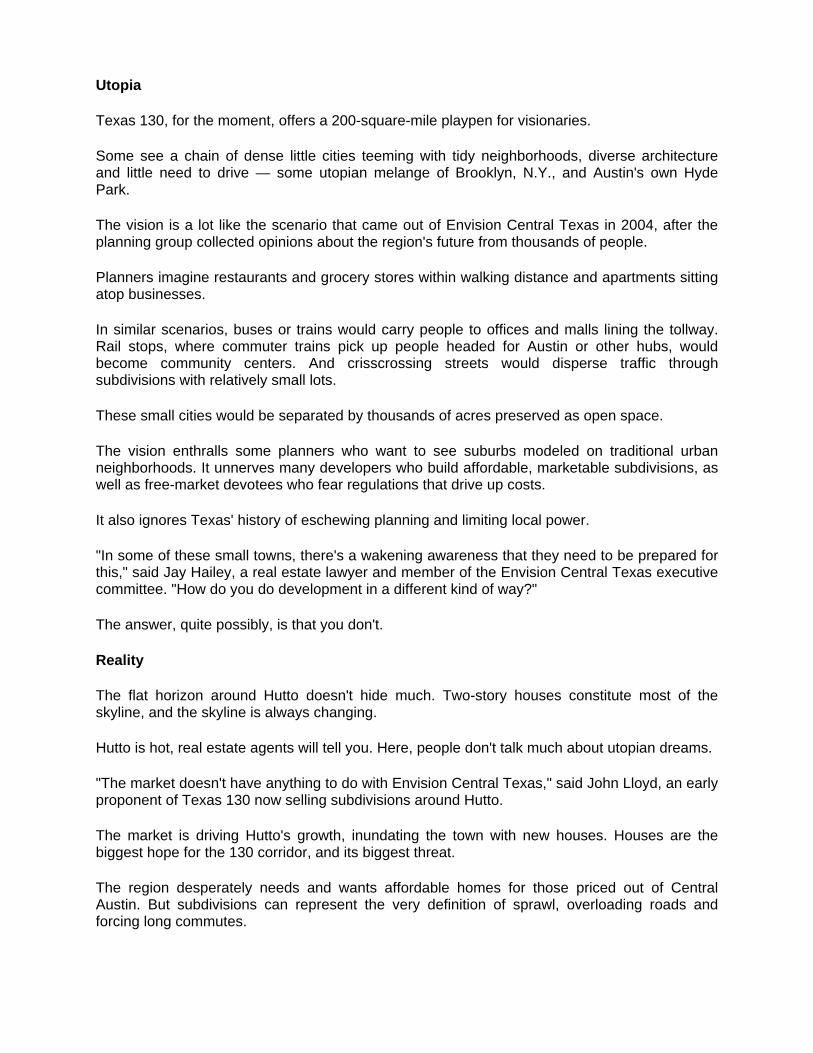
Utopia
Texas 130, for the moment, offers a 200-square-mile playpen for visionaries.
Some see a chain of dense little cities teeming with tidy neighborhoods, diverse architecture and little need to drive — some utopian melange of Brooklyn, N.Y., and Austin's own Hyde Park.
The vision is a lot like the scenario that came out of Envision Central Texas in 2004, after the planning group collected opinions about the region's future from thousands of people.
Planners imagine restaurants and grocery stores within walking distance and apartments sitting atop businesses.
In similar scenarios, buses or trains would carry people to offices and malls lining the tollway. Rail stops, where commuter trains pick up people headed for Austin or other hubs, would become community centers. And crisscrossing streets would disperse traffic through subdivisions with relatively small lots.
These small cities would be separated by thousands of acres preserved as open space.
The vision enthralls some planners who want to see suburbs modeled on traditional urban neighborhoods. It unnerves many developers who build affordable, marketable subdivisions, as well as free-market devotees who fear regulations that drive up costs.
It also ignores Texas' history of eschewing planning and limiting local power.
"In some of these small towns, there's a wakening awareness that they need to be prepared for this," said Jay Hailey, a real estate lawyer and member of the Envision Central Texas executive committee. "How do you do development in a different kind of way?"
The answer, quite possibly, is that you don't.
Reality
The flat horizon around Hutto doesn't hide much. Two-story houses constitute most of the skyline, and the skyline is always changing.
Hutto is hot, real estate agents will tell you. Here, people don't talk much about utopian dreams.
"The market doesn't have anything to do with Envision Central Texas," said John Lloyd, an early proponent of Texas 130 now selling subdivisions around Hutto.
The market is driving Hutto's growth, inundating the town with new houses. Houses are the biggest hope for the 130 corridor, and its biggest threat.
The region desperately needs and wants affordable homes for those priced out of Central Austin. But subdivisions can represent the very definition of sprawl, overloading roads and forcing long commutes.
An excess of houses drains the finances of cities and school districts, eating up land that would support dense projects that yield more tax revenue.
Texas 130 will affect at least 12 cities and six water-supply corporations in Travis, Williamson and Bastrop counties. They are doing little to guarantee a healthy balance of growth.
The state, perhaps the only player that could bring order to the 130 corridor, is doing nothing at all.
"I'm afraid that without some guidance and direction, we're going to have the same old same old," said Weaver. "We're going to have suburban sprawl, and in 20 years we're going to have neighborhoods that no one wants to live in."
Statistics from Metrostudy, a Houston-based market research firm, show seedlings of a boom in the corridor.
Hutto's new home construction doubled from 2000 to 2003. Around Manor and Elgin in 2000, there were just 1,984 planned lots for houses. By last fall, the inventory had skyrocketed past 13,400.
Growth was occurring anyway, said Eldon Rude, director of Metrostudy's Austin operations, but 130 will accelerate it.
Commercial growth
For growth-hungry towns, some forms of development are more profitable than others.
Businesses and expensive houses tend to generate more money in property and sales taxes than they use in services. But cities struggle to provide parks, police and other services to clusters of low- and moderately priced houses.
For example, just one 35-acre piece of Barton Creek Square mall has a taxable value of about $82 million, not counting the land it sits on, according to the Travis Central Appraisal District.
In Hutto, 35 acres of a Lloyd subdivision — counting the land — would be worth less than $37 million, assuming seven homes per acre and $150,000 per house.
Pflugerville, flush with new subdivisions, now struggles to pay for the growth, taxing homeowners 64 cents for every $100 in assessed property value. Austin, with a better mix of commercial property and high-end homes, charges 44.3 cents per $100.
Consequences of rampant home building may be felt far beyond Texas 130's path.
Consider this worst-case scenario: People and small stores move into the 130 corridor, but big employers don't. That would force commuters to take 130 to cross-town roads already jammed with cars and trucks. Most drivers, particularly those headed into Central Austin, would still end up on the interstate.
Roberts, the economic development consultant, said the Texas 130 corridor could create a wealth of commercial development that will pay dividends for generations.
He is less certain that local officials will seize the opportunity. Cities can earmark land for houses, stores, offices and other land uses within their limits, but developers often fight regulations they consider too restrictive.
"The pressures that are on the city councils and the county commissioners are enormous," Roberts said.
Pflugerville City Manager David Buesing said he has lost faith that the market will provide Pflugerville with the stores and employers that residents need. Despite limited resources and a high tax rate, the city wants to annex land along the tollway and extend utilities there to induce more commercial growth and fewer houses.
"If (developers) were given the opportunity, they'd build the bedrooms right up to the expressway," Buesing said.
In Austin, city staffers are monitoring development patterns in a 300-square-mile zone, stretching from Interstate 35 to the Bastrop County line. But the city has no plans for large-scale annexations.
"Annexations can be so emotional," Austin Mayor Will Wynn said. "Oftentimes, annexation is seen simply as a tax-base grab."
In most of the rest of the corridor, city officials are trusting the market to deliver commercial growth.
Former Hutto Mayor Mike Fowler knows well how much his city's future depends on development at 130 and U.S. 79, which is shaping up as a major interchange.
Reports last week of a possible dense, urban project near Hutto demonstrate the potential and limitations in the corridor. Developers, according to Hutto officials, want to concentrate offices, a hotel, shops, a water or skate park and other projects just south of U.S. 79 along 130.
But the land lies outside Hutto's city limits. So, though officials can negotiate with developers, they can't control what happens.
The limitations don't bother Fowler, who trusts the market to provide for his city. "I do think it's desirable, and I do think it's managed, but I don't think it's dictated," Fowler said of the city's development. "I'm an American. We're based on freedom and freedom of choice.
"One thing about a market-driven project is it sells."
Unincorporated areas
Beyond the pale of cities lie expanses of land known, prosaically, as unincorporated areas. They are to planners what the Old West was to sheriffs: fierce, intriguing places where one might scratch out a good life or be robbed and left for dead.
Roughly 90 percent of Texas 130 — 45 miles worth — will run outside the current limits of any city, according to the Capital Area Council of Governments.
Cities have little jurisdiction over those parcels, and state lawmakers have long refused to let counties manage growth there.
"That's a real problem that I think Texas faces," said Fritz Steiner, dean of the University of Texas School of Architecture and member of the Envision Central Texas executive committee. "Unless you get a grip on that, future generations will pay the price for inadequate utilities and roads and really poorly planned land use."
In unincorporated areas, developers are typically allowed to build whatever they can. That usually means subdivisions or strip centers.
Unincorporated areas seldom have water and sewer lines that developers need. But subdivisions can be built with septic tanks and wells, whereas malls and factories cannot.
So developers can build houses right away instead of waiting for cities to extend expensive infrastructure that would support denser development.
"You can sit and bitch about sprawl all you want," said Lloyd, the Hutto developer. "But until you're willing to write a check, sprawl is what you get."
The lack of authority leaves most of the Texas 130 corridor in the hands of landowners, developers and the market.
"If it's in an unincorporated area, it's going to be completely market-driven," said Betty Voights, executive director of the Council of Governments. "There's no telling. It could be all truck stops."
What to do
With its flat topography and dying farm towns, land east of Austin has never attracted the kind of scrutiny directed at the Hill Country southwest of the city. Now, the Texas 130 corridor is forcing its way into the region's consciousness.
Austin routinely urges companies to look east for expansions or relocations. The Greater Austin Chamber of Commerce, chaired by former Austin Mayor Kirk Watson, this year plans to study the tollway's potential economic benefits.
But for the most part, the region's elected officials and community leaders have shown little interest in such studies.
Governments along 130 have yet to form a group to consider the possibilities, challenges and threats they face. The Hill Country warrants two such groups.
Wynn has proposed a far-reaching ballot proposition that could include tens of millions of dollars for infrastructure. But it's too early to tell how much — if any — bond money will be spent on 130-related projects.
"The future of this region is going to boil down to land-use decisions," the Austin mayor said. "We either do it right the first time or, sadly, leave it to our grandkids to redo it."
Bills that would provide land-use controls in unincorporated areas, even those strictly around cities, have never found traction in the Legislature. State Sen. Jeff Wentworth is sponsoring a
bill this year that would give counties new powers to regulate development. But the San Antonio Republican has introduced similar legislation before; it has never passed.
State Rep. Mike Krusee, a Republican from Williamson County, said he at least wants to reward subdivisions that minimize costs on neighboring taxpayers. But he has yet to come up with a proposal that his colleagues would support.
"I know there's a problem," Krusee said, "but I'm not sure what the politically viable solution is."
For the public, the basic questions have proven nearly as elusive as any solution.
Not only does no one know just what will grow from the new highway, few people can even articulate what they want.
Harried officials make decisions every day that will shape their cities' futures. But there is little talk about which actions will prove wise a generation from now and which will prove tragically shortsighted.
There are only two certainties in the Texas 130 corridor: The road is coming, and the growth is fast behind it.