Embed Size (px)
DESCRIPTION
Paper sobre mezcla de hidrogeno con gasolina en motor de ciclo otto
Citation preview

400 Commonwealth Drive, Warrendale, PA 15096-0001 U.S.A. Tel: (724) 776-4841 Fax: (724) 776-5760 Web: www.sae.org
SAE TECHNICALPAPER SERIES 2004-01-0975
Knock Behavior of a Lean-Burn, H2 and COEnhanced, SI Gasoline Engine Concept
Jennifer A. Topinka, Michael D. Gerty, John B. Heywood and James C. KeckSloan Automotive Laboratory, Massachusetts Institute of Technology
Reprinted From: New Spark Ignition Engine and Component Design,and Spark Ignition Combustion
(SP-1828)
2004 SAE World CongressDetroit, MichiganMarch 8-11, 2004
THIS DOCUMENT IS PROTECTED BY U.S. AND INTERNATIONAL COPYRIGHTIt may not be reproduced, stored in a retrieval system, distributed or transmitted, in whole or in part, in any form or by any means.
Downloaded from SAE International by University of Wisconsin - Madison , Tuesday, April 03, 2012 07:19:03 PM

All rights reserved. No part of this publication may be reproduced, stored in a retrieval system, ortransmitted, in any form or by any means, electronic, mechanical, photocopying, recording, or otherwise,without the prior written permission of SAE.
For permission and licensing requests contact:
SAE Permissions400 Commonwealth DriveWarrendale, PA 15096-0001-USAEmail: [email protected]: 724-772-4891Tel: 724-772-4028
For multiple print copies contact:
SAE Customer ServiceTel: 877-606-7323 (inside USA and Canada)Tel: 724-776-4970 (outside USA)Fax: 724-776-1615Email: [email protected]
ISBN 0-7680-1319-4Copyright © 2004 SAE International
Positions and opinions advanced in this paper are those of the author(s) and not necessarily those of SAE.The author is solely responsible for the content of the paper. A process is available by which discussionswill be printed with the paper if it is published in SAE Transactions.
Persons wishing to submit papers to be considered for presentation or publication by SAE should send themanuscript or a 300 word abstract of a proposed manuscript to: Secretary, Engineering Meetings Board, SAE.
Printed in USA
THIS DOCUMENT IS PROTECTED BY U.S. AND INTERNATIONAL COPYRIGHTIt may not be reproduced, stored in a retrieval system, distributed or transmitted, in whole or in part, in any form or by any means.
Downloaded from SAE International by University of Wisconsin - Madison , Tuesday, April 03, 2012 07:19:03 PM

1
2004-01-0975
Knock Behavior of a Lean-Burn, H2 and CO Enhanced, SI Gasoline Engine Concept
Jennifer A. Topinka*, Michael D. Gerty, John B. Heywood and James C. Keck Sloan Automotive Laboratory, Massachusetts Institute of Technology
Copyright © 2004 SAE International ABSTRACT
Experiments were performed to identify the knock trends of lean hydrocarbon-air mixtures, and such mixtures enhanced with hydrogen (H2) and carbon monoxide (CO). These enhanced mixtures simulated 15% and 30% of the engine’s gasoline being reformed in a plasmatron fuel reformer [1]. Knock trends were determined by measuring the octane number (ON) of the primary reference fuel (mixture of isooctane and n-heptane) supplied to the engine that just produced audible knock. Experimental results show that leaner operation does not decrease the knock tendency of an engine under conditions where a fixed output torque is maintained; rather it slightly increases the octane requirement. The knock tendency does decrease with lean operation when the intake pressure is held constant, but engine torque is then reduced. When H2 and CO are added to the mixture, the knock susceptibility is reduced, as illustrated by a decrease in the measured octane number of the primary reference fuel resulting in knock. Experiments conducted with the addition of H2 and CO separately show similar trends, but to a lesser degree; therefore, both H2 and CO act as octane enhancers when added to a hydrocarbon-air mixture. The extent to which H2 and CO improve the knock resistance of a mixture can be estimated by finding the bond-weighted octane numbers for these non-traditional blends of fuels. To understand these results better, a reduced chemical kinetic model was also used to predict autoignition of the end-gas for various conditions and fuel-air mixtures. Predicted model trends of knock onset of primary reference fuels agree with experimental observations. A comprehensive isooctane chemistry mechanism was used to demonstrate that H2 and CO are effective in lengthening the ignition delay, thereby reducing knock tendency.
INTRODUCTION AND BACKGROUND
Knock is caused by the spontaneous ignition and rapid energy release of unburned fuel and air ahead of the propagating flame front in a spark-ignition (SI) engine [2]. This rapid release of energy causes a rise in local pressure. The pressure waves, which then propagate across the gas in the combustion chamber, cause the engine block and cylinder head to vibrate, generating a clanging or pinging noise. This noise is unattractive to drivers; in addition, extended operation under heavy knocking conditions can cause damage to engine components. Knock has been studied for many decades, but remains a significant engine constraint. Advances in fuel processing have resulted in gasolines with increased knock resistance; in addition, fast burning combustion chamber designs help to control knock. Nevertheless, engine performance and efficiency are limited by knock onset. If new methods to control knock are developed, engine performance and efficiency could be significantly improved. One way to suppress knock in a naturally aspirated engine is to operate the engine with excess air in the cylinder. However, under these lean operating conditions, the engine torque decreases. If the engine is boosted to maintain constant torque, then the knock tendency relative to operation with stoichiometric mixtures is unclear. * The traditional motivation for lean engine operation is to increase fuel conversion efficiency and reduce engine-out emissions. In general, the leaner the mixture, the greater the efficiency and emissions benefit. However, at some point the engine cannot support stable combustion mainly due to low flame speeds, and the lean limit is reached [3]. To extend the stable range of lean operation small amounts of hydrogen, which burns much faster than gasoline, can be added to the fuel-air mixture. To obtain
*Author is currently employed at General Electric Global Research.
THIS DOCUMENT IS PROTECTED BY U.S. AND INTERNATIONAL COPYRIGHTIt may not be reproduced, stored in a retrieval system, distributed or transmitted, in whole or in part, in any form or by any means.
Downloaded from SAE International by University of Wisconsin - Madison , Tuesday, April 03, 2012 07:19:03 PM

2
hydrogen onboard a vehicle, a fuel reformer can be used to produce a hydrogen (H2), carbon monoxide (CO), and nitrogen (N2) mixture from partial oxidation of a hydrocarbon with air. Several types of gasoline partial oxidation reformer systems are being developed (e.g. [4]). The concept investigated for this research uses a plasmatron reformer [5]. The plasmatron uses an electrical discharge to initiate the fuel reforming chemistry. Through partial oxidation of the gasoline, reformate gas of about equal concentrations of H2 and CO, with the N2 from the air used, and small amounts of H2O and CO2 is produced. The concept involves a fraction (e.g. 10% - 30%) of the gasoline being reformed in the plasmatron fuel reformer. The hydrogen-rich stream is then mixed with the main fuel/air mixture in the intake manifold. The work presented here explores the opportunities for suppressing knock by lean, hydrogen and CO-enhanced engine operation. The engine’s Octane Number Requirement (ONR) - defined as the octane number of the fuel that just produces audible knock - indicates its propensity to knock. This work examines the changes in knock limits of an engine under lean operating conditions by finding the ONR at various operating conditions. The role of H2 and CO on knock behavior was explored by finding the octane number improvement contributed by H2 and CO when added to blends of primary reference fuels. The changes in knock behavior will be discussed and related to fundamental explanations using engine experiments and modeling. Past research on lean knock limits has indicated various trends. Some literature shows that lean mixtures are more knock resistant, and therefore allow a higher compression ratio [6][7][8]. Other literature questions the assumption that lean mixtures allow for a higher compression ratio, especially at high loads [9]. This work attempts to answer the questions regarding knock trends with leaner mixtures where output torque is maintained. EXPERIMENTAL METHOD
EXPERIMENTAL SETUP – The base engine used in this study is a single-cylinder Ricardo Hydra MK III. The engine cylinder head has been replaced with a B5254 Volvo head to better represent current engines. The spark plug is located in the center of the pentroof combustion chamber. There are four valves, which are actuated by belt-driven dual overhead camshafts. Turbulence is increased by generating swirl with a charge motion control plate in the intake port. The complete specifications of the engine are shown in Table 1. The engine is equipped with an air supply from a compressor to simulate boosted operation.
Table 1: Engine specifications
Displaced Volume (cm3) 487
Clearance Volume (cm3) 54
Bore (mm) 83
Stroke (mm) 90
Con Rod Length (mm) 158
Compression Ratio 10.1 IVC 60º ABDC; IVO 0º ATDC Valve Timing:
EVC 8º ATDC; EVO 68º BBDC
EXPERIMENTAL PROCEDURE – A series of experiments were performed to investigate the knock trends for mixtures of primary reference fuels, with and without the addition of H2 and CO. All tests were completed at 1500 rpm, MBT spark timing, with coolant temperature at 90°C and intake air temperature at 20° C.
The engine parameters that were controlled and measured include the airflow and its temperature and pressure, the fuel flow rates, and the relative air/fuel ratio. The net indicated mean effective pressure (NIMEP) was calculated based on the cylinder pressure trace. The octane number of the primary reference fuel at the audible knock limit was measured in each case. The experiments proceeded as follows:
Step 1: The operating conditions were established and defined using isooctane (ON 100). The parameters that define an engine operating condition are: intake manifold pressure, airflow, fuel flow, intake air temperature, coolant temperature, spark timing, and speed. The spark timing was adjusted for maximum brake torque (MBT).
Step 2: For each operating condition established in the first step, the octane number of the primary reference fuel supplied to the engine was decreased until audible knock occurred. This involved multiple tests run with the octane number of the primary reference fuel decreasing by approximately two numbers for each successive run. For the short time between fuel changes, the engine was motored and the fuel lines purged. “Primary reference fuel only” tests were first completed to explore the knock trends when operating with lean mixtures and to determine baseline data, later used to understand the effects of H2 and CO with plasmatron-enhanced operation and hydrogen and CO addition cases. PLASMATRON REFORMATE ADDITION – Tests to characterize engine knock trends in the plasmatron engine concept were completed by replacing a fraction of the primary reference fuel and air mixture
THIS DOCUMENT IS PROTECTED BY U.S. AND INTERNATIONAL COPYRIGHTIt may not be reproduced, stored in a retrieval system, distributed or transmitted, in whole or in part, in any form or by any means.
Downloaded from SAE International by University of Wisconsin - Madison , Tuesday, April 03, 2012 07:19:03 PM

3
with a H2, CO and N2 mixture. The plasmatron fuel reformer is still being developed; so all of the experiments were carried out using bottled gas representative of the ideal output from the plasmatron when operating with gasoline. The mole fractions of H2, CO, and N2 in the simulated plasmatron reformate were 0.23, 0.25, and 0.52, respectively. The plasmatron fraction is defined as the fraction of total gasoline mass diverted to the plasmatron fuel reformer. For example, 30% plasmatron fraction means that 30% of the gasoline is diverted to the plasmatron, while 70% is directly injected into the engine intake port. The relative air/fuel ratio (λ) for the plasmatron addition cases is taken for the whole system. The air, used in the plasmatron and the engine, is compared with the air required for complete oxidation of the fuel, which is entering the plasmatron fuel reformer and the engine. Since all the air and fuel eventually enter the engine, the lambda measured in the exhaust stream is the system lambda.
EQUIVALENT HYDROGEN AND CO ADDITION – The synthetic reformate used in the plasmatron cases includes both H2 and CO. To investigate the roles of H2 and CO independently, equivalent H2 addition and CO addition tests were completed. To allow for a direct comparison between the plasmatron addition cases and the H2 and CO addition cases, the corresponding equivalent H2 and CO experiments were designed to provide the same fraction of total energy from H2 or CO as in the plasmatron case. In this manner, the separate effects of the H2 and CO, in the plasmatron gas, on knock could be evaluated.
EXPERIMENTAL RESULTS
GASOLINE OPERATION
Basic Trends - Figure 1 shows how the ONR changes with variations in fuel and air flows. Each node represents an engine operating condition. The number in parenthesis is the experimental primary reference fuel octane number requirement. The axes designate the fuel flow, and manifold air pressure (MAP) which is a good indication of air flow rate. Experiments of this type were carried out for two different loads and both sets of data show the same trends. The vertical line shows that the ONR decreases with leaner operation, when the fuel flow rate is reduced at a constant inlet pressure. However, the output torque also decreases. Instead of reducing fuel to increase lambda, another approach is to increase the air flow rate and hold the flow of fuel constant.
In this case, shown by the horizontal line, the ONR increases, as well as the NIMEP, due to increasing fuel conversion efficiency when operating under leaner conditions. To achieve constant torque (NIMEP) with leaner mixtures, a combination of less fuel and higher intake pressure is required. The ONR trend under leaning operation with constant torque output is the result of two competing effects – a decrease in the ONR due to less fuel, and an increase in ONR due to higher MAP. At a more fundamental level, leaner operation increases the value of the ratio of specific heats of the unburned mixture (γu). Higher unburned mixture γ results in a higher unburned end-gas temperature at peak pressure, for the same pressure ratio, pmax/pintake. Lean mixtures have a higher γ u due to reduced concentration of fuel molecules (which have lower γ than N2 and O2 due to their larger molecule size). For a given load, the ONR requirement increases slightly as lambda increases above approximately 1.2. The last set of data included is a series of points at constant lambda (γ =1.5) over a range of pressures. This shows that the knock behavior of a lean mixture is highly dependent on the intake pressure.
Role of Lambda on ONR - Figure 2 shows how the ONR and NIMEP change as a function of relative air/fuel ratio for a constant inlet pressure. This shows that a fuel leaning by 0.1 lambda results in a reduction of approximately two octane numbers. This trend compares to trends stated by Russ [10]. This is the trend with which lean operation is often associated; however, it is critical to note the NIMEP decreases along with the ONR. The decrease in ONR, and knock propensity, can be attributed to lower peak pressures, end-gas temperatures, and relative fuel concentrations.
0.2
0.25
0.3
0.35
0.4
0.8 1 1.2 1.4 1.6
Intake Manifold Pressure [bar]
Fue
l Mas
s F
low
[g/s
]
Constant Torque Output
Constant Fuel
Constant MAP
Constant Lambda
(96)
(97)
(99)
(90)
(85)
(92)(94)
(98)
(100)
(96)
(96)
Lean
Lean
(92)
Fig. 1 – Experimental data when operating with PRF. Values in parenthesis are octane numbers at the audible knock limit.
THIS DOCUMENT IS PROTECTED BY U.S. AND INTERNATIONAL COPYRIGHTIt may not be reproduced, stored in a retrieval system, distributed or transmitted, in whole or in part, in any form or by any means.
Downloaded from SAE International by University of Wisconsin - Madison , Tuesday, April 03, 2012 07:19:03 PM

4
Role of Intake Pressure on ONR - Figure 3 shows lines of constant ONR and lambda, plotted against MAP and NIMEP. As the MAP rises the NIMEP increases as well. Note that the ONR increases as the inlet pressure is raised. (4-5 ONR increase per 0.1 bar MAP). This is due to higher peak pressure and charge densities. The contours of constant ONR slope down slightly moving from near-stoichiometric to lean. The knock-limited NIMEP decreases slightly as a leaner mixture is burned.
For all operating points fueled with primary reference fuels only, the octane number at audible knock follows a clear trend with MAP, lambda, and NIMEP. Figures 4 and 5 show three-dimensional plots of ONR versus lambda and MAP. The plots resemble a plane with modest deviations. There are two prominent trends, which can be visualized by referring to Fig. 4: following a given value of MAP, one can see a tilt that shows the decrease in ONR
with lean operation at constant inlet pressure. The other trend is associated with the dependence of ONR on MAP, regardless of lambda. Figure 5 shows the individual data points as well as contours of constant ONR. The top view (plan view) of this data is presented in Fig. 6. The top view maintains the axis of lambda and MAP. On this graph, the shade (color) corresponds to the ONR, in addition; contours of constant NIMEP have been added. The shades change approximately with the contours of NIMEP, which indicates, as expected, that the ONR is strongly a function of NIMEP.
11.2
1.41.6
1.8
0.60.8
11.2
1.4
70
80
90
100
LambdaIntake Pressure [bar]
ON
R
(Lean)
(Stoich)
Fig. 4 – ONR plot stt ted for all data points operating with primary reference fuel.
3
4
5
6
7
8
9
0.9 1.1 1.3 1.5 1.7 1.9
Lambda
NIM
EP
[b
ar]
96
92
9086
8884
88
82
80
78
78
68
65
MAP=1.1 bar
MAP =0.9 bar
MAP =0.7 bar
Numbers in Symbols are Octane Number Requirements.
Fig. 2 – Experimental octane number of fuel at the onset of audible knock is shown in the symbols.
11.2
1.41.6
1.8
0.60.8
11.2
1.4
50
60
70
80
90
100
LambdaIntake Pressure
[bar]
ON
R
(Lean)
(Stoich)
Fig. 5 – ONR plotted for all data points with primary reference fuel. Lines of constant ONR are shown as well as the individual data points.
THIS DOCUMENT IS PROTECTED BY U.S. AND INTERNATIONAL COPYRIGHTIt may not be reproduced, stored in a retrieval system, distributed or transmitted, in whole or in part, in any form or by any means.
Downloaded from SAE International by University of Wisconsin - Madison , Tuesday, April 03, 2012 07:19:03 PM

5
H2 AND CO-ENHANCED OPERATION – The next sets of data show the knock trends when plasmatron reformate, followed by H2 and CO separately, are added to primary reference fuels. Seven of the original data points, comprised of lambda sweeps at two different loads (NIMEP of 6.7 bar and 8.5 bar), were repeated with different fuel mixtures. Three types of fuel mixtures were tested: (1) Primary reference fuels with plasmatron reformate (H2, CO and N2), (2) Primary reference fuels with hydrogen addition, each with two hydrogen fractions and (3) Primary reference fuels with CO addition, with two CO fractions. The hydrogen addition tests fixed the H2 energy fraction to match the H2 energy fraction in the plasmatron cases. The same was done for the CO addition tests. While completing these tests, the overall octane number requirement of the engine is presumed to be unchanged at the same NIMEP and speed. The plasmatron reformate, H2 and CO improve the octane number of the total fuel mixture; hence, the octane number of the primary reference fuel at the audible knock limit is reduced. Figure 7 shows the octane number of the primary reference fuel supplied to the engine at audible knock for four operating conditions with two plasmatron reformate fractions, 15% and 30%. The primary reference fuel only case is shown for reference. In the cases where plasmatron reformate is added to the mixture, the octane number of primary reference fuel at the audible knock limit decreases. Over the range tested, the octane number of the hydrocarbon supplied at knock decreases for increasing plasmatron fractions. The equivalent graph for hydrogen addition and CO addition is shown in Fig. 8.
The octane number of the primary reference fuel supplied to the engine at audible knock consistently decreases for all loads and air/fuel ratios with plasmatron enhancement. Figures 9, 10 and 11 compare the effect of plasmatron reformate, hydrogen addition, and CO addition for each operating condition. Each figure consists of a series of lines; there is one line for each operating condition. The lines represent the measured decrease in octane number of the primary reference fuel at audible knock as the plasmatron reformate or hydrogen or CO fraction is increased. The decrease in octane number of primary reference fuel supplied to the engine at audible knock is defined as the difference in hydrocarbon ON at the onset of knock when operating with primary reference fuels only versus the octane number of the primary reference fuel at audible knock when operating with a given plasmatron reformate fraction. A similar subtraction is done to find the decrease in octane number of primary reference fuel at knock for the H2 and CO addition cases.
50
60
70
80
90
100
1 1.1 1.2 1.3 1.4 1.5 1.6 1.7 1.8
Lambda
ON
of P
RF
into
Eng
ine
at A
udib
le K
nock
PRF, 0% Plas Fraction
15% Plas Fraction
30% Plas Fraction
Fig. 7 - Decrease in primary reference fuel octane number at the audible knock limit with increased plasmatron reformate addition. All data points are at 8.5 bar NIMEP.
80
85
90
95
100
1 1.1 1.2 1.3 1.4 1.5 1.6 1.7 1.8
Lambda
ON
of P
RF
into
Eng
ine
at A
udib
le K
nock
PRF, 0% H2 or CO5.6% energy from H211.5% energy from H27.1% energy from CO14.7% energy from CO
Fig. 8 - Decrease in primary reference fuel octane number at the audible knock limit with increased hydrogen addition and increased CO addition. All data points are at 8.5 bar NIMEP.
THIS DOCUMENT IS PROTECTED BY U.S. AND INTERNATIONAL COPYRIGHTIt may not be reproduced, stored in a retrieval system, distributed or transmitted, in whole or in part, in any form or by any means.
Downloaded from SAE International by University of Wisconsin - Madison , Tuesday, April 03, 2012 07:19:03 PM

6
0
5
10
15
20
25
30
0 0.05 0.1 0.15 0.2 0.25 0.3
Summed Fuel Energy From H2+CO [%/100]
Su
mm
ed D
ecre
ase
in O
N o
f P
RF
in
to E
ngin
e at
Aud
ible
Kno
ck
high load, lambda=1.1
high load, lambda=1.3
high load, lambda=1.5
high load, lambda=1.7
mid load, lambda=1.1
mid load, lambda=1.3
mid load, lambda=1.5
Fig. 12 – Sum of decreases in PRF octane number from separate H2 and CO addition experiments corresponding to 15% and 30% of the gasoline being reformed in the plasmatron fuel reformer.
Figure 9 shows how the octane number of PRF at knock onset decreases for higher plasmatron reformate fractions. The benefit with plasmatron reformate is only weakly dependent on lambda and load since no clear trend is noted between the different engine operation lines. The data shows that when 15% and 30% of the fuel is partially oxidized into H2 , CO, and N2, the octane number of the primary reference fuel required to just avoid knock decreases by about 8 ONs and 20 ONs, respectively. A similar but less substantial trend is found with pure hydrogen and with CO addition, as shown in Figs. 10 and 11, where the decrease in primary reference fuel octane number required to just avoid knock is plotted versus the fraction of the energy that was derived from hydrogen or CO. For 5% energy from H2, the octane number of hydrocarbon fuel at the audible knock limit is 5 lower than without H2. For 11% energy from hydrogen, there is a decrease of 10 octane numbers. For 7.1% and 14.7% energy from CO, there is a decrease in 2 octane numbers and 6 octane numbers, respectively. Figure 12 shows the results of summing the separate H2 and CO effects, in the proportions that these gases are present in plasmatron gas. When Fig. 12 is compared to Fig. 9, it is apparent that adding the separate effects of the H2 and CO gives a decrease in PRF ON that is comparable to but lower than that observed with the plasmatron gas. Thus the CO in the plasmatron gas contributes comparably to hydrogen to lowering the octane number of primary reference fuel supplied to the engine at the onset of audible knock.
0
5
10
15
20
25
30
0 0.02 0.04 0.06 0.08 0.1 0.12
Fuel Energy From H2 [%/100]
Dec
reas
e in
ON
of
PR
F
into
Eng
ine
at A
udib
le K
nock
high load, lambda=1.1
high load, lambda=1.3
high load, lambda=1.5
high load, lambda=1.7
mid load, lambda=1.1
mid load, lambda=1.3
mid load, lambda=1.5
Fig. 10 – Lower octane fuel is supplied to the engine for audible knock when some energy is derived from H2. Data simulates the H2 equivalent data for 15% and 30% of the gasoline being reformed in the plasmatron fuel reformer.
0
5
10
15
20
25
30
0 0.05 0.1 0.15 0.2 0.25 0.3
Fuel Energy From H2+CO [%/100]
Dec
reas
e in
ON
of
PR
F
into
Eng
ine
at A
udib
le K
nock
high load, lambda=1.1
high load, lambda=1.3
high load, lambda=1.5
high load, lambda=1.7
mid load, lambda=1.1
mid load, lambda=1.3
mid load, lambda=1.5
Fig. 9 - Lower octane fuel is supplied to the engine for audible knock when some energy is derived from H2
and CO (plasmatron reformate). Data simulates 15% and 30% of the gasoline being reformed in the plasmatron fuel reformer.
0
5
10
15
20
25
30
0 0.02 0.04 0.06 0.08 0.1 0.12 0.14 0.16
Fuel Energy From CO [%/100]
Dec
reas
e in
ON
of
PR
F
into
Eng
ine
at A
udib
le K
nock
high load, lambda=1.1
high load, lambda=1.3
high load, lambda=1.5
high load, lambda=1.7
mid load, lambda=1.1
mid load, lambda=1.3
mid load, lambda=1.5
Fig. 11 – Lower octane fuel is supplied to the engine for audible knock when some energy is derived from CO. Data simulates the CO equivalent data for 15% and 30% of the gasoline being reformed in the plasmatron fuel reformer.
THIS DOCUMENT IS PROTECTED BY U.S. AND INTERNATIONAL COPYRIGHTIt may not be reproduced, stored in a retrieval system, distributed or transmitted, in whole or in part, in any form or by any means.
Downloaded from SAE International by University of Wisconsin - Madison , Tuesday, April 03, 2012 07:19:03 PM

7
EFFECTIVE OCTANE NUMBER ESTIMATION
The aforementioned experiments show that H2 and CO have the effect of increasing the octane number of a fuel mixture. Octane number is an empirical measure of a fuel’s resistance to knock established by comparing the knock tendency of a fuel to a mixture of two primary reference fuels, isooctane and n-heptane. Results of this study show that when H2, CO, or a combination of H2 and CO, are added to a gasoline-air mixture, the octane number is increased above that of the liquid hydrocarbon alone. The effects of H2 and CO are analogous to octane-enhancing additives such as tetraethyl lead (TEL) or methyl tertiary butyl ether (MTBE). TEL and MTBE are known to increase the octane number of a mixture by an amount proportional to the mass or volume of additive mixed into a given amount of hydrocarbon fuel and that additive’s octane number. We have examined methods for estimating the octane number for blends of H2, CO, and primary reference fuels. The approach is to calculate an average octane number based on a weighted average of the individual components’ octane numbers. Most literature estimates of the research octane number of H2 are between 120 and 140 [11][12] [13]. This value appears reasonable when inspecting the spontaneous ignition temperature of H2, which is significantly higher than that of isooctane, as shown in Table 2. Fuels with high knock resistance will have a high spontaneous ignition temperature; thus, H2 should have an octane number higher than 100.
Table 2: Characteristics of fuels used in this study.
Fuel Spontaneous Ignition Temp [14]
Research Octane Number
Isooctane 447 C 100
Normal Heptane 247 C 0
Hydrogen 572 C 140
Carbon Monoxide 609 C 106
It is noted however, that a H2 octane number is difficult to define and measure. Octane number rating procedures were developed for liquid fuels. Values of about 140 are well above the rating given to isooctane of 100, and it is not clear that lead additives appropriately augment this value to hydrogen levels.
Another complication that could arise in knock testing is preignition. Hydrogen is prone to preignition, defined as ignition of the charge by a hot surface before the spark is discharged, which results from the low surface ignition energy of hydrogen. Knock tests on pure hydrogen engines must be carefully executed to ensure that the autoignition of the end-gas occurs with normal spark-ignition combustion, and not preignition. A value for the octane number of CO has not been found in current literature. However, there are several reasons CO would have a high octane number. First, the spontaneous ignition temperature for CO is high. Secondly, this study found that CO does delay the onset of knock, when added to a primary reference fuel mixture. Discussions indicate that some recent tests, using the standard octane rating procedure, found the research octane number of CO to be 106 [11]. The octane numbers used for each pure fuel are given in Table 2.
ENERGY-WEIGHTED OCTANE NUMBER – One method for estimating an effective octane number for a fuel mixture, which is analogous to that used with primary reference fuels is to weight the octane number of each fuel component by the fraction of the energy that it represents in the cylinder. The energy-weighted effective octane number is defined in Eq. (1).
where i is a pure fuel component, LHVi is the lower �
The results from this method of octane number calculation are shown in Fig. 13. If the octane estimation method achieved perfect correlation, the data points would lie on the diagonal. The scatter shows the error; the energy-weighted octane calculation usually underestimates the octane numbers of the mixtures. BOND-WEIGHTED OCTANE NUMBER - Hydrocarbon autoigntion processes initiate with the extraction of a hydrogen atom from a fuel molecule. This fundamental process suggests an approach for estimating the effective octane number of a mixture of these fuels where the fuel proportions are weighted by the fraction of critical bonds they supply to the mixture. Critical bonds are those bonds that could take part in the spontaneous ignition process. For hydrocarbons, critical bonds are taken as the H-
∑
∑
×
×
×
=•
•
ii
iii
mLHV
ONmLHVON weighted-energy (1)
heating value, and •m is the mass flow rate of fuel i.
THIS DOCUMENT IS PROTECTED BY U.S. AND INTERNATIONAL COPYRIGHTIt may not be reproduced, stored in a retrieval system, distributed or transmitted, in whole or in part, in any form or by any means.
Downloaded from SAE International by University of Wisconsin - Madison , Tuesday, April 03, 2012 07:19:03 PM

8
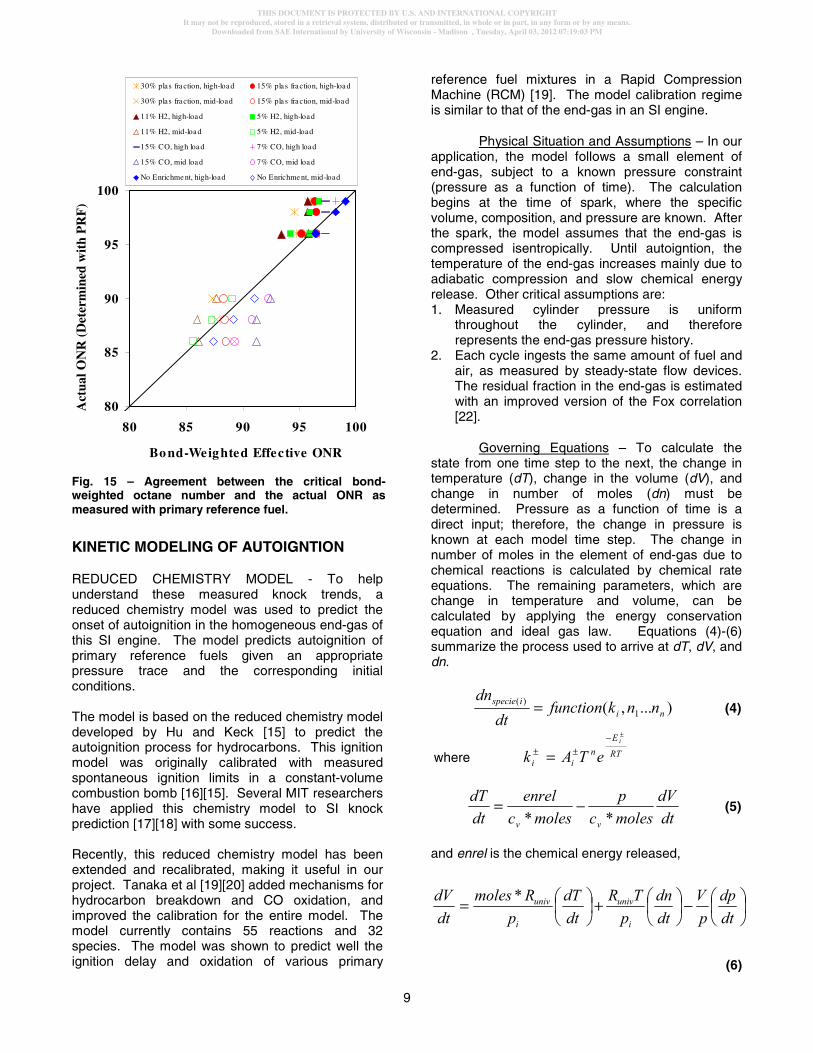
C bonds. For example, each molecule of isooctane (C8H18) contributes 18 H-C bonds; hence, the tendency of these H-C bonds to break determines the probability that an isooctane-air mixture will spontaneously ignite. (It is acknowledged that the H-C bonds in isooctane do not all have the same bond energy; however, the ON includes this factor.) For H2 to participate in the ignition reaction its one bond must be broken; therefore, H2 is given a value of one critical bond per molecule. The role of CO in the ignition process is complex. A detailed chemical simulation (discussed later) shows that the presence of CO significantly reduces the HO2 concentration, thereby changing the radical pool. The number of critical bonds in CO was determined by finding the value that resulted in the lowest error between the expected ON (mixture of PRF which knocks at the same engine condition) and the ON estimated by the bond-weighting approach. Figure 14 shows the “best-fit” number of bonds for CO is between two and three. A value of three was used for the calculations presented here. Table 3 summarizes the critical bond assumptions. The first step to calculate the bond-weighted octane number requires finding the number of CRitical Bonds (CRB) contributed by each pure fuel i as shown in Eq. (2).
where iX is the number of moles of fuel i in the
mixture. The number of critical bonds originating from each pure fuel component is then multiplied by the fuels’ respective octane number. Summing this product over all fuel components and dividing by the total number of critical bonds in the mixture provides a bond-weighted octane number as shown in Eq. (3).
The results are shown in Fig. 15. The correlation is plausible. When fuel mixtures contain H2 and CO in addition to gasoline, a method of estimating the octane number of the mixture is needed. The RMS error of the estimated octane numbers of our data set using the bond-weighting method is 1.9 octane numbers, while the RMS error using the energy-weighting method is 3.0 octane numbers.
Table 3: Sample calculation for the critical bond weighted-octane number. Example for 15%
plasmatron reformate fraction. Fuel Moles CRB/mol CRB
Fr. Fuel ON
Wt’ed ON
C8H18 0.233 18 0.676 100 67.6
C7H16 0.032 16 0.082 0 0
H2 0.349 1 0.056 140 7.8
CO 0.386 3 0.186 106 19.7
Total 1 1 95
80
85
90
95
100
80 85 90 95 100
Energy-Weighted Effective ONR
Act
ual O
NR
(D
eter
min
ed w
ith
PR
F)
30% plas fraction, high-load 15% plas fraction, high-load
30% plas fraction, mid-load 15% plas fraction, mid-load
11% H2, high load 5% H2, high load
11% H2, mid-load 5% H2, mid-load
15% CO, high load 7% CO, high load
15% CO, mid-load 7% CO, mid load
No Enrichment, high load No Enrichment, mid-load
Fig. 13 – Agreement between the energy-weighted octane number and the actual ONR as measured with primary reference fuel.
0
1
2
3
4
5
6
0 1 2 3 4 5 6
Number of "Critical Bonds" in CO
Ro
ot
Mea
n S
qu
are
[ON
Err
or]
Fig. 14 – RMS error associated with the ON estimation for a fuel mixture containing isooctane, n-heptane, H2, and CO, and the actual ON determined with traditional primary reference fuels.
( )iii XCRB MoleculeBonds Critical×= (2)
∑∑ ×
=−i
ii
CRB
ONCRBON
)(
weightedbond (3)
THIS DOCUMENT IS PROTECTED BY U.S. AND INTERNATIONAL COPYRIGHTIt may not be reproduced, stored in a retrieval system, distributed or transmitted, in whole or in part, in any form or by any means.
Downloaded from SAE International by University of Wisconsin - Madison , Tuesday, April 03, 2012 07:19:03 PM
9
KINETIC MODELING OF AUTOIGNTION
REDUCED CHEMISTRY MODEL - To help understand these measured knock trends, a reduced chemistry model was used to predict the onset of autoignition in the homogeneous end-gas of this SI engine. The model predicts autoignition of primary reference fuels given an appropriate pressure trace and the corresponding initial conditions. The model is based on the reduced chemistry model developed by Hu and Keck [15] to predict the autoignition process for hydrocarbons. This ignition model was originally calibrated with measured spontaneous ignition limits in a constant-volume combustion bomb [16][15]. Several MIT researchers have applied this chemistry model to SI knock prediction [17][18] with some success. Recently, this reduced chemistry model has been extended and recalibrated, making it useful in our project. Tanaka et al [19][20] added mechanisms for hydrocarbon breakdown and CO oxidation, and improved the calibration for the entire model. The model currently contains 55 reactions and 32 species. The model was shown to predict well the ignition delay and oxidation of various primary
reference fuel mixtures in a Rapid Compression Machine (RCM) [19]. The model calibration regime is similar to that of the end-gas in an SI engine.
Physical Situation and Assumptions – In our application, the model follows a small element of end-gas, subject to a known pressure constraint (pressure as a function of time). The calculation begins at the time of spark, where the specific volume, composition, and pressure are known. After the spark, the model assumes that the end-gas is compressed isentropically. Until autoigntion, the temperature of the end-gas increases mainly due to adiabatic compression and slow chemical energy release. Other critical assumptions are: 1. Measured cylinder pressure is uniform
throughout the cylinder, and therefore represents the end-gas pressure history.
2. Each cycle ingests the same amount of fuel and air, as measured by steady-state flow devices. The residual fraction in the end-gas is estimated with an improved version of the Fox correlation [22].
Governing Equations – To calculate the state from one time step to the next, the change in temperature (dT), change in the volume (dV), and change in number of moles (dn) must be determined. Pressure as a function of time is a direct input; therefore, the change in pressure is known at each model time step. The change in number of moles in the element of end-gas due to chemical reactions is calculated by chemical rate equations. The remaining parameters, which are change in temperature and volume, can be calculated by applying the energy conservation equation and ideal gas law. Equations (4)-(6) summarize the process used to arrive at dT, dV, and dn.
and enrel is the chemical energy released,
(6)
80
85
90
95
100
80 85 90 95 100
Bo nd-Weig hted Effective ONR
Act
ual O
NR
(D
eter
min
ed w
ith
PR
F)
30% plas fraction, high-load 15% pla s fraction, high-load
30% plas fraction, mid-load 15% pla s fraction, mid-load
11% H2, high-load 5% H2, high-load
11% H2, mid-load 5% H2, mid-load
15% CO, high load 7% CO, high load
15% CO, mid load 7% CO, mid load
No Enrichment, high-load No Enrichment, mid-load
Fig. 15 – Agreement between the critical bond-weighted octane number and the actual ONR as measured with primary reference fuel.
)...,( 1)(
niispecie nnkfunction
dtdn
= (4)
where RT
En
ii
i
eTAk±−
±± =
dtdV
molescp
molescenrel
dtdT
vv **−= (5)
−
+
=
dtdp
pV
dtdn
pTR
dtdT
pRmoles
dtdV
i
univ
i
univ*
THIS DOCUMENT IS PROTECTED BY U.S. AND INTERNATIONAL COPYRIGHTIt may not be reproduced, stored in a retrieval system, distributed or transmitted, in whole or in part, in any form or by any means.
Downloaded from SAE International by University of Wisconsin - Madison , Tuesday, April 03, 2012 07:19:03 PM

10
Inputs to the Model – Initial conditions include: specific volume, mixture composition, and a representative individual cycle pressure history from the appropriate experiment. Specific volume at time of spark can be estimated from the crank angle of spark and the steady-state mass flows into the engine. Specie concentrations are known from the fuel composition and relative air/fuel ratio. The pressure trace that is used must be representative of a pressure cycle which experiences autoignition at the audible knock limit. The individual cycle pressure traces at audible knock were reviewed. At the audible knock threshold, about half the pressure traces show pressure oscillations of 1 bar or higher. The pressure oscillations become apparent in the cycle near to the time of peak cylinder pressure. The cycles that show autoigntion tend to be the faster burning cycles, which experience an early location of peak pressure. Data from 100 pressure cycles at audible knock were analyzed. Figure 16 illustrates how we chose a representative pressure cycle that should experience autoigntion at the audible knock limit. Pressure traces that show a location of peak pressure one standard deviation earlier than the average location of peak pressure are likely to knock, and therefore are appropriate to use as input to the knock model.
Calculation Methodology – The model was used to examine how the octane number of the primary reference fuel affected the onset of audible knock. The model was run with fuels corresponding to the experiments to see if the same trends in ONR were obtained with the model. This section describes how the ONR was determined from the model.
The model was run several times to find the ONR for one data point. For the runs, everything was held constant except the relative amounts of isooctane and n-heptane, to simulate operation with a range of octane numbers. When the reactions in the end gas become significant, the temperature rises quickly as autoignition occurs. Autoigntion should first occur at peak cylinder pressure, which corresponds to peak end-gas temperature. The octane number of the fuel where autoignition occurred at peak pressure was taken as the ONR. An example of the model results is shown in Fig. 17. The figure illustrates that changes of ± 5 ON produce relatively modest shifts in time of autoigntion. The simulation is only valid until autoigntion. After autoigntion, the pressure of the end-gas element rises rapidly, and the assumed uniform cylinder pressure is no longer a valid constraint.
Model Results – Tables 4 and 5 show the experimental and the predicted ONR for two load cases for primary reference fuels only. There is an “offset” of about 5 ON, but the trends are comparable. Given the difficulties in describing the end-gas thermal state and complex chemistry, this offset is not surprising. However, when fuel mixtures, which include H2 and CO are used in the model, the results no longer scale well. Even with a PRF ON of zero, knock onset with 30% plasmatron gas occurs some 5 crank angle degrees after location of maximum pressure [23].
Table 4: Experimental vs predicted ONR for mid-load cases. Operating conditions are for primary reference
fuels only.
Relative air/fuel ratio (λ) �λ=1.1 �λ=1.3 �λ=1.5
Experimental 88 90 93
Predicted 86 85 88
Difference -2 -5 -5
0
0.2
0.4
0.6
0.8
1
0.8 0.85 0.9 0.95 1 1.05 1.1 1.15 1.2 1.25
Location of Peak Pressure [C.A.Deg ATDC]/Ave Location of Peak Pressure [C.A. deg ATDC]
Fra
ctio
n of
Cyc
les
Kno
ckin
g
0
5
10
15
20
25
Fre
q of
Occ
uran
ce
[No.
of C
ycle
s]
Fraction of Cycles Knocking Frequency of Occurance
1 Std Dev 1 Std Dev
Fig. 16 – Knock characteristics compiled for 100 pressure traces at the audible knock limit. Fast-burning pressure cycles have high likelihood of autoigntion.
1
2
3
4
5
Pre
ssur
e (M
Pa)
0 1 2 3 4 5 6 7500
1000
1500
2000
2500
Time (ms)
Tem
pera
ture
(K
)
Peak Cylinder Pressure
Experimental Pressure Trace
Spark
Calculated TemperatureProfiles
Spark
PRF 70 PRF 80
PRF 75
PRF 85
PRF 75 autoignites at peakpressure, therefore it is taken to be the ONR
Fig. 17 – Example and interpretation of engine knock simulation.
THIS DOCUMENT IS PROTECTED BY U.S. AND INTERNATIONAL COPYRIGHTIt may not be reproduced, stored in a retrieval system, distributed or transmitted, in whole or in part, in any form or by any means.
Downloaded from SAE International by University of Wisconsin - Madison , Tuesday, April 03, 2012 07:19:03 PM

11
Table 5: Experimental vs predicted ONR for high-load cases. Operating conditions are for primary reference
fuels only.
Relative air/fuel ratio (λ) �λ=1.1 �λ=1.3 �λ=1.5
Experimental 96 96 98
Predicted 91 90 90
Difference -5 -6 -8
COMPREHENSIVE CHEMISTRY MODEL – A recently published detailed chemistry model for isooctane [21] was used to predict the effects of H2 and CO addition on autoignition times. H2 and CO are formed and consumed in the break-up reactions of isooctane; therefore, initial fuel blends containing H2 and CO should be valid inputs to the model. To evaluate the chemical effects due to mixture composition, constant volume calculations were performed. The simulation results illustrated in Fig. 18 show constant volume predictive runs, each beginning at 875 K and 45 bar corresponding to typical conditions at peak pressure in the cylinder. For each mixture, the relative air-fuel ratio was 1.5. The plasmatron reformate case simulates 30% of the gasoline being diverted to the plasmatron. The isooctane + H2 case matches the H2 energy fraction (10%) in the plasmatron case. In the isooctane + CO case, the CO energy fraction matches the CO energy fraction (15%) in the plasmatron case.
The results show that CO and H2, both separately and together, lengthen the ignition delay. Addition of CO to isooctane-air mixture lengthens the ignition delay by 0.5 ms. H2 added to isooctane-air mixture lengthens the ignition delay by 3 ms. The effect of adding H2, CO, and N2 to isooctane-air mixture shows the longest ignition delay – 5 ms longer than the isooctane only case. These trends correspond
to the experimental data trends, which show the same relative ranking for CO, H2 and plasmatron gas addition. It should be noted, however, that in the engine experiments the maximum end-gas temperature does vary somewhat with these fuel changes; see discussion below. The reduced chemistry models run at the same condition for isooctane predict ignition delays of approximately half of those of the comprehensive models [23].
DISCUSSION
This work has shown that knock trends associated with lean operation depend on what parameters are held constant as the mixture is made leaner. If leaner operation is achieved by decreasing fuel flow, while holding airflow constant, the knock tendency of the engine decreases, along with the torque output. This trend of decreasing knock tendency with leaner mixtures, similar to what is displayed in Gruden and Hahn’s work [6], is a result of less reactive end-gas mixtures and lower peak end-gas temperatures due to lower peak pressures. Holding fuel flow constant, and introducing more air to achieve a leaner mixture increases the knock tendency of the engine significantly, as well as engine output because peak temperatures and pressures rise. To achieve constant torque with leaner operation, the air flow must be substantially increased and the fuel flow slightly decreased. In this constant torque scenario, knock tendency increased slightly with increasing leanness. These results imply that a lean engine, boosted to maintain constant torque, is less resistant to knock than a naturally aspirated stoichiometric engine at the same torque output. Estimates of end-gas temperature help explain this last trend. The end-gas can be modeled as a homogeneous mixture, which experiences an isentropic compression. Comparing stoichiometric and lean engine operating conditions at constant torque shows that lean unburned mixtures could reach higher maximum temperatures based on the relevant peak pressures and pressure ratios. The isentropic relation, Eq. (7) and Table 6 illustrate the effect of a higher ratio of specific heats, γu, as occurs in lean mixtures,
where state 1 is the start of compression and state 2 is the point of maximum pressure. Note that changes in the fuel composition also vary �γu due to change PRF fuel concentration in the overall fuel mixture.
0 0.002 0.004 0.006 0.008 0.01 0.012 0.014 0.016 0.018 0.02800
1000
1200
1400
1600
1800
2000
2200
2400
2600
2800
Time [sec]
Tem
pera
ture
[K
]
PRF100 PRF100+Plas GasPRF100+H2 PRF100+CO
Fig.18 – Ignition delays for four fuel mixtures in a constant volume simulation as predicted by a comprehensive chemistry model.
PRF 100
PRF 100 + H2
PRF 100 + Plas Gas
PRF 100 + CO
1
2
1
1
2
TT
pp u
u
=
−
γγ
(7)
THIS DOCUMENT IS PROTECTED BY U.S. AND INTERNATIONAL COPYRIGHTIt may not be reproduced, stored in a retrieval system, distributed or transmitted, in whole or in part, in any form or by any means.
Downloaded from SAE International by University of Wisconsin - Madison , Tuesday, April 03, 2012 07:19:03 PM

12
Table 6: Isentropic compression calculation for constant output operation, with stoichiometric and
lean mixtures.
Lambda T1 [K] P1 [bar]
P2 [bar]
(cp/cv), γu
T2 [K]
1.0 340 1.1 49 1.33 877
1.5 340 1.3 53 1.35 889
That the end-gas in a lean mixture reaches a higher temperature due to compression than a stoichiometric mixture is consistent with findings by a research group at Chalmers and Lund Universities [24]. The researchers found that leaner mixtures reach the critical temperature at a lower compression than richer mixtures. As a consequence, leaner mixtures will autoignite earlier, which results in a higher knock intensity. Experiments show that H2 and CO have an octane-enhancing effect when added to hydrocarbon/air mixtures. The knock changes that occur when H2
and CO are added to the mixture result from several effects. The dominant effect is slowing of the ignition reactions in the end-gas with the addition of H2 and CO. Thus, when these fuels are added to a hydrocarbon blend, they increase the octane number of the overall mixture. The effective mixture ON can be estimated from summing a bond-weighted component ON. Experiments with H2 addition, and CO addition, show the same trends of increasing the knock resistance of the mixture. The benefits of the plasmatron gas mixture (H2, CO, N2) are greater than but comparable to the addition of the separate H2 and CO effects. The H2 addition effect is larger than the CO effect.
CONCLUSIONS
The main conclusions that can be drawn from this work are summarized below: � While operating the engine at constant net
indicated mean effective pressure, leaner mixtures are more likely to knock due primarily to their higher ratio of specific heats than stoichiometric mixtures, which increases the end-gas temperature rise during compression – from intake to peak pressure. Operating with increasingly lean mixtures, while maintaining engine torque constant, requires an increase in manifold intake pressure, which also slightly increases the octane number requirement.
� H2 and CO have high octane numbers and
therefore increase the overall octane number of the fuel mixture when blended with primary
reference fuels. An effective octane number can be calculated by a bond-weighted average of individual fuels’ octane numbers. The octane benefits from H2 and CO do not appear to vary substantially with load or relative air/fuel ratio.
� A reduced chemistry autoignition model was
used to model a small element of end-gas as it follows a specified pressure profile with time. Autoignition is assumed to have occurred when end-gas temperature rises rapidly due to chemical energy release. Predicted autoignition trends for primary reference fuels agree with the experimental data.
� A comprehensive chemistry model was used to
investigate the autoignition delay times for various fuel mixtures in a constant volume situation where initial conditions were similar to that of the end-gas at peak pressure. The fuel mixtures run in the simulation were primary reference fuels alone, and with the addition of plasmatron reformate, and H2 and CO separately. The comprehensive chemical mechanism predicts relative autoignition delay times that agree with the trend shown in the experimental results.
� H2 and CO inhibit knock by slowing autoignition
chemistry and slightly increasing flame speed. In vehicles with onboard reforming the octane number of the fuel mixture that would reach the engine is higher. For example, if 15% of the fuel is reformed to H2 and CO, the resulting fuel mixture will be approximately 10 octane numbers higher than the original HC fuel. Based on previous research relating a change in compression ratio to octane requirements ( e.g. Russ and Chevron [10][25]), an increase in 10 octane numbers would permit an increase of two compression ratios.
ACKNOWLEDGMENTS
This project was supported by a grant from Ford Motor Company.
REFERENCES
[1] Bromberg, L., Cohn, D., Rabinovich, A., and Heywood, J., “Emissions reductions using hydrogen from plasmatron fuel converters,” International Journal of Hydrogen Energy, v 26, n 10, Oct. 2001, p 1115-21.
[2] Heywood, J., Internal Combustion Engine Fundamentals, McGraw-Hill, 1988.
THIS DOCUMENT IS PROTECTED BY U.S. AND INTERNATIONAL COPYRIGHTIt may not be reproduced, stored in a retrieval system, distributed or transmitted, in whole or in part, in any form or by any means.
Downloaded from SAE International by University of Wisconsin - Madison , Tuesday, April 03, 2012 07:19:03 PM

13
[3] Tully, E. and Heywood, J., “Lean-Burn Characteristics of a Gasoline Engine Enriched with Hydrogen from a Plasmatron Fuel Reformer,” SAE 2003-01-0630.
[4] Quader, A., Kirwan, J., and Greive. M.,
“Engine Performance and Emissions Near the Dilute Limit with Hydrogen Enrichments Using an On-Board Reforming Strategy,” SAE 2003-01-1356.
[5] Bromberg, L., Cohn, D., Rabinovich, A.,
Surma, J., and Virden, J., “Compact plasmatron-boosted hydrogen generation technology for vehicular applications,” International Journal of Hydrogen Energy, v 24, n 4, April 1999, p 341-350.
[6] Gruden, D., and Hahn, R., “Performance,
Exhaust Emissions and Fuel Consumption of a IC Engine Operation with Lean Mixtures,” I Mech E Publication (C111/79), 1979.
[7] Quissek, F., Milulic, L., and Bandel, W.,
“Application of the AVL High Compression Lean Burn System to Passenger Car Engines,” SAE 885092.
[8] Stokes, J., Lake, T., and Osborne, R., “A
Gasoline Engine Concept for Improved Fuel Economy – The Lean Boost System,” SAE 2000-01-2902.
[9] Betts, W., Gozzelino, R., Poullot, B., and
Williams, D., “Knock and Engine Trends,” Coordinating European Council Second International Symposium, 1985.
[10] Russ, S., “A Review of the Effect of Engine
Operating Conditions on Borderline Knock,” SAE 960497.
[11] Natkin, R., Ford Motor Company, Private
Communication, June 2003. [12] Tang, X., Heffel, J., et al., “Ford P2000
Hydrogen Engine Dynamometer Development,” SAE 2002-01-0242.
[13] Green, R. and Pearce, S., “Alternative
Transport Fuel,” Energy World, pp. 8-11, October 1994.
[14] Glassman, I., Combustion, Academic Press,
Inc., 1996. [15] Hu, H. and Keck, J., “Autoigntion of
Adiabatically Compressed Combustible Gas Mixtures”, SAE 872110.
[16] Keck, J. and Hu, H., “Explosions of
Adiabatically Compressed Gases in a Constant Volume Bomb,” 21st International Symposium on Combustion, The Combustion Institute, 1986, pp 521-529.
[17] Cowart, J., and Heywood, J., “The Intensity of
Knock in an Internal Combustion Engine: An Experimental and Modeling Study,” SAE 922327.
[18] Chun, K., Heywood, J., and Keck, J.,
“Prediction of Knock Occurrence in a Spark Ignition Engine,” 22nd International Symposium on Combustion, The Combustion Institute, pp 455-463, 1988.
[19] Tanaka, S., Ayala, F., and Keck, J., “A
Reduced Chemical Kinetic Model for HCCI Combustion of Primary Reference Fuels,” Combustion and Flame, Volume 133, pp 467-481, 2003.
[20] Tanaka, S., Ayala, F., Keck J., and Heywood
J., “Two-stage ignition in HCCI combustion and HCCI control by fuels and additives,” Combustion and Flame, Volume 132, pp 219-239, 2003.
[21] Curran, H., Gaffuri, P., Pitz, W., Westbrook,
C., “A Comprehensive Modeling Study of iso-Octane Oxidation,” Combustion and Flame, Volume 129, pp 253-280, 2002.
[22] Fox, J., Cheng, W., and Heywood J., “A Model
for Predicting Residual Gas Fraction in Spark-Ignition Engines,” SAE 931025.
[23] Topinka, J., “Knock Behavior of a Lean-Burn,
Hydrogen-Enhanced Engine Concept,” MS Thesis, Department of Mechanical Engineering, MIT, 2003.
[24] Grandin, B., et al., “Heat Release in the End-
Gas Prior to Knock in Lean, Rich, and Stoichiometric Mixtures With and Without EGR,” SAE 2002-01-0239.
[25] Chevron Technical Review, “Motor Gasolines,”
1996.
THIS DOCUMENT IS PROTECTED BY U.S. AND INTERNATIONAL COPYRIGHTIt may not be reproduced, stored in a retrieval system, distributed or transmitted, in whole or in part, in any form or by any means.
Downloaded from SAE International by University of Wisconsin - Madison , Tuesday, April 03, 2012 07:19:03 PM