Embed Size (px)
Citation preview
Trends ReviewGas Price
OakleyOGW reenwoodG
FEBRUARY 2016Revision 1
i
Disclaimer
The Gas Price Trends Review Report (Report) has been commissioned by the Commonwealth of Australia as represented by the Department of Industry, Innovation and Science, and prepared by an external consultant Oakley Greenwood Pty Ltd in consultation with EMS and MDQ Consulting.
The Gas Price Trends Review Report contains an aggregation of historical gas prices compiled to provide users with an understanding of industrial and residential gas prices. The prices in the Report are not an indication of future gas prices.
The Report has been developed and made publicly available to inform research, policy development, consumers, and market participants about historical gas prices.
The Commonwealth, its officers, employees, or agents are not responsible for any negligence, loss or damage howsoever caused, or for any expense or cost incurred by any person as a result of access to, use of, or reliance on, any information or data contained in the Report.
The Commonwealth does not make any representation as to the currency, accuracy, reliability or completeness of the information contained in the Report.
Readers should obtain their own independent advice before relying on the information contained in the Report. The Report does not indicate a commitment by the Australian Government to a particular course of action.
Acknowledgements
This report and data was commissioned by the Australian Government Department of Industry, Innovation and Science. The report was prepared by Jim Snow, Jeff Thong, Angus Rich and Tim Ryan of Oakley Greenwood, and Craig Langford of MDQ Consulting with data input from Energy and Management Services. Front cover image courtesy of James Davies, Fairfax Syndication.
© Commonwealth of Australia 2015
Ownership of intellectual property rights
Unless otherwise noted, copyright (and any other intellectual property rights, if any) in this publication is owned by the Commonwealth of Australia.
Creative Commons Licence Attribution CC BY
All material in this publication is licensed under a Creative Commons Attribution 3.0 Australia Licence, save for content supplied by third parties, logos, any material protected by trademark or otherwise noted in this publication, and the Commonwealth Coat of Arms.
Creative Commons Attribution 3.0 Australia Licence is a standard form licence agreement that allows you to copy, distribute, transmit and adapt this publication provided you attribute the work. A summary of the licence terms is available from creative commons license terms summary web page. The full licence terms are available from creative commons full licence terms web page.
Content contained herein should be attributed as Commonwealth of Australia Gas Price Trends Review.
ISBN: 978-1-925092-65-3 (online)
Department of Industry, Innovation and Science
Energy Division
GPO Box 9839
Canberra ACT 2601 Australia
Email: [email protected]
Web: http://www.industry.gov.au/GasPriceTrends
ii
Revisions
Number Description
1 “Energy Management Systems” changed to “Energy and
Management Services” in Acknowledgements.
Paragraph deleted in Section 8.2.4.
Figure 66 title changed.
Figure 67 title changed.
iii
Table of Contents
1 Executive Summary ............................................................................................. 1
1.1 Gas supply chain cost components .............................................................. 1
1.2 Industrial gas prices ..................................................................................... 2
1.2.1 Industrial gas price trends ........................................................................ 3
1.3 Residential gas prices .................................................................................. 5
1.3.1 Residential gas price trends ..................................................................... 5
2 Industrial gas price trends introduction ................................................................. 8
2.1 Domestic gas consumption .......................................................................... 8
2.2 LNG Exports ................................................................................................ 9
2.3 Australia’s wholesale gas markets.............................................................. 10
3 Key factors influencing industrial gas prices ....................................................... 12
3.1 Customer size ............................................................................................ 12
3.2 Load factor ................................................................................................. 12
3.3 Take or pay levels ...................................................................................... 15
3.4 Contract term ............................................................................................. 16
3.5 Producer vs retailer supply ......................................................................... 17
3.5.1 Retailer supply to large industrial customers .......................................... 18
3.6 Gas supply agreement price reviews .......................................................... 18
3.7 Queensland LNG impact ............................................................................ 20
3.8 Contract timing and implications in 2011-2015 ........................................... 20
3.9 Transportation charges .............................................................................. 21
3.10 Other gas fees and charges ....................................................................... 22
3.10.1 Carbon tax ............................................................................................ 23
3.11 Regional effects ......................................................................................... 25
3.12 Specific small industrial customers characteristics ..................................... 25
4 Industrial Customer Price History ....................................................................... 27
4.1 Victoria industrial gas prices ....................................................................... 27
4.1.1 Large industrial customer price trends .................................................... 27
4.1.2 Victorian large industrial customer gas price analysis ............................. 29
4.1.3 Small industrial customer price trends .................................................... 30
iv
4.1.4 Factors influencing Victorian industrial gas prices .................................. 32
4.1.5 Gascor contract ...................................................................................... 32
4.1.6 Introduction of new sources of gas supply to Victoria ............................. 33
4.1.7 Market Structure ..................................................................................... 33
4.1.8 Timeline of major influences on the Victorian gas market ....................... 34
4.2 Tasmanian industrial gas prices ................................................................. 35
4.2.1 Tasmanian large industrial gas price trends ........................................... 36
4.3 New South Wales and the Australian Capital Territory industrial gas prices 38
4.3.1 Gas prices for large industrial customers ................................................ 38
4.3.2 Influence of Cooper Basin gas prices to NSW and SA ........................... 40
4.3.3 Major factors influencing the Moomba gas market .................................. 41
4.3.4 New gas supply competition in NSW ...................................................... 45
4.3.5 NSW and ACT large industrial gas prices 2010 to 2015 ......................... 45
4.3.6 NSW small industrial customer gas prices .............................................. 45
4.4 South Australia industrial gas prices ........................................................... 49
4.4.1 Gas prices for large industrial customers ................................................ 49
4.4.2 Large SA industrial customer prices ....................................................... 51
4.4.3 SEA Gas deliveries to SA ....................................................................... 51
4.5 Queensland large industrial gas prices ....................................................... 51
4.5.1 Brisbane/South East Queensland large industrial customer gas prices .. 53
4.5.2 Brisbane and SEQ large industrial gas price history ............................... 55
4.5.3 Gladstone large industrial gas customers ............................................... 56
4.5.4 Gladstone large industrial customer gas price history ............................. 58
4.5.5 North West Queensland large industrial customer gas prices ................. 59
4.5.6 NWQ large industrial gas customer price history .................................... 61
4.5.7 Queensland large industrial customer gas price averages ...................... 61
4.6 East coast industrial gas price average ...................................................... 63
4.7 Northern Territory ....................................................................................... 65
4.7.1 Demand ................................................................................................. 65
4.7.2 Gas transmission.................................................................................... 66
4.7.3 Gas supply ............................................................................................. 68
4.7.4 Forecast demand ................................................................................... 68
v
4.8 WA large industrial gas customer prices (Perth) ......................................... 69
4.8.1 Large industrial customer price trends .................................................... 69
4.8.2 WA large industrial customer gas price history ....................................... 71
4.9 National summary of large industrial customer gas prices .......................... 73
4.9.1 National large industrial gas price comparison ....................................... 75
5 Key drivers of future industrial gas prices ........................................................... 78
6 Residential gas price trends introduction ............................................................ 82
7 Key factors influencing residential gas prices ..................................................... 83
7.1 Retail price regulation ................................................................................ 83
7.2 Key drivers ................................................................................................. 84
7.2.1 Distribution charges ................................................................................ 84
7.2.2 Declining average consumption .............................................................. 86
7.2.3 Wholesale gas price ............................................................................... 87
7.2.4 Retail cost component and role of the retailer ......................................... 88
7.2.5 Pricing structures.................................................................................... 88
7.3 Environmental policies ............................................................................... 89
8 Residential price history ..................................................................................... 90
8.1 Victoria ....................................................................................................... 90
8.1.1 Victorian residential gas prices ............................................................... 90
8.1.2 Market overview ..................................................................................... 93
8.1.3 Regulatory environment ......................................................................... 96
8.1.4 Victorian seasonal tariffs ........................................................................ 97
8.1.5 Victorian household consumption ........................................................... 98
8.1.6 Victorian gas price components and trends .......................................... 100
8.1.7 Further developments .......................................................................... 102
8.2 Tasmania ................................................................................................. 103
8.2.1 Tasmanian residential gas prices ......................................................... 103
8.2.2 Market Overview .................................................................................. 106
8.2.3 Tasmanian household consumption ..................................................... 107
8.2.4 Residential price components and trends ............................................. 109
8.2.5 Further developments .......................................................................... 109
8.3 New South Wales ..................................................................................... 110
vi
8.3.1 NSW residential gas prices .................................................................. 110
8.3.2 Rural NSW residential gas pricing ........................................................ 112
8.3.3 NSW average residential gas prices ..................................................... 116
8.3.4 Market overview ................................................................................... 117
8.3.5 NSW household consumption .............................................................. 119
8.3.6 NSW residential gas price components and trends .............................. 122
8.3.7 Further developments .......................................................................... 123
8.4 Australian Capital Territory ....................................................................... 124
8.4.1 Residential gas prices .......................................................................... 124
8.4.2 Overview .............................................................................................. 126
8.5 South Australia ......................................................................................... 129
8.5.1 SA residential gas prices ...................................................................... 129
8.5.2 Market overview ................................................................................... 131
8.5.3 Regulatory environment ....................................................................... 133
8.5.4 SA household consumption .................................................................. 134
8.5.5 SA residential gas price components and trends .................................. 135
8.5.6 Further developments .......................................................................... 136
8.6 Queensland .............................................................................................. 137
8.6.1 Qld residential gas prices ..................................................................... 137
8.6.2 Market overview ................................................................................... 139
8.6.3 Queensland household consumption.................................................... 141
8.6.4 Queensland residential gas price components and trends .................... 142
8.6.5 Further developments .......................................................................... 143
8.7 Western Australia ..................................................................................... 144
8.7.1 WA residential gas prices ..................................................................... 144
8.7.2 Market overview ................................................................................... 147
8.7.3 WA household consumption ................................................................. 149
8.7.4 WA residential gas price components and trends ................................. 151
8.7.5 Further developments .......................................................................... 152
9 National summary of residential gas prices ...................................................... 154
9.1 National retail price comparison ............................................................... 156
9.2 Distribution network charges .................................................................... 159
vii
9.3 National retailer component ..................................................................... 159
Appendix A : Methodology ....................................................................................... 161
A.1 Approach taken to industrial price review ................................................. 162
A.1.1 Data gathering and validation ............................................................. 162
A.2 Residential methodology .......................................................................... 168
A.2.1 How average household gas prices are calculated ............................. 168
A.2.2 Residential tariffs: Market and Standing Offers ................................... 172
A.2.3 Retail gas supply chain components .................................................. 174
A.2.4 National average ................................................................................ 179
viii
Table of Figures
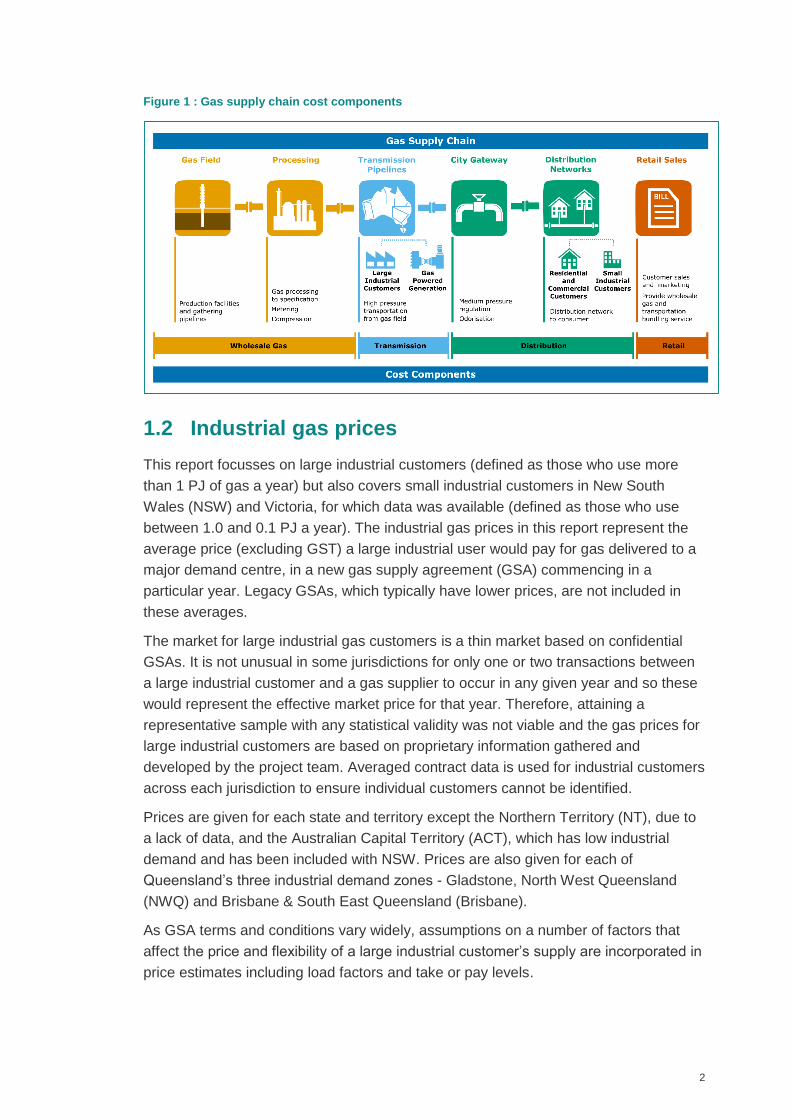
Figure 1 : Gas supply chain cost components ............................................................. 2
Figure 2 : Gas price trend for large industrial customers on new gas supply
agreements ................................................................................................................. 4
Figure 3: Average residential gas price trend by state ................................................. 6
Figure 4 : Annual gas consumption in Australia by sector for financial year 2013-2014.
.................................................................................................................................... 8
Figure 5: Annual gas consumption by sector and jurisdiction for financial year 2013-
2014. ........................................................................................................................... 9
Figure 6: Domestic gas consumption and LNG exports, with projections from 2014-15
.................................................................................................................................. 10
Figure 7: Victorian real and nominal large industrial gas prices (Melbourne) ............. 27
Figure 8: Victorian large industrial customer gas price components (Melbourne)....... 28
Figure 9: Victorian large industrial gas price components by % ................................. 28
Figure 10 : Victorian small industrial customer gas price components (Melbourne) ... 30
Figure 11: Victorian small industrial customer gas price components (country Victoria)
.................................................................................................................................. 31
Figure 12: Victorian small industrial wholesale price comparison. .............................. 31
Figure 13: Tasmania real and nominal large industrial customer gas prices (Hobart) 36
Figure 14: Tasmanian large industrial customer gas price components ..................... 37
Figure 15: Tasmanian large industrial gas price components by % ........................... 37
Figure 16: NSW & ACT real and nominal large industrial customer gas prices .......... 38
Figure 17: NSW & ACT large industrial customer gas price components ................... 39
Figure 18: NSW & ACT large industrial gas price components by %. ........................ 39
Figure 19: Historical Cooper Basin production over the last 15 years for gas and
ethane ....................................................................................................................... 41
Figure 20: NSW small industrial customer gas price components (Sydney) ............... 46
Figure 21: NSW small industrial gas price components % (Sydney) .......................... 46
Figure 22: Comparison of NSW and Victorian small industrial customer wholesale gas
prices ......................................................................................................................... 47
Figure 23: NSW small industrial wholesale price comparison. ................................... 47
Figure 24: SA real and nominal large industrial gas price trends (Adelaide) .............. 49
Figure 25: SA large industrial customer gas prices components (Adelaide) ............... 50
ix
Figure 26: SA large industrial customer gas price components by % ......................... 50
Figure 27: Queensland node map ............................................................................. 52
Figure 28: Brisbane & SEQ large industrial customer gas price history ..................... 53
Figure 29: Brisbane and SEQ large industrial customer gas prices components ....... 54
Figure 30: Brisbane and SEQ large industrial customer gas price components by % 54
Figure 31: Gladstone large industrial customer gas price history ............................... 57
Figure 32: Gladstone large industrial customer gas price components ...................... 57
Figure 33: Gladstone large industrial customer gas price components by % ............. 58
Figure 34: NWQ large industrial customer gas price history ...................................... 59
Figure 35: NWQ large industrial customer gas price components .............................. 60
Figure 36: NWQ large industrial customer gas price components by % ..................... 60
Figure 37: Weighted average large industrial customer gas price trend Queensland . 62
Figure 38: Weighted average large industrial customer gas price components
Queensland ............................................................................................................... 62
Figure 39: Weighted average large industrial gas customer price components
Queensland by %. ..................................................................................................... 63
Figure 40: East Coast weighted average large industrial gas price trend ................... 64
Figure 41: East Coast weighted average large industrial customer gas price
components ............................................................................................................... 64
Figure 42 : East Coast weighted average large industrial customer gas price
components % ........................................................................................................... 65
Figure 43: Map of the Northern Territory gas system ................................................. 67
Figure 44: Northern Territory average annual gas demand and forecast ................... 69
Figure 45: WA real and nominal large industrial customer gas price history (Perth) ... 70
Figure 46: WA large industrial customer gas price components ................................. 70
Figure 47: WA large industrial customer gas price components % ............................ 71
Figure 48: Australian weighted average large industrial gas price trend .................... 73
Figure 49: Australian weighted average large industrial gas price components ......... 74
Figure 50: Australian weighted average large industrial gas price components % ..... 74
Figure 51: Gas price trends for large industrial customers on new gas supply
agreements. .............................................................................................................. 75
Figure 52: Percent contribution of cost components to real industrial gas price
increases for 2002 to 2015. ....................................................................................... 77
Figure 53: WA large industrial customer wholesale gas pricing “bubble” ................... 79
x
Figure 54 Map of the gas transmission and gas distribution areas and retail demand in
Australia .................................................................................................................... 82
Figure 55: Benchmark network charges (¢/MJ) vs. distribution energy density (GJ/m
network) .................................................................................................................... 86
Figure 56: Typical consumption trends of household gas use .................................... 86
Figure 57: Victorian average gas price components .................................................. 90
Figure 58: Victorian average residential gas price components by % ........................ 91
Figure 59: Typical Household Gas Bill – AusNet Services, Vic .................................. 92
Figure 60: Typical Household Gas Bill – Multinet, Vic ................................................ 92
Figure 61: Typical Household Gas Bill – Australian Gas Networks, Vic ..................... 93
Figure 62: Map of Victorian distribution networks....................................................... 95
Figure 63: Victorian average household gas consumption levels ............................... 98
Figure 64: Average Victorian average household consumption and effective degree
days (EDDs) .............................................................................................................. 99
Figure 65: Main source of space heating for Victorian households ............................ 99
Figure 66: Tasmania residential gas price components ........................................... 104
Figure 67: Tasmania average gas price supply component proportions .................. 105
Figure 68: Tasmania typical household gas bill ....................................................... 105
Figure 69: Tasmanian gas distribution networks ...................................................... 106
Figure 70: Main sources of energy for space heating - Tasmania ............................ 108
Figure 71: NSW metro average household gas price components .......................... 110
Figure 72: NSW household gas price component % ................................................ 111
Figure 73: NSW metro typical household gas bill ..................................................... 112
Figure 74: NSW average household gas price components (Rural) ......................... 113
Figure 75: NSW average household gas price component % (Rural) ...................... 113
Figure 76: NSW typical household gas bill (Rural) ................................................... 115
Figure 77: NSW typical household gas bill compared (Rural and Metro) ................. 115
Figure 78: NSW residential weighted average residential gas price ......................... 116
Figure 79: NSW weighted average residential gas price supply component proportions
................................................................................................................................ 116
Figure 80: NSW distribution network and zoning ..................................................... 117
Figure 81: NSW household average gas consumption (Sydney - actual and forecast)
................................................................................................................................ 120
xi
Figure 82: Sydney Jemena network connection consumption histogram ................. 121
Figure 83: Main sources of energy for space heating – New South Wales............... 122
Figure 84: ACT average residential gas price components ...................................... 125
Figure 85: ACT average residential gas price component % ................................... 125
Figure 86: ACT typical household gas bill ................................................................ 126
Figure 87: ActewAGL Distribution network map ....................................................... 127
Figure 88: Main sources of energy for space heating – ACT ................................... 128
Figure 89: SA average residential gas price components ........................................ 129
Figure 90: SA average residential gas price component percentage ....................... 130
Figure 91: SA typical household gas bill (Adelaide) ................................................. 131
Figure 92: SA gas distribution network .................................................................... 132
Figure 93: SA typical household gas consumption ................................................... 134
Figure 94: Main sources of energy for space heating – SA ...................................... 135
Figure 95: Queensland residential gas price components ........................................ 137
Figure 96: Proportion of Queensland residential gas price components .................. 138
Figure 97: Typical Household Gas Bill – Australian Gas Networks, Queensland ..... 139
Figure 98: Typical Household Gas Bill – Allgas network, Queensland ..................... 139
Figure 99: Map of Queensland’s gas distribution networks ...................................... 140
Figure 100: QLD average household gas consumption ........................................... 141
Figure 101: Main sources of energy for space heating – Queensland...................... 142
Figure 102: WA residential gas price components ................................................... 144
Figure 103: Proportion of Western Australia residential gas price components ........ 145
Figure 104: WA typical household gas bill ............................................................... 146
Figure 105: Comparison of wholesale gas price estimates ...................................... 146
Figure 106: WA residential gas regions ................................................................... 147
Figure 107: WA typical household gas consumption ................................................ 150
Figure 108: Main sources of energy for space heating – Western Australia ............. 151
Figure 109: All jurisdictions average residential gas retail prices ............................. 154
Figure 110: Proportion of national average residential gas price components ......... 156
Figure 111: Residential gas price trends by state ($2015) ....................................... 156
Figure 112: Percent contribution of each cost component to the increase in real
residential gas prices from 2006 to 2015 ................................................................. 158
xii
Figure 113: Benchmark network charges ($/GJ) versus distribution energy density
(GJ/m network) ........................................................................................................ 159
Figure 114 : Retailer component revenue estimate for each state jurisdiction .......... 160
Figure 115 Gas Market Regulation in Different Jurisdictions .................................... 173
Figure 116 : National Natural Gas Consumption by State ........................................ 180
Figure 117: Residential gas consumption percentages by state in 2013 .................. 180
xiii
Table of Tables
Table 1: Scope 3 emission factors for natural gas consumption ................................ 24
Table 2: Timeline of influential events which impacted the Victorian gas market........ 34
Table 3: Timeline of major factors which influenced the ex-Moomba wholesale gas
price .......................................................................................................................... 43
Table 4 Average delivered gas price and cost components in 2015 for large industrial
users on new gas supply agreements. ....................................................................... 76
Table 5: Household gas penetration in Victoria (%) ................................................... 95
Table 6 List of Victorian gas retailers and proportion of market share in 2014 ........... 96
Table 7: Proportion of Victorian households that have reverse-cycle air-conditioning as
their choice of cooling (%) ....................................................................................... 100
Table 8: Fixed and variable tariff components ($2015) based on average market offers
................................................................................................................................ 104
Table 9: Household gas penetration rate in Tasmania (%) ...................................... 107
Table 10: Space heating comparison ....................................................................... 108
Table 11: Comparison of retail and network costs proportions for rural NSW .......... 114
Table 12: NSW Distribution network ownership and connections ............................ 118
Table 13: List of New South Wales gas retailers and proportion of market share..... 119
Table 14: Household gas penetration in NSW (%) ................................................... 119
Table 15: NSW average household consumption (2014) ......................................... 121
Table 16: List of Australian Capital Territory gas retailers and proportion of market
share ....................................................................................................................... 127
Table 17: Household gas penetration in the ACT (%) .............................................. 128
Table 18: List of SA gas retailers and proportion of market share as at March 2015 133
Table 19: Household gas penetration rate in SA (%) ............................................... 133
Table 20: Household gas penetration in Queensland (%) ........................................ 141
Table 21: Household gas penetration rate in Western Australia (%) ........................ 149
Table 22: National average gas bill component breakdown and percentages .......... 155
Table 23: Average delivered gas price and cost components for a typical household in
2015 ........................................................................................................................ 157
Table 24: Summary of carbon tax impost on retail customers .................................. 178
xiv
Abbreviations and acronyms
Acronym Description
2P Proved and Probable gas reserves (typically in PJ)
ACQ Annual Contract Quantity (typically in PJ per year)
ADQ Average Daily Quantity (typically in TJ per day)
AEMC Australian Energy Market Commission
AEMO Australian Energy Market Operator
AER Australian Energy Regulator
AGN Australian Gas Networks
CGP Carpentaria Gas Pipeline
CLF Customer Load Factor
CNG Compressed Natural Gas
CO2 Carbon Dioxide
CSG Coal Seam Gas
DBNGP Dampier to Bunbury Natural Gas Pipeline
DWGM Declared Wholesale Gas Market – the Victorian gas market
operated by AEMO
EDD Effective Degree Days
EGP Eastern Gas Pipeline – the gas transmission pipeline from
Longford to Sydney
ERAWA Economic Regulation Authority Western Australia
ESC(V) Essential Services Commission of Victoria
ESCOSA Essential Services Commission of South Australia
ESS NSW Energy Efficiency Scheme
GGP Goldfields Gas Pipeline
xv
Acronym Description
GLNG Gladstone Liquefied Natural Gas
GPG Gas Power Generation
GSA Gas Supply Agreement – sometimes also called a Gas
Sales Agreement
GSH Gas Supply Hub – the Wallumbilla GSH operated by AEMO
GTA Gas Transmission Agreement
ICRC Independent Competition and Regulatory Commission
IPART Independent Pricing and Regulatory Tribunal (NSW)
JV Joint Venture
LNG Liquefied Natural Gas
LPG Liquefied Petroleum Gas
MAPS Moomba to Adelaide Pipeline System
MDQ Maximum Daily Quantity (typically in TJ per day)
MSP Moomba to Sydney pipeline
NCC National Competition Council
NECF National Energy Customer Framework
NGER National Greenhouse Emissions Reporting
NEM National Electricity Market
NGA (Australian) National Greenhouse Accounts
OTTER Office of the Tasmanian Economic Regulator
PPS Pilbara Pipeline System
QCLNG Queensland Curtis LNG
QGP Queensland Gas Pipeline
RBP Roma to Brisbane Gas Pipeline
xvi
Acronym Description
RMS Retail Market Scheme
SLF Supply Load Factor
SRES Small Scale Renewable Energy Scheme
STTM Short Term Trading Market
SWQP South west Queensland Gas Pipeline
TGP Tasmanian Gas Pipeline
ToP Take or Pay
UAG Unaccounted for Gas
VEET Victorian Energy Efficiency Target
VTS Victorian Transmission System
WACC Weighted Average Cost of Capital
xvii
Units
Unit Description
MJ Megajoules
GJ Gigajoules (1GJ = 1000 MJ)
TJ Terajoules (1TJ = 1000 GJ)
PJ Petajoules (1GJ = 1000 TJ)
¢/MJ 2015 Australian cents per MJ - in year 2015 real terms
$/GJ 2015 Australian dollars per GJ - in year 2015 real terms
xviii
Glossary of specific gas terms used in the report
Term Description
Commodity Gas The price of gas ex field without consideration of
transportation and other charges.
Effective degree days Effective degree days is a weather variable set out by
AEMO that is created from a number of climate variables
which include temperatures, wind speeds and daily sun
hours as well as seasonal impacts to produce a linear
relationship between temperature and gas demand. It
provides a means of simplifying demand models and an
improvement of the fit of weather demand models.
Gas distribution zone A gas distribution zone in the retail analysis is an area that
correlates to the area of a regulated or monopoly gas
distribution network provider. It often defines the region that
retail standing and market offers are based on.
Gas shipper
A gas shipper is a customer of a transmission pipeline(s) -
typically a retailer or a large industrial customer, but can
also be a producer - that has a contract to haul gas.
Gas swaps
The underlying concept of a gas swap as used in this report
is the exchange of gas at one physical location for an
amount delivered at another physical location – effectively
payments are based on the exchange of some fixed amount
of gas volume between regions or market participants which
never physically changes hands – they are effectively
“swapped”. This can be used to overcome physical gas
transmission limitations on the wholesale gas market.
Illiquid market
An illiquid market is defined as one without many
transactions (annually) and is typified by either a small
number of sellers or buyers, or both – the wholesale gas
markets in Australia are typified as being illiquid for this
reason and some jurisdictional (state) locations may only
have one or two major gas transactions annually.
xix
Term Description
LNG netback
LNG netback gas pricing is the cost of gas at the wellhead
for gas supplied to LNG facilities, and is worked out by
deducting gas shipping (sea freight) costs, liquefaction
costs and pipeline transportation costs from delivered LNG
export prices.
Load factor The ratio (e.g. 1.2) of the Maximum Daily Quantity (MDQ) to
the Average Daily Quantity (ADQ) that a customer’s gas
supply agreement and/or gas transportation agreement
specifies. It gives an indication of the flexibility of a
customer’s contracted supply.
Market offer
A contract offered by a gas retailer to a customer where gas
tariffs are set by the retailer and which may have terms and
conditions in addition to those in a standing offer. Market
offers tend to be cheaper than standing offers. See A.2.1.7
for details.
Price maker
In this report the term price maker has been used where it is
considered that a specific market location or producer sets
the price for the wholesale market as a whole - the price
being limited only by the highest priced alternative
opportunity cost for the gas (e.g. LNG netback) and thus
can set (or make) the price for all supply in that wholesale
market. Occurs typically where wholesale gas markets are
not oversupplied relative to demand.
Ramp gas
Ramp gas is CSG that is produced by an LNG project prior
to their LNG plant’s commissioning.
Retail gas market
The retail gas market is defined in this report as being the
supply and sale of gas to residential, small business and
commercial customers.
Short or long (on gas)
Gas producers, retailers and major industrial gas users can
be short or long on gas over any given supply period. This
means they may have under or over contracted for supply
to meet their anticipated demand and could need to buy
additional gas or sell excess gas in order to avoid financial
penalties and therefore manage potential financial impacts.
xx
Term Description
Standing (or
Standard) Offer
This is a basic contract offered by a gas retailer to a
customer where terms and conditions and, where prices are
regulated, tariffs are set by set by state Governments or
jurisdictional regulators. See A.2.1.6 for details.
Take or Pay Take or Pay is a gas contract term that denotes the
minimum amount of gas that must be either taken or paid
for – typically quoted as a percentage of the ACQ
Transmission system
use gas
Transmission system use gas is gas provided to operators
of the transmission pipelines to cover compressor fuel,
metering errors, unaccounted for gas and venting during
maintenance and expansion activities (generally less than
1-2% of transmission pipeline annual throughput).
Unaccounted for gas Unaccounted for gas is a measure of the amount of gas lost
in transport systems either directly emitted or through
metering errors
Wholesale gas market The wholesale gas market is defined in this report to be
where gas producers, retailers, and large gas consuming
(industrial) customers buy and sell gas – the two key areas
are the east and west coast markets as these are not
physically interconnected.
1
1 Executive Summary
The opaque nature of Australia’s wholesale natural gas markets and the deregulation
of natural gas retail markets in most states and territories mean there is limited
information in the public domain about the gas prices paid by industrial and residential
customers.
The Commonwealth Department of Industry, Innovation and Science has
commissioned Oakley Greenwood to review gas price trends. This report is intended
to help fill this information gap and inform market participants, consumers and policy
development.
This report provides estimates of industrial and residential gas prices, the cost
components of these prices and their historical trends, for each state and territory. The
report also discusses the factors driving these price trends and provides background
to the development of wholesale and residential gas markets.
The analyses and opinions in this report are those of Oakley Greenwood and should
not be taken to represent the opinions of the Department of Industry, Innovation and
Science, the Australian Government or any state or territory government.
This report has three accompanying spreadsheets covering the large industrial, small
industrial and retail sectors, which provide the data on which the report is based.
These have been published at www.industry.gov.au/gaspricetrends.
1.1 Gas supply chain cost components
Figure 1 shows the four major cost components of the gas supply chain – wholesale
gas, transmission pipelines, distribution networks and retailers. These components
make up the gas price paid by industrial and residential customers, noting most large
industrial customers pay wholesale and transmission costs only. Environmental policy
costs are also considered but, except for carbon pricing, had negligible impact on
industrial and residential prices.
2
Figure 1 : Gas supply chain cost components
1.2 Industrial gas prices
This report focusses on large industrial customers (defined as those who use more
than 1 PJ of gas a year) but also covers small industrial customers in New South
Wales (NSW) and Victoria, for which data was available (defined as those who use
between 1.0 and 0.1 PJ a year). The industrial gas prices in this report represent the
average price (excluding GST) a large industrial user would pay for gas delivered to a
major demand centre, in a new gas supply agreement (GSA) commencing in a
particular year. Legacy GSAs, which typically have lower prices, are not included in
these averages.
The market for large industrial gas customers is a thin market based on confidential
GSAs. It is not unusual in some jurisdictions for only one or two transactions between
a large industrial customer and a gas supplier to occur in any given year and so these
would represent the effective market price for that year. Therefore, attaining a
representative sample with any statistical validity was not viable and the gas prices for
large industrial customers are based on proprietary information gathered and
developed by the project team. Averaged contract data is used for industrial customers
across each jurisdiction to ensure individual customers cannot be identified.
Prices are given for each state and territory except the Northern Territory (NT), due to
a lack of data, and the Australian Capital Territory (ACT), which has low industrial
demand and has been included with NSW. Prices are also given for each of
Queensland’s three industrial demand zones - Gladstone, North West Queensland
(NWQ) and Brisbane & South East Queensland (Brisbane).
As GSA terms and conditions vary widely, assumptions on a number of factors that
affect the price and flexibility of a large industrial customer’s supply are incorporated in
price estimates including load factors and take or pay levels.
3
1.2.1 Industrial gas price trends
In recent years there has been much anecdotal evidence about prices struck in new
GSAs. The industrial gas prices in this report are intended to be indicative only and
may differ from prices in the public domain for particular industrial customers.
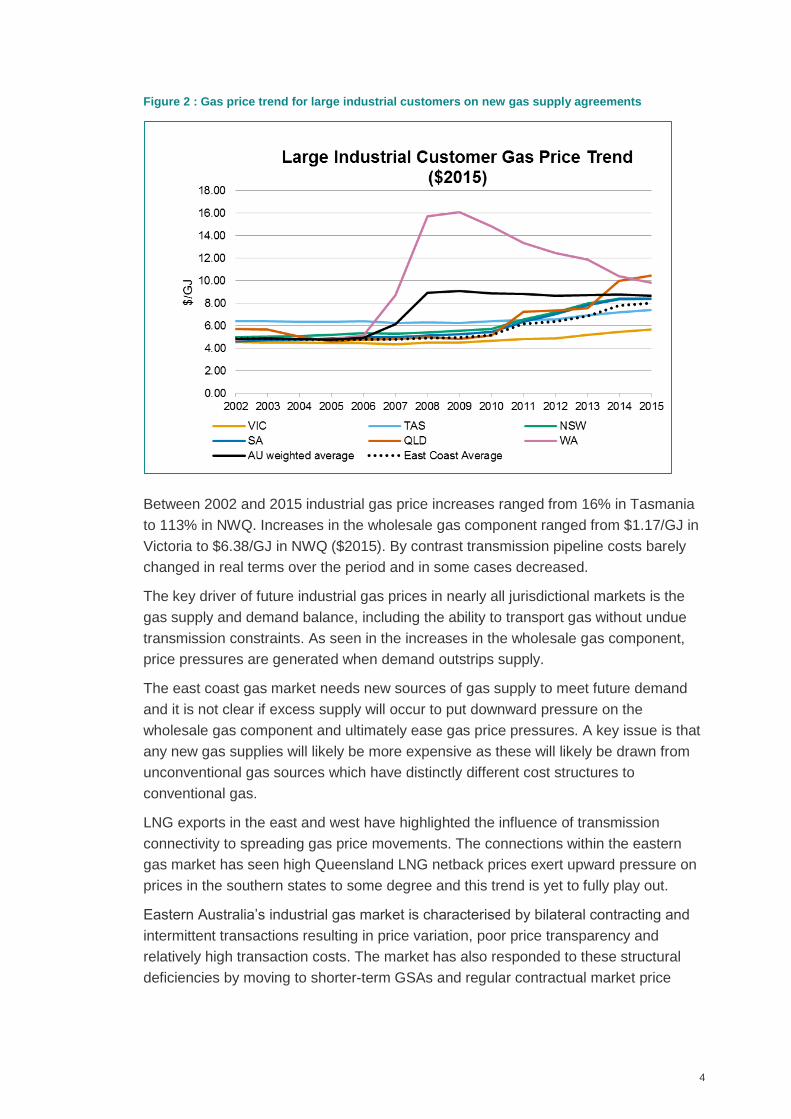
Figure 2 shows the 2002 to 2015 trend for real average delivered gas prices for large
industrial customers on new GSAs in each state. In 2015 delivered gas prices ranged
from $5.68/GJ in Victoria to $11.97/GJ in NWQ. Large industrial customer gas prices
have two basic cost components: wholesale gas costs and transmission pipeline
costs. For all states wholesale gas costs made up the majority of industrial gas prices
(from 71 % of the delivered gas price in Tasmania to 94% in Brisbane) and ranged
from $5.30/GJ in Victoria to $10.30/GJ in NWQ. Transmission pipeline costs ranged
from $0.38/GJ in Victoria to $2.12/GJ in Tasmania.
Industrial gas prices have been steadily rising in all states except Western Australia
(WA), where prices peaked in 2009 and have been declining since.
Industrial gas prices rose sharply in WA around 2006 as increasing demand from
domestic growth and the commodity boom had caught up with available gas supply.
Many large gas producers, driven by high Asian LNG prices, focussed on liquefied
natural gas (LNG) export opportunities and this also impacted market structure and
gas supply. The introduction of oil linking in place of CPI price escalation and US dollar
pricing in GSAs also contributed to the sharp price increase.
By comparison, Victorian industrial gas prices were lower than other states due to their
proximity to Bass Strait supplies and their distance from Gladstone LNG projects.
There are currently no environmental policies that directly affect gas prices for large
industrial customers. The effect of carbon pricing in financial years 2012/13 and
2013/14 ranged from $0.10/GJ in Victoria to $0.32/GJ in NSW ($2015).
4
Figure 2 : Gas price trend for large industrial customers on new gas supply agreements
Between 2002 and 2015 industrial gas price increases ranged from 16% in Tasmania
to 113% in NWQ. Increases in the wholesale gas component ranged from $1.17/GJ in
Victoria to $6.38/GJ in NWQ ($2015). By contrast transmission pipeline costs barely
changed in real terms over the period and in some cases decreased.
The key driver of future industrial gas prices in nearly all jurisdictional markets is the
gas supply and demand balance, including the ability to transport gas without undue
transmission constraints. As seen in the increases in the wholesale gas component,
price pressures are generated when demand outstrips supply.
The east coast gas market needs new sources of gas supply to meet future demand
and it is not clear if excess supply will occur to put downward pressure on the
wholesale gas component and ultimately ease gas price pressures. A key issue is that
any new gas supplies will likely be more expensive as these will likely be drawn from
unconventional gas sources which have distinctly different cost structures to
conventional gas.
LNG exports in the east and west have highlighted the influence of transmission
connectivity to spreading gas price movements. The connections within the eastern
gas market has seen high Queensland LNG netback prices exert upward pressure on
prices in the southern states to some degree and this trend is yet to fully play out.
Eastern Australia’s industrial gas market is characterised by bilateral contracting and
intermittent transactions resulting in price variation, poor price transparency and
relatively high transaction costs. The market has also responded to these structural
deficiencies by moving to shorter-term GSAs and regular contractual market price
5
reviews. Improving market efficiency could contribute to more homogenised prices and
increasing the volume of gas traded may also mitigate pricing.
1.3 Residential gas prices
Residential gas prices have been estimated from 2006 to 2015 for each state and
territory except the NT, which has negligible residential demand. Prices are also
provided for NSW’s distinct metro and rural zones. Prices have been broken down into
wholesale gas, transmission, distribution and retail cost components.
Prices are based on the typical household consumption for each state and are given in
¢/MJ (excluding GST) to reflect units used in residential gas bills (multiply ¢/MJ by 10
to get $/GJ).Years are the financial year (e.g. 2015 is 2014/15) or calendar year
depending on the state.
1.3.1 Residential gas price trends
While wholesale gas costs have driven industrial gas prices, they are only one of a
number of factors influencing residential gas prices. These factors include distribution
network tariffs, average household consumption and the extent of retail competition.
Further, the influence of these factors varies widely from state to state with the result
that, unlike industrial gas prices, there is no single explanation for the real increase in
residential gas prices over the study period.
In 2015, the average residential gas price ranged from 1.84 ¢/MJ in Victoria to
6.00 ¢/MJ in Queensland. In all states except Victoria, distribution network charges
were the largest cost component (from 31% of the average price in Victoria to 69% in
South Australia (SA)) and ranged from 0.57 ¢/MJ in Victoria to 3.68 ¢/MJ in
Queensland.
For most states retail costs were the next biggest component (from 0.39 ¢/MJ in SA to
1.20 ¢/MJ in Queensland) followed closely by wholesale gas costs (from 0.53 ¢/MJ in
Victoria and Tasmania to 0.92 ¢/MJ in Queensland).
Transmission costs were the smallest component for all states and ranged from
0.15 ¢/MJ in Victoria to 0.46 ¢/MJ in WA.
Victoria is the only state with an environmental policy that directly affects residential
gas prices, the cost of which is estimated to be less than 0.01 ¢/MJ. The impact of the
carbon tax when it was applied in 2012/13 and 2013/14 ranged from 0.15 ¢/MJ in
Victoria to 0.18 ¢/MJ in NSW.
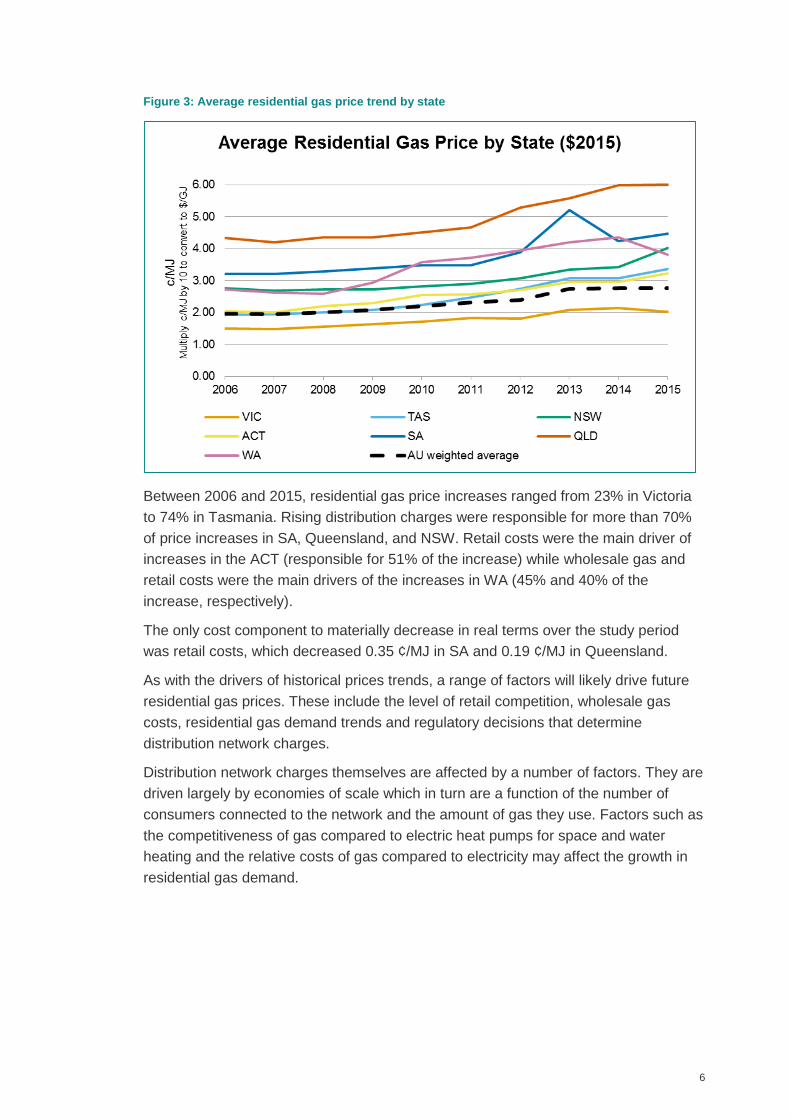
Figure 3 shows the residential gas price trends from 2006 to 2015 for each state.
Prices in the ACT, NSW and Tasmania have gradually increased over the study period
while prices in Victoria and Queensland have plateaued and prices in SA and WA
have peaked and started to decline (though SA prices are rising again).
6
Figure 3: Average residential gas price trend by state
Between 2006 and 2015, residential gas price increases ranged from 23% in Victoria
to 74% in Tasmania. Rising distribution charges were responsible for more than 70%
of price increases in SA, Queensland, and NSW. Retail costs were the main driver of
increases in the ACT (responsible for 51% of the increase) while wholesale gas and
retail costs were the main drivers of the increases in WA (45% and 40% of the
increase, respectively).
The only cost component to materially decrease in real terms over the study period
was retail costs, which decreased 0.35 ¢/MJ in SA and 0.19 ¢/MJ in Queensland.
As with the drivers of historical prices trends, a range of factors will likely drive future
residential gas prices. These include the level of retail competition, wholesale gas
costs, residential gas demand trends and regulatory decisions that determine
distribution network charges.
Distribution network charges themselves are affected by a number of factors. They are
driven largely by economies of scale which in turn are a function of the number of
consumers connected to the network and the amount of gas they use. Factors such as
the competitiveness of gas compared to electric heat pumps for space and water
heating and the relative costs of gas compared to electricity may affect the growth in
residential gas demand.
7
Industrial Gas Price Trends
8
2 Industrial gas price trends introduction
2.1 Domestic gas consumption
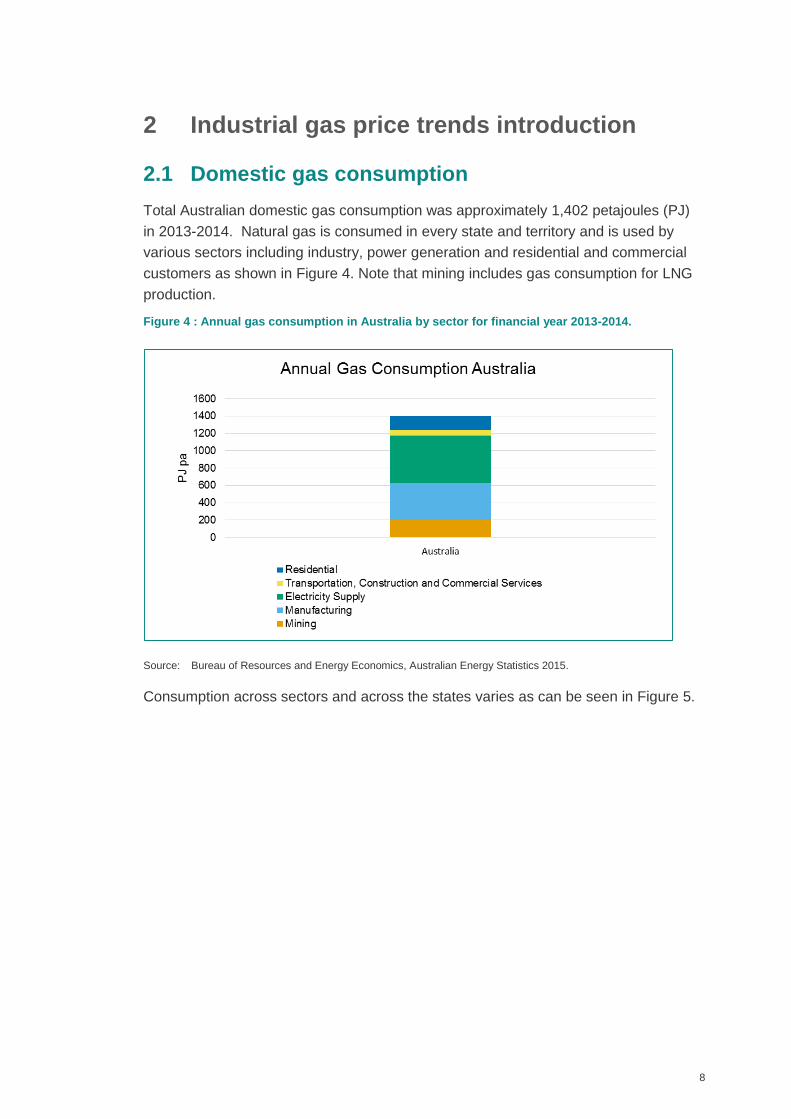
Total Australian domestic gas consumption was approximately 1,402 petajoules (PJ)
in 2013-2014. Natural gas is consumed in every state and territory and is used by
various sectors including industry, power generation and residential and commercial
customers as shown in Figure 4. Note that mining includes gas consumption for LNG
production.
Figure 4 : Annual gas consumption in Australia by sector for financial year 2013-2014.
Source: Bureau of Resources and Energy Economics, Australian Energy Statistics 2015.
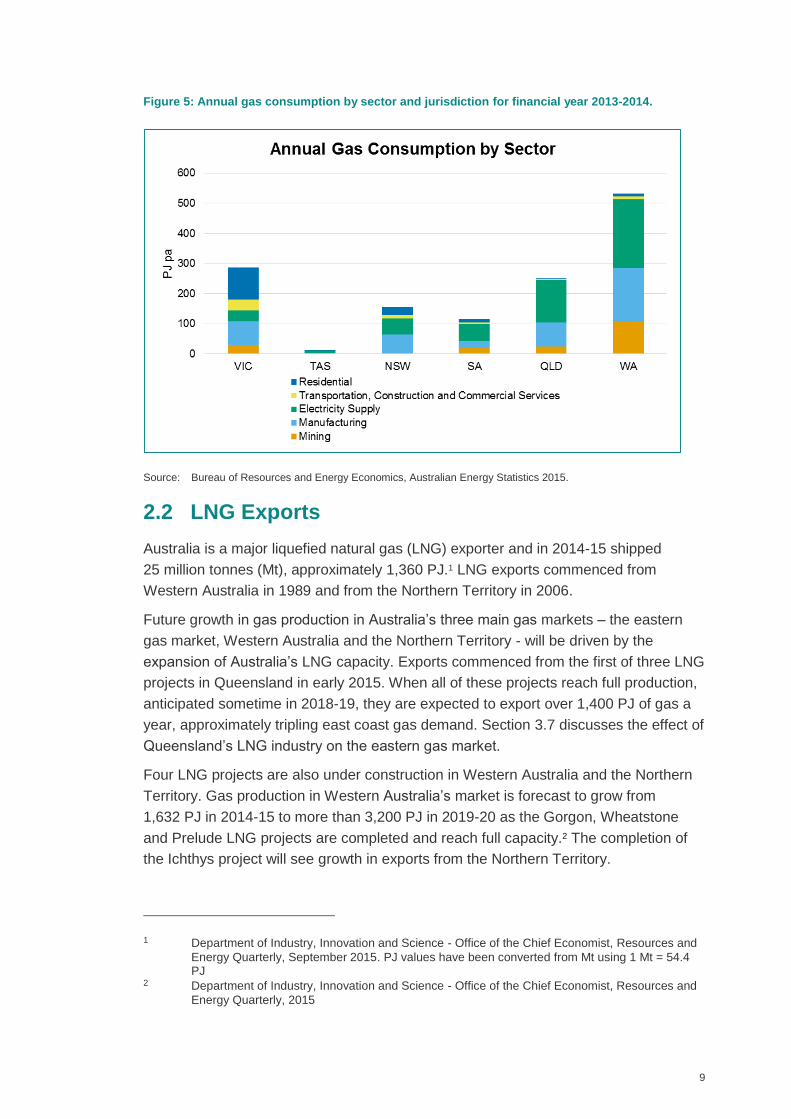
Consumption across sectors and across the states varies as can be seen in Figure 5.
9
Figure 5: Annual gas consumption by sector and jurisdiction for financial year 2013-2014.
Source: Bureau of Resources and Energy Economics, Australian Energy Statistics 2015.
2.2 LNG Exports
Australia is a major liquefied natural gas (LNG) exporter and in 2014-15 shipped
25 million tonnes (Mt), approximately 1,360 PJ.1 LNG exports commenced from
Western Australia in 1989 and from the Northern Territory in 2006.
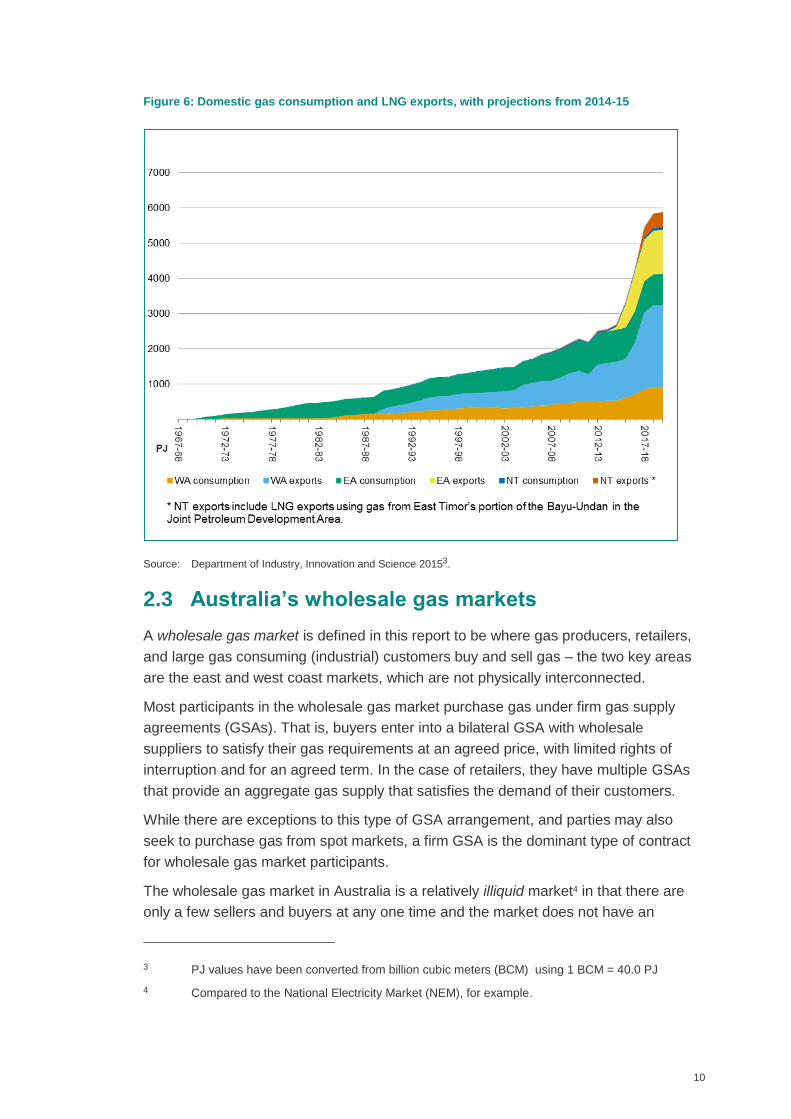
Future growth in gas production in Australia’s three main gas markets – the eastern
gas market, Western Australia and the Northern Territory - will be driven by the
expansion of Australia’s LNG capacity. Exports commenced from the first of three LNG
projects in Queensland in early 2015. When all of these projects reach full production,
anticipated sometime in 2018-19, they are expected to export over 1,400 PJ of gas a
year, approximately tripling east coast gas demand. Section 3.7 discusses the effect of
Queensland’s LNG industry on the eastern gas market.
Four LNG projects are also under construction in Western Australia and the Northern
Territory. Gas production in Western Australia’s market is forecast to grow from
1,632 PJ in 2014-15 to more than 3,200 PJ in 2019-20 as the Gorgon, Wheatstone
and Prelude LNG projects are completed and reach full capacity.2 The completion of
the Ichthys project will see growth in exports from the Northern Territory.
1 Department of Industry, Innovation and Science - Office of the Chief Economist, Resources and
Energy Quarterly, September 2015. PJ values have been converted from Mt using 1 Mt = 54.4 PJ
2 Department of Industry, Innovation and Science - Office of the Chief Economist, Resources and
Energy Quarterly, 2015
10
Figure 6: Domestic gas consumption and LNG exports, with projections from 2014-15
Source: Department of Industry, Innovation and Science 20153.
2.3 Australia’s wholesale gas markets
A wholesale gas market is defined in this report to be where gas producers, retailers,
and large gas consuming (industrial) customers buy and sell gas – the two key areas
are the east and west coast markets, which are not physically interconnected.
Most participants in the wholesale gas market purchase gas under firm gas supply
agreements (GSAs). That is, buyers enter into a bilateral GSA with wholesale
suppliers to satisfy their gas requirements at an agreed price, with limited rights of
interruption and for an agreed term. In the case of retailers, they have multiple GSAs
that provide an aggregate gas supply that satisfies the demand of their customers.
While there are exceptions to this type of GSA arrangement, and parties may also
seek to purchase gas from spot markets, a firm GSA is the dominant type of contract
for wholesale gas market participants.
The wholesale gas market in Australia is a relatively illiquid market4 in that there are
only a few sellers and buyers at any one time and the market does not have an
3 PJ values have been converted from billion cubic meters (BCM) using 1 BCM = 40.0 PJ
4 Compared to the National Electricity Market (NEM), for example.
11
accessible and managed market place or exchange. It is contractually driven and
contractual confidentiality is a cornerstone of the market. As a result, there is little
wholesale gas price transparency.
Australia also has several spot wholesale gas markets where buyers and sellers trade
gas on a daily basis. These are the Short Term Trading Markets (STTMs) that operate
in Brisbane, Sydney and Adelaide and also the Declared Wholesale Gas Market
(DWGM) operating in Victoria (operated by AEMO).
The eastern gas market also has the Wallumbilla Gas Supply Hub (GSH), which is an
exchange for the voluntary trade of wholesale gas at an upstream location in southern
Queensland.5 It allows participants to trade gas over longer terms than just a daily
imbalance including weekly, monthly and three monthly, using standardised contracts.
It also provides a mechanism to list an interest to trade transmission pipeline capacity.
Over the last five years GLNG alone has purchased over 1,800 PJ of third-party gas
on a short and long term basis under eight major GSAs.
The changing gas supply and demand balance has impacted states to varying
degrees as can be seen in Section 4.
5 At Wallumbilla, three gas transmission pipelines converge, namely the: Queensland Gas Pipeline
(QGP); Roma to Brisbane Pipeline (RBP); and the South West Queensland Pipeline (SWQP). In
addition, pipelines from several CSG fields meet at Wallumbilla. It is therefore is convenient
place to trade wholesale gas at an upstream location.
12
3 Key factors influencing industrial gas prices
3.1 Customer size
This section has broken industrial gas into two major customer segments:
Large industrial customers who use greater than 1.0 PJ/a,6 and
Small industrial customers who use from 0.1 to 1.0 PJ/a.
Large industrial customers generally purchase gas directly from the wholesale gas
market. While there is no precise minimum annual demand threshold, the data shows
gas producers are more likely to enter into a GSA with a customer that has an annual
demand in excess of 1 PJ.
In contrast, retailers are the primary supplier to smaller industrial customers and can
provide a spectrum of offerings, ranging from those that are more like GSAs to those
that are more like standard retail contracts. Transportation is usually bundled into
these types of agreements. A customer with annual usage below 0.1 PJ is generally
not considered an industrial customer but rather a business customer. Business
customers are offered a retail tariff as opposed to a GSA.
The 1 PJ/a threshold also tends to denote the type of connection (and also pressure of
the gas) that industrial customers take supply from:
Large industrial customers tend to have gas delivered directly from high pressure
transmission or sub-transmission pipelines, and
Small industrial customers are usually connected to the lower pressure distribution
network.
3.2 Load factor
A key parameter that can affect the price paid by large industrial customers is their
load factor (or sometimes knows as “gas swing”). Load factor is, in effect, a measure
of the peakiness of a customer’s gas supply and this can directly affect the prices paid
on an average dollar per gigajoule ($/GJ) basis. It is an important concept for
determining the average price of transmission pipeline haulage and distribution
network haulage as well.
Smaller industrial customers are also typically affected by peakier load factors in the
network prices they pay and sometimes even in their GSAs. The smaller residential
6 A petajoule (PJ) is equivalent to 1,000 terajoules (TJ) and 1,000,000 gigajoules (GJ).
13
customers are often the peakiest but are subject to more of a tariff type pricing
structure whereby gas and transportation charges are bundled in any case.
In the gas industry the load factor is the ratio of the Maximum Daily Quantity (MDQ) to
the Average Daily Quantity (ADQ) that a customer’s contract specifies. Load factor is
reported as MDQ/ADQ7. This can apply to an industrial customer’s gas purchase on
occasions but applies mainly to its pipeline capacity booking (e.g. under a GTA or
distribution network tariff).
The MDQ is the volume limit of gas that a customer can take on any given day of the
year. The ADQ is calculated by dividing the total annual volume the customer
contracts, known as the Annual Contract Quantity (ACQ), by the number of days in the
year.
As an industrial customer’s annual gas consumption decreases, it is typical that their
load factor also increases – that is it becomes peakier.
For the purpose of this report, the load factor for large industrial customers has been
standardised at 1.1 – the MDQ is 1.1 times (10%) greater than the ADQ – which is
considered a relatively flat load, reflecting that large industrial gas loads tend to be for
plant that operate 24 hours a day.
For small industrial customers (0.1 to 1.0 PJ/a) the load factor can vary more due to
working hours, type of business and weather conditions. Cold weather has a major
impact, similar to the way hot weather does in the electricity industry, for example.
Hence small industrial customers tend to pay a lot more on average for network usage
than large industrial customers.
For this study’s sample of GSAs in the small industrial customer group the load factor
ranged from 1.2 to 5.9 and averaged 1.9. The average without the odd high load factor
outlier was not materially different. For rural small industrial customers in the sample
the average load factor was 2.1 and for the metropolitan small industrial customers it
was 1.6. This indicates differences between the rural and metropolitan industrial bases
and is likely due to the predominance of food production and processing facilities in
rural areas.
An increase in load factor in a GSA or GTA provides industrial customers with more
offtake flexibility but also may come at an additional cost as the gas market becomes
tighter for supply.
7 This is different to the electricity industry where it is normally quoted as ADQ/MDQ – so a 1.2
load factor in the gas industry is equivalent to 83.4% in the electricity industry.
14
The additional costs for a higher load factor, for example, may involve a higher:
Upstream cost due to the increased MDQ flexibility provided to the customer; and
Gas transportation costs, since the higher MDQ will require greater pipeline
transportation capacity bookings and attract a higher reservation charge. In the
case of a retailer supplying a large industrial customer, the higher transportation
costs are typically passed through by way of an increased fixed charge.
It appears though that, until recently, load factor effects on gas wholesale prices (as
distinct from network charges) have been negligible and essentially bundled as part of
the wholesale gas price supplied either by producers and/or retailers for both small
and large industrial customers. However this is changing and separate pricing for load
factor variations is a relatively new development in wholesale gas price offers. There
is, for example, a recent trend for some gas producers to introduce a capacity charge
which reflects the higher MDQ flexibility cost.
Load factor variations affect gas transmission and distribution charges to a much
larger extent than they do wholesale gas prices due to the way transmission and
distribution services are priced. For most distribution networks the cost of load factor
variations is applied through network pricing so no assumptions need to be made for
scaling purposes8.
For example, most pipeline transmission costs are based on the MDQ a gas shipper9
has booked (a firm booking), regardless of whether or not it is used. This has given
rise to pipeline operators offering non-firm bookings (or often called as-available) to re-
allocate existing shippers’ contracted but unused capacities to other shippers, whereby
a shipper with a non-firm booking may be bumped if a firm shipper needs access to
their full contracted capacity.
To estimate the potential costs of load factors where this was required, a simple
storage analogue10 has been used to price this effect into the gas wholesale price.
8 Where load factor costs need to be estimated or calculated, such as for residential gas
consumers, a process of using a scaling factor has been used in the report as outlined in Section
3.2.
9 A gas shipper is a customer of a transmission pipeline(s) (typically a retailer or a large industrial
user, but can also be a producer) that has a contract to haul gas.
10 In Australia, gas can be stored in: underground and LNG gas storage systems that generally
manage peak demand (self-owned or third-party services); and transmission pipeline
linepack/park and loan facilities. Peaky demand can also be managed through paying customers
to shed load at peak times or by producers ensuring more winter production capability is
available.
15
The analogue used is a fixed charge of $200,000 per year per TJ of MDQ for storage:
A 1,000 TJ/a ACQ load would have an ADQ of 1,000/365 = 2.74 TJ/day and at a
load factor of 1.2 would have an MDQ of 1.2 x 2.74 = 3.29 TJ/day.
To increase load factor from 1.2 to 1.3 would mean providing for another
2.74 * 0.1 = 0.27 TJ of MDQ.
This equates to a marginal cost of 0.27 x $200,000 = $54,800/a, or
$54,800/1,000,000GJ (ACQ) = $0.055/GJ sold.
In recent years, a lot of investment has been made, and continues to be made, in gas
storage for both gas trading and peak demand management in Australia’s gas
markets.
The fixed charge used above is a mid-point for a range of storage options including
LNG storage and reinjection (Dandenong – APA Group, Newcastle Gas Storage -
AGL) and underground gas storage (Iona – EnergyAustralia and others).
Such rates are typically confidential but the rates for Iona underground gas storage
were published for some time when owned by TXU (called WUGS then) and the
assumed rate lies within the range of charges TXU then levied.11 This also aligns with
past experience within the gas market where a rule of thumb is about $0.05/GJ to
$0.10/GJ for each 0.1 increase in load factor.
3.3 Take or pay levels
Like load factor, an industrial user’s take or pay (ToP) requirement is a reflection of the
potential variability in their annual gas demand (reflected in their ACQ). ToP
represents the minimum quantity of gas the buyer is required to purchase from the
seller in a contract year (or pay to the seller if not taken)12 and is expressed as a
percentage of their ACQ.
11 This issue was reviewed extensively for IPART when setting standard retailers’ gas offers for
2013 to 2016. IPART commission a report by ACIL Tasman (now ACIL Allen Consulting) titled
Cost of Gas for the 2013 to 2016 Regulatory Period. The report’s conclusion to what is defined
as cost of additional delivery was:
There are a number of approaches to estimating the cost of MDQ. The application of these gives rise to a large range in estimated value from less than $100 per GJ/MDQ/year based on analysis of daily gas spot prices to possibly in excess of $300 per GJ/MDQ based on opportunities to interrupt gas-fired power generators or provide them with additional gas at a discounted price. We consider the most relevant benchmark cost to be that based on AGL’s Newcastle gas storage facility. Our reasoning is that this is a facility currently under construction in New South Wales.
12 GSAs may have ways of managing any shortfall from year to year but the underlying principle is
still enforced.
16
Most large industrial users tend to have reasonably constant annual offtakes and can
manage ToP levels at 80% or more. Although lower ToP levels can be negotiated, this
is not common for large industrial customers and ToP levels below 80% usually affect
pricing.
For the purpose of this report, a large industrial user’s GSA is assumed to have a ToP
level of 90% of their ACQ. This is arbitrary as the prices outlined would not change for
an 80% ToP level but the integrity of the GSA would be seriously questioned by
suppliers if lower levels are requested.
Small industrial customers are also typically subject to ToP in their GSAs but, as with
MDQ, those at the lower end of consumption may have more of a tariff structure where
ToP costs are bundled in their pricing.
3.4 Contract term
A short-term wholesale GSA is considered to be less than three years in duration and
a longer-term wholesale GSA is considered to be three years or more. Previously,
contracts out to 6 or 7 years were considered medium term GSAs as longer term
agreements were often in excess of 10 years but this has changed in the market over
time as supplies become tighter and prices more volatile.
GSAs between industrial customers and retailers generally have a term of around
three years. This ensures the retailer is not exposed to an upstream price increase
under a price review provision in the retailer’s GSA with a producer, which cannot be
passed through under a fixed-price GSA with the industrial customer without pass
through or price negotiation/arbitration clauses (see Section 3.6). This simplifies the
contractual structure and gives the retailer an opportunity to reset the contract for
supply (and the customer to shop around).
It is more common for a large industrial customer to have a long-term GSA directly
with an upstream producer rather than with a retailer. However, retailers have also
entered into long-term GSAs with large industrial customers.
Where an industrial customer has a longer-term contract of say six to 10 years or
more, either with a producer or a retailer, there will typically (but not always) be a pass
through mechanism to cater for any change in the upstream wholesale gas supply
price. However, a long-term agreement may end up in an arbitrated settlement or the
dissolution of the agreement if a price cannot be negotiated.
In recent times, where there has been a rapid increase in eastern Australian wholesale
gas prices, some customers have tended to prefer shorter-term agreements (three
years or less). The main reason for this has been these customers’ unwillingness to
accept the longer-term risk that wholesale gas prices may fall, as they have in Western
Australia (WA) in recent times, and therefore, under the terms of a fixed-price GSA,
pay more than they otherwise would.
17
3.5 Producer vs retailer supply
Large industrial customers purchase gas from the wholesale market, either from a
retailer or a gas producer. They tend to be sophisticated buyers because of the
importance of gas supply to their businesses.
Traditionally, the majority of large industrial customers in Queensland and WA
purchased gas directly from upstream gas producers. In the southern states, the
majority of industrial customers purchase gas from the major retailers. These trends
are largely due to historical factors and the differing nature of state gas markets.
The Queensland and WA gas markets are dominated by large mining and industrial
projects and have a relatively small retail gas market. The south eastern Australian
states have a significantly larger retail gas market13 due to the colder climate and
larger population.
Retail markets are predominately supplied by lower-pressure gas distribution systems
and retailers provide a bundled offer that includes distribution charges as well as other
items such as some environmental levies.
The larger retail markets in the southern states increased the role of retailers and they
grew to be active in supplying large industrial customers. This was partly driven by the
need for large foundation14 customers to secure the retailers’ natural gas portfolios15
and in some cases the transition to natural gas from town gas.16 In the case of Victoria
and SA, gas retailers were originally owned by the state government and were the only
parties that could sell gas in these states.
It should also be noted that in the last three to five years, many large industrial
customers in Queensland have purchased gas directly from the major retailers such as
AGL and Origin Energy rather than from the traditional upstream producers. This is
because a number of the major producers have stakes in LNG projects and they have
focused on securing or proving up gas reserves to back their LNG sales agreements.
As a result they have not been active in selling to the domestic market.
13 The gas retail market refers to supply to residential customers (predominantly) and small
industrial and commercial customers. The retail market is exclusively supplied by retailers.
14 Foundation customer(s) contract sufficient volume to allow a retailer or producer to establish or
contract for supply. Foundation customers reduce the risks of contracting for supply and then
having to find customers. They normally get a very good price as they effectively reduce risks for
the retailer/producer.
15 In many cases the original retailer was also the distribution provider and producers were not
involved in downstream gas markets.
16 Town gas was produced in the location it was required – originally from gasification of coal and
later, in some areas, the reforming of naphtha or other hydrocarbons or even using liquefied
petroleum gas (LPG) to make a synthetic natural gas equivalent.
18
3.5.1 Retailer supply to large industrial customers
Where a large industrial customer purchases gas from a retailer, the retailer is
constrained by the prevailing market alternative, which is the wholesale price that an
upstream producer would enter into for the same GSA and/or the price of a
competitive offer by another retailer. That is, a retailer’s margin to a large industrial
customer is constrained by the prevailing market price of the upstream supply
alternative.
Excluding aggressive retailer competition, the conclusion is the prevailing upstream
producers’ new wholesale gas price is, in most circumstances, the wholesale gas price
for a large industrial customer even if they buy from a retailer. However, this is not the
case where the retailer is the only viable supply option for the large industrial
customer. This can occur in situations such as:
Where a retailer owns all firm transportation capacity in the transmission system
and it is not economically viable or there is a time constraint preventing the large
industrial customer gaining access to gas transportation capacity and hence new
supply from a gas producer is not possible, or
There are no upstream supply options and the only parties which have gas to sell
are retailers.
It follows that any margin that a retailer may apply above this wholesale gas price is
either influenced by the applicable load factor or an actual retailer specific margin. So
for smaller industrial customers where the effective wholesale gas price may be higher
than the wholesale price (as defined here), corrected for load factors, the difference is
treated as part of the retail cost component.
3.6 Gas supply agreement price reviews
Price reviews when applied within GSAs are intended to maintain a market price over
the term of the GSA and provide a mechanism to address price changes. GSAs that
have terms greater than three to five years will generally have price reviews based on
establishing the market price at the time, and for the time to the next review. Being at
the market price is important for both buyers and sellers. Even for a buyer such as a
retailer, its wholesale gas price must be competitive with the wholesale price of other
retailers.
For sellers, it provides the opportunity to ensure that future cost increases do not
erode their sales margin. For example, where there has been a material change in
upstream development costs, this would be reflected in new market prices and
incorporated into an existing GSA through the price review process.
19
Similarly, if a market has excess gas to clear, then market prices may fall and retailers
and industrial customers do not want to be subject to uncompetitive pricing for
extended periods. One recent example of this has been with some of the Queensland
LNG ramp gas.17 This gas was sold into the domestic market as it could not be used at
the time in the LNG plants, and so did not attract LNG netback pricing, but was sold at
short term (lower) clearing prices. WA has also seen gas prices soften as supply
reached an excess and could not be placed into LNG production facilities.
Some small coal seam gas (CSG) producers in Queensland (prior to LNG
consolidation) entered into long-term GSAs without price reviews. Similarly some
power generation supply agreements negotiated in periods of excess supply are
without a price review for up to 10 years, but these are exceptions and they may have
price escalations built in.
In a market experiencing rapid price rises, price reviews tend to result in lower prices
compared to new GSAs or agreements with no reviews. This is because a price review
considers existing supply agreements at “old” prices whereas a new agreement
considers only present and future conditions. In a market where long-term contracts
predominate, which traditionally has been the case in Australia, this could materially
dampen prices. For example, if long-term supply agreements periodically have their
prices reviewed by referring to the prices in each other’s agreements, the resulting
circular loop could see little or no price change.
Without a significant portion of the market at a new wholesale price, it can be difficult
to change the price under a price review mechanism other than at the margin or
through proof of cost pressures. This is one of the reasons that producers may well
have an eye to having some level of their sales volume contracted directly with large
industrial customers.
There can be market implications where there is a substantial difference between
prices under long-term agreements compared to new supply agreements, which are
not encumbered by the market review mechanisms of long-term supply agreements.
New supply agreements that are driven, for example, by large developments in gas
demand can produce rapid price increases or step changes across the market (as
seen recently) and they become the new reference market price in price reviews.
This market dynamic is effectively the bilateral contracting market proxy for open and
competitive markets where liquidity and price transparency is much higher.
17 Ramp gas is CSG that is produced by LNG projects prior to their LNG plants’ commissioning.
20
3.7 Queensland LNG impact
All eastern Australia states have experienced a period of substantial rises in wholesale
gas prices during the last three to five years. The development of three LNG projects
in Gladstone has been a major factor contributing to these increases.
The rapid and massive increase in gas demand in Queensland from the LNG projects
(forecast to triple the east coast gas demand, increasing by some 1,400 PJ/a for
example from circa 700 PJ/a) has created a scarcity in material quantities of new
domestic gas supply from traditional supply sources such as the Cooper Basin and
Queensland CSG. This scarcity of new gas supply is most prevalent in Queensland.
However, the southern domestic markets have also been affected as some traditional
domestic market supplies are diverted north.
LNG projects such as GLNG (Gladstone LNG - operated by major shareholder
Santos) have accelerated the move away from “traditional” domestic gas prices to
equivalency with LNG netback prices or at least the equivalent cost of new gas
supplies, through its large-scale purchase of third party gas in Queensland and from
the Cooper Basin. Over the last five years GLNG alone has purchased over 1,800 PJ
of third-party gas on a short and long term basis under eight major GSAs. If not for the
LNG projects, this gas sold to GLNG and QCLNG (Queensland Curtis LNG – British
Gas) would most likely have been supplied to domestic customers. This has had an
impact on gas supply options for states like NSW with the mix favouring supply from
the Bass Strait over the Cooper Basin from 2014/15.
Most LNG exported from Queensland will be sold on an oil linked basis (85% to 90%).
This has seen a trend in new GSA prices on the east coast moving to have some level
of oil price linking at the major retailer portfolio level and aspects of oil price linking
starting to penetrate the wholesale gas market for large industrial customers. Several
retailers have also taken upstream gas positions (some have taken very significant
positions) so as to be more vertically integrated, and at some level, this inevitably
influences their views of oil linked pricing as a part-time (or even major) integrated gas
producer. It is also influencing their domestic market behaviour as they seek to
balance their gas production and sales/trading portfolios.
While producers have been seeking LNG netback pricing, gas prices are also now
beginning to be influenced by the development of new (more expensive) gas for the
domestic and LNG markets. This has become more apparent following the drop in
international oil prices and the subsequent fall of international LNG prices. LNG
netback arguments for oil-linking gas prices have progressively been giving way to
“cost of new supply” arguments in gas supply negotiations.
3.8 Contract timing and implications in 2011-2015
In a period of substantial increases in price and related market uncertainty, which the
eastern Australian market has experienced during 2011 to 2015, the actual prices
21
being paid by large industrial customers can vary greatly, depending on their individual
circumstances and the time they enter into a new GSA.
For example, some industrial customers that recontracted a few years in advance of
their requirement in 2009 and 2010, may still have a GSA based on market
fundamentals not subject to the full LNG impact and therefore may be accessing lower
prices. Other customers may have recently recontracted gas and have experienced a
greater LNG impact on the wholesale gas price.
The industrial price history detailed in this report is based on a prevailing forward
wholesale market gas supply price for industrial customers for each relevant year.
That is, the price a large industrial customer would have paid if they had contracted
their volume in that year, as opposed to having contracted earlier before prices had
increased.
In some cases, this timing issue has also seen prices decrease for certain industrial
customers who contracted when oversupply occurred. And this can occur to the extent
that other large industrial customers may not see that effect until their GSAs are
renewed or price reviewed – or may never see the impact if the oversupply is cleared
from the market quickly. Similarly some large users may never be offered such deals if
the capability of supplying larger volume GSAs is just not feasible or seen as a greater
risk than supplying a range of smaller GSAs.
3.9 Transportation charges
Large industrial customers generally only pay gas pipeline transmission charges
because they are directly connected to transmission pipelines. However, some
customers may also pay distribution network charges if they are connected to higher
pressure pipeline systems within a distribution network (often termed sub-transmission
of high pressure feeder/reticulation systems).
Large industrial customers typically have both a GSA with a producer and a gas
transportation agreement (GTA) with a transmission pipeline provider for the
transportation of gas on a firm basis. Producers rarely provide a GTA bundled with the
GSA.
Retailers’ GSAs with smaller industrial customers generally bundle firm transportation
services, with these charges imposed on a simple pass through basis. However, this is
not always the case as the retailer may well take an indirect margin on the transport
component.18
18 Major retailers can end up with large capacity bookings on a number of transmission systems
and benefit from diversity in the use of those pipelines by their range of customers, and/or the
procurement of ‘as available’ capacity. This diversity can have many uses, one of which is to be
able to manage customer margins effectively as part of their portfolio of gas purchases.
22
Recently, a non-firm (as available) transmission haulage market has developed
capacity on some major pipelines which aimed at improving asset utilisation. This has
also been augmented on some pipelines with online bulletin board capacity trading
platforms,19 but these options have not been examined in this report as they are used
more to manage gas portfolios and opportunistic gas purchases.
Transmission charges are typically based on a capacity reservation charge, normally
for the MDQ in the GSA, and a throughput charge. There is typically a minimum
charge and penalties for overrunning MDQ or being out of balance with daily injections
or deliveries.
The capacity reservation charge tends to dominate the cost of transmission and this
cost component reserves a customer’s contracted MDQ firm capacity on the pipeline.
Foundation customers’ MDQ bookings underpin investment in the construction of new
pipelines.
The throughput charges tend to reflect the annual costs of running and operating the
pipeline, and are charged on a p GJ hauled basis to effectively spread this cost across
all customers.
Some of the longer transmission pipeline operators only charge for the distance that
gas is hauled i.e. $ per km per GJ of MDQ for the capacity charge, and the equivalent
charging methodology for the throughput charge.
3.10 Other gas fees and charges
In addition to a wholesale market commodity charge and gas transportation costs,
large industrial customers pay additional gas market charges and fees as well as
environmental levies. These fees tend to be minor costs relative to the costs of gas
and haulage (and some of the environmental levies) and, except for the carbon tax,
this report assumes they are bundled into the price. Depending on the location of a
large industrial customer, additional charges may include:
STTM activity fee (approx. $0.082/GJ in $2015) that the Australian Energy Market
Operator (AEMO) charges to industrial customers who are located within a STTM.
Transmission system use gas (generally less than 1-2% of throughput) which is
provided to operators of the transmission pipeline to cover compressor fuel,
metering errors, unaccounted for gas (UAG) and venting during maintenance and
expansion activities.
19 APA Group’s capacity trading service at http://capacitytrading.apa.com.au/capacitytrading.aspx
and Jemena’s at http://jemena.com.au/industry/pipelines/capacity-trading.
23
Distribution unaccounted for gas (UAG) for large industrial customers that take gas
via a distribution network rather than directly from a transmission pipeline.20 UAG in
a distribution network is larger than a transmission pipeline and can very between
3.0 - 4.5% of throughput depending on how the network accounts for the use of its
assets.
State-based safety and regulatory fees to support Government oversight and
regulators.
3.10.1 Carbon tax
This report has used the National Greenhouse Accounts (NGA) to calculate the
average carbon tax imposts for all industrial gas users.
The carbon tax was applied from 1 July 2012 to 1 July 2014 and covered greenhouse
gas emissions from gas production and transmission pipelines (scope 3 emissions
under the NGA) and emissions from distribution networks and the combustion of gas
by end users (Scope 1 emissions under the NGA). Scope 1 carbon costs were the
larger of the two due to the combustion of gas.
Scope 3 carbon costs incurred by gas producers and pipeline operators were passed
through to the wholesale cost of gas for all industrial customers. Scope 3 costs varied
based on the source of gas. For example, gas from Victoria’s Gippsland and Otway
basins generally had a lower carbon intensity compared to gas from the Cooper Basin
in SA/Queensland.
Most large industrial customers were accountable directly for their Scope 1 emissions
from the combustion of gas and these were not included in their gas costs/prices,
noting some smaller industrial gas users were also part of larger industrial groups that
were directly liable so also did not have these Scope 1 emission costs included in their
gas prices.
Retailers collected Scope 1 carbon charges on behalf of their small industrial and
residential customers. As a result small industrial customers who purchased gas from
a retailer (the vast majority) had a larger carbon component in their wholesale gas
costs than large industrial users.
During the period the carbon tax was imposed, it represented a significant cost to
industrial customers as Scope 1 carbon costs equated on average to $1.18 to
$1.24/GJ.21 These “all up” carbon costs are highlighted in the small industrial customer
gas pricing analysis.
20 Victoria and NSW have the greatest number of large industrial customers that take gas from
distribution networks.
21 For example, when gas is combusted, 51.33 kg of CO2-e/GJ is liberated (depending on the CO2
concentration of the gas). At the tax rate of $23/tonne = (51.33/1,000)*$23 = $1.18.
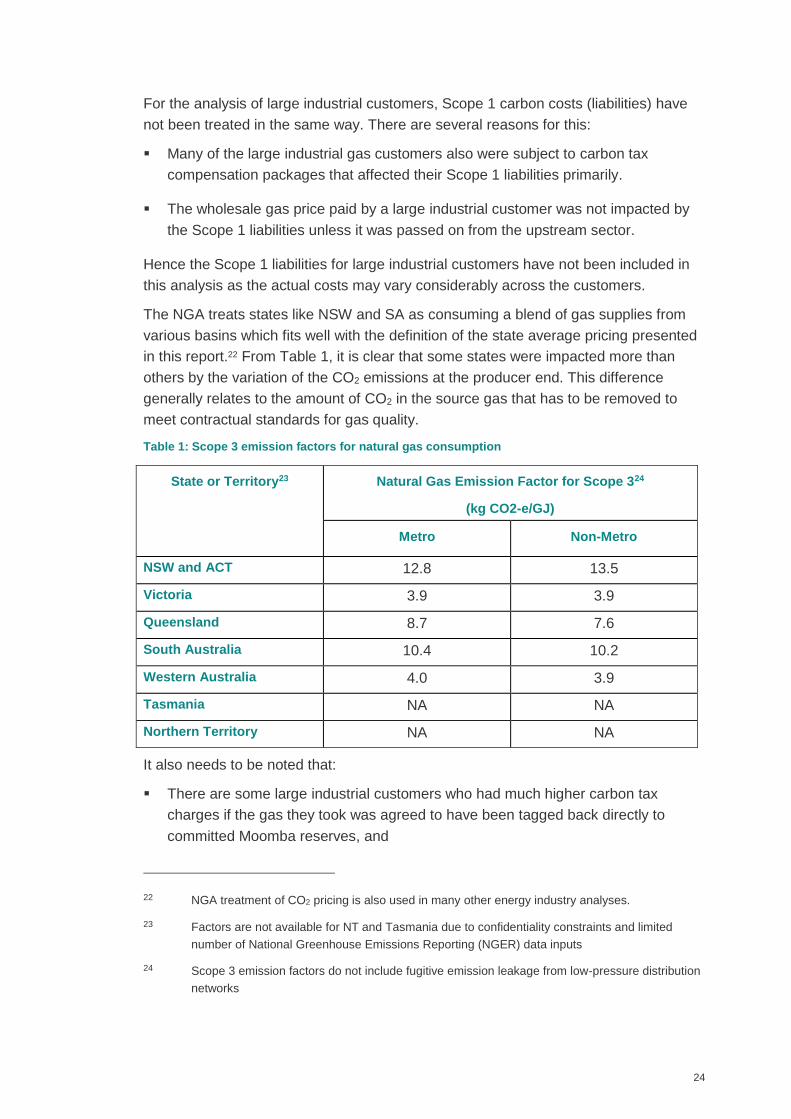
24
For the analysis of large industrial customers, Scope 1 carbon costs (liabilities) have
not been treated in the same way. There are several reasons for this:
Many of the large industrial gas customers also were subject to carbon tax
compensation packages that affected their Scope 1 liabilities primarily.
The wholesale gas price paid by a large industrial customer was not impacted by
the Scope 1 liabilities unless it was passed on from the upstream sector.
Hence the Scope 1 liabilities for large industrial customers have not been included in
this analysis as the actual costs may vary considerably across the customers.
The NGA treats states like NSW and SA as consuming a blend of gas supplies from
various basins which fits well with the definition of the state average pricing presented
in this report.22 From Table 1, it is clear that some states were impacted more than
others by the variation of the CO2 emissions at the producer end. This difference
generally relates to the amount of CO2 in the source gas that has to be removed to
meet contractual standards for gas quality.
Table 1: Scope 3 emission factors for natural gas consumption
State or Territory23 Natural Gas Emission Factor for Scope 324
(kg CO2-e/GJ)
Metro Non-Metro
NSW and ACT 12.8 13.5
Victoria 3.9 3.9
Queensland 8.7 7.6
South Australia 10.4 10.2
Western Australia 4.0 3.9
Tasmania NA NA
Northern Territory NA NA
It also needs to be noted that:
There are some large industrial customers who had much higher carbon tax
charges if the gas they took was agreed to have been tagged back directly to
committed Moomba reserves, and
22 NGA treatment of CO2 pricing is also used in many other energy industry analyses.
23 Factors are not available for NT and Tasmania due to confidentiality constraints and limited
number of National Greenhouse Emissions Reporting (NGER) data inputs
24 Scope 3 emission factors do not include fugitive emission leakage from low-pressure distribution
networks
25
Scope 3 emissions used for Tasmania are assumed to be the same as those for
Victoria because the gas is effectively coming from the same source in terms of
carbon intensity.
3.11 Regional effects
One of the trends observable in the industrial market is that where customers are
regionally isolated and only have the option of one retail supplier, they tend to pay
more for the commodity gas (gas only excluding transport and other charges),
particularly if they are not part of a larger buying group.
This is also typically compounded by additional haulage charges with some regional
customers paying for haulage through two or three separately-priced transmission
systems. Also, it may be the case that the one retailer has effectively booked all the
regional haulage capacity and thus has a degree of market power.
In such circumstances, delivered gas prices for these customers can be effectively
double their counterparts in metropolitan or more densely supplied areas (or through
buying as a bigger diversely located group).
3.12 Specific small industrial customers characteristics
There is a separate group of small industrial customers that has a wide spread of
usage from 0.1 PJ/a to 1 PJ/a. Customers in this group:
Source competitively priced wholesale gas when benchmarked against the
wholesale price trends for large industrial customers, which indicates there is
significant competition in this sector (except in some remote country areas as
outlined above), and
Are often characterised as a single entity that owns a number of smaller industrial
sites, and
Across the east coast market, these customers appear to experience a discernible
lag of price rises at the wholesale gas price level.
Have higher (peakier) load factors than the large industrial customers and tend to
have had these serviced without impost. There was little evidence that producers
or retailers had been charging for this service although it is possible that, due to
this cost being relatively small (for peakier load factor), it may have been
embedded in the error range associated with averaging.25
25 On an anecdotal level, this issue has been known to exist with large sales agreements for a few
years now. Using available data, it was found that in large contracts, the variance is minimal
(possibly $0.10 to $0.20/GJ) so falls within a 10% error band generated through averaging
market data.

26
Be subject to much higher network charges than large industrial customers as they
tend to be connected via lower pressure gas distribution systems and therefore
incur both transmission and distribution network costs, and
May use several transmission pipelines to receive supply and accordingly pay
more, if their sites are located in more remotely serviced country areas.
Have disaggregated pricing agreements (rather than bundled tariffs), representing
the level of historical competition in the sector and again pointing to more
competitive prices over simple application of bundled tariffs.
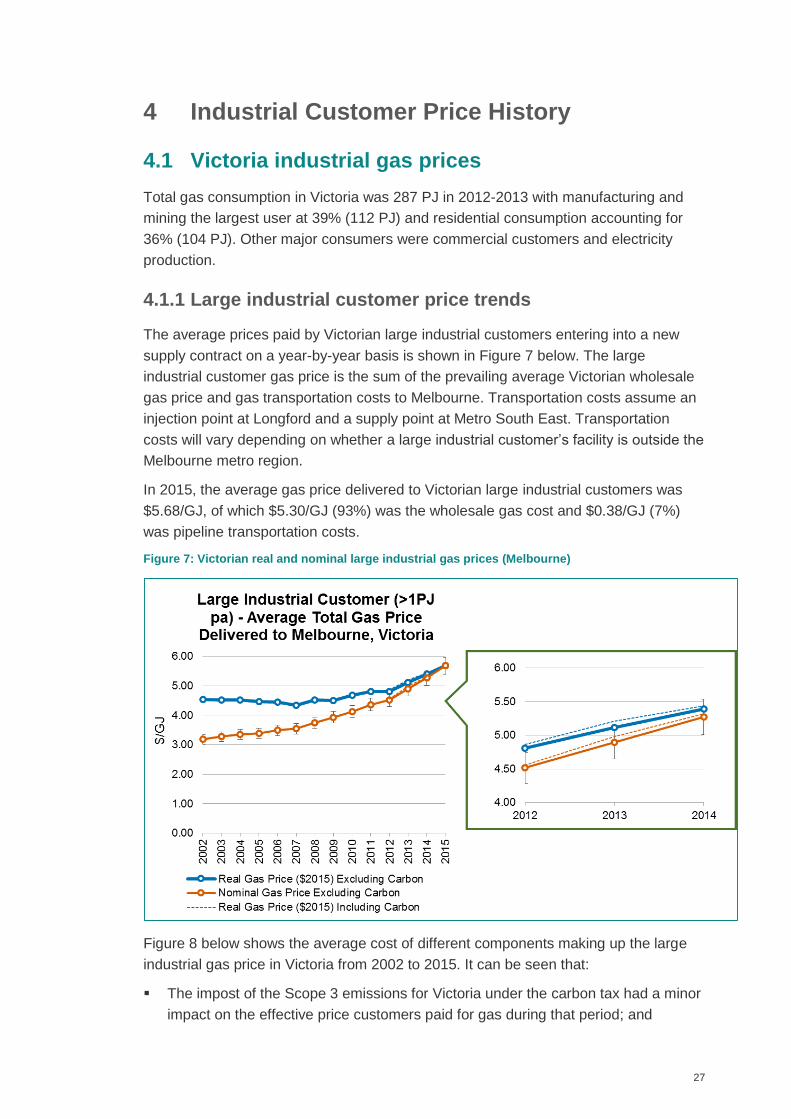
27
4 Industrial Customer Price History
4.1 Victoria industrial gas prices
Total gas consumption in Victoria was 287 PJ in 2012-2013 with manufacturing and
mining the largest user at 39% (112 PJ) and residential consumption accounting for
36% (104 PJ). Other major consumers were commercial customers and electricity
production.
4.1.1 Large industrial customer price trends
The average prices paid by Victorian large industrial customers entering into a new
supply contract on a year-by-year basis is shown in Figure 7 below. The large
industrial customer gas price is the sum of the prevailing average Victorian wholesale
gas price and gas transportation costs to Melbourne. Transportation costs assume an
injection point at Longford and a supply point at Metro South East. Transportation
costs will vary depending on whether a large industrial customer’s facility is outside the
Melbourne metro region.
In 2015, the average gas price delivered to Victorian large industrial customers was
$5.68/GJ, of which $5.30/GJ (93%) was the wholesale gas cost and $0.38/GJ (7%)
was pipeline transportation costs.
Figure 7: Victorian real and nominal large industrial gas prices (Melbourne)
Figure 8 below shows the average cost of different components making up the large
industrial gas price in Victoria from 2002 to 2015. It can be seen that:
The impost of the Scope 3 emissions for Victoria under the carbon tax had a minor
impact on the effective price customers paid for gas during that period; and
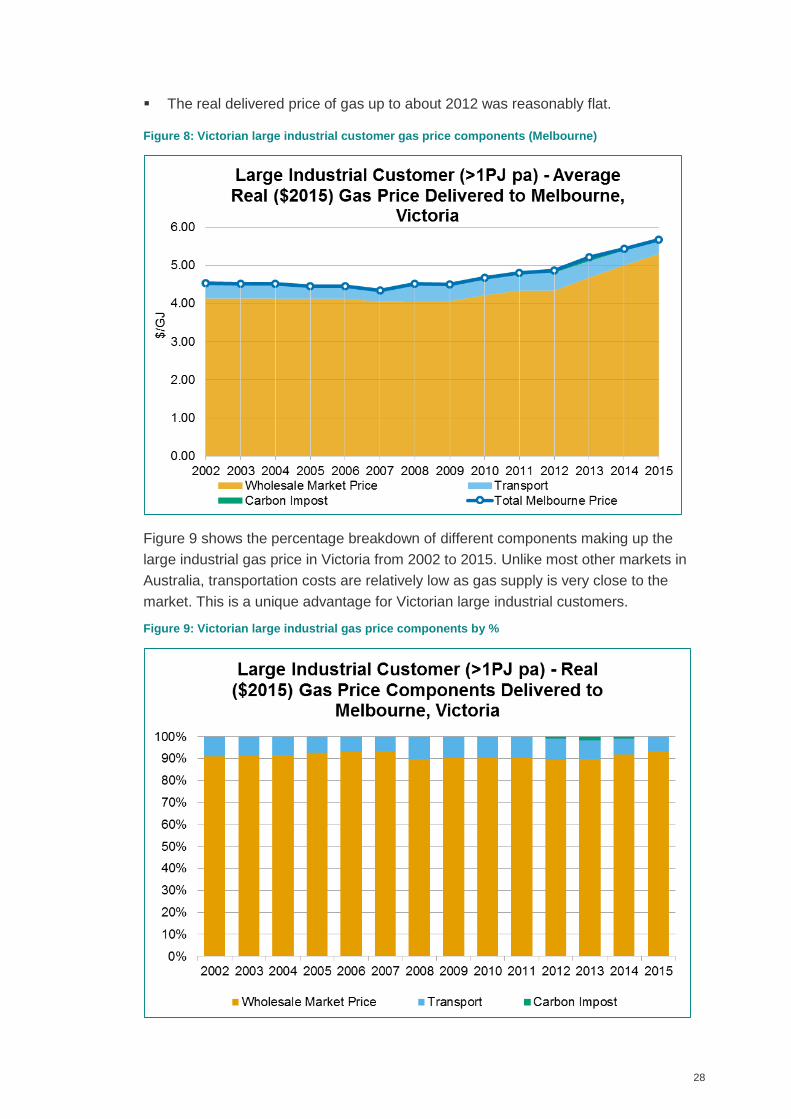
28
The real delivered price of gas up to about 2012 was reasonably flat.
Figure 8: Victorian large industrial customer gas price components (Melbourne)
Figure 9 shows the percentage breakdown of different components making up the
large industrial gas price in Victoria from 2002 to 2015. Unlike most other markets in
Australia, transportation costs are relatively low as gas supply is very close to the
market. This is a unique advantage for Victorian large industrial customers.
Figure 9: Victorian large industrial gas price components by %
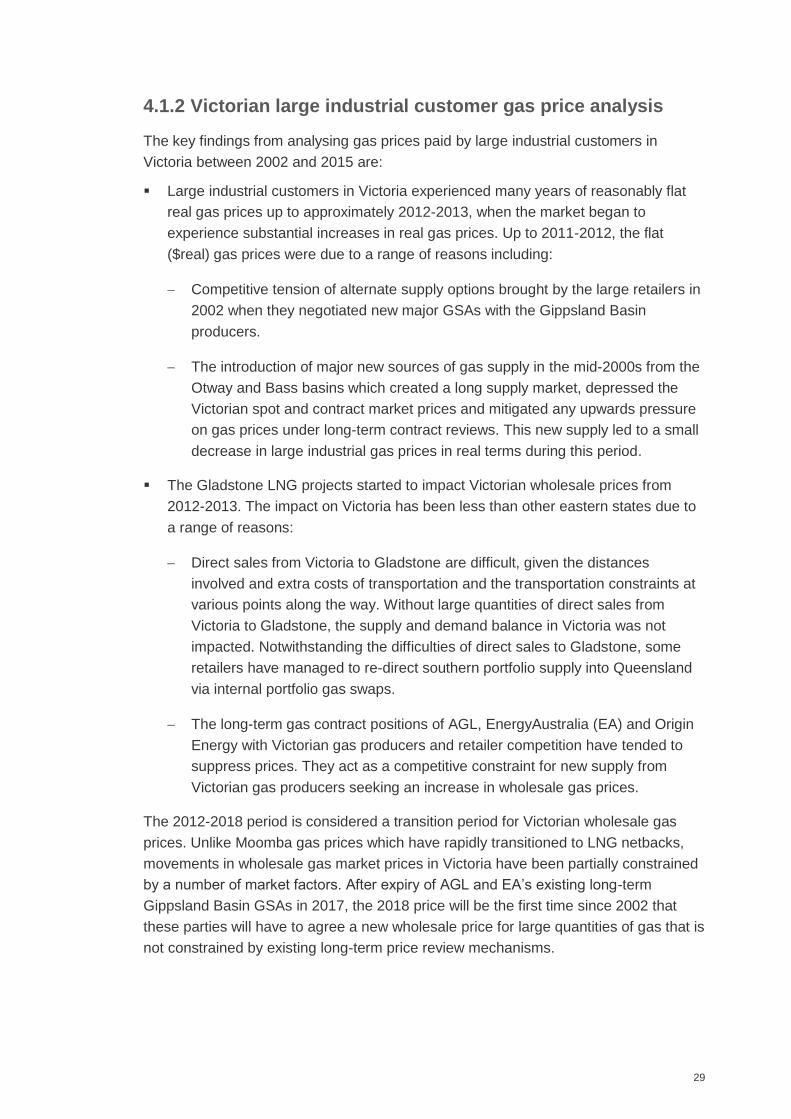
29
4.1.2 Victorian large industrial customer gas price analysis
The key findings from analysing gas prices paid by large industrial customers in
Victoria between 2002 and 2015 are:
Large industrial customers in Victoria experienced many years of reasonably flat
real gas prices up to approximately 2012-2013, when the market began to
experience substantial increases in real gas prices. Up to 2011-2012, the flat
($real) gas prices were due to a range of reasons including:
Competitive tension of alternate supply options brought by the large retailers in
2002 when they negotiated new major GSAs with the Gippsland Basin
producers.
The introduction of major new sources of gas supply in the mid-2000s from the
Otway and Bass basins which created a long supply market, depressed the
Victorian spot and contract market prices and mitigated any upwards pressure
on gas prices under long-term contract reviews. This new supply led to a small
decrease in large industrial gas prices in real terms during this period.
The Gladstone LNG projects started to impact Victorian wholesale prices from
2012-2013. The impact on Victoria has been less than other eastern states due to
a range of reasons:
Direct sales from Victoria to Gladstone are difficult, given the distances
involved and extra costs of transportation and the transportation constraints at
various points along the way. Without large quantities of direct sales from
Victoria to Gladstone, the supply and demand balance in Victoria was not
impacted. Notwithstanding the difficulties of direct sales to Gladstone, some
retailers have managed to re-direct southern portfolio supply into Queensland
via internal portfolio gas swaps.
The long-term gas contract positions of AGL, EnergyAustralia (EA) and Origin
Energy with Victorian gas producers and retailer competition have tended to
suppress prices. They act as a competitive constraint for new supply from
Victorian gas producers seeking an increase in wholesale gas prices.
The 2012-2018 period is considered a transition period for Victorian wholesale gas
prices. Unlike Moomba gas prices which have rapidly transitioned to LNG netbacks,
movements in wholesale gas market prices in Victoria have been partially constrained
by a number of market factors. After expiry of AGL and EA’s existing long-term
Gippsland Basin GSAs in 2017, the 2018 price will be the first time since 2002 that
these parties will have to agree a new wholesale price for large quantities of gas that is
not constrained by existing long-term price review mechanisms.
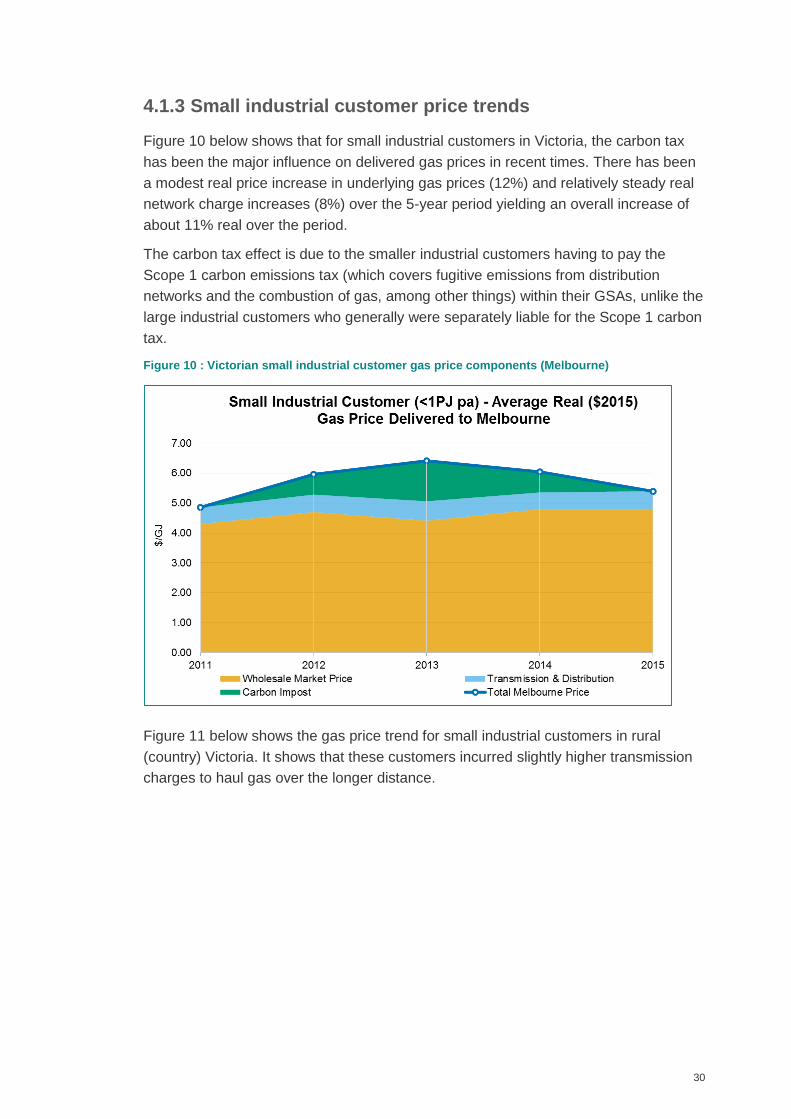
30
4.1.3 Small industrial customer price trends
Figure 10 below shows that for small industrial customers in Victoria, the carbon tax
has been the major influence on delivered gas prices in recent times. There has been
a modest real price increase in underlying gas prices (12%) and relatively steady real
network charge increases (8%) over the 5-year period yielding an overall increase of
about 11% real over the period.
The carbon tax effect is due to the smaller industrial customers having to pay the
Scope 1 carbon emissions tax (which covers fugitive emissions from distribution
networks and the combustion of gas, among other things) within their GSAs, unlike the
large industrial customers who generally were separately liable for the Scope 1 carbon
tax.
Figure 10 : Victorian small industrial customer gas price components (Melbourne)
Figure 11 below shows the gas price trend for small industrial customers in rural
(country) Victoria. It shows that these customers incurred slightly higher transmission
charges to haul gas over the longer distance.
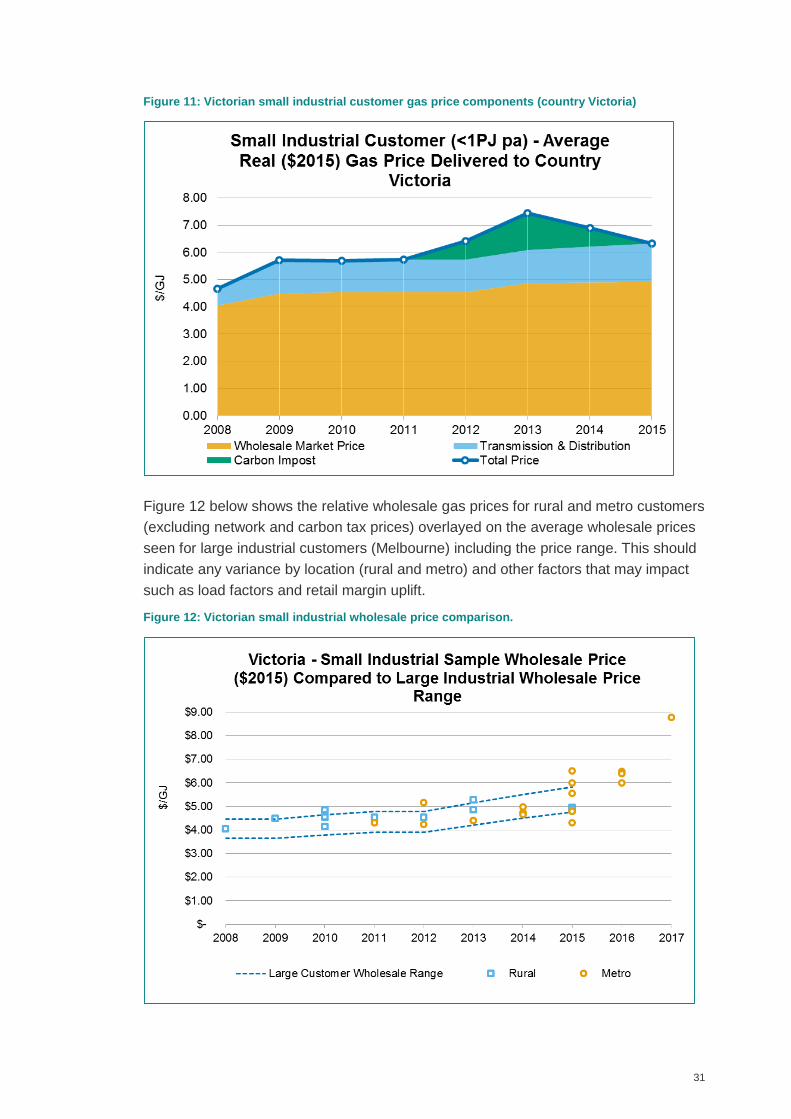
31
Figure 11: Victorian small industrial customer gas price components (country Victoria)
Figure 12 below shows the relative wholesale gas prices for rural and metro customers
(excluding network and carbon tax prices) overlayed on the average wholesale prices
seen for large industrial customers (Melbourne) including the price range. This should
indicate any variance by location (rural and metro) and other factors that may impact
such as load factors and retail margin uplift.
Figure 12: Victorian small industrial wholesale price comparison.
32
From Figure 12 it can be seen:
The general price trend is indicative of the historical charts for the large industrial
customers, which indicate that the recent real wholesale gas price increases were
starting to impact, and
There is a small lag effect relative to large industrial customers.
The data seems to show that there was no significant retailer margin uplifts for
metro customers over larger industrial consumers.
There appears to be some minor uplift for rural customers over metro customers in
the wholesale gas price. This may have related to rural customers having higher
load factors and/or a small retailer margin.
4.1.4 Factors influencing Victorian industrial gas prices
Between 2002 and 2015, the major factors influencing the Victorian wholesale gas
price were:
The Gascor contract (discussed below at 4.1.5) - all retailers purchased gas under
legacy Gascor GSAs from the Gippsland Basin producers.
New post-Gascor agreements entered into by the major retailers (AGL, Origin, and
EnergyAustralia) and market circumstances at that time.
Introduction of large quantities of non-Gippsland Basin gas from the Otway and
Yolla basins from the mid-2000s.
The impact of LNG projects in Gladstone, which affected all of eastern Australia,
including the Victorian gas market during the latter part of this period.
Market structure and the higher proportion of lower priced legacy domestic supply
agreements in the Victorian wholesale gas market.
4.1.5 Gascor contract
Prior to the opening up of the gas market in Victoria to competition by the introduction
of retail contestability in 2002, all of the gas into Victoria was supplied by a
government-owned entity, the Gas & Fuel Corporation of Victoria which later became
known as Gascor. Gascor’s GSA with the Gippsland Basin producers was originally
executed in 1969. The Gascor GSA was a large, long-term agreement which
essentially provided all gas to Victoria’s domestic, commercial and industrial
customers, other than a small separate network which supplied western Victoria from
onshore Otway gas fields.
Gippsland Basin supply to Gascor enabled the Victorian Government to develop the
downstream gas market in Victoria. During the development of the Victorian gas
network, gas was supplied to a number of towns in Victoria. A large number of
33
appliances were also modified for natural gas usage and central gas heating became
standard in many Victorian homes.
Following the privatisation of the Victorian gas industry in 1999, Gascor was split into a
number of entities including three pairs of businesses that each comprised a gas
distributor and a gas retailer. The retailers were Kinetik Energy Pty Ltd (which later
became an EnergyAustralia company), Energy 21 Pty Ltd (later bought by Origin
Energy) and Ikon Energy Pty Ltd (which later became Pulse Energy Pty Ltd and was
subsequently purchased by AGL). When the Gascor break up took place, rather than
terminating the Gascor GSA, each of the retailers entered into a sub-sales agreement
with Gascor under which they were entitled to more or less one third of the gas
purchased under the Gascor GSA.
Gascor continued to supply the majority of gas to AGL, Origin and EnergyAustralia
until the late 2000s. In 2002, AGL and EnergyAustralia announced new long-term
GSAs with the Gippsland Basin producers for the supply of gas from 2004 to the end
of 2017. These agreements contained small additional volumes from 2004 and ramp-
up to larger annual volumes after the Gascor volumes expired.
4.1.6 Introduction of new sources of gas supply to Victoria
In the mid-2000s, four new gas fields were developed that supplied additional gas to
Victoria and South Australia. Production commenced from Minerva (2005), Thylacine
and Geographe (2006), Casino (2006) and Yolla (2006). This additional production
and the corresponding large gas purchases by the major retailers, created a long
supply wholesale market and was a major factor contributing to low Victorian spot
prices and wholesale contract gas prices during the period of 2005 to 2010. This
dynamic changed when the market entered a new phase initiated by the establishment
of LNG projects in Queensland.
4.1.7 Market Structure
Compared to other east Australian states, there are a number of factors which have
enhanced the competitiveness of the Victorian gas market. These include:
Large and concentrated domestic market demand – the Victorian gas market has a
large annual demand (approximately 220 PJ/a). Due to the history of the Gascor
arrangements with the Gippsland Basin producers, Victoria developed a wide-
reaching distribution network. Network development was also assisted by the
smaller geographic spread of gas customers compared to other east coast
Australian states.
A number of competitive sources of gas – Victoria historically had large quantities
of offshore conventional gas in the Gippsland and Otway basins which supported
gas-on-gas competition within the state.
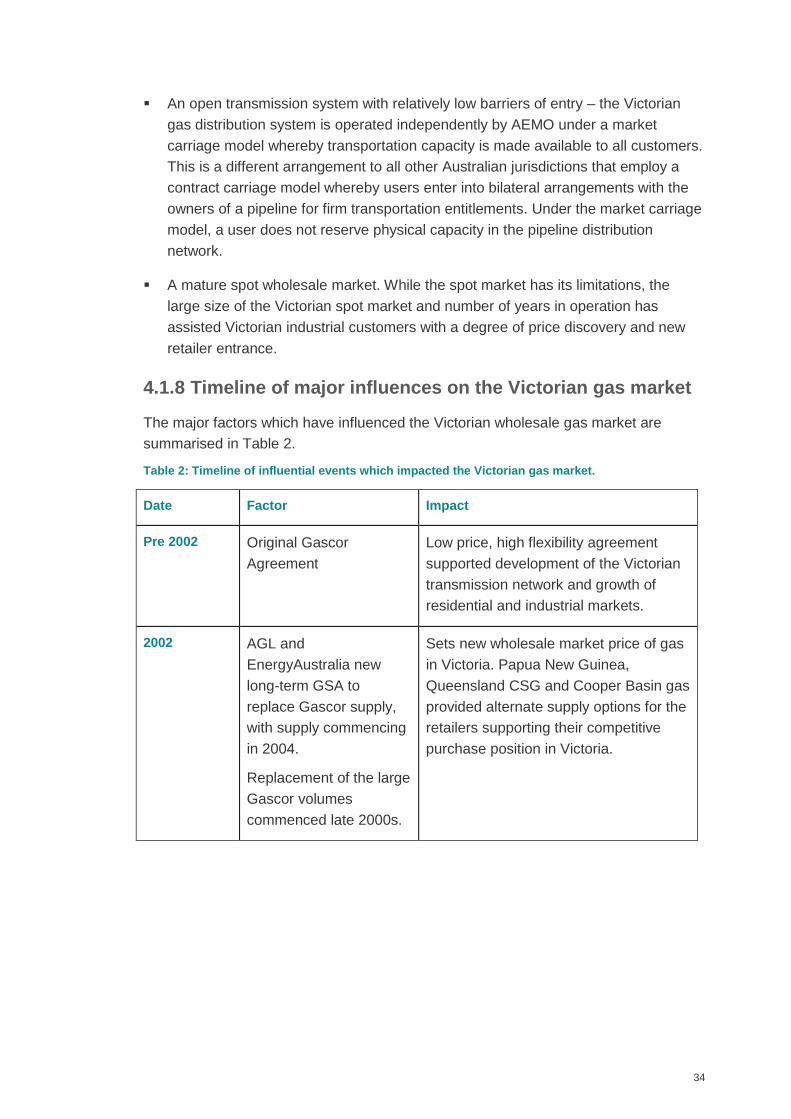
34
An open transmission system with relatively low barriers of entry – the Victorian
gas distribution system is operated independently by AEMO under a market
carriage model whereby transportation capacity is made available to all customers.
This is a different arrangement to all other Australian jurisdictions that employ a
contract carriage model whereby users enter into bilateral arrangements with the
owners of a pipeline for firm transportation entitlements. Under the market carriage
model, a user does not reserve physical capacity in the pipeline distribution
network.
A mature spot wholesale market. While the spot market has its limitations, the
large size of the Victorian spot market and number of years in operation has
assisted Victorian industrial customers with a degree of price discovery and new
retailer entrance.
4.1.8 Timeline of major influences on the Victorian gas market
The major factors which have influenced the Victorian wholesale gas market are
summarised in Table 2.
Table 2: Timeline of influential events which impacted the Victorian gas market.
Date Factor Impact
Pre 2002 Original Gascor
Agreement
Low price, high flexibility agreement
supported development of the Victorian
transmission network and growth of
residential and industrial markets.
2002 AGL and
EnergyAustralia new
long-term GSA to
replace Gascor supply,
with supply commencing
in 2004.
Replacement of the large
Gascor volumes
commenced late 2000s.
Sets new wholesale market price of gas
in Victoria. Papua New Guinea,
Queensland CSG and Cooper Basin gas
provided alternate supply options for the
retailers supporting their competitive
purchase position in Victoria.
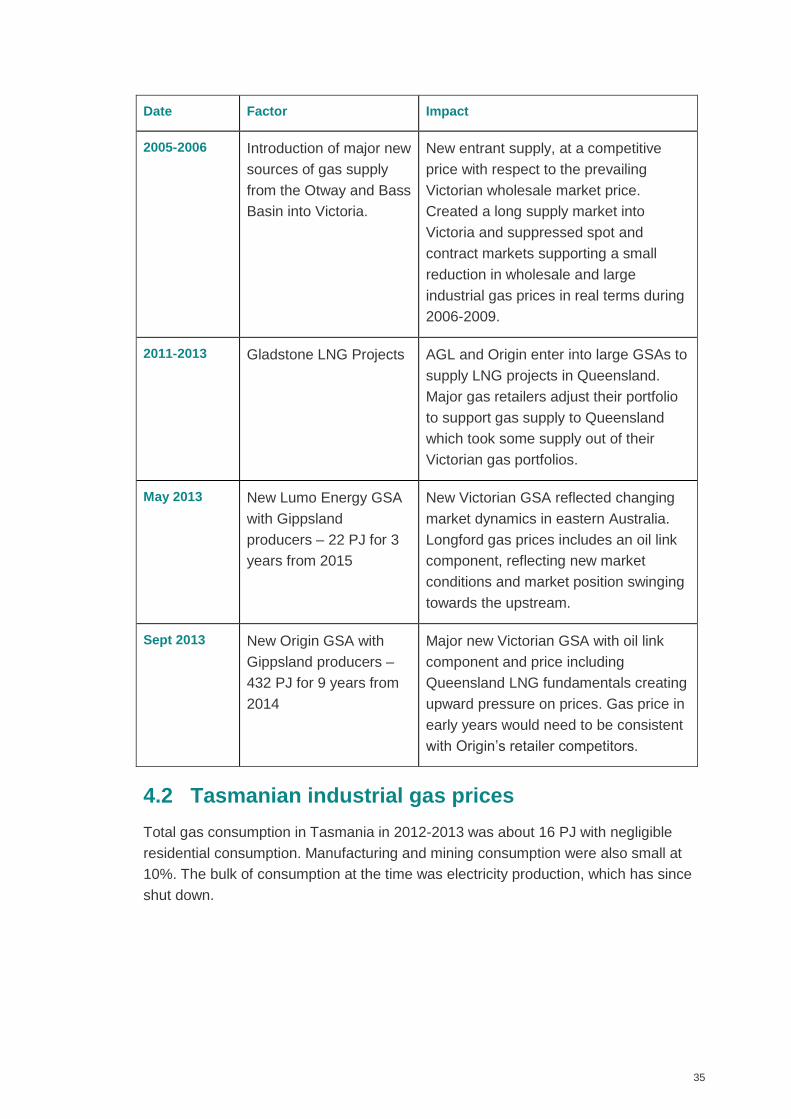
35
Date Factor Impact
2005-2006 Introduction of major new
sources of gas supply
from the Otway and Bass
Basin into Victoria.
New entrant supply, at a competitive
price with respect to the prevailing
Victorian wholesale market price.
Created a long supply market into
Victoria and suppressed spot and
contract markets supporting a small
reduction in wholesale and large
industrial gas prices in real terms during
2006-2009.
2011-2013 Gladstone LNG Projects AGL and Origin enter into large GSAs to
supply LNG projects in Queensland.
Major gas retailers adjust their portfolio
to support gas supply to Queensland
which took some supply out of their
Victorian gas portfolios.
May 2013 New Lumo Energy GSA
with Gippsland
producers – 22 PJ for 3
years from 2015
New Victorian GSA reflected changing
market dynamics in eastern Australia.
Longford gas prices includes an oil link
component, reflecting new market
conditions and market position swinging
towards the upstream.
Sept 2013 New Origin GSA with
Gippsland producers –
432 PJ for 9 years from
2014
Major new Victorian GSA with oil link
component and price including
Queensland LNG fundamentals creating
upward pressure on prices. Gas price in
early years would need to be consistent
with Origin’s retailer competitors.
4.2 Tasmanian industrial gas prices
Total gas consumption in Tasmania in 2012-2013 was about 16 PJ with negligible
residential consumption. Manufacturing and mining consumption were also small at
10%. The bulk of consumption at the time was electricity production, which has since
shut down.
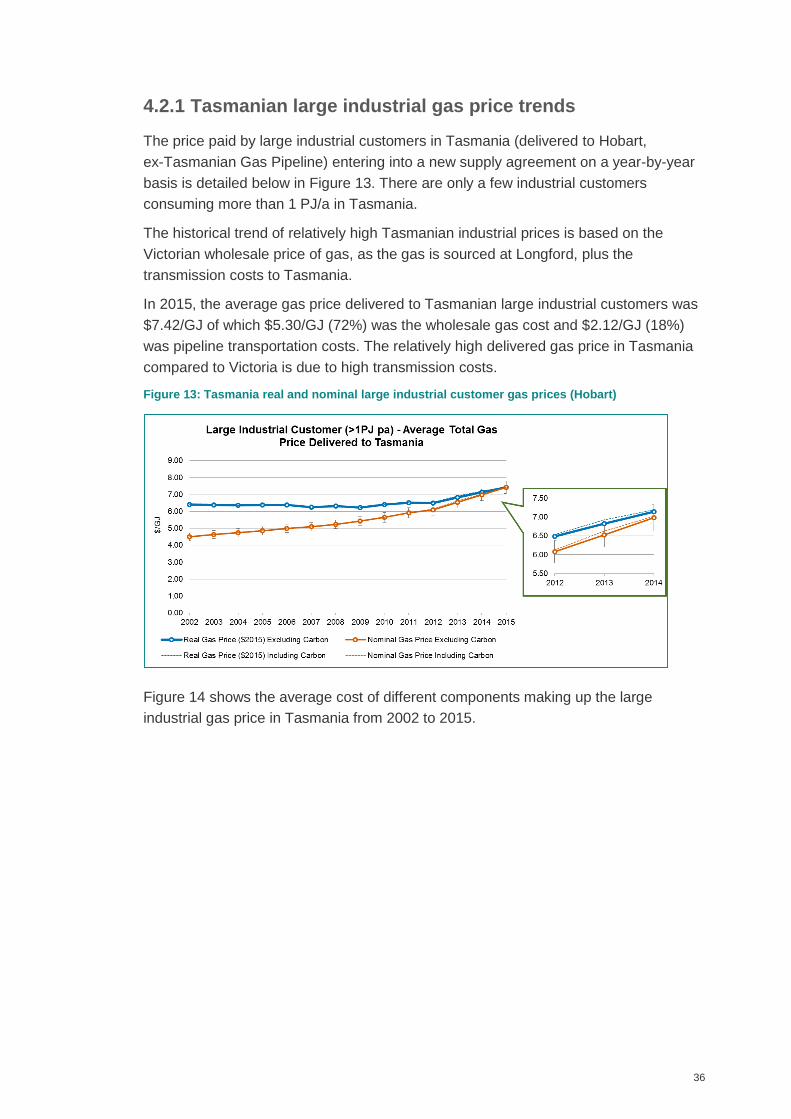
36
4.2.1 Tasmanian large industrial gas price trends
The price paid by large industrial customers in Tasmania (delivered to Hobart,
ex-Tasmanian Gas Pipeline) entering into a new supply agreement on a year-by-year
basis is detailed below in Figure 13. There are only a few industrial customers
consuming more than 1 PJ/a in Tasmania.
The historical trend of relatively high Tasmanian industrial prices is based on the
Victorian wholesale price of gas, as the gas is sourced at Longford, plus the
transmission costs to Tasmania.
In 2015, the average gas price delivered to Tasmanian large industrial customers was
$7.42/GJ of which $5.30/GJ (72%) was the wholesale gas cost and $2.12/GJ (18%)
was pipeline transportation costs. The relatively high delivered gas price in Tasmania
compared to Victoria is due to high transmission costs.
Figure 13: Tasmania real and nominal large industrial customer gas prices (Hobart)
Figure 14 shows the average cost of different components making up the large
industrial gas price in Tasmania from 2002 to 2015.
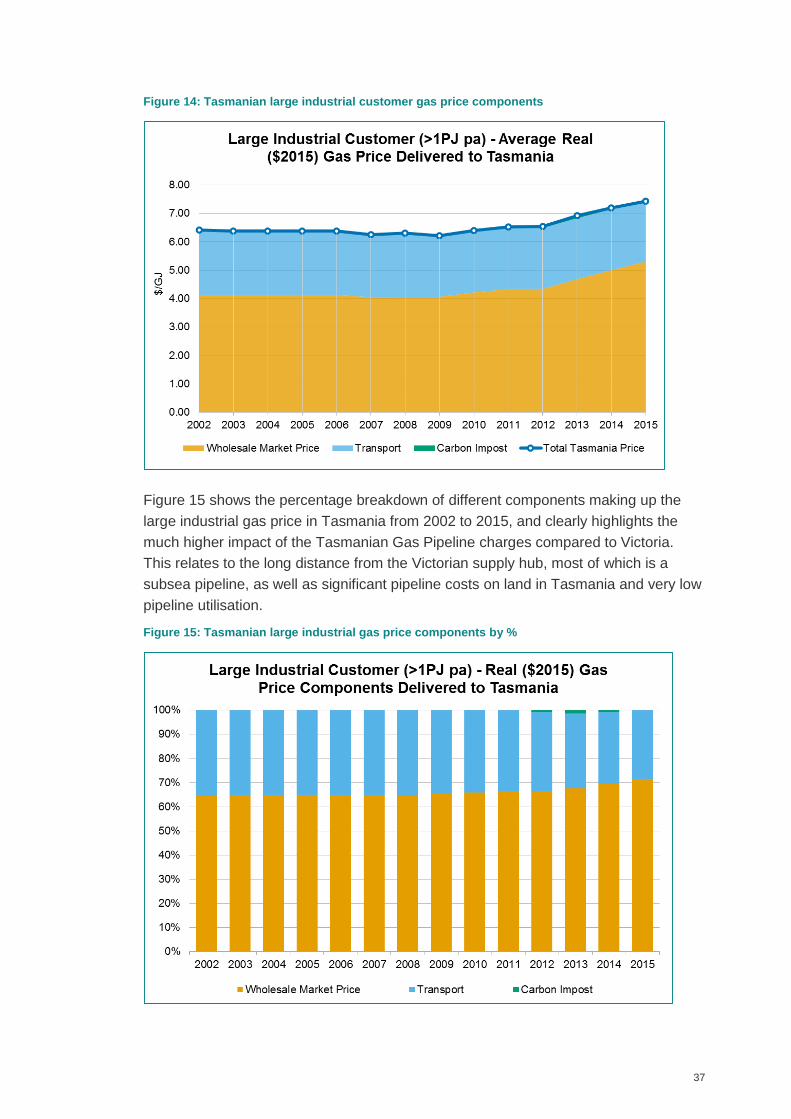
37
Figure 14: Tasmanian large industrial customer gas price components
Figure 15 shows the percentage breakdown of different components making up the
large industrial gas price in Tasmania from 2002 to 2015, and clearly highlights the
much higher impact of the Tasmanian Gas Pipeline charges compared to Victoria.
This relates to the long distance from the Victorian supply hub, most of which is a
subsea pipeline, as well as significant pipeline costs on land in Tasmania and very low
pipeline utilisation.
Figure 15: Tasmanian large industrial gas price components by %
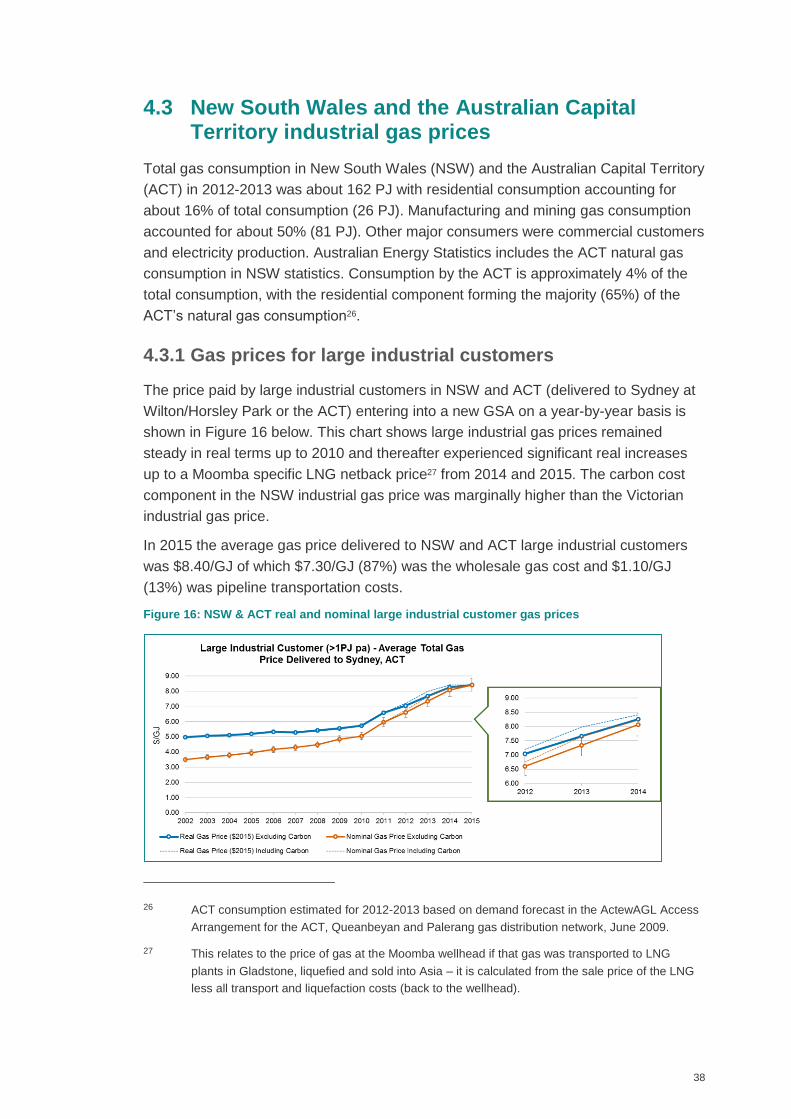
38
4.3 New South Wales and the Australian Capital Territory industrial gas prices
Total gas consumption in New South Wales (NSW) and the Australian Capital Territory
(ACT) in 2012-2013 was about 162 PJ with residential consumption accounting for
about 16% of total consumption (26 PJ). Manufacturing and mining gas consumption
accounted for about 50% (81 PJ). Other major consumers were commercial customers
and electricity production. Australian Energy Statistics includes the ACT natural gas
consumption in NSW statistics. Consumption by the ACT is approximately 4% of the
total consumption, with the residential component forming the majority (65%) of the
ACT’s natural gas consumption26.
4.3.1 Gas prices for large industrial customers
The price paid by large industrial customers in NSW and ACT (delivered to Sydney at
Wilton/Horsley Park or the ACT) entering into a new GSA on a year-by-year basis is
shown in Figure 16 below. This chart shows large industrial gas prices remained
steady in real terms up to 2010 and thereafter experienced significant real increases
up to a Moomba specific LNG netback price27 from 2014 and 2015. The carbon cost
component in the NSW industrial gas price was marginally higher than the Victorian
industrial gas price.
In 2015 the average gas price delivered to NSW and ACT large industrial customers
was $8.40/GJ of which $7.30/GJ (87%) was the wholesale gas cost and $1.10/GJ
(13%) was pipeline transportation costs.
Figure 16: NSW & ACT real and nominal large industrial customer gas prices
26 ACT consumption estimated for 2012-2013 based on demand forecast in the ActewAGL Access
Arrangement for the ACT, Queanbeyan and Palerang gas distribution network, June 2009.
27 This relates to the price of gas at the Moomba wellhead if that gas was transported to LNG
plants in Gladstone, liquefied and sold into Asia – it is calculated from the sale price of the LNG
less all transport and liquefaction costs (back to the wellhead).
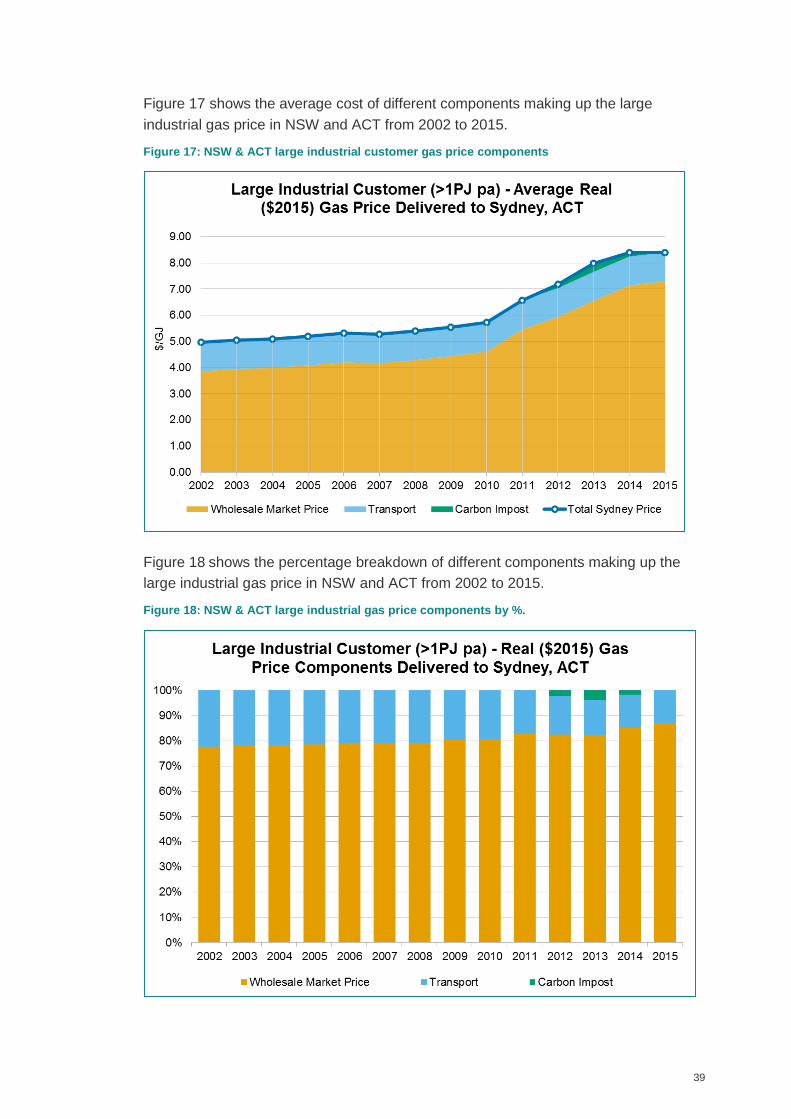
39
Figure 17 shows the average cost of different components making up the large
industrial gas price in NSW and ACT from 2002 to 2015.
Figure 17: NSW & ACT large industrial customer gas price components
Figure 18 shows the percentage breakdown of different components making up the
large industrial gas price in NSW and ACT from 2002 to 2015.
Figure 18: NSW & ACT large industrial gas price components by %.
40
The major factors influencing NSW and ACT large industrial gas prices between 2002
and 2015 were the:
Introduction of gas-on-gas competition in NSW via EGP deliveries of Victorian gas
into NSW from 2000.
Gladstone LNG projects materially impacted on Moomba wholesale gas prices
from 2010 as supply from Moomba to NSW was reduced (large 2P reserves were
dedicated to LNG) and Victorian gas started to dominate supply to NSW, and
Access to gas reportedly became an issue and prices escalated.
Market structure may have also impeded the ability of some industrial customers to
access competitive gas supply in NSW. It is a fully bilateral market where industrial
customers can contract directly with producers or retailers who have gas available
but lacks any transparency. There has also been uncertainty around CSG projects
and offers in NSW during this period which seems to have compounded firm
access to new gas supplies from within NSW. However, it was noticeable that
initial direct sales offers from NSW CSG producers mitigated pricing pressures for
a short while.
4.3.2 Influence of Cooper Basin gas prices to NSW and SA
The wholesale gas price at Moomba has a major influence on the gas price paid by
large industrial customers in SA and NSW. This influence has also flowed back into
Victoria over time as the demand for Bass Strait gas into NSW grew. The reduced
supply of gas out of Moomba set new prices for the basin’s gas supply and lifted prices
across the south east market.
The Cooper Basin producers (Santos, Delhi Petroleum and Origin Energy) were the
foundation suppliers to the SA and NSW gas markets. Cooper Basin gas supply to SA
started in 1969 and was SA’s exclusive supplier until the SEA Gas pipeline started
operating in 2004.
Cooper Basin supply to NSW started 23 December 1976. The Cooper Basin
producers remained the sole suppliers of gas into NSW up to September 2000 when
the EGP began operation, though the construction of the Victorian – NSW
Interconnect through Culcairn enabled small quantities of bidirectional flow between
NSW and Victoria from 1998.
The Cooper Basin is a mature conventional gas production area, having been in
production for over 45 years. Gas was originally sourced exclusively from the South
Australian side of the Cooper Basin. The Queensland side of the Cooper Basin was
connected to Moomba in the early 1990s as gas supply from the South Australian side
matured.
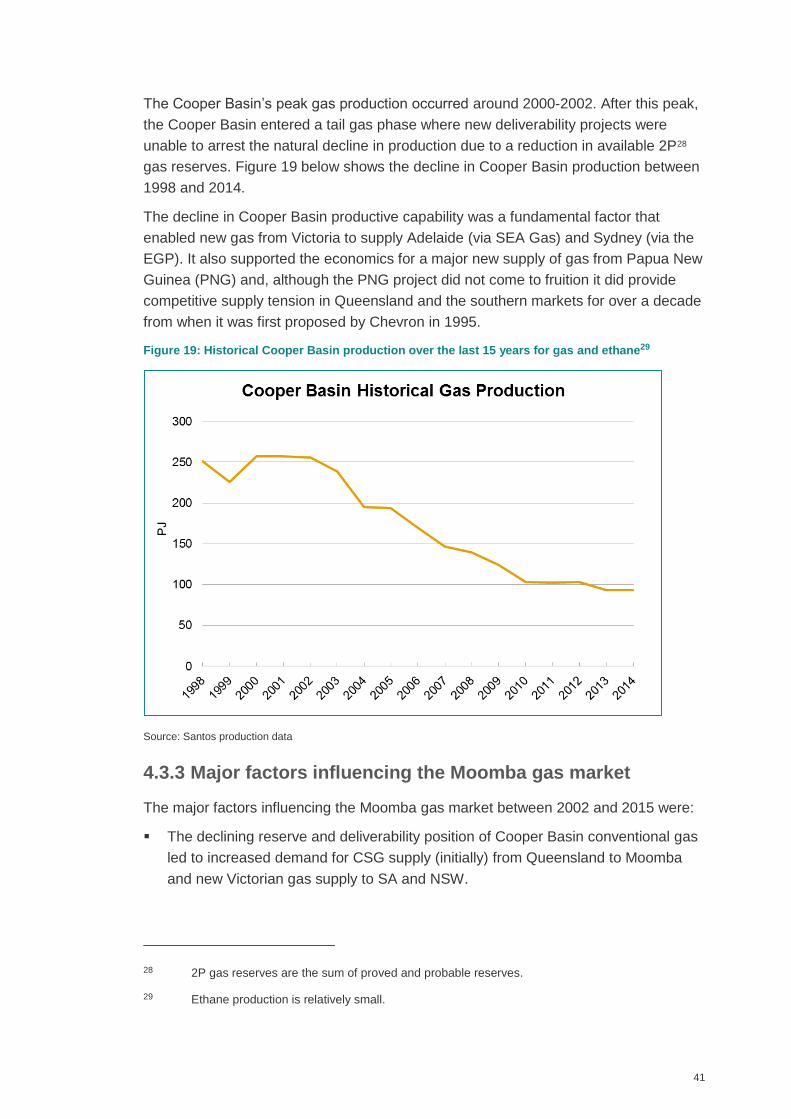
41
The Cooper Basin’s peak gas production occurred around 2000-2002. After this peak,
the Cooper Basin entered a tail gas phase where new deliverability projects were
unable to arrest the natural decline in production due to a reduction in available 2P28
gas reserves. Figure 19 below shows the decline in Cooper Basin production between
1998 and 2014.
The decline in Cooper Basin productive capability was a fundamental factor that
enabled new gas from Victoria to supply Adelaide (via SEA Gas) and Sydney (via the
EGP). It also supported the economics for a major new supply of gas from Papua New
Guinea (PNG) and, although the PNG project did not come to fruition it did provide
competitive supply tension in Queensland and the southern markets for over a decade
from when it was first proposed by Chevron in 1995.
Figure 19: Historical Cooper Basin production over the last 15 years for gas and ethane29
Source: Santos production data
4.3.3 Major factors influencing the Moomba gas market
The major factors influencing the Moomba gas market between 2002 and 2015 were:
The declining reserve and deliverability position of Cooper Basin conventional gas
led to increased demand for CSG supply (initially) from Queensland to Moomba
and new Victorian gas supply to SA and NSW.
28 2P gas reserves are the sum of proved and probable reserves.
29 Ethane production is relatively small.
42
The PNG gas project provided Moomba price competition between suppliers and
incumbent producers up to late 2006 when the project was withdrawn.
The Gladstone LNG projects began influencing the Moomba wholesale gas market
from 2010-2011. The Gladstone LNG projects rapidly changed the gas market
fundamentals from the previous phase of significant supply side competition during
the period of the PNG gas project and rise of CSG domestic supply from
Queensland to Moomba, to tight supply conditions during commercialisation and
development of LNG projects at Gladstone.
The Moomba wholesale gas market experienced two distinct market phases, similar to
the Victorian wholesale gas market. The market saw a period of reasonably flat real
gas wholesale prices up to approximately 2009 and then a rapid increase in real gas
prices from 2010-2011 as the impact of the Gladstone LNG projects transformed gas
market dynamics at Moomba.
The first oil link gas supply agreement at Moomba was signed by Santos to supply
GLNG (a Santos project with PETRONAS, Total and KOGAS) in October 2010. A
further major oil link gas sales agreement was announced by Beach Energy to supply
Origin Energy in April 2013. Santos’ GLNG agreement signalled the start of the
Cooper Basin’s direct supply to Queensland LNG projects which linked Moomba
wholesale gas prices (and hence Victoria, SA and NSW) directly with Queensland’s
wholesale gas prices.
By 2013, the prevailing Cooper Basin wholesale gas price had increased to the
Moomba LNG netback price due to the large number of new GSAs signed by AGL and
Origin with the Gladstone LNG projects for supply to Wallumbilla.
Prior to 2010, the wholesale gas price at Moomba and Victoria were generally similar,
however they have varied significantly from 2010 onwards. The Moomba wholesale
price curve has increased at a faster rate compared to Victorian wholesale prices due
to a range of reasons:
Proximity of Moomba to the Gladstone LNG projects and direct contractual
relationship with Moomba suppliers which created clear LNG netback prices at
Moomba.
The additional transportation cost and various pipeline constraints in transporting
gas from Victoria to Wallumbilla inhibited direct supply from Victoria to the
Gladstone LNG projects. Even if transportation issues were to be resolved, the
wholesale gas netback price to Victoria would be lower compared to the netback
price at Moomba because of additional transportation costs.
Legacy domestic GSAs with Victorian producers are not due to end until 2018 and
this has tended to (relatively) suppress the Victorian gas prices.
The timeline of major factors which has influenced the ex-Moomba wholesale gas
market are summarised in Table 3 below.
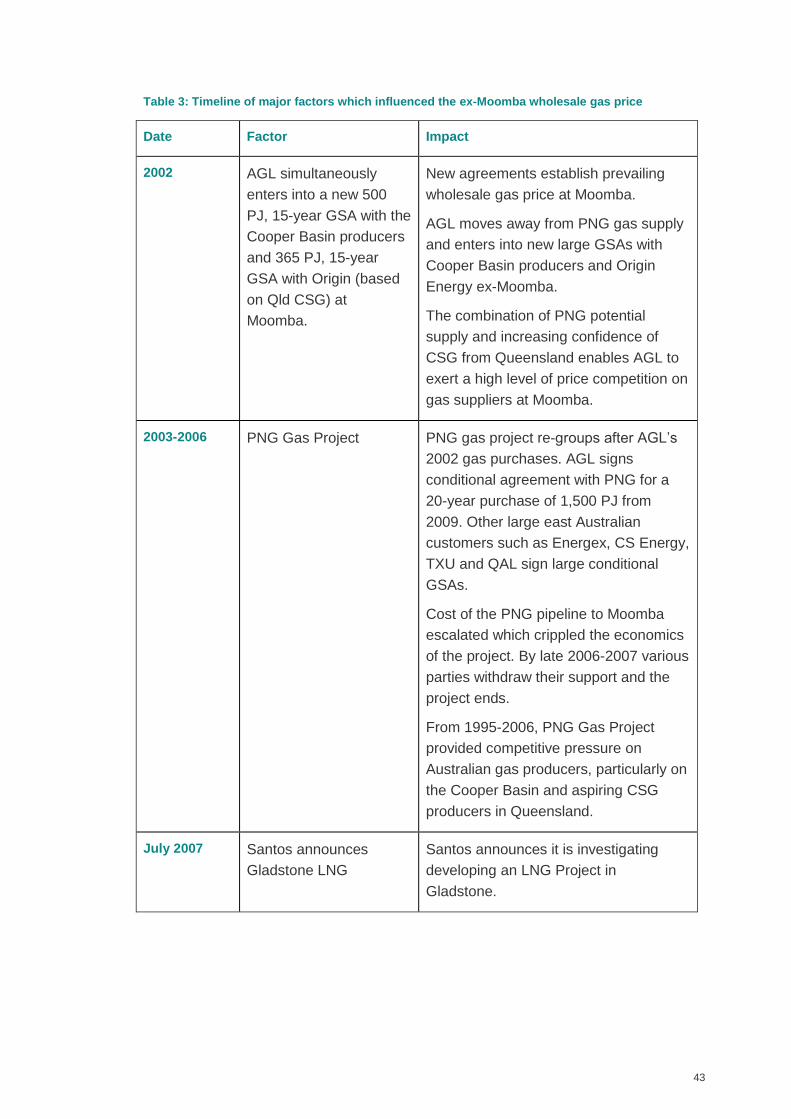
43
Table 3: Timeline of major factors which influenced the ex-Moomba wholesale gas price
Date Factor Impact
2002 AGL simultaneously
enters into a new 500
PJ, 15-year GSA with the
Cooper Basin producers
and 365 PJ, 15-year
GSA with Origin (based
on Qld CSG) at
Moomba.
New agreements establish prevailing
wholesale gas price at Moomba.
AGL moves away from PNG gas supply
and enters into new large GSAs with
Cooper Basin producers and Origin
Energy ex-Moomba.
The combination of PNG potential
supply and increasing confidence of
CSG from Queensland enables AGL to
exert a high level of price competition on
gas suppliers at Moomba.
2003-2006 PNG Gas Project PNG gas project re-groups after AGL’s
2002 gas purchases. AGL signs
conditional agreement with PNG for a
20-year purchase of 1,500 PJ from
2009. Other large east Australian
customers such as Energex, CS Energy,
TXU and QAL sign large conditional
GSAs.
Cost of the PNG pipeline to Moomba
escalated which crippled the economics
of the project. By late 2006-2007 various
parties withdraw their support and the
project ends.
From 1995-2006, PNG Gas Project
provided competitive pressure on
Australian gas producers, particularly on
the Cooper Basin and aspiring CSG
producers in Queensland.
July 2007 Santos announces
Gladstone LNG
Santos announces it is investigating
developing an LNG Project in
Gladstone.
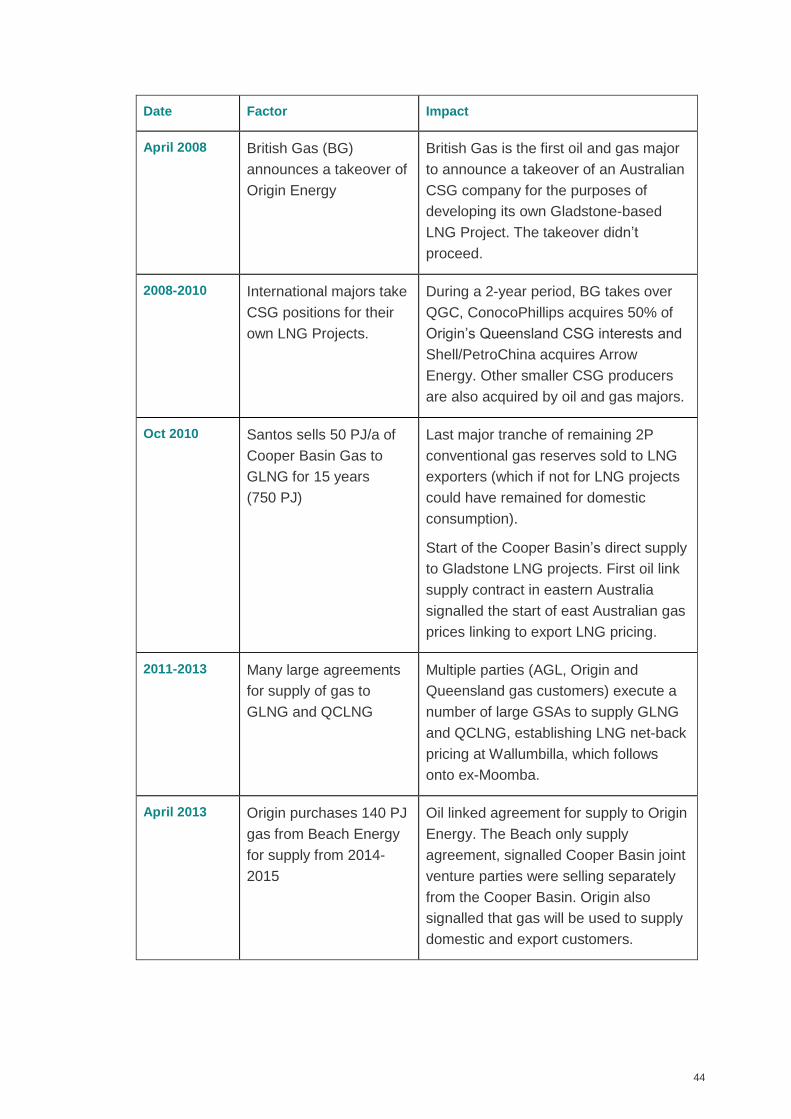
44
Date Factor Impact
April 2008 British Gas (BG)
announces a takeover of
Origin Energy
British Gas is the first oil and gas major
to announce a takeover of an Australian
CSG company for the purposes of
developing its own Gladstone-based
LNG Project. The takeover didn’t
proceed.
2008-2010 International majors take
CSG positions for their
own LNG Projects.
During a 2-year period, BG takes over
QGC, ConocoPhillips acquires 50% of
Origin’s Queensland CSG interests and
Shell/PetroChina acquires Arrow
Energy. Other smaller CSG producers
are also acquired by oil and gas majors.
Oct 2010 Santos sells 50 PJ/a of
Cooper Basin Gas to
GLNG for 15 years
(750 PJ)
Last major tranche of remaining 2P
conventional gas reserves sold to LNG
exporters (which if not for LNG projects
could have remained for domestic
consumption).
Start of the Cooper Basin’s direct supply
to Gladstone LNG projects. First oil link
supply contract in eastern Australia
signalled the start of east Australian gas
prices linking to export LNG pricing.
2011-2013 Many large agreements
for supply of gas to
GLNG and QCLNG
Multiple parties (AGL, Origin and
Queensland gas customers) execute a
number of large GSAs to supply GLNG
and QCLNG, establishing LNG net-back
pricing at Wallumbilla, which follows
onto ex-Moomba.
April 2013 Origin purchases 140 PJ
gas from Beach Energy
for supply from 2014-
2015
Oil linked agreement for supply to Origin
Energy. The Beach only supply
agreement, signalled Cooper Basin joint
venture parties were selling separately
from the Cooper Basin. Origin also
signalled that gas will be used to supply
domestic and export customers.
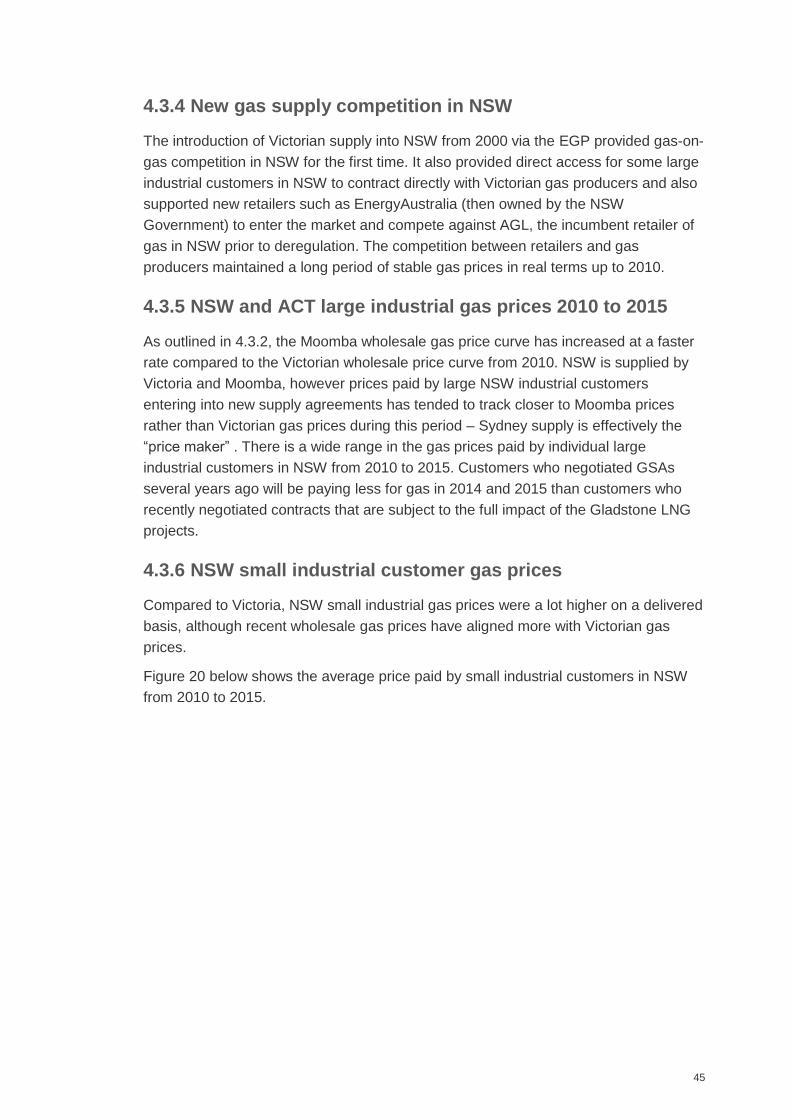
45
4.3.4 New gas supply competition in NSW
The introduction of Victorian supply into NSW from 2000 via the EGP provided gas-on-
gas competition in NSW for the first time. It also provided direct access for some large
industrial customers in NSW to contract directly with Victorian gas producers and also
supported new retailers such as EnergyAustralia (then owned by the NSW
Government) to enter the market and compete against AGL, the incumbent retailer of
gas in NSW prior to deregulation. The competition between retailers and gas
producers maintained a long period of stable gas prices in real terms up to 2010.
4.3.5 NSW and ACT large industrial gas prices 2010 to 2015
As outlined in 4.3.2, the Moomba wholesale gas price curve has increased at a faster
rate compared to the Victorian wholesale price curve from 2010. NSW is supplied by
Victoria and Moomba, however prices paid by large NSW industrial customers
entering into new supply agreements has tended to track closer to Moomba prices
rather than Victorian gas prices during this period – Sydney supply is effectively the
“price maker” . There is a wide range in the gas prices paid by individual large
industrial customers in NSW from 2010 to 2015. Customers who negotiated GSAs
several years ago will be paying less for gas in 2014 and 2015 than customers who
recently negotiated contracts that are subject to the full impact of the Gladstone LNG
projects.
4.3.6 NSW small industrial customer gas prices
Compared to Victoria, NSW small industrial gas prices were a lot higher on a delivered
basis, although recent wholesale gas prices have aligned more with Victorian gas
prices.
Figure 20 below shows the average price paid by small industrial customers in NSW
from 2010 to 2015.
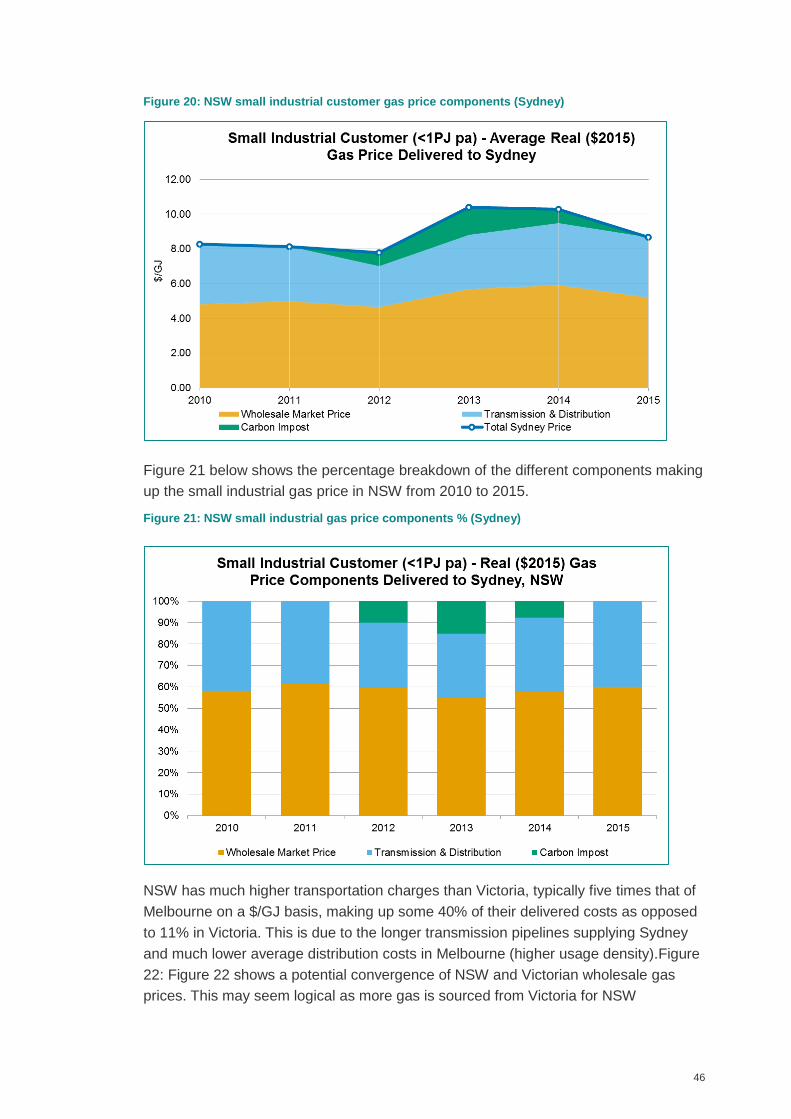
46
Figure 20: NSW small industrial customer gas price components (Sydney)
Figure 21 below shows the percentage breakdown of the different components making
up the small industrial gas price in NSW from 2010 to 2015.
Figure 21: NSW small industrial gas price components % (Sydney)
NSW has much higher transportation charges than Victoria, typically five times that of
Melbourne on a $/GJ basis, making up some 40% of their delivered costs as opposed
to 11% in Victoria. This is due to the longer transmission pipelines supplying Sydney
and much lower average distribution costs in Melbourne (higher usage density).Figure
22: Figure 22 shows a potential convergence of NSW and Victorian wholesale gas
prices. This may seem logical as more gas is sourced from Victoria for NSW
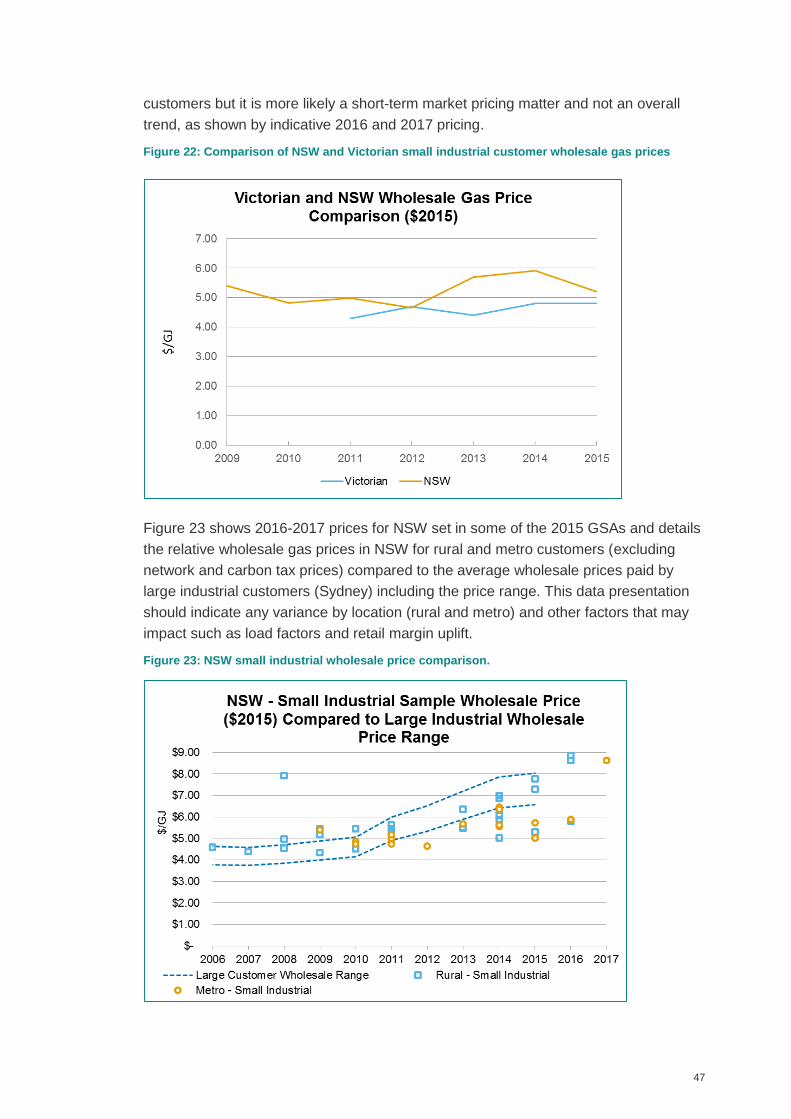
47
customers but it is more likely a short-term market pricing matter and not an overall
trend, as shown by indicative 2016 and 2017 pricing.
Figure 22: Comparison of NSW and Victorian small industrial customer wholesale gas prices
Figure 23 shows 2016-2017 prices for NSW set in some of the 2015 GSAs and details
the relative wholesale gas prices in NSW for rural and metro customers (excluding
network and carbon tax prices) compared to the average wholesale prices paid by
large industrial customers (Sydney) including the price range. This data presentation
should indicate any variance by location (rural and metro) and other factors that may
impact such as load factors and retail margin uplift.
Figure 23: NSW small industrial wholesale price comparison.
48
From the above:
The general price trend is indicative of the historical charts for the large industrial
customers until more recent years, when there is a distinct departure shown in the
sample data.
The data indicates major increases that will see prices range from approximately
$6.00/GJ to $9.00/GJ ($2015). A likely explanation is that several of the large
retailers had excessive LNG ramp gas available in their trading portfolios and have
been clearing this in the small industrial market. This makes some sense as there
would be more certainty of clearing this gas in this market rather than via larger
firm GSAs with large industrial customers.
This is a very recent (and short-term) trend with 3-year deals being offered at good
rates for the first year followed by rapid price escalations thereafter.
The data also appears to show a slightly greater lag in price increases penetrating
the small industrial market, which is similar to Victorian trends.
There is again some small uplift in prices for rural customers over metro
customers.30
The data also seems to show that there are no significant retailer margin uplifts for
metro customers over larger industrials.
30 In 2008, there was a very high-price rural outlier that was also one of the highest load factor
customers. The base data also showed that very new and more remote supply areas (like
Tamworth) had significant price uplifts and these were discarded as we could not discern if they
were load factor related or retail margin driven.
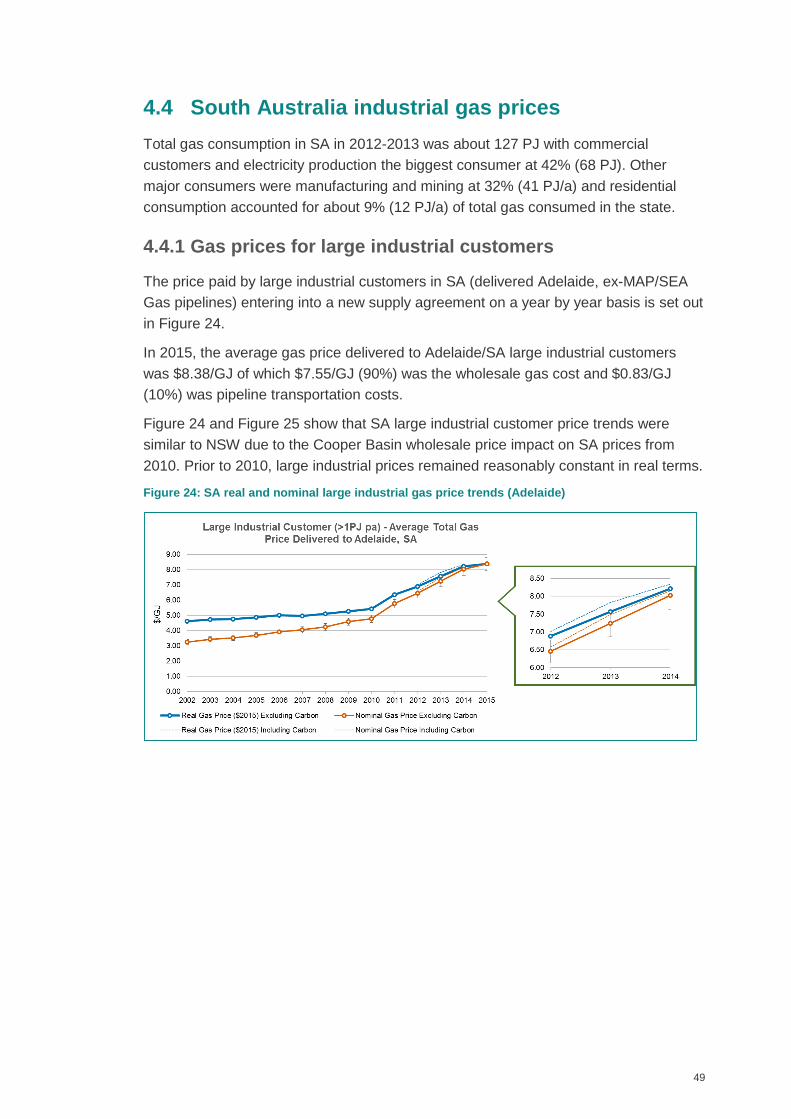
49
4.4 South Australia industrial gas prices
Total gas consumption in SA in 2012-2013 was about 127 PJ with commercial
customers and electricity production the biggest consumer at 42% (68 PJ). Other
major consumers were manufacturing and mining at 32% (41 PJ/a) and residential
consumption accounted for about 9% (12 PJ/a) of total gas consumed in the state.
4.4.1 Gas prices for large industrial customers
The price paid by large industrial customers in SA (delivered Adelaide, ex-MAP/SEA
Gas pipelines) entering into a new supply agreement on a year by year basis is set out
in Figure 24.
In 2015, the average gas price delivered to Adelaide/SA large industrial customers
was $8.38/GJ of which $7.55/GJ (90%) was the wholesale gas cost and $0.83/GJ
(10%) was pipeline transportation costs.
Figure 24 and Figure 25 show that SA large industrial customer price trends were
similar to NSW due to the Cooper Basin wholesale price impact on SA prices from
2010. Prior to 2010, large industrial prices remained reasonably constant in real terms.
Figure 24: SA real and nominal large industrial gas price trends (Adelaide)
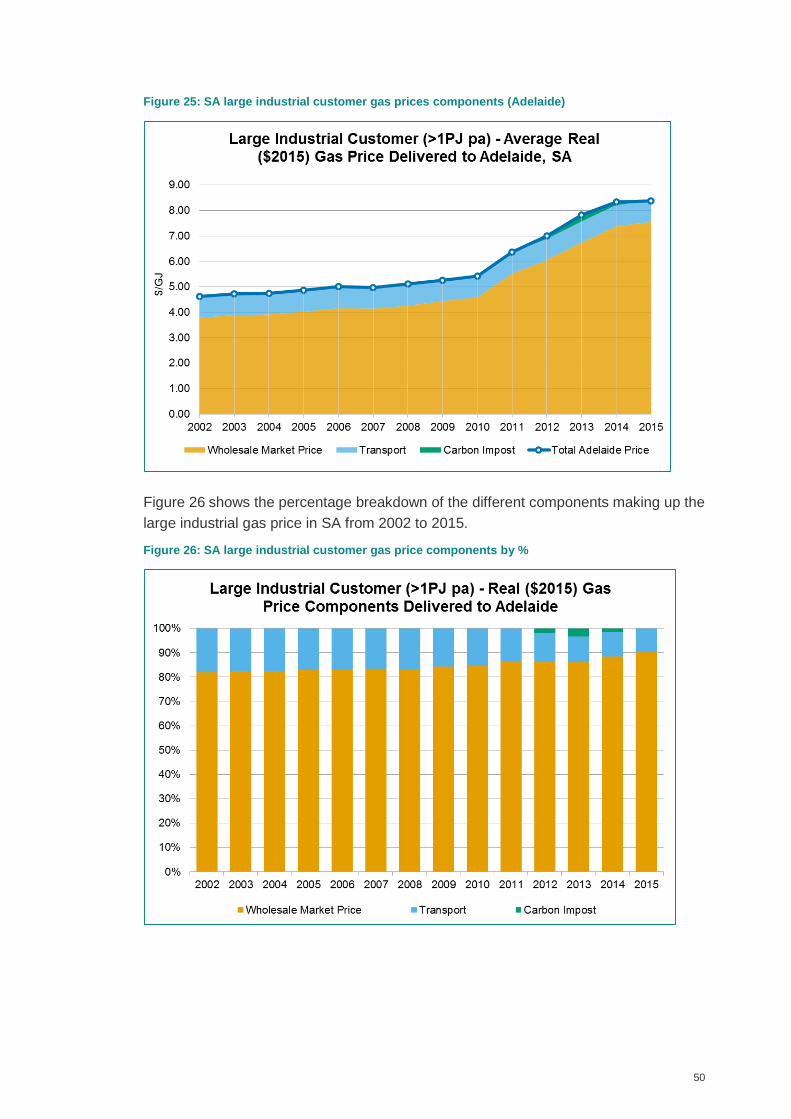
50
Figure 25: SA large industrial customer gas prices components (Adelaide)
Figure 26 shows the percentage breakdown of the different components making up the
large industrial gas price in SA from 2002 to 2015.
Figure 26: SA large industrial customer gas price components by %
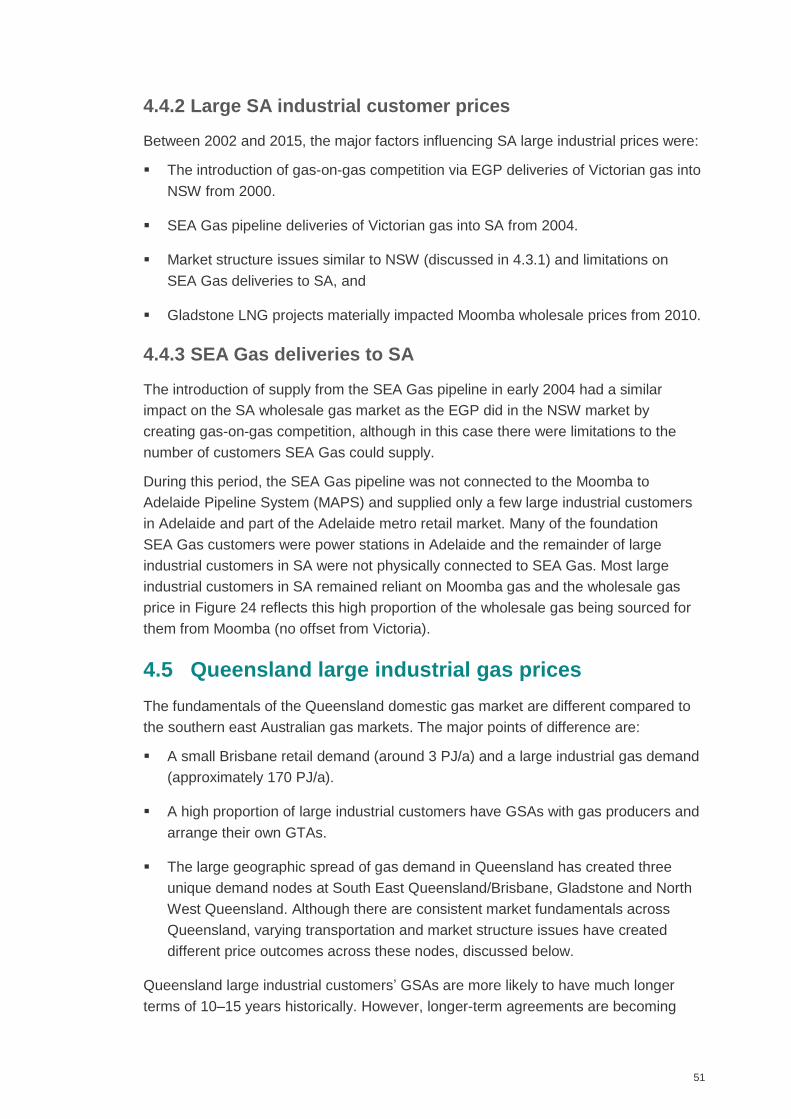
51
4.4.2 Large SA industrial customer prices
Between 2002 and 2015, the major factors influencing SA large industrial prices were:
The introduction of gas-on-gas competition via EGP deliveries of Victorian gas into
NSW from 2000.
SEA Gas pipeline deliveries of Victorian gas into SA from 2004.
Market structure issues similar to NSW (discussed in 4.3.1) and limitations on
SEA Gas deliveries to SA, and
Gladstone LNG projects materially impacted Moomba wholesale prices from 2010.
4.4.3 SEA Gas deliveries to SA
The introduction of supply from the SEA Gas pipeline in early 2004 had a similar
impact on the SA wholesale gas market as the EGP did in the NSW market by
creating gas-on-gas competition, although in this case there were limitations to the
number of customers SEA Gas could supply.
During this period, the SEA Gas pipeline was not connected to the Moomba to
Adelaide Pipeline System (MAPS) and supplied only a few large industrial customers
in Adelaide and part of the Adelaide metro retail market. Many of the foundation
SEA Gas customers were power stations in Adelaide and the remainder of large
industrial customers in SA were not physically connected to SEA Gas. Most large
industrial customers in SA remained reliant on Moomba gas and the wholesale gas
price in Figure 24 reflects this high proportion of the wholesale gas being sourced for
them from Moomba (no offset from Victoria).
4.5 Queensland large industrial gas prices
The fundamentals of the Queensland domestic gas market are different compared to
the southern east Australian gas markets. The major points of difference are:
A small Brisbane retail demand (around 3 PJ/a) and a large industrial gas demand
(approximately 170 PJ/a).
A high proportion of large industrial customers have GSAs with gas producers and
arrange their own GTAs.
The large geographic spread of gas demand in Queensland has created three
unique demand nodes at South East Queensland/Brisbane, Gladstone and North
West Queensland. Although there are consistent market fundamentals across
Queensland, varying transportation and market structure issues have created
different price outcomes across these nodes, discussed below.
Queensland large industrial customers’ GSAs are more likely to have much longer
terms of 10–15 years historically. However, longer-term agreements are becoming
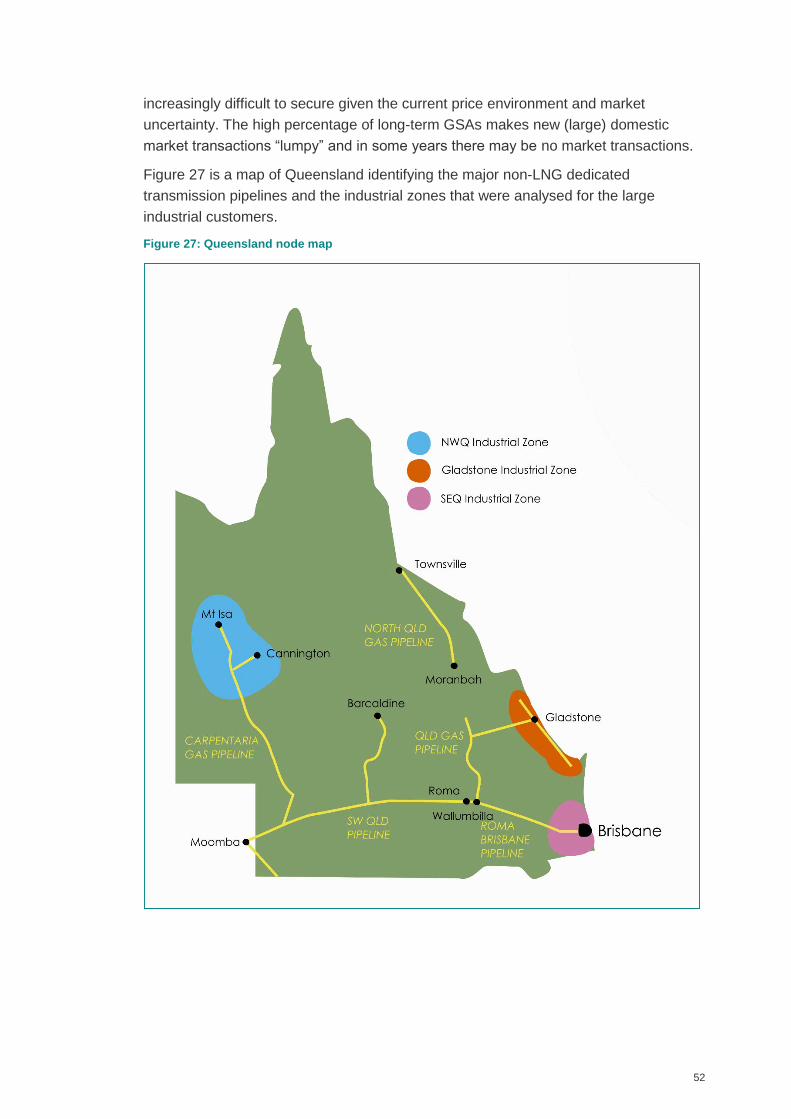
52
increasingly difficult to secure given the current price environment and market
uncertainty. The high percentage of long-term GSAs makes new (large) domestic
market transactions “lumpy” and in some years there may be no market transactions.
Figure 27 is a map of Queensland identifying the major non-LNG dedicated
transmission pipelines and the industrial zones that were analysed for the large
industrial customers.
Figure 27: Queensland node map
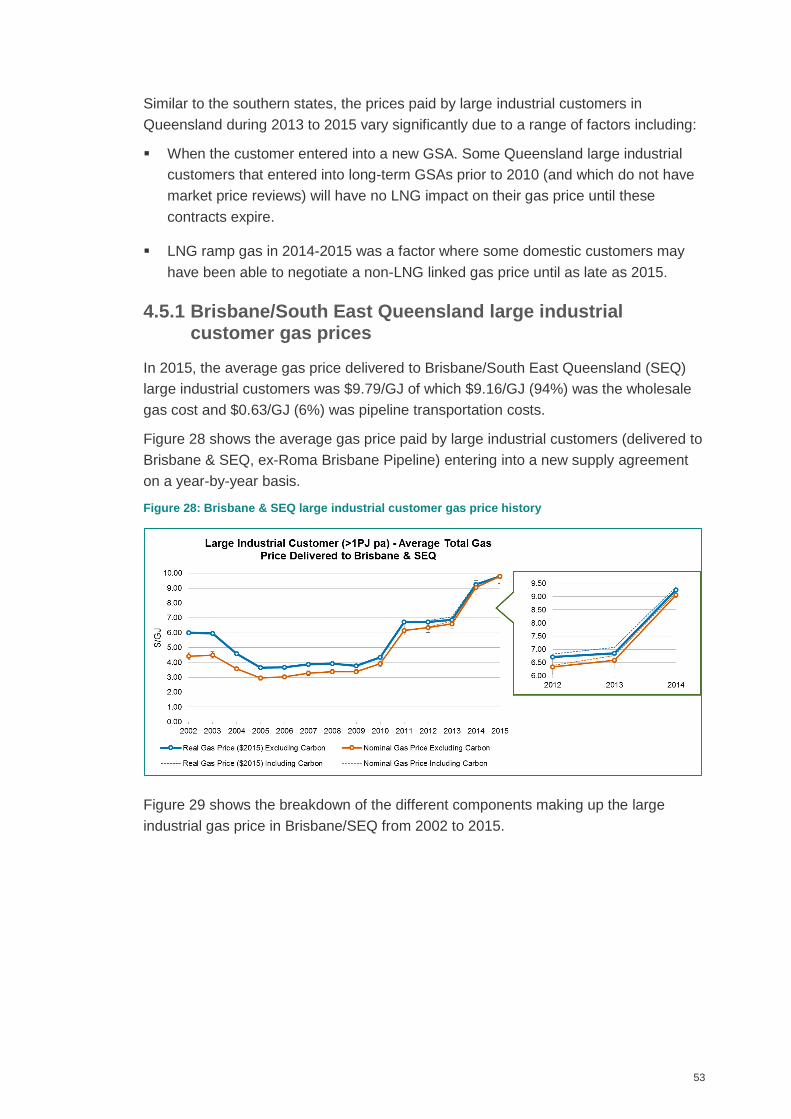
53
Similar to the southern states, the prices paid by large industrial customers in
Queensland during 2013 to 2015 vary significantly due to a range of factors including:
When the customer entered into a new GSA. Some Queensland large industrial
customers that entered into long-term GSAs prior to 2010 (and which do not have
market price reviews) will have no LNG impact on their gas price until these
contracts expire.
LNG ramp gas in 2014-2015 was a factor where some domestic customers may
have been able to negotiate a non-LNG linked gas price until as late as 2015.
4.5.1 Brisbane/South East Queensland large industrial customer gas prices
In 2015, the average gas price delivered to Brisbane/South East Queensland (SEQ)
large industrial customers was $9.79/GJ of which $9.16/GJ (94%) was the wholesale
gas cost and $0.63/GJ (6%) was pipeline transportation costs.
Figure 28 shows the average gas price paid by large industrial customers (delivered to
Brisbane & SEQ, ex-Roma Brisbane Pipeline) entering into a new supply agreement
on a year-by-year basis.
Figure 28: Brisbane & SEQ large industrial customer gas price history
Figure 29 shows the breakdown of the different components making up the large
industrial gas price in Brisbane/SEQ from 2002 to 2015.
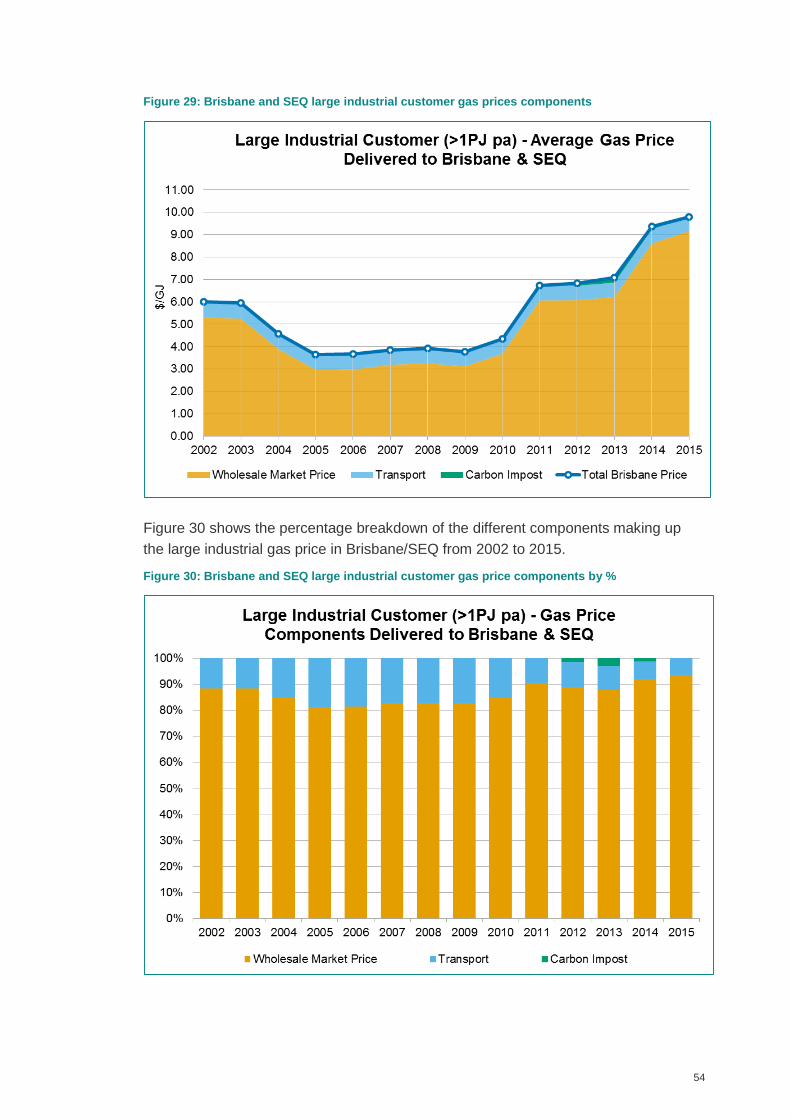
54
Figure 29: Brisbane and SEQ large industrial customer gas prices components
Figure 30 shows the percentage breakdown of the different components making up
the large industrial gas price in Brisbane/SEQ from 2002 to 2015.
Figure 30: Brisbane and SEQ large industrial customer gas price components by %
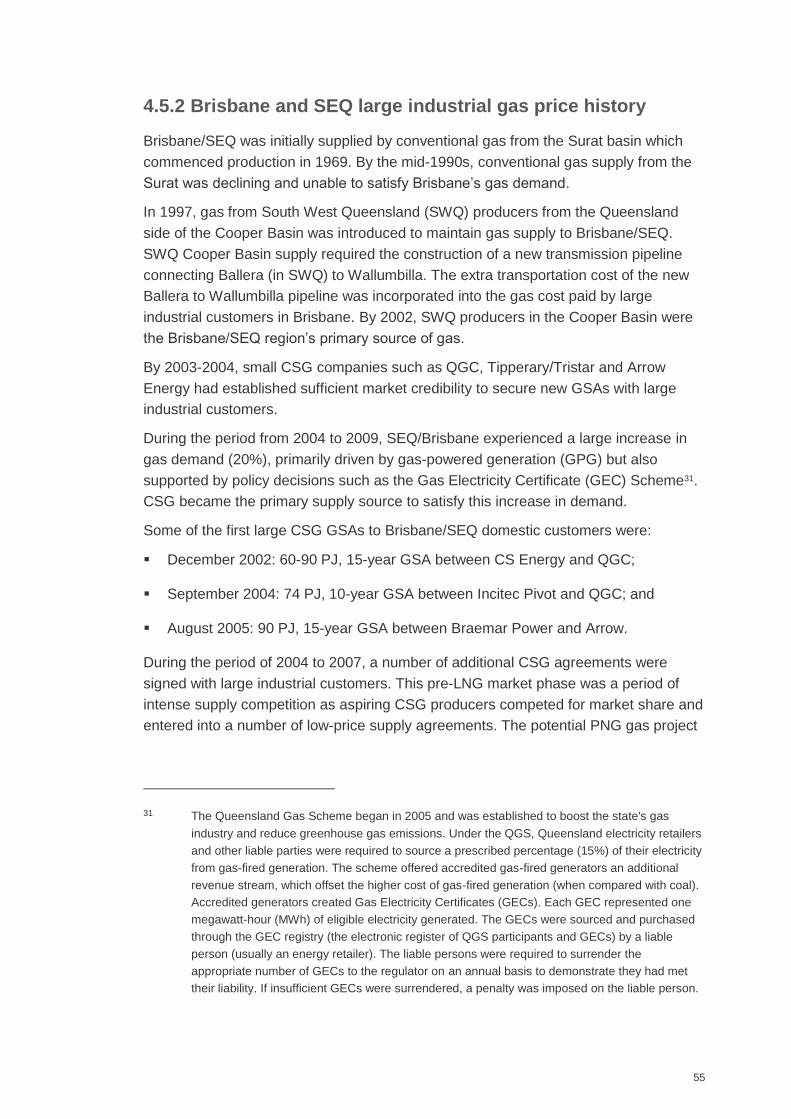
55
4.5.2 Brisbane and SEQ large industrial gas price history
Brisbane/SEQ was initially supplied by conventional gas from the Surat basin which
commenced production in 1969. By the mid-1990s, conventional gas supply from the
Surat was declining and unable to satisfy Brisbane’s gas demand.
In 1997, gas from South West Queensland (SWQ) producers from the Queensland
side of the Cooper Basin was introduced to maintain gas supply to Brisbane/SEQ.
SWQ Cooper Basin supply required the construction of a new transmission pipeline
connecting Ballera (in SWQ) to Wallumbilla. The extra transportation cost of the new
Ballera to Wallumbilla pipeline was incorporated into the gas cost paid by large
industrial customers in Brisbane. By 2002, SWQ producers in the Cooper Basin were
the Brisbane/SEQ region’s primary source of gas.
By 2003-2004, small CSG companies such as QGC, Tipperary/Tristar and Arrow
Energy had established sufficient market credibility to secure new GSAs with large
industrial customers.
During the period from 2004 to 2009, SEQ/Brisbane experienced a large increase in
gas demand (20%), primarily driven by gas-powered generation (GPG) but also
supported by policy decisions such as the Gas Electricity Certificate (GEC) Scheme31.
CSG became the primary supply source to satisfy this increase in demand.
Some of the first large CSG GSAs to Brisbane/SEQ domestic customers were:
December 2002: 60-90 PJ, 15-year GSA between CS Energy and QGC;
September 2004: 74 PJ, 10-year GSA between Incitec Pivot and QGC; and
August 2005: 90 PJ, 15-year GSA between Braemar Power and Arrow.
During the period of 2004 to 2007, a number of additional CSG agreements were
signed with large industrial customers. This pre-LNG market phase was a period of
intense supply competition as aspiring CSG producers competed for market share and
entered into a number of low-price supply agreements. The potential PNG gas project
31 The Queensland Gas Scheme began in 2005 and was established to boost the state's gas
industry and reduce greenhouse gas emissions. Under the QGS, Queensland electricity retailers
and other liable parties were required to source a prescribed percentage (15%) of their electricity
from gas-fired generation. The scheme offered accredited gas-fired generators an additional
revenue stream, which offset the higher cost of gas-fired generation (when compared with coal).
Accredited generators created Gas Electricity Certificates (GECs). Each GEC represented one
megawatt-hour (MWh) of eligible electricity generated. The GECs were sourced and purchased
through the GEC registry (the electronic register of QGS participants and GECs) by a liable
person (usually an energy retailer). The liable persons were required to surrender the
appropriate number of GECs to the regulator on an annual basis to demonstrate they had met
their liability. If insufficient GECs were surrendered, a penalty was imposed on the liable person.
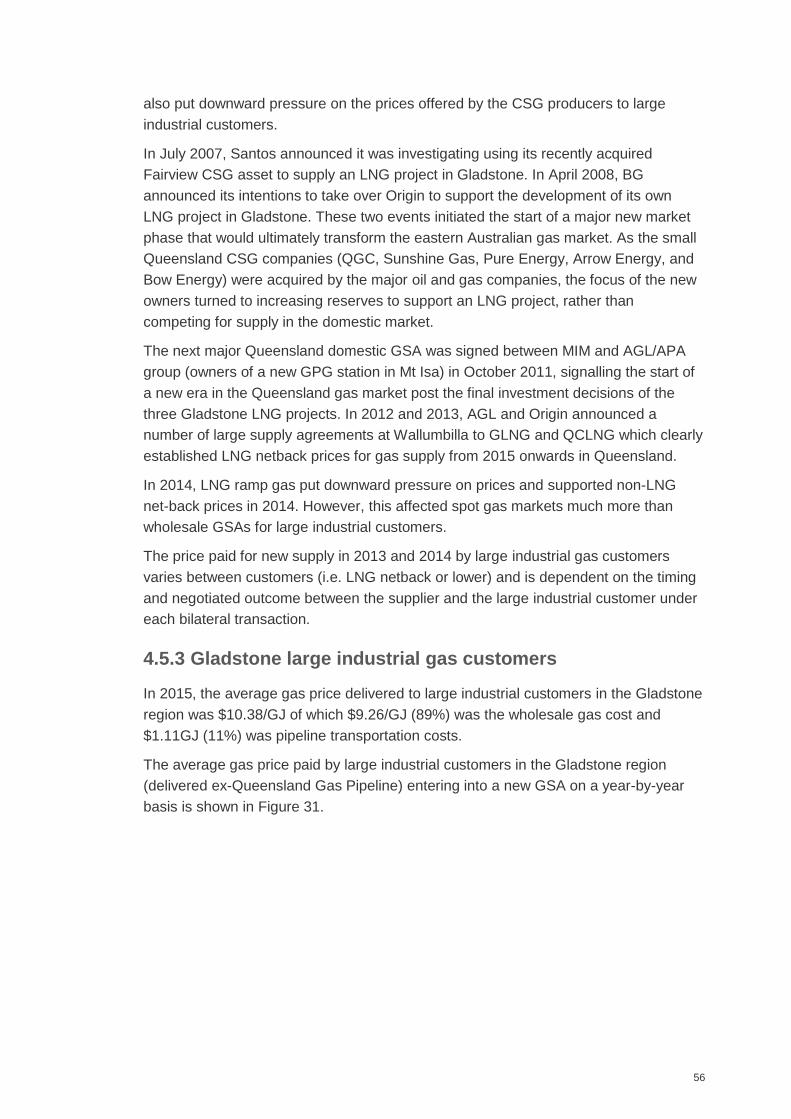
56
also put downward pressure on the prices offered by the CSG producers to large
industrial customers.
In July 2007, Santos announced it was investigating using its recently acquired
Fairview CSG asset to supply an LNG project in Gladstone. In April 2008, BG
announced its intentions to take over Origin to support the development of its own
LNG project in Gladstone. These two events initiated the start of a major new market
phase that would ultimately transform the eastern Australian gas market. As the small
Queensland CSG companies (QGC, Sunshine Gas, Pure Energy, Arrow Energy, and
Bow Energy) were acquired by the major oil and gas companies, the focus of the new
owners turned to increasing reserves to support an LNG project, rather than
competing for supply in the domestic market.
The next major Queensland domestic GSA was signed between MIM and AGL/APA
group (owners of a new GPG station in Mt Isa) in October 2011, signalling the start of
a new era in the Queensland gas market post the final investment decisions of the
three Gladstone LNG projects. In 2012 and 2013, AGL and Origin announced a
number of large supply agreements at Wallumbilla to GLNG and QCLNG which clearly
established LNG netback prices for gas supply from 2015 onwards in Queensland.
In 2014, LNG ramp gas put downward pressure on prices and supported non-LNG
net-back prices in 2014. However, this affected spot gas markets much more than
wholesale GSAs for large industrial customers.
The price paid for new supply in 2013 and 2014 by large industrial gas customers
varies between customers (i.e. LNG netback or lower) and is dependent on the timing
and negotiated outcome between the supplier and the large industrial customer under
each bilateral transaction.
4.5.3 Gladstone large industrial gas customers
In 2015, the average gas price delivered to large industrial customers in the Gladstone
region was $10.38/GJ of which $9.26/GJ (89%) was the wholesale gas cost and
$1.11GJ (11%) was pipeline transportation costs.
The average gas price paid by large industrial customers in the Gladstone region
(delivered ex-Queensland Gas Pipeline) entering into a new GSA on a year-by-year
basis is shown in Figure 31.
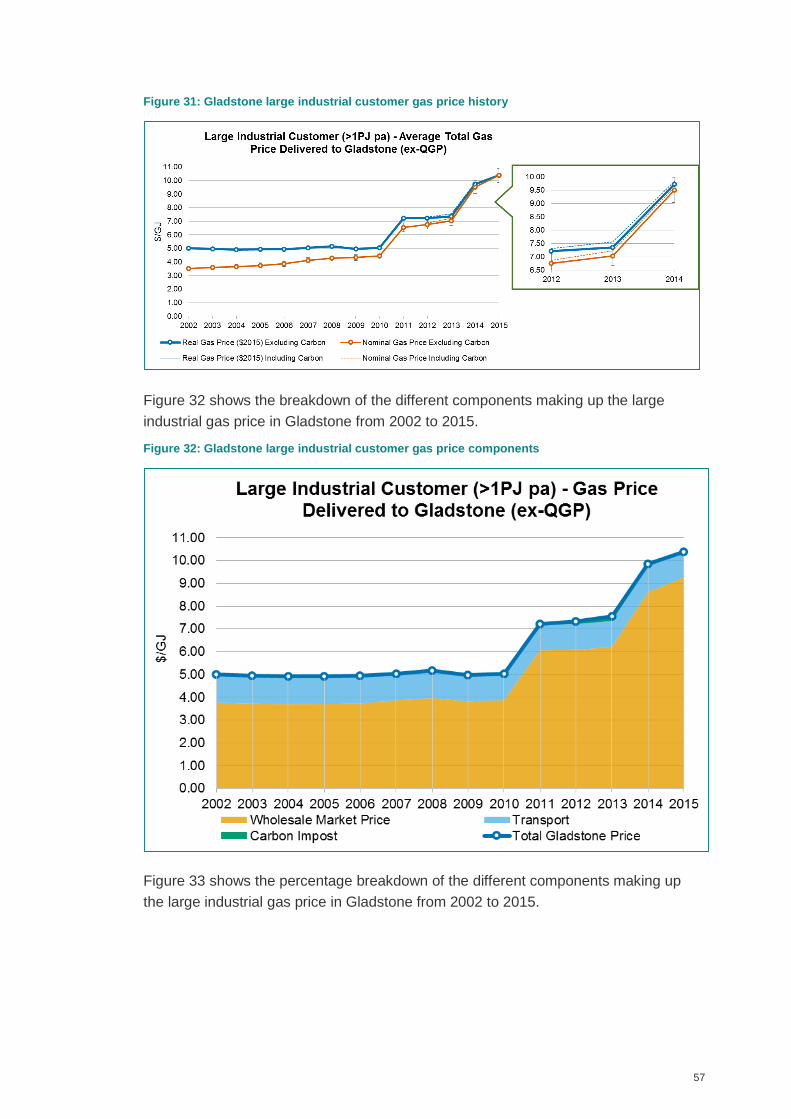
57
Figure 31: Gladstone large industrial customer gas price history
Figure 32 shows the breakdown of the different components making up the large
industrial gas price in Gladstone from 2002 to 2015.
Figure 32: Gladstone large industrial customer gas price components
Figure 33 shows the percentage breakdown of the different components making up
the large industrial gas price in Gladstone from 2002 to 2015.
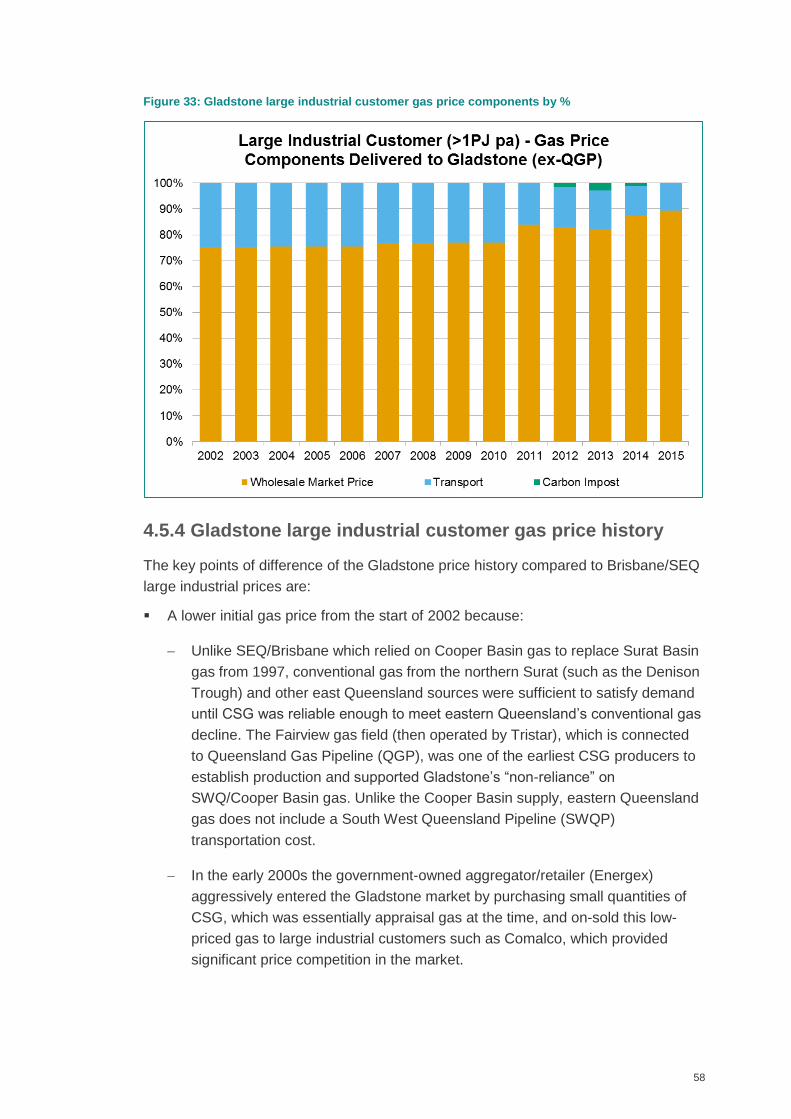
58
Figure 33: Gladstone large industrial customer gas price components by %
4.5.4 Gladstone large industrial customer gas price history
The key points of difference of the Gladstone price history compared to Brisbane/SEQ
large industrial prices are:
A lower initial gas price from the start of 2002 because:
Unlike SEQ/Brisbane which relied on Cooper Basin gas to replace Surat Basin
gas from 1997, conventional gas from the northern Surat (such as the Denison
Trough) and other east Queensland sources were sufficient to satisfy demand
until CSG was reliable enough to meet eastern Queensland’s conventional gas
decline. The Fairview gas field (then operated by Tristar), which is connected
to Queensland Gas Pipeline (QGP), was one of the earliest CSG producers to
establish production and supported Gladstone’s “non-reliance” on
SWQ/Cooper Basin gas. Unlike the Cooper Basin supply, eastern Queensland
gas does not include a South West Queensland Pipeline (SWQP)
transportation cost.
In the early 2000s the government-owned aggregator/retailer (Energex)
aggressively entered the Gladstone market by purchasing small quantities of
CSG, which was essentially appraisal gas at the time, and on-sold this low-
priced gas to large industrial customers such as Comalco, which provided
significant price competition in the market.
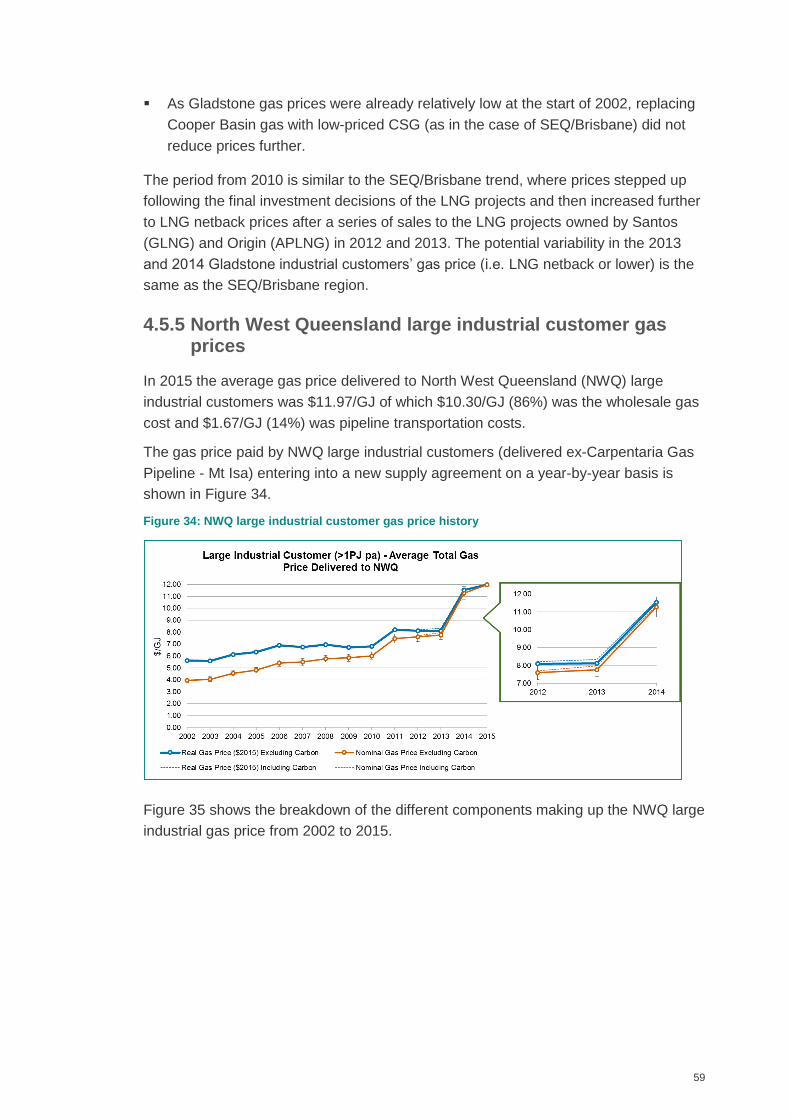
59
As Gladstone gas prices were already relatively low at the start of 2002, replacing
Cooper Basin gas with low-priced CSG (as in the case of SEQ/Brisbane) did not
reduce prices further.
The period from 2010 is similar to the SEQ/Brisbane trend, where prices stepped up
following the final investment decisions of the LNG projects and then increased further
to LNG netback prices after a series of sales to the LNG projects owned by Santos
(GLNG) and Origin (APLNG) in 2012 and 2013. The potential variability in the 2013
and 2014 Gladstone industrial customers’ gas price (i.e. LNG netback or lower) is the
same as the SEQ/Brisbane region.
4.5.5 North West Queensland large industrial customer gas prices
In 2015 the average gas price delivered to North West Queensland (NWQ) large
industrial customers was $11.97/GJ of which $10.30/GJ (86%) was the wholesale gas
cost and $1.67/GJ (14%) was pipeline transportation costs.
The gas price paid by NWQ large industrial customers (delivered ex-Carpentaria Gas
Pipeline - Mt Isa) entering into a new supply agreement on a year-by-year basis is
shown in Figure 34.
Figure 34: NWQ large industrial customer gas price history
Figure 35 shows the breakdown of the different components making up the NWQ large
industrial gas price from 2002 to 2015.
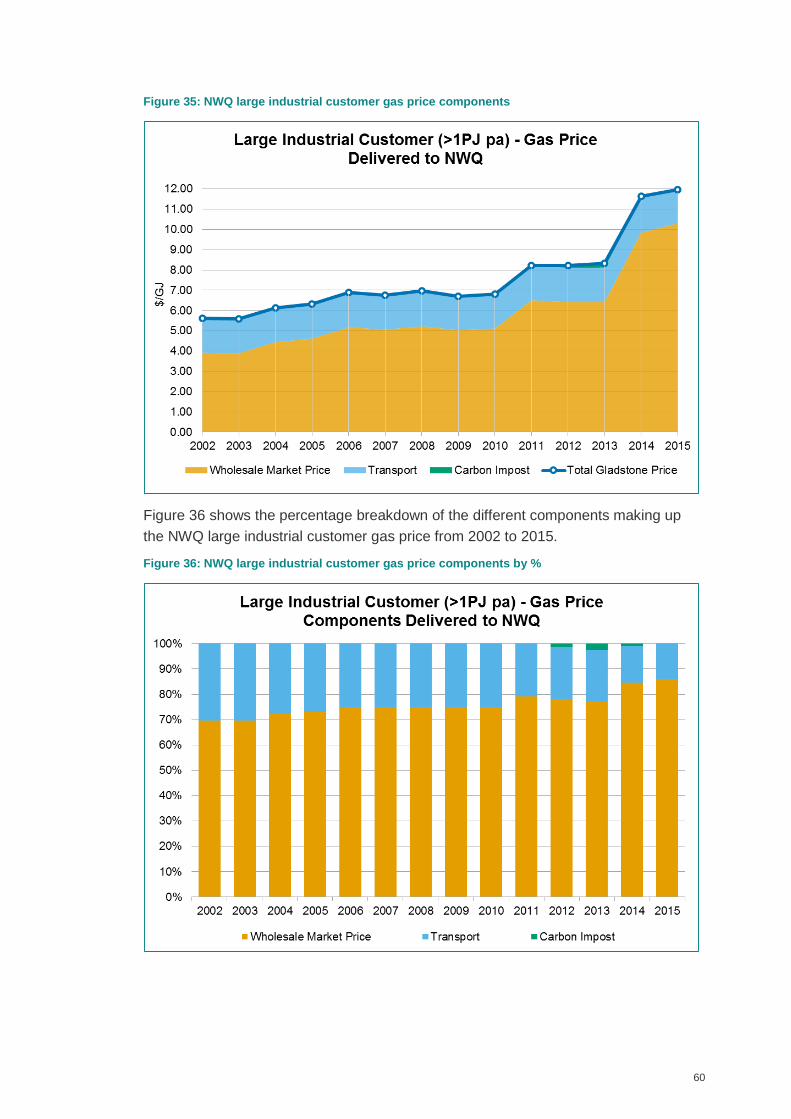
60
Figure 35: NWQ large industrial customer gas price components
Figure 36 shows the percentage breakdown of the different components making up
the NWQ large industrial customer gas price from 2002 to 2015.
Figure 36: NWQ large industrial customer gas price components by %
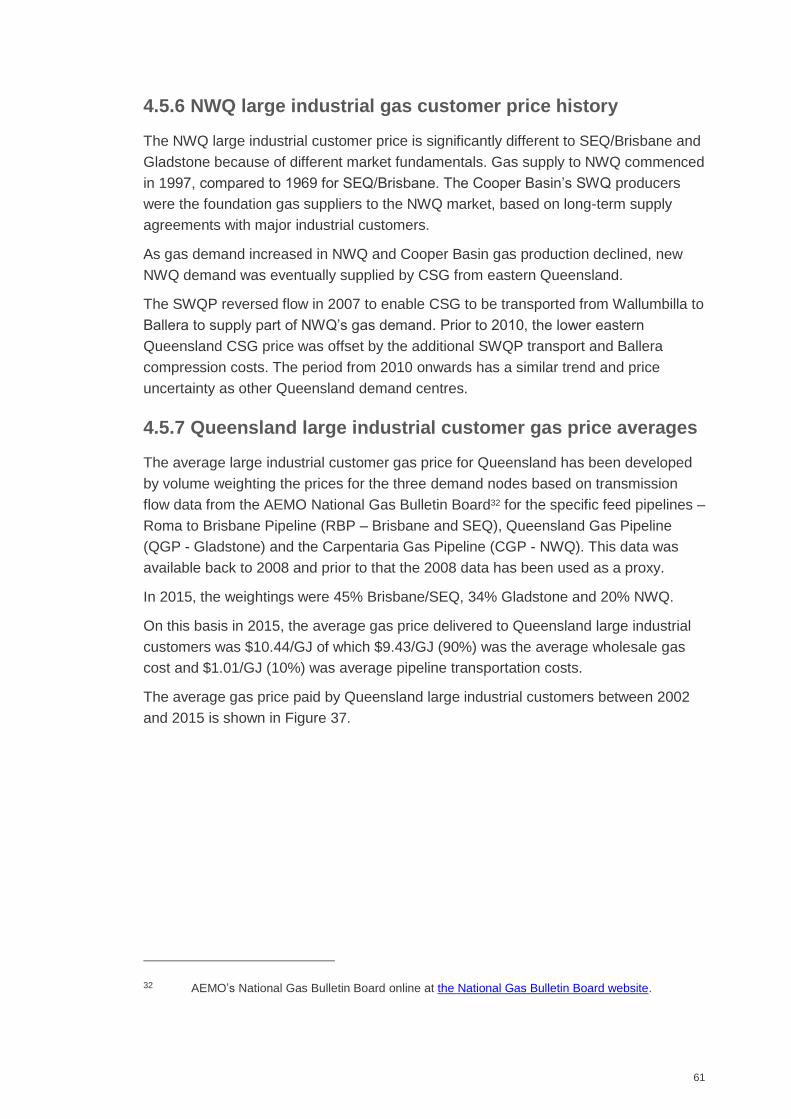
61
4.5.6 NWQ large industrial gas customer price history
The NWQ large industrial customer price is significantly different to SEQ/Brisbane and
Gladstone because of different market fundamentals. Gas supply to NWQ commenced
in 1997, compared to 1969 for SEQ/Brisbane. The Cooper Basin’s SWQ producers
were the foundation gas suppliers to the NWQ market, based on long-term supply
agreements with major industrial customers.
As gas demand increased in NWQ and Cooper Basin gas production declined, new
NWQ demand was eventually supplied by CSG from eastern Queensland.
The SWQP reversed flow in 2007 to enable CSG to be transported from Wallumbilla to
Ballera to supply part of NWQ’s gas demand. Prior to 2010, the lower eastern
Queensland CSG price was offset by the additional SWQP transport and Ballera
compression costs. The period from 2010 onwards has a similar trend and price
uncertainty as other Queensland demand centres.
4.5.7 Queensland large industrial customer gas price averages
The average large industrial customer gas price for Queensland has been developed
by volume weighting the prices for the three demand nodes based on transmission
flow data from the AEMO National Gas Bulletin Board32 for the specific feed pipelines –
Roma to Brisbane Pipeline (RBP – Brisbane and SEQ), Queensland Gas Pipeline
(QGP - Gladstone) and the Carpentaria Gas Pipeline (CGP - NWQ). This data was
available back to 2008 and prior to that the 2008 data has been used as a proxy.
In 2015, the weightings were 45% Brisbane/SEQ, 34% Gladstone and 20% NWQ.
On this basis in 2015, the average gas price delivered to Queensland large industrial
customers was $10.44/GJ of which $9.43/GJ (90%) was the average wholesale gas
cost and $1.01/GJ (10%) was average pipeline transportation costs.
The average gas price paid by Queensland large industrial customers between 2002
and 2015 is shown in Figure 37.
32 AEMO’s National Gas Bulletin Board online at the National Gas Bulletin Board website.
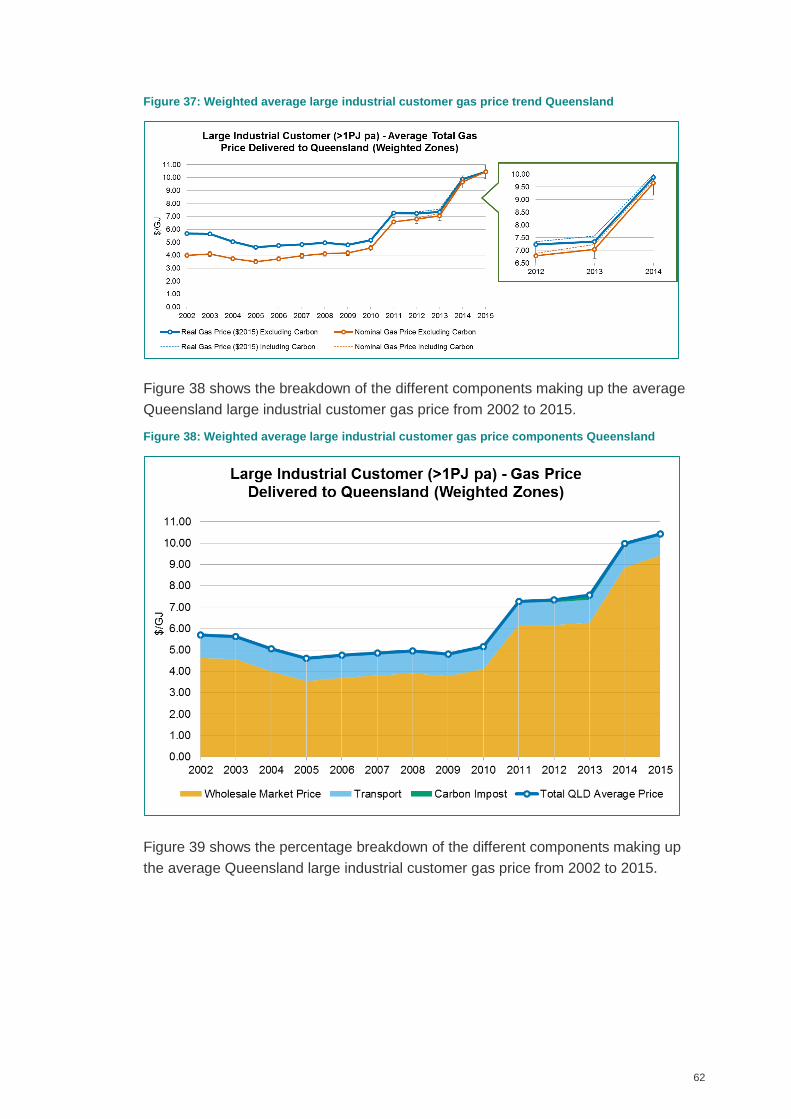
62
Figure 37: Weighted average large industrial customer gas price trend Queensland
Figure 38 shows the breakdown of the different components making up the average
Queensland large industrial customer gas price from 2002 to 2015.
Figure 38: Weighted average large industrial customer gas price components Queensland
Figure 39 shows the percentage breakdown of the different components making up
the average Queensland large industrial customer gas price from 2002 to 2015.
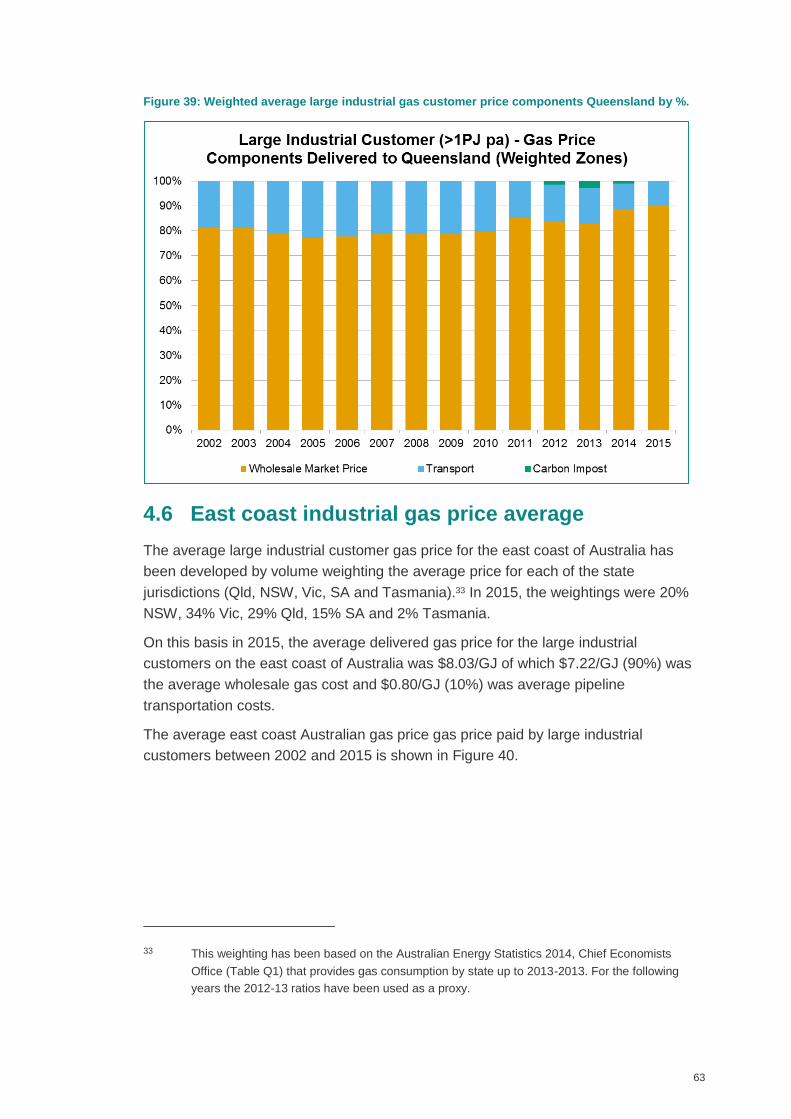
63
Figure 39: Weighted average large industrial gas customer price components Queensland by %.
4.6 East coast industrial gas price average
The average large industrial customer gas price for the east coast of Australia has
been developed by volume weighting the average price for each of the state
jurisdictions (Qld, NSW, Vic, SA and Tasmania).33 In 2015, the weightings were 20%
NSW, 34% Vic, 29% Qld, 15% SA and 2% Tasmania.
On this basis in 2015, the average delivered gas price for the large industrial
customers on the east coast of Australia was $8.03/GJ of which $7.22/GJ (90%) was
the average wholesale gas cost and $0.80/GJ (10%) was average pipeline
transportation costs.
The average east coast Australian gas price gas price paid by large industrial
customers between 2002 and 2015 is shown in Figure 40.
33 This weighting has been based on the Australian Energy Statistics 2014, Chief Economists
Office (Table Q1) that provides gas consumption by state up to 2013-2013. For the following
years the 2012-13 ratios have been used as a proxy.
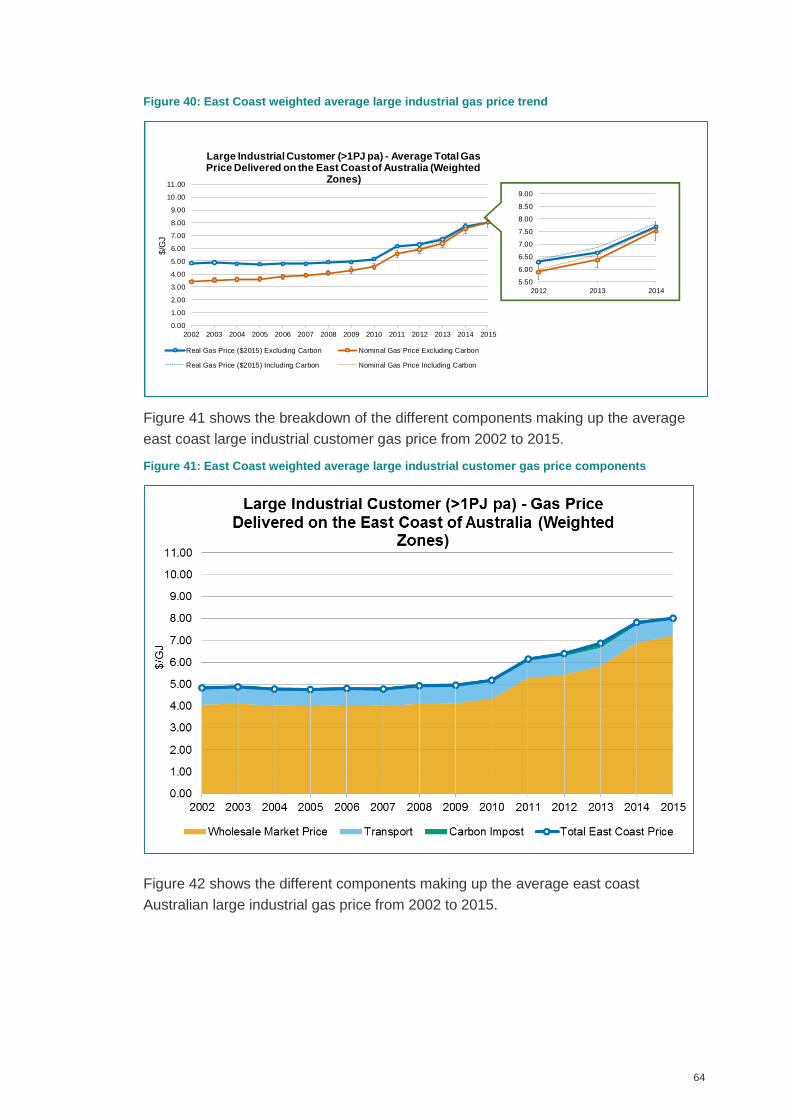
64
Figure 40: East Coast weighted average large industrial gas price trend
Figure 41 shows the breakdown of the different components making up the average
east coast large industrial customer gas price from 2002 to 2015.
Figure 41: East Coast weighted average large industrial customer gas price components
Figure 42 shows the different components making up the average east coast
Australian large industrial gas price from 2002 to 2015.
0.00
1.00
2.00
3.00
4.00
5.00
6.00
7.00
8.00
9.00
10.00
11.00
2002 2003 2004 2005 2006 2007 2008 2009 2010 2011 2012 2013 2014 2015
$/G
JLarge Industrial Customer (>1PJ pa) - Average Total Gas Price Delivered on the East Coast of Australia (Weighted
Zones)
Real Gas Price ($2015) Excluding Carbon Nominal Gas Price Excluding Carbon
Real Gas Price ($2015) Including Carbon Nominal Gas Price Including Carbon
5.50
6.00
6.50
7.00
7.50
8.00
8.50
9.00
2012 2013 2014
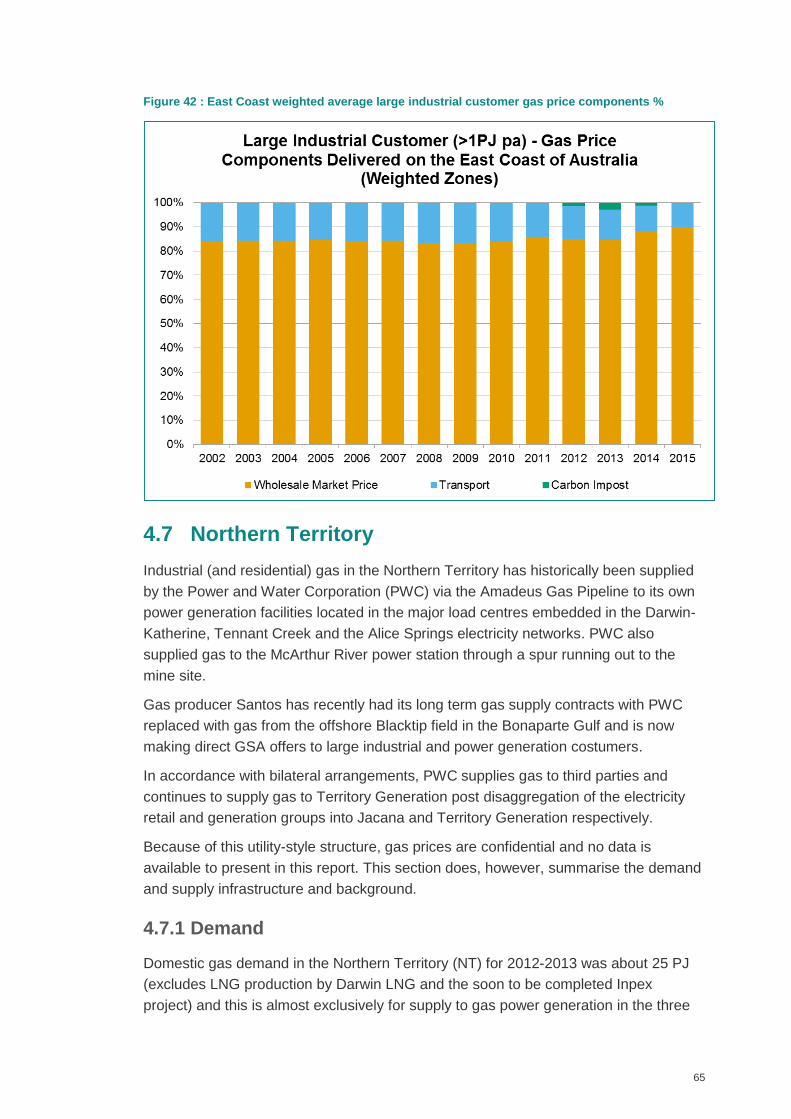
65
Figure 42 : East Coast weighted average large industrial customer gas price components %
4.7 Northern Territory
Industrial (and residential) gas in the Northern Territory has historically been supplied
by the Power and Water Corporation (PWC) via the Amadeus Gas Pipeline to its own
power generation facilities located in the major load centres embedded in the Darwin-
Katherine, Tennant Creek and the Alice Springs electricity networks. PWC also
supplied gas to the McArthur River power station through a spur running out to the
mine site.
Gas producer Santos has recently had its long term gas supply contracts with PWC
replaced with gas from the offshore Blacktip field in the Bonaparte Gulf and is now
making direct GSA offers to large industrial and power generation costumers.
In accordance with bilateral arrangements, PWC supplies gas to third parties and
continues to supply gas to Territory Generation post disaggregation of the electricity
retail and generation groups into Jacana and Territory Generation respectively.
Because of this utility-style structure, gas prices are confidential and no data is
available to present in this report. This section does, however, summarise the demand
and supply infrastructure and background.
4.7.1 Demand
Domestic gas demand in the Northern Territory (NT) for 2012-2013 was about 25 PJ
(excludes LNG production by Darwin LNG and the soon to be completed Inpex
project) and this is almost exclusively for supply to gas power generation in the three
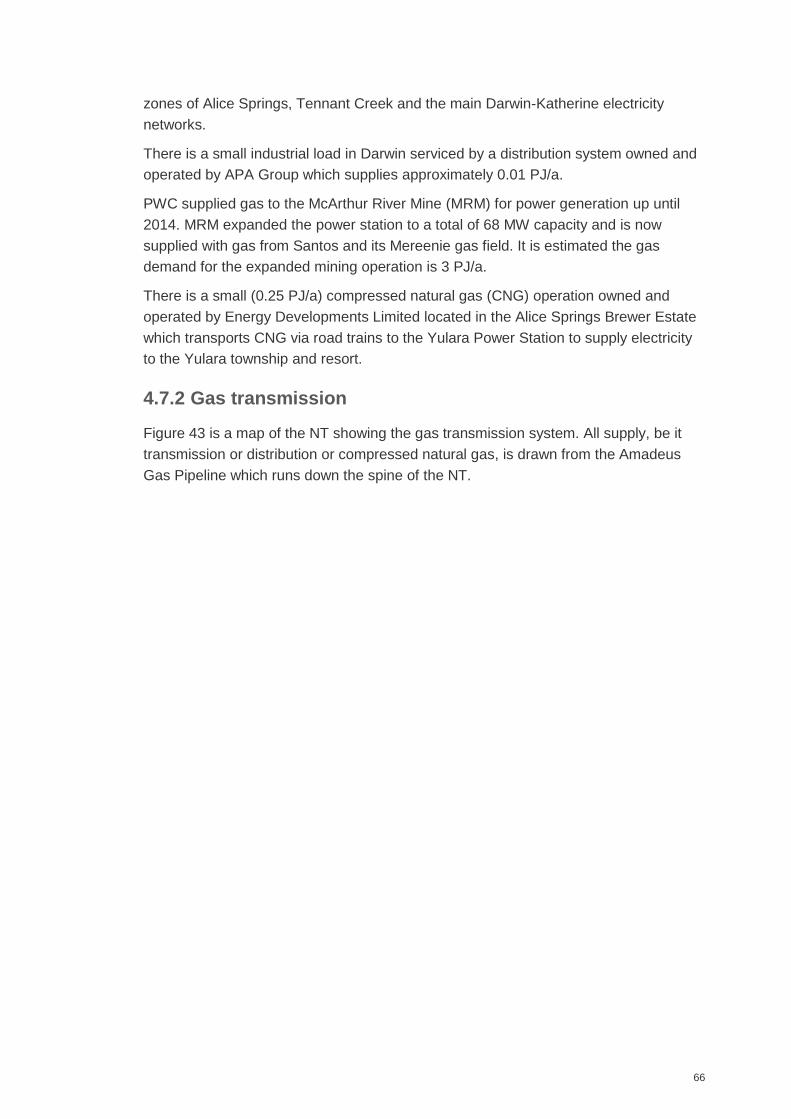
66
zones of Alice Springs, Tennant Creek and the main Darwin-Katherine electricity
networks.
There is a small industrial load in Darwin serviced by a distribution system owned and
operated by APA Group which supplies approximately 0.01 PJ/a.
PWC supplied gas to the McArthur River Mine (MRM) for power generation up until
2014. MRM expanded the power station to a total of 68 MW capacity and is now
supplied with gas from Santos and its Mereenie gas field. It is estimated the gas
demand for the expanded mining operation is 3 PJ/a.
There is a small (0.25 PJ/a) compressed natural gas (CNG) operation owned and
operated by Energy Developments Limited located in the Alice Springs Brewer Estate
which transports CNG via road trains to the Yulara Power Station to supply electricity
to the Yulara township and resort.
4.7.2 Gas transmission
Figure 43 is a map of the NT showing the gas transmission system. All supply, be it
transmission or distribution or compressed natural gas, is drawn from the Amadeus
Gas Pipeline which runs down the spine of the NT.
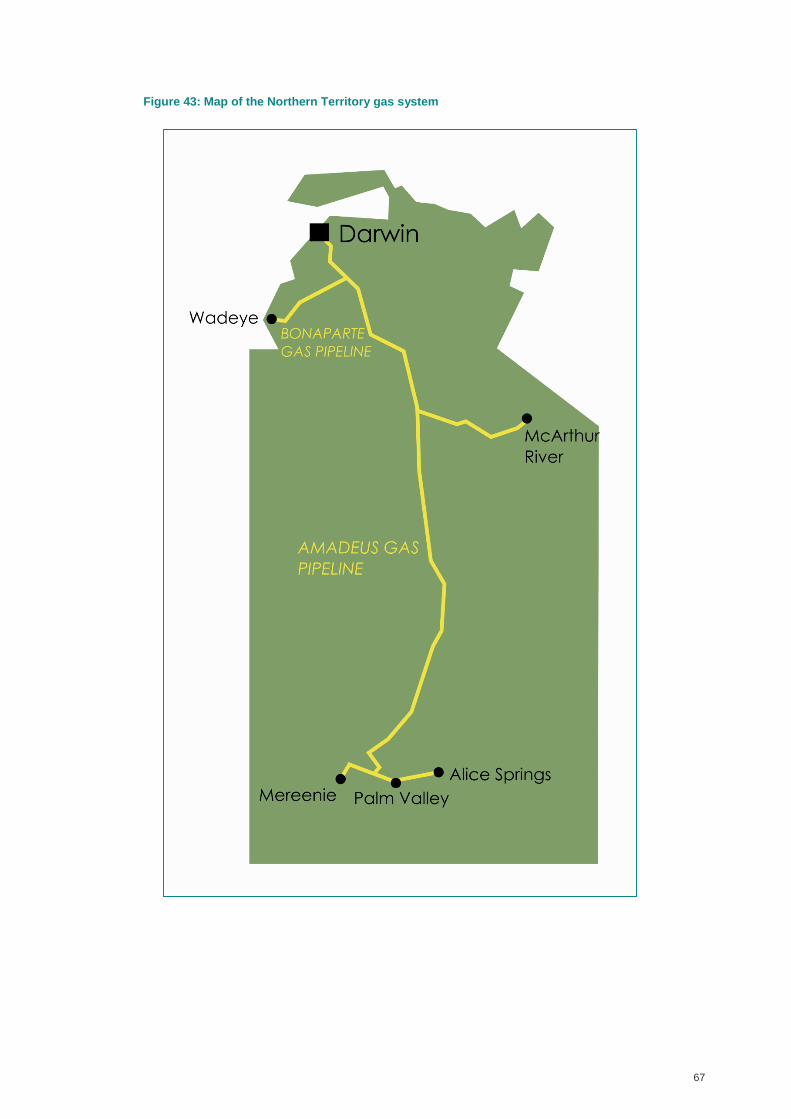
67
Figure 43: Map of the Northern Territory gas system
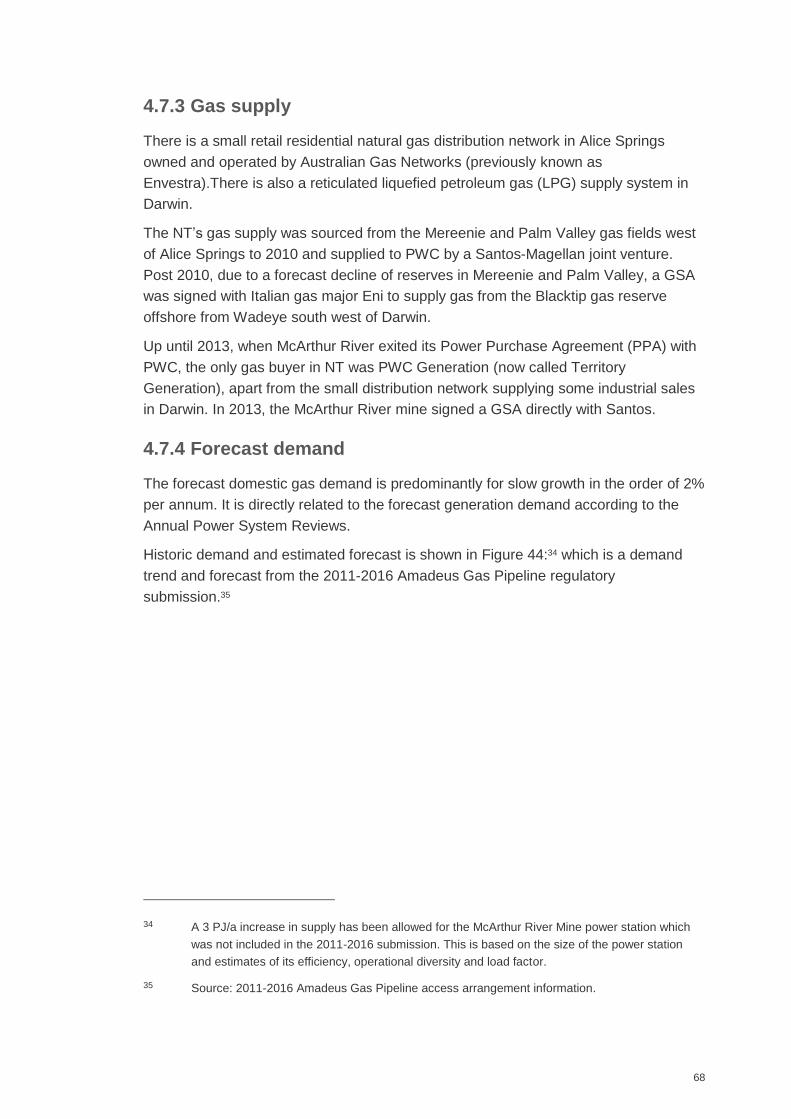
68
4.7.3 Gas supply
There is a small retail residential natural gas distribution network in Alice Springs
owned and operated by Australian Gas Networks (previously known as
Envestra).There is also a reticulated liquefied petroleum gas (LPG) supply system in
Darwin.
The NT’s gas supply was sourced from the Mereenie and Palm Valley gas fields west
of Alice Springs to 2010 and supplied to PWC by a Santos-Magellan joint venture.
Post 2010, due to a forecast decline of reserves in Mereenie and Palm Valley, a GSA
was signed with Italian gas major Eni to supply gas from the Blacktip gas reserve
offshore from Wadeye south west of Darwin.
Up until 2013, when McArthur River exited its Power Purchase Agreement (PPA) with
PWC, the only gas buyer in NT was PWC Generation (now called Territory
Generation), apart from the small distribution network supplying some industrial sales
in Darwin. In 2013, the McArthur River mine signed a GSA directly with Santos.
4.7.4 Forecast demand
The forecast domestic gas demand is predominantly for slow growth in the order of 2%
per annum. It is directly related to the forecast generation demand according to the
Annual Power System Reviews.
Historic demand and estimated forecast is shown in Figure 44:34 which is a demand
trend and forecast from the 2011-2016 Amadeus Gas Pipeline regulatory
submission.35
34 A 3 PJ/a increase in supply has been allowed for the McArthur River Mine power station which
was not included in the 2011-2016 submission. This is based on the size of the power station
and estimates of its efficiency, operational diversity and load factor.
35 Source: 2011-2016 Amadeus Gas Pipeline access arrangement information.
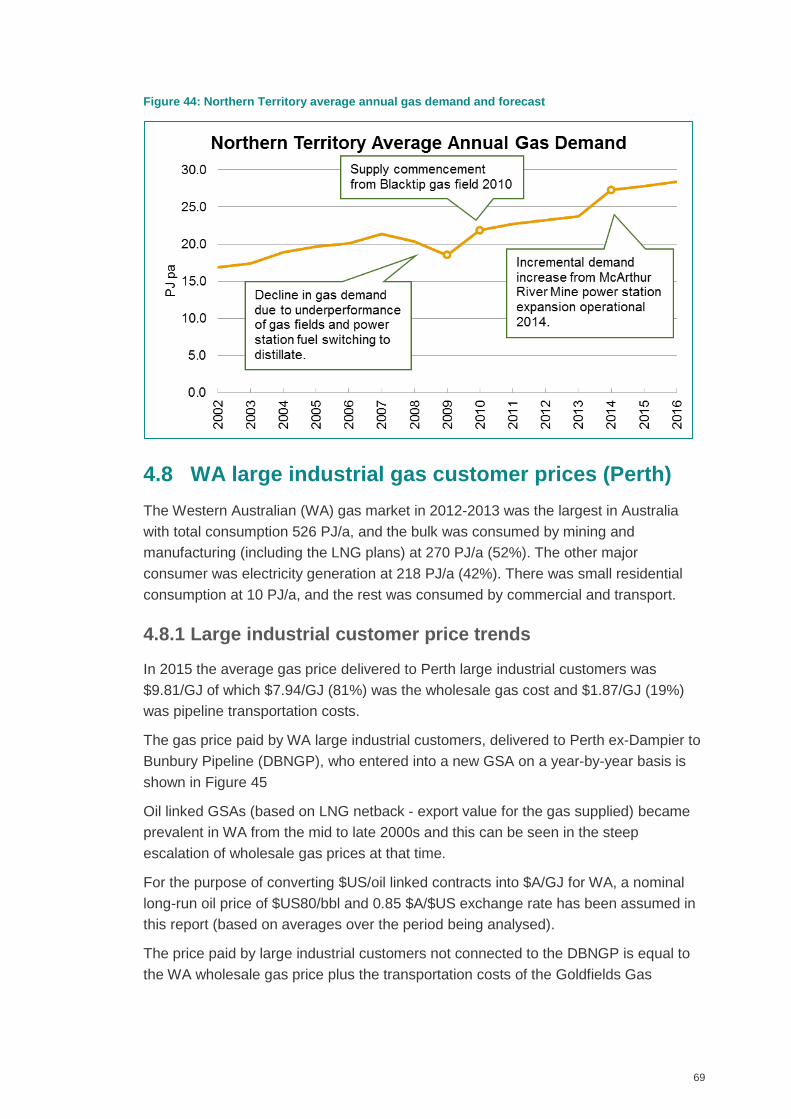
69
Figure 44: Northern Territory average annual gas demand and forecast
4.8 WA large industrial gas customer prices (Perth)
The Western Australian (WA) gas market in 2012-2013 was the largest in Australia
with total consumption 526 PJ/a, and the bulk was consumed by mining and
manufacturing (including the LNG plans) at 270 PJ/a (52%). The other major
consumer was electricity generation at 218 PJ/a (42%). There was small residential
consumption at 10 PJ/a, and the rest was consumed by commercial and transport.
4.8.1 Large industrial customer price trends
In 2015 the average gas price delivered to Perth large industrial customers was
$9.81/GJ of which $7.94/GJ (81%) was the wholesale gas cost and $1.87/GJ (19%)
was pipeline transportation costs.
The gas price paid by WA large industrial customers, delivered to Perth ex-Dampier to
Bunbury Pipeline (DBNGP), who entered into a new GSA on a year-by-year basis is
shown in Figure 45
Oil linked GSAs (based on LNG netback - export value for the gas supplied) became
prevalent in WA from the mid to late 2000s and this can be seen in the steep
escalation of wholesale gas prices at that time.
For the purpose of converting $US/oil linked contracts into $A/GJ for WA, a nominal
long-run oil price of $US80/bbl and 0.85 $A/$US exchange rate has been assumed in
this report (based on averages over the period being analysed).
The price paid by large industrial customers not connected to the DBNGP is equal to
the WA wholesale gas price plus the transportation costs of the Goldfields Gas
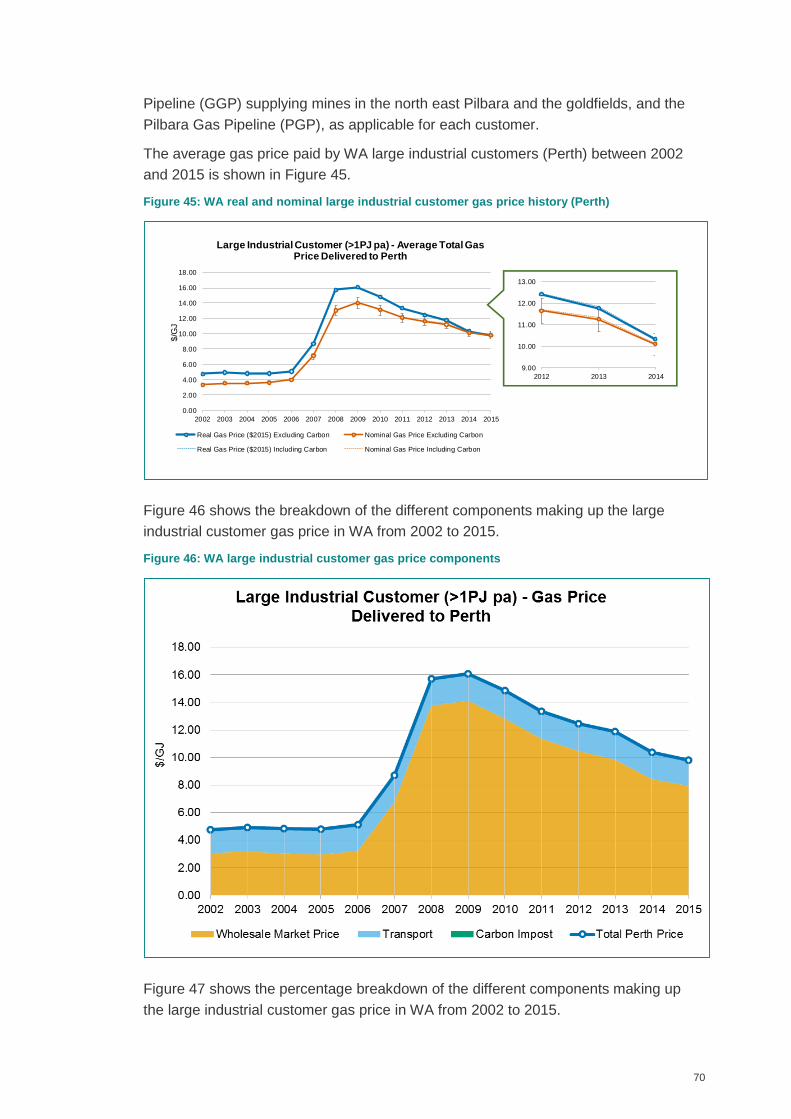
70
Pipeline (GGP) supplying mines in the north east Pilbara and the goldfields, and the
Pilbara Gas Pipeline (PGP), as applicable for each customer.
The average gas price paid by WA large industrial customers (Perth) between 2002
and 2015 is shown in Figure 45.
Figure 45: WA real and nominal large industrial customer gas price history (Perth)
Figure 46 shows the breakdown of the different components making up the large
industrial customer gas price in WA from 2002 to 2015.
Figure 46: WA large industrial customer gas price components
Figure 47 shows the percentage breakdown of the different components making up
the large industrial customer gas price in WA from 2002 to 2015.
0.00
1.00
2.00
3.00
4.00
5.00
6.00
7.00
8.00
9.00
10.00
11.00
12.00
2002 2003 2004 2005 2006 2007 2008 2009 2010 2011 2012 2013 2014 2015
$/G
J
Large Industrial Customer (>1PJ pa) - Average Total Gas Price Delivered to NWQ
Real Gas Price ($2015) Excluding Carbon Nominal Gas Price Excluding Carbon
Real Gas Price ($2015) Including Carbon Nominal Gas Price Including Carbon
9.00
10.00
11.00
12.00
13.00
2012 2013 2014
0.00
2.00
4.00
6.00
8.00
10.00
12.00
14.00
16.00
18.00
2002 2003 2004 2005 2006 2007 2008 2009 2010 2011 2012 2013 2014 2015
$/G
J
Large Industrial Customer (>1PJ pa) - Average Total Gas Price Delivered to Perth
Real Gas Price ($2015) Excluding Carbon Nominal Gas Price Excluding Carbon
Real Gas Price ($2015) Including Carbon Nominal Gas Price Including Carbon
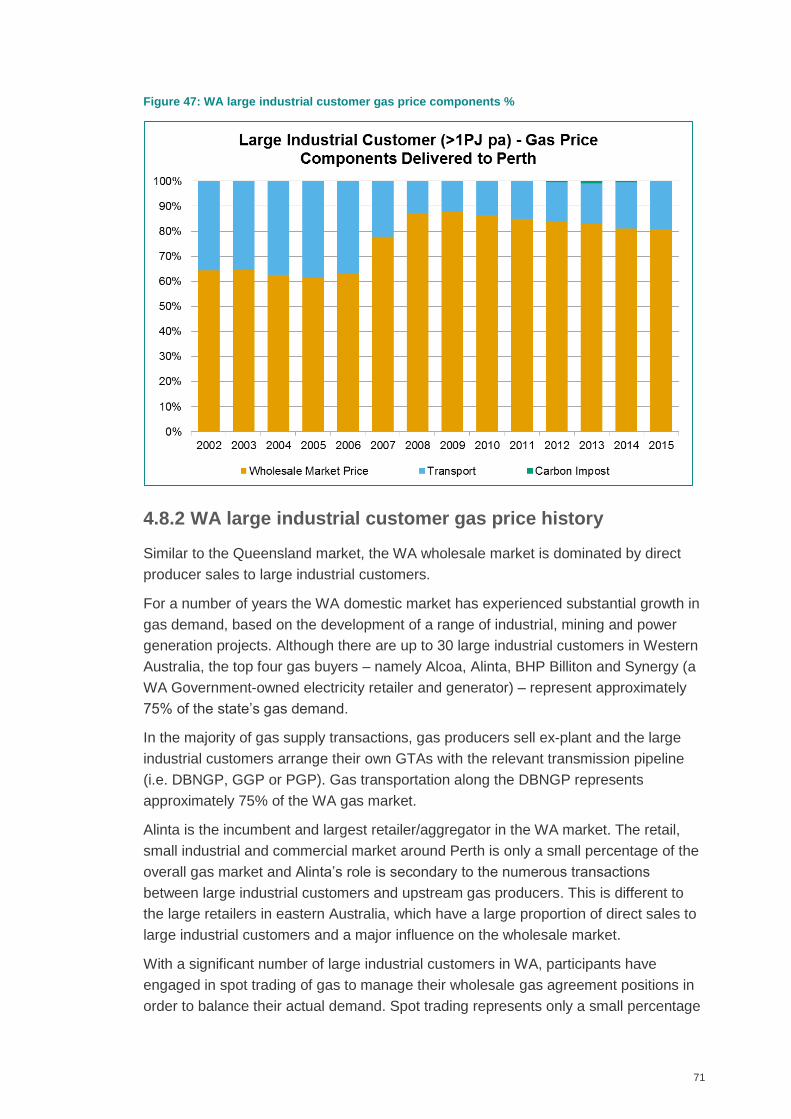
71
Figure 47: WA large industrial customer gas price components %
4.8.2 WA large industrial customer gas price history
Similar to the Queensland market, the WA wholesale market is dominated by direct
producer sales to large industrial customers.
For a number of years the WA domestic market has experienced substantial growth in
gas demand, based on the development of a range of industrial, mining and power
generation projects. Although there are up to 30 large industrial customers in Western
Australia, the top four gas buyers – namely Alcoa, Alinta, BHP Billiton and Synergy (a
WA Government-owned electricity retailer and generator) – represent approximately
75% of the state’s gas demand.
In the majority of gas supply transactions, gas producers sell ex-plant and the large
industrial customers arrange their own GTAs with the relevant transmission pipeline
(i.e. DBNGP, GGP or PGP). Gas transportation along the DBNGP represents
approximately 75% of the WA gas market.
Alinta is the incumbent and largest retailer/aggregator in the WA market. The retail,
small industrial and commercial market around Perth is only a small percentage of the
overall gas market and Alinta’s role is secondary to the numerous transactions
between large industrial customers and upstream gas producers. This is different to
the large retailers in eastern Australia, which have a large proportion of direct sales to
large industrial customers and a major influence on the wholesale market.
With a significant number of large industrial customers in WA, participants have
engaged in spot trading of gas to manage their wholesale gas agreement positions in
order to balance their actual demand. Spot trading represents only a small percentage
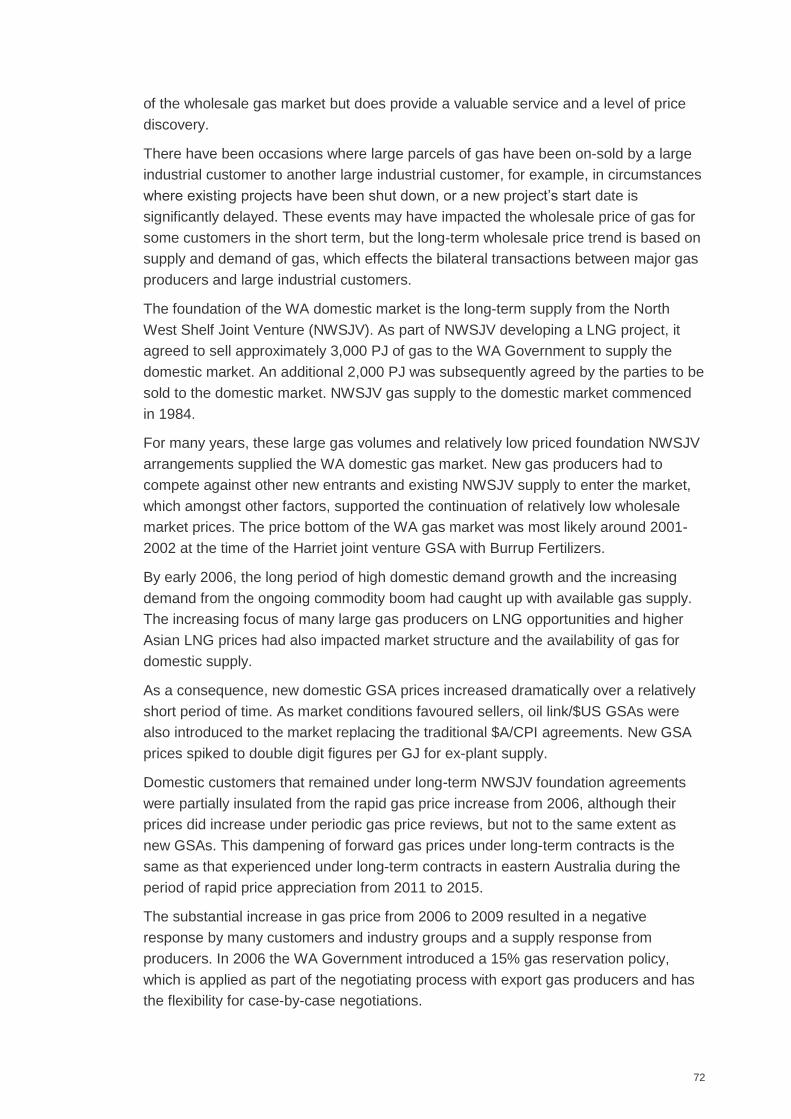
72
of the wholesale gas market but does provide a valuable service and a level of price
discovery.
There have been occasions where large parcels of gas have been on-sold by a large
industrial customer to another large industrial customer, for example, in circumstances
where existing projects have been shut down, or a new project’s start date is
significantly delayed. These events may have impacted the wholesale price of gas for
some customers in the short term, but the long-term wholesale price trend is based on
supply and demand of gas, which effects the bilateral transactions between major gas
producers and large industrial customers.
The foundation of the WA domestic market is the long-term supply from the North
West Shelf Joint Venture (NWSJV). As part of NWSJV developing a LNG project, it
agreed to sell approximately 3,000 PJ of gas to the WA Government to supply the
domestic market. An additional 2,000 PJ was subsequently agreed by the parties to be
sold to the domestic market. NWSJV gas supply to the domestic market commenced
in 1984.
For many years, these large gas volumes and relatively low priced foundation NWSJV
arrangements supplied the WA domestic gas market. New gas producers had to
compete against other new entrants and existing NWSJV supply to enter the market,
which amongst other factors, supported the continuation of relatively low wholesale
market prices. The price bottom of the WA gas market was most likely around 2001-
2002 at the time of the Harriet joint venture GSA with Burrup Fertilizers.
By early 2006, the long period of high domestic demand growth and the increasing
demand from the ongoing commodity boom had caught up with available gas supply.
The increasing focus of many large gas producers on LNG opportunities and higher
Asian LNG prices had also impacted market structure and the availability of gas for
domestic supply.
As a consequence, new domestic GSA prices increased dramatically over a relatively
short period of time. As market conditions favoured sellers, oil link/$US GSAs were
also introduced to the market replacing the traditional $A/CPI agreements. New GSA
prices spiked to double digit figures per GJ for ex-plant supply.
Domestic customers that remained under long-term NWSJV foundation agreements
were partially insulated from the rapid gas price increase from 2006, although their
prices did increase under periodic gas price reviews, but not to the same extent as
new GSAs. This dampening of forward gas prices under long-term contracts is the
same as that experienced under long-term contracts in eastern Australia during the
period of rapid price appreciation from 2011 to 2015.
The substantial increase in gas price from 2006 to 2009 resulted in a negative
response by many customers and industry groups and a supply response from
producers. In 2006 the WA Government introduced a 15% gas reservation policy,
which is applied as part of the negotiating process with export gas producers and has
the flexibility for case-by-case negotiations.
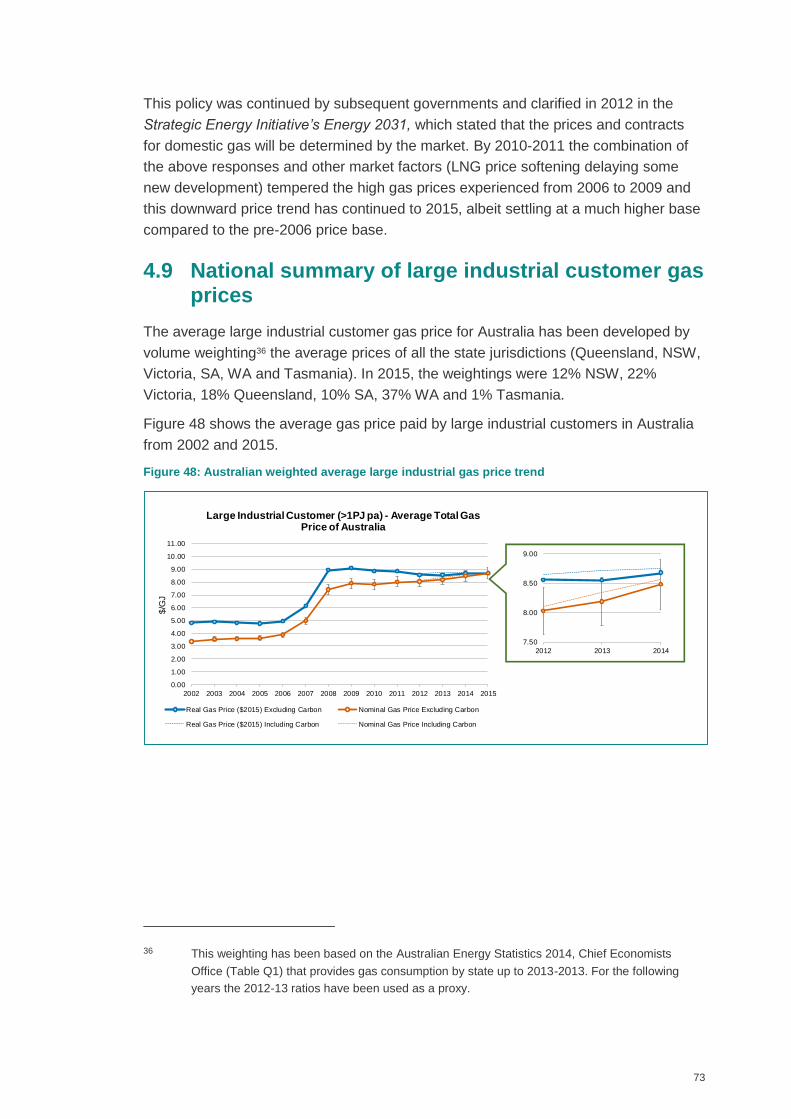
73
This policy was continued by subsequent governments and clarified in 2012 in the
Strategic Energy Initiative’s Energy 2031, which stated that the prices and contracts
for domestic gas will be determined by the market. By 2010-2011 the combination of
the above responses and other market factors (LNG price softening delaying some
new development) tempered the high gas prices experienced from 2006 to 2009 and
this downward price trend has continued to 2015, albeit settling at a much higher base
compared to the pre-2006 price base.
4.9 National summary of large industrial customer gas prices
The average large industrial customer gas price for Australia has been developed by
volume weighting36 the average prices of all the state jurisdictions (Queensland, NSW,
Victoria, SA, WA and Tasmania). In 2015, the weightings were 12% NSW, 22%
Victoria, 18% Queensland, 10% SA, 37% WA and 1% Tasmania.
Figure 48 shows the average gas price paid by large industrial customers in Australia
from 2002 and 2015.
Figure 48: Australian weighted average large industrial gas price trend
36 This weighting has been based on the Australian Energy Statistics 2014, Chief Economists
Office (Table Q1) that provides gas consumption by state up to 2013-2013. For the following
years the 2012-13 ratios have been used as a proxy.
0.00
1.00
2.00
3.00
4.00
5.00
6.00
7.00
8.00
9.00
10.00
11.00
2002 2003 2004 2005 2006 2007 2008 2009 2010 2011 2012 2013 2014 2015
$/G
J
Large Industrial Customer (>1PJ pa) - Average Total Gas Price of Australia
Real Gas Price ($2015) Excluding Carbon Nominal Gas Price Excluding Carbon
Real Gas Price ($2015) Including Carbon Nominal Gas Price Including Carbon
7.50
8.00
8.50
9.00
2012 2013 2014
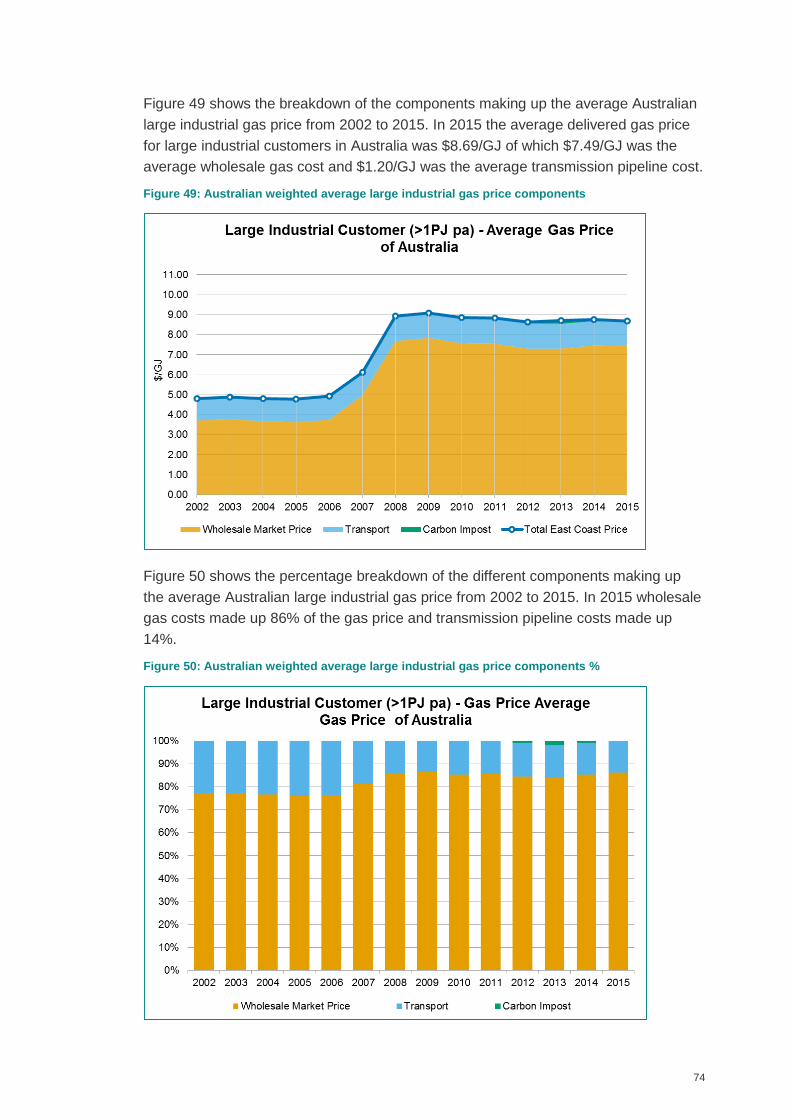
74
Figure 49 shows the breakdown of the components making up the average Australian
large industrial gas price from 2002 to 2015. In 2015 the average delivered gas price
for large industrial customers in Australia was $8.69/GJ of which $7.49/GJ was the
average wholesale gas cost and $1.20/GJ was the average transmission pipeline cost.
Figure 49: Australian weighted average large industrial gas price components
Figure 50 shows the percentage breakdown of the different components making up
the average Australian large industrial gas price from 2002 to 2015. In 2015 wholesale
gas costs made up 86% of the gas price and transmission pipeline costs made up
14%.
Figure 50: Australian weighted average large industrial gas price components %
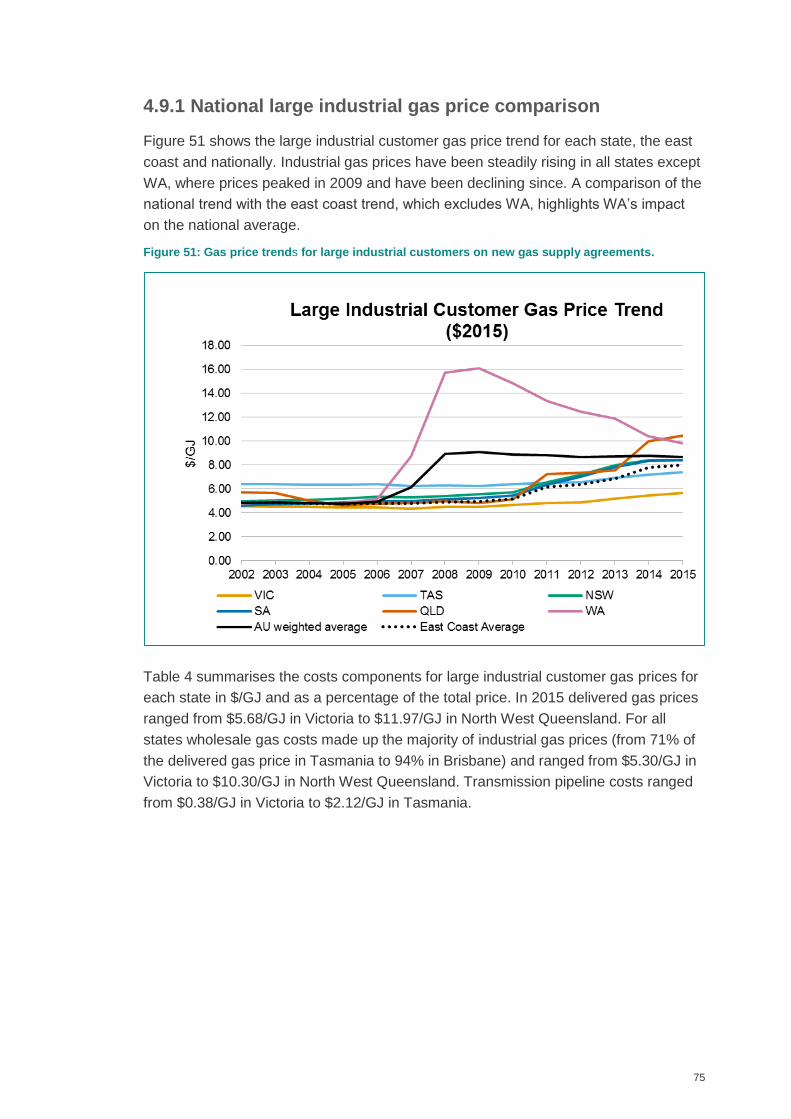
75
4.9.1 National large industrial gas price comparison
Figure 51 shows the large industrial customer gas price trend for each state, the east
coast and nationally. Industrial gas prices have been steadily rising in all states except
WA, where prices peaked in 2009 and have been declining since. A comparison of the
national trend with the east coast trend, which excludes WA, highlights WA’s impact
on the national average.
Figure 51: Gas price trends for large industrial customers on new gas supply agreements.
Table 4 summarises the costs components for large industrial customer gas prices for
each state in $/GJ and as a percentage of the total price. In 2015 delivered gas prices
ranged from $5.68/GJ in Victoria to $11.97/GJ in North West Queensland. For all
states wholesale gas costs made up the majority of industrial gas prices (from 71% of
the delivered gas price in Tasmania to 94% in Brisbane) and ranged from $5.30/GJ in
Victoria to $10.30/GJ in North West Queensland. Transmission pipeline costs ranged
from $0.38/GJ in Victoria to $2.12/GJ in Tasmania.
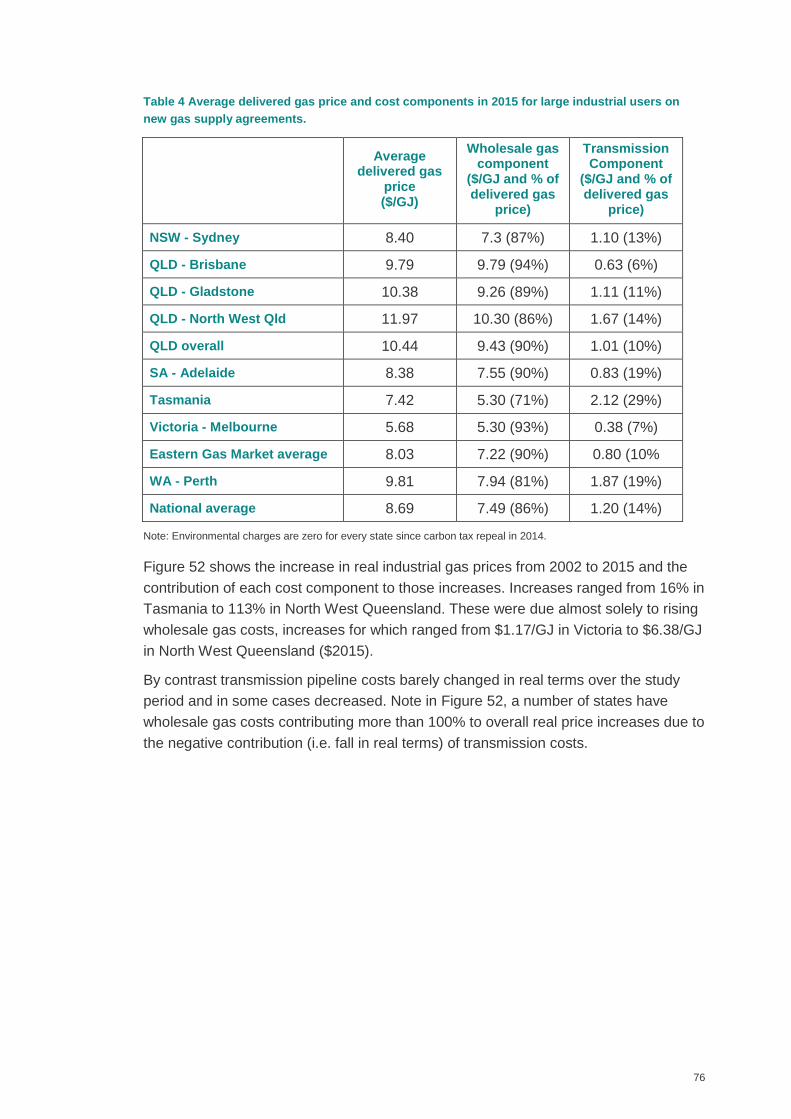
76
Table 4 Average delivered gas price and cost components in 2015 for large industrial users on
new gas supply agreements.
Average delivered gas
price ($/GJ)
Wholesale gas component
($/GJ and % of delivered gas
price)
Transmission Component
($/GJ and % of delivered gas
price)
NSW - Sydney 8.40 7.3 (87%) 1.10 (13%)
QLD - Brisbane 9.79 9.79 (94%) 0.63 (6%)
QLD - Gladstone 10.38 9.26 (89%) 1.11 (11%)
QLD - North West Qld 11.97 10.30 (86%) 1.67 (14%)
QLD overall 10.44 9.43 (90%) 1.01 (10%)
SA - Adelaide 8.38 7.55 (90%) 0.83 (19%)
Tasmania 7.42 5.30 (71%) 2.12 (29%)
Victoria - Melbourne 5.68 5.30 (93%) 0.38 (7%)
Eastern Gas Market average 8.03 7.22 (90%) 0.80 (10%
WA - Perth 9.81 7.94 (81%) 1.87 (19%)
National average 8.69 7.49 (86%) 1.20 (14%)
Note: Environmental charges are zero for every state since carbon tax repeal in 2014.
Figure 52 shows the increase in real industrial gas prices from 2002 to 2015 and the
contribution of each cost component to those increases. Increases ranged from 16% in
Tasmania to 113% in North West Queensland. These were due almost solely to rising
wholesale gas costs, increases for which ranged from $1.17/GJ in Victoria to $6.38/GJ
in North West Queensland ($2015).
By contrast transmission pipeline costs barely changed in real terms over the study
period and in some cases decreased. Note in Figure 52, a number of states have
wholesale gas costs contributing more than 100% to overall real price increases due to
the negative contribution (i.e. fall in real terms) of transmission costs.
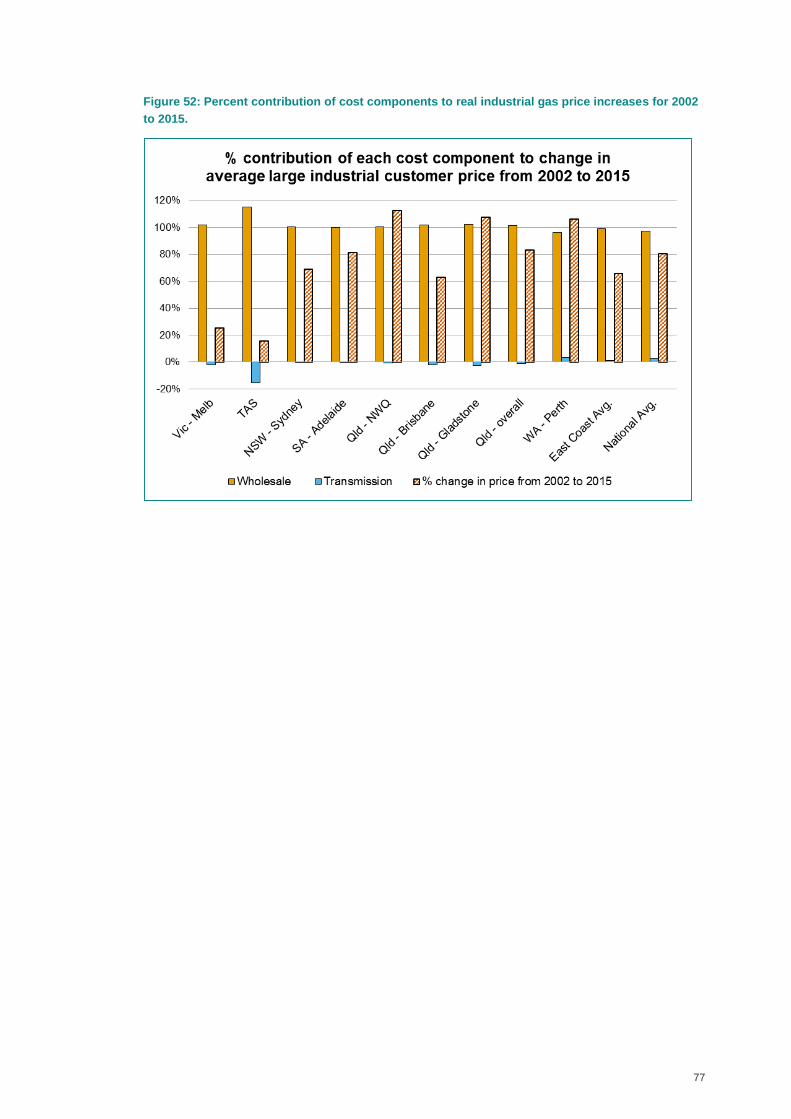
77
Figure 52: Percent contribution of cost components to real industrial gas price increases for 2002
to 2015.
78
5 Key drivers of future industrial gas prices
The key issue in nearly all the jurisdictional markets that will impact future wholesale
gas prices is the supply and demand balance, including the ability to transport (haul)
gas without undue transmission constraints. The simple economic models of supply
and demand balances and clearing prices are always at play in the gas market.
Scarcity of supply has seen gas prices rise, which in turn has seen demand reduced
and new supply enter the various jurisdictional markets. Price increases may seem to
be a windfall for those sellers with market power but it can be seen from this report
that price increases are an essential component in the development of new supply.
Eastern Australia’s wholesale gas market is a thin transactional market (transactions
are intermittent) based largely on bilateral contracting and the prices individual
industrial users pay may vary more than would be expected of a more mature,
exchange style market where prices are cleared daily. As a result, the market has poor
price transparency and relatively high transactional costs. More efficiency in the
market would probably see more homogenised prices across large industrial users
and a lot more volume trading between participants that may mitigate pricing, but
probably would still not impact the underlying supply and demand balances at the
macro level.
Other market mechanisms are now being used to try and compensate for these
structural deficiencies and to test market pricing more frequently. The main
mechanisms are shorter-term GSAs of three to five years and regular contractual
market price reviews that can either negotiate and arbitrate a new price or, if a new
price cannot be agreed, end a GSA.
Both the eastern Australian and Western Australian gas markets are linked to liquefied
natural gas (LNG) plant gas demand and this has driven domestic gas pricing peaks to
LNG netback37 levels. However, as observed in Western Australia, once supply
exceeds demand, prices start to almost immediately moderate toward cost of supply
pricing (see Figure 53). This occurs as long as there is reasonable competition and no
substantial transmission constraints, or a desire by a producer or retailer to dispose of
their excess gas.
In the case of WA supply tightened as demand for LNG grew and then went into
oversupply, tempering gas prices as LNG projects were deferred, other market factors
started to bite (mining decline) and reservation policies were enacted.
The eastern Australian gas market may follow similar supply and demand dynamics as
seen in Western Australia as new LNG plant developments seem to have halted on
37 Under LNG netback gas pricing, the cost of gas at the wellhead is worked out by deducting
shipping, liquefaction and pipeline transportation costs from LNG export prices.
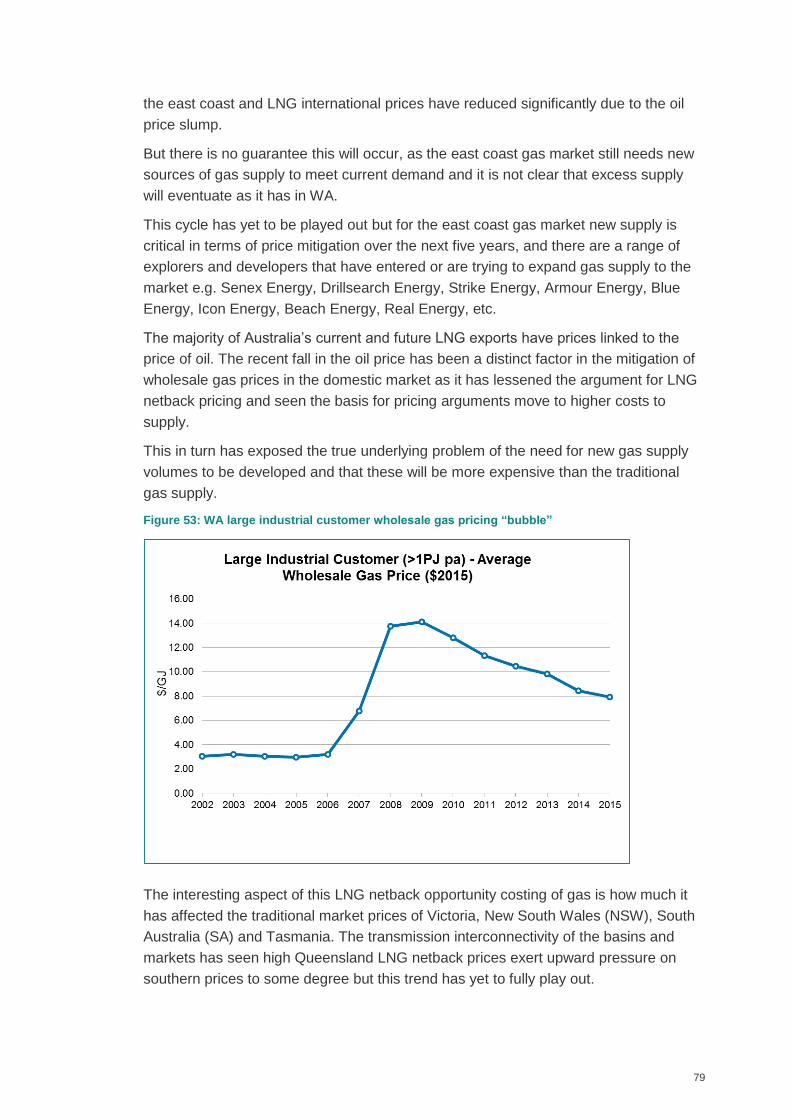
79
the east coast and LNG international prices have reduced significantly due to the oil
price slump.
But there is no guarantee this will occur, as the east coast gas market still needs new
sources of gas supply to meet current demand and it is not clear that excess supply
will eventuate as it has in WA.
This cycle has yet to be played out but for the east coast gas market new supply is
critical in terms of price mitigation over the next five years, and there are a range of
explorers and developers that have entered or are trying to expand gas supply to the
market e.g. Senex Energy, Drillsearch Energy, Strike Energy, Armour Energy, Blue
Energy, Icon Energy, Beach Energy, Real Energy, etc.
The majority of Australia’s current and future LNG exports have prices linked to the
price of oil. The recent fall in the oil price has been a distinct factor in the mitigation of
wholesale gas prices in the domestic market as it has lessened the argument for LNG
netback pricing and seen the basis for pricing arguments move to higher costs to
supply.
This in turn has exposed the true underlying problem of the need for new gas supply
volumes to be developed and that these will be more expensive than the traditional
gas supply.
Figure 53: WA large industrial customer wholesale gas pricing “bubble”
The interesting aspect of this LNG netback opportunity costing of gas is how much it
has affected the traditional market prices of Victoria, New South Wales (NSW), South
Australia (SA) and Tasmania. The transmission interconnectivity of the basins and
markets has seen high Queensland LNG netback prices exert upward pressure on
southern prices to some degree but this trend has yet to fully play out.
80
The prices seen in the south-eastern Australian gas markets have lagged those in
Queensland and prices have been mitigated by distances and underlying contractual
positions of retailers and large industrial customers and greater competition for
customers.
The prices into the Sydney hub seem to be the clearing prices for this current dynamic
in the southern markets largely because NSW does not have any major supplies of
indigenous gas, and is reliant on gas from Moomba in South Australia and Victorian
gas. Victoria is best served in terms of price mitigation as the available supply is very
close to the market but it is also starting to experience rising prices as Sydney sets the
clearing prices for Bass Strait gas sales.
The key factor driving gas prices over the next five years will most likely be the cost of
new gas supplies as this becomes the basis for new wholesale gas market clearing
prices. The pricing bubble effect will continue until demand is satisfied (this may be
achieved through reduced demand) and new supply starts to seek out demand. The
outlier is if a sustained increase in oil prices sparks new investment in Australia’s LNG
capacity, resulting in a further, major increase in demand.
The cost of new gas is anticipated to be substantially higher than prices prior to the
LNG netback impacts (even adjusted for CPI effects). This is because new gas
supplies are likely to be drawn from unconventional gas sources such as CSG and
shale gas, which both have distinctly different cost structures to conventional gas from
large reservoirs. The main differences relate to the greater number of wells that need
to be drilled, how often they need to worked over and/or replaced, and the fact that
they deplete far faster than conventional reservoirs. This results in a higher degree of
stay in business capital.
81
Residential Gas Price Trends
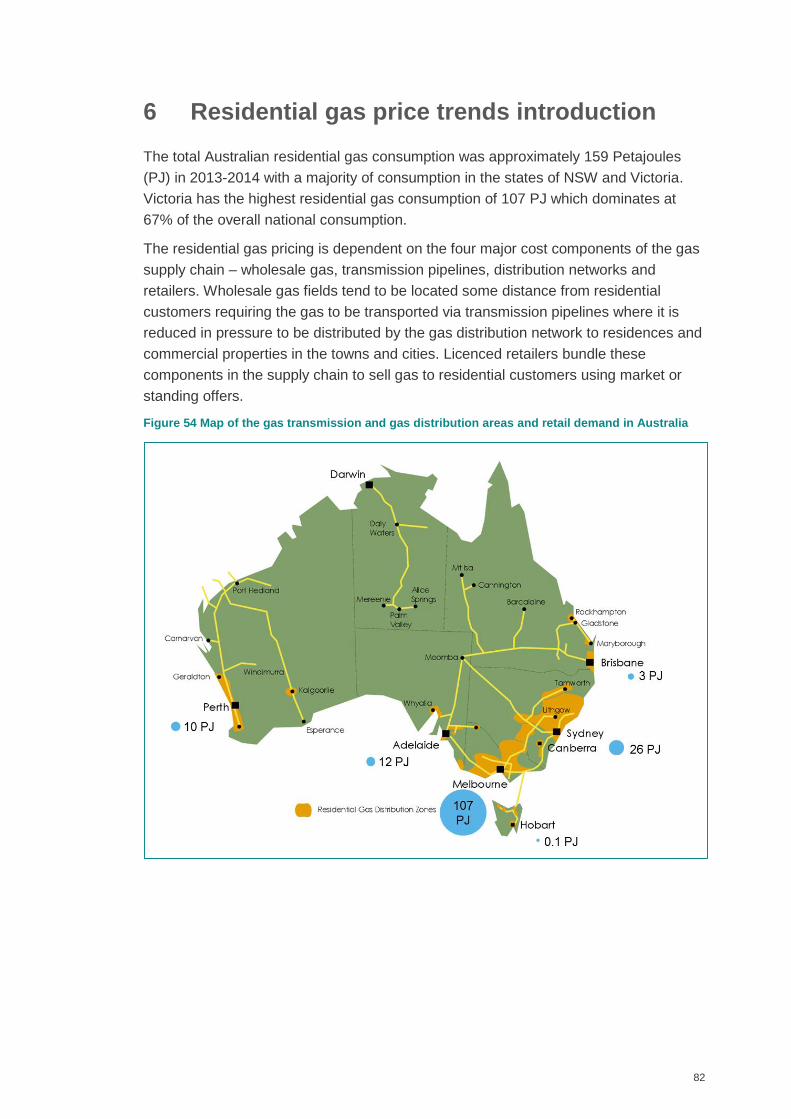
82
6 Residential gas price trends introduction
The total Australian residential gas consumption was approximately 159 Petajoules
(PJ) in 2013-2014 with a majority of consumption in the states of NSW and Victoria.
Victoria has the highest residential gas consumption of 107 PJ which dominates at
67% of the overall national consumption.
The residential gas pricing is dependent on the four major cost components of the gas
supply chain – wholesale gas, transmission pipelines, distribution networks and
retailers. Wholesale gas fields tend to be located some distance from residential
customers requiring the gas to be transported via transmission pipelines where it is
reduced in pressure to be distributed by the gas distribution network to residences and
commercial properties in the towns and cities. Licenced retailers bundle these
components in the supply chain to sell gas to residential customers using market or
standing offers.
Figure 54 Map of the gas transmission and gas distribution areas and retail demand in Australia
83
7 Key factors influencing residential gas
prices
The residential gas prices are broken into the following components:
Retail costs - the direct costs and margins for retailers to supply customers
Wholesale gas costs - the wholesale cost of gas supplied from a gas field
Transmission pipeline costs - charges to transport of gas from gas fields to the
distribution network
Distribution network costs – charges to supply gas to homes and businesses
through a distribution network.
Environmental Policy costs - this covers the Clean Energy Act (carbon pricing –
now withdrawn) and any energy efficiency schemes. The only energy efficient
scheme that has direct impact on gas pricing is the VEET scheme.
There are a number of overriding factors that have impacted residential gas
consumption and costs to consumers which are markedly different to factors which
impacted industrial gas prices. Some of these factors are unique to the gas industry
and some are similar trends observed in the residential electricity sector.
The key drivers which impacted residential gas markets in Australia included:
Distribution charges and recovery of long run marginal costs
Declining average household gas consumption
Wholesale gas price escalation
Retailer costs
Pricing and tariff structures
Carbon pricing
These key drivers are discussed below in Section 7.2.
7.1 Retail price regulation
Only two states currently retain regulation of residential retail gas prices in some form.
NSW has both standing offers, where gas prices are regulated by that state’s
Independent Pricing and Regulatory Tribunal (IPART), and unregulated market offers.
Standing offers are the default for customers who have not moved to a market offer or
84
are on a network where there is no retail competition. According to IPART, 21% of
NSW customers are on standing offers38.
In WA the WA Government regulates gas prices to small users and, under the Energy
Coordination (Gas Tariffs) Regulations 2000, sets gas price caps each year. The price
caps vary in the different areas, for example in the 2015-16 caps only the
Mid-West/South-West (MWSW) area had a two tier tariff.39 All retailers must offer a
standard contract at these rates and they have the option to offer rates (discounts)
below the regulated price caps. Retailers may charge additional fees (for example
market fees) other than the tariff caps and these are not regulated by the WA
Government.40
7.2 Key drivers
7.2.1 Distribution charges
Distribution charges represent the largest component of the typical residential gas bill
in most states (the national average is 42%). The main driver of distribution charges is
the cost of installing and maintaining the network of pipes and connections.
Distribution networks seek to recover these costs through the use of two part tariffs
with a variable component, which charges per MJ of gas consumed, and a fixed
component. These tariffs are charged by distribution networks to retailers, who pass
them through to residential customers and the structure of distribution charges usually
determines a retailer’s pricing structure.
Distribution networks rely on economies of scale and volume throughput to minimise
prices and make gas use attractive. This is a function of the number of customers
connected to a network and the consumption of each customer. Economies of scale
are a function of:
Penetration rates – the percentage of customers that are eligible to connect to a
gas network that have connected, and
Density of connections - in terms of the number of customers connected per length
of network – often this is affected by things like size of house blocks and number of
units with gas connected - making construction costs more efficient.
38 Independent Pricing and Regulatory Tribunal, Fact Sheet – Change in Regulated Retail Gas
Prices from 1 July 2015, page 3
39 Department of Finance, 2015, Gas tariff caps, Perth, WA Department of Finance gas tariff caps
website .
40 Retail Energy Market Company, 2015, Fees and Revenue, Retail Energy Market Company fees
and revenue web page .
85
The higher the number of households connected to gas and the closer these
households are to each other, the lower the distribution charge to the consumer as
the cost is spread over a greater number of users.
Throughput volumes of gas are the main method of recovering the capital invested.
This is generally through variable charges (¢/MJ) and, to a lesser extent, using the
fixed charges. As a result, the higher the consumption of a household, the lower the
cost is per unit of gas consumed.
Figure 55 shows the impact of low and high-density throughput of energy per metre of
installed distribution network for Australia’s largest distribution networks. In essence,
the cost required to serve a customer is unlikely to be materially different between
distribution networks (regardless of jurisdiction), therefore those customers that have
much greater consumption of gas (i.e. Victoria) are paying much less per unit of gas
for the distribution network’s largely fixed costs. This represents the value of
economies of scale within a network.
Figure 55 also highlights the point of diminishing returns where increasing the number
of connections or gas use per connection would not provide a material decrease to the
cost to consumers.
For example, in Queensland the penetration rate of gas to households is 10% and
average household consumption is low at 11.4 GJ/a. As a result, the two Queensland
networks (Allgas and Australian Gas Networks) have high gas distribution charges (the
Qld average is 3.68 ¢/MJ) which is reflected in the gas price of consumers. Compare
this to Victoria which has a household gas connection penetration rate of 80% and
high average household consumption (51.4 GJ/a) resulting in relatively high
throughput of gas per metre of installed gas distribution network. In this case
distributors Multinet, Ausnet and Australian Gas Networks offer the most competitive
network charges (in the Victorian average is 0.57 ¢/MJ) out of all jurisdictions.
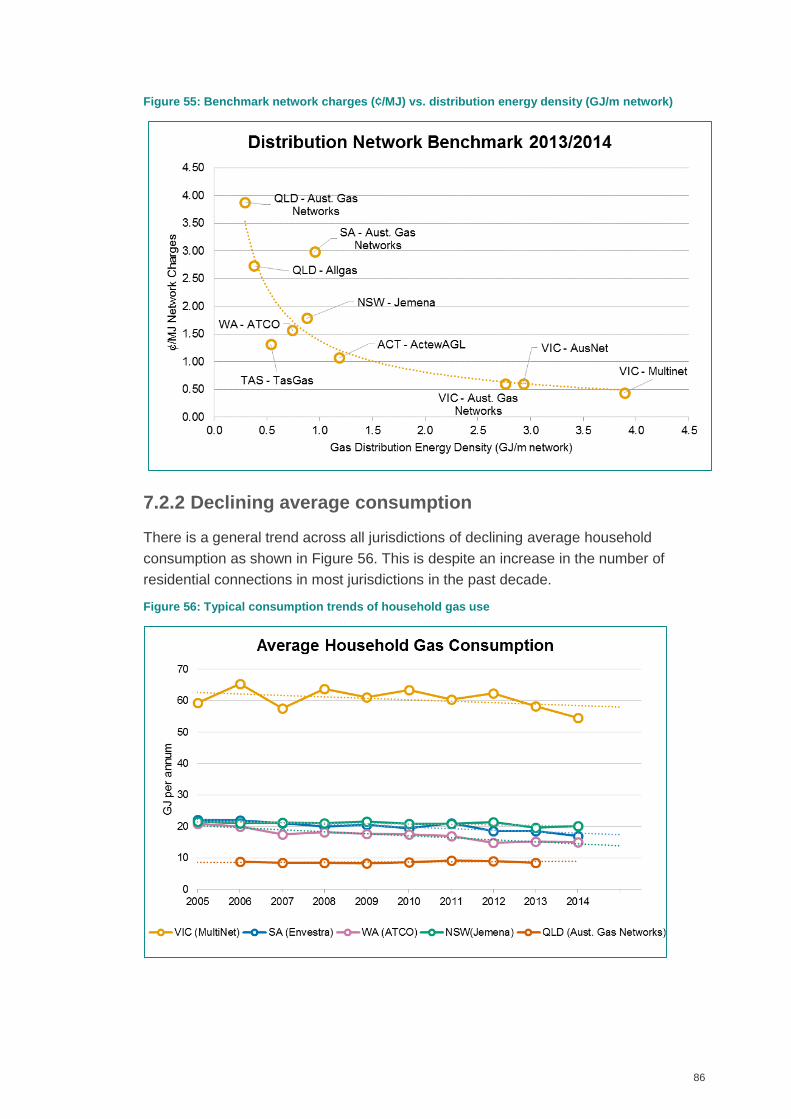
86
Figure 55: Benchmark network charges (¢/MJ) vs. distribution energy density (GJ/m network)
7.2.2 Declining average consumption
There is a general trend across all jurisdictions of declining average household
consumption as shown in Figure 56. This is despite an increase in the number of
residential connections in most jurisdictions in the past decade.
Figure 56: Typical consumption trends of household gas use
87
Decreases in average household consumption can be due to a combination of several
factors in each jurisdiction and one may contribute more than others. For example, in
Victoria the average consumption has been trending with milder weather and therefore
less demand for gas for heating. The decline in consumption could also be driven at
the margins by households switching to another fuel or simply conserving their gas
use to reduce energy bills.
Factors which have influenced average consumption include:
Gas appliance efficiency – and to some degree technology developments with
competing electric appliances e.g. induction cooktops.
Household conservation – being more conservative with heating appliances to
save money.
Socio-demographic changes – reduced number of persons per household.
Fuel substitution – increasing penetration of competitively priced reverse cycle air
conditioning or the potential for wood use in Tasmania (and even around
Canberra).
More energy efficient building construction – better insulating properties of
construction materials, designing for “green” building ratings and reduced energy
reliance.
Federal or state government energy policies – for example the Small Scale
Renewable Energy Scheme (SRES), eligibility for solar hot water/heat pump
installations incentivising alternative water heating substitutes.
7.2.3 Wholesale gas price
In the residential sector wholesale gas prices typically account for about 10-15% of the
retail price of gas (12% is the national average). As a result, the wholesale gas price is
far less of a driver in the residential market than in the large industrial sector due to the
impacts of retail and network costs components in residential customers’ bills.
However, it is still an issue for prospective new entrants in retail gas markets to
consider and hence a factor in competitive gas supply to customers.
The viability of entry into retail gas markets depends on access to gas and at a
reasonably competitive price. Where an incumbent retailer has access to low
wholesale gas prices, it may compete on better terms than a new entrant that is
unable to secure access to low wholesale gas prices. Alternatively they may elect to
take a greater retail margin and use this margin to market more effectively for new
customers.
There are retailers with access to low priced gas under legacy gas contract
arrangements that can use this marginal advantage at times. Many are facing the end
of their gas contracts and need to renegotiate gas prices in an escalating market – so
this is partly a market timing issue.
88
It should be noted that, in the absence of information on each retailer’s gas portfolio,
for most states the wholesale cost identified for large industrial customers is assumed
to be the wholesale gas component of the residential price. This is discussed further in
section A.2.3.1 of the residential methodology.
7.2.4 Retail cost component and role of the retailer
Traditionally, retailers buy gas in wholesale markets and package it with transportation
services for sale to customers under a retail contract. The customer pays charges
based on the rates set out in the contract and is not exposed to the short term
movements in the wholesale market prices. Retailers use a range of portfolio and
hedging arrangements to manage risks of the price volatility in the wholesale market.
In some states, retailers also arrange connections with distributors and participate in
compulsory trading markets.
The retail cost component of a consumer’s residential bill covers a retailer’s operation
and marketing costs and their profit margin. A retailer’s profit margin depends on the
retailer’s ability to operate efficiently, the level of competition in the market and
whether there is a regulated ceiling on the tariffs consumers can be charged.
For example, in WA’s mid-west to south-west gas supply area the WA Government
sets a tariff cap for small use customers. If new entrants in that market are unable to
access wholesale gas at a price that enables them to sell gas below the retail tariff
cap, they would not be competitive and so would not seek to enter the market. Alinta is
the dominant retailer in WA with a legacy gas contract that enables it to price at or
below the tariff cap.
In Victoria the average retail cost component is relatively high indicating there may be
less than effective competition, as noted by the Victorian Essential Services
Commission for residential electricity (see Victorian discussion in Section 8.1). This is
despite the market having several retailers and high customer switching rates.
7.2.5 Pricing structures
The standard pricing approach for gas retailers is to offer a two-part tariff with a fixed
and variable component, which largely follows the tariff structure applied by gas
distribution businesses. This is the standard approach for utilities across Australia,
where the variable component is nominally set with reference to variable costs for the
business while the fixed price is to ensure revenue sufficiency for the business or
recovery of nominal fixed costs.
The majority of gas retailers apply declining block tariffs for gas consumption. This
means that a higher level of consumption will be charged at a lower price per MJ. In
contrast, the water industry tends to apply an inclining block tariff where higher usage
gets charged at a higher rate per kilolitre. The theory behind declining block tariffs is
that the network has a declining marginal cost to supply over some average usage
89
threshold and is therefore seeking to encourage higher consumption (in contrast to
inclining block tariffs that are designed to encourage restricting excess consumption).
This also has the impact of providing more competitive gas supply at the margin which
is an important pricing signal for customers considering switching between electricity
and gas consumption. An example is space heating where, if the consumer has a
reverse cycle air conditioner and gas heating, switching costs then relate to the
marginal cost of the fuel as there is no capital expenditure involved.
Victoria has an added complexity with its tariff structure with the use of seasonal-
based pricing. Given the significant fluctuation in gas consumption between winter
months and non-winter months in Victoria, the majority of Victorian retailers apply a
peak price for usage in winter months which lessens the competitiveness of gas at that
time with electricity (and notably some retailers have recently stopped this approach
after one of the distribution networks stopped applying peak charges).
Several retailers offer a dual fuel account which provides gas and electricity accounts
rolled into one and can allow the retailer to offer a better gas or electricity deal/price
due to increased returns per customer. If a customer is on a dual fuel account, the
impact of any subsequent fuel switching decision on the retailer is also lessened.
7.3 Environmental policies
The only two environmental policies that have had direct cost impost on gas tariffs for
the review period are the Commonwealth Government’s Carbon Pollution Reduction
Scheme, which put a price on carbon emissions, and the Victorian Energy Efficiency
Target (VEET).
The carbon price was the environmental policy that had the most significant impact on
residential gas prices throughout Australia forming approximately 5% of the tariff
during the periods 2012-2013 and 2013-2014. This was removed from retail gas prices
in July 2014.
The Victorian Government introduced the Victorian Energy Efficiency Target (VEET)
scheme commenced in 2009 and is legislated to continue in three-year phases until
2030. The scheme requires large energy retailers to surrender a specified number of
certificates each year and is designed to reduce the greenhouse gas emissions across
both the electricity and gas industry sectors. During the review period, the impact that
this scheme has had on residential gas prices was minimal (approximately 10% of the
carbon price impact).
No other jurisdiction operated an energy efficiency scheme that covered gas activities.
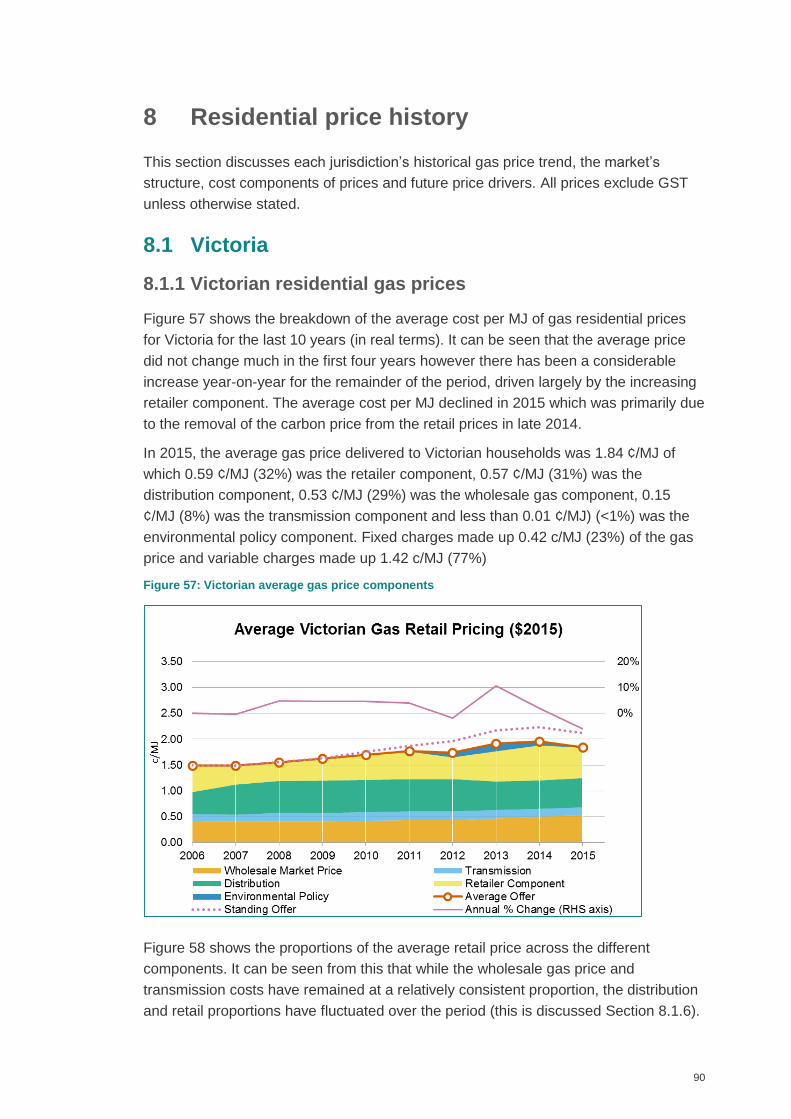
90
8 Residential price history
This section discusses each jurisdiction’s historical gas price trend, the market’s
structure, cost components of prices and future price drivers. All prices exclude GST
unless otherwise stated.
8.1 Victoria
8.1.1 Victorian residential gas prices
Figure 57 shows the breakdown of the average cost per MJ of gas residential prices
for Victoria for the last 10 years (in real terms). It can be seen that the average price
did not change much in the first four years however there has been a considerable
increase year-on-year for the remainder of the period, driven largely by the increasing
retailer component. The average cost per MJ declined in 2015 which was primarily due
to the removal of the carbon price from the retail prices in late 2014.
In 2015, the average gas price delivered to Victorian households was 1.84 ¢/MJ of
which 0.59 ¢/MJ (32%) was the retailer component, 0.57 ¢/MJ (31%) was the
distribution component, 0.53 ¢/MJ (29%) was the wholesale gas component, 0.15
¢/MJ (8%) was the transmission component and less than 0.01 ¢/MJ) (<1%) was the
environmental policy component. Fixed charges made up 0.42 c/MJ (23%) of the gas
price and variable charges made up 1.42 c/MJ (77%)
Figure 57: Victorian average gas price components
Figure 58 shows the proportions of the average retail price across the different
components. It can be seen from this that while the wholesale gas price and
transmission costs have remained at a relatively consistent proportion, the distribution
and retail proportions have fluctuated over the period (this is discussed Section 8.1.6).
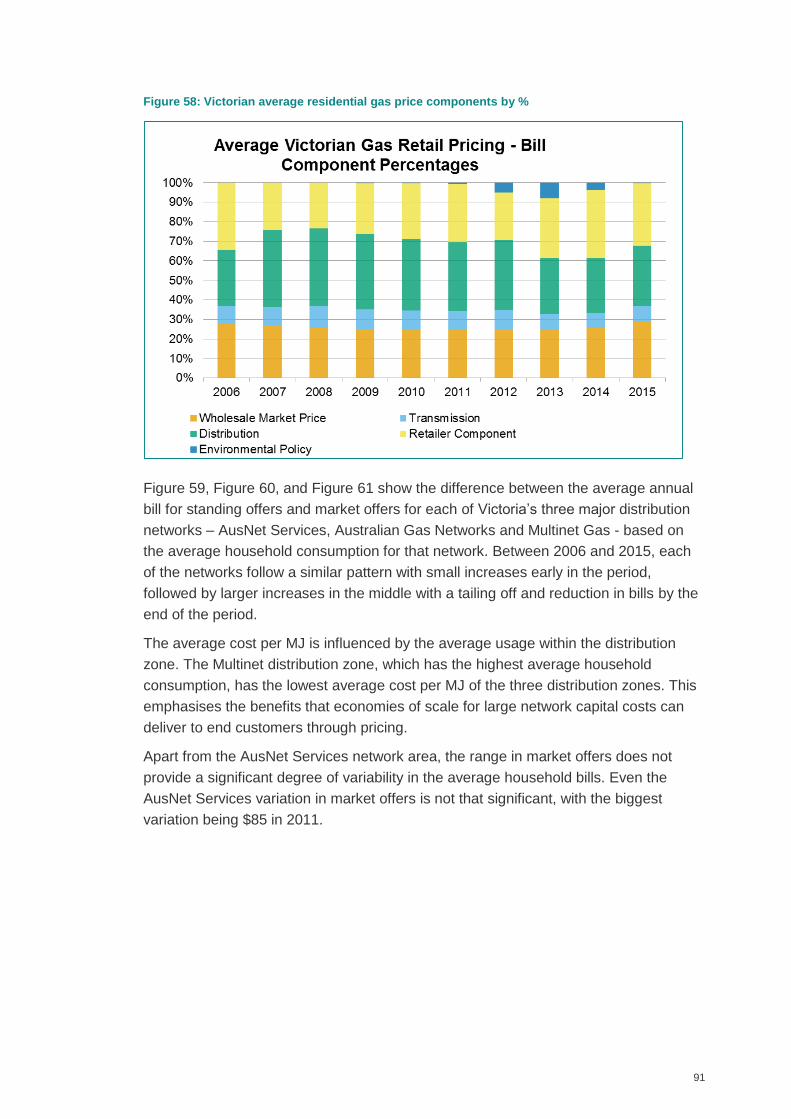
91
Figure 58: Victorian average residential gas price components by %
Figure 59, Figure 60, and Figure 61 show the difference between the average annual
bill for standing offers and market offers for each of Victoria’s three major distribution
networks – AusNet Services, Australian Gas Networks and Multinet Gas - based on
the average household consumption for that network. Between 2006 and 2015, each
of the networks follow a similar pattern with small increases early in the period,
followed by larger increases in the middle with a tailing off and reduction in bills by the
end of the period.
The average cost per MJ is influenced by the average usage within the distribution
zone. The Multinet distribution zone, which has the highest average household
consumption, has the lowest average cost per MJ of the three distribution zones. This
emphasises the benefits that economies of scale for large network capital costs can
deliver to end customers through pricing.
Apart from the AusNet Services network area, the range in market offers does not
provide a significant degree of variability in the average household bills. Even the
AusNet Services variation in market offers is not that significant, with the biggest
variation being $85 in 2011.
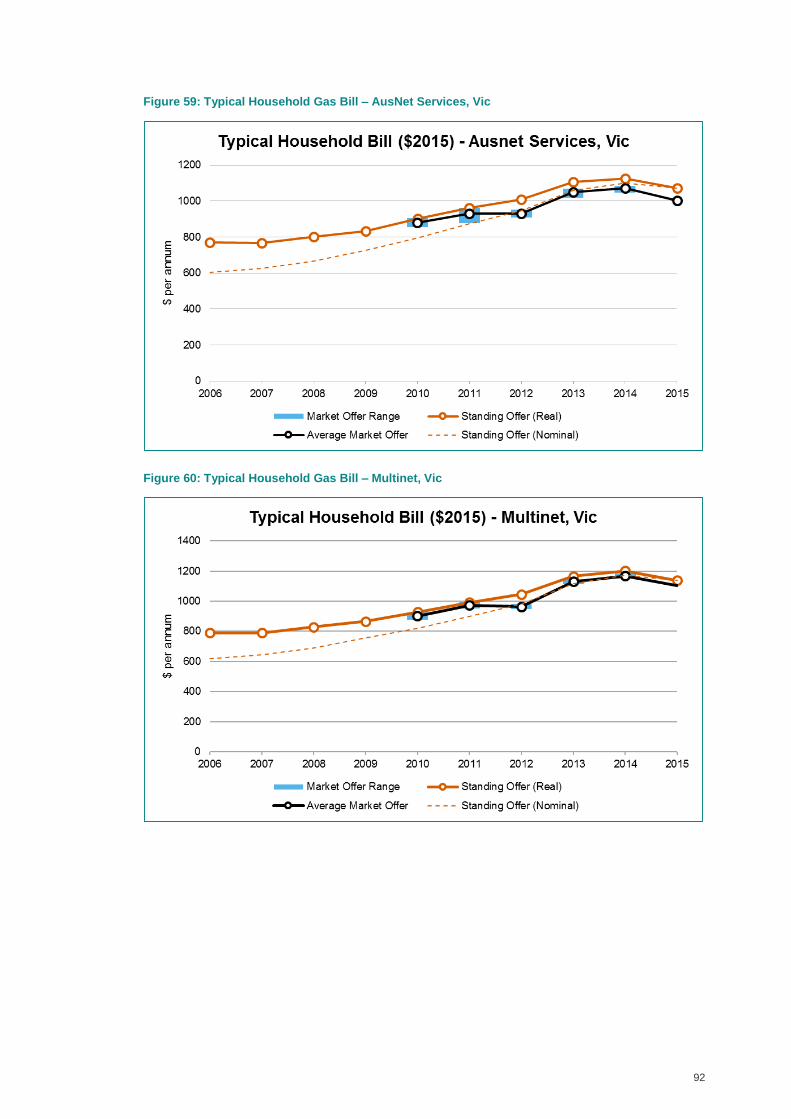
92
Figure 59: Typical Household Gas Bill – AusNet Services, Vic
Figure 60: Typical Household Gas Bill – Multinet, Vic
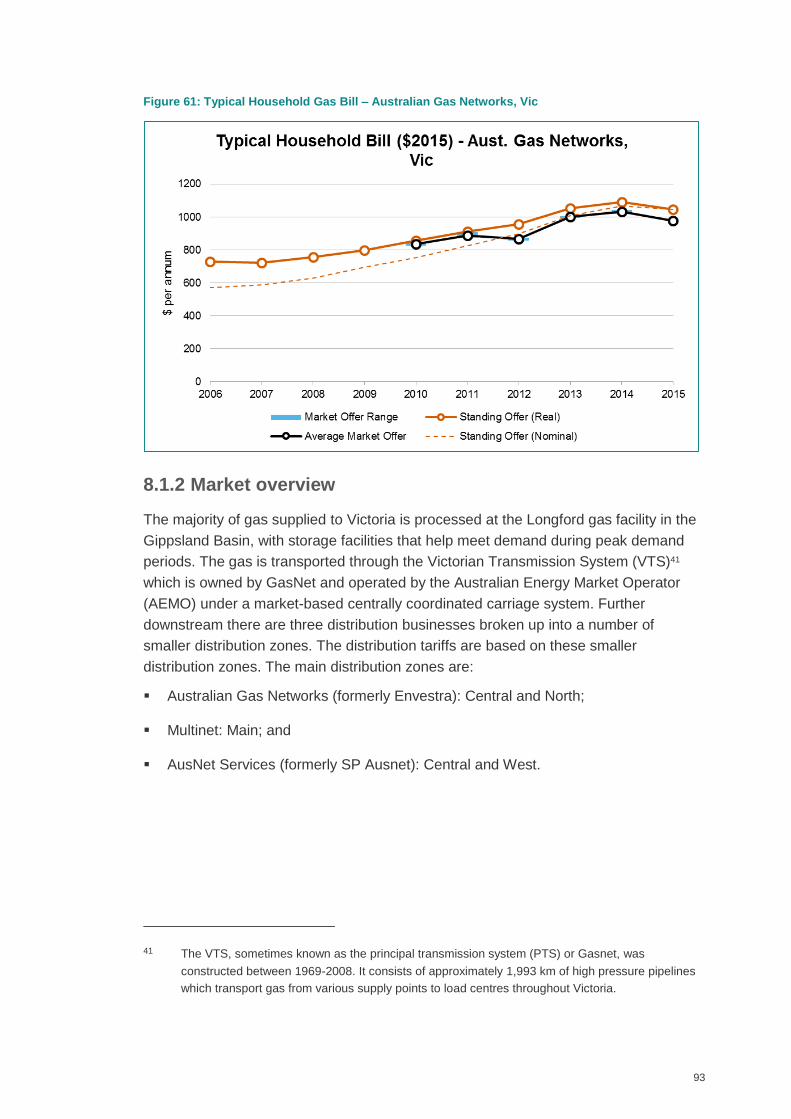
93
Figure 61: Typical Household Gas Bill – Australian Gas Networks, Vic
8.1.2 Market overview
The majority of gas supplied to Victoria is processed at the Longford gas facility in the
Gippsland Basin, with storage facilities that help meet demand during peak demand
periods. The gas is transported through the Victorian Transmission System (VTS)41
which is owned by GasNet and operated by the Australian Energy Market Operator
(AEMO) under a market-based centrally coordinated carriage system. Further
downstream there are three distribution businesses broken up into a number of
smaller distribution zones. The distribution tariffs are based on these smaller
distribution zones. The main distribution zones are:
Australian Gas Networks (formerly Envestra): Central and North;
Multinet: Main; and
AusNet Services (formerly SP Ausnet): Central and West.
41 The VTS, sometimes known as the principal transmission system (PTS) or Gasnet, was
constructed between 1969-2008. It consists of approximately 1,993 km of high pressure pipelines
which transport gas from various supply points to load centres throughout Victoria.
94
There are a number of smaller distribution zones that have their own distinct charges.
However, these zones were disregarded from this analysis due to their small size (the
largest of which has approximately 8,500 customers).42
End customers are then charged based on retail franchise zones. These zones were
established when the retail market was opened to contestability and they do not
exactly line up with the physical distribution zones. The following retail zones align to
the main distribution zones outlined above. Some of the naming conventions reflect
the ownership structure at the time of deregulation and Envestra zones are part of the
Australia Gas Networks distribution network.
Envestra Central 1 (also referred to as Origin South-East);
Envestra Central 2 (also referred to as TRU East);
Envestra North (also referred to as Origin North);
Multinet Main 1 (also referred to as Origin Metro);
Multinet Main 2 (also referred to as AGL South);
AusNet Services Central 1 (also referred to as TRU Central);
AusNet Services Central 2 (also referred to as AGL North); and
AusNet Services West (also referred to as TRU West).
Figure 62 shows the different zones. It should be noted that some retailers that have
entered the market in recent years have begun charging on the distribution zones
rather than the retail franchise zones.
42 These zones include Australian Gas Networks Murray Valley, Australian Gas Networks Bairnsdale,
Multinet Yarra Valley, Multinet South Gippsland, AusNet Services Adjoining Central and AusNet
Services Adjoining West.
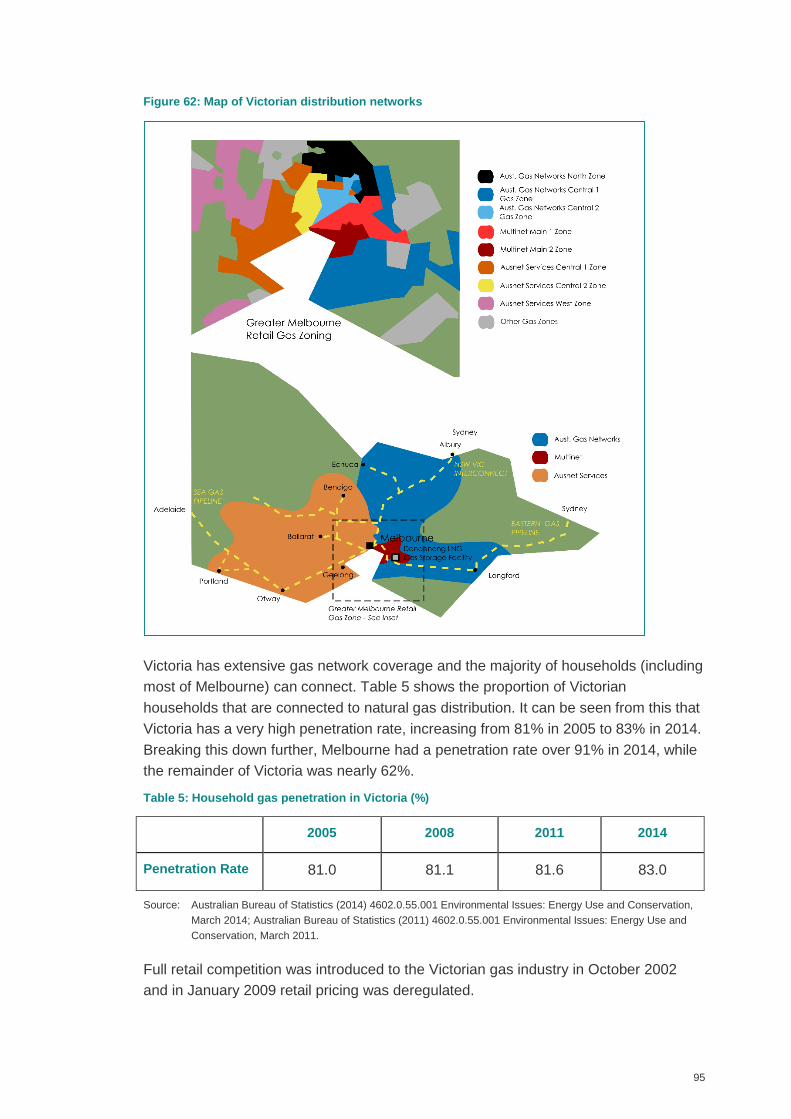
95
Figure 62: Map of Victorian distribution networks
Victoria has extensive gas network coverage and the majority of households (including
most of Melbourne) can connect. Table 5 shows the proportion of Victorian
households that are connected to natural gas distribution. It can be seen from this that
Victoria has a very high penetration rate, increasing from 81% in 2005 to 83% in 2014.
Breaking this down further, Melbourne had a penetration rate over 91% in 2014, while
the remainder of Victoria was nearly 62%.
Table 5: Household gas penetration in Victoria (%)
2005 2008 2011 2014
Penetration Rate 81.0 81.1 81.6 83.0
Source: Australian Bureau of Statistics (2014) 4602.0.55.001 Environmental Issues: Energy Use and Conservation,
March 2014; Australian Bureau of Statistics (2011) 4602.0.55.001 Environmental Issues: Energy Use and
Conservation, March 2011.
Full retail competition was introduced to the Victorian gas industry in October 2002
and in January 2009 retail pricing was deregulated.
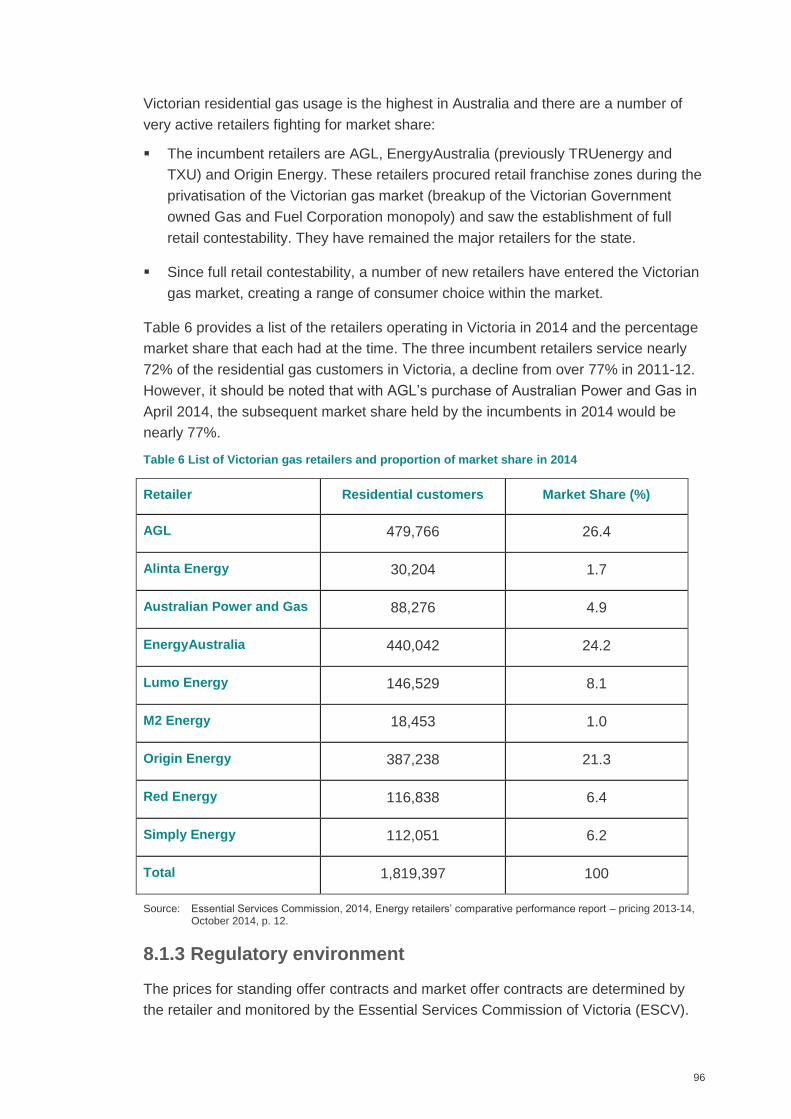
96
Victorian residential gas usage is the highest in Australia and there are a number of
very active retailers fighting for market share:
The incumbent retailers are AGL, EnergyAustralia (previously TRUenergy and
TXU) and Origin Energy. These retailers procured retail franchise zones during the
privatisation of the Victorian gas market (breakup of the Victorian Government
owned Gas and Fuel Corporation monopoly) and saw the establishment of full
retail contestability. They have remained the major retailers for the state.
Since full retail contestability, a number of new retailers have entered the Victorian
gas market, creating a range of consumer choice within the market.
Table 6 provides a list of the retailers operating in Victoria in 2014 and the percentage
market share that each had at the time. The three incumbent retailers service nearly
72% of the residential gas customers in Victoria, a decline from over 77% in 2011-12.
However, it should be noted that with AGL’s purchase of Australian Power and Gas in
April 2014, the subsequent market share held by the incumbents in 2014 would be
nearly 77%.
Table 6 List of Victorian gas retailers and proportion of market share in 2014
Retailer Residential customers Market Share (%)
AGL 479,766 26.4
Alinta Energy 30,204 1.7
Australian Power and Gas 88,276 4.9
EnergyAustralia 440,042 24.2
Lumo Energy 146,529 8.1
M2 Energy 18,453 1.0
Origin Energy 387,238 21.3
Red Energy 116,838 6.4
Simply Energy 112,051 6.2
Total 1,819,397 100
Source: Essential Services Commission, 2014, Energy retailers’ comparative performance report – pricing 2013-14, October 2014, p. 12.
8.1.3 Regulatory environment
The prices for standing offer contracts and market offer contracts are determined by
the retailer and monitored by the Essential Services Commission of Victoria (ESCV).
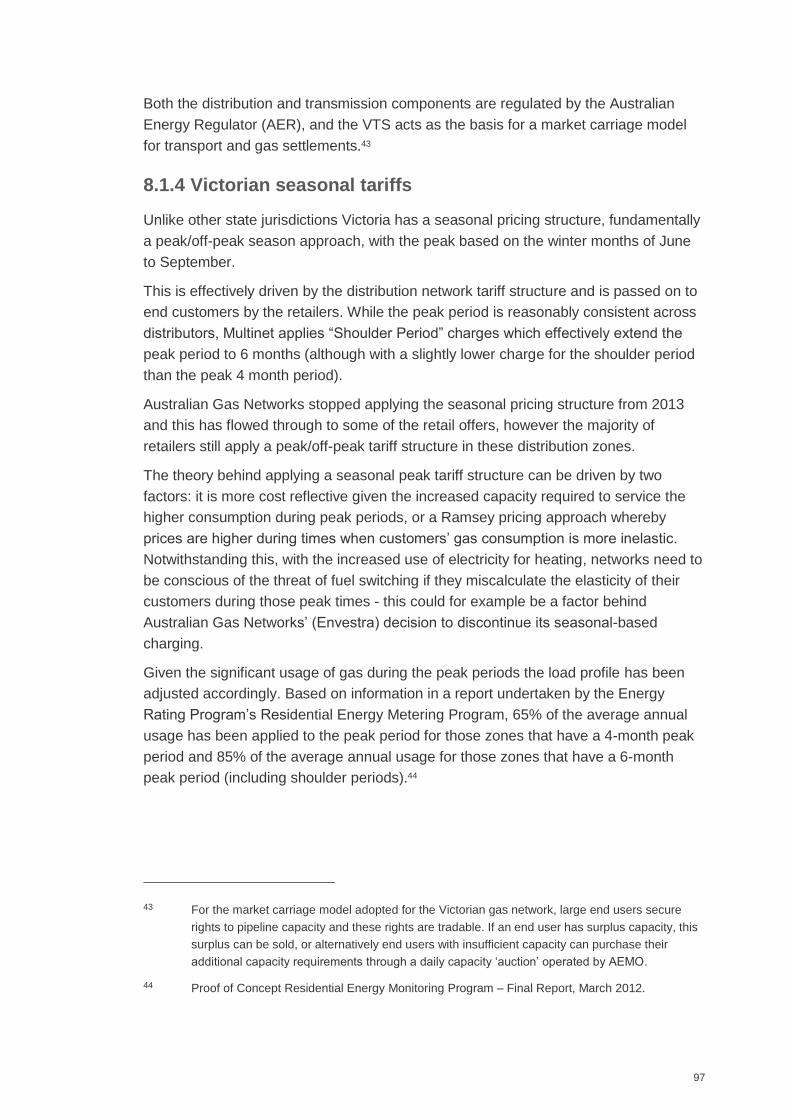
97
Both the distribution and transmission components are regulated by the Australian
Energy Regulator (AER), and the VTS acts as the basis for a market carriage model
for transport and gas settlements.43
8.1.4 Victorian seasonal tariffs
Unlike other state jurisdictions Victoria has a seasonal pricing structure, fundamentally
a peak/off-peak season approach, with the peak based on the winter months of June
to September.
This is effectively driven by the distribution network tariff structure and is passed on to
end customers by the retailers. While the peak period is reasonably consistent across
distributors, Multinet applies “Shoulder Period” charges which effectively extend the
peak period to 6 months (although with a slightly lower charge for the shoulder period
than the peak 4 month period).
Australian Gas Networks stopped applying the seasonal pricing structure from 2013
and this has flowed through to some of the retail offers, however the majority of
retailers still apply a peak/off-peak tariff structure in these distribution zones.
The theory behind applying a seasonal peak tariff structure can be driven by two
factors: it is more cost reflective given the increased capacity required to service the
higher consumption during peak periods, or a Ramsey pricing approach whereby
prices are higher during times when customers’ gas consumption is more inelastic.
Notwithstanding this, with the increased use of electricity for heating, networks need to
be conscious of the threat of fuel switching if they miscalculate the elasticity of their
customers during those peak times - this could for example be a factor behind
Australian Gas Networks’ (Envestra) decision to discontinue its seasonal-based
charging.
Given the significant usage of gas during the peak periods the load profile has been
adjusted accordingly. Based on information in a report undertaken by the Energy
Rating Program’s Residential Energy Metering Program, 65% of the average annual
usage has been applied to the peak period for those zones that have a 4-month peak
period and 85% of the average annual usage for those zones that have a 6-month
peak period (including shoulder periods).44
43 For the market carriage model adopted for the Victorian gas network, large end users secure
rights to pipeline capacity and these rights are tradable. If an end user has surplus capacity, this
surplus can be sold, or alternatively end users with insufficient capacity can purchase their
additional capacity requirements through a daily capacity ‘auction’ operated by AEMO.
44 Proof of Concept Residential Energy Monitoring Program – Final Report, March 2012.
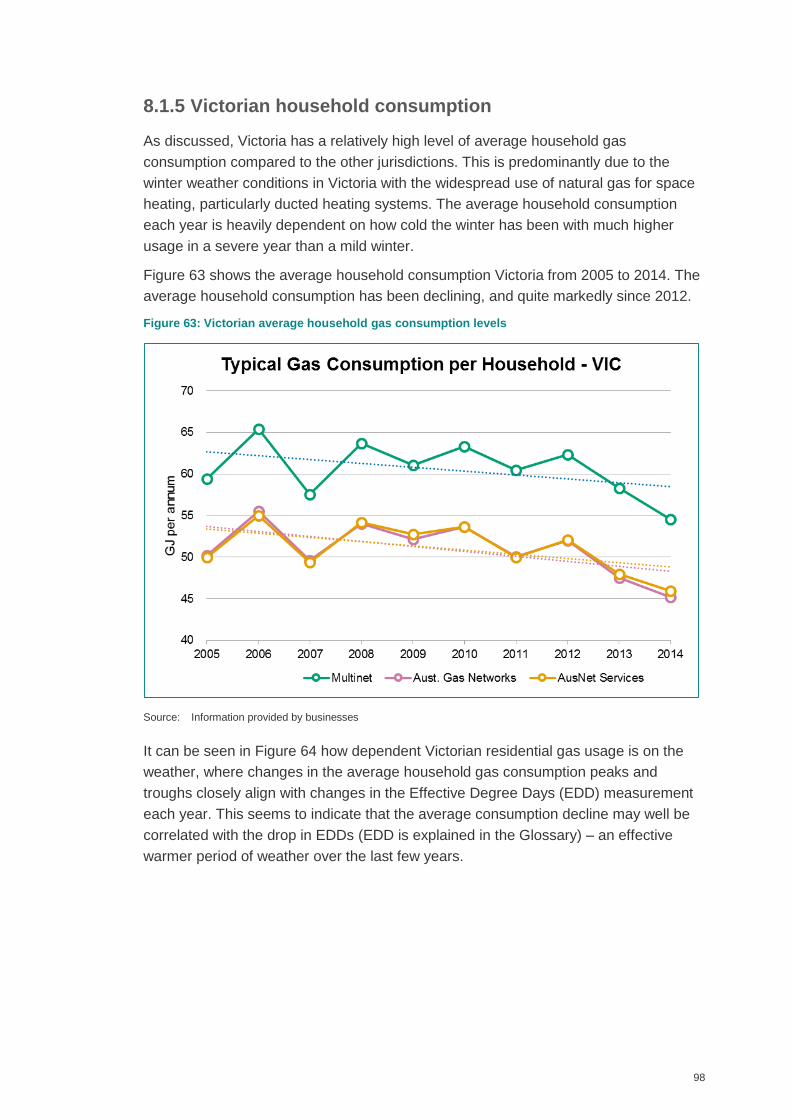
98
8.1.5 Victorian household consumption
As discussed, Victoria has a relatively high level of average household gas
consumption compared to the other jurisdictions. This is predominantly due to the
winter weather conditions in Victoria with the widespread use of natural gas for space
heating, particularly ducted heating systems. The average household consumption
each year is heavily dependent on how cold the winter has been with much higher
usage in a severe year than a mild winter.
Figure 63 shows the average household consumption Victoria from 2005 to 2014. The
average household consumption has been declining, and quite markedly since 2012.
Figure 63: Victorian average household gas consumption levels
Source: Information provided by businesses
It can be seen in Figure 64 how dependent Victorian residential gas usage is on the
weather, where changes in the average household gas consumption peaks and
troughs closely align with changes in the Effective Degree Days (EDD) measurement
each year. This seems to indicate that the average consumption decline may well be
correlated with the drop in EDDs (EDD is explained in the Glossary) – an effective
warmer period of weather over the last few years.
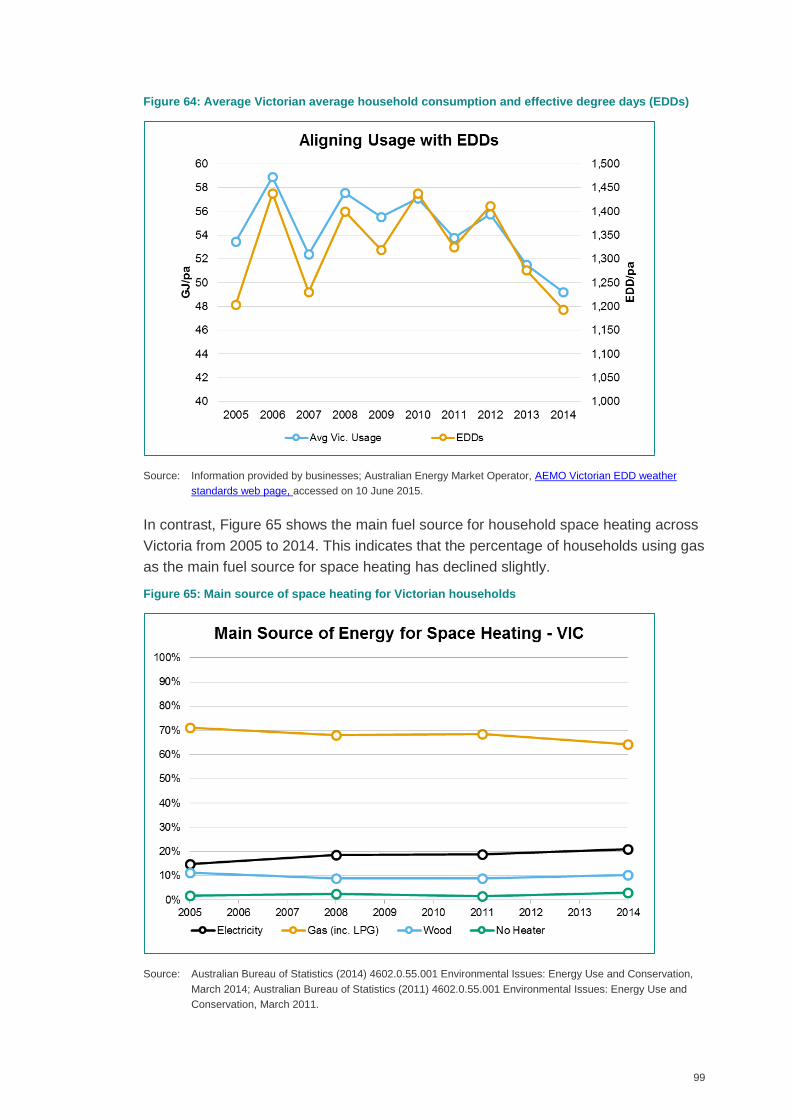
99
Figure 64: Average Victorian average household consumption and effective degree days (EDDs)
Source: Information provided by businesses; Australian Energy Market Operator, AEMO Victorian EDD weather
standards web page, accessed on 10 June 2015.
In contrast, Figure 65 shows the main fuel source for household space heating across
Victoria from 2005 to 2014. This indicates that the percentage of households using gas
as the main fuel source for space heating has declined slightly.
Figure 65: Main source of space heating for Victorian households
Source: Australian Bureau of Statistics (2014) 4602.0.55.001 Environmental Issues: Energy Use and Conservation,
March 2014; Australian Bureau of Statistics (2011) 4602.0.55.001 Environmental Issues: Energy Use and
Conservation, March 2011.
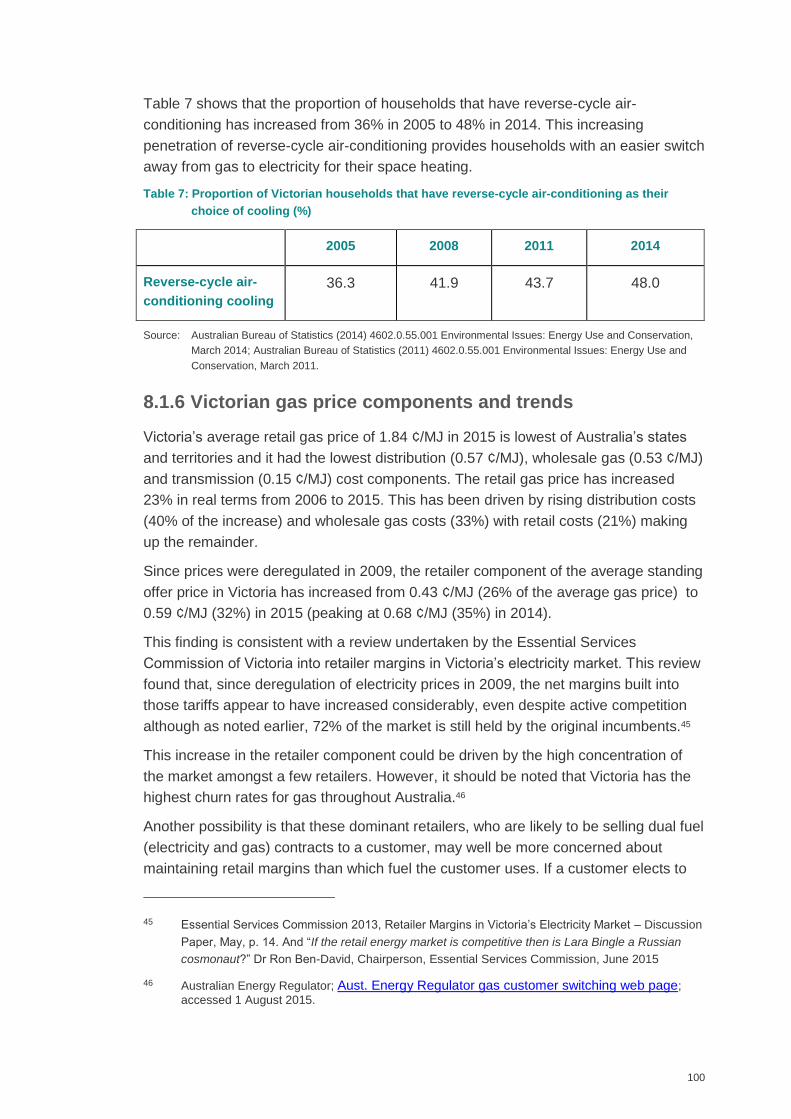
100
Table 7 shows that the proportion of households that have reverse-cycle air-
conditioning has increased from 36% in 2005 to 48% in 2014. This increasing
penetration of reverse-cycle air-conditioning provides households with an easier switch
away from gas to electricity for their space heating.
Table 7: Proportion of Victorian households that have reverse-cycle air-conditioning as their
choice of cooling (%)
2005 2008 2011 2014
Reverse-cycle air-
conditioning cooling
36.3 41.9 43.7 48.0
Source: Australian Bureau of Statistics (2014) 4602.0.55.001 Environmental Issues: Energy Use and Conservation,
March 2014; Australian Bureau of Statistics (2011) 4602.0.55.001 Environmental Issues: Energy Use and
Conservation, March 2011.
8.1.6 Victorian gas price components and trends
Victoria’s average retail gas price of 1.84 ¢/MJ in 2015 is lowest of Australia’s states
and territories and it had the lowest distribution (0.57 ¢/MJ), wholesale gas (0.53 ¢/MJ)
and transmission (0.15 ¢/MJ) cost components. The retail gas price has increased
23% in real terms from 2006 to 2015. This has been driven by rising distribution costs
(40% of the increase) and wholesale gas costs (33%) with retail costs (21%) making
up the remainder.
Since prices were deregulated in 2009, the retailer component of the average standing
offer price in Victoria has increased from 0.43 ¢/MJ (26% of the average gas price) to
0.59 ¢/MJ (32%) in 2015 (peaking at 0.68 ¢/MJ (35%) in 2014).
This finding is consistent with a review undertaken by the Essential Services
Commission of Victoria into retailer margins in Victoria’s electricity market. This review
found that, since deregulation of electricity prices in 2009, the net margins built into
those tariffs appear to have increased considerably, even despite active competition
although as noted earlier, 72% of the market is still held by the original incumbents.45
This increase in the retailer component could be driven by the high concentration of
the market amongst a few retailers. However, it should be noted that Victoria has the
highest churn rates for gas throughout Australia.46
Another possibility is that these dominant retailers, who are likely to be selling dual fuel
(electricity and gas) contracts to a customer, may well be more concerned about
maintaining retail margins than which fuel the customer uses. If a customer elects to
45 Essential Services Commission 2013, Retailer Margins in Victoria’s Electricity Market – Discussion
Paper, May, p. 14. And “If the retail energy market is competitive then is Lara Bingle a Russian
cosmonaut?” Dr Ron Ben-David, Chairperson, Essential Services Commission, June 2015
46 Australian Energy Regulator; Aust. Energy Regulator gas customer switching web page;
accessed 1 August 2015.
101
switch from gas to electricity they would be more likely to do so while staying with their
current energy retailer. In this case, the retailer is unlikely to provide discounts to
encourage the customer to stay with gas, and certainly not at levels that might
ultimately erode the retailer’s overall profit. This trend of profit maintenance and growth
(rather than chasing or maintaining gas customer numbers at the margin) also fits with
the private and listed ownership of retailers who need to show effective returns for
shareholders. Customer switching between gas and electricity may well be less of an
issue in this market than profit margins.
It may also hint at competition issues related to the ability to source competitive gas in
the near term as the east coast market starts to feel the squeeze of new (higher) gas
prices and the roll-over of the older Gascor contracts to new deals. Access to
competitive gas for smaller retailers may become a lot less liquid as NSW starts to rely
more on Longford for supply, and certainly more expensive than legacy Victorian
contracts. There would be a natural tendency in this case for incumbents with legacy
contracts to price gas supply up to new entrant costs.
The increase in the 2008 distribution component was driven by the distribution
regulatory review undertaken by the ESC that allowed for greater expenditure and had
decreasing average demand forecasts (the ESC regulated the VTS and distribution
networks until 1 January 2009, when the AER took over). This increase was not
passed on to customers through higher retail gas prices but instead the retailer
component was reduced to offset the majority of the increase at the time.
After 2008, the actual distribution component of the average residential gas cost per
MJ has decreased from 40% to 25%. This has been driven by a slight decrease in the
distribution cost (in real terms) and increases in the other components.
The transmission component has remained relatively constant in real terms over the
last 10 years representing between 23% and 28% of the average retail price.
Victorian energy efficient target (VEET)
The VEET scheme started in 2009 as a market-based approach to encourage energy
efficiency in households and workplaces throughout Victoria. The scheme operates
through earning Victorian Energy Efficiency certificates when eligible energy efficiency
measures are implemented. Every certificate represents one tonne of carbon
emissions saved over the lifetime of the measure.
These certificates can then be sold to energy retailers who are required to meet an
emission savings target each year. These certificates are subsequently traded on a
market to allow the development of a market-based value.
The energy retailers’ costs of either undertaking the energy efficiency activity or
purchasing certificates to meet their required target each year is passed on to
customers through the retail price.
102
In determining the cost of meeting these targets for the gas retailers, the value of the
traded certificates has been used. It is assumed that a retailer would not undertake an
energy efficiency (gas-related) activity47 to meet its target that cost more than the value
of the certificates in the market. Therefore the use of the certificates to quantify the
cost of the scheme would be a conservative approach and represent an estimate at
the upper bounds of the likely cost of the scheme on customers.
The estimated impact on retail gas bills is quite minor with a maximum impact of
0.01 ¢/MJ in 2012. The estimated impact on customer bills is mainly influenced by the
traded price of the certificates which peaked in 2012 with an average of $23.04. In
combination with the carbon price, the maximum impact of environmental polices was
0.02 ¢/MJ in 2013, representing approximately 7% of the average retail gas price.
8.1.7 Further developments
In October 2014, the Victorian Government released its Energy Statement which
highlights the significant changes occurring in the Victorian energy market and
identifies other changes that are likely to emerge in the future. The objective of the
Energy Statement is to help drive a modern, resilient energy system that can adapt to
changing trends.
In addition to broader energy themes such as retail competition, empowering
consumers and developing Victoria’s energy resources, one of the key outcomes of
the Statement for the gas industry has a focus on driving a more integrated gas
market. This includes:
Advocating for a set of more integrated market arrangements throughout the
eastern seaboard;
Seeking to make gas markets more transparent, liquid and accessible;
A single set of principles for east coast pipelines;
Reviewing governance and rule-making arrangements for the Victorian gas
market; and
Funding the AEMC to undertake a thorough review of capacity and risk
management mechanisms in the Victorian gas market (the initial phase of this
review was incorporated in the AEMC’s Stage 1 Draft Report of its East Coast
Wholesale Gas Market and Pipeline Frameworks Review, with further work on the
specific Victorian market to be undertaken later in 2015).
47 Gas-related energy efficiency activities include decommissioning electric hot water and installing
gas hot water, installing high efficiency ducted gas space heating, replacement of gas heating
ducts, etc.
103
The other major issue for the Victorian gas market is the likely response to impending
wholesale gas price increases, tighter liquidity and falling average household
consumption.
Victorian residential gas customers have enjoyed relatively well priced gas for a long
time and this is likely to change. Coupled with cold weather, residential demand has
grown strongly in the past but now it can be seen to be deteriorating as the weather
pattern in recent times has become milder and changes in appliance stock occur.
There are a number of factors that may well be contributing to this development but it
is likely that gas will lose residential market share in Victoria to more cost effective
electric heat pumps for space and water heating.
One of the other further developments is the construction of virtual networks in
regional areas in Victoria (refer Box 1)
8.2 Tasmania
8.2.1 Tasmanian residential gas prices
Gas is a relatively new commodity in Tasmania with the state first connected in 2002
and the state’s distribution network completed in 2007. The gas retail prices shown in
Figure 66 were relatively flat until 2009 after which prices rose due to increasing
distribution and retail costs. The average retail gas price in Tasmania increased by
almost 1 ¢/MJ between 2009 and 2014, an increase of 46%.
In 2015, the average gas price delivered to Tasmanian households was 3.36 ¢/MJ, of
which 1.61 ¢/MJ (48%) was the distribution component, 0.70 ¢/MJ (21%) was the
retailer component, 0.53 ¢/MJ (16%) was the wholesale gas component and 0.51 ¢/MJ
(15%) was the transmission component. There was no environmental policy
component.
Box 1
In 2011, the Victorian Government announced an “Energy for the Regions” program
which was aimed at connecting a number of regional towns to natural gas. These
new networks have either been extensions to smaller distribution zones (i.e. small
increase in AusNet Services Adjoining West zone) or a new network to be supplied
by Brookfield Infrastructure Group following a tender process by the Victorian
Government. New networks will be a compressed natural gas (CNG) solution
whereby CNG will be transported by road to the outskirts of each town and
subsequently reticulated into homes and businesses, thereby creating a separate
network from the current three distribution networks. These networks are expected
to commence reticulation and customer connections from the 3rd quarter of 2015
(Lakes Entrance) with the latest commencement of reticulation expected in the 4th
quarter of 2016 (Maldon and Invermay). No pricing information is publicly available
as yet.
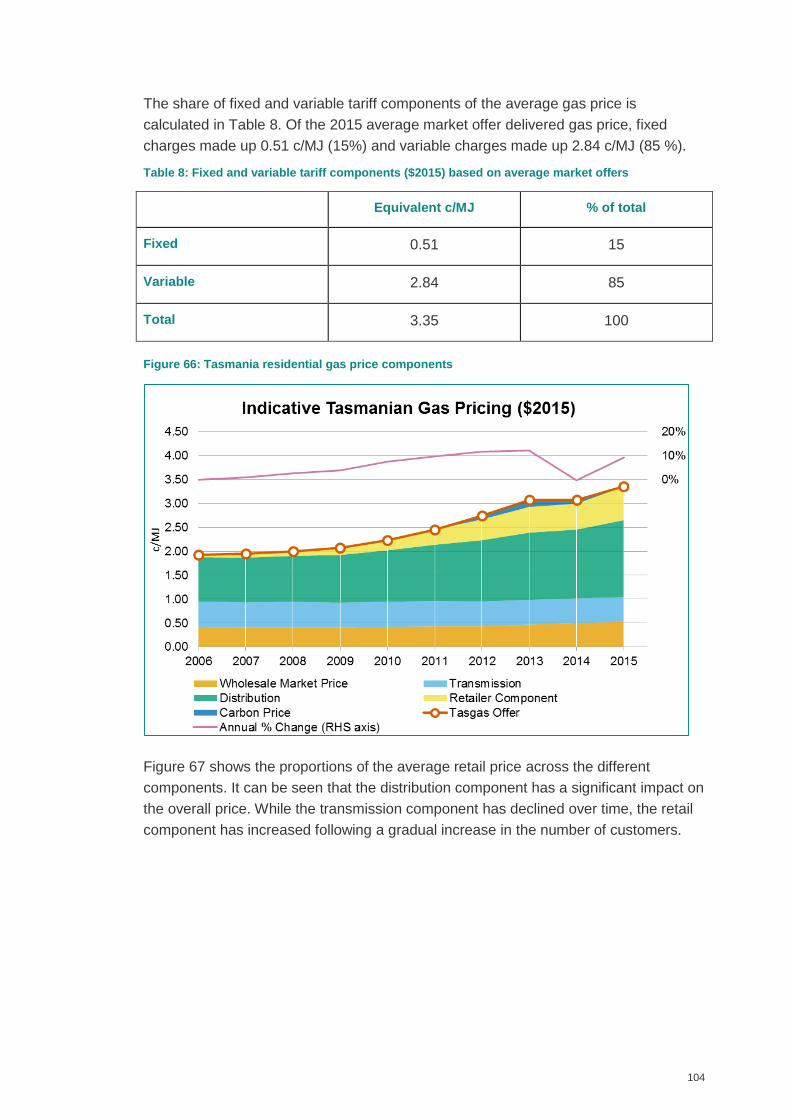
104
The share of fixed and variable tariff components of the average gas price is
calculated in Table 8. Of the 2015 average market offer delivered gas price, fixed
charges made up 0.51 c/MJ (15%) and variable charges made up 2.84 c/MJ (85 %).
Table 8: Fixed and variable tariff components ($2015) based on average market offers
Equivalent c/MJ % of total
Fixed 0.51 15
Variable 2.84 85
Total 3.35 100
Figure 66: Tasmania residential gas price components
Figure 67 shows the proportions of the average retail price across the different
components. It can be seen that the distribution component has a significant impact on
the overall price. While the transmission component has declined over time, the retail
component has increased following a gradual increase in the number of customers.
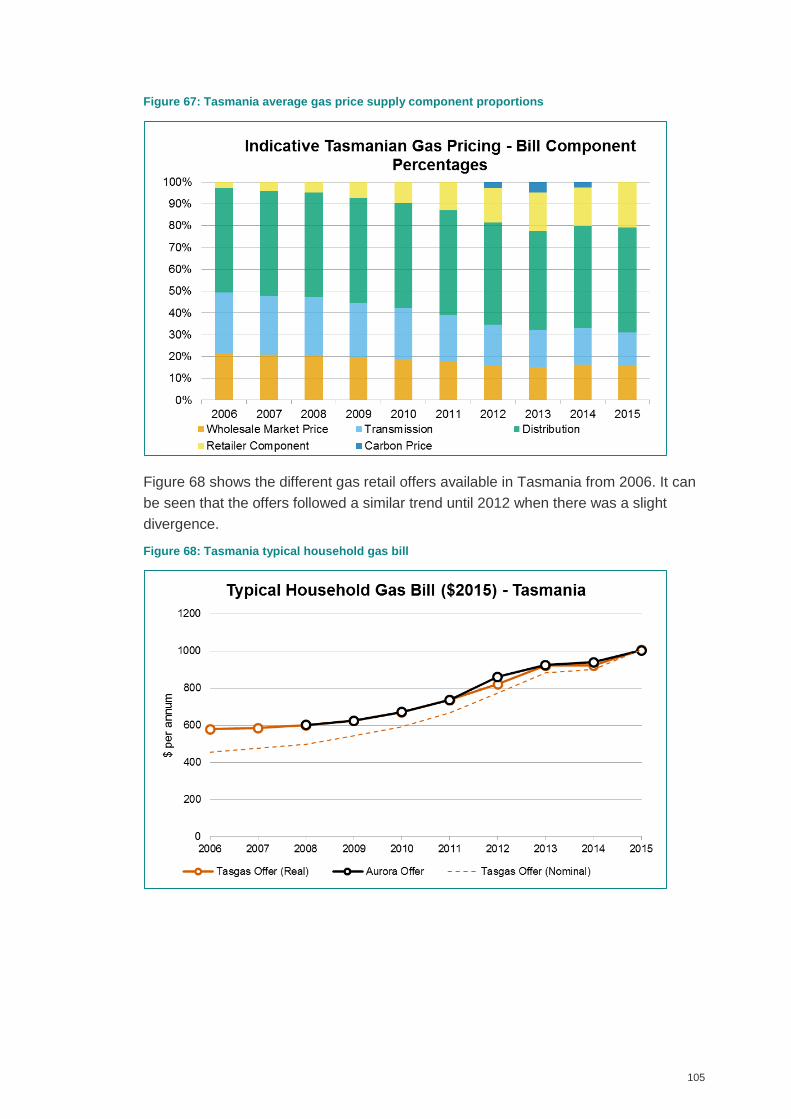
105
Figure 67: Tasmania average gas price supply component proportions
Figure 68 shows the different gas retail offers available in Tasmania from 2006. It can
be seen that the offers followed a similar trend until 2012 when there was a slight
divergence.
Figure 68: Tasmania typical household gas bill
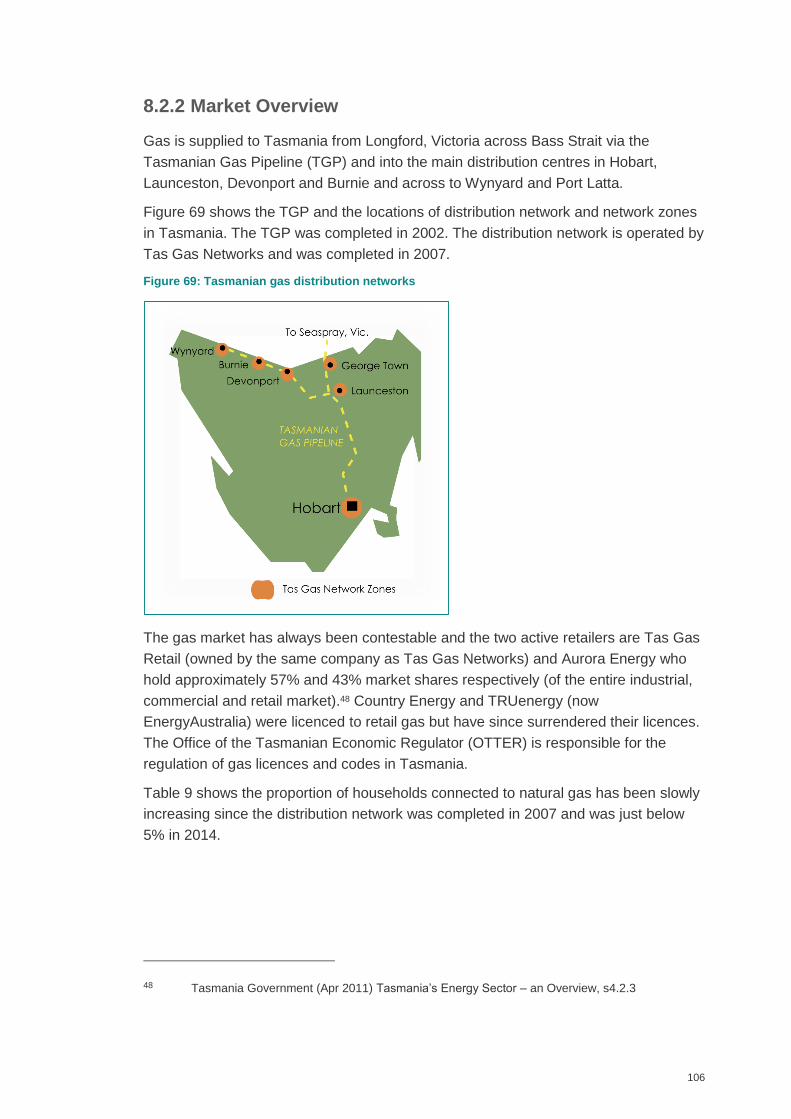
106
8.2.2 Market Overview
Gas is supplied to Tasmania from Longford, Victoria across Bass Strait via the
Tasmanian Gas Pipeline (TGP) and into the main distribution centres in Hobart,
Launceston, Devonport and Burnie and across to Wynyard and Port Latta.
Figure 69 shows the TGP and the locations of distribution network and network zones
in Tasmania. The TGP was completed in 2002. The distribution network is operated by
Tas Gas Networks and was completed in 2007.
Figure 69: Tasmanian gas distribution networks
The gas market has always been contestable and the two active retailers are Tas Gas
Retail (owned by the same company as Tas Gas Networks) and Aurora Energy who
hold approximately 57% and 43% market shares respectively (of the entire industrial,
commercial and retail market).48 Country Energy and TRUenergy (now
EnergyAustralia) were licenced to retail gas but have since surrendered their licences.
The Office of the Tasmanian Economic Regulator (OTTER) is responsible for the
regulation of gas licences and codes in Tasmania.
Table 9 shows the proportion of households connected to natural gas has been slowly
increasing since the distribution network was completed in 2007 and was just below
5% in 2014.
48 Tasmania Government (Apr 2011) Tasmania’s Energy Sector – an Overview, s4.2.3
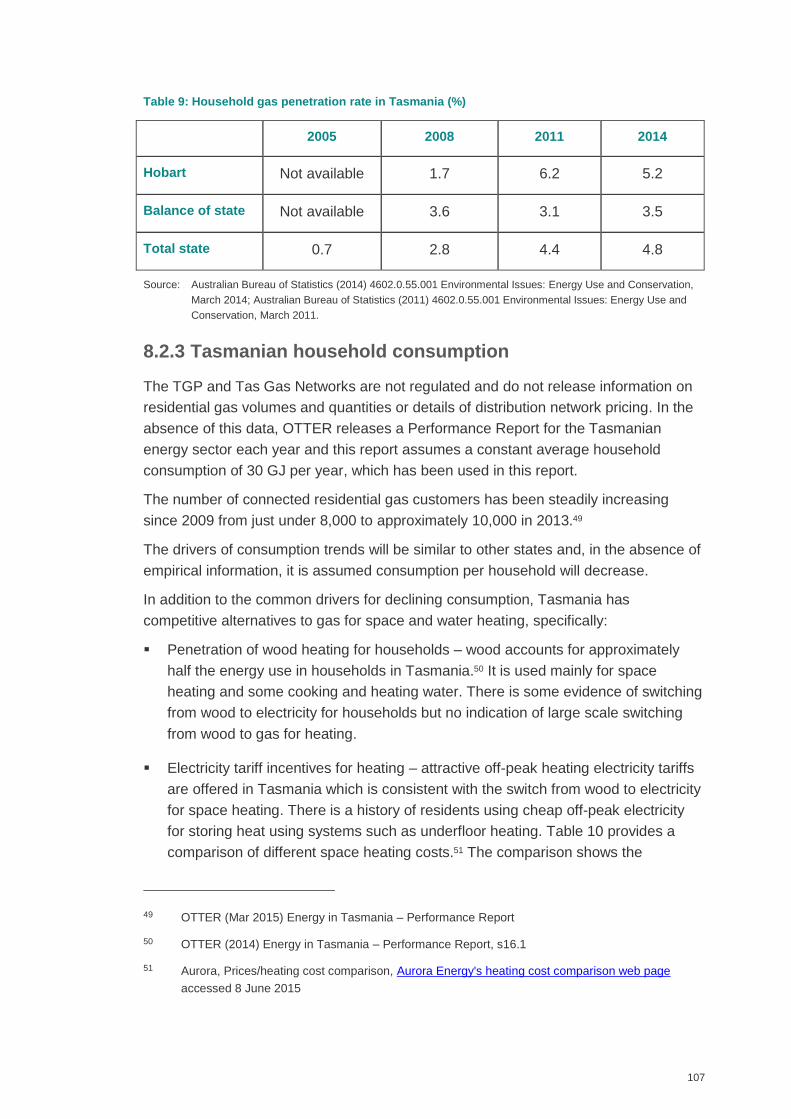
107
Table 9: Household gas penetration rate in Tasmania (%)
2005 2008 2011 2014
Hobart Not available 1.7 6.2 5.2
Balance of state Not available 3.6 3.1 3.5
Total state 0.7 2.8 4.4 4.8
Source: Australian Bureau of Statistics (2014) 4602.0.55.001 Environmental Issues: Energy Use and Conservation,
March 2014; Australian Bureau of Statistics (2011) 4602.0.55.001 Environmental Issues: Energy Use and
Conservation, March 2011.
8.2.3 Tasmanian household consumption
The TGP and Tas Gas Networks are not regulated and do not release information on
residential gas volumes and quantities or details of distribution network pricing. In the
absence of this data, OTTER releases a Performance Report for the Tasmanian
energy sector each year and this report assumes a constant average household
consumption of 30 GJ per year, which has been used in this report.
The number of connected residential gas customers has been steadily increasing
since 2009 from just under 8,000 to approximately 10,000 in 2013.49
The drivers of consumption trends will be similar to other states and, in the absence of
empirical information, it is assumed consumption per household will decrease.
In addition to the common drivers for declining consumption, Tasmania has
competitive alternatives to gas for space and water heating, specifically:
Penetration of wood heating for households – wood accounts for approximately
half the energy use in households in Tasmania.50 It is used mainly for space
heating and some cooking and heating water. There is some evidence of switching
from wood to electricity for households but no indication of large scale switching
from wood to gas for heating.
Electricity tariff incentives for heating – attractive off-peak heating electricity tariffs
are offered in Tasmania which is consistent with the switch from wood to electricity
for space heating. There is a history of residents using cheap off-peak electricity
for storing heat using systems such as underfloor heating. Table 10 provides a
comparison of different space heating costs.51 The comparison shows the
49 OTTER (Mar 2015) Energy in Tasmania – Performance Report
50 OTTER (2014) Energy in Tasmania – Performance Report, s16.1
51 Aurora, Prices/heating cost comparison, Aurora Energy's heating cost comparison web page
accessed 8 June 2015
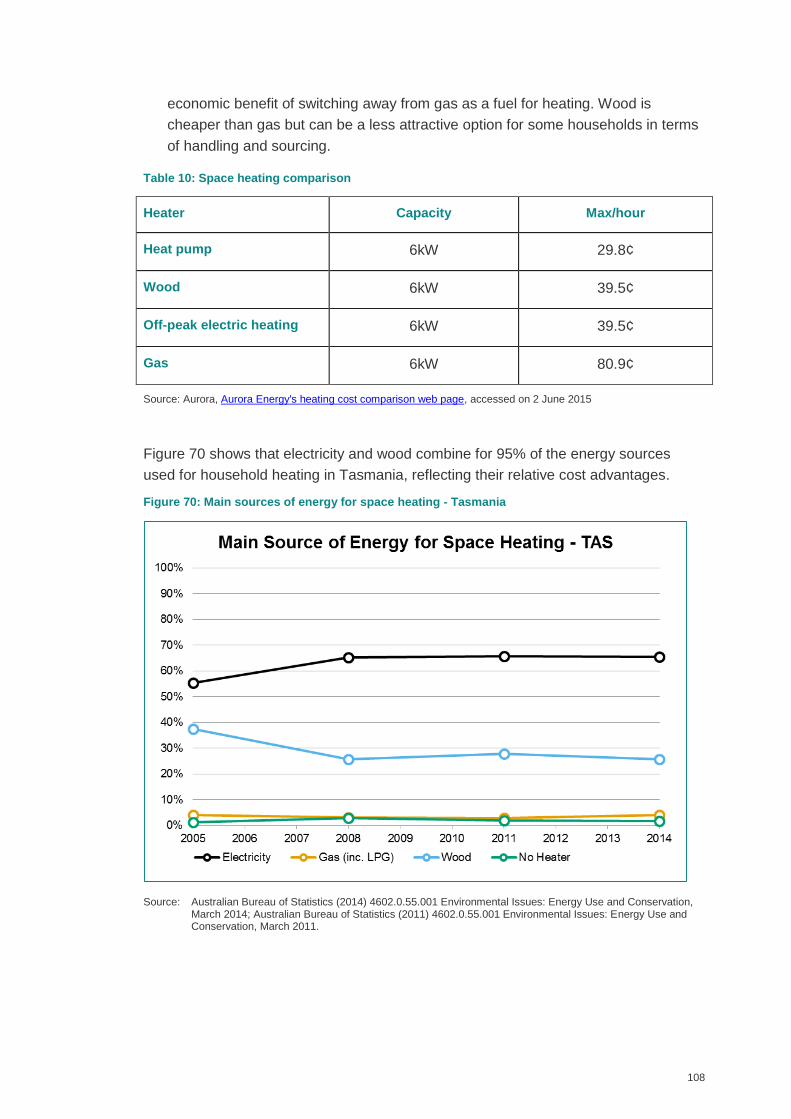
108
economic benefit of switching away from gas as a fuel for heating. Wood is
cheaper than gas but can be a less attractive option for some households in terms
of handling and sourcing.
Table 10: Space heating comparison
Heater Capacity Max/hour
Heat pump 6kW 29.8¢
Wood 6kW 39.5¢
Off-peak electric heating 6kW 39.5¢
Gas 6kW 80.9¢
Source: Aurora, Aurora Energy's heating cost comparison web page, accessed on 2 June 2015
Figure 70 shows that electricity and wood combine for 95% of the energy sources
used for household heating in Tasmania, reflecting their relative cost advantages.
Figure 70: Main sources of energy for space heating - Tasmania
Source: Australian Bureau of Statistics (2014) 4602.0.55.001 Environmental Issues: Energy Use and Conservation, March 2014; Australian Bureau of Statistics (2011) 4602.0.55.001 Environmental Issues: Energy Use and Conservation, March 2011.
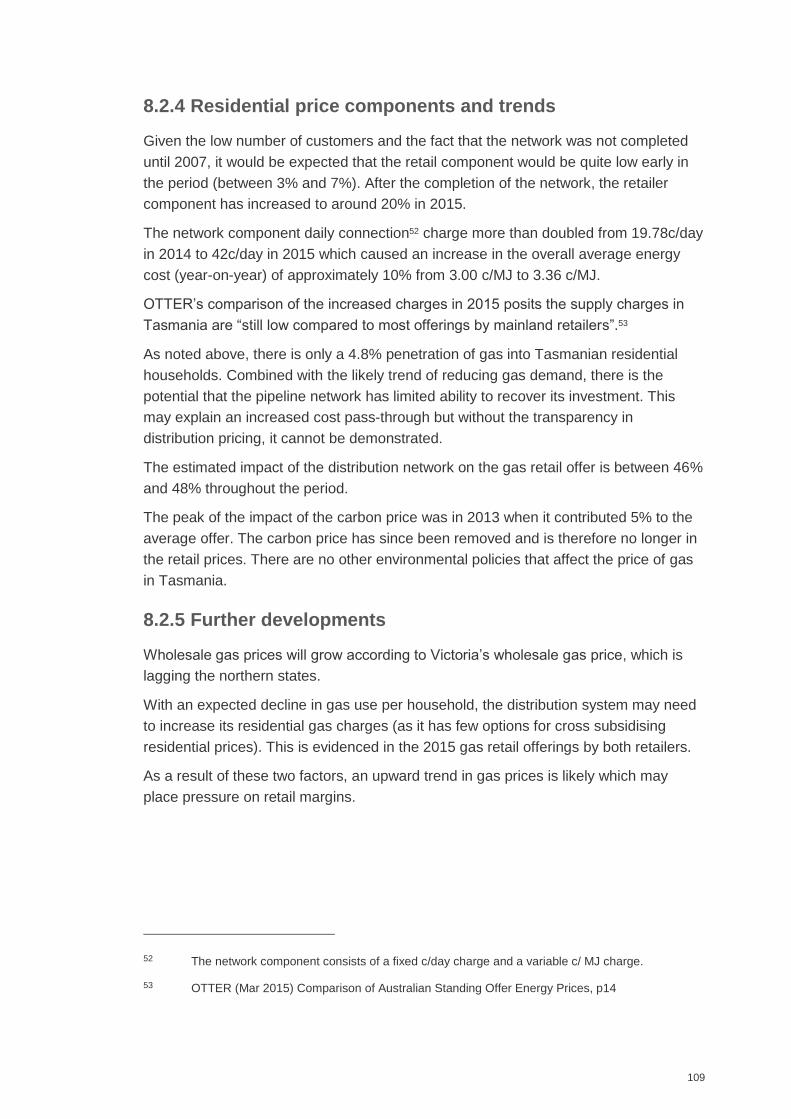
109
8.2.4 Residential price components and trends
Given the low number of customers and the fact that the network was not completed
until 2007, it would be expected that the retail component would be quite low early in
the period (between 3% and 7%). After the completion of the network, the retailer
component has increased to around 20% in 2015.
The network component daily connection52 charge more than doubled from 19.78c/day
in 2014 to 42c/day in 2015 which caused an increase in the overall average energy
cost (year-on-year) of approximately 10% from 3.00 c/MJ to 3.36 c/MJ.
OTTER’s comparison of the increased charges in 2015 posits the supply charges in
Tasmania are “still low compared to most offerings by mainland retailers”.53
As noted above, there is only a 4.8% penetration of gas into Tasmanian residential
households. Combined with the likely trend of reducing gas demand, there is the
potential that the pipeline network has limited ability to recover its investment. This
may explain an increased cost pass-through but without the transparency in
distribution pricing, it cannot be demonstrated.
The estimated impact of the distribution network on the gas retail offer is between 46%
and 48% throughout the period.
The peak of the impact of the carbon price was in 2013 when it contributed 5% to the
average offer. The carbon price has since been removed and is therefore no longer in
the retail prices. There are no other environmental policies that affect the price of gas
in Tasmania.
8.2.5 Further developments
Wholesale gas prices will grow according to Victoria’s wholesale gas price, which is
lagging the northern states.
With an expected decline in gas use per household, the distribution system may need
to increase its residential gas charges (as it has few options for cross subsidising
residential prices). This is evidenced in the 2015 gas retail offerings by both retailers.
As a result of these two factors, an upward trend in gas prices is likely which may
place pressure on retail margins.
52 The network component consists of a fixed c/day charge and a variable c/ MJ charge.
53 OTTER (Mar 2015) Comparison of Australian Standing Offer Energy Prices, p14
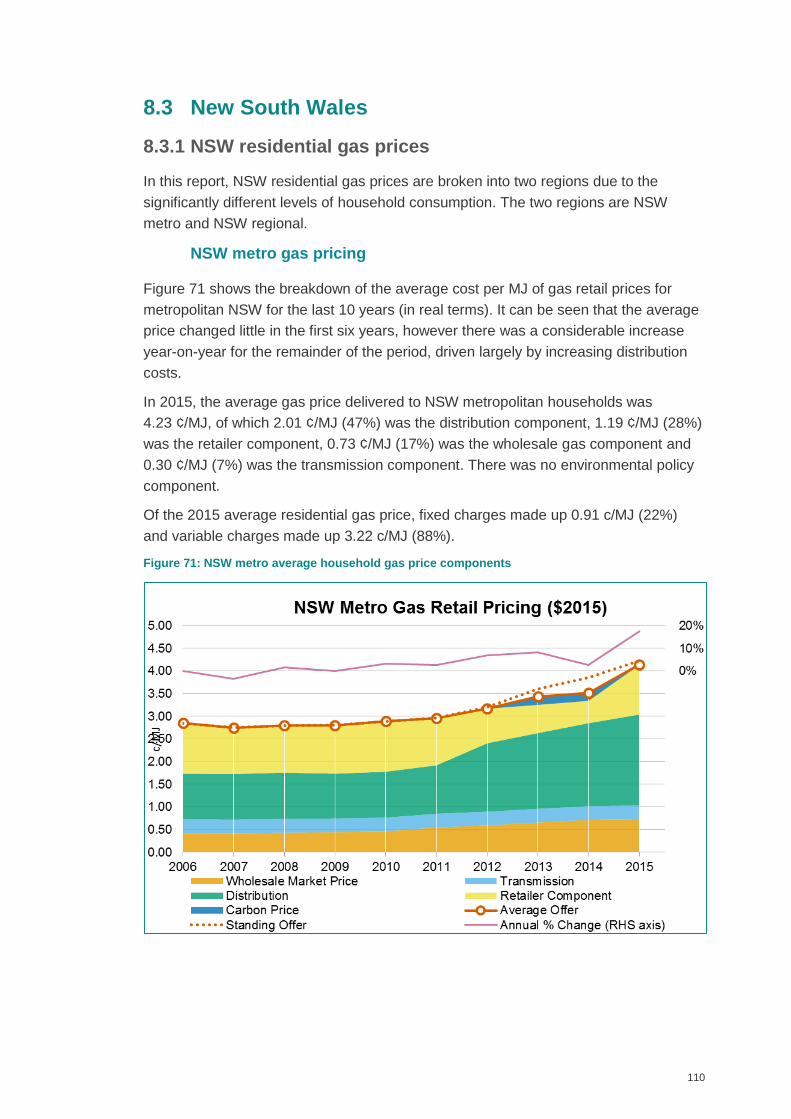
110
8.3 New South Wales
8.3.1 NSW residential gas prices
In this report, NSW residential gas prices are broken into two regions due to the
significantly different levels of household consumption. The two regions are NSW
metro and NSW regional.
NSW metro gas pricing
Figure 71 shows the breakdown of the average cost per MJ of gas retail prices for
metropolitan NSW for the last 10 years (in real terms). It can be seen that the average
price changed little in the first six years, however there was a considerable increase
year-on-year for the remainder of the period, driven largely by increasing distribution
costs.
In 2015, the average gas price delivered to NSW metropolitan households was
4.23 ¢/MJ, of which 2.01 ¢/MJ (47%) was the distribution component, 1.19 ¢/MJ (28%)
was the retailer component, 0.73 ¢/MJ (17%) was the wholesale gas component and
0.30 ¢/MJ (7%) was the transmission component. There was no environmental policy
component.
Of the 2015 average residential gas price, fixed charges made up 0.91 c/MJ (22%)
and variable charges made up 3.22 c/MJ (88%).
Figure 71: NSW metro average household gas price components
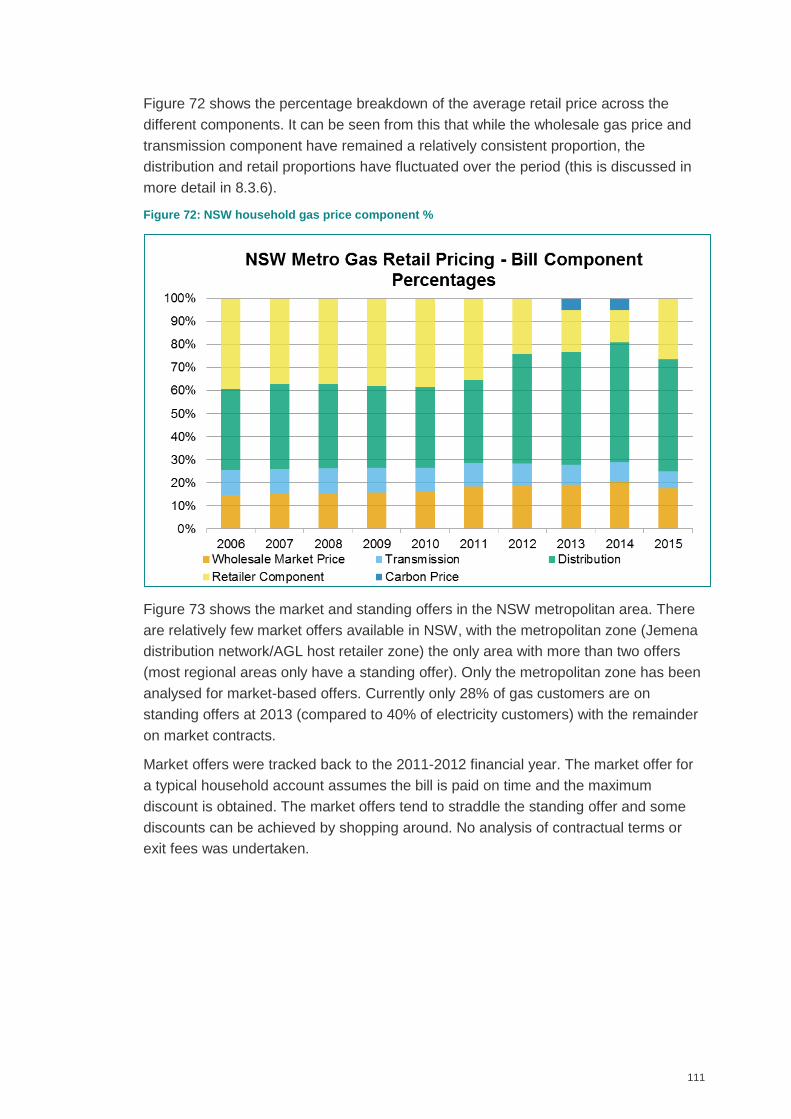
111
Figure 72 shows the percentage breakdown of the average retail price across the
different components. It can be seen from this that while the wholesale gas price and
transmission component have remained a relatively consistent proportion, the
distribution and retail proportions have fluctuated over the period (this is discussed in
more detail in 8.3.6).
Figure 72: NSW household gas price component %
Figure 73 shows the market and standing offers in the NSW metropolitan area. There
are relatively few market offers available in NSW, with the metropolitan zone (Jemena
distribution network/AGL host retailer zone) the only area with more than two offers
(most regional areas only have a standing offer). Only the metropolitan zone has been
analysed for market-based offers. Currently only 28% of gas customers are on
standing offers at 2013 (compared to 40% of electricity customers) with the remainder
on market contracts.
Market offers were tracked back to the 2011-2012 financial year. The market offer for
a typical household account assumes the bill is paid on time and the maximum
discount is obtained. The market offers tend to straddle the standing offer and some
discounts can be achieved by shopping around. No analysis of contractual terms or
exit fees was undertaken.
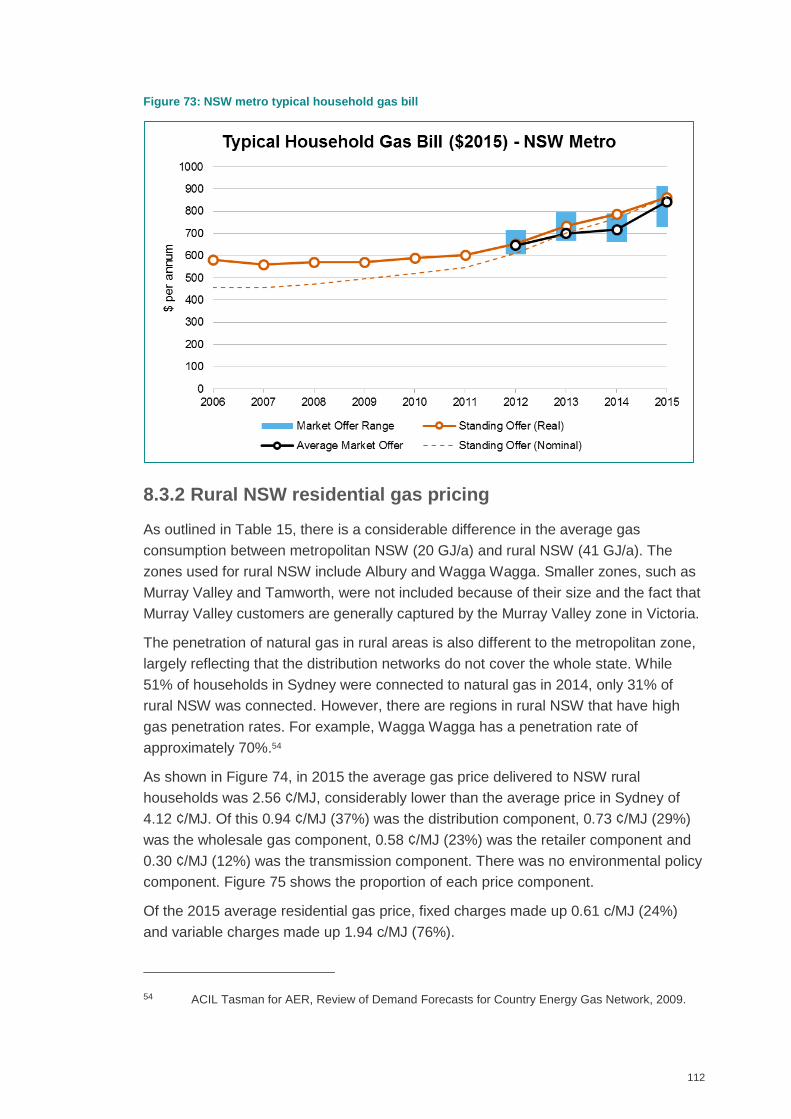
112
Figure 73: NSW metro typical household gas bill
8.3.2 Rural NSW residential gas pricing
As outlined in Table 15, there is a considerable difference in the average gas
consumption between metropolitan NSW (20 GJ/a) and rural NSW (41 GJ/a). The
zones used for rural NSW include Albury and Wagga Wagga. Smaller zones, such as
Murray Valley and Tamworth, were not included because of their size and the fact that
Murray Valley customers are generally captured by the Murray Valley zone in Victoria.
The penetration of natural gas in rural areas is also different to the metropolitan zone,
largely reflecting that the distribution networks do not cover the whole state. While
51% of households in Sydney were connected to natural gas in 2014, only 31% of
rural NSW was connected. However, there are regions in rural NSW that have high
gas penetration rates. For example, Wagga Wagga has a penetration rate of
approximately 70%.54
As shown in Figure 74, in 2015 the average gas price delivered to NSW rural
households was 2.56 ¢/MJ, considerably lower than the average price in Sydney of
4.12 ¢/MJ. Of this 0.94 ¢/MJ (37%) was the distribution component, 0.73 ¢/MJ (29%)
was the wholesale gas component, 0.58 ¢/MJ (23%) was the retailer component and
0.30 ¢/MJ (12%) was the transmission component. There was no environmental policy
component. Figure 75 shows the proportion of each price component.
Of the 2015 average residential gas price, fixed charges made up 0.61 c/MJ (24%)
and variable charges made up 1.94 c/MJ (76%).
54 ACIL Tasman for AER, Review of Demand Forecasts for Country Energy Gas Network, 2009.
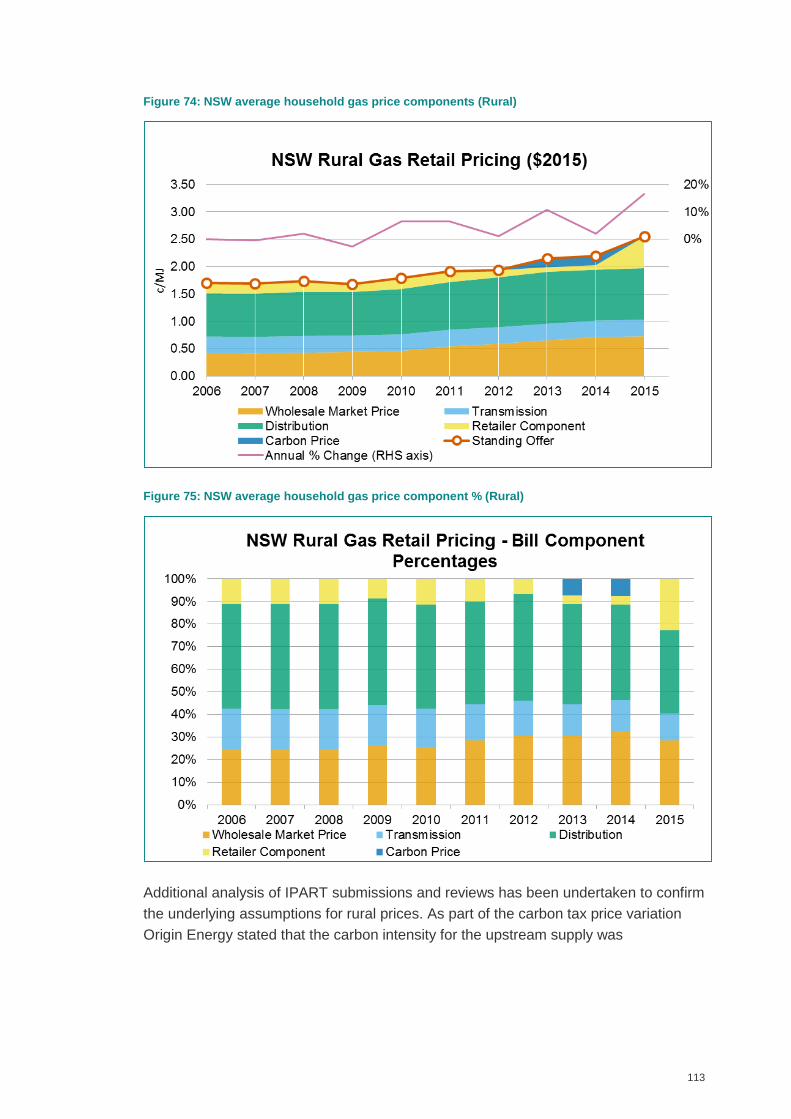
113
Figure 74: NSW average household gas price components (Rural)
Figure 75: NSW average household gas price component % (Rural)
Additional analysis of IPART submissions and reviews has been undertaken to confirm
the underlying assumptions for rural prices. As part of the carbon tax price variation
Origin Energy stated that the carbon intensity for the upstream supply was
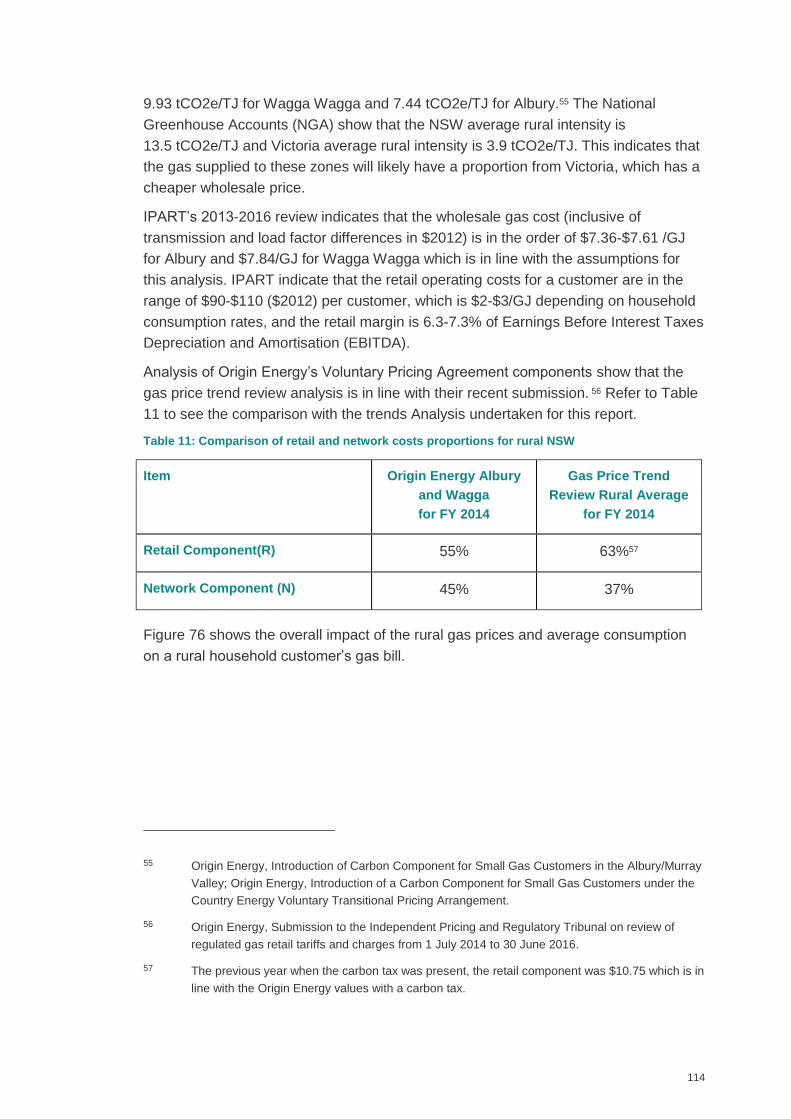
114
9.93 tCO2e/TJ for Wagga Wagga and 7.44 tCO2e/TJ for Albury.55 The National
Greenhouse Accounts (NGA) show that the NSW average rural intensity is
13.5 tCO2e/TJ and Victoria average rural intensity is 3.9 tCO2e/TJ. This indicates that
the gas supplied to these zones will likely have a proportion from Victoria, which has a
cheaper wholesale price.
IPART’s 2013-2016 review indicates that the wholesale gas cost (inclusive of
transmission and load factor differences in $2012) is in the order of $7.36-$7.61 /GJ
for Albury and $7.84/GJ for Wagga Wagga which is in line with the assumptions for
this analysis. IPART indicate that the retail operating costs for a customer are in the
range of $90-$110 ($2012) per customer, which is $2-$3/GJ depending on household
consumption rates, and the retail margin is 6.3-7.3% of Earnings Before Interest Taxes
Depreciation and Amortisation (EBITDA).
Analysis of Origin Energy’s Voluntary Pricing Agreement components show that the
gas price trend review analysis is in line with their recent submission. 56 Refer to Table
11 to see the comparison with the trends Analysis undertaken for this report.
Table 11: Comparison of retail and network costs proportions for rural NSW
Item Origin Energy Albury
and Wagga
for FY 2014
Gas Price Trend
Review Rural Average
for FY 2014
Retail Component(R) 55% 63%57
Network Component (N) 45% 37%
Figure 76 shows the overall impact of the rural gas prices and average consumption
on a rural household customer’s gas bill.
55 Origin Energy, Introduction of Carbon Component for Small Gas Customers in the Albury/Murray
Valley; Origin Energy, Introduction of a Carbon Component for Small Gas Customers under the
Country Energy Voluntary Transitional Pricing Arrangement.
56 Origin Energy, Submission to the Independent Pricing and Regulatory Tribunal on review of
regulated gas retail tariffs and charges from 1 July 2014 to 30 June 2016.
57 The previous year when the carbon tax was present, the retail component was $10.75 which is in
line with the Origin Energy values with a carbon tax.
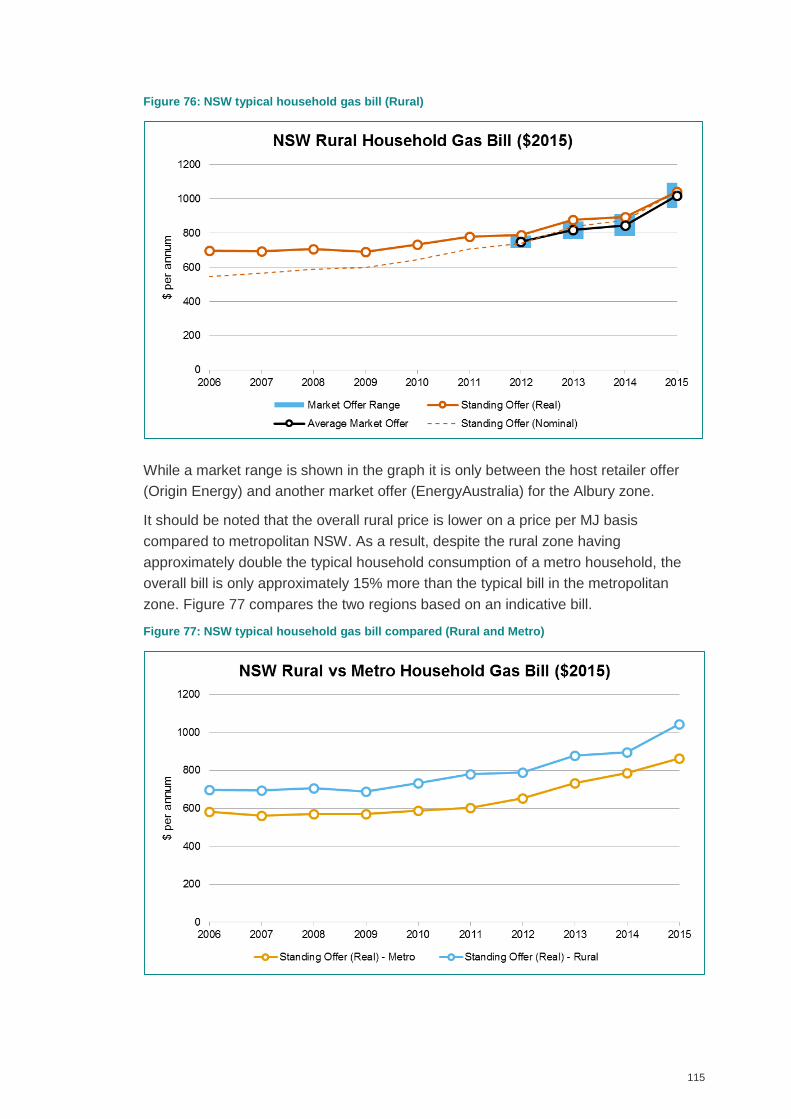
115
Figure 76: NSW typical household gas bill (Rural)
While a market range is shown in the graph it is only between the host retailer offer
(Origin Energy) and another market offer (EnergyAustralia) for the Albury zone.
It should be noted that the overall rural price is lower on a price per MJ basis
compared to metropolitan NSW. As a result, despite the rural zone having
approximately double the typical household consumption of a metro household, the
overall bill is only approximately 15% more than the typical bill in the metropolitan
zone. Figure 77 compares the two regions based on an indicative bill.
Figure 77: NSW typical household gas bill compared (Rural and Metro)
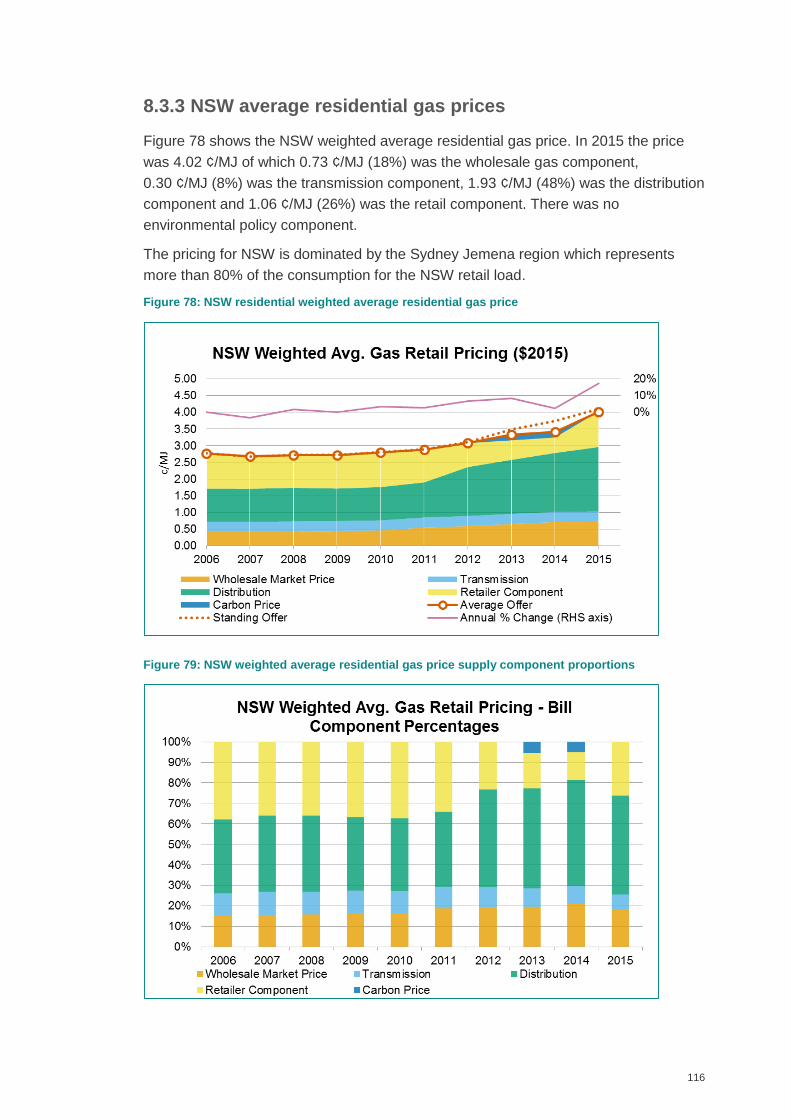
116
8.3.3 NSW average residential gas prices
Figure 78 shows the NSW weighted average residential gas price. In 2015 the price
was 4.02 ¢/MJ of which 0.73 ¢/MJ (18%) was the wholesale gas component,
0.30 ¢/MJ (8%) was the transmission component, 1.93 ¢/MJ (48%) was the distribution
component and 1.06 ¢/MJ (26%) was the retail component. There was no
environmental policy component.
The pricing for NSW is dominated by the Sydney Jemena region which represents
more than 80% of the consumption for the NSW retail load.
Figure 78: NSW residential weighted average residential gas price
Figure 79: NSW weighted average residential gas price supply component proportions
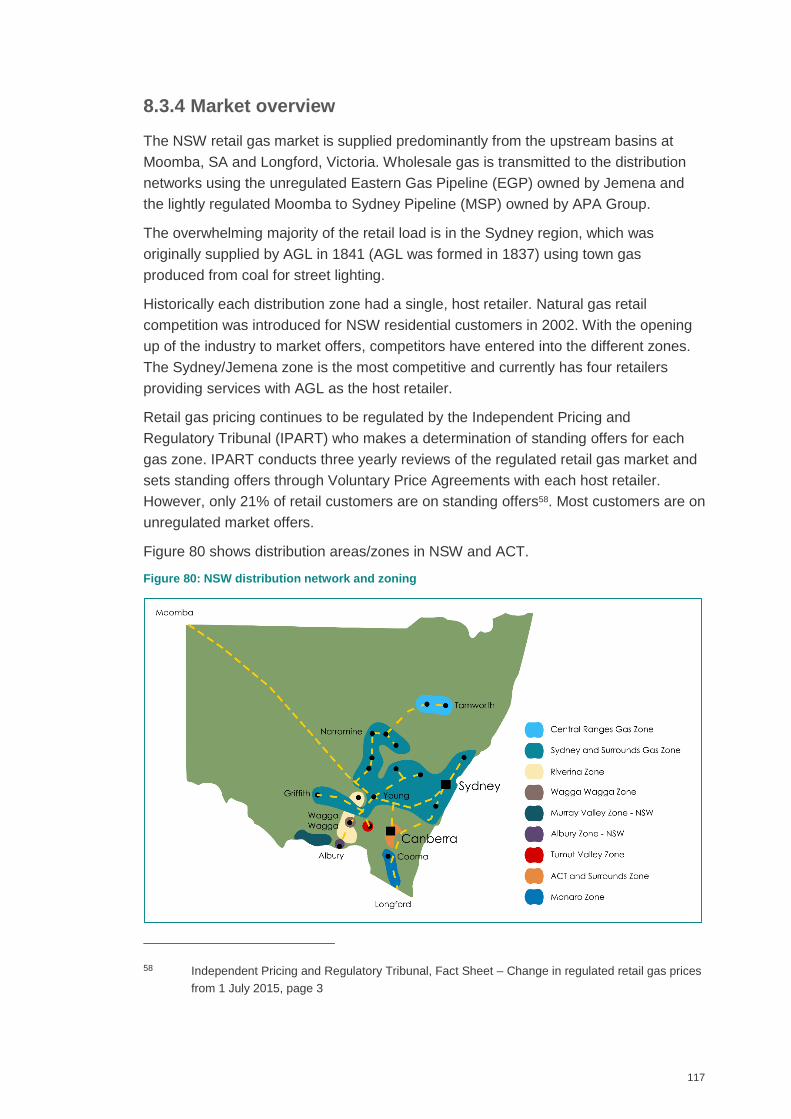
117
8.3.4 Market overview
The NSW retail gas market is supplied predominantly from the upstream basins at
Moomba, SA and Longford, Victoria. Wholesale gas is transmitted to the distribution
networks using the unregulated Eastern Gas Pipeline (EGP) owned by Jemena and
the lightly regulated Moomba to Sydney Pipeline (MSP) owned by APA Group.
The overwhelming majority of the retail load is in the Sydney region, which was
originally supplied by AGL in 1841 (AGL was formed in 1837) using town gas
produced from coal for street lighting.
Historically each distribution zone had a single, host retailer. Natural gas retail
competition was introduced for NSW residential customers in 2002. With the opening
up of the industry to market offers, competitors have entered into the different zones.
The Sydney/Jemena zone is the most competitive and currently has four retailers
providing services with AGL as the host retailer.
Retail gas pricing continues to be regulated by the Independent Pricing and
Regulatory Tribunal (IPART) who makes a determination of standing offers for each
gas zone. IPART conducts three yearly reviews of the regulated retail gas market and
sets standing offers through Voluntary Price Agreements with each host retailer.
However, only 21% of retail customers are on standing offers58. Most customers are on
unregulated market offers.
Figure 80 shows distribution areas/zones in NSW and ACT.
Figure 80: NSW distribution network and zoning
58 Independent Pricing and Regulatory Tribunal, Fact Sheet – Change in regulated retail gas prices
from 1 July 2015, page 3
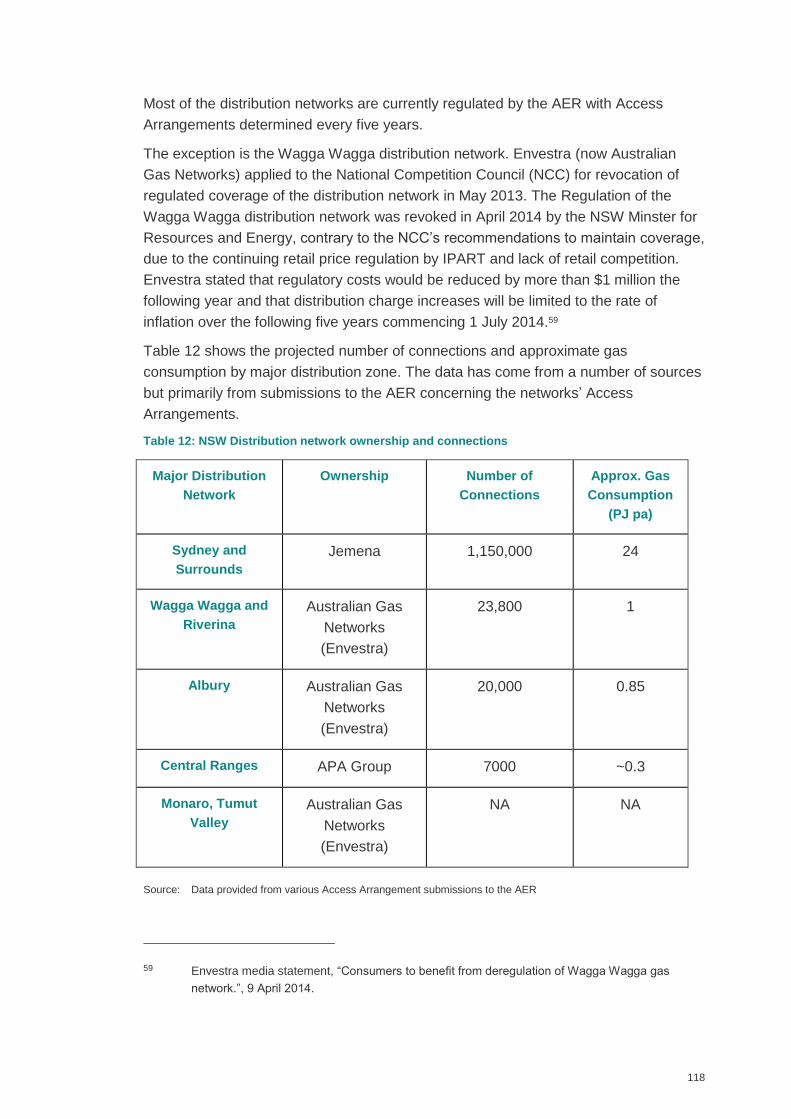
118
Most of the distribution networks are currently regulated by the AER with Access
Arrangements determined every five years.
The exception is the Wagga Wagga distribution network. Envestra (now Australian
Gas Networks) applied to the National Competition Council (NCC) for revocation of
regulated coverage of the distribution network in May 2013. The Regulation of the
Wagga Wagga distribution network was revoked in April 2014 by the NSW Minster for
Resources and Energy, contrary to the NCC’s recommendations to maintain coverage,
due to the continuing retail price regulation by IPART and lack of retail competition.
Envestra stated that regulatory costs would be reduced by more than $1 million the
following year and that distribution charge increases will be limited to the rate of
inflation over the following five years commencing 1 July 2014.59
Table 12 shows the projected number of connections and approximate gas
consumption by major distribution zone. The data has come from a number of sources
but primarily from submissions to the AER concerning the networks’ Access
Arrangements.
Table 12: NSW Distribution network ownership and connections
Major Distribution
Network
Ownership Number of
Connections
Approx. Gas
Consumption
(PJ pa)
Sydney and
Surrounds
Jemena 1,150,000 24
Wagga Wagga and
Riverina
Australian Gas
Networks
(Envestra)
23,800 1
Albury Australian Gas
Networks
(Envestra)
20,000 0.85
Central Ranges APA Group 7000 ~0.3
Monaro, Tumut
Valley
Australian Gas
Networks
(Envestra)
NA NA
Source: Data provided from various Access Arrangement submissions to the AER
59 Envestra media statement, “Consumers to benefit from deregulation of Wagga Wagga gas
network.”, 9 April 2014.
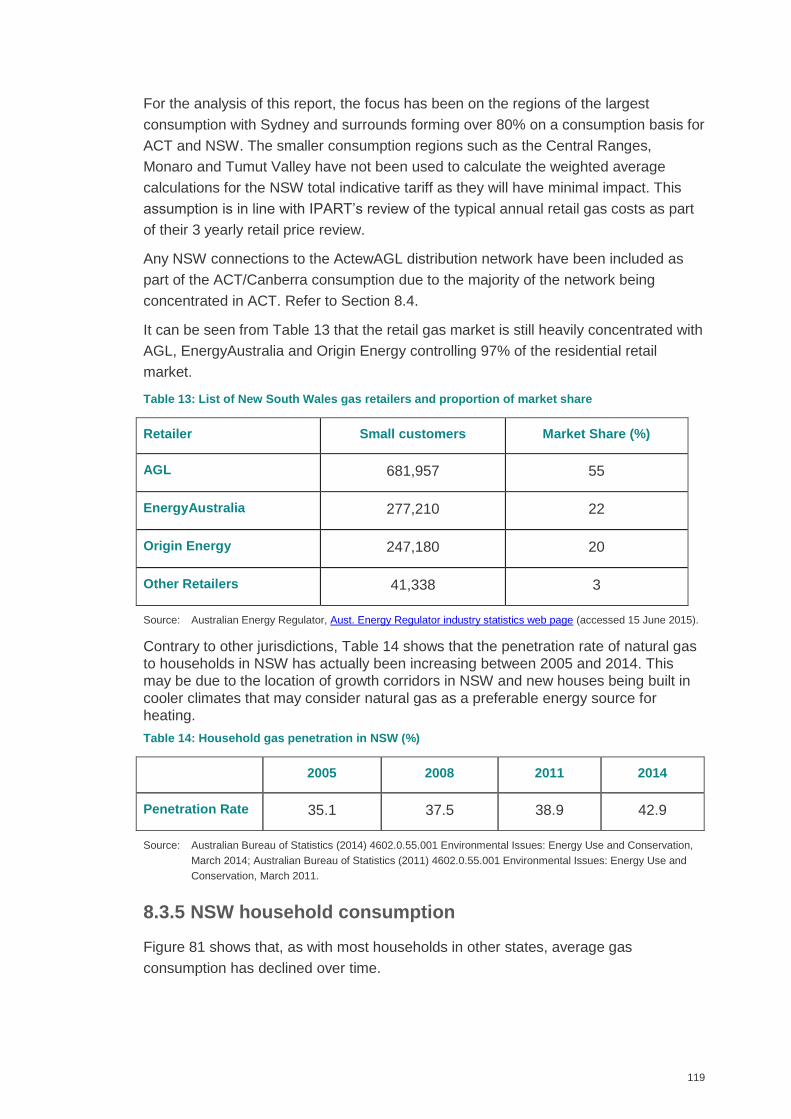
119
For the analysis of this report, the focus has been on the regions of the largest
consumption with Sydney and surrounds forming over 80% on a consumption basis for
ACT and NSW. The smaller consumption regions such as the Central Ranges,
Monaro and Tumut Valley have not been used to calculate the weighted average
calculations for the NSW total indicative tariff as they will have minimal impact. This
assumption is in line with IPART’s review of the typical annual retail gas costs as part
of their 3 yearly retail price review.
Any NSW connections to the ActewAGL distribution network have been included as
part of the ACT/Canberra consumption due to the majority of the network being
concentrated in ACT. Refer to Section 8.4.
It can be seen from Table 13 that the retail gas market is still heavily concentrated with
AGL, EnergyAustralia and Origin Energy controlling 97% of the residential retail
market.
Table 13: List of New South Wales gas retailers and proportion of market share
Retailer Small customers Market Share (%)
AGL 681,957 55
EnergyAustralia 277,210 22
Origin Energy 247,180 20
Other Retailers 41,338 3
Source: Australian Energy Regulator, Aust. Energy Regulator industry statistics web page (accessed 15 June 2015).
Contrary to other jurisdictions, Table 14 shows that the penetration rate of natural gas
to households in NSW has actually been increasing between 2005 and 2014. This
may be due to the location of growth corridors in NSW and new houses being built in
cooler climates that may consider natural gas as a preferable energy source for
heating.
Table 14: Household gas penetration in NSW (%)
2005 2008 2011 2014
Penetration Rate 35.1 37.5 38.9 42.9
Source: Australian Bureau of Statistics (2014) 4602.0.55.001 Environmental Issues: Energy Use and Conservation,
March 2014; Australian Bureau of Statistics (2011) 4602.0.55.001 Environmental Issues: Energy Use and
Conservation, March 2011.
8.3.5 NSW household consumption
Figure 81 shows that, as with most households in other states, average gas
consumption has declined over time.
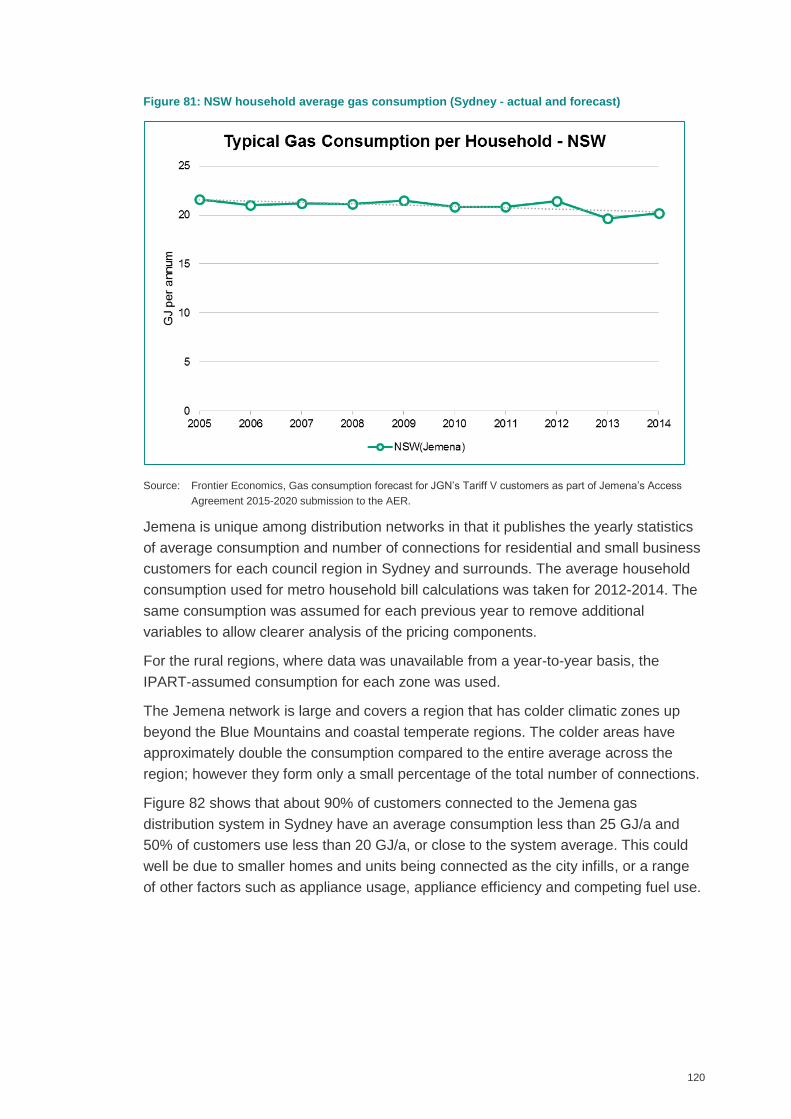
120
Figure 81: NSW household average gas consumption (Sydney - actual and forecast)
Source: Frontier Economics, Gas consumption forecast for JGN’s Tariff V customers as part of Jemena’s Access
Agreement 2015-2020 submission to the AER.
Jemena is unique among distribution networks in that it publishes the yearly statistics
of average consumption and number of connections for residential and small business
customers for each council region in Sydney and surrounds. The average household
consumption used for metro household bill calculations was taken for 2012-2014. The
same consumption was assumed for each previous year to remove additional
variables to allow clearer analysis of the pricing components.
For the rural regions, where data was unavailable from a year-to-year basis, the
IPART-assumed consumption for each zone was used.
The Jemena network is large and covers a region that has colder climatic zones up
beyond the Blue Mountains and coastal temperate regions. The colder areas have
approximately double the consumption compared to the entire average across the
region; however they form only a small percentage of the total number of connections.
Figure 82 shows that about 90% of customers connected to the Jemena gas
distribution system in Sydney have an average consumption less than 25 GJ/a and
50% of customers use less than 20 GJ/a, or close to the system average. This could
well be due to smaller homes and units being connected as the city infills, or a range
of other factors such as appliance usage, appliance efficiency and competing fuel use.
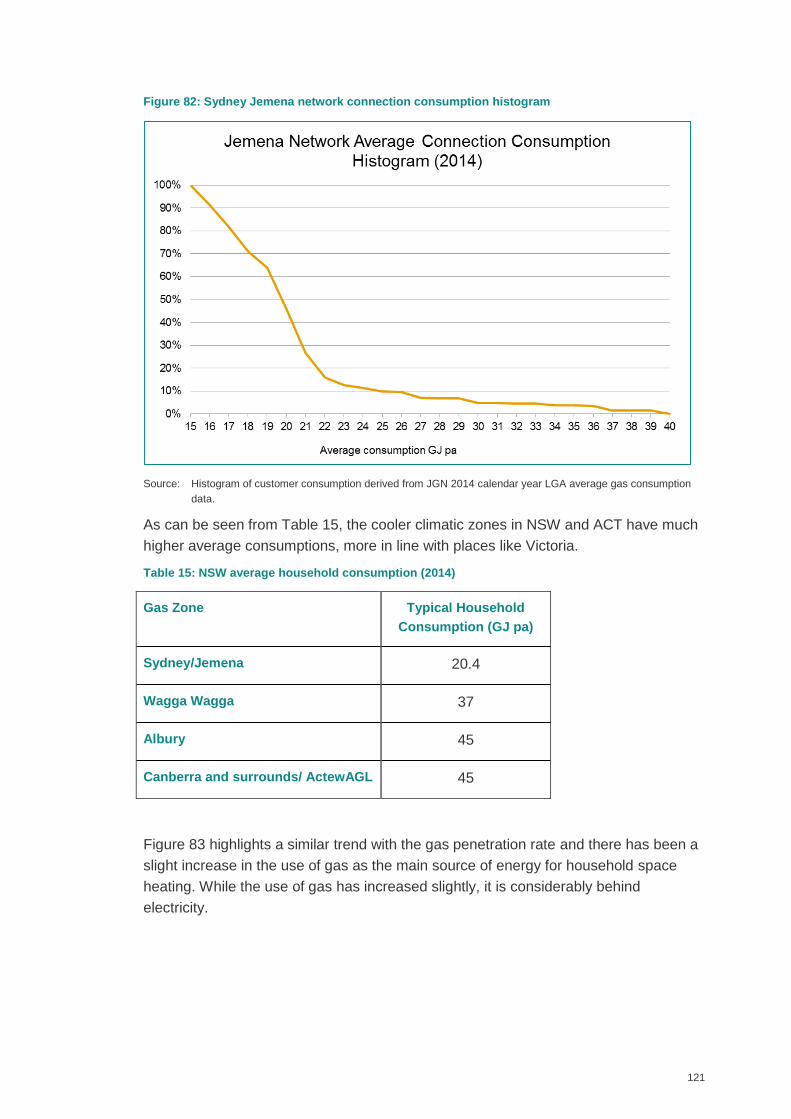
121
Figure 82: Sydney Jemena network connection consumption histogram
Source: Histogram of customer consumption derived from JGN 2014 calendar year LGA average gas consumption
data.
As can be seen from Table 15, the cooler climatic zones in NSW and ACT have much
higher average consumptions, more in line with places like Victoria.
Table 15: NSW average household consumption (2014)
Gas Zone Typical Household
Consumption (GJ pa)
Sydney/Jemena 20.4
Wagga Wagga 37
Albury 45
Canberra and surrounds/ ActewAGL 45
Figure 83 highlights a similar trend with the gas penetration rate and there has been a
slight increase in the use of gas as the main source of energy for household space
heating. While the use of gas has increased slightly, it is considerably behind
electricity.
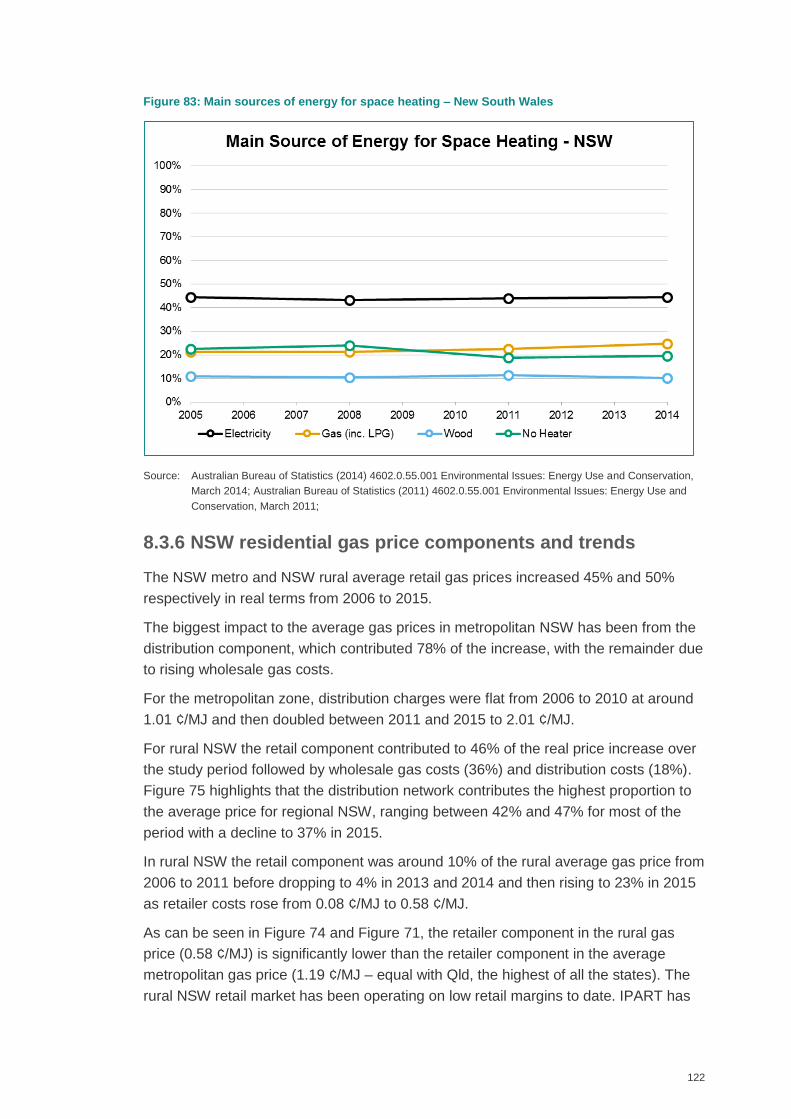
122
Figure 83: Main sources of energy for space heating – New South Wales
Source: Australian Bureau of Statistics (2014) 4602.0.55.001 Environmental Issues: Energy Use and Conservation,
March 2014; Australian Bureau of Statistics (2011) 4602.0.55.001 Environmental Issues: Energy Use and
Conservation, March 2011;
8.3.6 NSW residential gas price components and trends
The NSW metro and NSW rural average retail gas prices increased 45% and 50%
respectively in real terms from 2006 to 2015.
The biggest impact to the average gas prices in metropolitan NSW has been from the
distribution component, which contributed 78% of the increase, with the remainder due
to rising wholesale gas costs.
For the metropolitan zone, distribution charges were flat from 2006 to 2010 at around
1.01 ¢/MJ and then doubled between 2011 and 2015 to 2.01 ¢/MJ.
For rural NSW the retail component contributed to 46% of the real price increase over
the study period followed by wholesale gas costs (36%) and distribution costs (18%).
Figure 75 highlights that the distribution network contributes the highest proportion to
the average price for regional NSW, ranging between 42% and 47% for most of the
period with a decline to 37% in 2015.
In rural NSW the retail component was around 10% of the rural average gas price from
2006 to 2011 before dropping to 4% in 2013 and 2014 and then rising to 23% in 2015
as retailer costs rose from 0.08 ¢/MJ to 0.58 ¢/MJ.
As can be seen in Figure 74 and Figure 71, the retailer component in the rural gas
price (0.58 ¢/MJ) is significantly lower than the retailer component in the average
metropolitan gas price (1.19 ¢/MJ – equal with Qld, the highest of all the states). The
rural NSW retail market has been operating on low retail margins to date. IPART has
123
previously noted that the retail component for Origin Energy’s rural retail pricing is
below the range they consider that balances the longer and shorter term objectives of
a retailer in this market.
AEMO has also commented on these regions and raised concerns that the level of
competition is low due to the low tariffs and small size of the market, which make it
difficult for new entrants. The removal of the carbon price has provided an opportunity
to increase the retail component. This is reflected in the increase in the retail
component of the rural gas price in 2014.
While the wholesale price of gas for rural NSW is similar to that of metro NSW, it
contributes a higher proportion to the rural gas retail price due to the smaller size of
the other components. It has been assumed that the wholesale gas price from the
large industrial analysis is applicable to the rural gas wholesale pricing component
analysis.
The gas transmission component for NSW is mid-range compared to other states in
real terms (0.30 ¢/MJ) and as a proportion to gas costs (8%).
The peak impact of the carbon price was 0.18 ¢/MJ in 2014 where it contributed nearly
5% of the average residential gas price. The carbon price has since been removed
and there are no environmental policies affecting residential gas prices in NSW.
As retail gas pricing is regulated by IPART, the carbon pricing methodology from the
different retailers is transparent. The Scope 1 emissions (upstream supply) varied
between the different retailers depending where the gas is supplied from and the
Scope 3 emissions (customer combustion) were determined using the calculations in
the NGA.
In the determinations from the different retailers, IPART also permitted the retailers to
include processing costs and margins. For example, AGL was allowed a carbon
related operation expenditure as well as an 8% retail margin adjustment. Other state
regulators did not allow these additional cost increases.
8.3.7 Further developments
The recent AER determination of the Jemena access arrangement for 2015-2020 saw
IPART decrease regulated retail gas prices for Sydney residential customers by 7.3%
for 2015/16 due to a reduction of 20.2% in Jemena’s regulated network prices for that
year 60. The final decision saw the AER reject Jemena’s methodology for determining a
rate of return of 7.06% and saw the application of a lower rate of return of 5.41% being
applied due to better global financial conditions61. This has important implications to
60 IPART Fact Sheet, Change in regulated retail gas prices from 1 July 2015, June 2015.
61 AER Final decision: Jemena Gas Networks (NSW) 2015-2020.
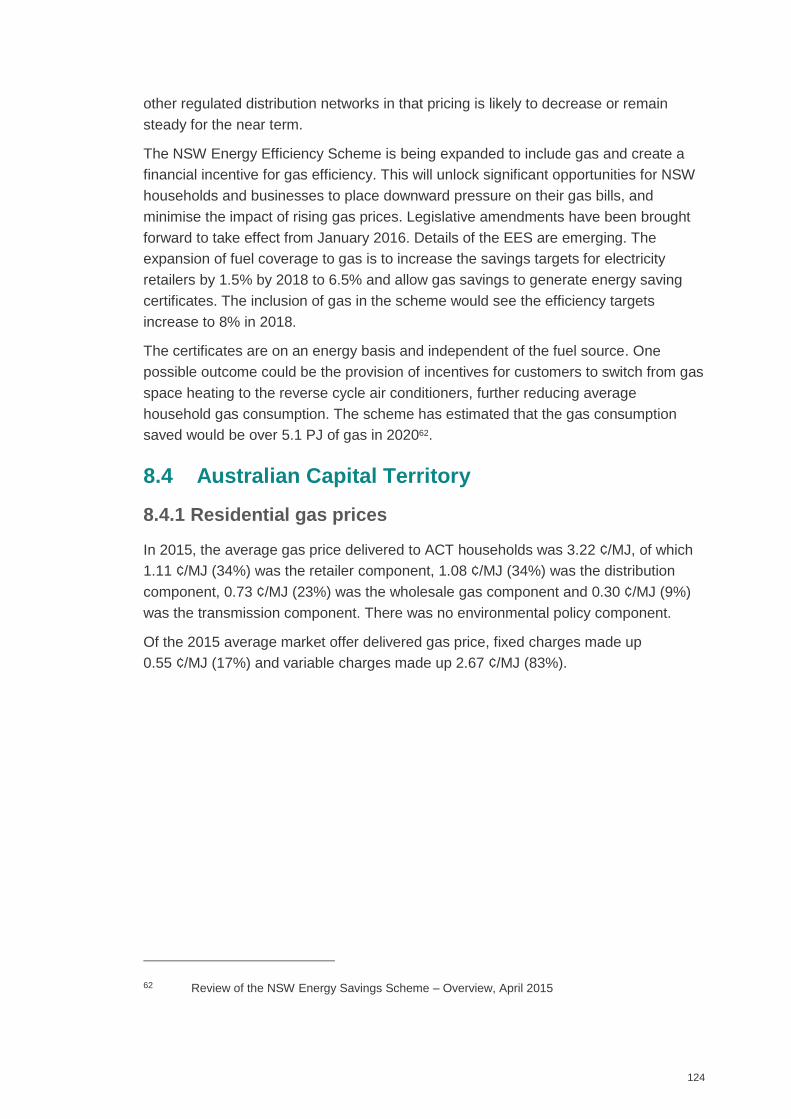
124
other regulated distribution networks in that pricing is likely to decrease or remain
steady for the near term.
The NSW Energy Efficiency Scheme is being expanded to include gas and create a
financial incentive for gas efficiency. This will unlock significant opportunities for NSW
households and businesses to place downward pressure on their gas bills, and
minimise the impact of rising gas prices. Legislative amendments have been brought
forward to take effect from January 2016. Details of the EES are emerging. The
expansion of fuel coverage to gas is to increase the savings targets for electricity
retailers by 1.5% by 2018 to 6.5% and allow gas savings to generate energy saving
certificates. The inclusion of gas in the scheme would see the efficiency targets
increase to 8% in 2018.
The certificates are on an energy basis and independent of the fuel source. One
possible outcome could be the provision of incentives for customers to switch from gas
space heating to the reverse cycle air conditioners, further reducing average
household gas consumption. The scheme has estimated that the gas consumption
saved would be over 5.1 PJ of gas in 202062.
8.4 Australian Capital Territory
8.4.1 Residential gas prices
In 2015, the average gas price delivered to ACT households was 3.22 ¢/MJ, of which
1.11 ¢/MJ (34%) was the retailer component, 1.08 ¢/MJ (34%) was the distribution
component, 0.73 ¢/MJ (23%) was the wholesale gas component and 0.30 ¢/MJ (9%)
was the transmission component. There was no environmental policy component.
Of the 2015 average market offer delivered gas price, fixed charges made up
0.55 ¢/MJ (17%) and variable charges made up 2.67 ¢/MJ (83%).
62 Review of the NSW Energy Savings Scheme – Overview, April 2015
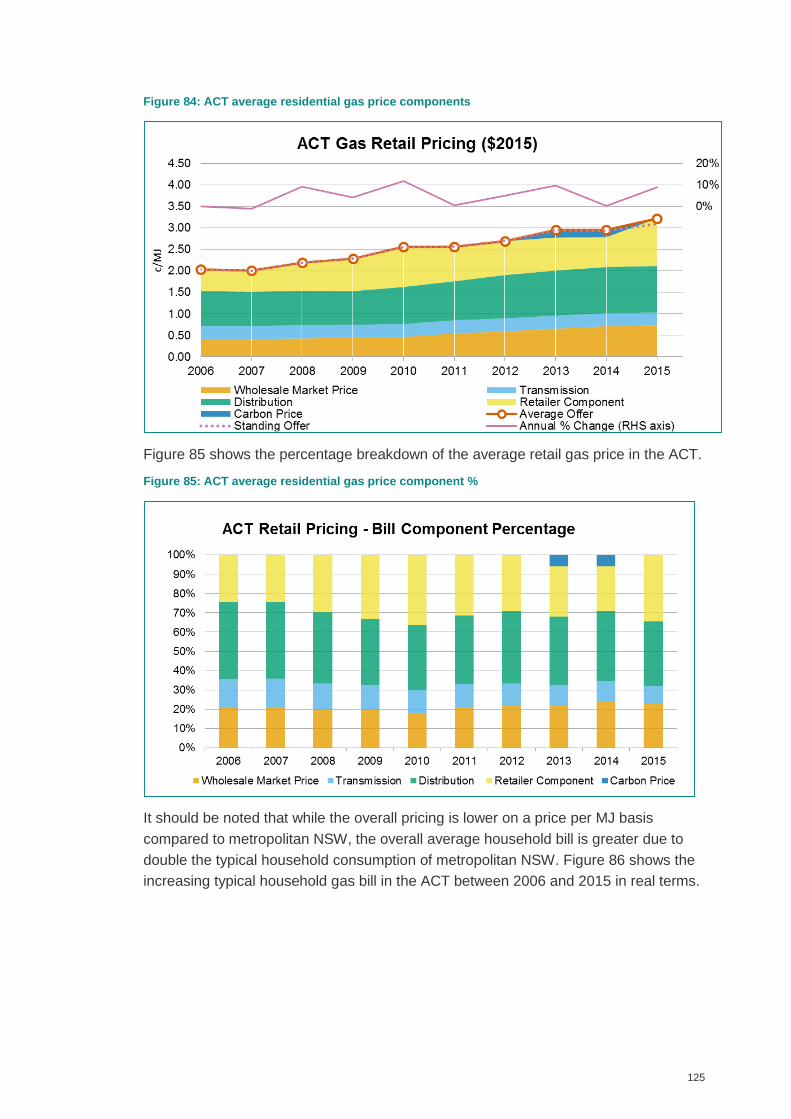
125
Figure 84: ACT average residential gas price components
Figure 85 shows the percentage breakdown of the average retail gas price in the ACT.
Figure 85: ACT average residential gas price component %
It should be noted that while the overall pricing is lower on a price per MJ basis
compared to metropolitan NSW, the overall average household bill is greater due to
double the typical household consumption of metropolitan NSW. Figure 86 shows the
increasing typical household gas bill in the ACT between 2006 and 2015 in real terms.
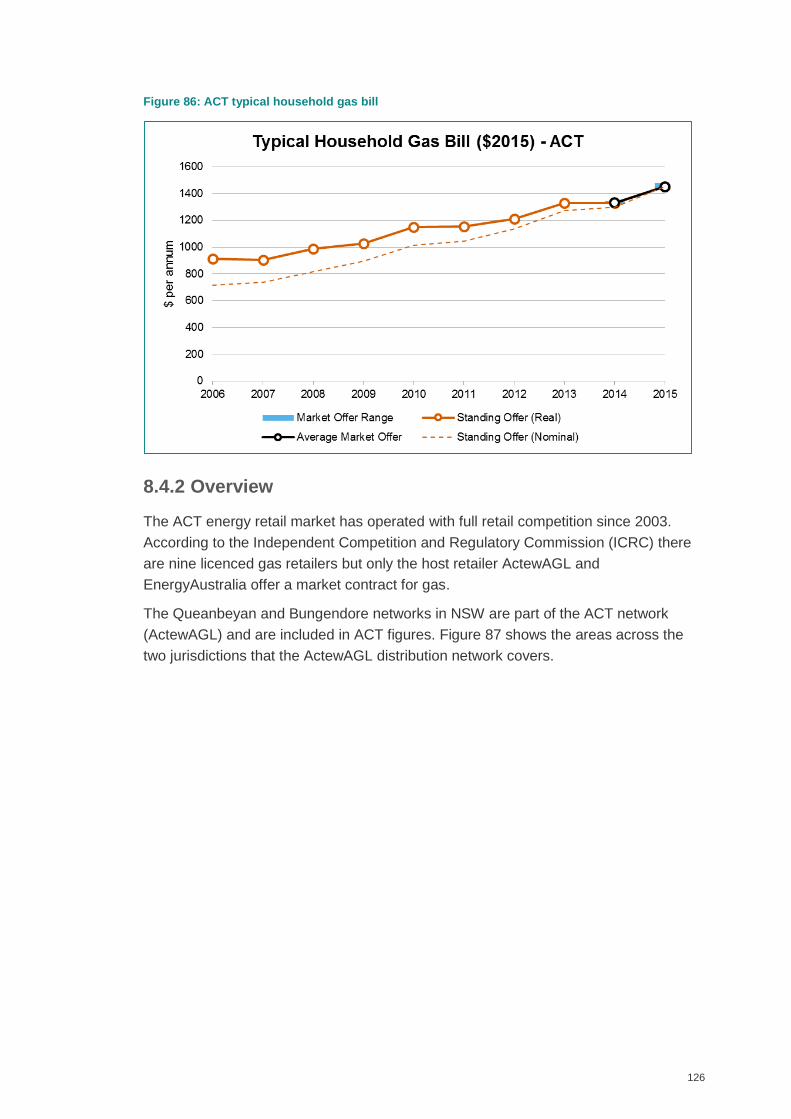
126
Figure 86: ACT typical household gas bill
8.4.2 Overview
The ACT energy retail market has operated with full retail competition since 2003.
According to the Independent Competition and Regulatory Commission (ICRC) there
are nine licenced gas retailers but only the host retailer ActewAGL and
EnergyAustralia offer a market contract for gas.
The Queanbeyan and Bungendore networks in NSW are part of the ACT network
(ActewAGL) and are included in ACT figures. Figure 87 shows the areas across the
two jurisdictions that the ActewAGL distribution network covers.
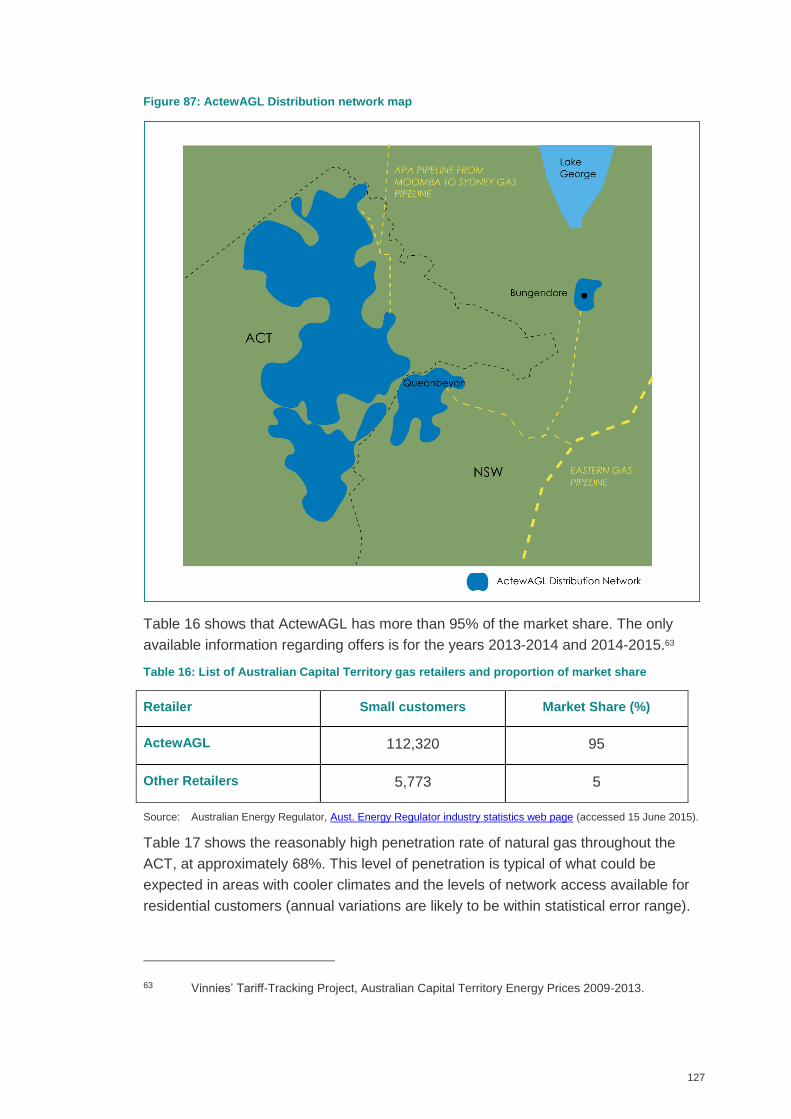
127
Figure 87: ActewAGL Distribution network map
Table 16 shows that ActewAGL has more than 95% of the market share. The only
available information regarding offers is for the years 2013-2014 and 2014-2015.63
Table 16: List of Australian Capital Territory gas retailers and proportion of market share
Retailer Small customers Market Share (%)
ActewAGL 112,320 95
Other Retailers 5,773 5
Source: Australian Energy Regulator, Aust. Energy Regulator industry statistics web page (accessed 15 June 2015).
Table 17 shows the reasonably high penetration rate of natural gas throughout the
ACT, at approximately 68%. This level of penetration is typical of what could be
expected in areas with cooler climates and the levels of network access available for
residential customers (annual variations are likely to be within statistical error range).
63 Vinnies’ Tariff-Tracking Project, Australian Capital Territory Energy Prices 2009-2013.
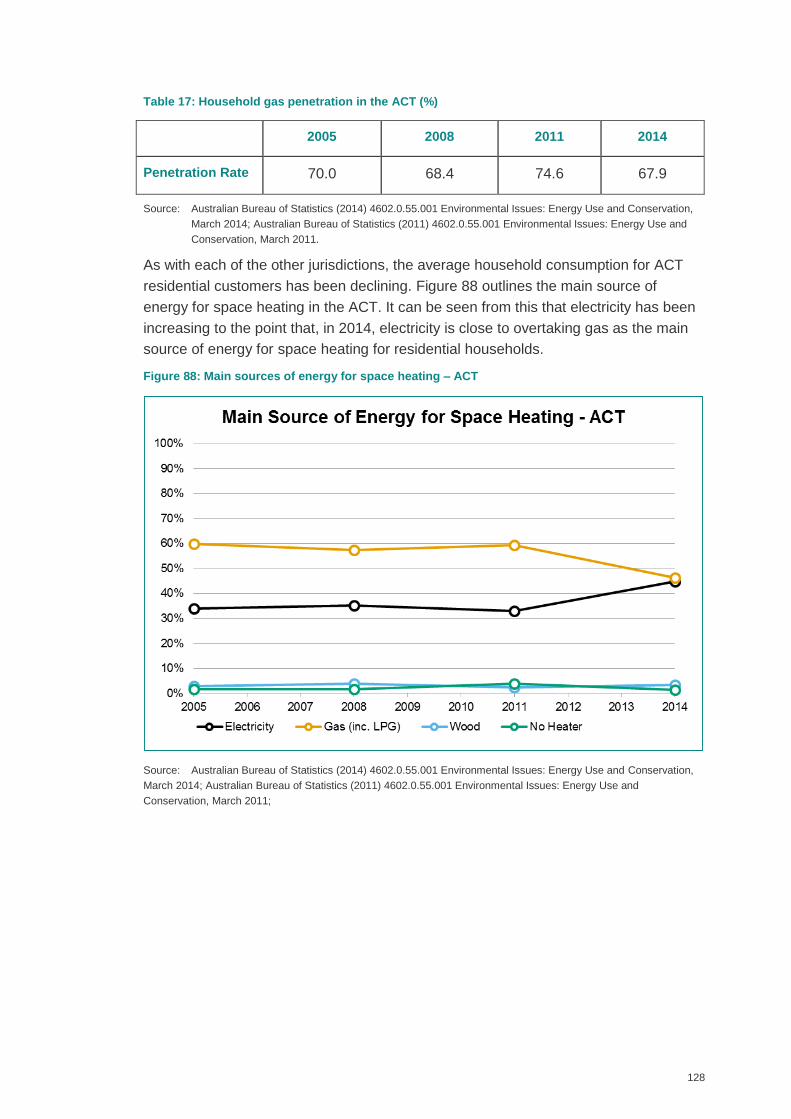
128
Table 17: Household gas penetration in the ACT (%)
2005 2008 2011 2014
Penetration Rate 70.0 68.4 74.6 67.9
Source: Australian Bureau of Statistics (2014) 4602.0.55.001 Environmental Issues: Energy Use and Conservation,
March 2014; Australian Bureau of Statistics (2011) 4602.0.55.001 Environmental Issues: Energy Use and
Conservation, March 2011.
As with each of the other jurisdictions, the average household consumption for ACT
residential customers has been declining. Figure 88 outlines the main source of
energy for space heating in the ACT. It can be seen from this that electricity has been
increasing to the point that, in 2014, electricity is close to overtaking gas as the main
source of energy for space heating for residential households.
Figure 88: Main sources of energy for space heating – ACT
Source: Australian Bureau of Statistics (2014) 4602.0.55.001 Environmental Issues: Energy Use and Conservation,
March 2014; Australian Bureau of Statistics (2011) 4602.0.55.001 Environmental Issues: Energy Use and
Conservation, March 2011;
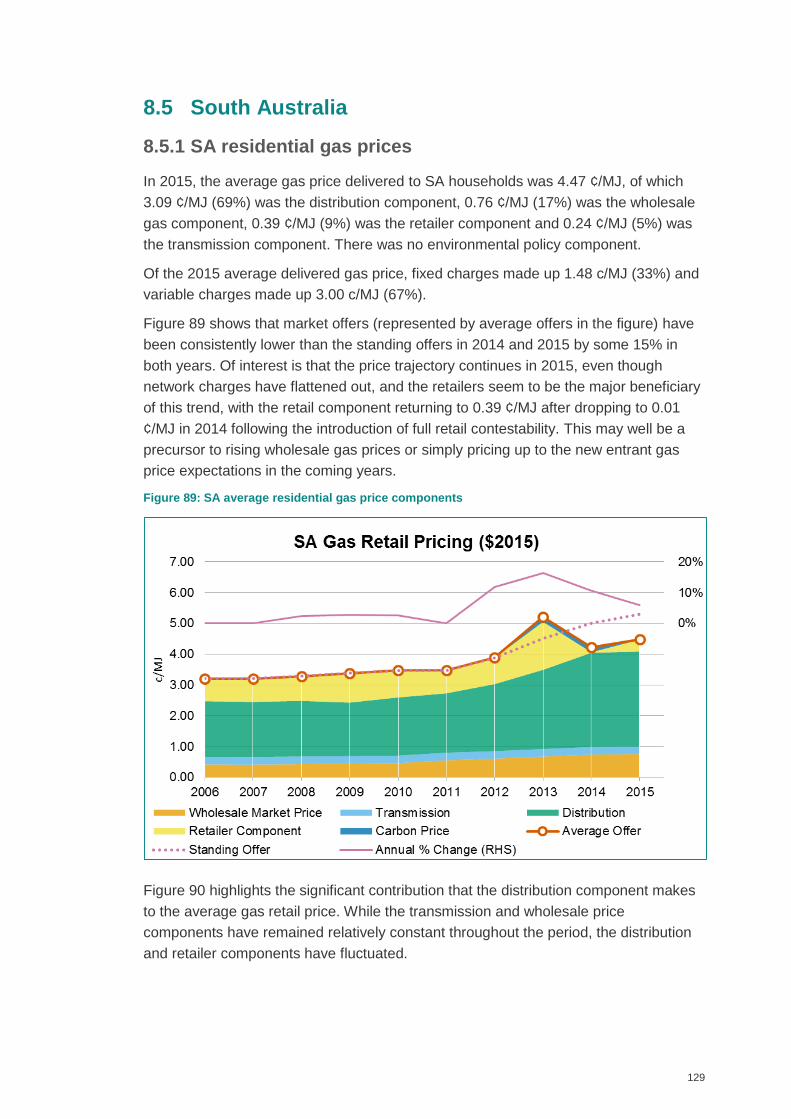
129
8.5 South Australia
8.5.1 SA residential gas prices
In 2015, the average gas price delivered to SA households was 4.47 ¢/MJ, of which
3.09 ¢/MJ (69%) was the distribution component, 0.76 ¢/MJ (17%) was the wholesale
gas component, 0.39 ¢/MJ (9%) was the retailer component and 0.24 ¢/MJ (5%) was
the transmission component. There was no environmental policy component.
Of the 2015 average delivered gas price, fixed charges made up 1.48 c/MJ (33%) and
variable charges made up 3.00 c/MJ (67%).
Figure 89 shows that market offers (represented by average offers in the figure) have
been consistently lower than the standing offers in 2014 and 2015 by some 15% in
both years. Of interest is that the price trajectory continues in 2015, even though
network charges have flattened out, and the retailers seem to be the major beneficiary
of this trend, with the retail component returning to 0.39 ¢/MJ after dropping to 0.01
¢/MJ in 2014 following the introduction of full retail contestability. This may well be a
precursor to rising wholesale gas prices or simply pricing up to the new entrant gas
price expectations in the coming years.
Figure 89: SA average residential gas price components
Figure 90 highlights the significant contribution that the distribution component makes
to the average gas retail price. While the transmission and wholesale price
components have remained relatively constant throughout the period, the distribution
and retailer components have fluctuated.
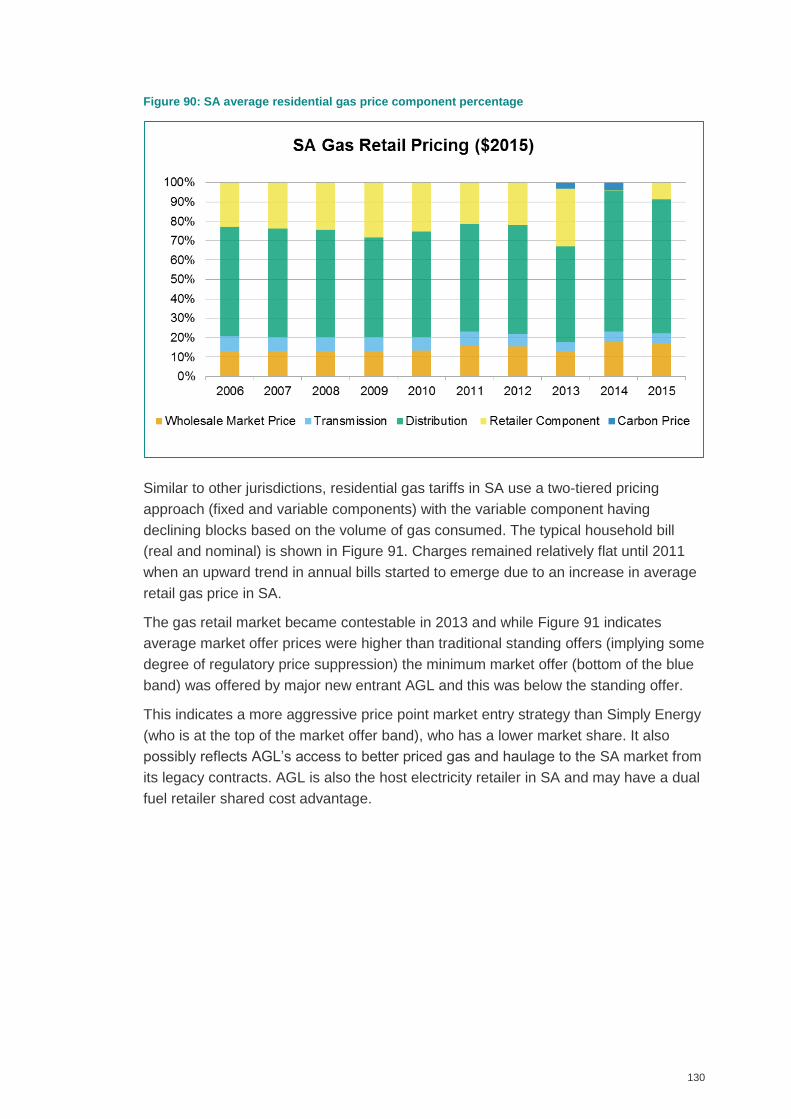
130
Figure 90: SA average residential gas price component percentage
Similar to other jurisdictions, residential gas tariffs in SA use a two-tiered pricing
approach (fixed and variable components) with the variable component having
declining blocks based on the volume of gas consumed. The typical household bill
(real and nominal) is shown in Figure 91. Charges remained relatively flat until 2011
when an upward trend in annual bills started to emerge due to an increase in average
retail gas price in SA.
The gas retail market became contestable in 2013 and while Figure 91 indicates
average market offer prices were higher than traditional standing offers (implying some
degree of regulatory price suppression) the minimum market offer (bottom of the blue
band) was offered by major new entrant AGL and this was below the standing offer.
This indicates a more aggressive price point market entry strategy than Simply Energy
(who is at the top of the market offer band), who has a lower market share. It also
possibly reflects AGL’s access to better priced gas and haulage to the SA market from
its legacy contracts. AGL is also the host electricity retailer in SA and may have a dual
fuel retailer shared cost advantage.
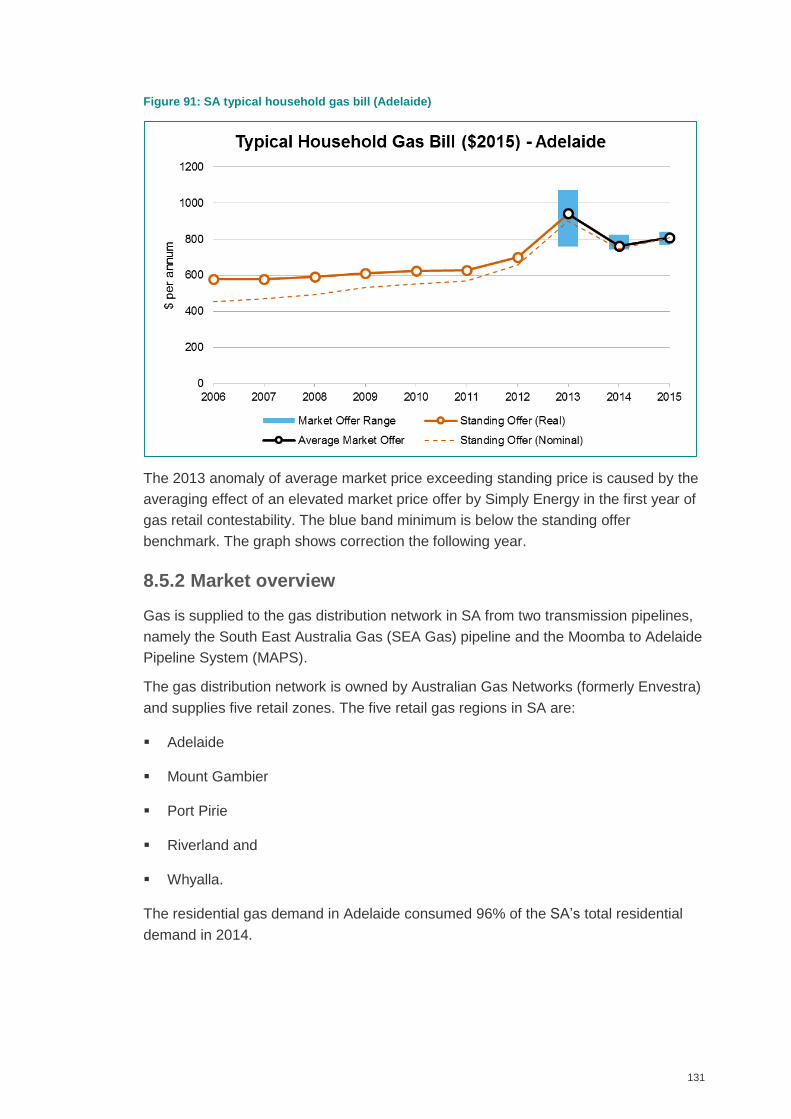
131
Figure 91: SA typical household gas bill (Adelaide)
The 2013 anomaly of average market price exceeding standing price is caused by the
averaging effect of an elevated market price offer by Simply Energy in the first year of
gas retail contestability. The blue band minimum is below the standing offer
benchmark. The graph shows correction the following year.
8.5.2 Market overview
Gas is supplied to the gas distribution network in SA from two transmission pipelines,
namely the South East Australia Gas (SEA Gas) pipeline and the Moomba to Adelaide
Pipeline System (MAPS).
The gas distribution network is owned by Australian Gas Networks (formerly Envestra)
and supplies five retail zones. The five retail gas regions in SA are:
Adelaide
Mount Gambier
Port Pirie
Riverland and
Whyalla.
The residential gas demand in Adelaide consumed 96% of the SA’s total residential
demand in 2014.
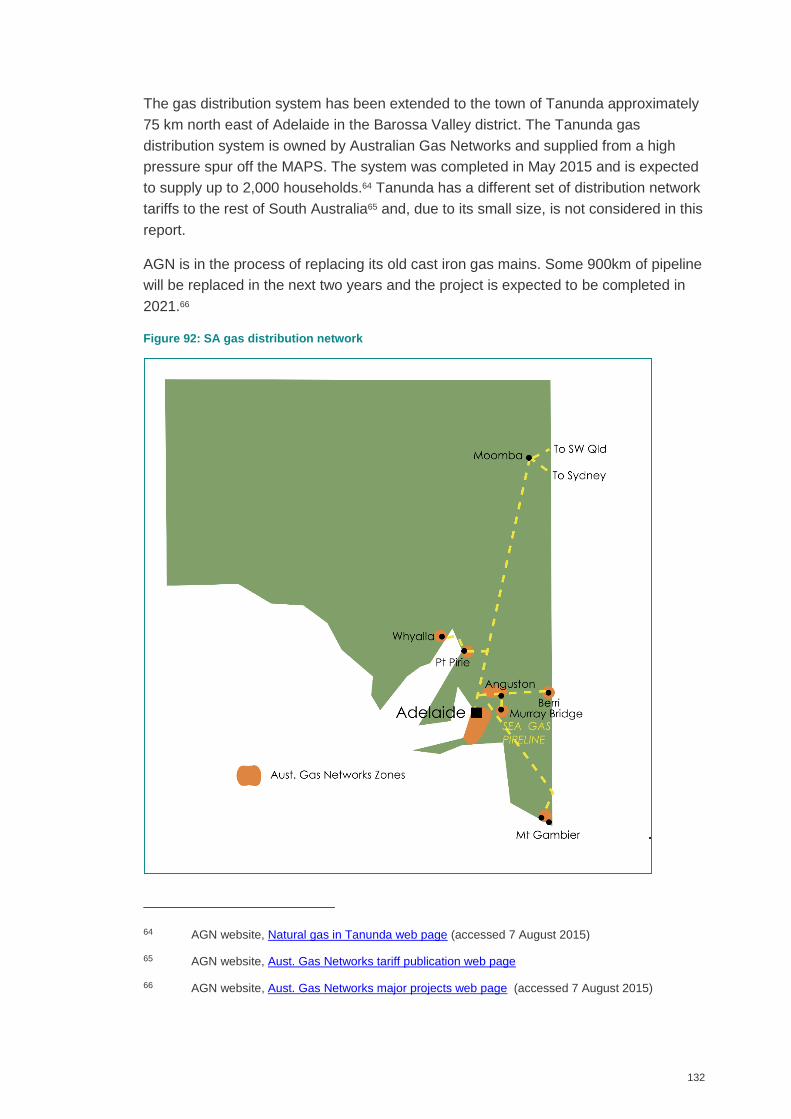
132
The gas distribution system has been extended to the town of Tanunda approximately
75 km north east of Adelaide in the Barossa Valley district. The Tanunda gas
distribution system is owned by Australian Gas Networks and supplied from a high
pressure spur off the MAPS. The system was completed in May 2015 and is expected
to supply up to 2,000 households.64 Tanunda has a different set of distribution network
tariffs to the rest of South Australia65 and, due to its small size, is not considered in this
report.
AGN is in the process of replacing its old cast iron gas mains. Some 900km of pipeline
will be replaced in the next two years and the project is expected to be completed in
2021.66
Figure 92: SA gas distribution network
64 AGN website, Natural gas in Tanunda web page (accessed 7 August 2015)
65 AGN website, Aust. Gas Networks tariff publication web page
66 AGN website, Aust. Gas Networks major projects web page (accessed 7 August 2015)
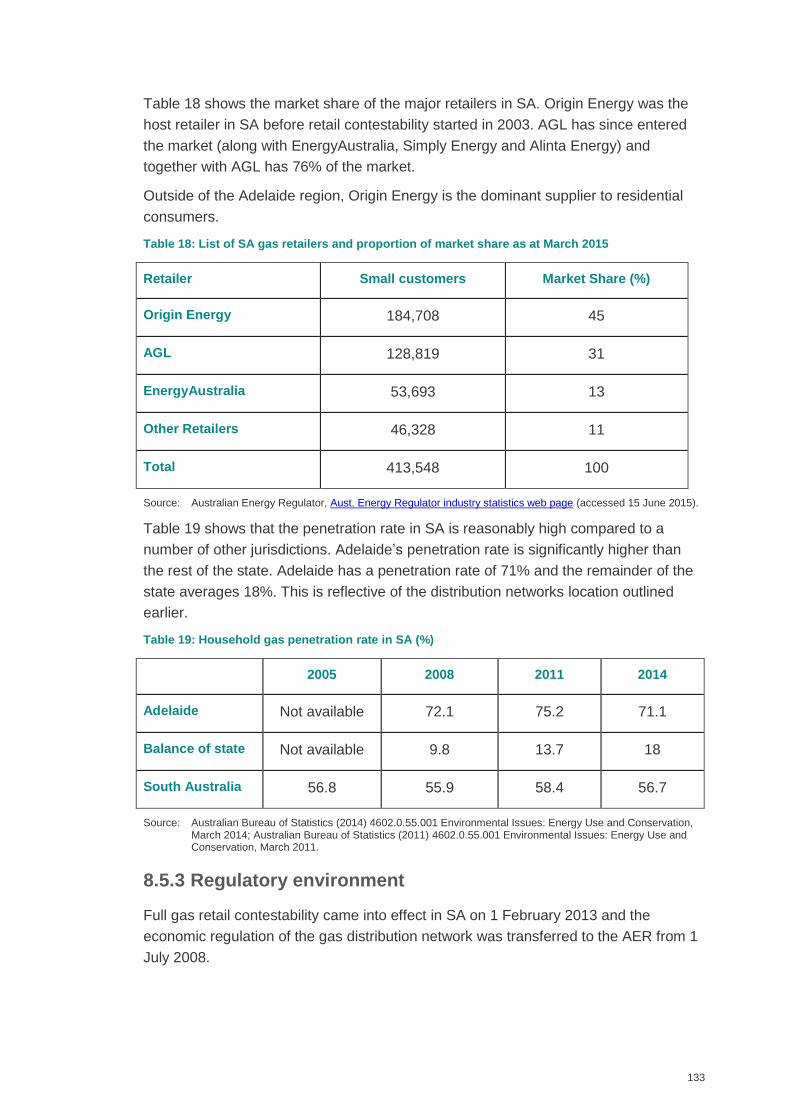
133
Table 18 shows the market share of the major retailers in SA. Origin Energy was the
host retailer in SA before retail contestability started in 2003. AGL has since entered
the market (along with EnergyAustralia, Simply Energy and Alinta Energy) and
together with AGL has 76% of the market.
Outside of the Adelaide region, Origin Energy is the dominant supplier to residential
consumers.
Table 18: List of SA gas retailers and proportion of market share as at March 2015
Retailer Small customers Market Share (%)
Origin Energy 184,708 45
AGL 128,819 31
EnergyAustralia 53,693 13
Other Retailers 46,328 11
Total 413,548 100
Source: Australian Energy Regulator, Aust. Energy Regulator industry statistics web page (accessed 15 June 2015).
Table 19 shows that the penetration rate in SA is reasonably high compared to a
number of other jurisdictions. Adelaide’s penetration rate is significantly higher than
the rest of the state. Adelaide has a penetration rate of 71% and the remainder of the
state averages 18%. This is reflective of the distribution networks location outlined
earlier.
Table 19: Household gas penetration rate in SA (%)
2005 2008 2011 2014
Adelaide Not available 72.1 75.2 71.1
Balance of state Not available 9.8 13.7 18
South Australia 56.8 55.9 58.4 56.7
Source: Australian Bureau of Statistics (2014) 4602.0.55.001 Environmental Issues: Energy Use and Conservation, March 2014; Australian Bureau of Statistics (2011) 4602.0.55.001 Environmental Issues: Energy Use and Conservation, March 2011.
8.5.3 Regulatory environment
Full gas retail contestability came into effect in SA on 1 February 2013 and the
economic regulation of the gas distribution network was transferred to the AER from 1
July 2008.
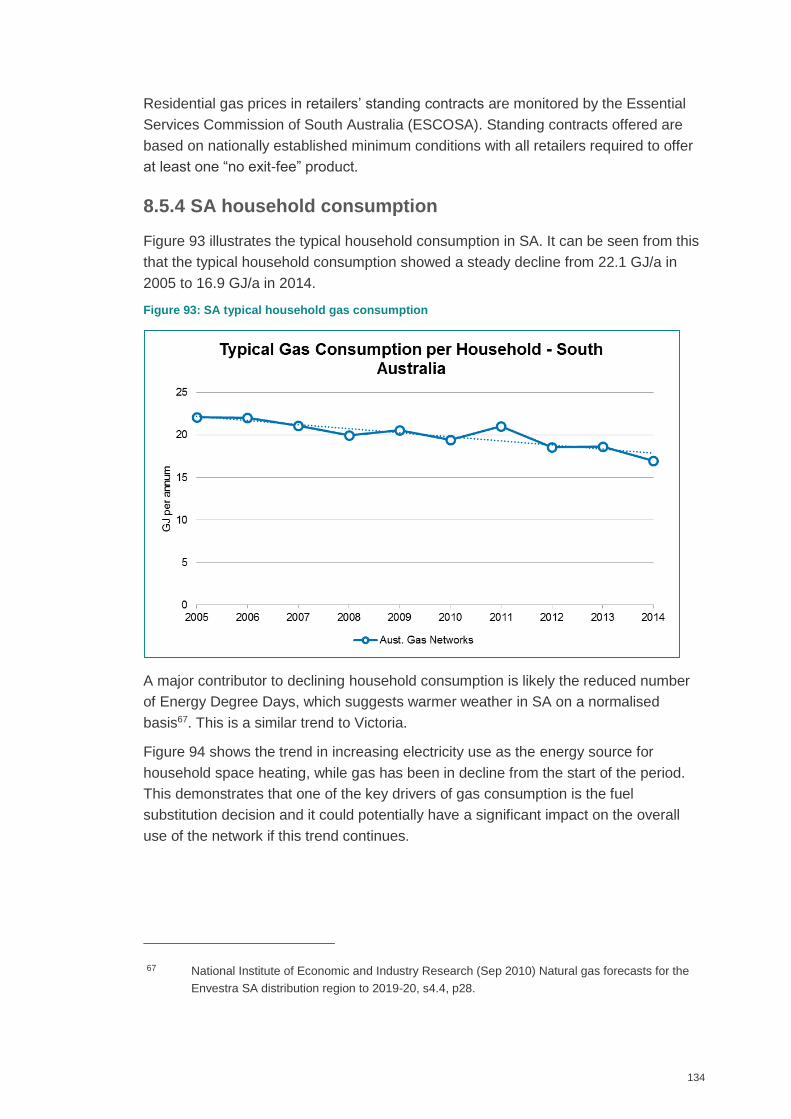
134
Residential gas prices in retailers’ standing contracts are monitored by the Essential
Services Commission of South Australia (ESCOSA). Standing contracts offered are
based on nationally established minimum conditions with all retailers required to offer
at least one “no exit-fee” product.
8.5.4 SA household consumption
Figure 93 illustrates the typical household consumption in SA. It can be seen from this
that the typical household consumption showed a steady decline from 22.1 GJ/a in
2005 to 16.9 GJ/a in 2014.
Figure 93: SA typical household gas consumption
A major contributor to declining household consumption is likely the reduced number
of Energy Degree Days, which suggests warmer weather in SA on a normalised
basis67. This is a similar trend to Victoria.
Figure 94 shows the trend in increasing electricity use as the energy source for
household space heating, while gas has been in decline from the start of the period.
This demonstrates that one of the key drivers of gas consumption is the fuel
substitution decision and it could potentially have a significant impact on the overall
use of the network if this trend continues.
67 National Institute of Economic and Industry Research (Sep 2010) Natural gas forecasts for the
Envestra SA distribution region to 2019-20, s4.4, p28.
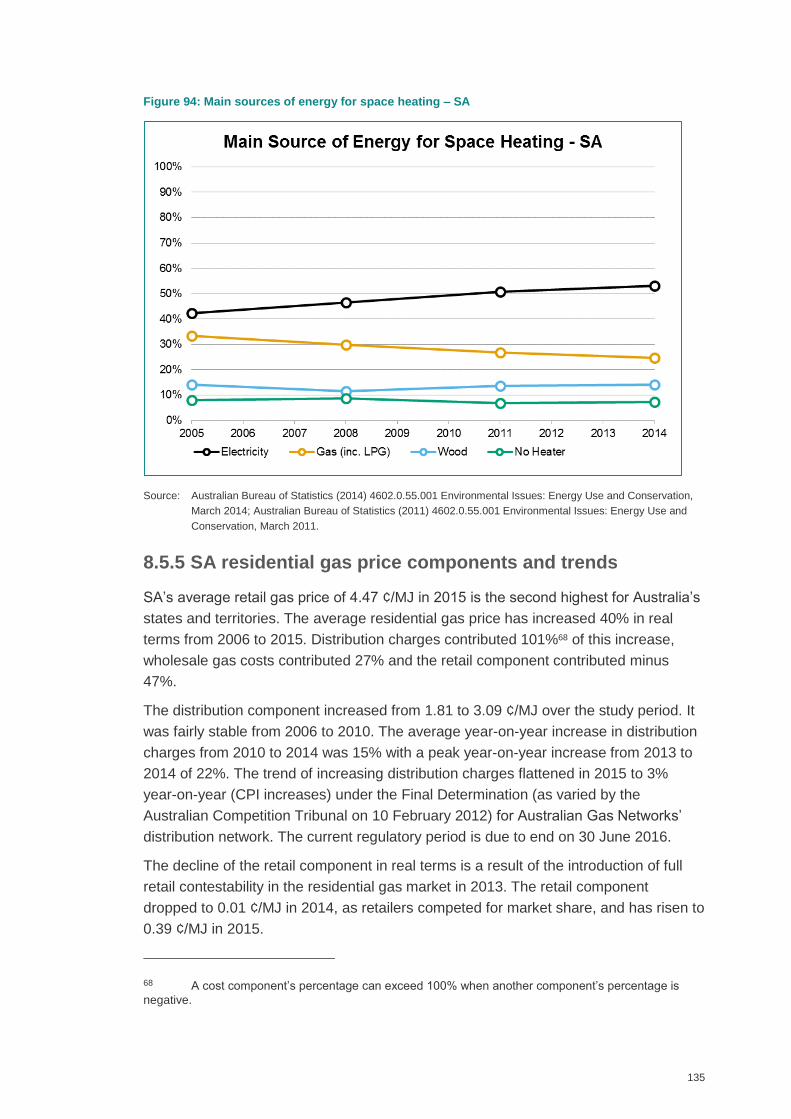
135
Figure 94: Main sources of energy for space heating – SA
Source: Australian Bureau of Statistics (2014) 4602.0.55.001 Environmental Issues: Energy Use and Conservation,
March 2014; Australian Bureau of Statistics (2011) 4602.0.55.001 Environmental Issues: Energy Use and
Conservation, March 2011.
8.5.5 SA residential gas price components and trends
SA’s average retail gas price of 4.47 ¢/MJ in 2015 is the second highest for Australia’s
states and territories. The average residential gas price has increased 40% in real
terms from 2006 to 2015. Distribution charges contributed 101%68 of this increase,
wholesale gas costs contributed 27% and the retail component contributed minus
47%.
The distribution component increased from 1.81 to 3.09 ¢/MJ over the study period. It
was fairly stable from 2006 to 2010. The average year-on-year increase in distribution
charges from 2010 to 2014 was 15% with a peak year-on-year increase from 2013 to
2014 of 22%. The trend of increasing distribution charges flattened in 2015 to 3%
year-on-year (CPI increases) under the Final Determination (as varied by the
Australian Competition Tribunal on 10 February 2012) for Australian Gas Networks’
distribution network. The current regulatory period is due to end on 30 June 2016.
The decline of the retail component in real terms is a result of the introduction of full
retail contestability in the residential gas market in 2013. The retail component
dropped to 0.01 ¢/MJ in 2014, as retailers competed for market share, and has risen to
0.39 ¢/MJ in 2015.
68 A cost component’s percentage can exceed 100% when another component’s percentage is
negative.
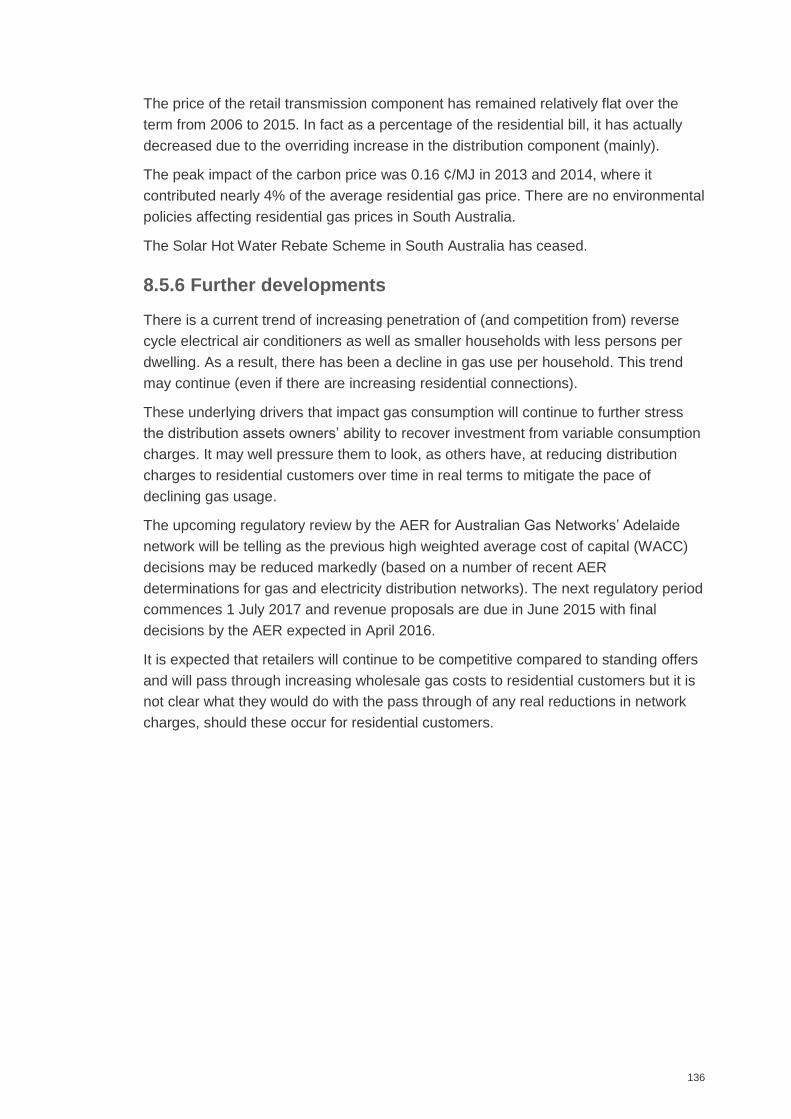
136
The price of the retail transmission component has remained relatively flat over the
term from 2006 to 2015. In fact as a percentage of the residential bill, it has actually
decreased due to the overriding increase in the distribution component (mainly).
The peak impact of the carbon price was 0.16 ¢/MJ in 2013 and 2014, where it
contributed nearly 4% of the average residential gas price. There are no environmental
policies affecting residential gas prices in South Australia.
The Solar Hot Water Rebate Scheme in South Australia has ceased.
8.5.6 Further developments
There is a current trend of increasing penetration of (and competition from) reverse
cycle electrical air conditioners as well as smaller households with less persons per
dwelling. As a result, there has been a decline in gas use per household. This trend
may continue (even if there are increasing residential connections).
These underlying drivers that impact gas consumption will continue to further stress
the distribution assets owners’ ability to recover investment from variable consumption
charges. It may well pressure them to look, as others have, at reducing distribution
charges to residential customers over time in real terms to mitigate the pace of
declining gas usage.
The upcoming regulatory review by the AER for Australian Gas Networks’ Adelaide
network will be telling as the previous high weighted average cost of capital (WACC)
decisions may be reduced markedly (based on a number of recent AER
determinations for gas and electricity distribution networks). The next regulatory period
commences 1 July 2017 and revenue proposals are due in June 2015 with final
decisions by the AER expected in April 2016.
It is expected that retailers will continue to be competitive compared to standing offers
and will pass through increasing wholesale gas costs to residential customers but it is
not clear what they would do with the pass through of any real reductions in network
charges, should these occur for residential customers.
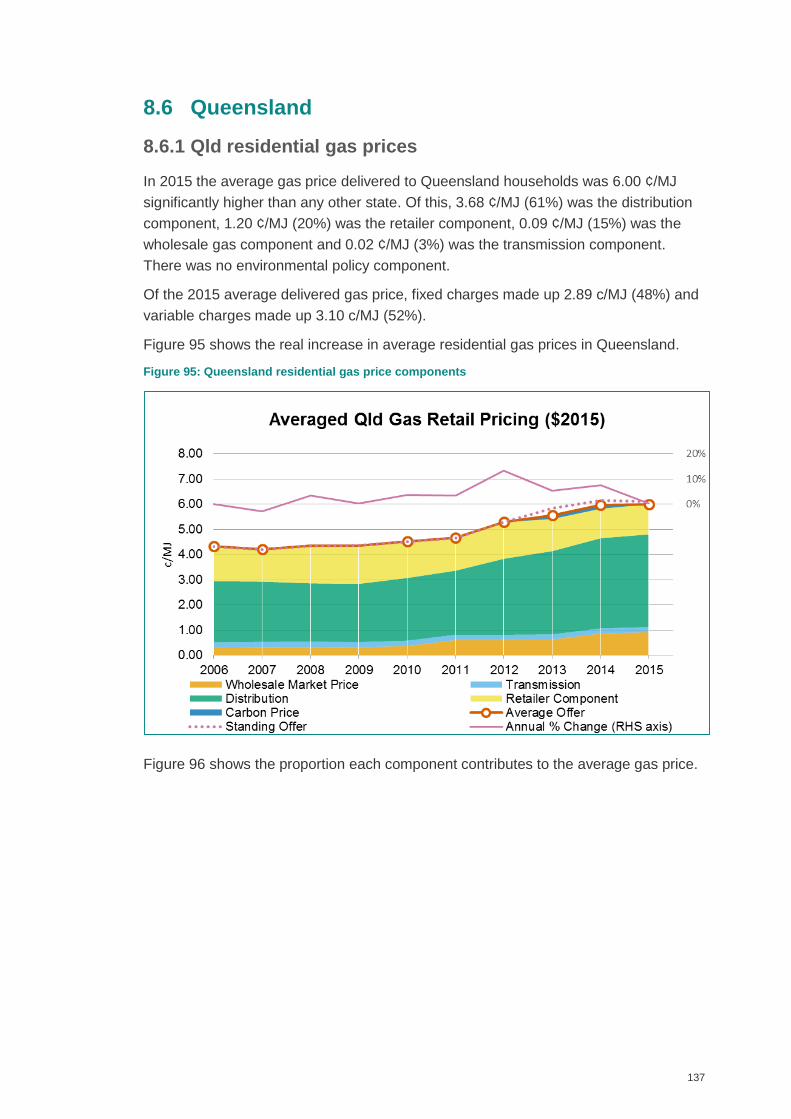
137
8.6 Queensland
8.6.1 Qld residential gas prices
In 2015 the average gas price delivered to Queensland households was 6.00 ¢/MJ
significantly higher than any other state. Of this, 3.68 ¢/MJ (61%) was the distribution
component, 1.20 ¢/MJ (20%) was the retailer component, 0.09 ¢/MJ (15%) was the
wholesale gas component and 0.02 ¢/MJ (3%) was the transmission component.
There was no environmental policy component.
Of the 2015 average delivered gas price, fixed charges made up 2.89 c/MJ (48%) and
variable charges made up 3.10 c/MJ (52%).
Figure 95 shows the real increase in average residential gas prices in Queensland.
Figure 95: Queensland residential gas price components
Figure 96 shows the proportion each component contributes to the average gas price.
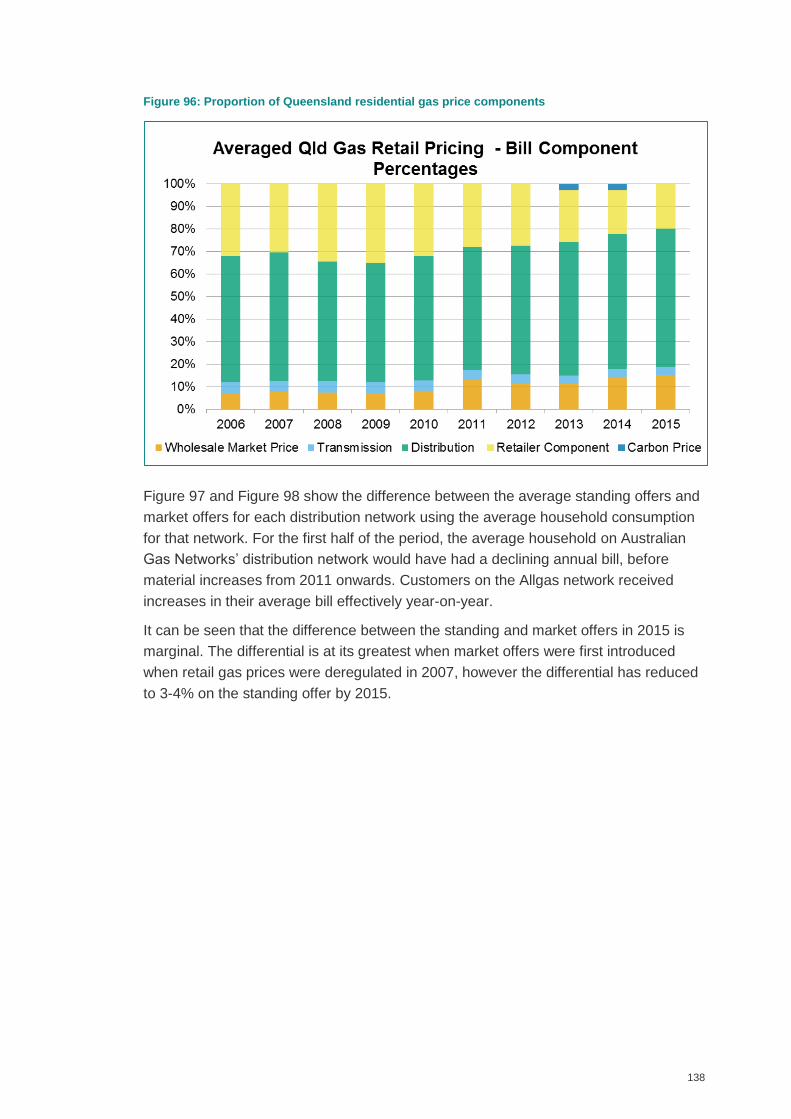
138
Figure 96: Proportion of Queensland residential gas price components
Figure 97 and Figure 98 show the difference between the average standing offers and
market offers for each distribution network using the average household consumption
for that network. For the first half of the period, the average household on Australian
Gas Networks’ distribution network would have had a declining annual bill, before
material increases from 2011 onwards. Customers on the Allgas network received
increases in their average bill effectively year-on-year.
It can be seen that the difference between the standing and market offers in 2015 is
marginal. The differential is at its greatest when market offers were first introduced
when retail gas prices were deregulated in 2007, however the differential has reduced
to 3-4% on the standing offer by 2015.
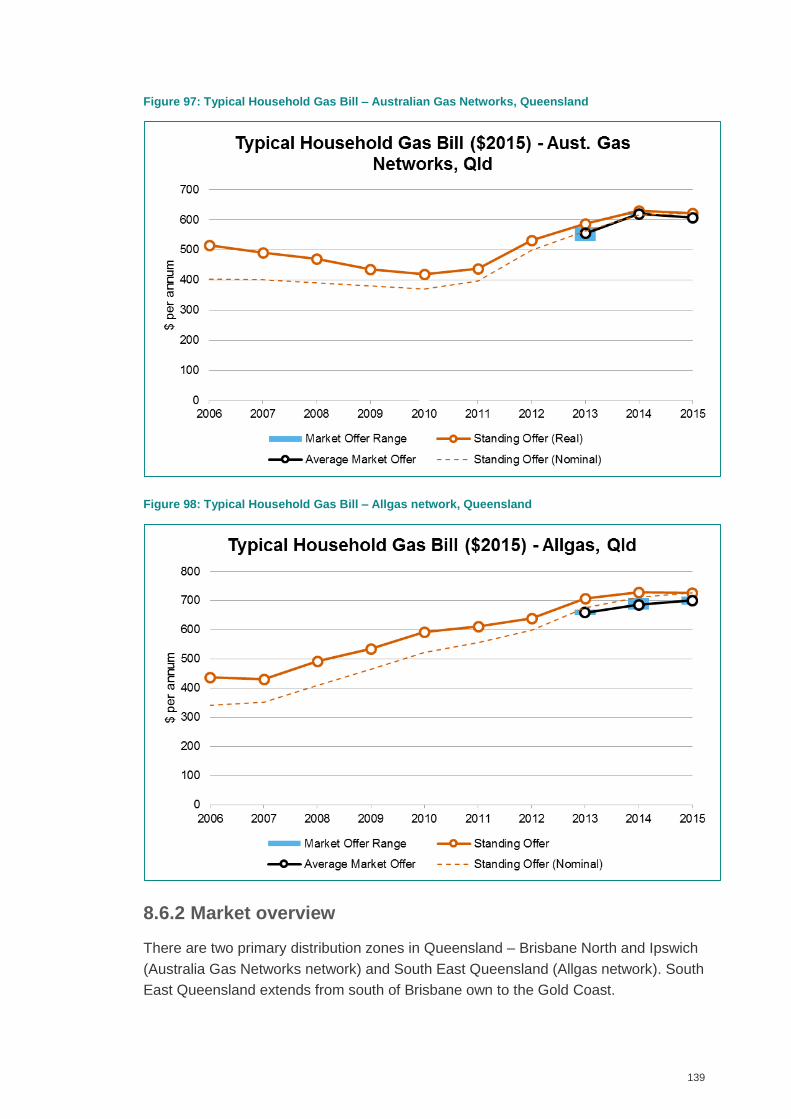
139
Figure 97: Typical Household Gas Bill – Australian Gas Networks, Queensland
Figure 98: Typical Household Gas Bill – Allgas network, Queensland
8.6.2 Market overview
There are two primary distribution zones in Queensland – Brisbane North and Ipswich
(Australia Gas Networks network) and South East Queensland (Allgas network). South
East Queensland extends from south of Brisbane own to the Gold Coast.
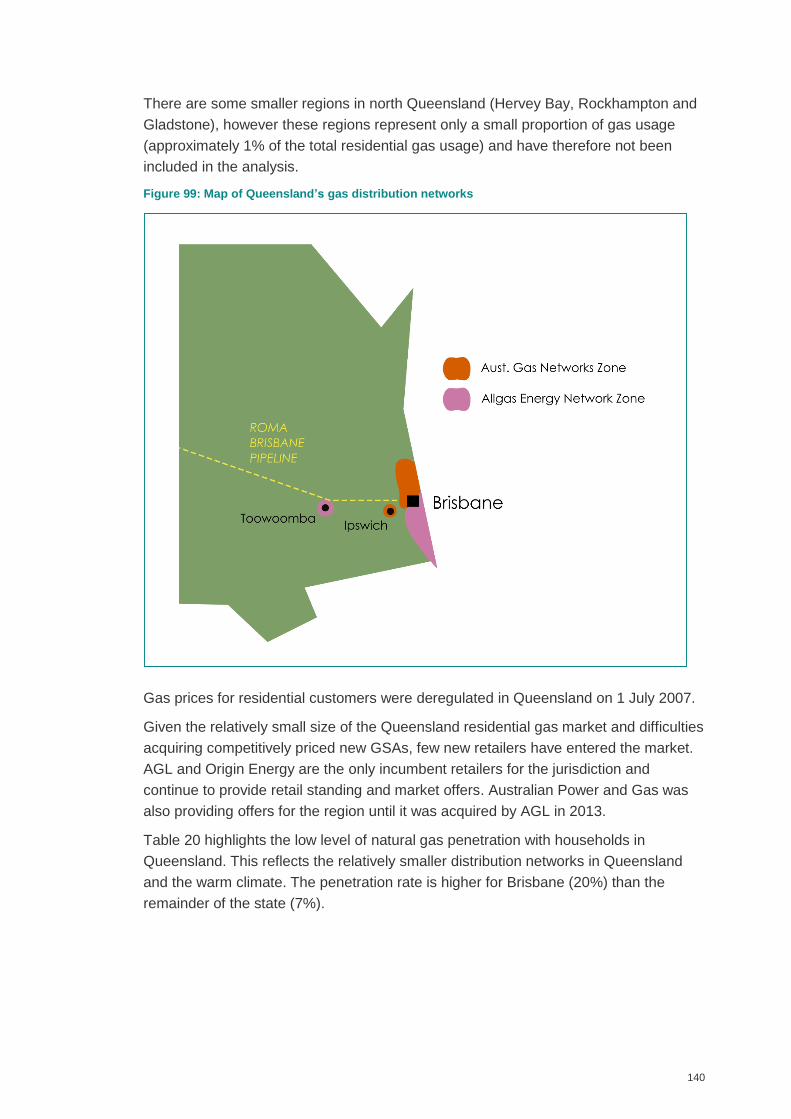
140
There are some smaller regions in north Queensland (Hervey Bay, Rockhampton and
Gladstone), however these regions represent only a small proportion of gas usage
(approximately 1% of the total residential gas usage) and have therefore not been
included in the analysis.
Figure 99: Map of Queensland’s gas distribution networks
Gas prices for residential customers were deregulated in Queensland on 1 July 2007.
Given the relatively small size of the Queensland residential gas market and difficulties
acquiring competitively priced new GSAs, few new retailers have entered the market.
AGL and Origin Energy are the only incumbent retailers for the jurisdiction and
continue to provide retail standing and market offers. Australian Power and Gas was
also providing offers for the region until it was acquired by AGL in 2013.
Table 20 highlights the low level of natural gas penetration with households in
Queensland. This reflects the relatively smaller distribution networks in Queensland
and the warm climate. The penetration rate is higher for Brisbane (20%) than the
remainder of the state (7%).
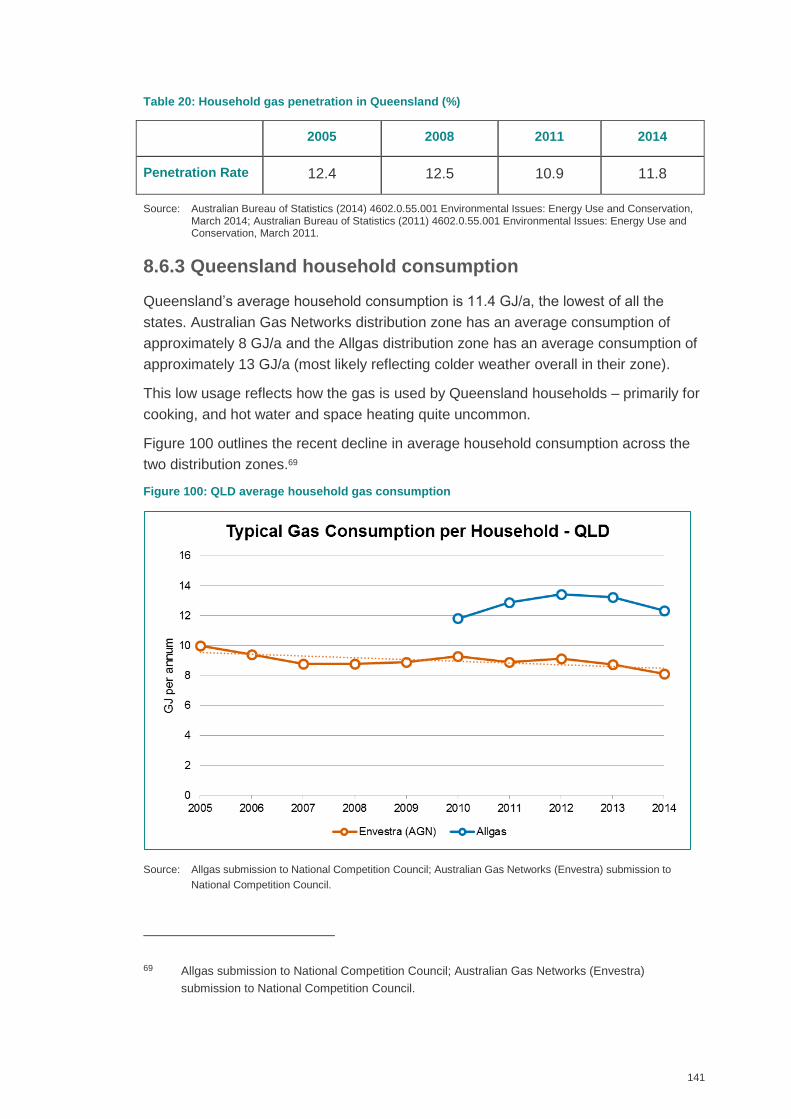
141
Table 20: Household gas penetration in Queensland (%)
2005 2008 2011 2014
Penetration Rate 12.4 12.5 10.9 11.8
Source: Australian Bureau of Statistics (2014) 4602.0.55.001 Environmental Issues: Energy Use and Conservation, March 2014; Australian Bureau of Statistics (2011) 4602.0.55.001 Environmental Issues: Energy Use and Conservation, March 2011.
8.6.3 Queensland household consumption
Queensland’s average household consumption is 11.4 GJ/a, the lowest of all the
states. Australian Gas Networks distribution zone has an average consumption of
approximately 8 GJ/a and the Allgas distribution zone has an average consumption of
approximately 13 GJ/a (most likely reflecting colder weather overall in their zone).
This low usage reflects how the gas is used by Queensland households – primarily for
cooking, and hot water and space heating quite uncommon.
Figure 100 outlines the recent decline in average household consumption across the
two distribution zones.69
Figure 100: QLD average household gas consumption
Source: Allgas submission to National Competition Council; Australian Gas Networks (Envestra) submission to
National Competition Council.
69 Allgas submission to National Competition Council; Australian Gas Networks (Envestra)
submission to National Competition Council.
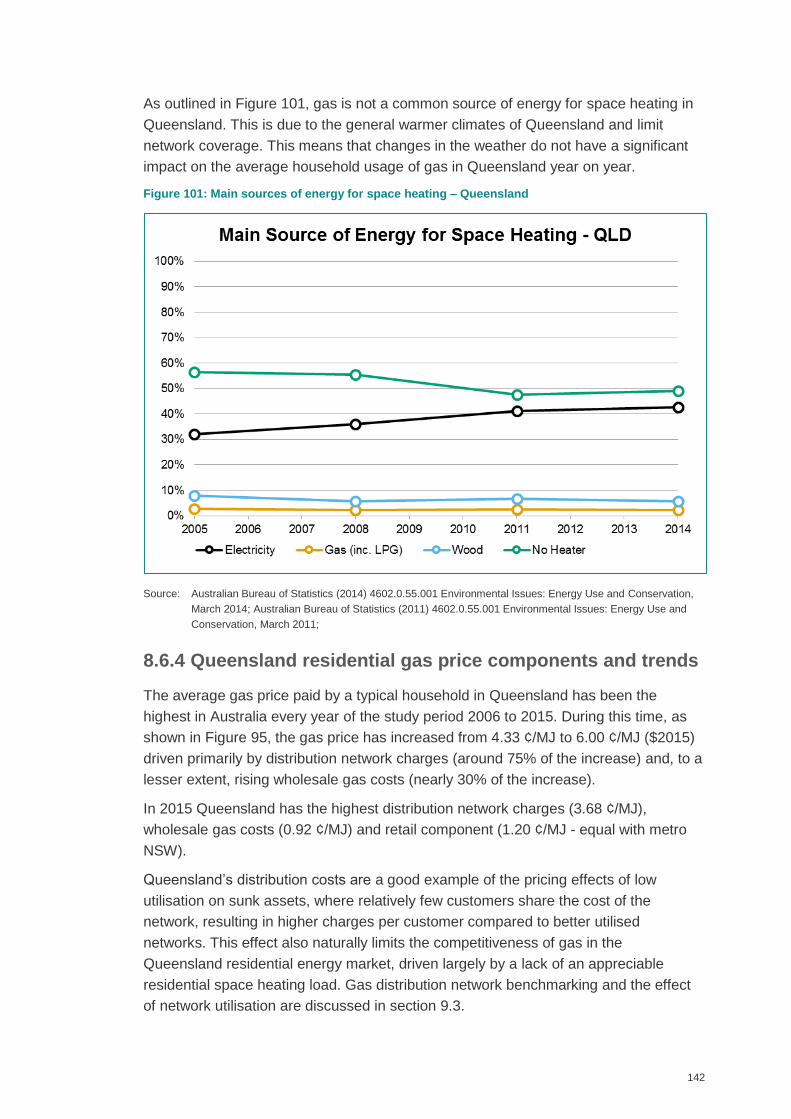
142
As outlined in Figure 101, gas is not a common source of energy for space heating in
Queensland. This is due to the general warmer climates of Queensland and limit
network coverage. This means that changes in the weather do not have a significant
impact on the average household usage of gas in Queensland year on year.
Figure 101: Main sources of energy for space heating – Queensland
Source: Australian Bureau of Statistics (2014) 4602.0.55.001 Environmental Issues: Energy Use and Conservation,
March 2014; Australian Bureau of Statistics (2011) 4602.0.55.001 Environmental Issues: Energy Use and
Conservation, March 2011;
8.6.4 Queensland residential gas price components and trends
The average gas price paid by a typical household in Queensland has been the
highest in Australia every year of the study period 2006 to 2015. During this time, as
shown in Figure 95, the gas price has increased from 4.33 ¢/MJ to 6.00 ¢/MJ ($2015)
driven primarily by distribution network charges (around 75% of the increase) and, to a
lesser extent, rising wholesale gas costs (nearly 30% of the increase).
In 2015 Queensland has the highest distribution network charges (3.68 ¢/MJ),
wholesale gas costs (0.92 ¢/MJ) and retail component (1.20 ¢/MJ - equal with metro
NSW).
Queensland’s distribution costs are a good example of the pricing effects of low
utilisation on sunk assets, where relatively few customers share the cost of the
network, resulting in higher charges per customer compared to better utilised
networks. This effect also naturally limits the competitiveness of gas in the
Queensland residential energy market, driven largely by a lack of an appreciable
residential space heating load. Gas distribution network benchmarking and the effect
of network utilisation are discussed in section 9.3.
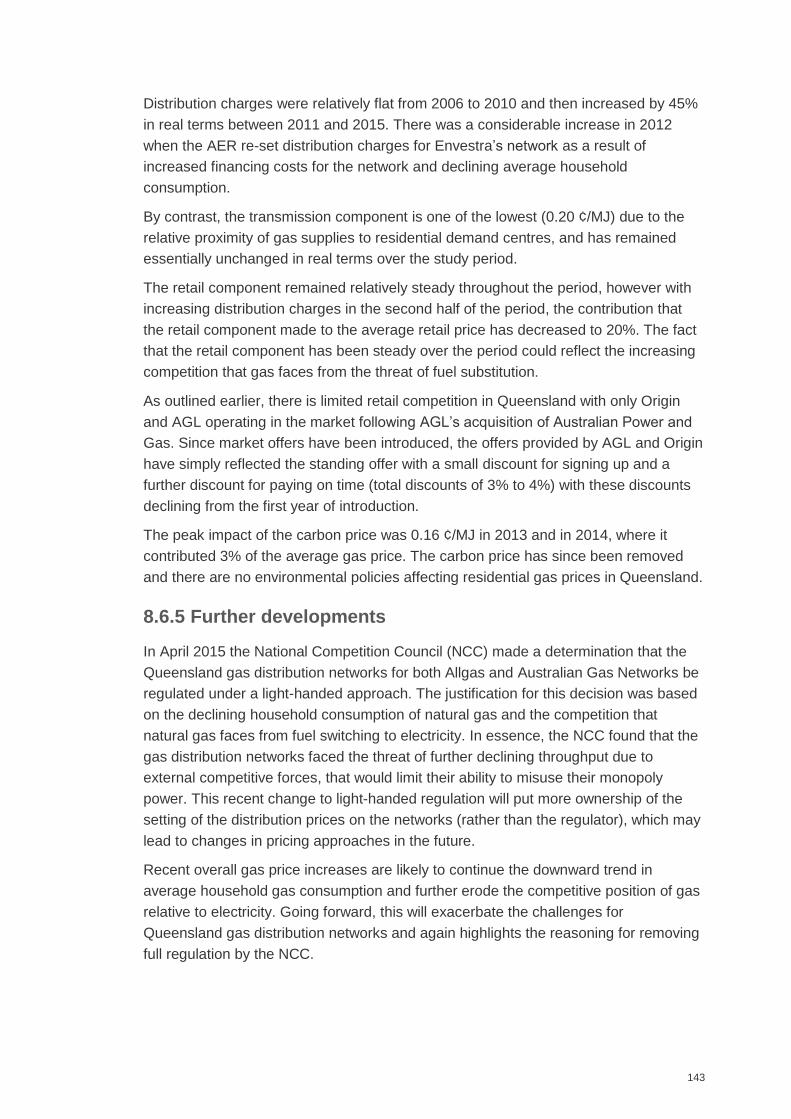
143
Distribution charges were relatively flat from 2006 to 2010 and then increased by 45%
in real terms between 2011 and 2015. There was a considerable increase in 2012
when the AER re-set distribution charges for Envestra’s network as a result of
increased financing costs for the network and declining average household
consumption.
By contrast, the transmission component is one of the lowest (0.20 ¢/MJ) due to the
relative proximity of gas supplies to residential demand centres, and has remained
essentially unchanged in real terms over the study period.
The retail component remained relatively steady throughout the period, however with
increasing distribution charges in the second half of the period, the contribution that
the retail component made to the average retail price has decreased to 20%. The fact
that the retail component has been steady over the period could reflect the increasing
competition that gas faces from the threat of fuel substitution.
As outlined earlier, there is limited retail competition in Queensland with only Origin
and AGL operating in the market following AGL’s acquisition of Australian Power and
Gas. Since market offers have been introduced, the offers provided by AGL and Origin
have simply reflected the standing offer with a small discount for signing up and a
further discount for paying on time (total discounts of 3% to 4%) with these discounts
declining from the first year of introduction.
The peak impact of the carbon price was 0.16 ¢/MJ in 2013 and in 2014, where it
contributed 3% of the average gas price. The carbon price has since been removed
and there are no environmental policies affecting residential gas prices in Queensland.
8.6.5 Further developments
In April 2015 the National Competition Council (NCC) made a determination that the
Queensland gas distribution networks for both Allgas and Australian Gas Networks be
regulated under a light-handed approach. The justification for this decision was based
on the declining household consumption of natural gas and the competition that
natural gas faces from fuel switching to electricity. In essence, the NCC found that the
gas distribution networks faced the threat of further declining throughput due to
external competitive forces, that would limit their ability to misuse their monopoly
power. This recent change to light-handed regulation will put more ownership of the
setting of the distribution prices on the networks (rather than the regulator), which may
lead to changes in pricing approaches in the future.
Recent overall gas price increases are likely to continue the downward trend in
average household gas consumption and further erode the competitive position of gas
relative to electricity. Going forward, this will exacerbate the challenges for
Queensland gas distribution networks and again highlights the reasoning for removing
full regulation by the NCC.
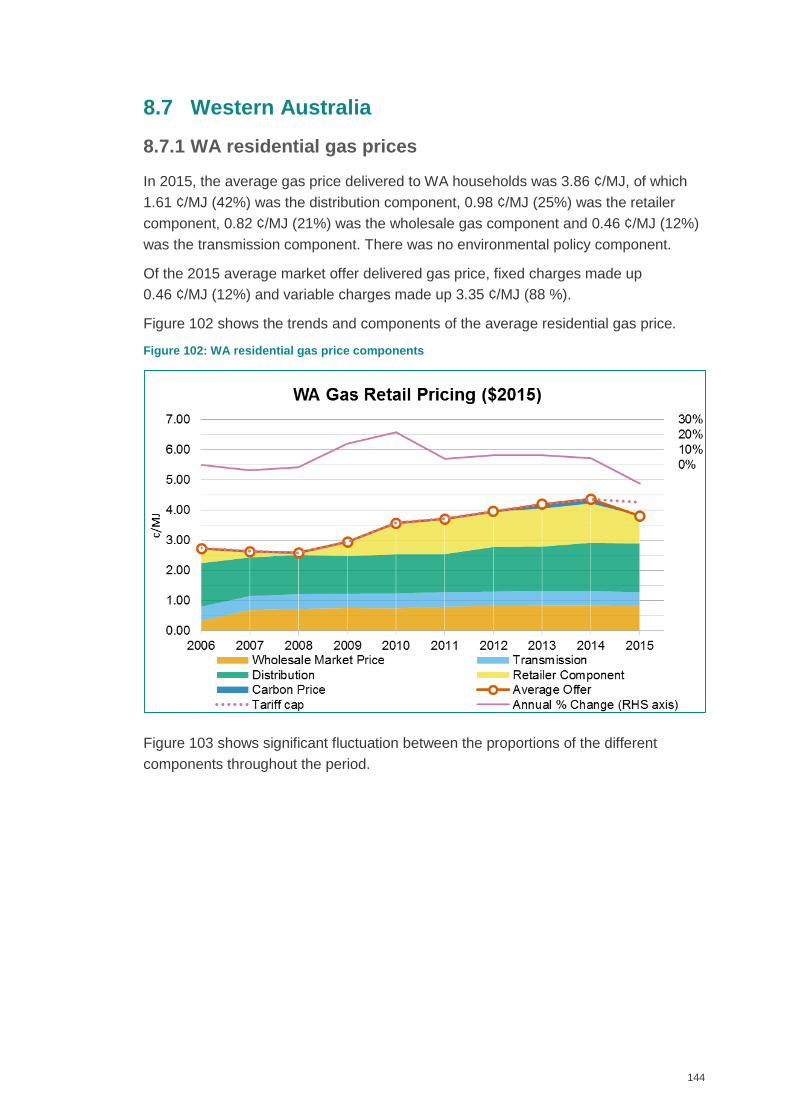
144
8.7 Western Australia
8.7.1 WA residential gas prices
In 2015, the average gas price delivered to WA households was 3.86 ¢/MJ, of which
1.61 ¢/MJ (42%) was the distribution component, 0.98 ¢/MJ (25%) was the retailer
component, 0.82 ¢/MJ (21%) was the wholesale gas component and 0.46 ¢/MJ (12%)
was the transmission component. There was no environmental policy component.
Of the 2015 average market offer delivered gas price, fixed charges made up
0.46 ¢/MJ (12%) and variable charges made up 3.35 ¢/MJ (88 %).
Figure 102 shows the trends and components of the average residential gas price.
Figure 102: WA residential gas price components
Figure 103 shows significant fluctuation between the proportions of the different
components throughout the period.
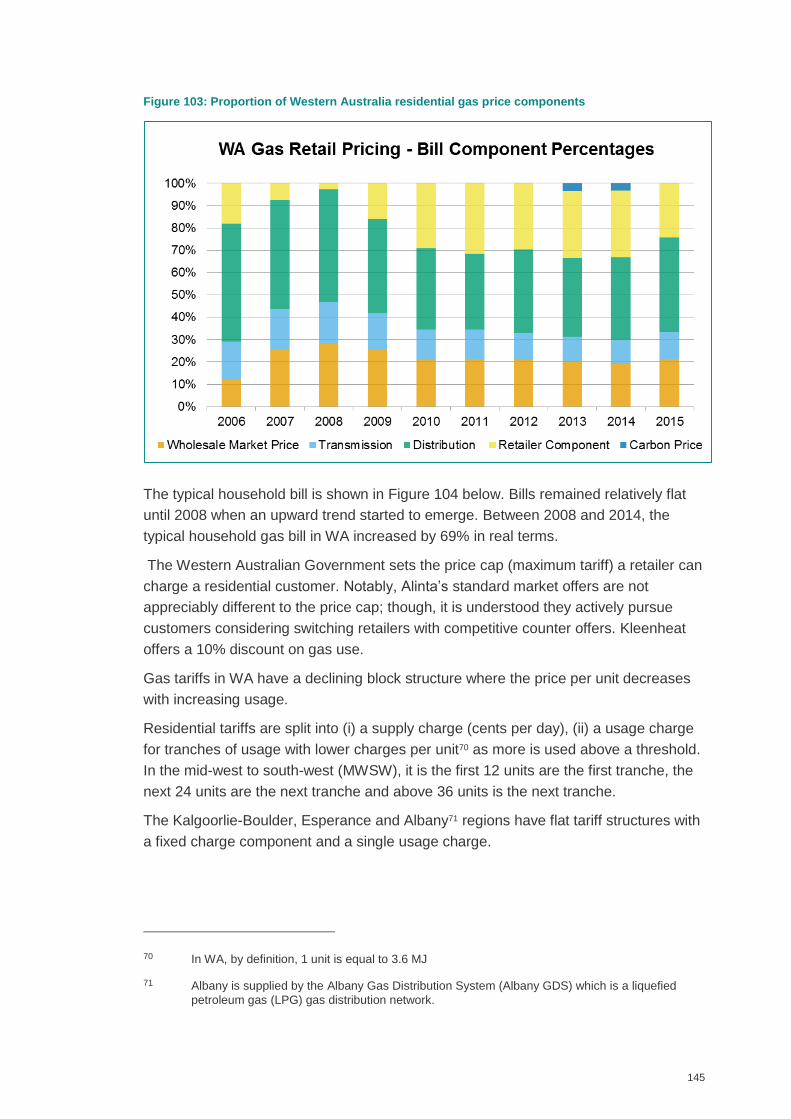
145
Figure 103: Proportion of Western Australia residential gas price components
The typical household bill is shown in Figure 104 below. Bills remained relatively flat
until 2008 when an upward trend started to emerge. Between 2008 and 2014, the
typical household gas bill in WA increased by 69% in real terms.
The Western Australian Government sets the price cap (maximum tariff) a retailer can
charge a residential customer. Notably, Alinta’s standard market offers are not
appreciably different to the price cap; though, it is understood they actively pursue
customers considering switching retailers with competitive counter offers. Kleenheat
offers a 10% discount on gas use.
Gas tariffs in WA have a declining block structure where the price per unit decreases
with increasing usage.
Residential tariffs are split into (i) a supply charge (cents per day), (ii) a usage charge
for tranches of usage with lower charges per unit70 as more is used above a threshold.
In the mid-west to south-west (MWSW), it is the first 12 units are the first tranche, the
next 24 units are the next tranche and above 36 units is the next tranche.
The Kalgoorlie-Boulder, Esperance and Albany71 regions have flat tariff structures with
a fixed charge component and a single usage charge.
70 In WA, by definition, 1 unit is equal to 3.6 MJ
71 Albany is supplied by the Albany Gas Distribution System (Albany GDS) which is a liquefied
petroleum gas (LPG) gas distribution network.
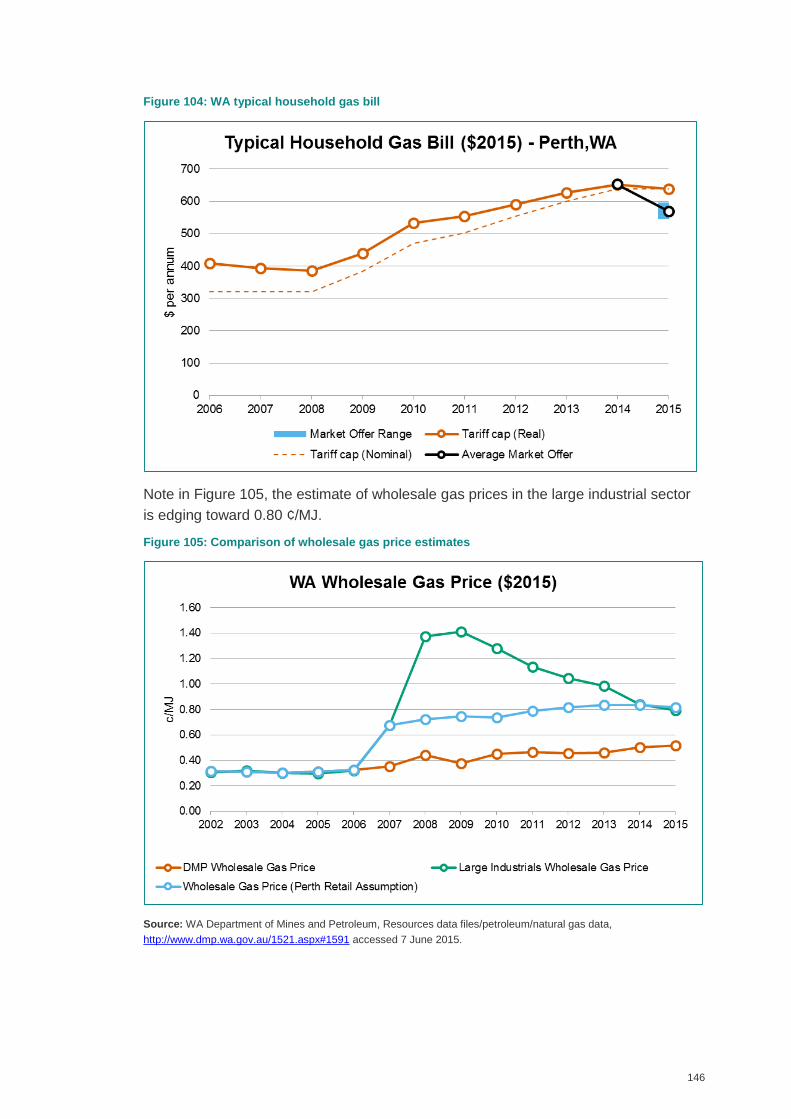
146
Figure 104: WA typical household gas bill
Note in Figure 105, the estimate of wholesale gas prices in the large industrial sector
is edging toward 0.80 ¢/MJ.
Figure 105: Comparison of wholesale gas price estimates
Source: WA Department of Mines and Petroleum, Resources data files/petroleum/natural gas data,
http://www.dmp.wa.gov.au/1521.aspx#1591 accessed 7 June 2015.
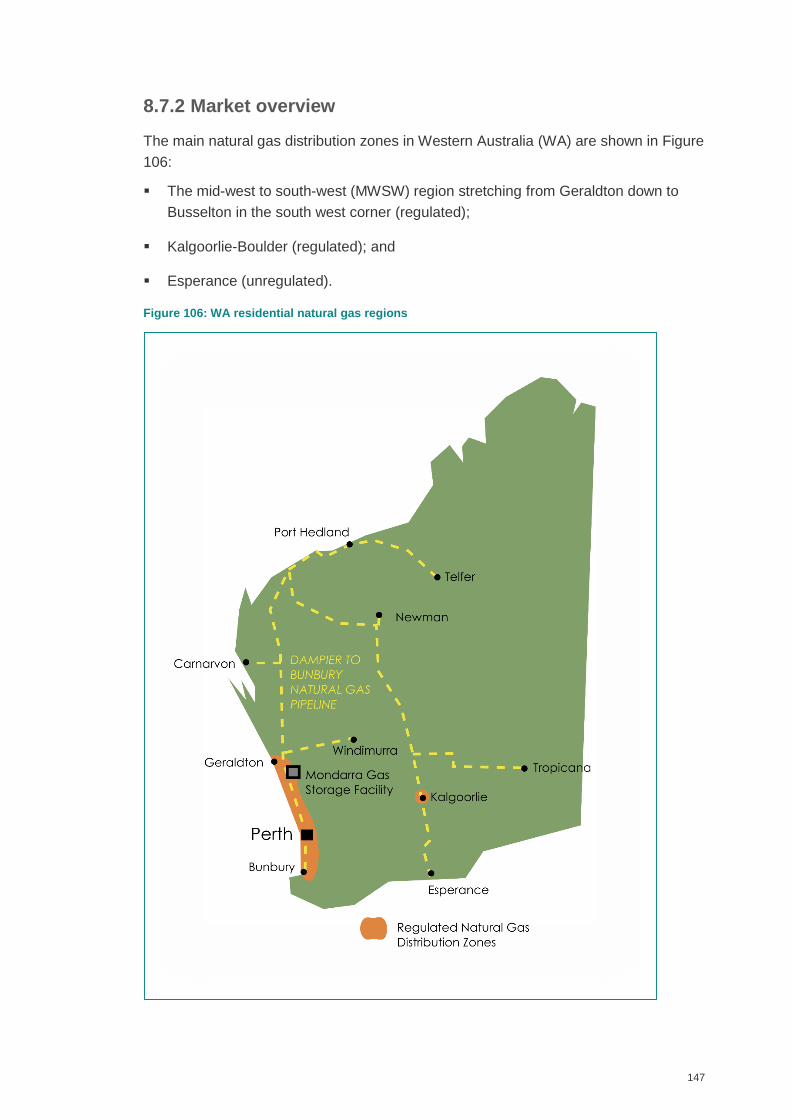
147
8.7.2 Market overview
The main natural gas distribution zones in Western Australia (WA) are shown in Figure
106:
The mid-west to south-west (MWSW) region stretching from Geraldton down to
Busselton in the south west corner (regulated);
Kalgoorlie-Boulder (regulated); and
Esperance (unregulated).
Figure 106: WA residential natural gas regions
148
There are a number of other gas distribution systems in WA (both regulated and
unregulated) that distribute LPG. The Albany gas distribution system is the largest with
smaller systems located in Leinster, Margaret River and Hopetoun. These zones have
not been included in this report.
Only the larger, regulated mid-west to south-west natural gas distribution zones are
included in this report.
The gas retail market in WA became contestable in 2004 and there are two active gas
retailers. They are the incumbent Alinta Energy and Kleenheat Gas (part of
Wesfarmers).
An approved Retail Market Scheme (RMS) operates in the WA retail gas market which
is administered by the Retail Energy Market Company Limited (REMCo). The ERAWA
has oversight over amendments to the RMS and non-compliance investigations.
Gas retailers must hold a gas trading licence issued by ERAWA. The WA Government
regulates gas prices to small users and under the Energy Coordination (Gas Tariffs)
Regulations 2000 sets gas price caps each year. The price caps vary in the different
areas and in the 2015-16 caps, only the Mid-West/South-West (MWSW) area had a
two tier tariff for gas consumed.72 All retailers must offer a standard contract at these
rates and they have the option to offer rates (discounts) below the regulated price
caps. Retailers may charge additional fees (for example REMCo fees) other than the
tariff caps and these are not regulated by the WA Government.73
WA’s dominant gas consumption zone is the MWSW region and the distribution
network servicing this region is owned by ATCO Australia Pty Ltd.
Table 21 indicates that the gas penetration for Western Australia is reasonably high,
with nearly 70% of the state connected to natural gas. There is a considerable
difference between gas usage between metro and regional WA. The gas penetration
rate in Perth is 83% (one of the highest for a capital city in Australia) while the
remainder of the state averages only 25%, probably due to lack of access in those
regions.
72 Department of Finance, 2015, Gas tariff caps, Perth, WA Dept. of Finance gas tariff caps web
page
73 Retail Energy Market Company, 2015, Fees and Revenue, Retail Energy Market Company fees
and revenue web page
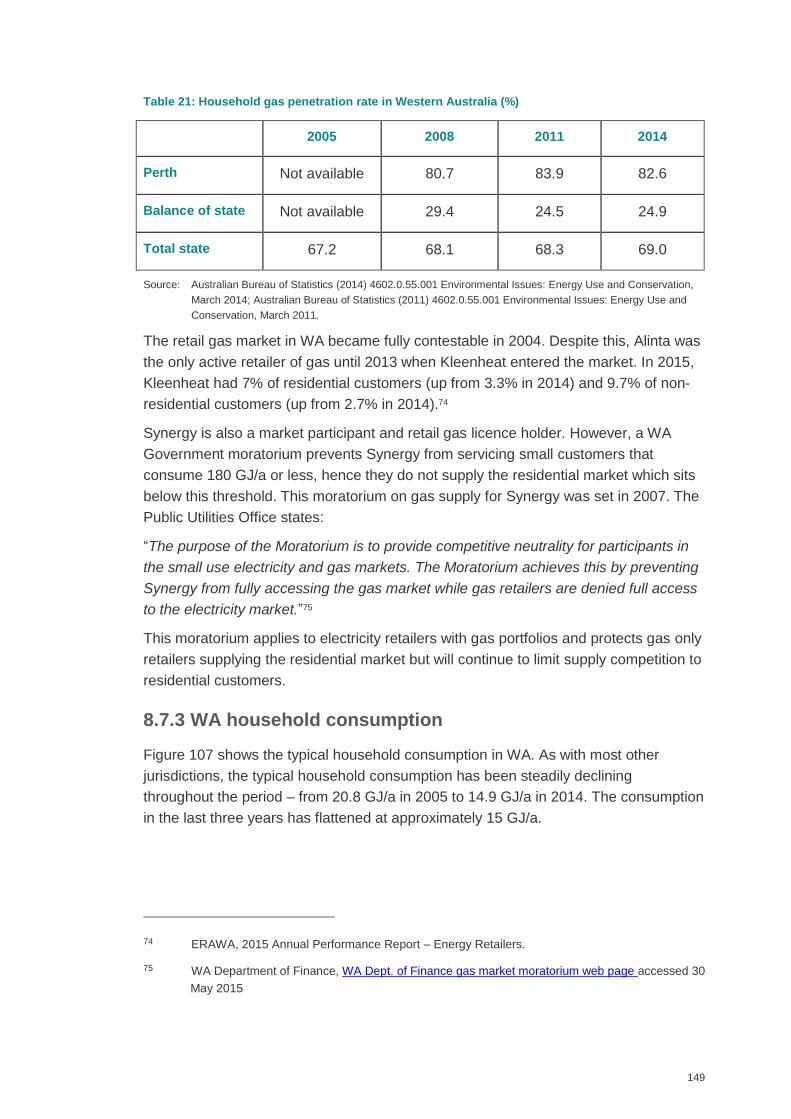
149
Table 21: Household gas penetration rate in Western Australia (%)
2005 2008 2011 2014
Perth Not available 80.7 83.9 82.6
Balance of state Not available 29.4 24.5 24.9
Total state 67.2 68.1 68.3 69.0
Source: Australian Bureau of Statistics (2014) 4602.0.55.001 Environmental Issues: Energy Use and Conservation,
March 2014; Australian Bureau of Statistics (2011) 4602.0.55.001 Environmental Issues: Energy Use and
Conservation, March 2011.
The retail gas market in WA became fully contestable in 2004. Despite this, Alinta was
the only active retailer of gas until 2013 when Kleenheat entered the market. In 2015,
Kleenheat had 7% of residential customers (up from 3.3% in 2014) and 9.7% of non-
residential customers (up from 2.7% in 2014).74
Synergy is also a market participant and retail gas licence holder. However, a WA
Government moratorium prevents Synergy from servicing small customers that
consume 180 GJ/a or less, hence they do not supply the residential market which sits
below this threshold. This moratorium on gas supply for Synergy was set in 2007. The
Public Utilities Office states:
“The purpose of the Moratorium is to provide competitive neutrality for participants in
the small use electricity and gas markets. The Moratorium achieves this by preventing
Synergy from fully accessing the gas market while gas retailers are denied full access
to the electricity market.”75
This moratorium applies to electricity retailers with gas portfolios and protects gas only
retailers supplying the residential market but will continue to limit supply competition to
residential customers.
8.7.3 WA household consumption
Figure 107 shows the typical household consumption in WA. As with most other
jurisdictions, the typical household consumption has been steadily declining
throughout the period – from 20.8 GJ/a in 2005 to 14.9 GJ/a in 2014. The consumption
in the last three years has flattened at approximately 15 GJ/a.
74 ERAWA, 2015 Annual Performance Report – Energy Retailers.
75 WA Department of Finance, WA Dept. of Finance gas market moratorium web page accessed 30
May 2015
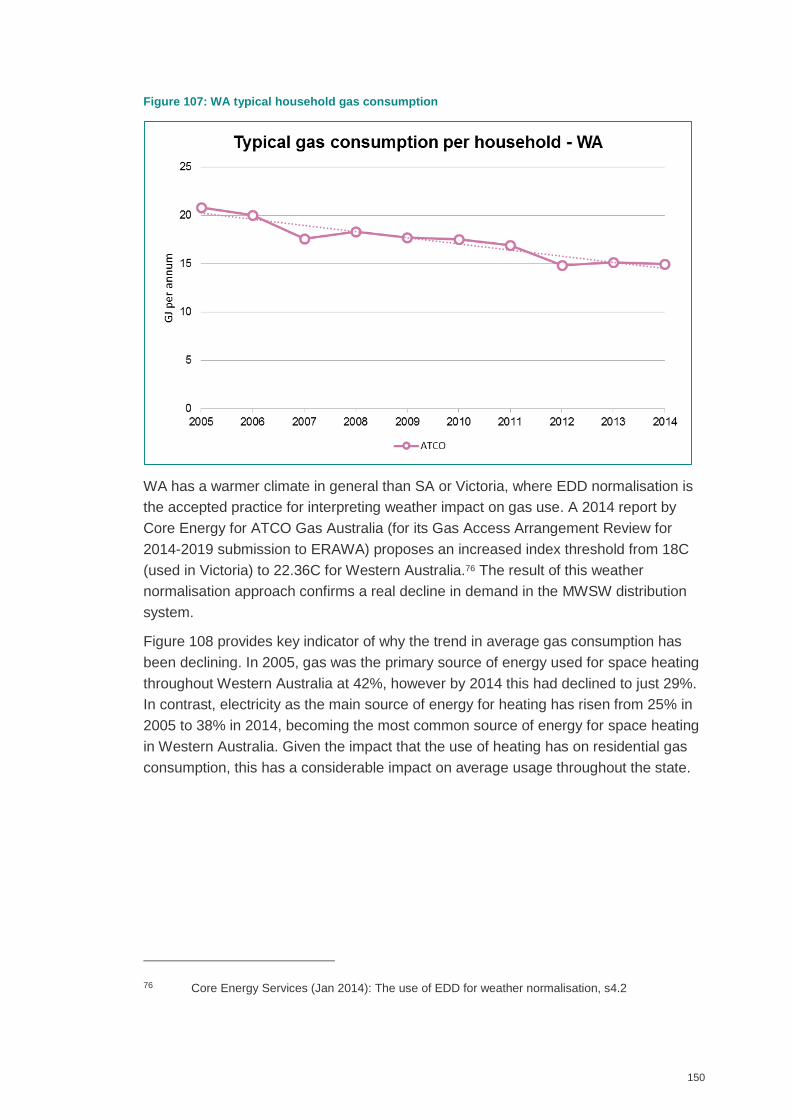
150
Figure 107: WA typical household gas consumption
WA has a warmer climate in general than SA or Victoria, where EDD normalisation is
the accepted practice for interpreting weather impact on gas use. A 2014 report by
Core Energy for ATCO Gas Australia (for its Gas Access Arrangement Review for
2014-2019 submission to ERAWA) proposes an increased index threshold from 18C
(used in Victoria) to 22.36C for Western Australia.76 The result of this weather
normalisation approach confirms a real decline in demand in the MWSW distribution
system.
Figure 108 provides key indicator of why the trend in average gas consumption has
been declining. In 2005, gas was the primary source of energy used for space heating
throughout Western Australia at 42%, however by 2014 this had declined to just 29%.
In contrast, electricity as the main source of energy for heating has risen from 25% in
2005 to 38% in 2014, becoming the most common source of energy for space heating
in Western Australia. Given the impact that the use of heating has on residential gas
consumption, this has a considerable impact on average usage throughout the state.
76 Core Energy Services (Jan 2014): The use of EDD for weather normalisation, s4.2
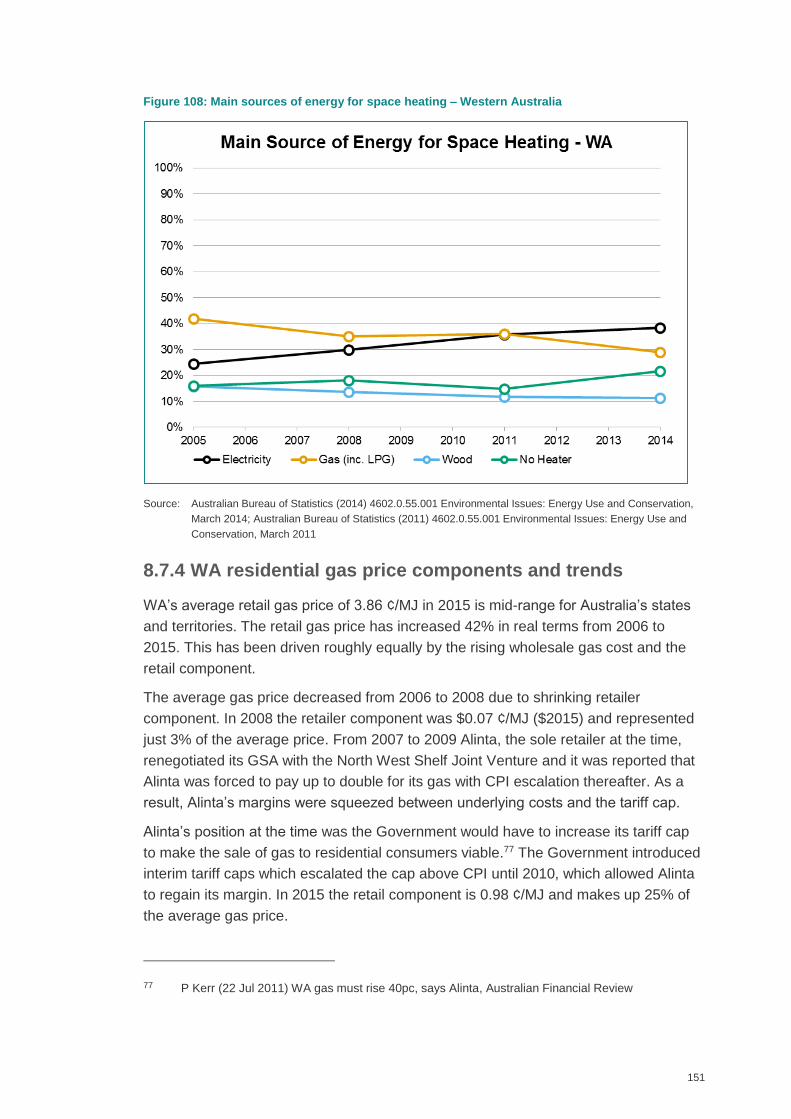
151
Figure 108: Main sources of energy for space heating – Western Australia
Source: Australian Bureau of Statistics (2014) 4602.0.55.001 Environmental Issues: Energy Use and Conservation,
March 2014; Australian Bureau of Statistics (2011) 4602.0.55.001 Environmental Issues: Energy Use and
Conservation, March 2011
8.7.4 WA residential gas price components and trends
WA’s average retail gas price of 3.86 ¢/MJ in 2015 is mid-range for Australia’s states
and territories. The retail gas price has increased 42% in real terms from 2006 to
2015. This has been driven roughly equally by the rising wholesale gas cost and the
retail component.
The average gas price decreased from 2006 to 2008 due to shrinking retailer
component. In 2008 the retailer component was $0.07 ¢/MJ ($2015) and represented
just 3% of the average price. From 2007 to 2009 Alinta, the sole retailer at the time,
renegotiated its GSA with the North West Shelf Joint Venture and it was reported that
Alinta was forced to pay up to double for its gas with CPI escalation thereafter. As a
result, Alinta’s margins were squeezed between underlying costs and the tariff cap.
Alinta’s position at the time was the Government would have to increase its tariff cap
to make the sale of gas to residential consumers viable.77 The Government introduced
interim tariff caps which escalated the cap above CPI until 2010, which allowed Alinta
to regain its margin. In 2015 the retail component is 0.98 ¢/MJ and makes up 25% of
the average gas price.
77 P Kerr (22 Jul 2011) WA gas must rise 40pc, says Alinta, Australian Financial Review
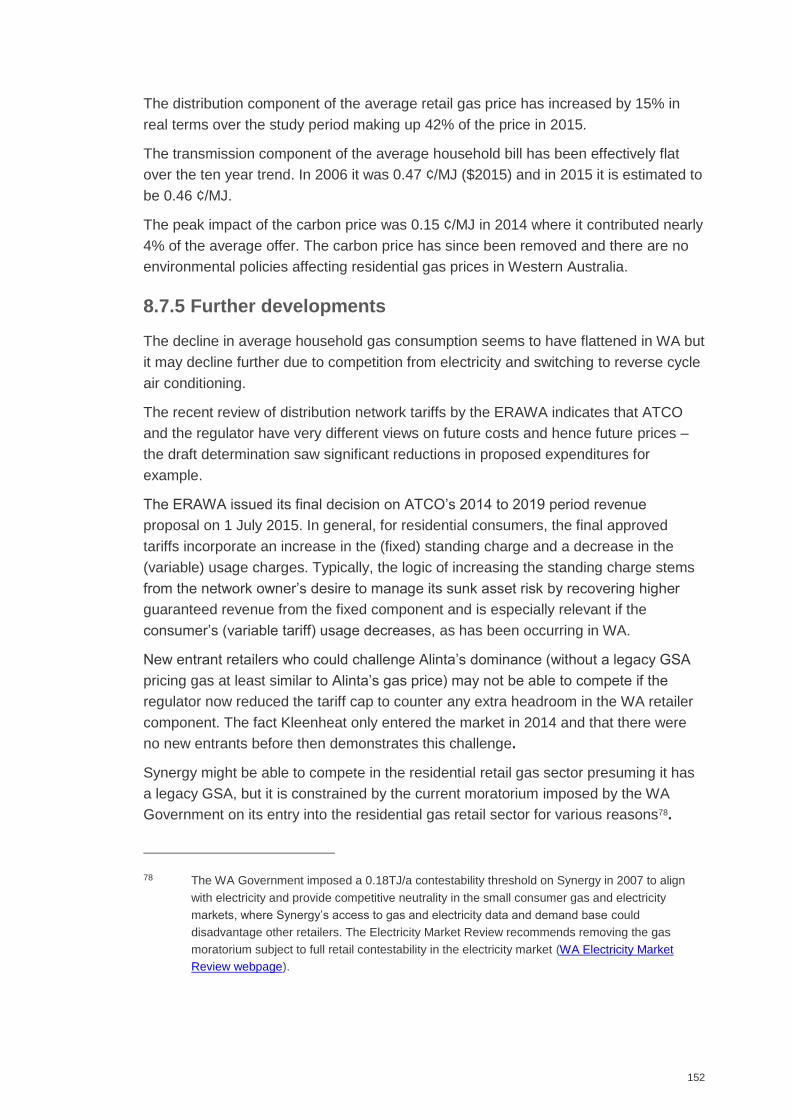
152
The distribution component of the average retail gas price has increased by 15% in
real terms over the study period making up 42% of the price in 2015.
The transmission component of the average household bill has been effectively flat
over the ten year trend. In 2006 it was 0.47 ¢/MJ ($2015) and in 2015 it is estimated to
be 0.46 ¢/MJ.
The peak impact of the carbon price was 0.15 ¢/MJ in 2014 where it contributed nearly
4% of the average offer. The carbon price has since been removed and there are no
environmental policies affecting residential gas prices in Western Australia.
8.7.5 Further developments
The decline in average household gas consumption seems to have flattened in WA but
it may decline further due to competition from electricity and switching to reverse cycle
air conditioning.
The recent review of distribution network tariffs by the ERAWA indicates that ATCO
and the regulator have very different views on future costs and hence future prices –
the draft determination saw significant reductions in proposed expenditures for
example.
The ERAWA issued its final decision on ATCO’s 2014 to 2019 period revenue
proposal on 1 July 2015. In general, for residential consumers, the final approved
tariffs incorporate an increase in the (fixed) standing charge and a decrease in the
(variable) usage charges. Typically, the logic of increasing the standing charge stems
from the network owner’s desire to manage its sunk asset risk by recovering higher
guaranteed revenue from the fixed component and is especially relevant if the
consumer’s (variable tariff) usage decreases, as has been occurring in WA.
New entrant retailers who could challenge Alinta’s dominance (without a legacy GSA
pricing gas at least similar to Alinta’s gas price) may not be able to compete if the
regulator now reduced the tariff cap to counter any extra headroom in the WA retailer
component. The fact Kleenheat only entered the market in 2014 and that there were
no new entrants before then demonstrates this challenge.
Synergy might be able to compete in the residential retail gas sector presuming it has
a legacy GSA, but it is constrained by the current moratorium imposed by the WA
Government on its entry into the residential gas retail sector for various reasons78.
78 The WA Government imposed a 0.18TJ/a contestability threshold on Synergy in 2007 to align
with electricity and provide competitive neutrality in the small consumer gas and electricity
markets, where Synergy’s access to gas and electricity data and demand base could
disadvantage other retailers. The Electricity Market Review recommends removing the gas
moratorium subject to full retail contestability in the electricity market (WA Electricity Market
Review webpage).

153
Given Alinta’s dominant market position, there is also an opportunity for new entrants
to capture market share by virtue of natural attrition away from the incumbent market
share holder. Kleenheat should steadily increase its market share and provide a
competitive offering to consumers.
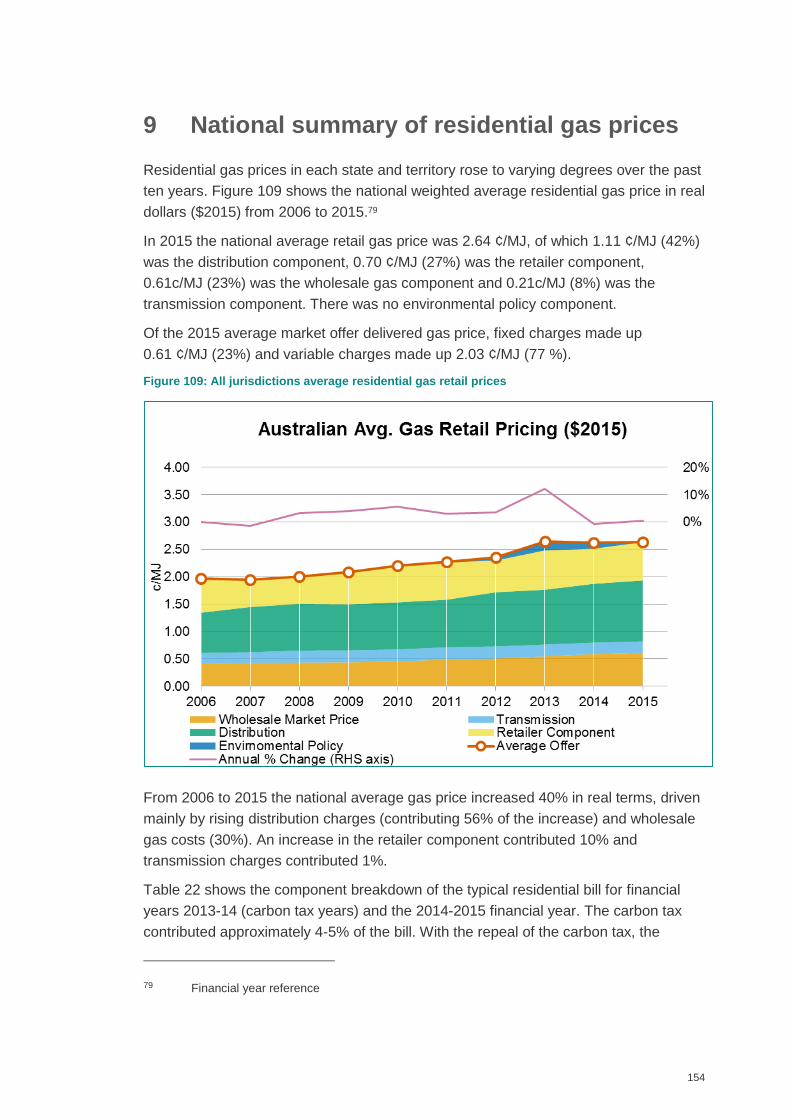
154
9 National summary of residential gas prices
Residential gas prices in each state and territory rose to varying degrees over the past
ten years. Figure 109 shows the national weighted average residential gas price in real
dollars ($2015) from 2006 to 2015.79
In 2015 the national average retail gas price was 2.64 ¢/MJ, of which 1.11 ¢/MJ (42%)
was the distribution component, 0.70 ¢/MJ (27%) was the retailer component,
0.61c/MJ (23%) was the wholesale gas component and 0.21c/MJ (8%) was the
transmission component. There was no environmental policy component.
Of the 2015 average market offer delivered gas price, fixed charges made up
0.61 ¢/MJ (23%) and variable charges made up 2.03 ¢/MJ (77 %).
Figure 109: All jurisdictions average residential gas retail prices
From 2006 to 2015 the national average gas price increased 40% in real terms, driven
mainly by rising distribution charges (contributing 56% of the increase) and wholesale
gas costs (30%). An increase in the retailer component contributed 10% and
transmission charges contributed 1%.
Table 22 shows the component breakdown of the typical residential bill for financial
years 2013-14 (carbon tax years) and the 2014-2015 financial year. The carbon tax
contributed approximately 4-5% of the bill. With the repeal of the carbon tax, the
79 Financial year reference
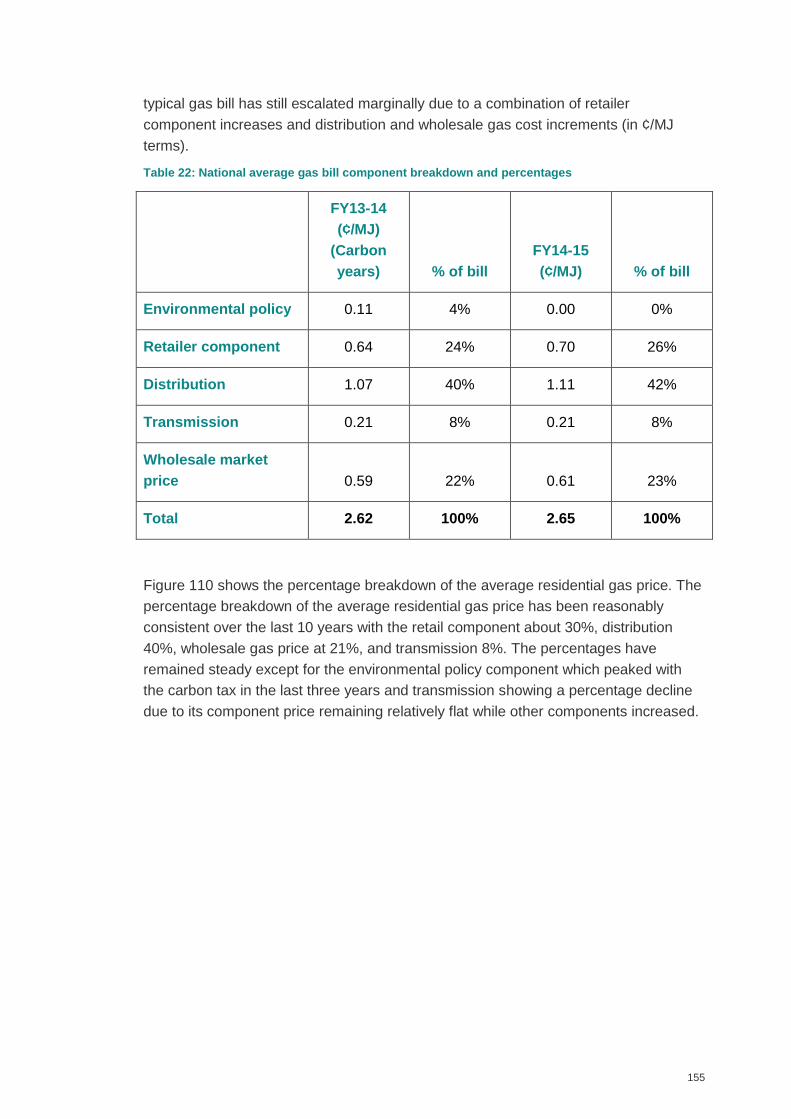
155
typical gas bill has still escalated marginally due to a combination of retailer
component increases and distribution and wholesale gas cost increments (in ¢/MJ
terms).
Table 22: National average gas bill component breakdown and percentages
FY13-14
(¢/MJ)
(Carbon
years) % of bill
FY14-15
(¢/MJ) % of bill
Environmental policy 0.11 4% 0.00 0%
Retailer component 0.64 24% 0.70 26%
Distribution 1.07 40% 1.11 42%
Transmission 0.21 8% 0.21 8%
Wholesale market
price 0.59 22% 0.61 23%
Total 2.62 100% 2.65 100%
Figure 110 shows the percentage breakdown of the average residential gas price. The
percentage breakdown of the average residential gas price has been reasonably
consistent over the last 10 years with the retail component about 30%, distribution
40%, wholesale gas price at 21%, and transmission 8%. The percentages have
remained steady except for the environmental policy component which peaked with
the carbon tax in the last three years and transmission showing a percentage decline
due to its component price remaining relatively flat while other components increased.
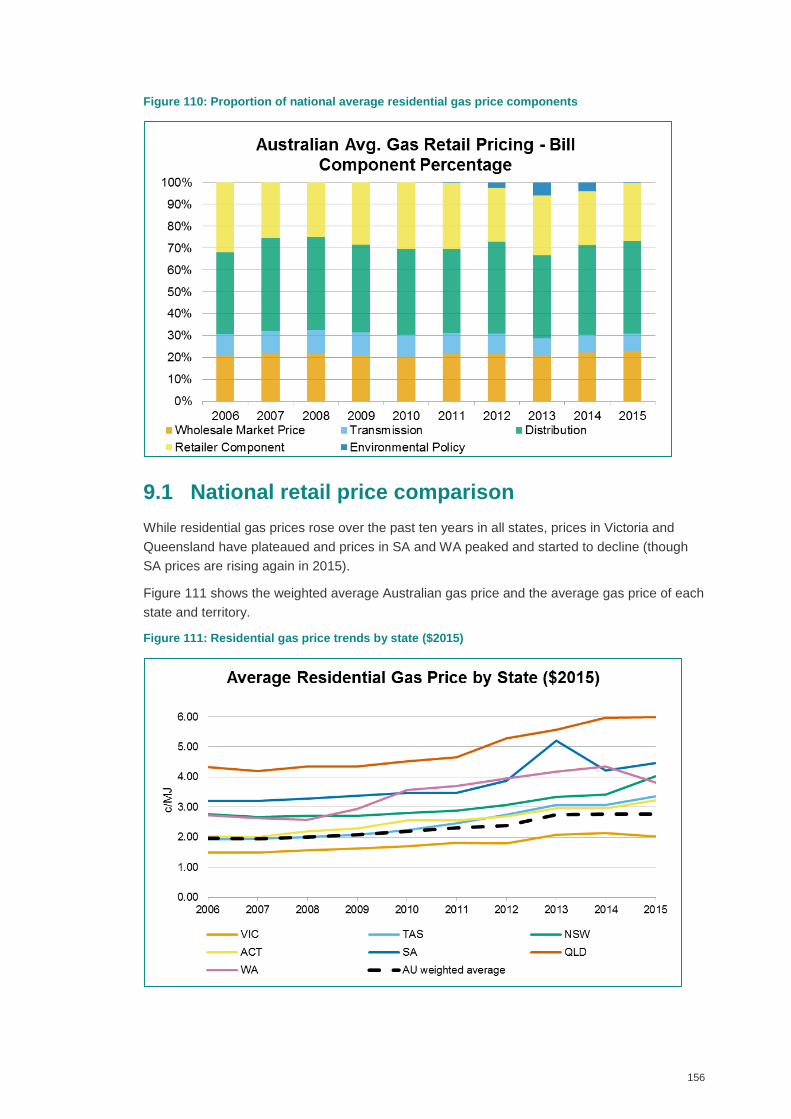
156
Figure 110: Proportion of national average residential gas price components
9.1 National retail price comparison
While residential gas prices rose over the past ten years in all states, prices in Victoria and
Queensland have plateaued and prices in SA and WA peaked and started to decline (though
SA prices are rising again in 2015).
Figure 111 shows the weighted average Australian gas price and the average gas price of each
state and territory.
Figure 111: Residential gas price trends by state ($2015)
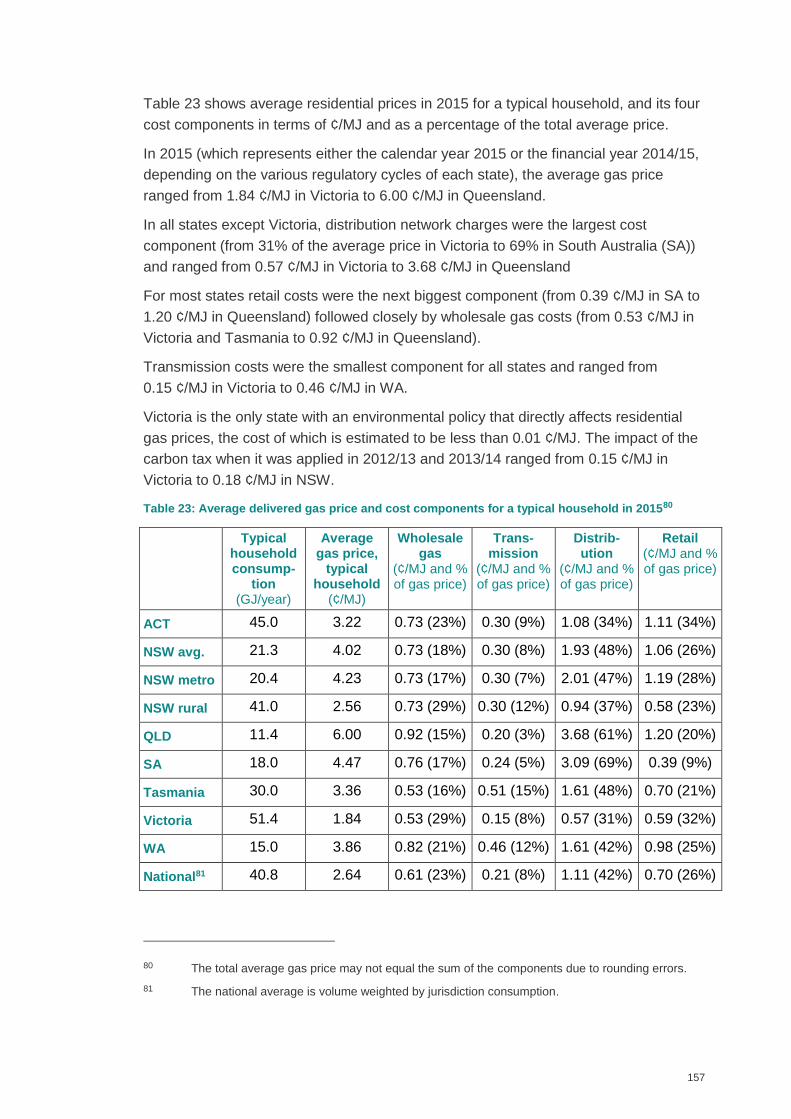
157
Table 23 shows average residential prices in 2015 for a typical household, and its four
cost components in terms of ¢/MJ and as a percentage of the total average price.
In 2015 (which represents either the calendar year 2015 or the financial year 2014/15,
depending on the various regulatory cycles of each state), the average gas price
ranged from 1.84 ¢/MJ in Victoria to 6.00 ¢/MJ in Queensland.
In all states except Victoria, distribution network charges were the largest cost
component (from 31% of the average price in Victoria to 69% in South Australia (SA))
and ranged from 0.57 ¢/MJ in Victoria to 3.68 ¢/MJ in Queensland
For most states retail costs were the next biggest component (from 0.39 ¢/MJ in SA to
1.20 ¢/MJ in Queensland) followed closely by wholesale gas costs (from 0.53 ¢/MJ in
Victoria and Tasmania to 0.92 ¢/MJ in Queensland).
Transmission costs were the smallest component for all states and ranged from
0.15 ¢/MJ in Victoria to 0.46 ¢/MJ in WA.
Victoria is the only state with an environmental policy that directly affects residential
gas prices, the cost of which is estimated to be less than 0.01 ¢/MJ. The impact of the
carbon tax when it was applied in 2012/13 and 2013/14 ranged from 0.15 ¢/MJ in
Victoria to 0.18 ¢/MJ in NSW.
Table 23: Average delivered gas price and cost components for a typical household in 201580
Typical household consump-
tion (GJ/year)
Average gas price,
typical household
(¢/MJ)
Wholesale gas
(¢/MJ and % of gas price)
Trans- mission
(¢/MJ and % of gas price)
Distrib- ution
(¢/MJ and % of gas price)
Retail (¢/MJ and % of gas price)
ACT 45.0 3.22 0.73 (23%) 0.30 (9%) 1.08 (34%) 1.11 (34%)
NSW avg. 21.3 4.02 0.73 (18%) 0.30 (8%) 1.93 (48%) 1.06 (26%)
NSW metro 20.4 4.23 0.73 (17%) 0.30 (7%) 2.01 (47%) 1.19 (28%)
NSW rural 41.0 2.56 0.73 (29%) 0.30 (12%) 0.94 (37%) 0.58 (23%)
QLD 11.4 6.00 0.92 (15%) 0.20 (3%) 3.68 (61%) 1.20 (20%)
SA 18.0 4.47 0.76 (17%) 0.24 (5%) 3.09 (69%) 0.39 (9%)
Tasmania 30.0 3.36 0.53 (16%) 0.51 (15%) 1.61 (48%) 0.70 (21%)
Victoria 51.4 1.84 0.53 (29%) 0.15 (8%) 0.57 (31%) 0.59 (32%)
WA 15.0 3.86 0.82 (21%) 0.46 (12%) 1.61 (42%) 0.98 (25%)
National81 40.8 2.64 0.61 (23%) 0.21 (8%) 1.11 (42%) 0.70 (26%)
80 The total average gas price may not equal the sum of the components due to rounding errors.
81 The national average is volume weighted by jurisdiction consumption.
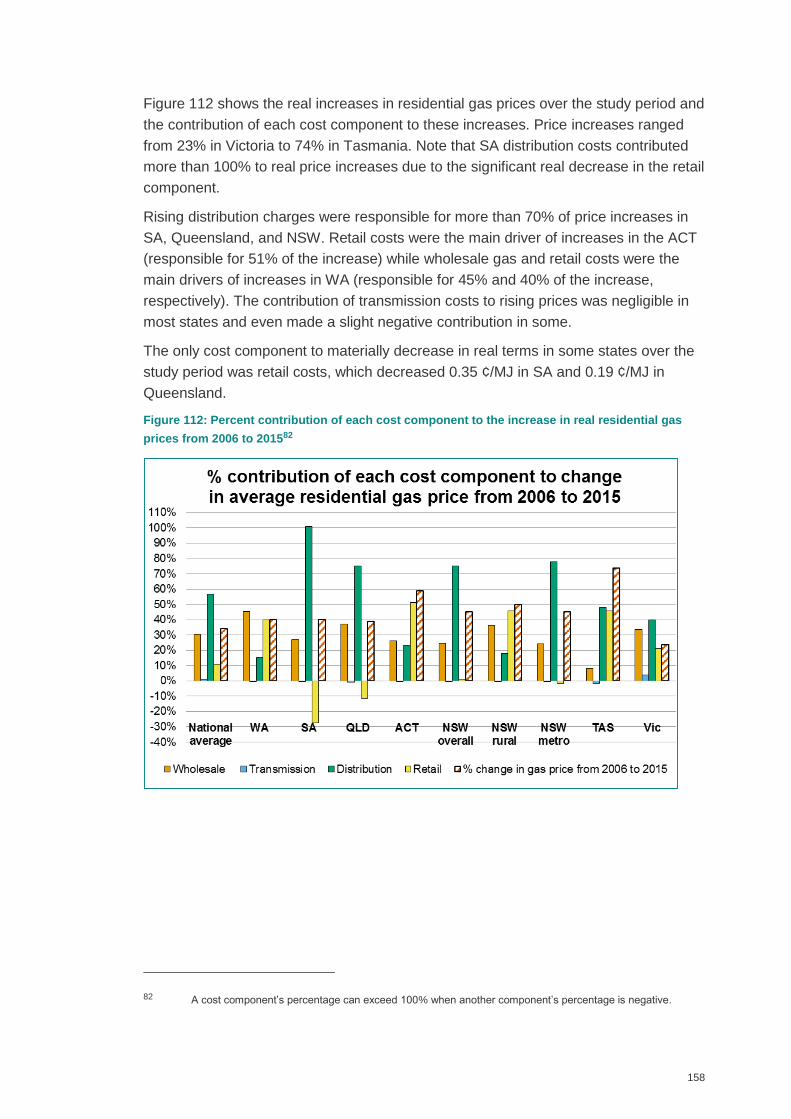
158
Figure 112 shows the real increases in residential gas prices over the study period and
the contribution of each cost component to these increases. Price increases ranged
from 23% in Victoria to 74% in Tasmania. Note that SA distribution costs contributed
more than 100% to real price increases due to the significant real decrease in the retail
component.
Rising distribution charges were responsible for more than 70% of price increases in
SA, Queensland, and NSW. Retail costs were the main driver of increases in the ACT
(responsible for 51% of the increase) while wholesale gas and retail costs were the
main drivers of increases in WA (responsible for 45% and 40% of the increase,
respectively). The contribution of transmission costs to rising prices was negligible in
most states and even made a slight negative contribution in some.
The only cost component to materially decrease in real terms in some states over the
study period was retail costs, which decreased 0.35 ¢/MJ in SA and 0.19 ¢/MJ in
Queensland.
Figure 112: Percent contribution of each cost component to the increase in real residential gas
prices from 2006 to 201582
82 A cost component’s percentage can exceed 100% when another component’s percentage is negative.
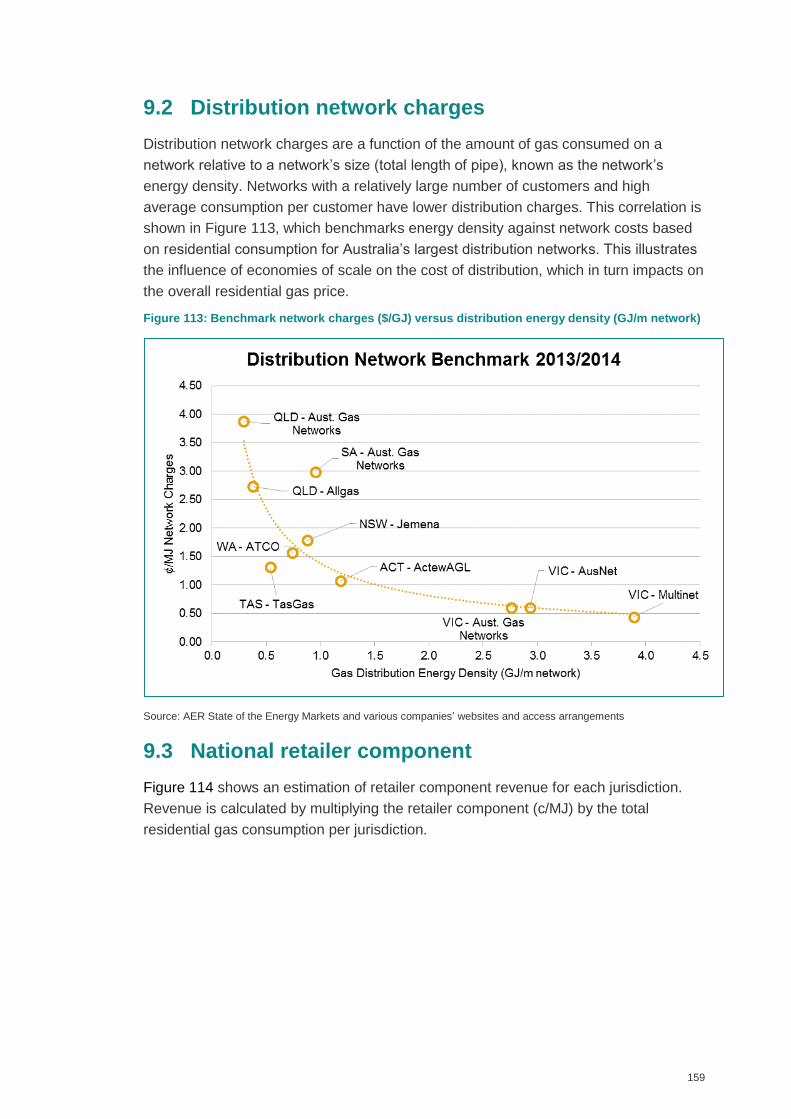
159
9.2 Distribution network charges
Distribution network charges are a function of the amount of gas consumed on a
network relative to a network’s size (total length of pipe), known as the network’s
energy density. Networks with a relatively large number of customers and high
average consumption per customer have lower distribution charges. This correlation is
shown in Figure 113, which benchmarks energy density against network costs based
on residential consumption for Australia’s largest distribution networks. This illustrates
the influence of economies of scale on the cost of distribution, which in turn impacts on
the overall residential gas price.
Figure 113: Benchmark network charges ($/GJ) versus distribution energy density (GJ/m network)
Source: AER State of the Energy Markets and various companies’ websites and access arrangements
9.3 National retailer component
Figure 114 shows an estimation of retailer component revenue for each jurisdiction.
Revenue is calculated by multiplying the retailer component (c/MJ) by the total
residential gas consumption per jurisdiction.
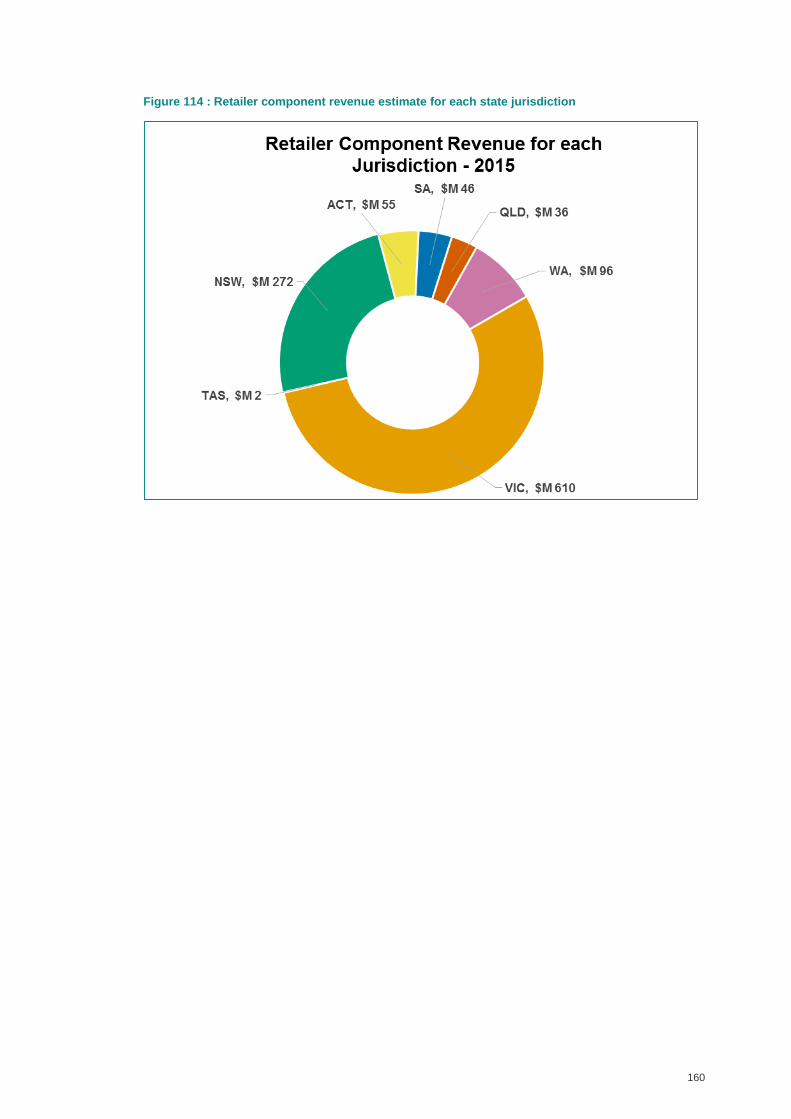
160
Figure 114 : Retailer component revenue estimate for each state jurisdiction

161
Appendix A: Methodology
162
A.1 Approach taken to industrial price review
A.1.1 Data gathering and validation
The large Industrial customer analysis was based on proprietary information
developed by the project team. These data are based on real market information (not
implied by cost of supply curves etc.). This is different to the residential analysis which
used a variety of regulatory and gas retailer data, which are mostly in the public
domain.
Averaged data are used for industrial customers across each jurisdiction, which does
not allow for identification of any specific industrial customer or
supplier/retailer/producer.83
The data are what a customer “sees” (outlined in section A.1.1.1) and not, for
example, actual basin data or retailer portfolio data.
The data cover industrial customers who typically contract in excess of 1 PJ/a but, for
NSW and Victoria, also cover industrial customers in the 0.1 to 1.0 PJ/a range. The
smaller industrial customers have distinct differences to larger customers and were
therefore treated as a separate segment for analysis.
Averaging involves a range of costs and therefore the industrial customer segments
were standardised as much as possible (such as for load factor, transmission costs,
etc.) so that they represent a jurisdictional value (e.g. delivered to Melbourne and
Sydney). Where major departures from these averages were observed we noted what
these are and why they may be occurring, or broke out the data into separate regions,
as was done for Queensland.
Transmission pipeline and distribution network data and pricing were largely
accessible through the Australian Energy Regulator, state regulators and directly from
the companies.
Load factor scaling between the standardised large industrial customer and those with
significantly peakier load factors was estimated using a storage analogue (see Section
3.2 for more detail).
Jurisdictional and national environmental imposts were derived from environmental
legislation, researched and validated with the assistance of various regulatory
bodies.84 For the industrial sector the carbon tax was the only material factor.
83 No single gas consumer in the industrial segmentation could use this data to analyse their own
particular circumstances, and this was certainly not the intent. However they could see the
underlying jurisdictional trends that may have impacted on their delivered gas prices.
163
To allow suitable comparison between jurisdictions, the market data involves a degree
of normalisation and assumptions for load factors and a range of other market
information, such as locational data.
Aggregated volume weighted average prices were also supplied for:
Queensland, as it was split into three regions
For the east coast market (NSW, Victoria, Queensland, SA and Tasmania)
Australia overall
The NT wholesale gas prices relate mainly to contracts for power generation and are
dominated by Territory Generation. They are commercially confidential so only an
outline of the NT market has been provided.
A.1.1.1 Data characteristics
For the purposes of this report analysis industrial customers were separated into:
Large industrial customers - defined as those who consume more than 1 PJ/a; and
Small industrial customers - defined as those who consume 0.1 to 1.0 PJ/a.
This was done to see if there were any distinct differences in the disaggregated price
structures, noting:
Large industrial customers tend to be able to attract offers for gas supply from both
retailers and producers, while small industrial customers tend to only receive offers
from retailers.
Large industrial customers are not connected to the lower-pressure distribution
networks and thus avoid distribution costs and so have transportation costs in only
(mainly transmission system costs).
The smaller industrial loads tend to have higher load factors (peakier loads). This
is canvassed in section 4.1.3 (Victoria) and section 4.3.6 (NSW).
It is less of a risk from a volume commitment perspective for retailers to supply
small industrial customers when market supply is tight.
A.1.1.2 Industrial Pricing Range
The pricing range for large industrial customer wholesale gas price has been
estimated for the purposes of this report to be +/- 10%, as a result of prices being
averaged. This was checked against as much original data as possible and found to
be the best fit in terms of the spread of results, except for some more remote regional
areas.
164
A.1.1.3 Large industrial customer analysis
This segment is typified by confidential GSAs and therefore attaining a representative
and historic sample with any statistical validity was not viable. As a result the analysis
relied on proprietary information. It should also be noted that the wholesale gas market
is a thin market at the jurisdictional level for transactions greater than 1 PJ/a. For
example it is not unusual that in some jurisdictions only one or two transactions may
occur in any given year – but these would still represent an effective market price for
that year.
The information presented here is not reflective of any individual customer’s GSA but
the market prices on offer at the time for the standardised large industrial customer.
A.1.1.4 Small industrial customer analysis
This separate segment was identified as one worthy of analysis so a sample of GSA
data was sourced from Energy Management Systems (EMS) in a format where these
specific customers could not be identified other than from their jurisdiction and if they
were rural or metropolitan (metro) based.
Small industrial customers were analysed for NSW and Victoria. There was either
inadequate or no data available for other jurisdictions. The objectives of analysing this
segment included:
To see if there were underlying differences in wholesale gas prices that may
indicate additional charges by retailers for higher load factors, as these small
industrial customers are generally unable to source producer based offers.
To see if retail margins built into the wholesale gas pricing were higher than what a
large industrial customer would pay (using the large industrial customer wholesale
gas price as the reference for analysis).
To analyse the effects of transmission and distribution network pricing on this
sector, as it was known small industrial customers would be generally supplied
through distribution networks and so use more network assets than large industrial
customers.
165
The small industrial customer data set provided by EMS for NSW and Victoria
consisted of:
68 customers with:
An ACQ of 340 TJ/a (0.34 PJ/a)
An average load factor of 1.8
39 rural customers (14 in Victoria and 25 in NSW)
29 metro customers (11 in Victoria and 18 in NSW)
The majority of data related to the last five years for Victoria (2011-2015) and
seven years for NSW (2009-2015).
Victorian customers analysed had:
An average ACQ of 350 TJ/a
The average load factor was 1.6: 1.7 for rural customers and 1.5 for metro
customers
NSW customers analysed had:
An average ACQ of 340 TJ/a, and
The average load factor was 1.9: 2.1 for rural and 1.6 for metro.
The variances in the rural load factors show that many rural customers have peakier
gas use (higher load factors) relative to small industrial customers in metro NSW and
Victoria (who had similar load factors). Many of the rural customers are involved in
food and beverage production and processing whereas metro customers tend to be
engaged in more traditional manufacturing and processing industries – and therefore
this peakier profile may reflect work hours and seasonality issues.
Those small industrial customers that lacked a full data set (mainly those where
transportation costs were not available) were not included in the cost component
analysis. This reduced the analysed data set to 36 customers for NSW (19 rural, 17
metro) and 19 for Victoria (8 rural and 11 Metro). However, a majority of the excluded
data set did have wholesale gas contract pricing which was used in the small industrial
wholesale gas price comparison as shown in Figure 12 for Victoria and Figure 23 for
NSW.
A.1.1.5 Definitional matters
The approach to defining the wholesale gas cost is to use the wholesale gas price that
a large industrial customer (defined as one using more than 1 PJ/year) would be able
to achieve or be offered from a gas producer directly, in competition with retail gas
suppliers.
166
This is a market-based wholesale cost and the price is influenced by the customer’s
load factor, annual quantities, timing, etc., aspects of which have been standardised
for large and small (those who use 0.1 to 1.0 PJ a year) industrial customers.
The reasoning behind this definition was that if a retailer makes and secures a supply
offer in competition with a producer, the retail margin is either negligible (or can even
be negative for strategic reasons) or is unidentified but positive – being embedded in
the retailer’s ability to buy gas at better than current market wholesale price offers.85
The retailer is able to secure these price offers largely through their ability to:
Buy in bulk and generate a margin over smaller allotments of the bulk purchase.
Buy through multiple supply portfolios, some of which may even be their own
upstream gas positions.
Have legacy contract prices flowing through to periods of escalating prices – this is
very common at the moment.
Possibly renegotiate outcomes lower than those that would be set by new GSAs,
at price reset negotiations of existing bulk supply (portfolio) agreements. This
reflects, for example, the marginal costs of contractually excised gas reserves in
long-term supply agreements as opposed to the marginal costs of developing new
gas reserves.
Know producers’ price ambitions (from, for example, price reset negotiations or
even confidential price arbitrations) and being able to set prices up to these levels
knowing that there will be a low likelihood they will be undercut by the producers
seeking to realise those ambitions.
Use transmission contracts to make a margin where they have a scale advantage.
This margin can be achieved where multiple customer MDQ bookings give rise to a
level of effective MDQ that the retailer would contract for that is less than the total
sum of the individual MDQ of each customer as it is highly unlikely all customers
would be using their MDQ at exactly the same time.
For an industrial customer, where both producers and retailers make offers, the
contracted wholesale gas price is the real market wholesale cost of gas – even if it
includes retail type trading margins (and even if it covers the extremely low marginal
costs related to customer service and billing, etc.) – as the offer price is under serious
85 This trading style margin is different for all retailers across their selected service areas and
across time (and can vary very quickly) so there is no “standard” retail trading margin when it
comes to the large industrial market.
167
competitive pressures.86 This is effectively the real wholesale gas market for large
industrial customers.
Importantly, if the prices offered by producers and retailers to a large industrial
customer are not acceptable, the customer has only a few alternatives. These
alternatives are vertically integrating into supply, such as buying/funding a stake in an
upstream development, using alternatives energy sources where practical or economic
to do so, or simply reducing demand.87
Where the wholesale gas cost definition starts to become important is when smaller
volume GSAs and tariffs are analysed.
For small industrial customers (industrial customers who use 0.1 to 1.0 PJ/a), the data
shows that the gas wholesale price did not escalate unless there were outlier load
factors or the customer was in a more rural or remote area. This is even though
typically88 only retailers are competing for these smaller customers. This seems to
indicate that competition in this sector is still strong between retailers.
This project has sought to isolate any price effects on small industrial customers of
load factors or a real retail margin, over and above what a retailer would charge for a
large industrial customer. This has been done by taking the >1 PJ/a commodity
wholesale gas costs (scaled for load factor effects, with an error band) as the basis of
analysing the impact on all customers that are <1PJ pa.
The market for large gas portfolios held by a few of the major retailers is a different
market that goes more to producer basin prices. This market is not analysed in this
report as customers do not “see” these basin prices, but rather they are just reflected
in the offers retailers make. There is also strong evidence from the data that this also
is reflected in the small industrial gas customer contracts.
86 It is often the case that producers seek to be the market price “maker” in that they pursue pricing
that sets new market rates related to their costs and supply positions) but they are seriously
mitigated by retail offers. In oversupplied markets, producers can for example drive down prices
(as we have seen recently in some oversupplied markets) and when new supply is called for due
to increasing demand they will try and force prices up to signal scarcity and/or the cost of new
supplies). This balancing effect between retailers and producers also often mitigates the speed
of price movements as ownership of the volume of sales is important for future portfolio
procurement.
87 It is understood that one new entrant retailer is offering a procurement service based on buying
at spot prices and charging a simple margin but this is a relatively new development and means
average prices could swing widely based on supply and demand balances in the hub trading
systems.
88 Customers with some smaller volume sites can benefit from being part of a larger buying entity –
so customers with one or more large sites can leverage their contractual position for better
outcomes.
168
A.2 Residential methodology
This section outlines the approach used to estimate the trends in gas pricing for
residential gas for each state and territory, excluding the Northern Territory, from
2002-2003 to 2014-2015 on a yearly basis. The data is processed on a ¢/MJ basis to
understand the component costs for each jurisdiction and also was processed to
develop a representative household bill per annum. All prices and costings are GST
exclusive and are in real dollars (2014-2015), unless noted otherwise.
Data are based on a calendar year for some jurisdictions and financial year for others.
For comparison purposes, any data that is based on a calendar year was assumed to
be equivalent to the previous financial year. For example, 2015 calendar year data is
assumed to align with data provided for the 2014-2015 financial year from another
jurisdiction.
Estimations were produced for the following components of the retail price:
Wholesale gas
Transmission
Distribution
Environmental policies
Retailer
Through the research process it became apparent that the archiving and transparency
of tariffs and changes in tariffs (and some environmental policies) was dependent
upon each individual regulating body and, as a result, details and quality of the data
were variable between states and territories particularly in the earlier years. Where
prices were not regulated, details were not always available with even some retailers
not carrying records back more than four to five years.
As a result, for some states a small number of data points were not available for some
years and in these cases the data were interpolated. Where data were unavailable at
the beginning, the data were extrapolated for the rate of change in previous or
subsequent years. Queensland is the only state where retail tariff data were
incomplete in the years 2008 and 2009. Where a year has been estimated no marker
appears on the average retail offer trend line for that year. Refer to Figure 95 for an
example.
A.2.1 How average household gas prices are calculated
An effective average gas price was calculated for residential customers in each state.
This price is an average ¢/MJ price a customer with the average gas consumption for
169
a particular state would pay. The basic approach used to calculate an effective
average gas price for a state, in a particular year, was:
Research the retail and distribution tariffs in the market offers and/or, if applicable,
standing offers in a state for each distribution zone or region, for each year;
Establish the jurisdiction’s average household consumption or where there are
multiple distribution zones, the average consumption per zone;
Using the average household consumption calculate the annual retail bill and
distribution charges from the market or standing offer tariffs for each year;
Divide the annual bill by the average household consumption to get a ¢/MJ
equivalent gas price for the retail and distribution charges;
Where there are multiple market offers in a given year, calculate the average ¢/MJ
equivalent gas price for each offer and then average these values to get an overall
average ¢/MJ equivalent gas price; and
Where there were multiple distribution zones in a jurisdiction, use a weighted
average based on distribution zone consumption to derive an average jurisdiction
¢/MJ for the retail and distribution charges.
This approach, including the various considerations and assumptions that have been
used, is explained as follows.
In 2015, in each state the majority of consumers were on market offers (see section
A.2.2 for an explanation of market and standing offers). In competitive markets, there
are often a number of market offers available from a range of retailers. To determine
the equivalent gas price, the straight mean of the ¢/MJ equivalent gas price for each
market offer for a given year in a distribution zone was used as the average gas price
for that zone.
At the beginning of the data series in 2006, some jurisdictions did not have retail
contestability and/or there was limited competition. In these cases the majority of
customers were on standing offers and so standing offers were used to calculate gas
prices in the initial years.
Tariffs and data were calculated for each state based on a consumption weighted
average from each gas zone. The consumption weighted average of these zones is
used to calculate the consumption weighted average for the state.
A gas distribution zone is the area covered by a particular distribution network or part
of a distribution network that has market and/or standing offers particular to that area.
These distribution zones have traditionally been operated by a single distribution
company with a regulated distribution tariff, which forms the underlying cost basis for
the retail tariff. In regions that have high penetration, competition and consumption,
such as Victoria, the major distribution networks are each divided into a number of
distribution zones, based on historical retail franchise zones, and retailers have market
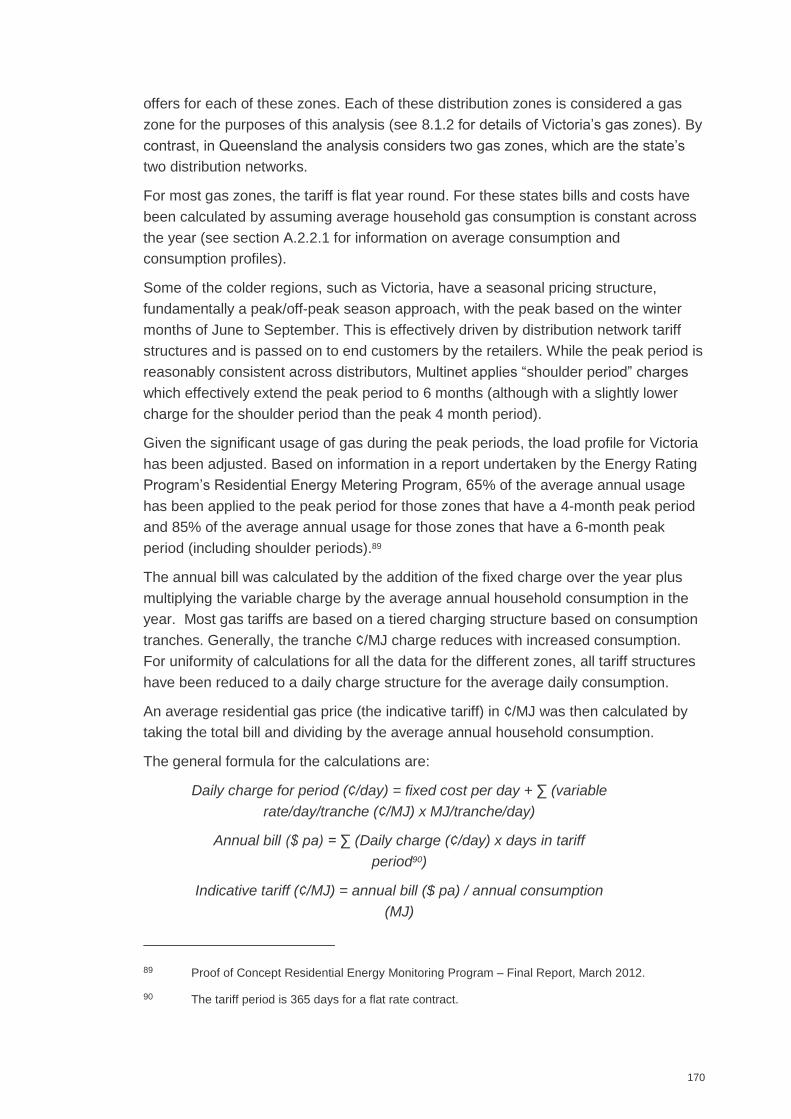
170
offers for each of these zones. Each of these distribution zones is considered a gas
zone for the purposes of this analysis (see 8.1.2 for details of Victoria’s gas zones). By
contrast, in Queensland the analysis considers two gas zones, which are the state’s
two distribution networks.
For most gas zones, the tariff is flat year round. For these states bills and costs have
been calculated by assuming average household gas consumption is constant across
the year (see section A.2.2.1 for information on average consumption and
consumption profiles).
Some of the colder regions, such as Victoria, have a seasonal pricing structure,
fundamentally a peak/off-peak season approach, with the peak based on the winter
months of June to September. This is effectively driven by distribution network tariff
structures and is passed on to end customers by the retailers. While the peak period is
reasonably consistent across distributors, Multinet applies “shoulder period” charges
which effectively extend the peak period to 6 months (although with a slightly lower
charge for the shoulder period than the peak 4 month period).
Given the significant usage of gas during the peak periods, the load profile for Victoria
has been adjusted. Based on information in a report undertaken by the Energy Rating
Program’s Residential Energy Metering Program, 65% of the average annual usage
has been applied to the peak period for those zones that have a 4-month peak period
and 85% of the average annual usage for those zones that have a 6-month peak
period (including shoulder periods).89
The annual bill was calculated by the addition of the fixed charge over the year plus
multiplying the variable charge by the average annual household consumption in the
year. Most gas tariffs are based on a tiered charging structure based on consumption
tranches. Generally, the tranche ¢/MJ charge reduces with increased consumption.
For uniformity of calculations for all the data for the different zones, all tariff structures
have been reduced to a daily charge structure for the average daily consumption.
An average residential gas price (the indicative tariff) in ¢/MJ was then calculated by
taking the total bill and dividing by the average annual household consumption.
The general formula for the calculations are:
Daily charge for period (¢/day) = fixed cost per day + ∑ (variable
rate/day/tranche (¢/MJ) x MJ/tranche/day)
Annual bill ($ pa) = ∑ (Daily charge (¢/day) x days in tariff
period90)
Indicative tariff (¢/MJ) = annual bill ($ pa) / annual consumption
(MJ)
89 Proof of Concept Residential Energy Monitoring Program – Final Report, March 2012.
90 The tariff period is 365 days for a flat rate contract.
171
Box 2 provides a complete worked example for 2014-2015 for the ACT region.
Box 2 Worked Example for ACT
ActewAGL retail offer for ACT for 2014-2015:
(Source: archived ActewAGL website)
Assumed average annual household consumption for ACT = 45 GJ/annum.
Daily consumption 45/365 = 0.1233 GJ/day or 123.3 MJ/day.
Retail tariff calculation (GST exclusive) from above:
Tariffs Calculation Totals (c/day)
Tranche 1 =< 41.0959 MJ/day 41.0959MJ x 2.685c/MJ 110.34
Tranche 2 next 2704.1096 MJ/day 82.1917MJ x 2.484 c/MJ 204.16
Daily charge 66.66 c/day 66.66
Daily totals ~123.3 MJ 381.17
Typical household yearly bill = 381.17/100 x 365 = $1,391.26
Indicative tariff for 2014-2015 = 1391.26/45000MJ = 3.09 c/MJ
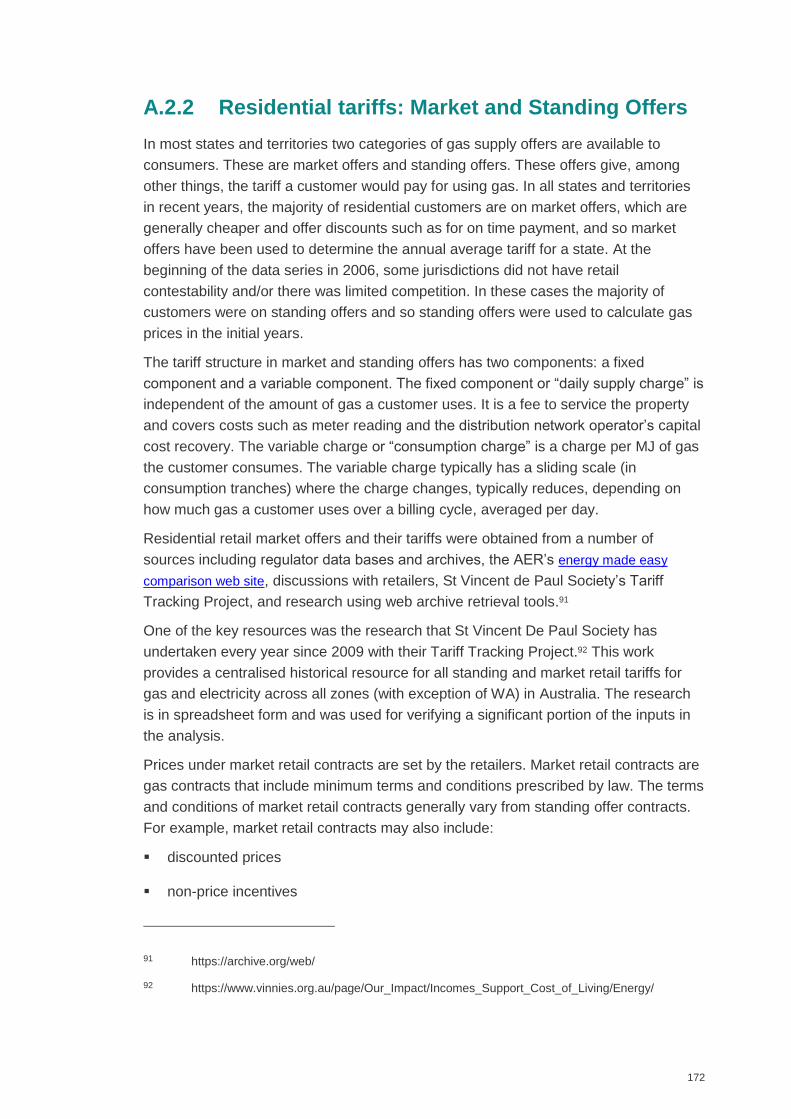
172
A.2.2 Residential tariffs: Market and Standing Offers
In most states and territories two categories of gas supply offers are available to
consumers. These are market offers and standing offers. These offers give, among
other things, the tariff a customer would pay for using gas. In all states and territories
in recent years, the majority of residential customers are on market offers, which are
generally cheaper and offer discounts such as for on time payment, and so market
offers have been used to determine the annual average tariff for a state. At the
beginning of the data series in 2006, some jurisdictions did not have retail
contestability and/or there was limited competition. In these cases the majority of
customers were on standing offers and so standing offers were used to calculate gas
prices in the initial years.
The tariff structure in market and standing offers has two components: a fixed
component and a variable component. The fixed component or “daily supply charge” is
independent of the amount of gas a customer uses. It is a fee to service the property
and covers costs such as meter reading and the distribution network operator’s capital
cost recovery. The variable charge or “consumption charge” is a charge per MJ of gas
the customer consumes. The variable charge typically has a sliding scale (in
consumption tranches) where the charge changes, typically reduces, depending on
how much gas a customer uses over a billing cycle, averaged per day.
Residential retail market offers and their tariffs were obtained from a number of
sources including regulator data bases and archives, the AER’s energy made easy
comparison web site, discussions with retailers, St Vincent de Paul Society’s Tariff
Tracking Project, and research using web archive retrieval tools.91
One of the key resources was the research that St Vincent De Paul Society has
undertaken every year since 2009 with their Tariff Tracking Project.92 This work
provides a centralised historical resource for all standing and market retail tariffs for
gas and electricity across all zones (with exception of WA) in Australia. The research
is in spreadsheet form and was used for verifying a significant portion of the inputs in
the analysis.
Prices under market retail contracts are set by the retailers. Market retail contracts are
gas contracts that include minimum terms and conditions prescribed by law. The terms
and conditions of market retail contracts generally vary from standing offer contracts.
For example, market retail contracts may also include:
discounted prices
non-price incentives
91 https://archive.org/web/
92 https://www.vinnies.org.au/page/Our_Impact/Incomes_Support_Cost_of_Living/Energy/
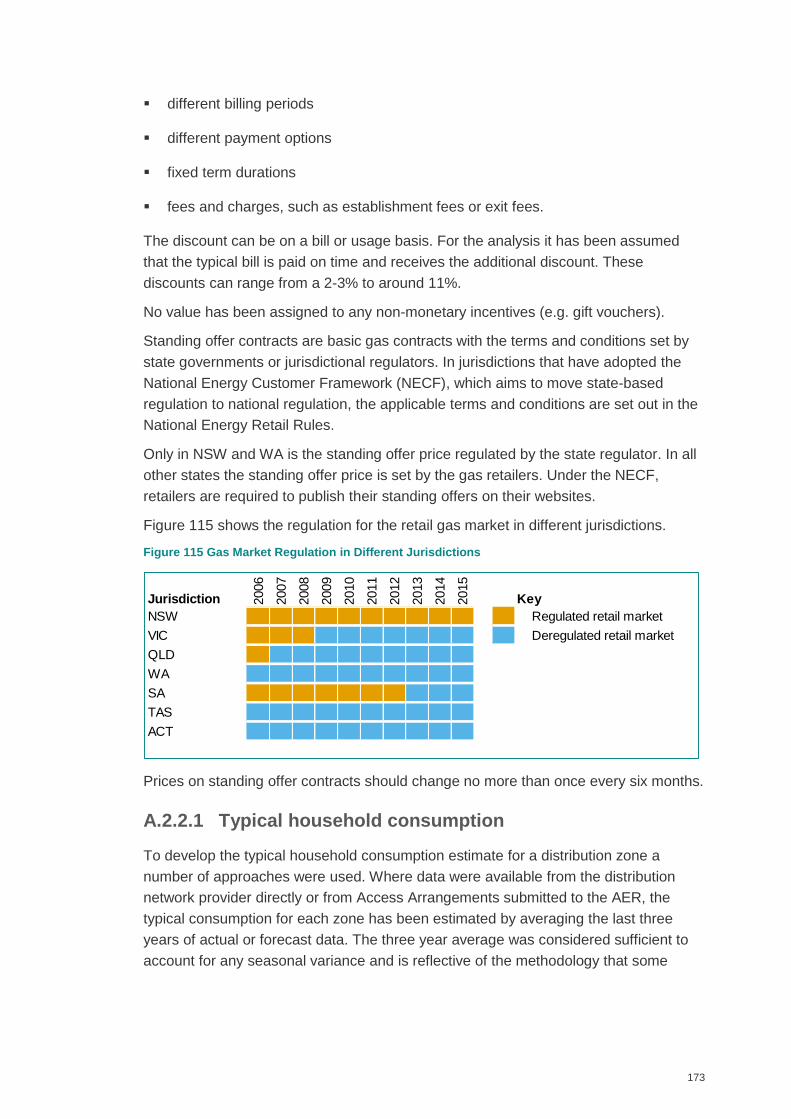
173
different billing periods
different payment options
fixed term durations
fees and charges, such as establishment fees or exit fees.
The discount can be on a bill or usage basis. For the analysis it has been assumed
that the typical bill is paid on time and receives the additional discount. These
discounts can range from a 2-3% to around 11%.
No value has been assigned to any non-monetary incentives (e.g. gift vouchers).
Standing offer contracts are basic gas contracts with the terms and conditions set by
state governments or jurisdictional regulators. In jurisdictions that have adopted the
National Energy Customer Framework (NECF), which aims to move state-based
regulation to national regulation, the applicable terms and conditions are set out in the
National Energy Retail Rules.
Only in NSW and WA is the standing offer price regulated by the state regulator. In all
other states the standing offer price is set by the gas retailers. Under the NECF,
retailers are required to publish their standing offers on their websites.
Figure 115 shows the regulation for the retail gas market in different jurisdictions.
Figure 115 Gas Market Regulation in Different Jurisdictions
Prices on standing offer contracts should change no more than once every six months.
A.2.2.1 Typical household consumption
To develop the typical household consumption estimate for a distribution zone a
number of approaches were used. Where data were available from the distribution
network provider directly or from Access Arrangements submitted to the AER, the
typical consumption for each zone has been estimated by averaging the last three
years of actual or forecast data. The three year average was considered sufficient to
account for any seasonal variance and is reflective of the methodology that some
Jurisdiction 2006
2007
2008
2009
2010
2011
2012
2013
2014
2015
Key
NSW Regulated retail market
VIC Deregulated retail market
QLD
WA
SA
TAS
ACT
174
distributors apply to their consumption trends93. Data was typically available for the
larger zones, such as Victoria, Sydney metro, Adelaide and Brisbane. Where this data
was not available, another approach was to use typical household gas consumption
figures published by the state regulator.
For each jurisdiction, an average gas price and its components are calculated on a
gas volume weighted average of each distribution gas zone to derive a state-based
average gas price.
Consumption data in each distribution gas zone in each state were reviewed to see if
consumption varies significantly. Only NSW was found to have significant variation in
consumption between zones. Household consumption in rural NSW is approximately
twice the metro household consumption due to the colder climate conditions
encountered inland in some rural areas. As a result NSW has been separated into
rural and metropolitan zones for analysis.
A.2.3 Retail gas supply chain components
Average residential gas prices were broken down into five major cost components:
Wholesale gas
Transmission
Distribution
Environmental policy
Retailer
A.2.3.1 Wholesale component
Most retailers maintain a portfolio of wholesale gas supply contracts that usually
includes legacy contracts that provide gas at a relatively low price. In the absence of
information on each retailer’s gas portfolio, for each state the wholesale cost identified
in the large industrials analysis is assumed to be the wholesale gas component. This
cost is for new industrial contracts struck in the year in question and, as a result, it is
likely the actual average wholesale gas component for some retailers is less than what
is estimated in this report.
The effect of any potential difference is moderated by the fact that the wholesale gas
component of retail prices in 2015 ranges from 15% in Qld to 29% in Victoria and so
will have a limited effect on overall retail price estimates and the related retail
component (discussed in Section 1.3).
93 Jemena 2012-2014 Calendar Year LGA Rolling Average Gas Consumption Data refer Jemena's
2012 to 2014 rolling average gas consumption data documentation
175
These wholesale gas costs have also been compared with analysis undertaken by
some of the jurisdictional regulators when determining residential gas prices (where
they were regulated within the jurisdiction). Regulators typically undertook this analysis
using wholesale gas price forecasts provided by third-party forecasters and then
worked through a retailer cost and margin exercise to arrive at final determined prices
or to check the prices and disaggregation of costs provided by retailers submitting new
prices for determination. This type of analysis had the benefit of being open to public
scrutiny.
A.2.3.2 Transmission component
Transmission pricing for each jurisdiction was adapted from the large industrial
analysis to estimate the transmission costs. The load factor assumption for the large
industrial analysis was 1.2 where the load factor is the maximum daily quantity or peak
demand divided by the average demand. Large industrial loads tend to be fairly
constant with small or limited peaks. The customer load factor for retail load tends to
have larger peaks.
The customer load factor for retail supply has been assumed as 2.5 for all gas zones.
This is based on a review of a number of public sources and a number of distribution
network access arrangements which identify peak daily flow and average daily flow. 94
To confirm that this number was reasonable, information available from AEMO’s Gas
Statement of Opportunities was reviewed.95 Detailed information is available for the
Victorian network, of which it was considered that Melbourne would be the best zone
to use in confirming the use of 2.5 for the load factor. In considering the Melbourne
usage, the maximum daily usage of 853 TJ/day and an average daily usage of
340 TJ/day equates to a customer load factor of 2.51 which aligns with the other
sources cited for customer load factors of 2.5.
Estimation of the cost of transportation of the wholesale gas supply has been
calculated by multiplying the transmission costs in the large industrials by the
residential customer load factor (CLF) divided by the large industrial supply load factor
(SLF).
Residential transmission cost estimate = transmission cost (large industrials) x 2.5/1.2
As wholesale contracts are offered on a supply load factor of 1.2 to 1.05, the retailer
also needs to ensure that their GSAs are capable of covering the peaks and diversity
of their load factor. They can do this using a number of means such as additional
94 AGL’s Voluntary Price Agreement proposed price path for NSW regulated gas price from 1 July to
30 June 2016 – public submission and ACIL Tasman report, Cost of gas for the 2013 to 2016
regulatory period for IPART’s review of regulated retail prices.
95 Australian Energy Market Operator, Gas Statement of Opportunities – Attachment B: Victorian Gas
Planning Review 2015, April 2015.
176
GSAs, specific gas storage contracts etc. For the estimation of the deliverability cost of
the difference between the two load factors, the use of reference storage costs has
been utilised (outlined in section 3.2) The deliverability cost estimate is 5.5 cents per
GJ for each 0.1 difference between the customer load factor (assumed to be 2.5 for
residential) and the supply load factor (assumed to be 1.2).
Deliverability estimate = (SLF-CLF)/0.1 x 5.5 cents/GJ ($2014)
The total transmission cost estimate in ¢/MJ for each year is the sum of the pipeline
transmission cost estimate and the delivery cost estimate.
A.2.3.3 Distribution component
As the majority of Australia’s distribution networks were regulated by the AER from
2009, or state based regulators before then, detailed distribution network tariffs are
readily available. Distribution tariffs have a fixed and variable charge, which is usually
reflected in retailer tariffs, which have the same structure.
Every five years distribution networks submit a proposed access arrangement to the
regulator, who determines the tariffs and associated charges. Each year the variation
to the tariff is approved by the regulator and published by the distributor.
The distribution component on a ¢/MJ basis was calculated using the same process as
the retailer tariffs. The annual distribution charge is calculated from the regulated tariff
using the annual household consumption assumption. The resulting cost is then
divided by the average household consumption to determine a distribution charge
based on ¢/MJ for the zone. If multiple zones exist in the jurisdiction, then an indicative
tariff is calculated using the consumption weighted average for each zone.
In most cases, the distribution gas zone also aligned with the retail gas zone. Some
exceptions have been where the network crosses jurisdictional boundaries. For
example, where ActewAGL operates in both the ACT and NSW, then it has been
assumed that the analysis for the ACT gas prices, which forms a majority of the
consumption, also apply to the NSW regions on the same distribution network. In
Victoria, retail franchise zones were established when the retail market was opened to
contestability and they do not exactly line up with the physical distribution zones.
For the Tasmanian gas distribution network no publicly available data exists to
determine the bottom up distribution cost component. The only information published
is by the regulator which identifies the distribution is approximately 48% of the retail
cost.96 The distribution cost component has been estimated using this percentage to
determine the ¢/MJ for all of the Tasmanian data.
96 Office of the Tasmanian Economic Regulator, Comparison of Australian standing offer energy
prices, March 2015.
177
A.2.3.4 Environmental Policy
The two environmental policy costs that were analysed and estimated were:
Clean Energy Act 2011 – Carbon Price for the years 2012-2013 and 2013-
2014; and
The VEET scheme.
NSW also has the Energy Savings Scheme (ESS) but it has only been focussed at
reducing electricity consumption at present. A recent decision was made to expand the
scheme to gas efficiency however this is not expected to commence until 2016.
Clean Energy Act
The difference between the large industrial carbon cost estimate and the residential
carbon cost estimate is that the retailer is also responsible for the customer’s carbon
emissions when the gas is combusted. The carbon cost estimate recovered from the
customer consists of:
Upstream costs resulting from direct and indirect emissions from production
and transmission (Scope 1 emissions);
Downstream costs resulting from combustion by end users (Scope 3); and
Any retail costs associated in processing and managing costs.97
Where retailers have been transparent on their determination of the carbon cost
impact on a $/MJ basis, these costs have been used directly in estimating the
environmental policy cost. The determination of the carbon tax cost used the publicly
available National Greenhouse Accounts (NGA) intensity factors for determining their
Scope 3 emissions and applied these to the distribution of their customer base. Other
vertically integrated retailers have used their own emission intensity factors from their
gas fields to determine the Scope 3 emissions.
Under the Clean Energy Act 2011, liability is imposed on a natural gas supplier for the
potential greenhouse gas emissions embodied in the natural gas it supplies.98 Scope 1
emissions have been calculated using the emission intensity factor of 51.33 kgCO2-
e/GJ for natural gas distributed by a pipeline.
Publicly available proposals by retailers for the carbon tax showed a variety of different
additional costs which have been identified - from operating cost to bad debt
increases. In addition, proposals for an uplift adjustment for retail margin has also
97 ESCOSA rejected the inclusion of a retail margin on the basis that there is no evidence that the
carbon price will materially increase those costs intended to be recovered by Origin Energy’s retail
margin. IPART accepted retail costs and margins on the carbon tax. For this report has been
assumed that retailers have recovered additional costs incurred from administering the carbon tax.
98 Clean Energy Act 2011, Section 33
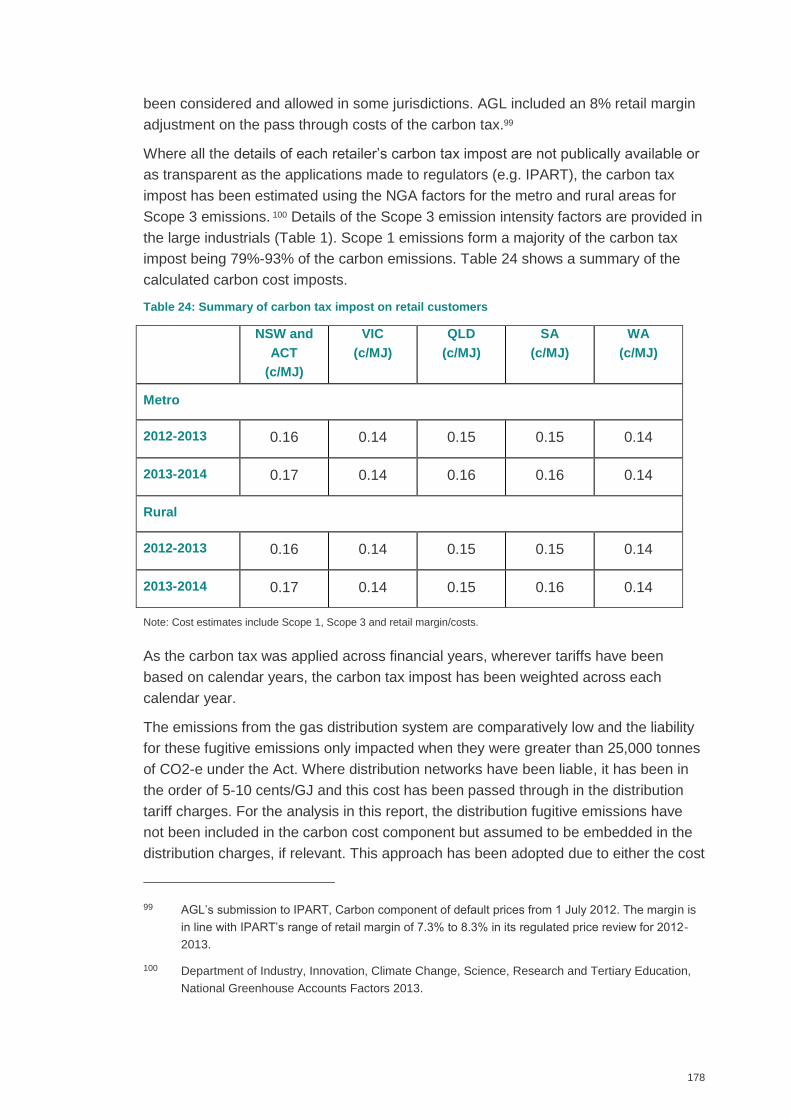
178
been considered and allowed in some jurisdictions. AGL included an 8% retail margin
adjustment on the pass through costs of the carbon tax.99
Where all the details of each retailer’s carbon tax impost are not publically available or
as transparent as the applications made to regulators (e.g. IPART), the carbon tax
impost has been estimated using the NGA factors for the metro and rural areas for
Scope 3 emissions. 100 Details of the Scope 3 emission intensity factors are provided in
the large industrials (Table 1). Scope 1 emissions form a majority of the carbon tax
impost being 79%-93% of the carbon emissions. Table 24 shows a summary of the
calculated carbon cost imposts.
Table 24: Summary of carbon tax impost on retail customers
NSW and
ACT
(c/MJ)
VIC
(c/MJ)
QLD
(c/MJ)
SA
(c/MJ)
WA
(c/MJ)
Metro
2012-2013 0.16 0.14 0.15 0.15 0.14
2013-2014 0.17 0.14 0.16 0.16 0.14
Rural
2012-2013 0.16 0.14 0.15 0.15 0.14
2013-2014 0.17 0.14 0.15 0.16 0.14
Note: Cost estimates include Scope 1, Scope 3 and retail margin/costs.
As the carbon tax was applied across financial years, wherever tariffs have been
based on calendar years, the carbon tax impost has been weighted across each
calendar year.
The emissions from the gas distribution system are comparatively low and the liability
for these fugitive emissions only impacted when they were greater than 25,000 tonnes
of CO2-e under the Act. Where distribution networks have been liable, it has been in
the order of 5-10 cents/GJ and this cost has been passed through in the distribution
tariff charges. For the analysis in this report, the distribution fugitive emissions have
not been included in the carbon cost component but assumed to be embedded in the
distribution charges, if relevant. This approach has been adopted due to either the cost
99 AGL’s submission to IPART, Carbon component of default prices from 1 July 2012. The margin is
in line with IPART’s range of retail margin of 7.3% to 8.3% in its regulated price review for 2012-
2013.
100 Department of Industry, Innovation, Climate Change, Science, Research and Tertiary Education,
National Greenhouse Accounts Factors 2013.
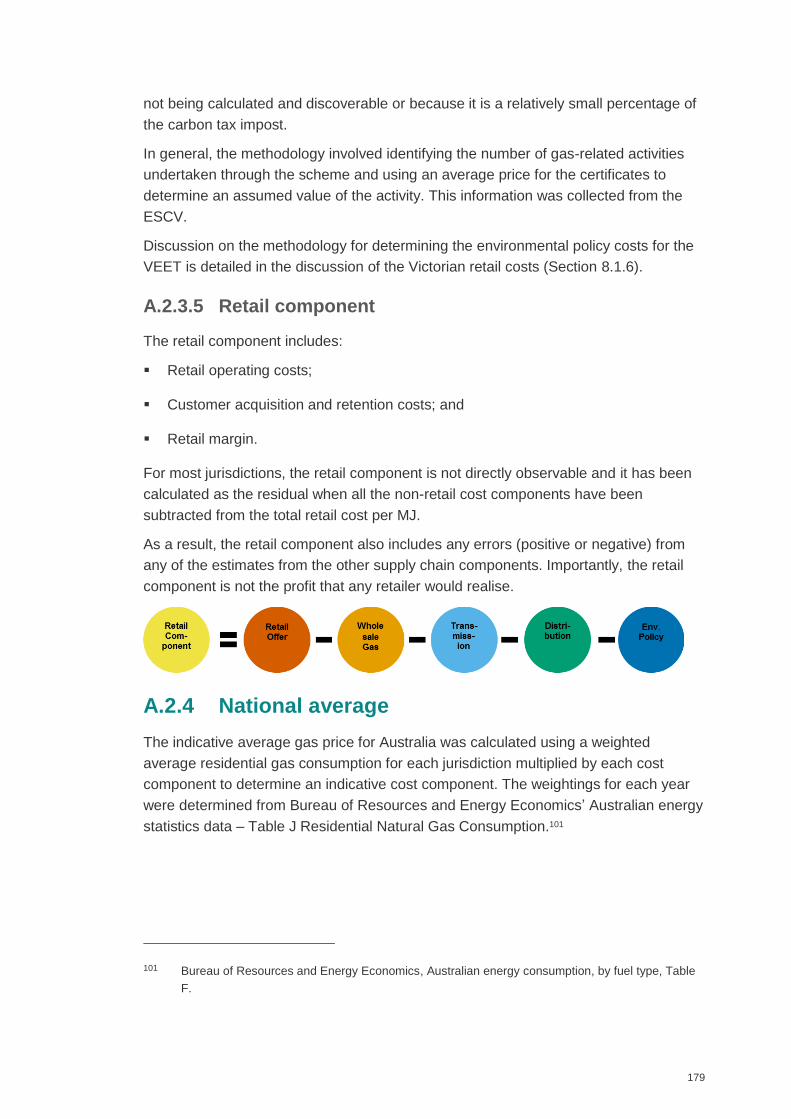
179
not being calculated and discoverable or because it is a relatively small percentage of
the carbon tax impost.
In general, the methodology involved identifying the number of gas-related activities
undertaken through the scheme and using an average price for the certificates to
determine an assumed value of the activity. This information was collected from the
ESCV.
Discussion on the methodology for determining the environmental policy costs for the
VEET is detailed in the discussion of the Victorian retail costs (Section 8.1.6).
A.2.3.5 Retail component
The retail component includes:
Retail operating costs;
Customer acquisition and retention costs; and
Retail margin.
For most jurisdictions, the retail component is not directly observable and it has been
calculated as the residual when all the non-retail cost components have been
subtracted from the total retail cost per MJ.
As a result, the retail component also includes any errors (positive or negative) from
any of the estimates from the other supply chain components. Importantly, the retail
component is not the profit that any retailer would realise.
A.2.4 National average
The indicative average gas price for Australia was calculated using a weighted
average residential gas consumption for each jurisdiction multiplied by each cost
component to determine an indicative cost component. The weightings for each year
were determined from Bureau of Resources and Energy Economics’ Australian energy
statistics data – Table J Residential Natural Gas Consumption.101
101 Bureau of Resources and Energy Economics, Australian energy consumption, by fuel type, Table
F.
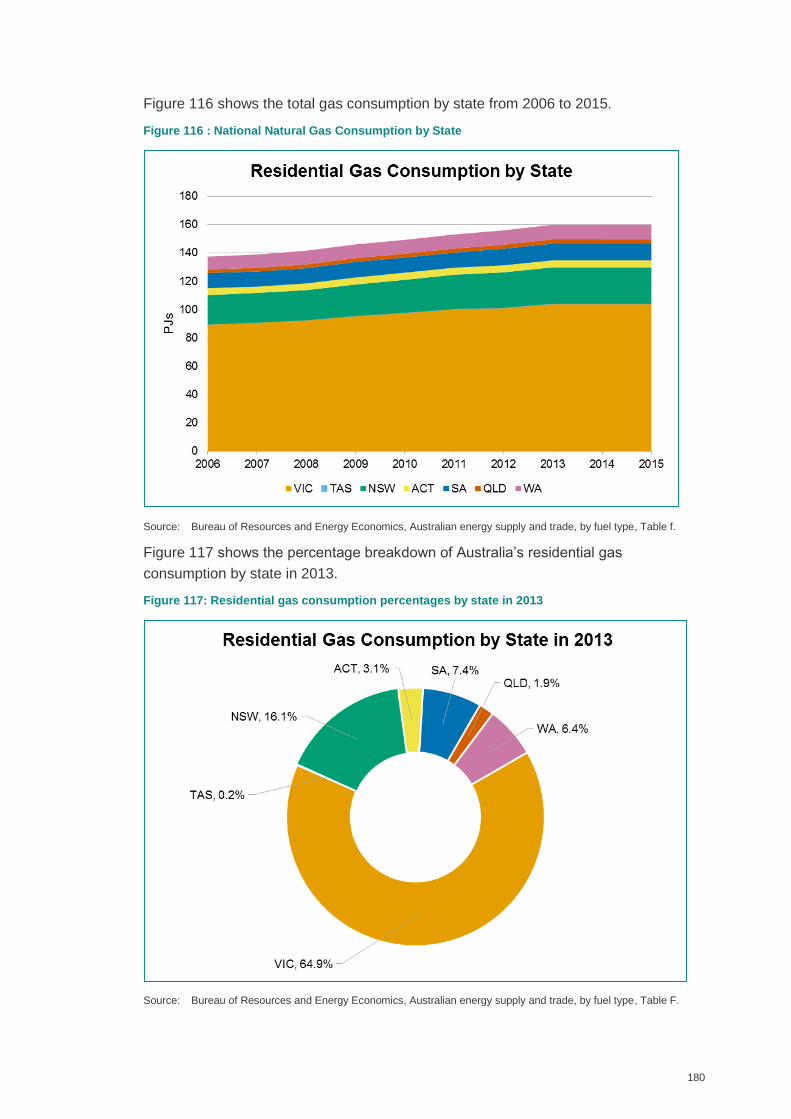
180
Figure 116 shows the total gas consumption by state from 2006 to 2015.
Figure 116 : National Natural Gas Consumption by State
Source: Bureau of Resources and Energy Economics, Australian energy supply and trade, by fuel type, Table f.
Figure 117 shows the percentage breakdown of Australia’s residential gas
consumption by state in 2013.
Figure 117: Residential gas consumption percentages by state in 2013
Source: Bureau of Resources and Energy Economics, Australian energy supply and trade, by fuel type, Table F.
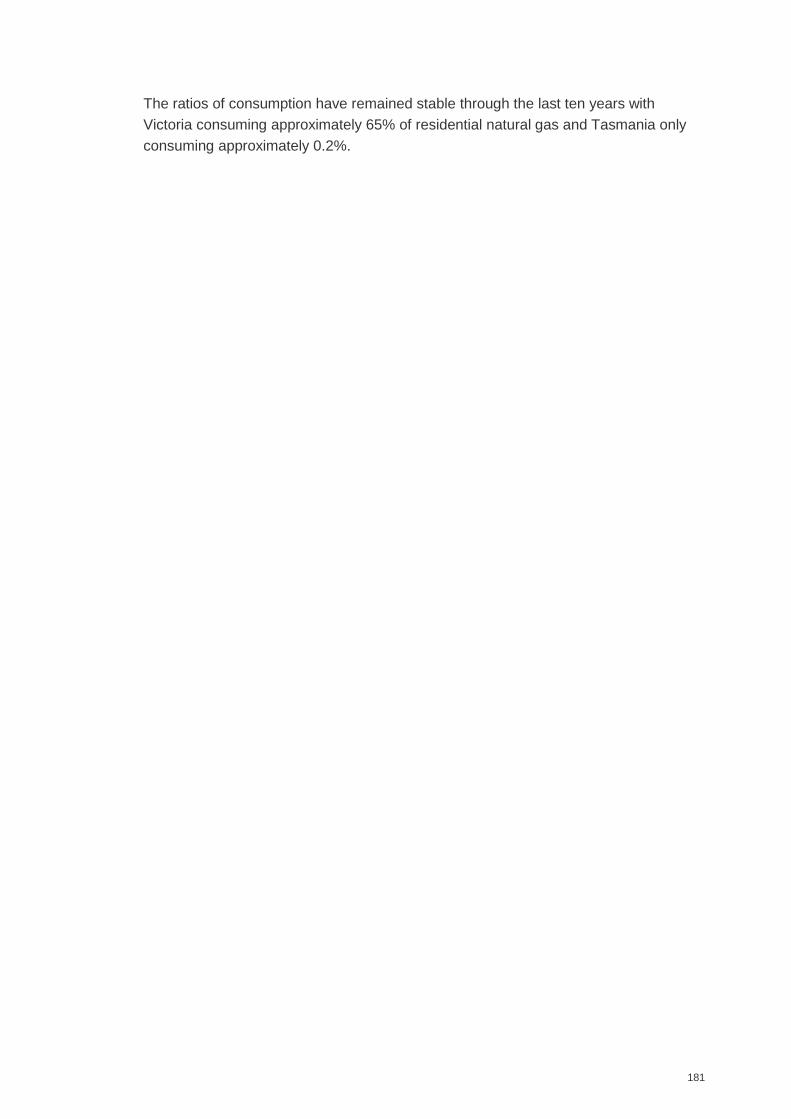
181
The ratios of consumption have remained stable through the last ten years with
Victoria consuming approximately 65% of residential natural gas and Tasmania only
consuming approximately 0.2%.