Embed Size (px)
Citation preview
Gas Fired Boiler—Test Report Refinery Site A
Characterization of Fine Particulate Emission Factors and Speciation Profiles from Stationary Petroleum Industry Combustion Sources
Regulatory and Scientific Affairs
PUBLICATION NUMBER 4703JULY 2001

Gas Fired Boiler—Test Report Refinery Site A
Characterization of Fine Particulate Emission Factors and Speciation Profiles from Stationary Petroleum Industry Combustion Sources
Regulatory and Scientific Affairs
API PUBLICATION NUMBER 4703JULY 2001
PREPARED UNDER CONTRACT BY:GE E
NERGY
AND
ENVIRONMENTAL
RESEARCH
CORPORATION
18 M
ASON
I
RVINE
, CA 92618
FOREWORD
API PUBLICATIONS NECESSARILY ADDRESS PROBLEMS OF A GENERAL NATURE.WITH RESPECT TO PARTICULAR CIRCUMSTANCES, LOCAL, STATE, AND FEDERALLAWS AND REGULATIONS SHOULD BE REVIEWED.
API IS NOT UNDERTAKING TO MEET THE DUTIES OF EMPLOYERS,MANUFACTURERS, OR SUPPLIERS TO WARN AND PROPERLY TRAIN AND EQUIPTHEIR EMPLOYEES, AND OTHERS EXPOSED, CONCERNING HEALTH AND SAFETYRISKS AND PRECAUTIONS, NOR UNDERTAKING THEIR OBLIGATIONS UNDERLOCAL, STATE, OR FEDERAL LAWS.
NOTHING CONTAINED IN ANY API PUBLICATION IS TO BE CONSTRUED ASGRANTING ANY RIGHT, BY IMPLICATION OR OTHERWISE, FOR THEMANUFACTURE, SALE, OR USE OF ANY METHOD, APPARATUS, OR PRODUCTCOVERED BY LETTERS PATENT. NEITHER SHOULD ANYTHING CONTAINED INTHE PUBLICATION BE CONSTRUED AS INSURING ANYONE AGAINST LIABILITYFOR INFRINGEMENT OF LETTERS PATENT.
All rights reserved. No part of this work may be reproduced, stored in a retrieval system, or transmitted byany means, electronic, mechanical, photocopying, recording, or otherwise, without prior written
permission from the publisher. Contact the publisher, API Publishing Services, 1220 L Street, N.W.,Washington, D.C. 20005.
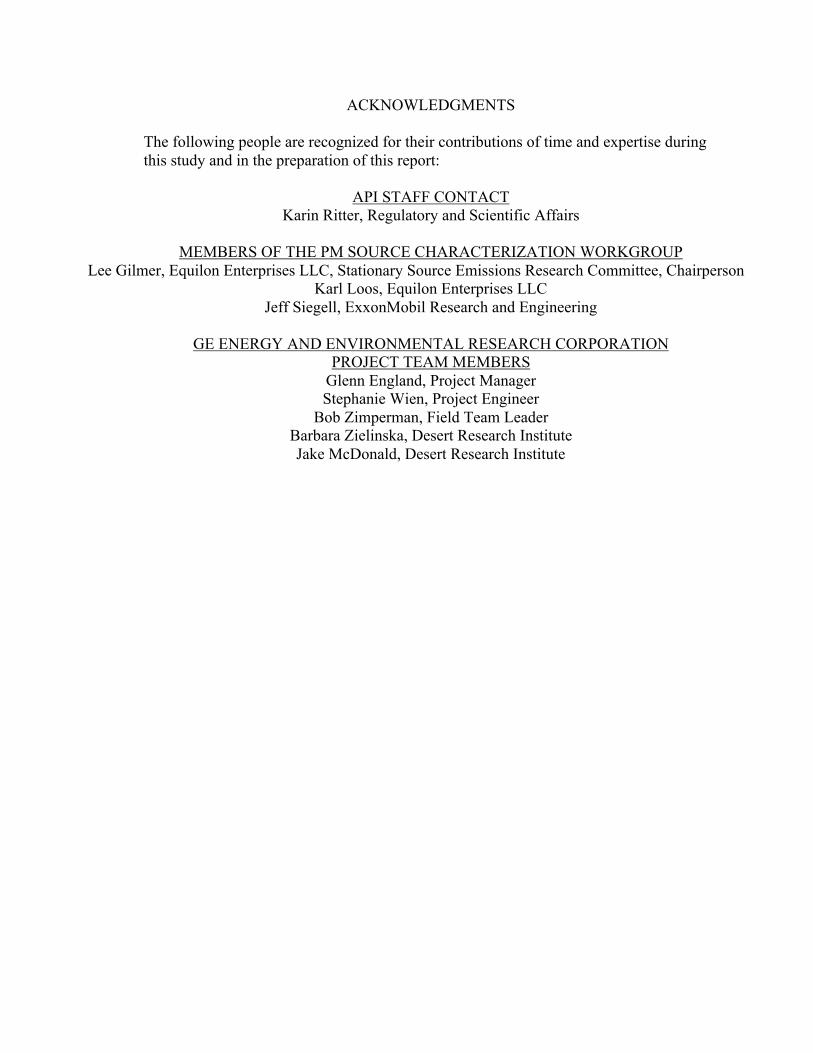
ACKNOWLEDGMENTS
The following people are recognized for their contributions of time and expertise duringthis study and in the preparation of this report:
API STAFF CONTACTKarin Ritter, Regulatory and Scientific Affairs
MEMBERS OF THE PM SOURCE CHARACTERIZATION WORKGROUPLee Gilmer, Equilon Enterprises LLC, Stationary Source Emissions Research Committee, Chairperson
Karl Loos, Equilon Enterprises LLCJeff Siegell, ExxonMobil Research and Engineering
GE ENERGY AND ENVIRONMENTAL RESEARCH CORPORATIONPROJECT TEAM MEMBERS
Glenn England, Project ManagerStephanie Wien, Project Engineer
Bob Zimperman, Field Team LeaderBarbara Zielinska, Desert Research InstituteJake McDonald, Desert Research Institute


TABLE OF CONTENTS
Section Page
EXECUTIVE SUMMARY................................................................................................ ES-1
1.0 PROJECT DESCRIPTION ....................................................................................... 1-1
PROJECT OVERVIEW ................................................................................ 1-1
PROJECT OBJECTIVES .............................................................................. 1-2
Primary Objectives............................................................................. 1-2
Secondary Objectives......................................................................... 1-2
TEST OVERVIEW ....................................................................................... 1-2
Source Level (In-Stack) Samples........................................................ 1-2
Dilution Stack Gas Samples ............................................................... 1-3
Process Samples................................................................................. 1-4
KEY PERSONNEL....................................................................................... 1-5
2.0 PROCESS DESCRIPTION....................................................................................... 2-1
SAMPLING LOCATIONS............................................................................ 2-1
3.0 TEST PROCEDURES .............................................................................................. 3-1
STACK GAS FLOW RATE, MOISTURE CONTENT AND
MOLECULAR WEIGHT.............................................................................. 3-1
O2, CO2, CO, NOX AND SO2 ........................................................................ 3-1
IN-STACK METHOD TESTS ...................................................................... 3-6
In-Stack Filterable Total PM, PM10 and PM2.5 ................................. 3-7
Condensible Particulate Matter Mass and Chemical Analysis ........... 3-12
DILUTION TUNNEL TESTS ..................................................................... 3-15
PM2.5 Mass ..................................................................................... 3-17
Elements .......................................................................................... 3-17
Sulfate, Nitrate, Chloride and Ammonium........................................ 3-18
Organic and Elemental Carbon......................................................... 3-19
Volatile Organic Compounds ........................................................... 3-19
Semivolatile Organic Compounds .................................................... 3-20
4.0 TEST RESULTS....................................................................................................... 4-1
PROCESS OPERATING CONDITIONS ...................................................... 4-1
PRELIMINARY TEST RESULTS................................................................ 4-1
STACK CONDITIONS AND FLOW RATE................................................. 4-5
CO, NOX AND SO2 EMISSIONS.................................................................. 4-6
IN-STACK AND IMPINGER METHOD RESULTS .................................... 4-7
Particulate Mass ................................................................................. 4-7
OC, EC and SVOCs ......................................................................... 4-12
DILUTION TUNNEL RESULTS................................................................ 4-14
Particulate Mass ............................................................................... 4-14
Sulfate, Chloride, Nitrate and Ammonium........................................ 4-15
OC, EC and Organic Species............................................................ 4-15
Elements .......................................................................................... 4-19
5.0 EMISSION FACTORS AND SPECIATION PROFILES.......................................... 5-1
UNCERTAINTY........................................................................................... 5-1
EMISSION FACTORS FOR PRIMARY EMISSIONS ................................. 5-1
PM2.5 SPECIATION PROFILES.................................................................. 5-5
Dilution Tunnel.................................................................................. 5-5
Method 201A/202 .............................................................................. 5-8
SPECIATION PROFILES FOR ORGANIC AEROSOLS ............................. 5-8
Dilution Tunnel Organic Speciation ................................................... 5-8
Method 201A/202 Organic Speciation.............................................. 5-10
6.0 QUALITY ASSURANCE......................................................................................... 6-1
SAMPLE STORAGE AND SHIPPING......................................................... 6-1
DILUTION TUNNEL FLOWS ..................................................................... 6-1
GRAVIMETRIC ANALYSIS ....................................................................... 6-1
ELEMENTAL (XRF) ANALYSIS................................................................ 6-3
ORGANIC AND ELEMENTAL CARBON ANALYSIS .............................. 6-4
SULFATE, NITRATE, CHLORIDE AND AMMONIUM
ANALYSIS ................................................................................................... 6-5
SVOC ANALYSIS........................................................................................ 6-6
VOC ANALYSIS.......................................................................................... 6-8
TABLE OF CONTENTS (CONTINUED)
Section Page
CEMS ANALYSIS...................................................................................... 6-12
7.0 DISCUSSION AND FINDINGS............................................................................... 7-1
PM2.5 MASS MEASUREMENTS................................................................ 7-1
CHEMICAL SPECIATION OF PRIMARY PM2.5 EMISSIONS.................. 7-5
SECONDARY PM2.5 PRECURSOR EMISSIONS .................................... 7-11
REFERENCES.................................................................................................................... R-1
Appendix AGLOSSARY ..................................................................................................................... A-1
Appendix BSI CONVERSION FACTORS............................................................................................. B-1
LIST OF FIGURES
Figure Page
E-1 Speciation Profile for Primary Particulate Emissions from Gas-Fired Boiler
(Refinery Site A)................................................................................................. ES-10
2-1 Boiler Process Overview and Sampling/Monitoring Locations .................................2-2
3-1 Chronology for Gas-Fired Boiler (Refinery Site A) ..................................................3-3
3-2 CEMS Schematic .....................................................................................................3-5
3-3 PM2.5/PM10 Train Configuration for Method 201A/202 .........................................3-8
3-4 Method 201A (Modified) Sample Recovery Procedure ............................................3-9
3-5 Method 201A Modified Sample Analysis Procedure ..............................................3-10
3-6 Sampling Train Configuration for EPA Method 17.................................................3-11
3-7 Method 202 Sample Recovery Procedure ...............................................................3-13
3-8 Method 202 Sample Modified Analysis Procedure .................................................3-14
3-9 Dilution Tunnel Sampling System..........................................................................3-16
5-1 Speciation Profile-Dilution Tunnel PM2.5 Fractions ................................................5-9
5-2 Speciation Profile-Method 201A/202 .....................................................................5-11
5-3 Organic Aerosol Mass Fraction Speciation .............................................................5-14
5-4 In-Stack Organic Aerosol Mass Fraction Speciation ...............................................5-17
7-1 Speciation of Inorganic Impinger Fraction Reanalysis (Refinery Site A) ..................7-2
7-2 Results of Laboratory Tests Showing Effect of SO2 and Purge on
Method 202 Sulfate Bias ..........................................................................................7-4
7-3 In-Stack and Ambient Species Concentrations (Dilution Tunnel)
(Refinery Site A)......................................................................................................7-6
7-4 Comparison of Species Concentrations to Detection Limits (Dilution Tunnel)..........7-7
7-5 Mean Species Concentrations and Standard Deviation (Dilution Tunnel) .................7-8
LIST OF TABLESTable Page
E-1 Summary of Primary Particulate Emission Factors for Gas-Fired Refinery
Boiler ................................................................................................................... ES-4
E-2 Summary of Semivolatile Organic Species Emission Factors for Gas-Fired
Refinery Boiler ...................................................................................................... ES-5
E-3 Summary of Secondary Particulate Precursor Emission Factors for Gas-Fired
Refinery Boiler....................................................................................................... ES-8
E-4 Substances of Interest Not Detected in Stack Emissions from Gas-Fired Boiler...... ES-9
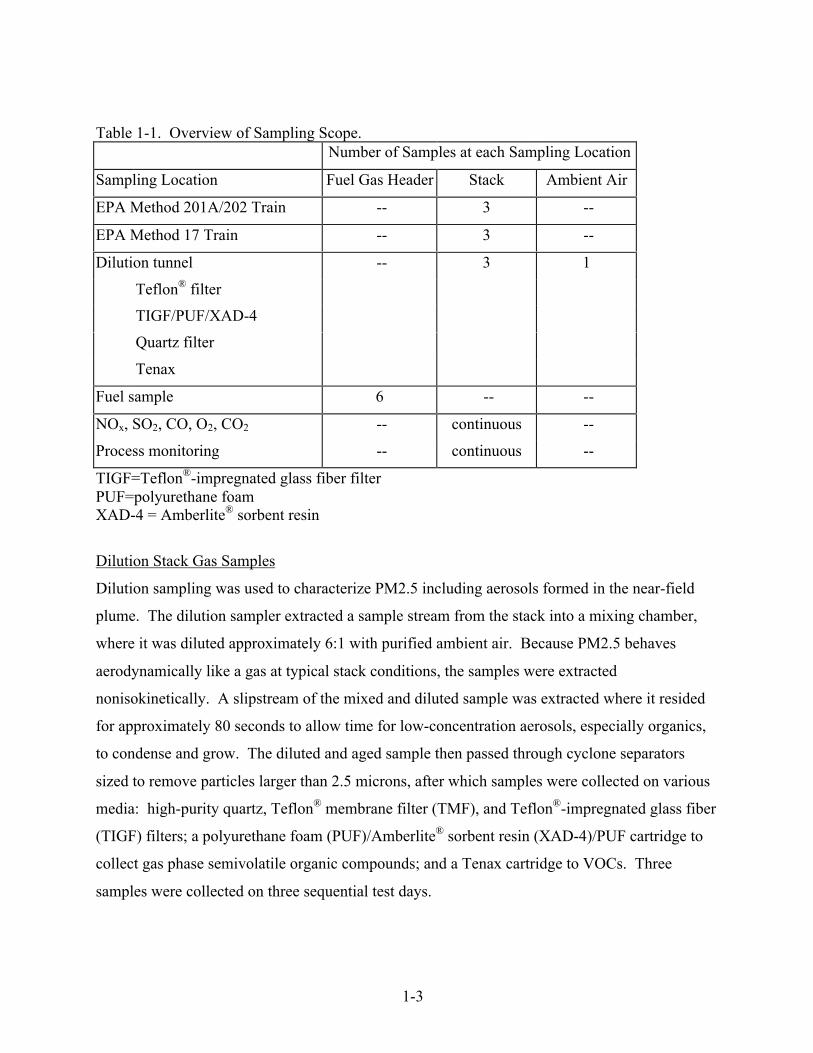
1-1 Overview of Sampling Scope .................................................................................... 1-3
1-2 Summary of Analytical Targets ................................................................................. 1-4
3-1 Summary of Test Procedures..................................................................................... 3-2
3-2 Description of CEMS Instrumentation Used for Gas-Fired
Boiler Test (Refinery Site A)..................................................................................... 3-6
4-1 Approximate In-Stack Detection Limits Achieved for Gas-Fired
Boiler Tests (Refinery A) .......................................................................................... 4-2
4-2 Process Data for Gas-Fired Boiler (Refinery Site A).................................................. 4-3
4-3 Fuel Gas Analyses for Gas-Fired Boiler (Refinery Site A)......................................... 4-4
4-4 Stratification Data for Gas-Fired Boiler (Refinery Site A) ......................................... 4-5
4-5 Stack Gas Summary for Gas-Fired Boiler (Refinery Site A) ...................................... 4-6
4-6 CEMS Data For Gas-Fired Boiler (Refinery Site A) .................................................. 4-7
4-7 Filterable Particulate Matter (Method 201A) for Gas-Fired Boiler
(Refinery Site A)....................................................................................................... 4-8
4-8 Condensible Particulate for Gas-Fired Boiler (Refinery Site A)................................. 4-9
4-9 Method 202 Inorganic Residue Analysis ................................................................. 4-11
4-10 In-Stack Organic and Elemental Carbon Results for Gas-Fired Boiler
(Refinery Site A) .................................................................................................... 4-13
4-11 In-Stack SVOC Results for Gas-Fired Boiler (Refinery Site A) .............................. 4-13
4-12 Stack Gas PM2.5 Results for Gas-Fired Boiler (Refinery Site A) ........................... 4-14
4-13 Ambient Air PM2.5 Results for Gas-Fired Boiler (Refinery Site A) ........................ 4-14
LIST OF TABLES (CONTINUED)
Table Page
4-14 Dilution Tunnel Sulfate, Nitrate, Chloride and Ammonium Results for
Gas-Fired Boiler (Refinery Site A) .......................................................................... 4-15
4-15 Dilution Tunnel Organic and Elemental Carbon Results for Gas-Fired
Boiler (Refinery Site A) .......................................................................................... 4-16
4-16 Dilution Tunnel SVOC Results for Gas-Fired Boiler (Refinery Site A) ................... 4-17
4-17 Dilution Tunnel VOC Results for Gas-Fired Boiler (Refinery Site A) ..................... 4-20
4-18 Dilution Tunnel Elemental Results for Gas-Fired Boiler (Refinery Site A) .............. 4-21
5-1 Primary Emissions - Particulate Mass and Elements.................................................. 5-2
5-2 Primary Emissions - Carbon and Semivolatile Organic Compounds .......................... 5-3
5-3 Emission Factors for Secondary Organic Aerosol Precursors (VOC) ......................... 5-6
5-4 Emission Factors for Secondary Organic Aerosol Precursors - NOx
and SO2..................................................................................................................... 5-6
5-5 Speciation Profile for Dilution Tunnel Primary Emissions for Gas-Fired
Boiler (Refinery Site A) ............................................................................................ 5-7
5-6 Speciation Profile for PM2.5 for Gas-Fired Boiler (Refinery Site A)
(Method 201 A/202)................................................................................................ 5-10
5-7 Organic Aerosol Speciation Profile ......................................................................... 5-12
5-8 Organic Aerosol Speciation Profile (Method 201A/202).......................................... 5-16
6-1 Pre- and Post- Test Dilution Tunnel Flow Checks for the Gas-Fired Boiler
(Refinery Site A)....................................................................................................... 6-2
6-2 Method 201A/202 Blank Results............................................................................... 6-3
6-3 Results from Field Blank Acetone Rinses.................................................................. 6-3
6-4 Field Blank for Elements........................................................................................... 6-4
6-5 Organic and Elemental Carbon Blanks and Replicate Sample (mg/dscm) .................. 6-5
6-6 Ion Blank Results ...................................................................................................... 6-6
6-7 SVOC/PUF/XAD Field Blank Results ...................................................................... 6-9
6-8 SVOC PUF/XAD Replicate Analysis Results.......................................................... 6-10
ES-1
EXECUTIVE SUMMARY
In 1997, the United States Environmental Protection Agency (EPA) promulgated new ambient
air standards for particulate matter smaller than 2.5 micrometers in diameter (PM2.5). Source
emissions data are needed to assess the contribution of petroleum industry combustion sources to
ambient PM2.5 concentrations for receptor modeling and PM2.5 standard attainment strategy
development. There are few existing data on emissions and characteristics of fine aerosols from
petroleum industry combustion sources, and the limited information that is available is
incomplete and outdated. The American Petroleum Institute (API) developed a test protocol to
address this data gap, specifically to:
· Develop emission factors and speciation profiles for emissions of primary fineparticulate matter (i.e., particulate present in the stack flue gas includingcondensible aerosols), especially organic aerosols from gas-fired combustiondevices; and
· Identify and characterize secondary particulate (i.e., particulate formed viareaction of stack emissions in the atmosphere) precursor emissions.
This report presents results of a pilot project to evaluate the test protocol on 550,000 pounds per
hour steam (approximately 650 x 106 British thermal units per hour) boiler firing refinery process
gas. The tangentially fired boiler has a waterwall furnace with two rows of burners in each
corner of the furnace. The unit has no controls for NOx emissions. The boiler operated at
approximately 57 percent of capacity, and flue gas temperature at the stack was approximately
345 degrees Fahrenheit during the tests.
The particulate measurements at the stack were made using both a dilution tunnel research test
method and traditional methods for regulatory enforcement of particulate regulations. The
dilution tunnel method is attractive because the sample collection media and analysis methods
are identical to those used for ambient air sampling. Thus, the results are directly comparable
with ambient air data. Also, the dilution tunnel method is believed to provide representative
results for condensible aerosols. Regulatory methods are attractive because they are readily
accepted by regulatory agencies and have been used extensively on a wide variety of source
ES-2
types; existing regulatory methods for condensible aerosols may be subject to significant bias,
however, and sampling/analytical options are limited.
Emission factors for all species measured are extremely low, which is expected for gas-fired
sources. Emission factors for primary particulate, including: total particulate, PM10 (particles
smaller than nominally 10 micrometers), and PM2.5; elements; ionic species; and organic and
elemental carbon are presented in Table E-1. Since the boiler was firing refinery process gas
with a heating value different from natural gas, emission factors are expressed in pounds of
pollutant per million British thermal units of gas fired (lb/MMBtu). All tests were performed in
triplicate. As a measure of the bias, precision, and variability of the results, the uncertainty and
95 percent confidence upper bound also are presented.
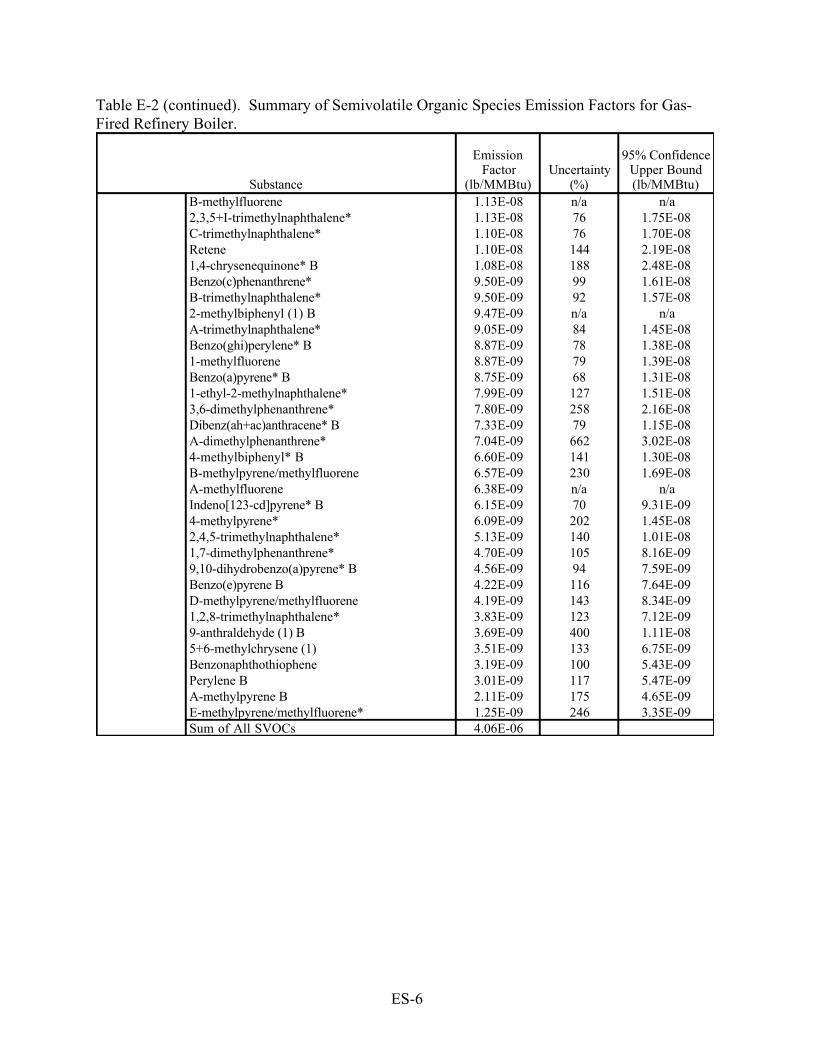
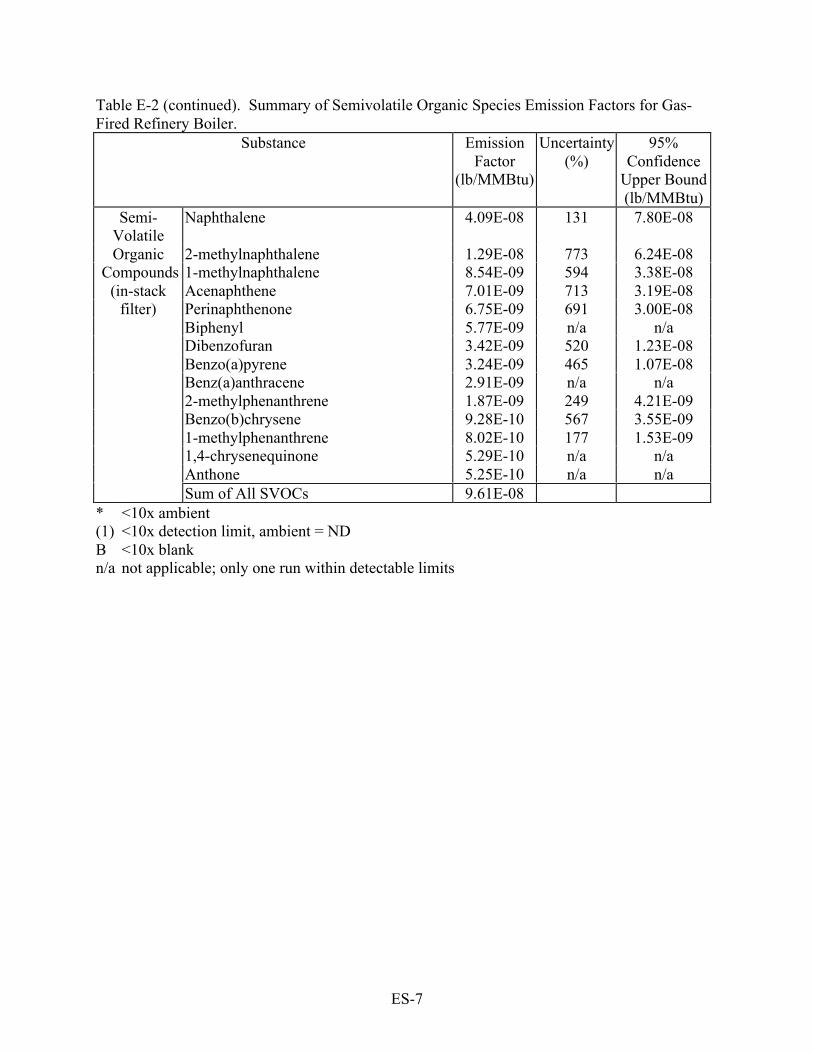
Emission factors for semivolatile organic species are presented in Table E-2. The sum of
semivolatile organic species is approximately three percent of the organic carbon. Emission
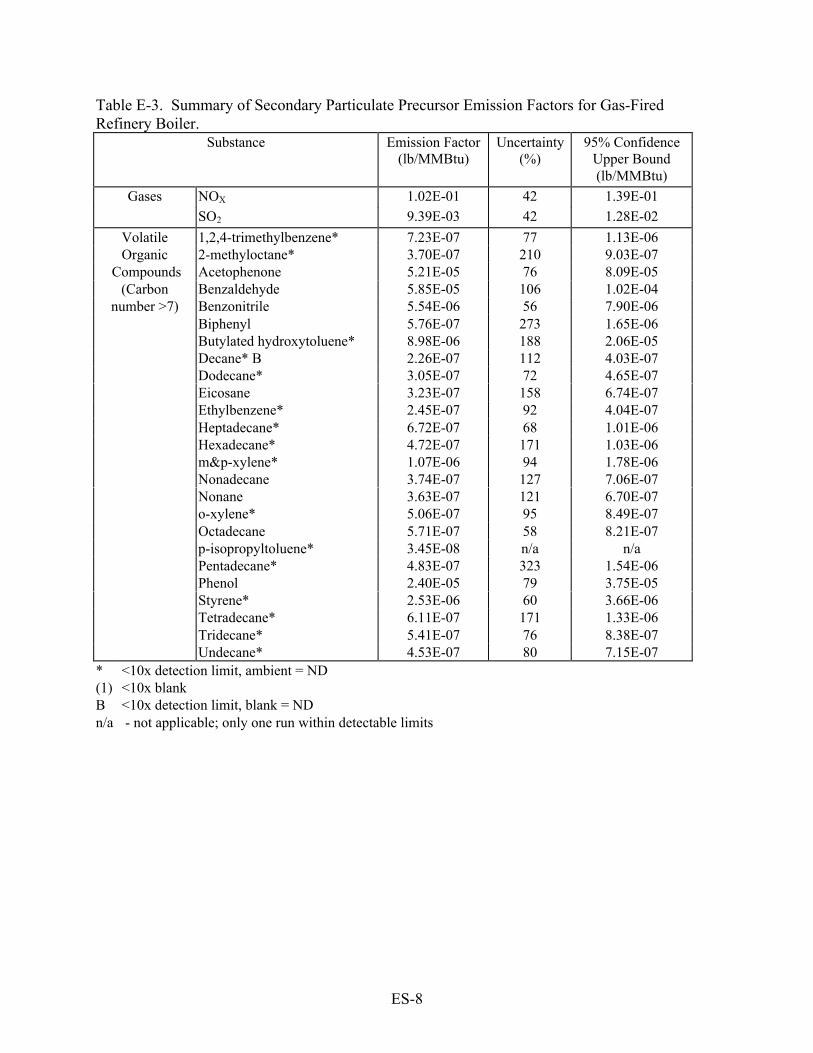
factors for secondary particulate precursors (NOx, SO2, and volatile organic species with carbon
number of 7 or greater) are presented in Table E-3.
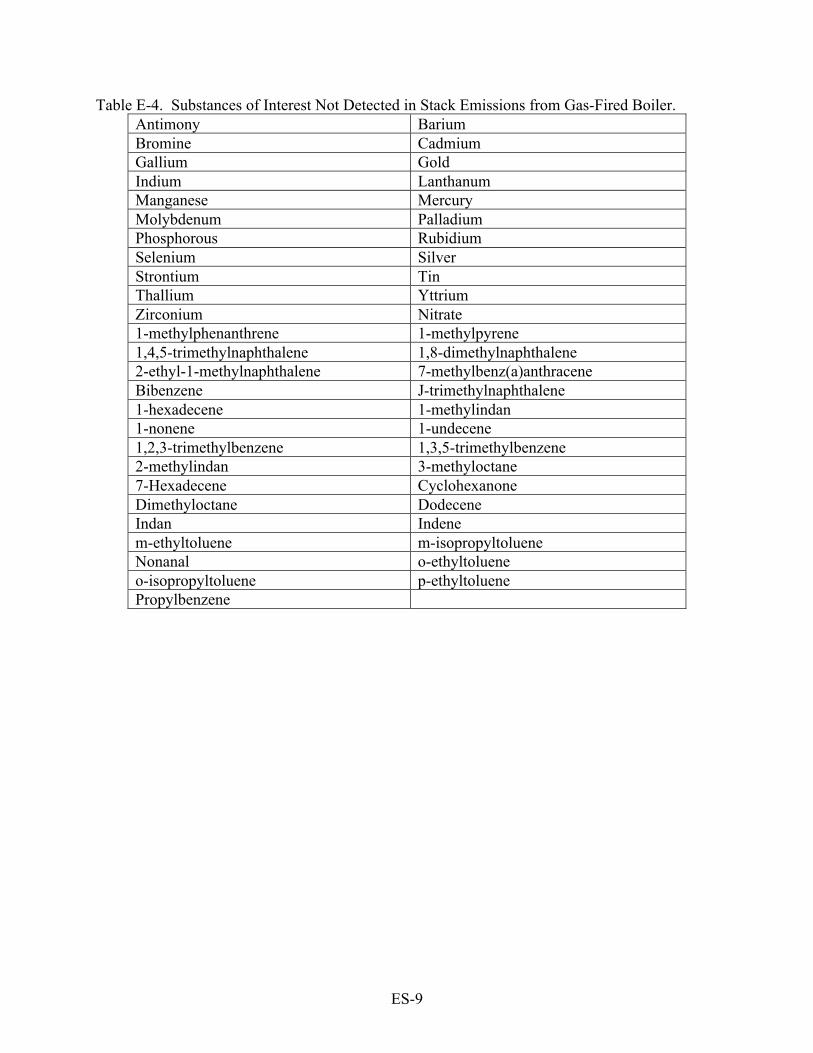
The preceding tables include only those substances that were detected in at least one of the three
test runs. Substances of interest that were not present above the minimum detection limit for
these tests are listed in Table E-4.
A single ambient air sample was collected at the site. In some cases, the emission factors
reported in Tables E-1 to E-3 resulted from in-stack concentrations that were near ambient air
concentrations. Those species concentrations that are within a factor of 10 of the ambient air
concentration are indicated on the table by an asterisk (*).
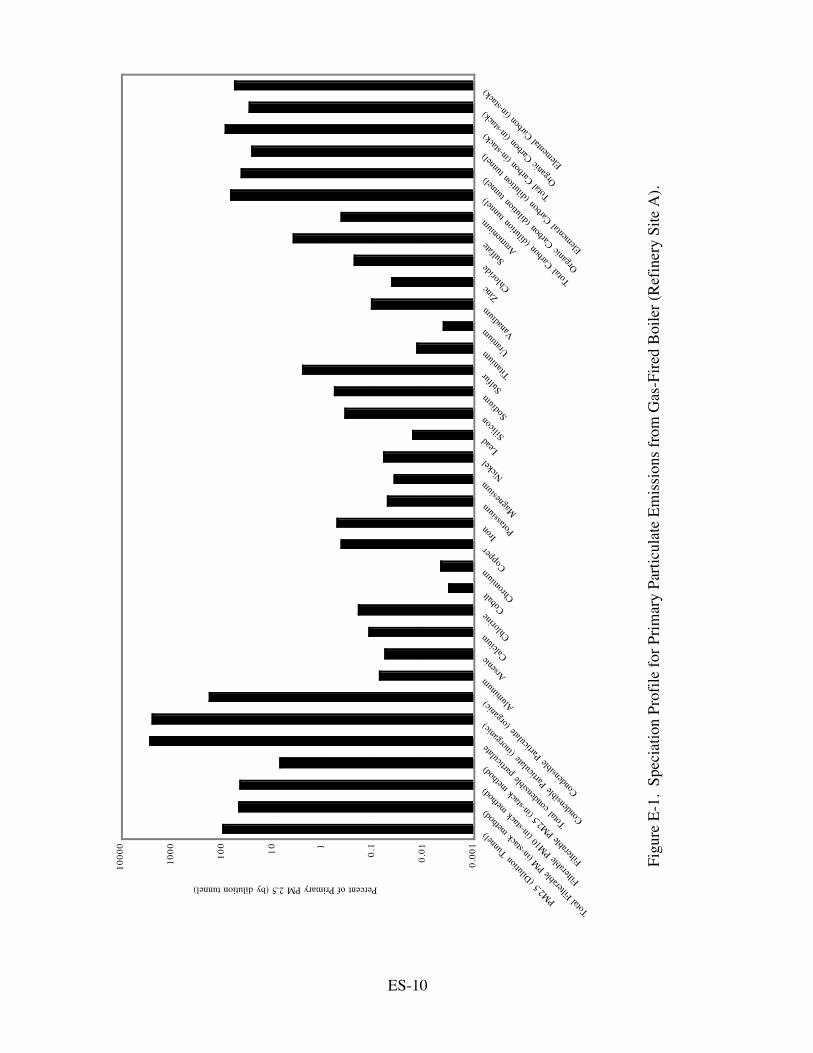
The primary particulate results presented in Table E-1 also may be expressed as a PM2.5
speciation profile, which is the mass fraction of each species contributing to the total PM2.5
mass. The speciation profile is presented in Figure E-1.
ES-3
The main findings of these tests are:
· Particulate mass emissions from the boiler were extremely low, consistent with levelsexpected for gaseous fuel combustion.
· Two methods for determining the average emission factor for primary PM2.5 massgave results which differed in magnitude by a factor of 27: 0.000358 lb/MMBtu usingthe dilution tunnel; and 0.00974 lb/MMBtu using conventional in-stack methods forfilterable and condensible particulate.
· Sampling and analytical artifacts principally caused by gaseous SO2 in the stack gaswere shown to produce a relatively large positive bias in condensible particulate asmeasured by conventional in-stack methods. Most of the difference between thedilution tunnel and conventional method results can be explained by thesemeasurement artifacts. The results using conventional EPA methods are nominallyconsistent with published EPA emission factors for external combustion of naturalgas (U. S. EPA, 1998). Therefore, the published EPA emission factors derived fromtests using similar measurement methods also may be positively biased.
· Chemical species accounting for 74 percent of the measured PM2.5 mass werequantified.
· Organic and elemental carbon comprise 68 percent of the measured primary PM2.5mass.
· Sulfates, iron, copper, chloride, and smaller amounts of other elements account foranother 6 percent of the measured PM2.5 mass.
· Less than 26 percent of the measured PM2.5 mass is unspeciated.
· Most elements are not present at levels significantly above the background levels inthe ambient air or the minimum detection limits of the test methods.
· Most organic species are not detected at levels significantly above background levelsin the ambient air or field blanks. All detected organics are present at extremely lowlevels consistent with gaseous fuel combustion.
· Emissions of secondary particle precursors are low and consistent with levelsexpected for gaseous fuel combustion.
ES-4
Table E-1. Summary of Primary Particulate Emission Factors for Gas-Fired Refinery Boiler.Substance Emission Uncertainty 95% Confidence
Particulate Condensible Particulate (inorganic) 9.07E-3 107 1.58E-2Condensible Particulate (organic) 6.36E-4 290 1.89E-3Total Condensible Particulate 9.16E-3 118 1.66E-2Total Filterable PM (in-stack method) 1.66E-4 332 5.40E-4Filterable PM10 (in-stack method) 1.58E-4 n/a n/aFilterable PM2.5 (in-stack method) 2.64E-5 n/a n/aPM2.5 (dilution tunnel) 5.58E-4 80 8.69E-4
Elements Aluminum* 2.65E-7 54 3.68E-7Arsenic 2.11E-7 79 3.27E-7Calcium* 4.46E-7 147 8.93E-7Chlorine 7.12E-7 n/a n/aCobalt (1) 1.13E-8 450 3.66E-8Chromium* 1.61E-8 n/a n/aCopper* 1.55E-6 112 2.74E-6Iron* 1.93E-6 79 2.99E-6Potassium* 1.87E-7 116 3.36E-7Magnesium* B 1.38E-7 292 4.11E-7Nickel 2.25E-7 86 3.59E-7Lead* 5.82E-8 746 2.74E-7Silicon* 1.27E-6 64 1.84E-6Sodium 2.13E-6 162 4.48E-6Sulfur* 8.94E-6 76 1.37E-5Titanium* 4.75E-8 n/a n/aUranium (1) 1.45E-8 n/a n/aVanadium 3.90E-7 97 6.51E-7Zinc* 1.59E-7 87 2.55E-7
Ions Sulfate* 1.43E-5 68 2.11E-5Nitrate ND n/a n/aChloride (1) 8.46E-7 n/a n/aAmmonium* 1.60E-6 95 2.64E-6
Carbon Organic Carbon (dilution tunnel) 1.55E-4 55 2.16E-4Elemental Carbon (dilution tunnel) 9.41E-5 114 1.68E-4Total Carbon (dilution tunnel) 2.49E-4 59 3.54E-4Organic Carbon (in-stack) 1.05E-4 70 1.57E-4Elemental Carbon (in-stack) 2.03E-4 121 3.72E-4Total Carbon (in-stack) 3.08E-4 55 4.32E-4
* <10x ambient(1) <10x detection limit, ambient=NDB <10x blankn/a - not applicable; only one run within detectable limits
ES-5
Table E-2. Summary of Semivolatile Organic Species Emission Factors for Gas-Fired RefineryBoiler.
Substance
Emission Factor
(lb/MMBtu)Uncertainty
(%)
95% Confidence Upper Bound (lb/MMBtu)
Semivolatile Phenanthrene 1.03E-06 94 1.71E-06 Organic Perinaphthenone 3.78E-07 134 7.29E-07
Compounds Fluoranthene 2.83E-07 136 5.49E-07(Dilution Biphenyl 2.49E-07 372 8.78E-07Tunnel/ Pyrene 1.99E-07 126 3.72E-07
PUF/XAD) Cholestane B 1.91E-07 75 2.94E-07Coronene* 1.80E-07 62 2.64E-07Fluorene* 1.11E-07 76 1.72E-07Naphthalene* 1.04E-07 544 3.88E-07Anthracene 7.83E-08 112 1.39E-07Acenaphthylene 6.04E-08 283 1.77E-07Acenaphthenequinone B 5.48E-08 136 1.06E-07B-methylphenanthrene 5.10E-08 113 9.14E-082-methylnaphthalene* 4.44E-08 159 9.31E-081,4+1,5+2,3-dimethylnaphthalene* 4.41E-08 n/a n/a3-methylbiphenyl* 4.41E-08 125 8.24E-081,3+1,6+1,7-dimethylnaphthalene* 4.06E-08 140 8.00E-08Anthraquinone* B 4.00E-08 64 5.90E-089-methylanthracene 3.66E-08 n/a n/a2-methylphenanthrene* 3.55E-08 150 7.22E-08A-methylphenanthrene* 3.34E-08 145 6.70E-08Benzanthrone* B 3.22E-08 56 4.59E-082-phenylnaphthalene 3.13E-08 126 5.86E-08Xanthone B 3.10E-08 n/a n/a9-fluorenone 2.82E-08 n/a n/aBenzo(b+j+k)fluoranthene* 2.78E-08 58 4.00E-081-methylnaphthalene* 2.77E-08 169 5.99E-08Benz(a)anthracene* 2.51E-08 137 4.88E-08Benzo(b)chrysene* 2.39E-08 56 3.40E-081-methylpyrene+C-methylpyrene/fluorene 2.36E-08 188 4.63E-08Benz(a)anthracene-7,12* B 2.17E-08 65 3.20E-084H-cyclopenta(def)phenanthrene B 2.07E-08 97 3.49E-082,6+2,7-dimethylnaphthalene* 1.99E-08 122 3.69E-087-methylbenzo(a)pyrene (1) 1.94E-08 75 2.98E-08Chrysene* B 1.84E-08 71 2.79E-08F-trimethylnaphthalene* 1.84E-08 264 4.28E-08C-dimethylphenanthrene* 1.82E-08 315 5.72E-08Dibenzofuran* 1.80E-08 66 2.68E-08B-dimethylphenanthrene 1.76E-08 238 3.88E-081,2-dimethylnaphthalene* 1.68E-08 n/a n/a1+2-ethylnaphthalene* 1.65E-08 214 3.44E-08C-methylphenanthrene* 1.57E-08 79 2.45E-08Acenaphthene* 1.55E-08 63 2.27E-08E-trimethylnaphthalene* 1.54E-08 297 4.64E-081-phenylnaphthalene (1) 1.17E-08 126 2.20E-08Anthrone* B 1.17E-08 69 1.76E-08D-dimethylphenanthrene 1.17E-08 76 1.81E-08E-dimethylphenanthrene* 1.14E-08 445 3.67E-08
ES-6
Table E-2 (continued). Summary of Semivolatile Organic Species Emission Factors for Gas-Fired Refinery Boiler.
Substance
Emission Factor
(lb/MMBtu)Uncertainty
(%)
95% Confidence Upper Bound (lb/MMBtu)
B-methylfluorene 1.13E-08 n/a n/a2,3,5+I-trimethylnaphthalene* 1.13E-08 76 1.75E-08C-trimethylnaphthalene* 1.10E-08 76 1.70E-08Retene 1.10E-08 144 2.19E-081,4-chrysenequinone* B 1.08E-08 188 2.48E-08Benzo(c)phenanthrene* 9.50E-09 99 1.61E-08B-trimethylnaphthalene* 9.50E-09 92 1.57E-082-methylbiphenyl (1) B 9.47E-09 n/a n/aA-trimethylnaphthalene* 9.05E-09 84 1.45E-08Benzo(ghi)perylene* B 8.87E-09 78 1.38E-081-methylfluorene 8.87E-09 79 1.39E-08Benzo(a)pyrene* B 8.75E-09 68 1.31E-081-ethyl-2-methylnaphthalene* 7.99E-09 127 1.51E-083,6-dimethylphenanthrene* 7.80E-09 258 2.16E-08Dibenz(ah+ac)anthracene* B 7.33E-09 79 1.15E-08A-dimethylphenanthrene* 7.04E-09 662 3.02E-084-methylbiphenyl* B 6.60E-09 141 1.30E-08B-methylpyrene/methylfluorene 6.57E-09 230 1.69E-08A-methylfluorene 6.38E-09 n/a n/aIndeno[123-cd]pyrene* B 6.15E-09 70 9.31E-094-methylpyrene* 6.09E-09 202 1.45E-082,4,5-trimethylnaphthalene* 5.13E-09 140 1.01E-081,7-dimethylphenanthrene* 4.70E-09 105 8.16E-099,10-dihydrobenzo(a)pyrene* B 4.56E-09 94 7.59E-09Benzo(e)pyrene B 4.22E-09 116 7.64E-09D-methylpyrene/methylfluorene 4.19E-09 143 8.34E-091,2,8-trimethylnaphthalene* 3.83E-09 123 7.12E-099-anthraldehyde (1) B 3.69E-09 400 1.11E-085+6-methylchrysene (1) 3.51E-09 133 6.75E-09Benzonaphthothiophene 3.19E-09 100 5.43E-09Perylene B 3.01E-09 117 5.47E-09A-methylpyrene B 2.11E-09 175 4.65E-09E-methylpyrene/methylfluorene* 1.25E-09 246 3.35E-09Sum of All SVOCs 4.06E-06
ES-7
Table E-2 (continued). Summary of Semivolatile Organic Species Emission Factors for Gas-Fired Refinery Boiler.
Substance EmissionFactor
(lb/MMBtu)
Uncertainty(%)
95%Confidence
Upper Bound(lb/MMBtu)
Semi-Volatile
Naphthalene 4.09E-08 131 7.80E-08
Organic 2-methylnaphthalene 1.29E-08 773 6.24E-08 Compounds 1-methylnaphthalene 8.54E-09 594 3.38E-08
(in-stack Acenaphthene 7.01E-09 713 3.19E-08filter) Perinaphthenone 6.75E-09 691 3.00E-08
Biphenyl 5.77E-09 n/a n/aDibenzofuran 3.42E-09 520 1.23E-08Benzo(a)pyrene 3.24E-09 465 1.07E-08Benz(a)anthracene 2.91E-09 n/a n/a2-methylphenanthrene 1.87E-09 249 4.21E-09Benzo(b)chrysene 9.28E-10 567 3.55E-091-methylphenanthrene 8.02E-10 177 1.53E-091,4-chrysenequinone 5.29E-10 n/a n/aAnthone 5.25E-10 n/a n/aSum of All SVOCs 9.61E-08
* <10x ambient(1) <10x detection limit, ambient = NDB <10x blankn/a not applicable; only one run within detectable limits
ES-8
Table E-3. Summary of Secondary Particulate Precursor Emission Factors for Gas-FiredRefinery Boiler.
Substance Emission Factor(lb/MMBtu)
Uncertainty(%)
95% ConfidenceUpper Bound(lb/MMBtu)
Gases NOX 1.02E-01 42 1.39E-01SO2 9.39E-03 42 1.28E-02
Volatile 1,2,4-trimethylbenzene* 7.23E-07 77 1.13E-06Organic 2-methyloctane* 3.70E-07 210 9.03E-07
Compounds Acetophenone 5.21E-05 76 8.09E-05(Carbon Benzaldehyde 5.85E-05 106 1.02E-04
number >7) Benzonitrile 5.54E-06 56 7.90E-06Biphenyl 5.76E-07 273 1.65E-06Butylated hydroxytoluene* 8.98E-06 188 2.06E-05Decane* B 2.26E-07 112 4.03E-07Dodecane* 3.05E-07 72 4.65E-07Eicosane 3.23E-07 158 6.74E-07Ethylbenzene* 2.45E-07 92 4.04E-07Heptadecane* 6.72E-07 68 1.01E-06Hexadecane* 4.72E-07 171 1.03E-06m&p-xylene* 1.07E-06 94 1.78E-06Nonadecane 3.74E-07 127 7.06E-07Nonane 3.63E-07 121 6.70E-07o-xylene* 5.06E-07 95 8.49E-07Octadecane 5.71E-07 58 8.21E-07p-isopropyltoluene* 3.45E-08 n/a n/aPentadecane* 4.83E-07 323 1.54E-06Phenol 2.40E-05 79 3.75E-05Styrene* 2.53E-06 60 3.66E-06Tetradecane* 6.11E-07 171 1.33E-06Tridecane* 5.41E-07 76 8.38E-07Undecane* 4.53E-07 80 7.15E-07
* <10x detection limit, ambient = ND(1) <10x blankB <10x detection limit, blank = NDn/a - not applicable; only one run within detectable limits
ES-9
Table E-4. Substances of Interest Not Detected in Stack Emissions from Gas-Fired Boiler.Antimony BariumBromine CadmiumGallium GoldIndium LanthanumManganese MercuryMolybdenum PalladiumPhosphorous RubidiumSelenium SilverStrontium TinThallium YttriumZirconium Nitrate1-methylphenanthrene 1-methylpyrene1,4,5-trimethylnaphthalene 1,8-dimethylnaphthalene2-ethyl-1-methylnaphthalene 7-methylbenz(a)anthraceneBibenzene J-trimethylnaphthalene1-hexadecene 1-methylindan1-nonene 1-undecene1,2,3-trimethylbenzene 1,3,5-trimethylbenzene2-methylindan 3-methyloctane7-Hexadecene CyclohexanoneDimethyloctane DodeceneIndan Indenem-ethyltoluene m-isopropyltolueneNonanal o-ethyltolueneo-isopropyltoluene p-ethyltoluenePropylbenzene
ES-10
Figu
re E
-1.
Spec
iatio
n Pr
ofile
for
Pri
mar
y Pa
rtic
ulat
e E
mis
sion
s fr
om G
as-F
ired
Boi
ler
(Ref
iner
y Si
te A
).
0.0
01
0.0
1
0.11
10
10
0
10
00
10
00
0
PM2.5
(Dilu
tion
Tunne
l)
Total F
iltera
ble P
M (i
n-sta
ck m
ethod
)
Filter
able
PM10
(in-
stack
meth
od)
Filter
able
PM2.5
(in-
stack
meth
od)
Total
cond
ensib
le pa
rticu
late
Conde
nsib
le Par
ticul
ate (i
norg
anic)
Conde
nsib
le Par
ticul
ate (o
rgan
ic) Alum
inum
Arsenic
Calciu
m Chlorin
eCob
alt
Chrom
ium
CopperIro
n Potas
sium M
agne
sium
Nickel
Lead Sili
con Sodium
Sulfu
r Titani
umUran
ium Vanad
ium
Zinc Chlo
ride
Sulfate Ammonium
Total
Carbo
n (d
ilutio
n tu
nnel)
Organ
ic Car
bon
(dilu
tion
tunn
el)
Elemen
tal C
arbo
n (d
ilutio
n tu
nnel)
Total
Carbo
n (in
-stac
k)
Organ
ic Car
bon
(in-st
ack)
Elemen
tal C
arbon
(in-
stack
)
Percent of Primary PM 2.5 (by dilution tunnel)
1-1
Section 1
PROJECT DESCRIPTION
PROJECT OVERVIEW
In 1997, the United States Environmental Protection Agency (EPA) promulgated new ambient
air standards for particulate matter, including for the first time particles with aerodynamic
diameter smaller than 2.5 micrometers (PM2.5). There are few existing data regarding emissions
and characteristics of fine aerosols from petroleum industry combustion sources, and such
information that is available is fairly old. Traditional stationary source air emission sampling
methods tend to underestimate or overestimate the contribution of the source to ambient aerosols
because they do not properly account for primary aerosol formation that occurs after the gases
leave the stack. This issue was extensively reviewed by API in a recent report (England et al.,
1997), which concluded that dilution sampling techniques are more appropriate for obtaining a
representative sample from combustion systems. These techniques have been widely used in
research studies (Hildemann et al., 1994; McDonald et al., 1998), and use clean ambient air to
dilute the stack gas sample and provide 80-90 seconds residence time for aerosol formation prior
to sample collection for determination of mass and chemical speciation.
As a result of the API review, a test protocol was developed based on the dilution sampling
system described in this report, which was then used to collect particulate emissions data from
petroleum industry combustion sources, along with emissions data obtained from conventional
sampling methods. This test program is designed to provide reliable source emissions data for
use in assessing the contribution of petroleum industry combustion sources to ambient PM2.5
concentrations. The goals of this test program were to:
· Develop emission factors and speciation profiles for emissions of fineparticulate matter, especially organic aerosols;
· Identify and characterize PM2.5 precursor compound emissions.
This test report describes the results of tests performed on a gas-fired boiler at Refinery Site A on
July 14-20, 1998.
1-2
PROJECT OBJECTIVES
The specific objectives of this test were to:
Primary objectives
· Compare PM2.5 mass measured using an in-stack filter and an iced impingertrain (EPA Method 201A/202), and mass measured using a dilution tunnel;
· Develop emission factors and speciation profiles for organic aerosols andPM2.5 mass;
· Characterize sulfate, nitrate, ammonium, elemental carbon (EC) and organiccarbon (OC) in particulate matter collected on filter media after stack gasdilution;
· Characterize key secondary particle precursors in stack gas samples: volatileorganic compounds (VOC) with carbon number of 7 and above; sulfur dioxide(SO2); and oxides of nitrogen (NOX);
· Document the relevant process design characteristics and operating conditionsduring the test.
Secondary Objective
· Characterize ions (sulfate, nitrate and ammonium), OC, and EC in particulatecollected on filter media in stack gas sampling trains.
TEST OVERVIEW
The scope of testing is summarized in Table 1-1. The emissions testing included collection and
analysis of both in-stack and diluted stack gas samples. All emission samples were collected
from the stack of the unit. An ambient air sample also was collected. The samples were
analyzed for the compounds listed in Table 1-2. Boiler process data and fuel gas samples were
collected during the tests to document operating conditions.
Source Level (In-stack) Samples
In-stack sampling and analysis for filterable (total, PM10 and PM2.5) and condensible
particulate matter (CPM), NOx, oxygen (O2), carbon dioxide (CO2), carbon monoxide (CO) and
SO2 was performed using traditional EPA methods. In-stack cyclones and filters were used for
filterable particulate matter. Sample analysis was expanded to include OC, EC and organic
species on the in-stack quartz filters.
1-3
Table 1-1. Overview of Sampling Scope.Number of Samples at each Sampling Location
Sampling Location Fuel Gas Header Stack Ambient Air
EPA Method 201A/202 Train -- 3 --
EPA Method 17 Train -- 3 --
Dilution tunnel -- 3 1
Teflon¨ filter
TIGF/PUF/XAD-4
Quartz filter
Tenax
Fuel sample 6 -- --
NOx, SO2, CO, O2, CO2 -- continuous --
Process monitoring -- continuous --
TIGF=Teflon¨-impregnated glass fiber filterPUF=polyurethane foamXAD-4 = Amberlite¨ sorbent resin
Dilution Stack Gas Samples
Dilution sampling was used to characterize PM2.5 including aerosols formed in the near-field
plume. The dilution sampler extracted a sample stream from the stack into a mixing chamber,
where it was diluted approximately 6:1 with purified ambient air. Because PM2.5 behaves
aerodynamically like a gas at typical stack conditions, the samples were extracted
nonisokinetically. A slipstream of the mixed and diluted sample was extracted where it resided
for approximately 80 seconds to allow time for low-concentration aerosols, especially organics,
to condense and grow. The diluted and aged sample then passed through cyclone separators
sized to remove particles larger than 2.5 microns, after which samples were collected on various
media: high-purity quartz, Teflon¨ membrane filter (TMF), and Teflon¨-impregnated glass fiber
(TIGF) filters; a polyurethane foam (PUF)/Amberlite¨ sorbent resin (XAD-4)/PUF cartridge to
collect gas phase semivolatile organic compounds; and a Tenax cartridge to VOCs. Three
samples were collected on three sequential test days.
1-4
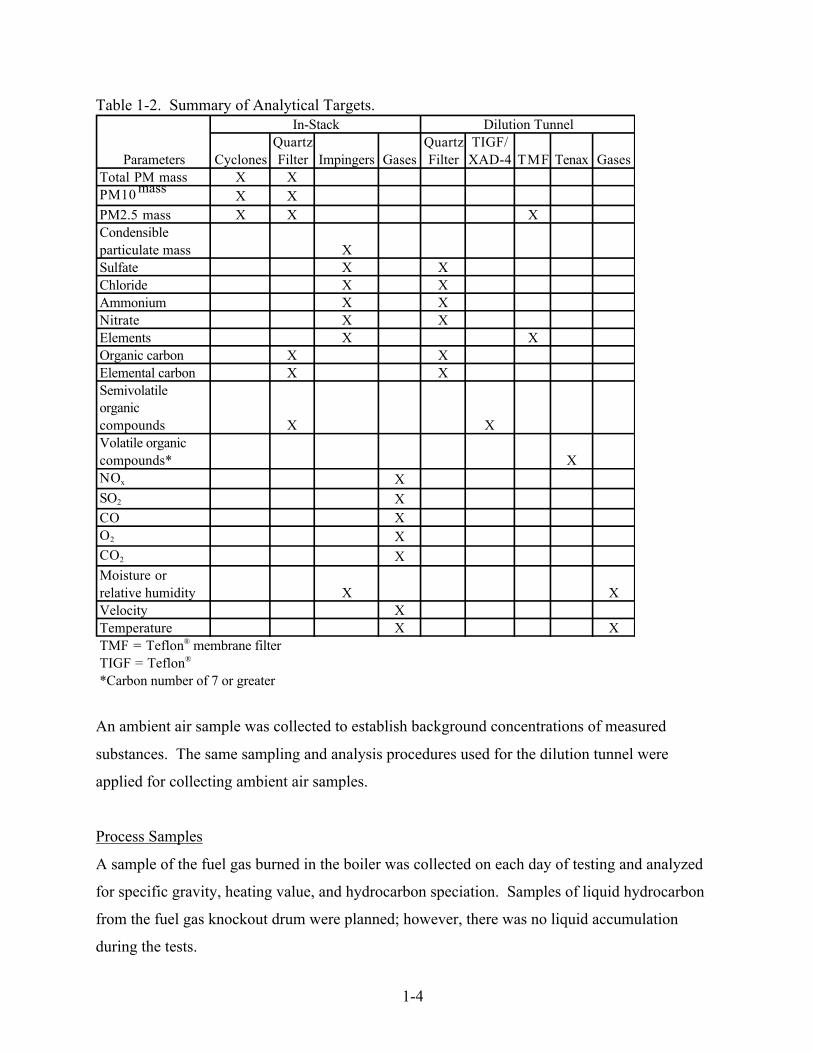
Table 1-2. Summary of Analytical Targets.
An ambient air sample was collected to establish background concentrations of measured
substances. The same sampling and analysis procedures used for the dilution tunnel were
applied for collecting ambient air samples.
Process Samples
A sample of the fuel gas burned in the boiler was collected on each day of testing and analyzed
for specific gravity, heating value, and hydrocarbon speciation. Samples of liquid hydrocarbon
from the fuel gas knockout drum were planned; however, there was no liquid accumulation
during the tests.
In-Stack Dilution TunnelQuartz Quartz TIGF/
Parameters Cyclones Filter Impingers Gases Filter XAD-4 TMF Tenax GasesTotal PM mass X XPM10
massX X
PM2.5 mass X X XCondensible particulate mass XSulfate X XChloride X XAmmonium X XNitrate X XElements X XOrganic carbon X XElemental carbon X XSemivolatile organic compounds X XVolatile organic compounds* XNOx XSO2 XCO XO2 XCO2 X Moisture or relative humidity X XVelocity X Temperature X XTMF = Teflon¨ membrane filterTIGF = Teflon¨
*Carbon number of 7 or greater

1-5
KEY PERSONNEL
Energy and Environmental Research Corporation, a General Electric company, (GE-EER) had
primary responsibility for the test program. Key personnel involved in the tests were:
· Glenn England (GE-EER) - Program Manager (949) 859-8851· Stephanie Wien (GE-EER) - Project Engineer (949) 552-1803· Bob Zimperman (GE-EER) - Field Team Leader (949) 552-1803· Barbara Zielinska (Desert Research Institute) - Dilution Sampling and
Laboratory Analysis (775) 674-7066· Karl Loos (Equilon Enterprises LLC) - API Work Group Chairman
(281) 544-7264· Karin Ritter (API) - API Project Officer (202) 682-8472
2-1
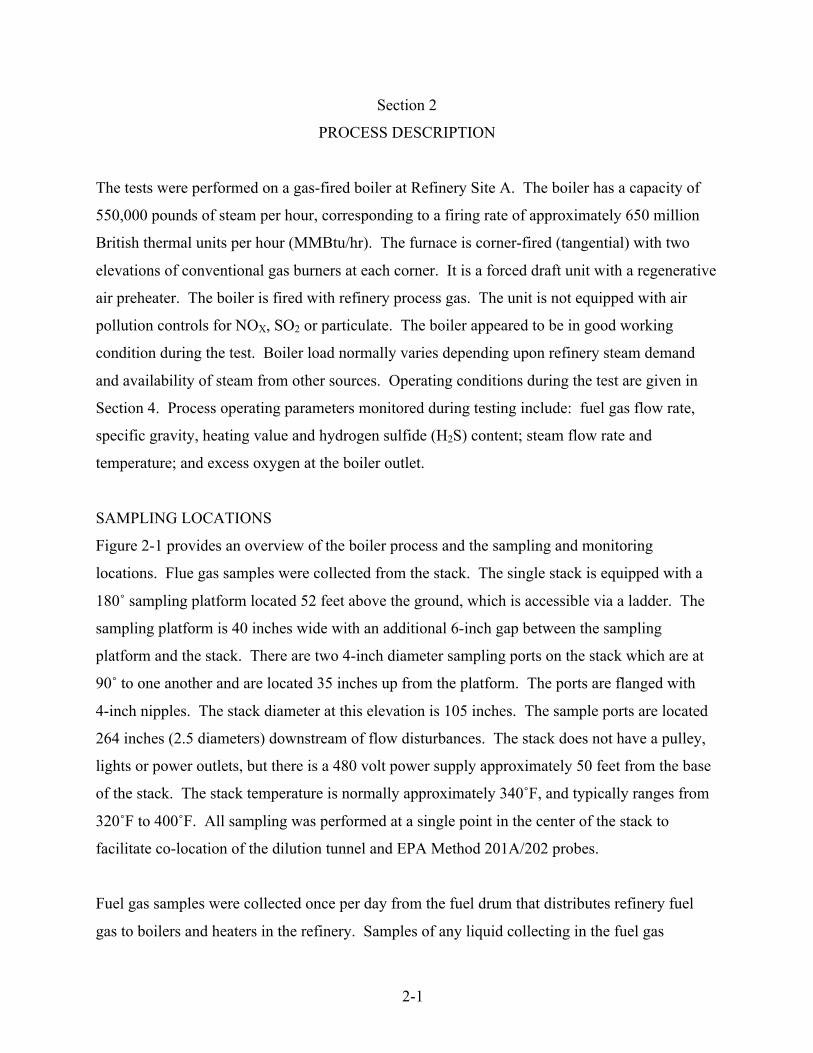
Section 2
PROCESS DESCRIPTION
The tests were performed on a gas-fired boiler at Refinery Site A. The boiler has a capacity of
550,000 pounds of steam per hour, corresponding to a firing rate of approximately 650 million
British thermal units per hour (MMBtu/hr). The furnace is corner-fired (tangential) with two
elevations of conventional gas burners at each corner. It is a forced draft unit with a regenerative
air preheater. The boiler is fired with refinery process gas. The unit is not equipped with air
pollution controls for NOX, SO2 or particulate. The boiler appeared to be in good working
condition during the test. Boiler load normally varies depending upon refinery steam demand
and availability of steam from other sources. Operating conditions during the test are given in
Section 4. Process operating parameters monitored during testing include: fuel gas flow rate,
specific gravity, heating value and hydrogen sulfide (H2S) content; steam flow rate and
temperature; and excess oxygen at the boiler outlet.
SAMPLING LOCATIONS
Figure 2-1 provides an overview of the boiler process and the sampling and monitoring
locations. Flue gas samples were collected from the stack. The single stack is equipped with a
180û sampling platform located 52 feet above the ground, which is accessible via a ladder. The
sampling platform is 40 inches wide with an additional 6-inch gap between the sampling
platform and the stack. There are two 4-inch diameter sampling ports on the stack which are at
90û to one another and are located 35 inches up from the platform. The ports are flanged with
4-inch nipples. The stack diameter at this elevation is 105 inches. The sample ports are located
264 inches (2.5 diameters) downstream of flow disturbances. The stack does not have a pulley,
lights or power outlets, but there is a 480 volt power supply approximately 50 feet from the base
of the stack. The stack temperature is normally approximately 340ûF, and typically ranges from
320ûF to 400ûF. All sampling was performed at a single point in the center of the stack to
facilitate co-location of the dilution tunnel and EPA Method 201A/202 probes.
Fuel gas samples were collected once per day from the fuel drum that distributes refinery fuel
gas to boilers and heaters in the refinery. Samples of any liquid collecting in the fuel gas
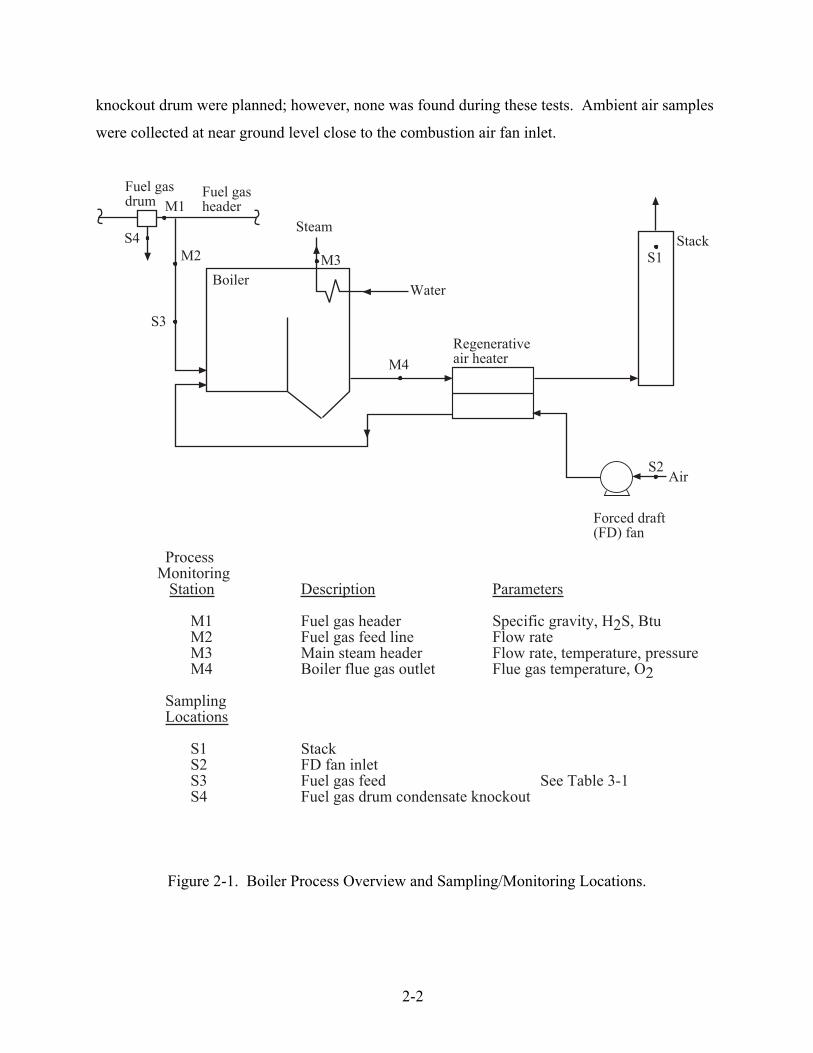
2-2
knockout drum were planned; however, none was found during these tests. Ambient air samples
were collected at near ground level close to the combustion air fan inlet.
ProcessMonitoring Station Description Parameters
M1 Fuel gas header Specific gravity, H2S, BtuM2 Fuel gas feed line Flow rateM3 Main steam header Flow rate, temperature, pressureM4 Boiler flue gas outlet Flue gas temperature, O2
Sampling Locations
S1 StackS2 FD fan inletS3 Fuel gas feed See Table 3-1S4 Fuel gas drum condensate knockout
S4
Fuel gasheader
M2
S3
Boiler
Steam
M3
Water
Regenerativeair heater
StackS1
Forced draft(FD) fan
AirS2
M1Fuel gasdrum
M4
Figure 2-1. Boiler Process Overview and Sampling/Monitoring Locations.

3-1
Section 3
TEST PROCEDURES
An overview of the sampling and analysis procedures is given in Table 3-1. Figure 3-1 shows
the testing chronology for the dilution tunnel and in-stack methods. The time of day for the start
and finish of each measurement run is shown on the figure. For example, Method 201A/202 Run
1 began at 16:24 hours and finished at 22:24 hours on Wednesday, July 15. Dilution tunnel
testing and in-stack testing were performed on different days due to limited space on the stack
platform. All samples were collected at approximately the same point in the center of the stack.
STACK GAS FLOW RATE, MOISTURE CONTENT AND MOLECULAR WEIGHT
An S-type Pitot tube (EPA Method 2) was used to determine the stack gas velocity and
volumetric flow rate. Stack gas molecular weight was calculated in accordance with EPA
Method 3. Moisture content of the sample was determined based on weight gain of the
impingers used in the Method 201A/202 train according to EPA Method 4. A full velocity
traverse of the stack was performed before and after most of the tests to determine total stack gas
flow rate. In those few cases where velocity was not directly measured, stack gas flow rate was
calculated using fuel flow rate and dry F factors according to EPA Method 19.
O2, CO2, CO, NOx AND SO2
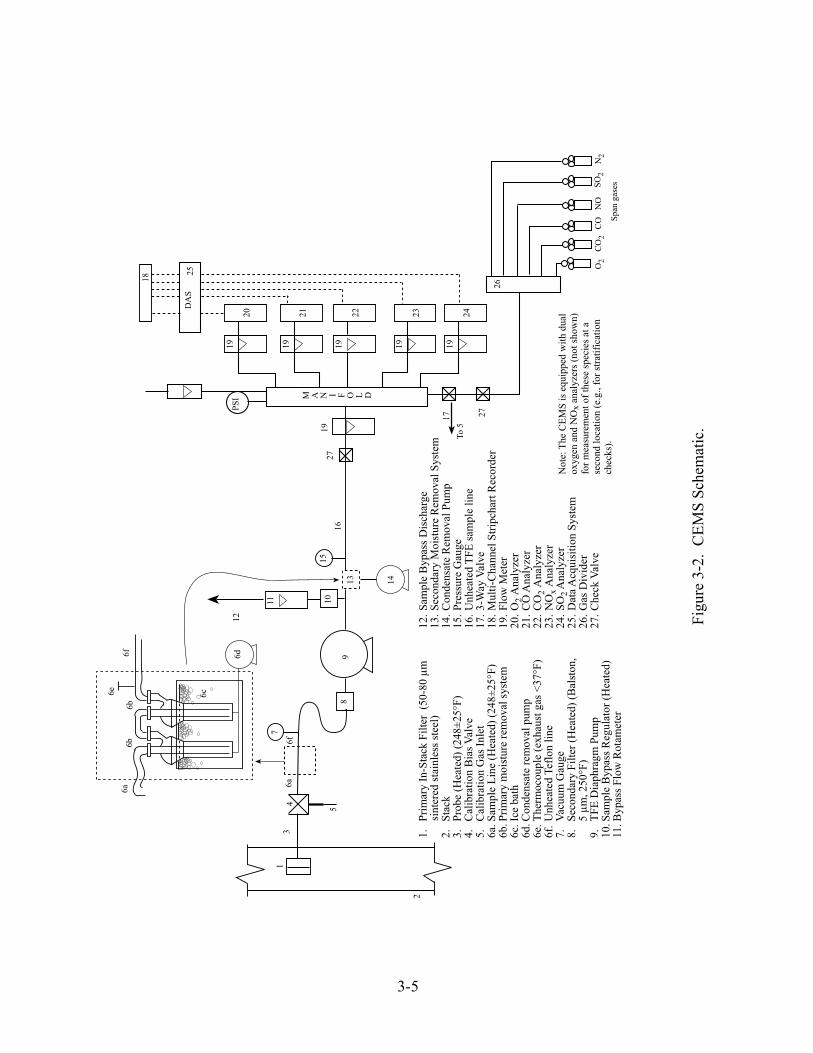
Major gases and pollutant concentrations in the stack sample were measured using a continuous
emission monitoring system (CEMS), illustrated schematically in Figure 3-2. Table 3-2 lists the
CEMS specifications. The sample was collected from a single traverse point in the stack after
verifying that the gas concentration profile deviated by less than 10 percent of the mean
concentration. Sample gas was passed through a primary in-stack sintered metal filter, a heated
stainless steel probe, a heated Teflon¨ transfer line, a primary moisture removal system (heat
exchanger impingers in an ice bath), a heated secondary filter, a diapgragm pump, and a heated
back-pressure regulatory to a thermoelectric water condenser. The condenser's heat exchangers
are specially designed impingers that separate the condensate from the gas sample with a
minimum of contgact area to avoid loss of the water soluble gas fraction. The condensate was
removed with a peristaltic pump through the bottom of the heat exchanger. All contact

3-2
Table 3-1. Summary of Test Procedures
Sampling Measurements Sampling Sample ReferenceLocation Approach Analyses
StackS1
Total PM,PM10, PM2.5andcomposition
In-Stack seriescyclones and filter
Mass organicspecies
U.S. EPA Method201A (modified)
PMcomposition
In-stack filter Organic carbon,elemental carbon
U.S. EPA Method17 (modified)
CondensiblePM andcomposition
Impingers Mass (organic andinorganic), sulfate,chloride, nitrate,ammoniumelements
U.S. EPA Method202 (modified)
GaseousPM2.5precursors
Continuous SO2 and NOX (O2,CO2, CO alsomeasured)
U.S. EPA Methods3A/6C/7E/10
Stack (DilutionTunnel)S1
PM2.5 andchemicalcomposition
Filters Mass, organiccarbon, elementalcarbon, organicspecies, sulfate,nitrate, chloride,ammonium
U.S. EPA, 1999aHildemann et al.,1989
VOC Tenax Speciated VOC Zielinska et al., 1996SVOC PUF/XAD-4/PUF Speciated SVOC U.S. EPA Method
TO13Ambient Air(Forced DraftFan Inlet)S2
PM2.5 andchemicalcomposition
Filters Mass, organiccarbon, elementalcarbon, organicspecies, sulfate,nitrate, chloride,ammonium
U.S. EPA, 1999a
VOC Tenax Speciated VOC Zielinska et al., 1996SVOC PUF/XAD-4/PUF Speciated SVOC U.S. EPA Method
TO13Fuel gas feedto heater(S3)
Fuel gascomposition
Integrated grabsample (bag orcanister)
Hydrocarbonspeciation andheating value
ASTM D3588; U.S.EPA Method 19
Fuel gasknockout drum(S4)
Liquidhydrocarbons
Composite grabsample
Ultimate analysis(C, H, N, S, O,ash), hydrocarbonspeciation
ASTM D3176; U.S.EPA Method 19 (orequivalent)

3-3
Boiler StackTime Velocity Method 201/202 CEMS Dilution Tunnel Fuel Gas Samples
7/14/1998 9:00Tue 10:00
11:0012:0013:0014:0015:0016:0017:0018:00 Preliminary Moisture19:00 18:52 18:4220:00 19:53 19:27
7/15/1998 9:00Wed 10:00 * Grab
11:00 Stratification12:00 12:1113:00 Pre-test 13:1814:00 14:2715:00 14:5616:00 R1 / 16:24 R1 / 16:2417:0018:0019:00 18:5820:00 20:0521:00 21:3422:00 22:24
7/16/1998 9:00Thurs 10:00 R2 / 10:10 R2 / 10:22 * Grab
11:0012:0013:00 12:5614:00 13:5115:00 15:2216:00 16:1017:0018:0019:0020:0021:00
Figure 3-1. Chronology for Gas-Fired Boiler (Refinery Site A).

3-4
Boiler StackTime Velocity Method
201A/202CEMS Dilution Tunnel Fuel Gas Samples
7/17/1998 8:00 R3 / 8:15 Ambient / 8:30Fri 9:00 R3 / 9:14
10:00 * Grab11:00 11:1212:00 11:4713:0014:00 14:15 14:1615:0016:00 16:3017:00
7/18/1998 9:00Sat 10:00 * Grab
11:0012:00 1 DT / 12:45 1 DT / 12:4513:0014:0015:00 15:22*16:00 16:2717:0018:00 18:48 18:4819:00
7/19/1998 8:00Sun 9:00
10:00 * Grab11:00 2 DT / 11:35 2 DT / 11:3512:0013:0014:00 14:33*15:00 14:5416:0017:00 17:30 17:3018:0019:00
7/20/1998 8:00 3 DT / 8:45 3 DT / 8:45Mon 9:00
10:00 * Grab11:00 11:22*12:00 11:4513:0014:00 Post-test 14:45 14:4515:00 15:5616:00 16:1417:00
DT - Dilution tunnel testing run*Run interrupted for calibration check
Figure 3-1 (continued). Chronology for Gas-Fired Boiler (Refinery Site A).
3-5
Figu
re 3
-2.
CE
MS
Sche
mat
ic.
3-6
Table 3-2. Description of CEMS Instrumentation used for Gas-Fired Boiler Test(Refinery Site A).
components were constructed of inert materials such as glass, stainless steel and
tetrafluoroethylene (TFE). All components preceding the condenser (probe, sample line, sample
bypass regulator, pump) were heated to 248¡ F to prevent condensation. The sample was
conducted from the chiller outlet through the TFE line to a tertiary filter preceding the sample
manifold. Samples were analyzed for O2 and CO2 using instrumental methods according to EPA
Method 3A. Oxygen was measured using a paramagnetic analyzer, and CO2 was measured using
a non-dispersive infrared (NDIR) analyzer. Samples were analyzed for NOx using a low-
pressure chemiluminescent analyzer with a molybdenum nitrogen dioxide (NO2)-to-nitric oxide
(NO) converter according to EPA Method 7E. Sulfur dioxide was determined in the sample using
a non-dispersive ultraviolet analyzer according to EPA Method 6C. Carbon monoxide was
determined using a NDIR analyzer following EPA Method 10.
IN-STACK METHOD TESTS
Total particulate, PM10 and PM2.5 filterable at stack temperature were determined using in-
stack methods. CPM, defined as the material collected in chilled impingers, also was measured
for the in-stack samples.
3-7
In-Stack Total Filterable PM, PM10 and PM2.5
Two in-stack cyclones followed by an in-stack filter (Figure 3-3) were used to measure total
particulate and particulate matter with nominal aerodynamic diameters less than or equal to 10
µm (PM10) and 2.5 µm (PM2.5). EPA Method 201A, modified to accommodate the second
cyclone, was used following the constant-rate sampling procedure. Sampling time was six hours
for each of the three runs. The sample recovery field procedure is summarized in Figure 3-4.
Sampling was performed as published except for the following modifications and clarifications:
· A PM10 cyclone and a PM2.5 cyclone (Andersen Model Case-PM10 andCase-PM2.5) were attached in series to the filter inlet. Sample recoveryprocedures were modified accordingly;
· The sample was collected from a single traverse point near the center of thestack to preserve the integrity of the dilution tunnel method comparison. Itwas assumed that any particulate present was small enough to mixaerodynamically in the same manner as a gas; therefore, the magnitude of theparticle concentration profile was assumed to be no greater than the gasconcentration profile. Quartz filters were used. The filters werepreconditioned in the same manner as those used in the dilution tunnel, asdescribed below.
The particulate mass collected in the two cyclones and on the filter was determined
gravimetrically (Figure 3-5). The Gelman filters (No. RPJ047) were weighed before and after
testing on a microbalance with a sensitivity of 1 microgram. Pre- and post-test weighing was
performed after drying the filters in a dessicator for a minimum of 72 hours; repeat weighings
were then performed at a minimum of 6-hour intervals until constant weight was achieved.
Probe and cyclone acetone rinses were recovered in glass sample jars for storage and shipment,
then transferred to tared beakers for evaporation, finally to tared watch glasses for final
evaporation and weighing. Acetone and filter blanks also were collected and analyzed. See
Section 4 for discussion of data treatment.
Subsequent to these tests, EPA published preliminary method PRE-4, entitled "Test Protocol
PCA PM10/PM2.5 Emission Factor and Chemical Characterization Testing" (U.S. EPA, 1999b).
This protocol, developed by the Portland Cement Association (PCA), is intended for use by
Portland cement plants to measure PM10 and PM2.5 emission factors applicable to a variety
3-8
Ser es cyclone and f lter assembly
Impinger Configuration1 Greenburg-Smith, 100 ml DI water2 Greenburg-Smith, 100 ml DI water3 Modified Greenburg-Smith, empty4 Modified Greenburg-Smith, silica gel
Ice Bath
1 2 3 4
Filter
Thermometer
Pump
Vacuum Gauge
Dry Gas
Meter
Orifi ce Meter
V
TT
Sampling train
Thermocouple
S-Type Pitot Tube
Nozzle
Series cyclones and filter(in-stack)
Incline Manometer
Figure 3-3. PM2.5/PM10 Train Configuration for Method 201A/202.
3-9
Label as "Container 1:Particles <2.5 µm
caught in-stack filter"
Final rinse of brush and interior
surfaces
Disassemble PM2.5 cyclone. Recover all
interior surfaces from PM 10 cyclone exit through
PM2.5 cycloneDo not recover PM2.5
cyclone outlet
Rinse with acetone
Inspect to see if all particulate
removed; if not, repeat step above
Label as "Container 2. Particulate
matter >10 µm"
PM2.5 cyclone
Brush & rinse with acetone 3 times
Rinse with acetone
Label as "Container 3 <10 µm and
>2.5 µm"
Disassemble 47mm Gelman filter housing.
Recover all internal surfaces from PM2.5
cyclone exit through filter support
Filter housing
Brush & rinse with acetone 3 times
Rinse with acetone
Final rinse of brush and interior surfaces
Label as "Container 4. Particulate matter
<2.5 µm"
In-stack filter
Disassemble PM10 cyclone.
Remove nozzle
Carefully remove filter from support and place
in petri dish
Transfer 200 ml ofacetone from wash
bottle to glass samplecontainer
Acetoneblank
Label as"Acetone Blank"
Store at 4¡C
Inspect to see if all particulate
removed; if not, repeat step above
Final rinse of brush and interior surfaces
Inspect to see if all particulate
removed; if not, repeat step above
PM10 cyclone
Brush loose particulatematter into petri dish
with brush
Brush & rinse with acetone 3 times
Seal petri dish with TFE tape
Figure 3-4. Method 201A (Modified) Sample Recovery Procedure.
3-10
Figure 3-5. Method 201A (Modified) Sample Analysis Procedure.
3-11
of particulate sources. Method PRE-4 describes substantially the same sampling equipment and
sample collection procedures used in these tests. The analytical procedures differ slightly in the
scope of chemical analysis performed.
Total particulate samples also were collected using EPA Method 17 (Figure 3-6). A 47-mm flat
filter assembly loaded with quartz filters was used. Quartz filters are preconditioned in the same
manner as those used in the dilution tunnel. These samples were used only for determination of
in-stack OC, EC and speciated semivolatile organic compounds (SVOC). The analytical
procedures were the same as those described below for dilution tunnel samples. These samples
were collected at different times than the Method 201A/202 samples because of limited access at
the sampling location (see Figure 3-1).
InclineManometer
Impingerg s
1. 100 ml DI Water2. 100 ml DI Water3. Empty4. 200-300 g Silica gel
IceBath
1 2 3 4
Thermometers
Vacuum GaugeVaV
Dry GasDry GasMeter
OrificeMeter
Check ValveVaV
VV
TTTT
Thermocouple
S-Type PitoTyT tTube
Nozzlee
Incline Manometer
In-Stack FilterThermocouple
Pump
Figure 3-6. Sampling Train Configuration for EPA Method 17.
3-12
Condensible Particulate Matter Mass and Chemical Analysis
CPM was determined using EPA Method 202. After the in-stack filter, the sample passed
through a heated Teflon¨ line to a series of impingers placed in an ice bath used for the Method
201A train. The contents of the impingers were recovered with distilled deionized (DI) water
and dichloromethane (Figure 3-7). The samples were analyzed in the laboratory according to the
method, including optional analyses for sulfate and chloride (Figure 3-8). The method was
performed as published except for the following modifications and clarifications:
· The impinger train consisted of 4 impingers. The first two impingerscontained DI water, the third was empty, and the fourth contained silica gel.For Runs 1 and 3, the first and third impingers were modified Greenburg-Smith (G-S) type and the second was a standard G-S type. For Run 2 the firstimpinger was a modified G-S type and the second and third impingers werestandard G-S type;
· A quartz filter was placed between the second and third impingers to improvecapture efficiency and capture any aerosols that may have passed through thefirst two impingers, as described in the method as an optional procedure;
· The Method 202 impinger trains were not purged with nitrogen after the testbecause the post-test pH of the impinger solutions was greater than 4.5;
· Total sampling time was six hours for all runs;
· An aliquot of the impingers was analyzed for sulfate ion (SO4=) by ion
chromatography, as described in the method as an optional procedure;
· The first inorganic fraction drying step was finished at ambient temperature ina dessicator, as described in the method as an optional procedure;
· Ammonium hydroxide was added to the inorganic fraction during analysis tostabilize sulfate and chloride compounds, as described in the method;
· The inorganic fraction final residue was analyzed for chloride ion (Cl-) by ionchromatography, as described in the method as an optional procedure.
· Several months after the initial sample analysis, archived inorganic fractionresidue samples (the unused portion of the dissolved residue that was initiallyanalyzed for chloride) were analyzed for additional ions and elements by ionchromatography, colorimetry, and inductively coupled plasma massspectrometry. This was performed to obtain more complete speciation of theinorganic CPM. Because of the age of these samples, some degradation mayhave occurred and the results should be considered qualitative.
3-13
Tra
nsfe
r 20
0 m
l of
MeC
l 2 fr
om w
ash
bottl
e to
gla
ss s
ampl
eco
ntai
ner
Labe
l as
"Dic
hlor
omet
hane
Bla
nk"
Sto
re a
t 4°C
Labe
l as
"Con
tain
er 7
:D
ichl
orom
etha
ne r
inse
"
Met
hyle
neC
hlor
ide
blan
kT
rans
fer
200
ml o
fD
I wat
er fr
om w
ash
bottl
e to
gla
ss s
ampl
eco
ntai
ner
Wat
erB
lank
Labe
l as
"Wat
er B
lank
"
Bru
sh lo
ose
part
icul
ate
mat
ter
into
pet
ri di
shw
ith b
rush
Car
eful
ly r
emov
e fil
ter
from
sup
port
and
pla
cein
pet
ri di
sh
Sea
l pet
ri di
sh w
ithT
FE
tape
Labe
l as
"Con
tain
er 5
:im
ping
er fi
lter"
Impi
nger
Filt
er
Sto
re a
t 4°C
Mar
k liq
uid
leve
l
Sav
e rin
ses
in a
cle
angl
ass
sam
ple
jar
Sto
re a
t 4°C
Labe
l as
"Con
tain
er 6
:im
ping
er c
atch
"
Mar
k liq
uid
leve
lon
bot
tle
Rec
ord
colo
r of
gel t
o se
e if
it is
spe
nt
Sili
ca g
elim
ping
er
Wei
gh im
ping
erfo
r m
oist
ure
dete
rmin
atio
n
Wei
ghim
ping
ers ±
0.5
gR
ecor
d on
dat
a sh
eet.
Impi
nger
cont
ents
Rin
se w
ith D
.I. H
2O th
e ba
ckha
lf of
cyc
lone
filte
r, g
lass
prob
e lin
er, T
FE
flex
line
all
impi
nger
s &
"U
" tu
bes
fron
tan
d ba
ck h
alf o
f im
ping
er fi
lter
Qua
ntita
tivel
y tr
ansf
erliq
uid
to c
lean
nal
gene
sam
ple
bottl
e
Dic
hlor
omet
hane
rin
se
Rin
se w
ith D
.I. H
2O th
e ba
ckha
lf of
cyc
lone
filte
r, g
lass
prob
e lin
er, T
FE
flex
line
all
impi
nger
s &
tube
s fr
ont a
ndba
ck h
alf o
f im
ping
er fi
lter
Reu
se o
r di
scar
dS
tore
at 4
°C
Figu
re 3
-7.
Met
hod
202
Sam
ple
Rec
over
y Pr
oced
ure.

3-14
hours
hours
hours
hours
hours
hours
hours
hours
hours
Figure 3-8. Method 202 Sample Modified Analysis Procedure.
3-15
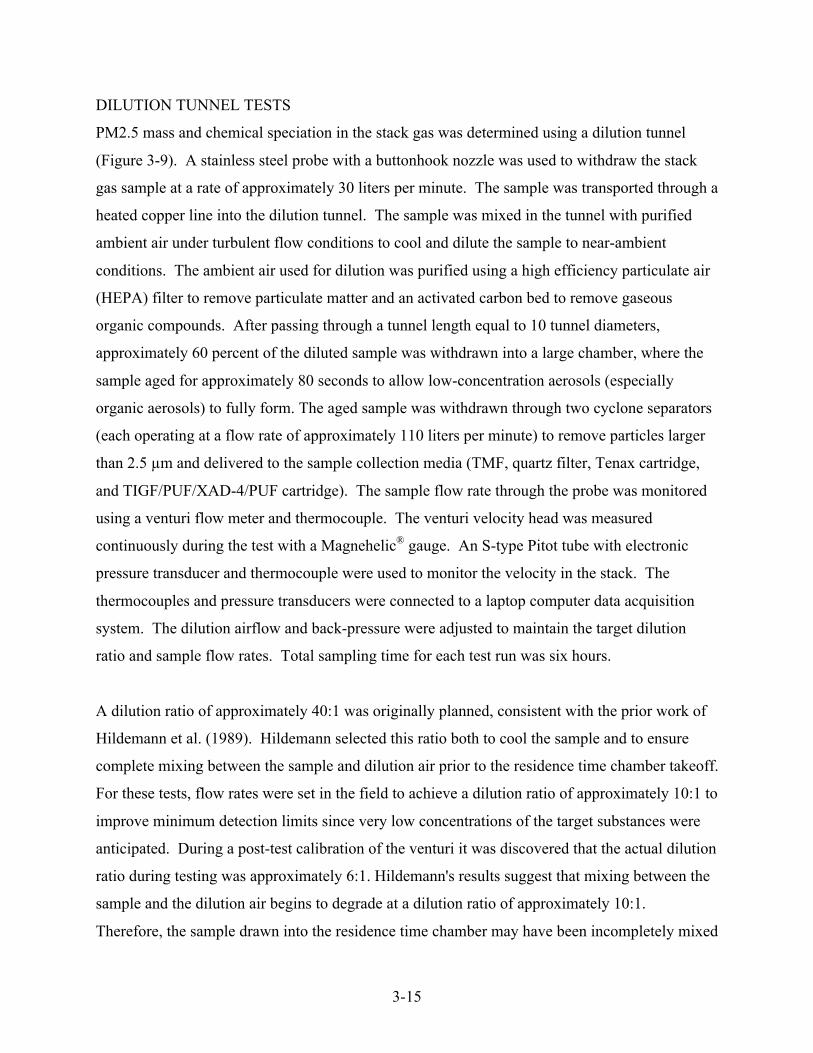
DILUTION TUNNEL TESTS
PM2.5 mass and chemical speciation in the stack gas was determined using a dilution tunnel
(Figure 3-9). A stainless steel probe with a buttonhook nozzle was used to withdraw the stack
gas sample at a rate of approximately 30 liters per minute. The sample was transported through a
heated copper line into the dilution tunnel. The sample was mixed in the tunnel with purified
ambient air under turbulent flow conditions to cool and dilute the sample to near-ambient
conditions. The ambient air used for dilution was purified using a high efficiency particulate air
(HEPA) filter to remove particulate matter and an activated carbon bed to remove gaseous
organic compounds. After passing through a tunnel length equal to 10 tunnel diameters,
approximately 60 percent of the diluted sample was withdrawn into a large chamber, where the
sample aged for approximately 80 seconds to allow low-concentration aerosols (especially
organic aerosols) to fully form. The aged sample was withdrawn through two cyclone separators
(each operating at a flow rate of approximately 110 liters per minute) to remove particles larger
than 2.5 µm and delivered to the sample collection media (TMF, quartz filter, Tenax cartridge,
and TIGF/PUF/XAD-4/PUF cartridge). The sample flow rate through the probe was monitored
using a venturi flow meter and thermocouple. The venturi velocity head was measured
continuously during the test with a Magnehelic¨ gauge. An S-type Pitot tube with electronic
pressure transducer and thermocouple were used to monitor the velocity in the stack. The
thermocouples and pressure transducers were connected to a laptop computer data acquisition
system. The dilution airflow and back-pressure were adjusted to maintain the target dilution
ratio and sample flow rates. Total sampling time for each test run was six hours.
A dilution ratio of approximately 40:1 was originally planned, consistent with the prior work of
Hildemann et al. (1989). Hildemann selected this ratio both to cool the sample and to ensure
complete mixing between the sample and dilution air prior to the residence time chamber takeoff.
For these tests, flow rates were set in the field to achieve a dilution ratio of approximately 10:1 to
improve minimum detection limits since very low concentrations of the target substances were
anticipated. During a post-test calibration of the venturi it was discovered that the actual dilution
ratio during testing was approximately 6:1. Hildemann's results suggest that mixing between the
sample and the dilution air begins to degrade at a dilution ratio of approximately 10:1.
Therefore, the sample drawn into the residence time chamber may have been incompletely mixed
3-16
StackGas
HEPAFilterCarbonFilter
Flow Sensor (rotameter)
VenturiProbe
T
RH
AmbientAir
Flow Control
Pump
ResidenceTimeChamber
PM2.5Cyclones
PUF
XAD
PUF
TenaxTenax
Teflon¨-impregnatedGlass FiberFilter
VolatileOrganic
Compounds
OrganicCarbon/ElementalCarbon,Anions
Mass,Elements
SemivolatileOrganic
Compounds
QuartzFilter
Teflon¨Filter
DilutionTunnelSampler
SampleCollectionTrains
SampleMakeup Air
RH Relative humidity
T Temperature
HEPA - High Efficiency Particulate AirPUF - Polyurethane Foam
Figure 3-9. Dilution Tunnel Sampling System.
3-17
with the dilution air. Based on profiles reported by Hildemann, this may produce a slight
(estimated 10-20 percent) positive bias in the reported emission factors but should not affect
chemical speciation profiles significantly.
A single ambient air sample was collected using the dilution tunnel. The dilution tunnel setup
was modified by removing the sample probe and attaching a special inlet adapter in place of the
HEPA and charcoal filters. The ambient air sample was drawn into the tunnel without dilution
through the special inlet adapter. The sampling period was increased to eight hours to improve
minimum detection limits. The same sampling media were used as described below and in
Figure 3-8.
PM2.5 Mass
Samples for PM2.5 mass measurements were collected on a 47-mm diameter Gelman #RPJ047
polymethylpentane ringed, 2.0 µm pore size, TMF placed in an aluminum filter holder. The
filter packs were equipped with quick release connectors to ensure that no handling of the filters
was required in the field. The flow rate through the filter was set prior to sample collection and
checked after sample collection by placing a calibrated rotameter on the inlet side of the copper
sampling line and setting the position of the needle valve to achieve the desired flow rate.
Weighing was performed on a Cahn 31 electro-microbalance with ±1 microgram sensitivity.
Elements
Energy dispersive x-ray fluorescence (ED-XRF) analysis was performed on the TMFs for the
following 40 elements: aluminum (Al), silver (Ag), arsenic (As), gold (Au), barium (Ba),
bromine (Br), calcium (Ca), cadmium (Cd), chlorine (Cl), cobalt (Co), chromium (Cr), copper
(Cu), iron (Fe), gallium (Ga), mercury (Hg), indium (In), potassium (K), lanthanum (La),
magnesium (Mg), manganese (Mn), molybdenum (Mo), sodium (Na), nickel (Ni), phosphorus
(P), lead (Pb), palladium (Pd), rubidium (Rb), sulfur (S), antimony (Sb), selenium (Se), silicon
(Si), tin (Sn), strontium (Sr), titanium (Ti), thallium (Tl), uranium (U), vanadium (V), yttrium
(Y), zinc (Zn), and zirconium (Zr). Magnesium and Na results are considered semi-quantitative
because of analytical technique limitations.
3-18
A Kevex Corporation Model 700/8000 ED-XRF analyzer with a side-window, liquid-cooled, 60
keV, 3.3 milliamp rhodium anode x-ray tube and secondary fluorescers was used. The silicon
detector had an active area of 30 mm2, with a system resolution better than 165 eV. The analysis
was controlled, spectra were acquired, and elemental concentrations were calculated by software
on a microcomputer which was interfaced to the analyzer. Five separate XRF analyses were
conducted on each sample to optimize the detection limits for the specified elements. The filters
were removed from their petri slides and placed with their deposit sides downward into
polycarbonate filter cassettes. A polycarbonate retainer ring kept the filter flat against the bottom
of the cassette. The cassettes were loaded into a carousel in the x-ray chamber. The sample
chamber was evacuated to 10-3 Torr. A computer program controlled the positioning of the
samples and the excitation conditions. Complete analysis of 16 samples under five excitation
conditions required approximately 6 hours.
Sulfate, Nitrate, Chloride and Ammonium
Samples for determining water-soluble Cl-, nitrate (NO3-), SO4
= and ammonium (NH4+) were
collected on quartz fiber filters. The flow rate through the filter holder was set prior to sample
collection and checked after sample collection by placing a calibrated rotameter on the outlet of
the holder and setting the position of the needle valve to achieve the desired flow rate.
Each quartz fiber filter was cut in half, and one filter half was placed in a polystyrene extraction
vial with 15 ml of DI water. The remaining half was used for determination of OC and EC as
described below. The extraction vials were capped and sonicated for 60 minutes, shaken for 60
minutes, then aged overnight to assure complete extraction of the deposited material. After
extraction, these solutions were stored under refrigeration prior to analysis. The unanalyzed
filter half was archived in the original petri slide. Chloride ion, NO3-, and SO4
= were measured
with a Dionex 2020i ion chromatograph (IC). Approximately 2 ml of the filter extract was
injected into the ion chromatograph.
A Technicon TRAACS 800 Automated Colorimetric System (AC) was used to measure NH4+
concentrations by the indolphenol method. Each sample was mixed with reagents and subjected
to appropriate reaction periods before submission to the colorimeter. BeerÕs Law relates the
3-19
liquidÕs absorbency to the amount of the ion in the sample. A photomultiplier tube measured this
absorbency through an interference filter which is specific to NH4+. Two ml of extract in a
sample vial were placed in a computer-controlled autosampler. Technicon software operating on
a microcomputer controlled the sample throughput, calculated concentrations, and recorded data.
Organic and Elemental Carbon
Quartz fiber filters were used to collect samples for determination of OC and EC mass (see
above). The filters were heated in air for at least three hours at approximately 900¡C prior to
use. Pre-acceptance testing was performed on each lot of filters. Filters with levels exceeding
1.5 micrograms per square centimeter (µg/cm2) of OC and 0.5 µg/cm2 of EC were refired or
rejected. Pre-fired filters were sealed and stored in a freezer prior to preparation for field
sampling.
The thermal/optical reflectance (TOR) method was used to determine OC and EC on the quartz
filters. The TOR method is based on the principle that different types of carbon-containing
particles are converted to gases under different temperature and oxidation conditions. The TOR
carbon analyzer consists of a thermal system and an optical system. Reflected light is
continuously monitored throughout the analysis cycle. The negative change in reflectance is
proportional to the degree of pyrolytic conversion of carbon that takes place during OC analysis.
After oxygen is introduced, the reflectance increases rapidly as the light-absorbing carbon burns
off the filter. The carbon measured after the reflectance attains the value it had at the beginning
of the analysis cycle is defined as EC.
Volatile Organic Compounds
Glass cartridges filled with Tenax-TA (a polymer of 2,6-diphenyl-p-phenylene oxide) solid
adsorbent were used to collect VOC samples. Two Tenax cartridges in parallel were used
simultaneously for each test run due to the low concentrations expected in the sample. Each
cartridge contained approximately 0.2 grams of Tenax resin. A sample rate of approximately 0.1
liters per minute through each Tenax tube was used. The flow rate through the Tenax cartridges
was set prior to sample collection and checked after sample collection by placing a rotameter on
3-20
the outlet of each Tenax tube and setting the position of the needle valve to achieve the desired
flow rate.
The Tenax samples were analyzed by the thermal desorption-cryogenic preconcentration method,
followed by high resolution gas chromatographic separation and flame ionization detection (FID)
of individual hydrocarbons for peak quantification, and/or combined mass spectrometric/Fourier
transform infrared detection (MSD/FTIR), for peak identification. The resultant peaks were
quantified and recorded by the chromatographic data systems.
Semivolatile Organic Compounds
SVOCs were determined in two different samples: dilution tunnel filter/absorbent cartridges and
in-stack filters. The dilution tunnel samples were collected using a filter followed by an
adsorbent cartridge. The media used for collecting SVOCs were as follows:
· Pallflex (Putnam, CT) T60A20 102-mm TIGF filters;
· PUF sheets, purchased from E.R. Carpenter Company, Inc. (Richmond, VA)and cut into 2-inch diameter plugs;
· XAD-4 resin (20-60 mesh) purchased from Aldrich Chemical Company, Inc.
The sample was transferred from the aging chamber through a 1/2-inch copper manifold leading
to a momentum diffuser chamber. The diffuser chamber is followed by the cartridge holder and
is connected to a vacuum pump through a needle valve. The flow through the sampler was set
prior to sample collection by placing a calibrated rotameter on the inlet side of the copper
sampling line and setting the position of the needle valve to achieve the desired flow rate.
The samples were isotopically spiked, extracted in dichloromethane, and concentrated prior to
analysis. Sample extracts were analyzed by the electron impact (EI) gas chromatography/mass
spectrometric (GC/MS) technique, using a Hewlett-Packard 5890 GC equipped with a model
7673A Automatic Sampler and interfaced to a model 5970B Mass Selective Detector (MSD). To
assist in the unique identification of individual compounds, selected samples were analyzed by
combined gas chromatography/Fourier transform infrared/mass spectrometry (GC/IRD/MSD)

3-21
technique, i.e., using the Fourier transform infrared detector to aid mass spectrometric
identification. Quantification of polyaromatic hydrocarbon (PAH), and other compounds of
interest, was obtained by multiple ion detection (MID).
4-1
Section 4
TEST RESULTS
All stack emission results are presented in units of milligrams per dry standard cubic meter
(mg/dscm) and pounds per hour (lb/hr). Concentrations are corrected to a standard temperature
of 68¡F and a standard pressure of 29.92 inches of mercury unless otherwise indicated. See the
conversion factors presented at the beginning of this report to convert results to SI units.
Compounds that were not detected in any of the three runs generally are not listed on the tables.
Where shown, undetected data are flagged ÒNDÓ, treated as zeroes in sums, and excluded from
averaged results. The approximate minimum in-stack detection limits achieved for all measured
substances are given in Table 4-1.
PROCESS OPERATING CONDITIONS
Boiler operating conditions during testing are summarized in Table 4-2. The boiler operated at
53 to 59 percent of full steam capacity during the tests. Superheated steam was delivered at
approximately 640 pounds per square inch gauge (psig) and 740¡F. Excess O2 measured at the
boiler outlet (upstream of the air heater) was 3.6-5.2 percent.
The average fuel higher heating value (HHV) during each test was calculated from fuel gas grab
sample analysis results (Table 4-3) and normalized over the entire run using the specific gravity
of the grab sample and the average specific gravity measured by continuous specific gravity
monitor. The average heat input to the boiler during the test is the product of average fuel gas
flow rate and the average fuel HHV. The average heat input was used to convert in-stack
emission rates (lb/hr) to emission factors (lb/MMBtu), which are presented in Section 5. The
concentration of H2S in the fuel gas in parts per million by volume (ppmv) was calculated from
continuous H2S monitor data using the specific gravity of the fuel and the H2S concentration in
grains per 100 standard cubic feet (gr/100scf).
PRELIMINARY TEST RESULTS
Preliminary tests were conducted to establish a single point in the stack for sample collection.
The O2 concentration profile was measured prior to testing by traversing the CEMS probe across
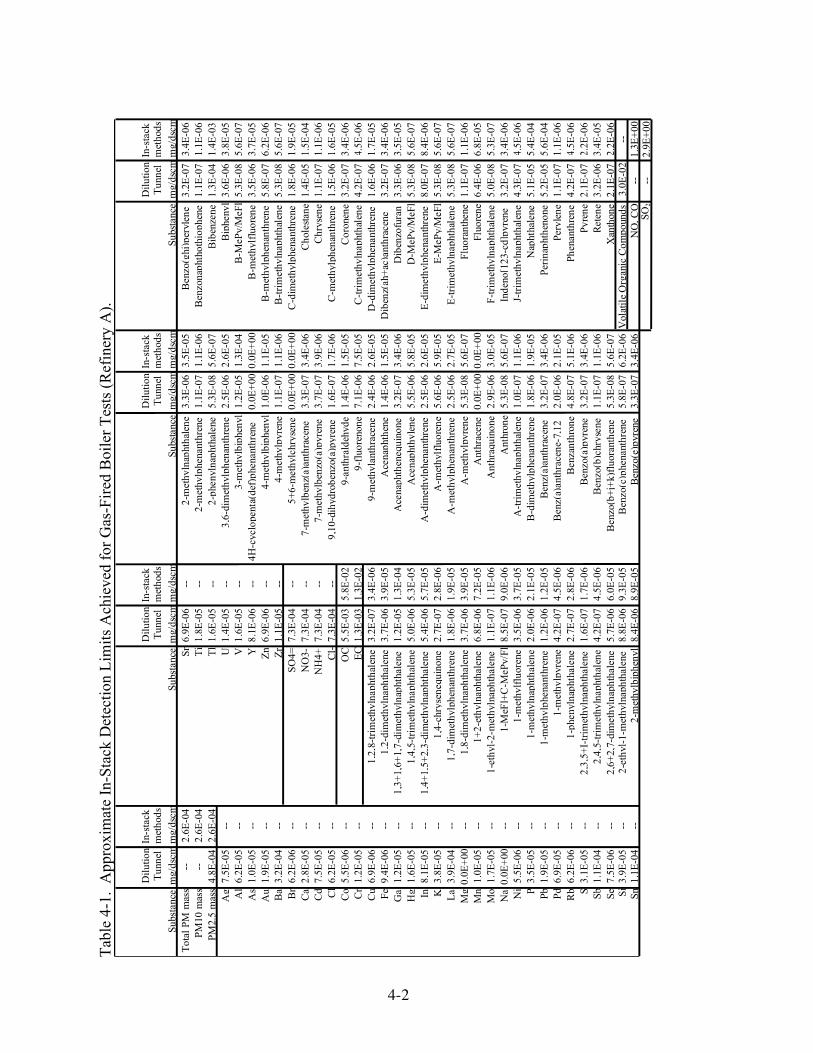
4-2
Tab
le 4
-1.
App
roxi
mat
e In
-Sta
ck D
etec
tion
Lim
its A
chie
ved
for
Gas
-Fir
ed B
oile
r T
ests
(R
efin
ery
A).
Dilu
tion
Tun
nel
In-s
tack
met
hods
Dilu
tion
Tun
nel
In-s
tack
met
hods
Dilu
tion
Tun
nel
In-s
tack
met
hods
Dilu
tion
Tun
nel
In-s
tack
met
hods
Subs
tanc
em
g/ds
cmm
g/ds
cmSu
bsta
nce
mg/
dscm
mg/
dscm
Subs
tanc
em
g/ds
cmm
g/ds
cmSu
bsta
nce
mg/
dscm
mg/
dscm
Tot
al P
M m
ass
--2.
6E-0
4Sr
6.9E
-06
--2-
met
h yln
apht
hale
ne3.
3E-0
63.
5E-0
5B
enzo
(ghi
)per
ylen
e3.
2E-0
73.
4E-0
6PM
10 m
ass
--2.
6E-0
4T
i1.
8E-0
5--
2-m
eth y
lphe
nant
hren
e1.
1E-0
71.
1E-0
6B
enzo
naph
thot
hiop
hene
1.1E
-07
1.1E
-06
PM2.
5 m
ass
4.8E
-04
2.6E
-04
Tl
1.6E
-05
--2-
phen
ylna
phth
alen
e5.
3E-0
85.
6E-0
7B
iben
zene
1.3E
-04
1.4E
-03
Ag
7.5E
-05
--U
1.4E
-05
--3,
6-di
met
hylp
hena
nthr
ene
2.5E
-06
2.6E
-05
Bip
heny
l3.
6E-0
63.
8E-0
5A
l6.
2E-0
5--
V1.
6E-0
5--
3-m
eth y
lbip
heny
l1.
2E-0
51.
3E-0
4B
-MeP
y/M
eFl
5.3E
-08
5.6E
-07
As
1.0E
-05
--Y
8.1E
-06
--4H
-cyc
lope
nta(
def)
phen
anth
rene
0.0E
+00
0.0E
+00
B-m
ethy
lflu
oren
e3.
5E-0
63.
7E-0
5A
u1.
9E-0
5--
Zn
6.9E
-06
--4-
met
h ylb
iphe
nyl
1.0E
-06
1.1E
-05
B-m
ethy
lphe
nant
hren
e5.
8E-0
76.
2E-0
6B
a3.
2E-0
4--
Zr
1.1E
-05
--4-
met
hylp
yren
e1.
1E-0
71.
1E-0
6B
-tri
met
hyln
apht
hale
ne5.
3E-0
85.
6E-0
7B
r6.
2E-0
6--
SO4=
7.3E
-04
--5+
6-m
eth y
lchr
ysen
e0.
0E+
000.
0E+
00C
-dim
ethy
lphe
nant
hren
e1.
8E-0
61.
9E-0
5C
a2.
8E-0
5--
NO
3-7.
3E-0
4--
7-m
ethy
lben
z(a)
anth
race
ne3.
3E-0
73.
4E-0
6C
hole
stan
e1.
4E-0
51.
5E-0
4C
d7.
5E-0
5--
NH
4+7.
3E-0
4--
7-m
ethy
lben
zo(a
)pyr
ene
3.7E
-07
3.9E
-06
Chr
ysen
e1.
1E-0
71.
1E-0
6C
l6.
2E-0
5--
Cl-
7.3E
-04
--9 ,
10-d
ihyd
robe
nzo(
a)py
rene
1.6E
-07
1.7E
-06
C-m
ethy
lphe
nant
hren
e1.
5E-0
61.
6E-0
5C
o5.
5E-0
6--
OC
5.5E
-03
5.8E
-02
9-an
thra
ldeh
yde
1.4E
-06
1.5E
-05
Cor
onen
e3.
2E-0
73.
4E-0
6C
r1.
2E-0
5--
EC
1.3E
-03
1.3E
-02
9-fl
uore
none
7.1E
-06
7.5E
-05
C-t
rim
eth y
lnap
htha
lene
4.2E
-07
4.5E
-06
Cu
6.9E
-06
--1 ,
2,8-
trim
ethy
lnap
htha
lene
3.2E
-07
3.4E
-06
9-m
ethy
lant
hrac
ene
2.4E
-06
2.6E
-05
D-d
imet
hylp
hena
nthr
ene
1.6E
-06
1.7E
-05
Fe9.
4E-0
6--
1,2-
dim
ethy
lnap
htha
lene
3.7E
-06
3.9E
-05
Ace
naph
then
e1.
4E-0
61.
5E-0
5D
iben
z(ah
+ac
)ant
hrac
ene
3.2E
-07
3.4E
-06
Ga
1.2E
-05
--1 ,
3+1,
6+1,
7-di
met
hyln
apht
hale
ne1.
2E-0
51.
3E-0
4A
cena
phth
eneq
uino
ne3.
2E-0
73.
4E-0
6D
iben
zofu
ran
3.3E
-06
3.5E
-05
Hg
1.6E
-05
--1,
4,5-
trim
ethy
lnap
htha
lene
5.0E
-06
5.3E
-05
Ace
naph
thyl
ene
5.5E
-06
5.8E
-05
D-M
ePy/
MeF
l5.
3E-0
85.
6E-0
7In
8.1E
-05
--1 ,
4+1,
5+2,
3-di
met
hyln
apht
hale
ne5.
4E-0
65.
7E-0
5A
-dim
ethy
lphe
nant
hren
e2.
5E-0
62.
6E-0
5E
-dim
ethy
lphe
nant
hren
e8.
0E-0
78.
4E-0
6K
3.8E
-05
--1,
4-ch
ryse
nequ
inon
e2.
7E-0
72.
8E-0
6A
-met
hylf
luor
ene
5.6E
-06
5.9E
-05
E-M
ePy/
MeF
l5.
3E-0
85.
6E-0
7L
a3.
9E-0
4--
1 ,7-
dim
ethy
lphe
nant
hren
e1.
8E-0
61.
9E-0
5A
-met
hylp
hena
nthr
ene
2.5E
-06
2.7E
-05
E-t
rim
ethy
lnap
htha
lene
5.3E
-08
5.6E
-07
Mg
0.0E
+00
--1,
8-di
met
hyln
apht
hale
ne3.
7E-0
63.
9E-0
5A
-met
hylp
yren
e5.
3E-0
85.
6E-0
7Fl
uora
nthe
ne1.
1E-0
71.
1E-0
6M
n1.
0E-0
5--
1+2-
ethy
lnap
htha
lene
6.8E
-06
7.2E
-05
Ant
hrac
ene
0.0E
+00
0.0E
+00
Fluo
rene
6.4E
-06
6.8E
-05
Mo
1.7E
-05
--1-
eth y
l-2-
met
hyln
apht
hale
ne1.
1E-0
71.
1E-0
6A
nthr
aqui
none
2.9E
-06
3.0E
-05
F-tr
imet
hyln
apht
hale
ne5.
0E-0
85.
3E-0
7N
a0.
0E+
00--
1-M
eFl+
C-M
ePy/
Fl8.
5E-0
79.
0E-0
6A
nthr
one
5.3E
-08
5.6E
-07
Inde
no[1
23-c
d]py
rene
3.2E
-07
3.4E
-06
Ni
5.5E
-06
--1-
met
hylf
luor
ene
3.5E
-06
3.7E
-05
A-t
rim
ethy
lnap
htha
lene
1.0E
-07
1.1E
-06
J-tr
imet
hyln
apht
hale
ne4.
3E-0
74.
5E-0
6P
3.5E
-05
--1-
met
h yln
apht
hale
ne2.
0E-0
62.
1E-0
5B
-dim
ethy
lphe
nant
hren
e1.
8E-0
61.
9E-0
5N
apht
hale
ne5.
1E-0
55.
4E-0
4Pb
1.9E
-05
--1-
met
h ylp
hena
nthr
ene
1.2E
-06
1.2E
-05
Ben
z(a)
anth
race
ne3.
2E-0
73.
4E-0
6Pe
rina
phth
enon
e5.
2E-0
55.
6E-0
4Pd
6.9E
-05
--1-
met
h ylp
yren
e4.
2E-0
74.
5E-0
6B
enz(
a)an
thra
cene
-7,1
22.
0E-0
62.
1E-0
5Pe
ryle
ne1.
1E-0
71.
1E-0
6R
b6.
2E-0
6--
1-ph
enyl
naph
thal
ene
2.7E
-07
2.8E
-06
Ben
zant
hron
e4.
8E-0
75.
1E-0
6Ph
enan
thre
ne4.
2E-0
74.
5E-0
6S
3.1E
-05
--2 ,
3,5+
I-tr
imet
hyln
apht
hale
ne1.
6E-0
71.
7E-0
6B
enzo
(a)p
yren
e3.
2E-0
73.
4E-0
6Py
rene
2.1E
-07
2.2E
-06
Sb1.
1E-0
4--
2,4,
5-tr
imet
hyln
apht
hale
ne4.
2E-0
74.
5E-0
6B
enzo
(b)c
hrys
ene
1.1E
-07
1.1E
-06
Ret
ene
3.2E
-06
3.4E
-05
Se7.
5E-0
6--
2 ,6+
2,7-
dim
ethy
lnap
htha
lene
5.7E
-06
6.0E
-05
Ben
zo(b
+j+
k)fl
uora
nthe
ne5.
3E-0
85.
6E-0
7X
anth
one
2.1E
-07
2.2E
-06
Si3.
9E-0
5--
2-et
hyl-
1-m
ethy
lnap
htha
lene
8.8E
-06
9.3E
-05
Ben
zo(c
)phe
nant
hren
e5.
8E-0
76.
2E-0
6V
olat
ile
Org
anic
Com
poun
ds3.
0E-0
2--
Sn1.
1E-0
4--
2-m
eth y
lbip
heny
l8.
4E-0
68.
9E-0
5B
enzo
(e)p
yren
e3.
3E-0
73.
4E-0
6N
O, C
O--
1.3E
+00
SO2
--2.
9E+
00
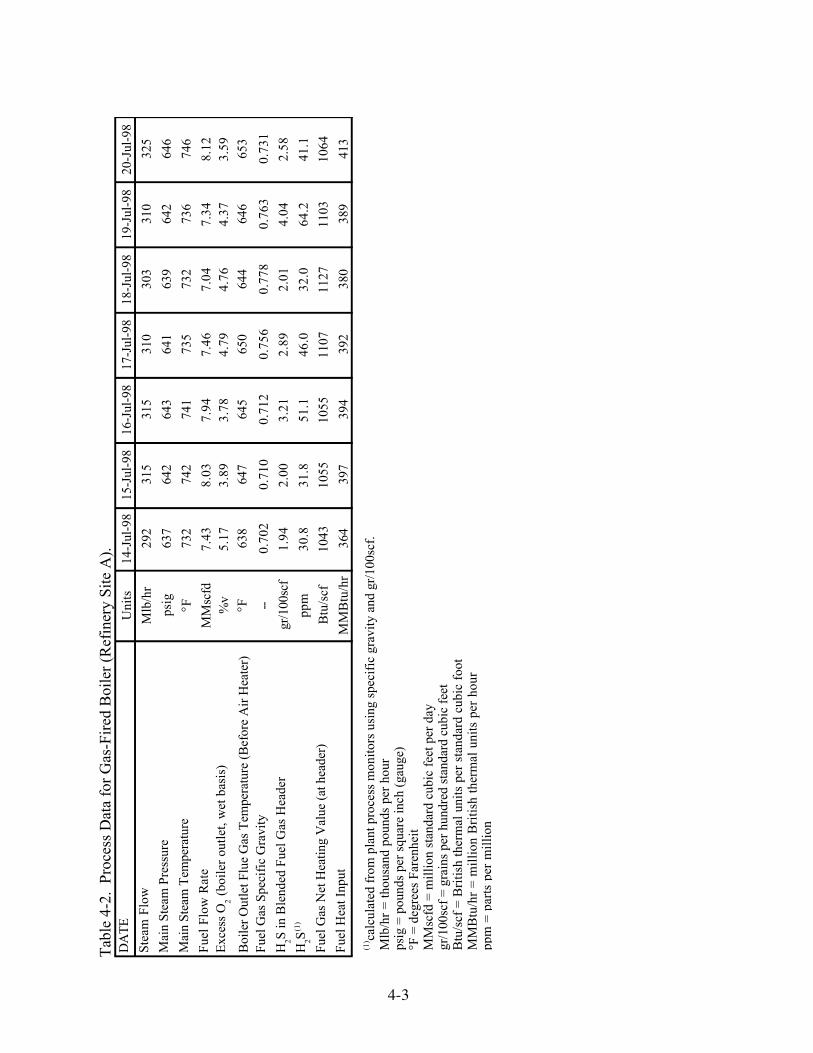
4-3
Tab
le 4
-2.
Proc
ess
Dat
a fo
r G
as-F
ired
Boi
ler
(Ref
iner
y Si
te A
).D
AT
EU
nits
14-J
ul-9
815
-Jul
-98
16-J
ul-9
817
-Jul
-98
18-J
ul-9
819
-Jul
-98
20-J
ul-9
8St
eam
Flo
wM
lb/h
r29
231
531
531
030
331
032
5M
ain
Stea
m P
ress
ure
psig
637
642
643
641
639
642
646
Mai
n St
eam
Tem
pera
ture
¡F73
274
274
173
573
273
674
6Fu
el F
low
Rat
eM
Msc
fd7.
438.
037.
947.
467.
047.
348.
12E
xces
s O
2 (bo
iler
outle
t, w
et b
asis
)%
v5.
173.
893.
784.
794.
764.
373.
59
Boi
ler
Out
let F
lue
Gas
Tem
pera
ture
(B
efor
e A
ir H
eate
r)¡F
638
647
645
650
644
646
653
Fuel
Gas
Spe
cifi
c G
ravi
ty--
0.70
20.
710
0.71
20.
756
0.77
80.
763
0.73
1H
2S in
Ble
nded
Fue
l Gas
Hea
der
gr/1
00sc
f1.
942.
003.
212.
892.
014.
042.
58H
2S(1
)pp
m30
.831
.851
.146
.032
.064
.241
.1Fu
el G
as N
et H
eatin
g V
alue
(at
hea
der)
Btu
/scf
1043
1055
1055
1107
1127
1103
1064
Fuel
Hea
t Inp
utM
MB
tu/h
r36
439
739
439
238
038
941
3
(1) ca
lcul
ated
fro
m p
lant
pro
cess
mon
itors
usi
ng s
peci
fic
grav
ity a
nd g
r/10
0scf
.M
lb/h
r =
thou
sand
pou
nds
per
hour
psig
= p
ound
s pe
r sq
uare
inch
(ga
uge)
¡F =
deg
rees
Far
enhe
itM
Msc
fd =
mill
ion
stan
dard
cub
ic f
eet p
er d
aygr
/100
scf
= gr
ains
per
hun
dred
sta
ndar
d cu
bic
feet
Btu
/scf
= B
ritis
h th
erm
al u
nits
per
sta
ndar
d cu
bic
foot
MM
Btu
/hr
= m
illio
n B
ritis
h th
erm
al u
nits
per
hou
rpp
m =
par
ts p
er m
illio
n
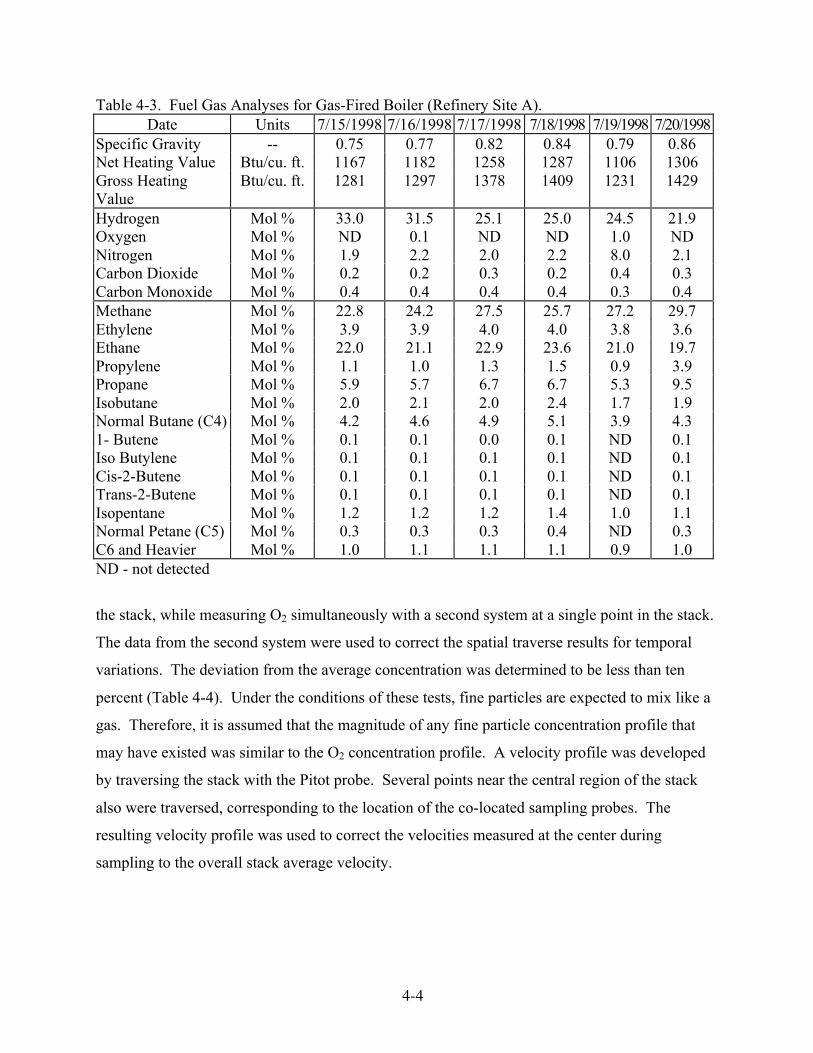
4-4
Table 4-3. Fuel Gas Analyses for Gas-Fired Boiler (Refinery Site A).Date Units 7/15/1998 7/16/1998 7/17/1998 7/18/1998 7/19/1998 7/20/1998
Specific Gravity -- 0.75 0.77 0.82 0.84 0.79 0.86Net Heating Value Btu/cu. ft. 1167 1182 1258 1287 1106 1306Gross HeatingValue
Btu/cu. ft. 1281 1297 1378 1409 1231 1429
Hydrogen Mol % 33.0 31.5 25.1 25.0 24.5 21.9Oxygen Mol % ND 0.1 ND ND 1.0 NDNitrogen Mol % 1.9 2.2 2.0 2.2 8.0 2.1Carbon Dioxide Mol % 0.2 0.2 0.3 0.2 0.4 0.3Carbon Monoxide Mol % 0.4 0.4 0.4 0.4 0.3 0.4Methane Mol % 22.8 24.2 27.5 25.7 27.2 29.7Ethylene Mol % 3.9 3.9 4.0 4.0 3.8 3.6Ethane Mol % 22.0 21.1 22.9 23.6 21.0 19.7Propylene Mol % 1.1 1.0 1.3 1.5 0.9 3.9Propane Mol % 5.9 5.7 6.7 6.7 5.3 9.5Isobutane Mol % 2.0 2.1 2.0 2.4 1.7 1.9Normal Butane (C4) Mol % 4.2 4.6 4.9 5.1 3.9 4.31- Butene Mol % 0.1 0.1 0.0 0.1 ND 0.1Iso Butylene Mol % 0.1 0.1 0.1 0.1 ND 0.1Cis-2-Butene Mol % 0.1 0.1 0.1 0.1 ND 0.1Trans-2-Butene Mol % 0.1 0.1 0.1 0.1 ND 0.1Isopentane Mol % 1.2 1.2 1.2 1.4 1.0 1.1Normal Petane (C5) Mol % 0.3 0.3 0.3 0.4 ND 0.3C6 and Heavier Mol % 1.0 1.1 1.1 1.1 0.9 1.0ND - not detected
the stack, while measuring O2 simultaneously with a second system at a single point in the stack.
The data from the second system were used to correct the spatial traverse results for temporal
variations. The deviation from the average concentration was determined to be less than ten
percent (Table 4-4). Under the conditions of these tests, fine particles are expected to mix like a
gas. Therefore, it is assumed that the magnitude of any fine particle concentration profile that
may have existed was similar to the O2 concentration profile. A velocity profile was developed
by traversing the stack with the Pitot probe. Several points near the central region of the stack
also were traversed, corresponding to the location of the co-located sampling probes. The
resulting velocity profile was used to correct the velocities measured at the center during
sampling to the overall stack average velocity.
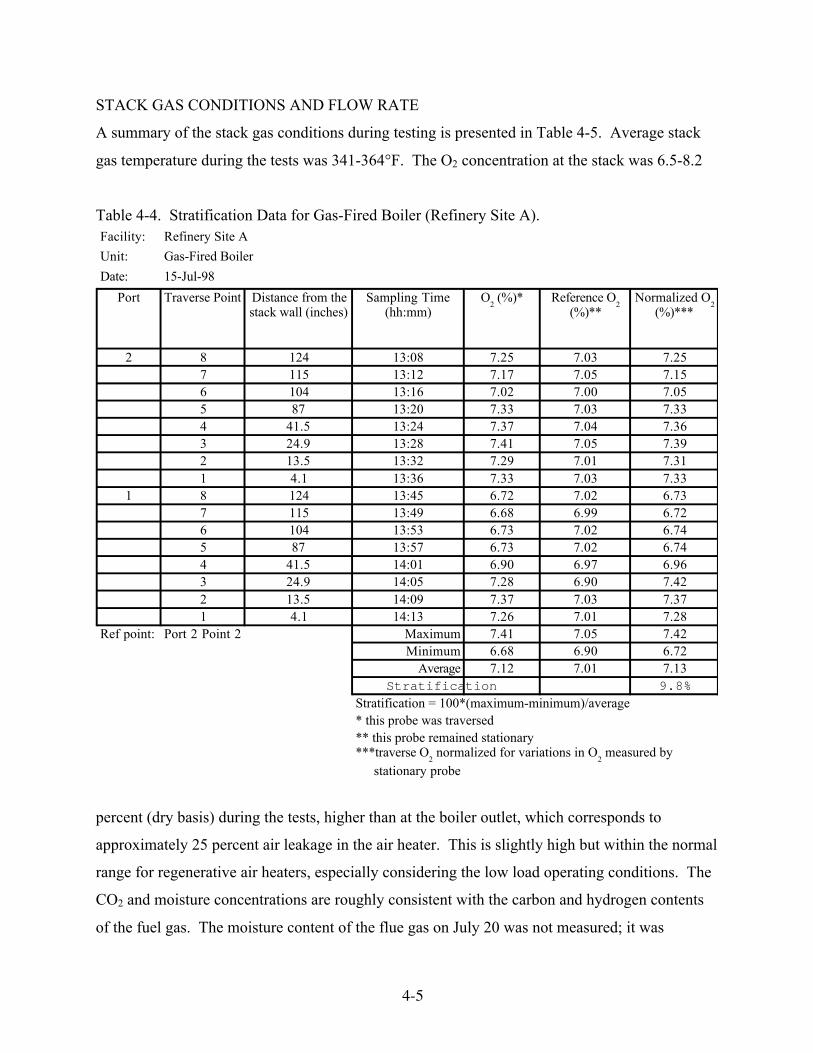
4-5
STACK GAS CONDITIONS AND FLOW RATE
A summary of the stack gas conditions during testing is presented in Table 4-5. Average stack
gas temperature during the tests was 341-364¡F. The O2 concentration at the stack was 6.5-8.2
Table 4-4. Stratification Data for Gas-Fired Boiler (Refinery Site A).
percent (dry basis) during the tests, higher than at the boiler outlet, which corresponds to
approximately 25 percent air leakage in the air heater. This is slightly high but within the normal
range for regenerative air heaters, especially considering the low load operating conditions. The
CO2 and moisture concentrations are roughly consistent with the carbon and hydrogen contents
of the fuel gas. The moisture content of the flue gas on July 20 was not measured; it was
Facility: Refinery Site A
Unit: Gas-Fired Boiler
Date: 15-Jul-98
Port Traverse Point Distance from the stack wall (inches)
Sampling Time (hh:mm)
O2 (%)* Reference O
2 (%)**
Normalized O2
(%)***
2 8 124 13:08 7.25 7.03 7.257 115 13:12 7.17 7.05 7.156 104 13:16 7.02 7.00 7.055 87 13:20 7.33 7.03 7.334 41.5 13:24 7.37 7.04 7.363 24.9 13:28 7.41 7.05 7.392 13.5 13:32 7.29 7.01 7.311 4.1 13:36 7.33 7.03 7.33
1 8 124 13:45 6.72 7.02 6.737 115 13:49 6.68 6.99 6.726 104 13:53 6.73 7.02 6.745 87 13:57 6.73 7.02 6.744 41.5 14:01 6.90 6.97 6.963 24.9 14:05 7.28 6.90 7.422 13.5 14:09 7.37 7.03 7.371 4.1 14:13 7.26 7.01 7.28
Ref point: Port 2 Point 2 Maximum 7.41 7.05 7.42Minimum 6.68 6.90 6.72
Average 7.12 7.01 7.13Stratification 9.8%
Stratification = 100*(maximum-minimum)/average* this probe was traversed** this probe remained stationary***traverse O
2 normalized for variations in O
2 measured by
stationary probe
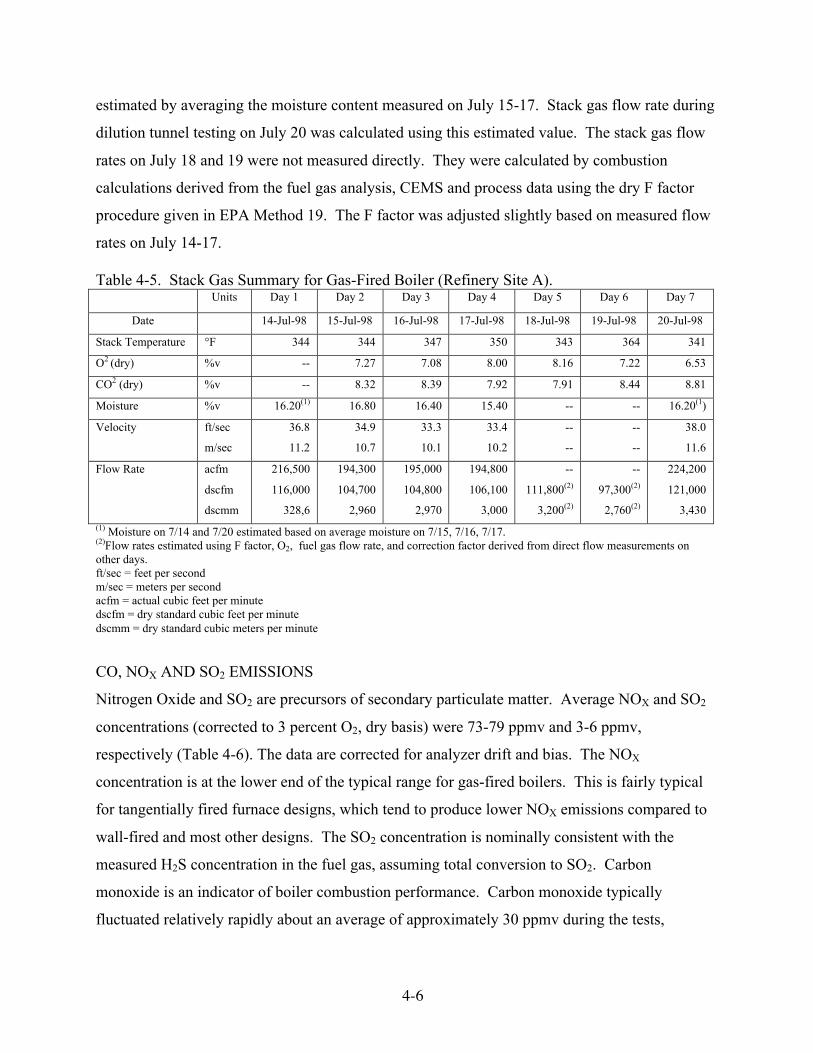
4-6
estimated by averaging the moisture content measured on July 15-17. Stack gas flow rate during
dilution tunnel testing on July 20 was calculated using this estimated value. The stack gas flow
rates on July 18 and 19 were not measured directly. They were calculated by combustion
calculations derived from the fuel gas analysis, CEMS and process data using the dry F factor
procedure given in EPA Method 19. The F factor was adjusted slightly based on measured flow
rates on July 14-17.
Table 4-5. Stack Gas Summary for Gas-Fired Boiler (Refinery Site A).Units Day 1 Day 2 Day 3 Day 4 Day 5 Day 6 Day 7
Date 14-Jul-98 15-Jul-98 16-Jul-98 17-Jul-98 18-Jul-98 19-Jul-98 20-Jul-98
Stack Temperature ¡F 344 344 347 350 343 364 341
O2 (dry) %v -- 7.27 7.08 8.00 8.16 7.22 6.53
CO2 (dry) %v -- 8.32 8.39 7.92 7.91 8.44 8.81
Moisture %v 16.20(1) 16.80 16.40 15.40 -- -- 16.20(1)
Velocity ft/sec
m/sec
36.8
11.2
34.9
10.7
33.3
10.1
33.4
10.2
--
--
--
--
38.0
11.6
Flow Rate acfm
dscfm
dscmm
216,500
116,000
328,6
194,300
104,700
2,960
195,000
104,800
2,970
194,800
106,100
3,000
--
111,800(2)
3,200(2)
--
97,300(2)
2,760(2)
224,200
121,000
3,430(1) Moisture on 7/14 and 7/20 estimated based on average moisture on 7/15, 7/16, 7/17.(2)Flow rates estimated using F factor, O2, fuel gas flow rate, and correction factor derived from direct flow measurements onother days.ft/sec = feet per secondm/sec = meters per secondacfm = actual cubic feet per minutedscfm = dry standard cubic feet per minutedscmm = dry standard cubic meters per minute
CO, NOX AND SO2 EMISSIONS
Nitrogen Oxide and SO2 are precursors of secondary particulate matter. Average NOX and SO2
concentrations (corrected to 3 percent O2, dry basis) were 73-79 ppmv and 3-6 ppmv,
respectively (Table 4-6). The data are corrected for analyzer drift and bias. The NOX
concentration is at the lower end of the typical range for gas-fired boilers. This is fairly typical
for tangentially fired furnace designs, which tend to produce lower NOX emissions compared to
wall-fired and most other designs. The SO2 concentration is nominally consistent with the
measured H2S concentration in the fuel gas, assuming total conversion to SO2. Carbon
monoxide is an indicator of boiler combustion performance. Carbon monoxide typically
fluctuated relatively rapidly about an average of approximately 30 ppmv during the tests,
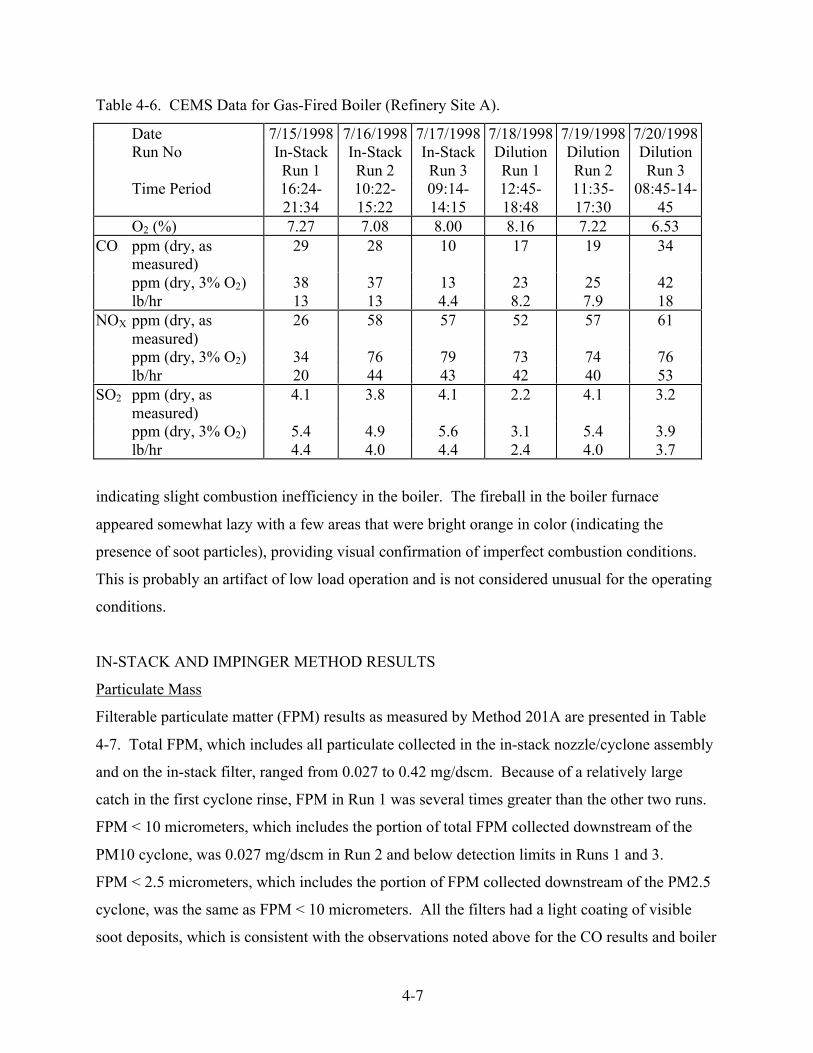
4-7
Table 4-6. CEMS Data for Gas-Fired Boiler (Refinery Site A).
Date 7/15/1998 7/16/1998 7/17/1998 7/18/1998 7/19/1998 7/20/1998Run No In-Stack
Run 1In-StackRun 2
In-StackRun 3
DilutionRun 1
DilutionRun 2
DilutionRun 3
Time Period 16:24-21:34
10:22-15:22
09:14-14:15
12:45-18:48
11:35-17:30
08:45-14-45
O2 (%) 7.27 7.08 8.00 8.16 7.22 6.53CO ppm (dry, as
measured)29 28 10 17 19 34
ppm (dry, 3% O2) 38 37 13 23 25 42lb/hr 13 13 4.4 8.2 7.9 18
NOX ppm (dry, asmeasured)
26 58 57 52 57 61
ppm (dry, 3% O2) 34 76 79 73 74 76lb/hr 20 44 43 42 40 53
SO2 ppm (dry, asmeasured)
4.1 3.8 4.1 2.2 4.1 3.2
ppm (dry, 3% O2) 5.4 4.9 5.6 3.1 5.4 3.9lb/hr 4.4 4.0 4.4 2.4 4.0 3.7
indicating slight combustion inefficiency in the boiler. The fireball in the boiler furnace
appeared somewhat lazy with a few areas that were bright orange in color (indicating the
presence of soot particles), providing visual confirmation of imperfect combustion conditions.
This is probably an artifact of low load operation and is not considered unusual for the operating
conditions.
IN-STACK AND IMPINGER METHOD RESULTS
Particulate Mass
Filterable particulate matter (FPM) results as measured by Method 201A are presented in Table
4-7. Total FPM, which includes all particulate collected in the in-stack nozzle/cyclone assembly
and on the in-stack filter, ranged from 0.027 to 0.42 mg/dscm. Because of a relatively large
catch in the first cyclone rinse, FPM in Run 1 was several times greater than the other two runs.
FPM < 10 micrometers, which includes the portion of total FPM collected downstream of the
PM10 cyclone, was 0.027 mg/dscm in Run 2 and below detection limits in Runs 1 and 3.
FPM < 2.5 micrometers, which includes the portion of FPM collected downstream of the PM2.5
cyclone, was the same as FPM < 10 micrometers. All the filters had a light coating of visible
soot deposits, which is consistent with the observations noted above for the CO results and boiler
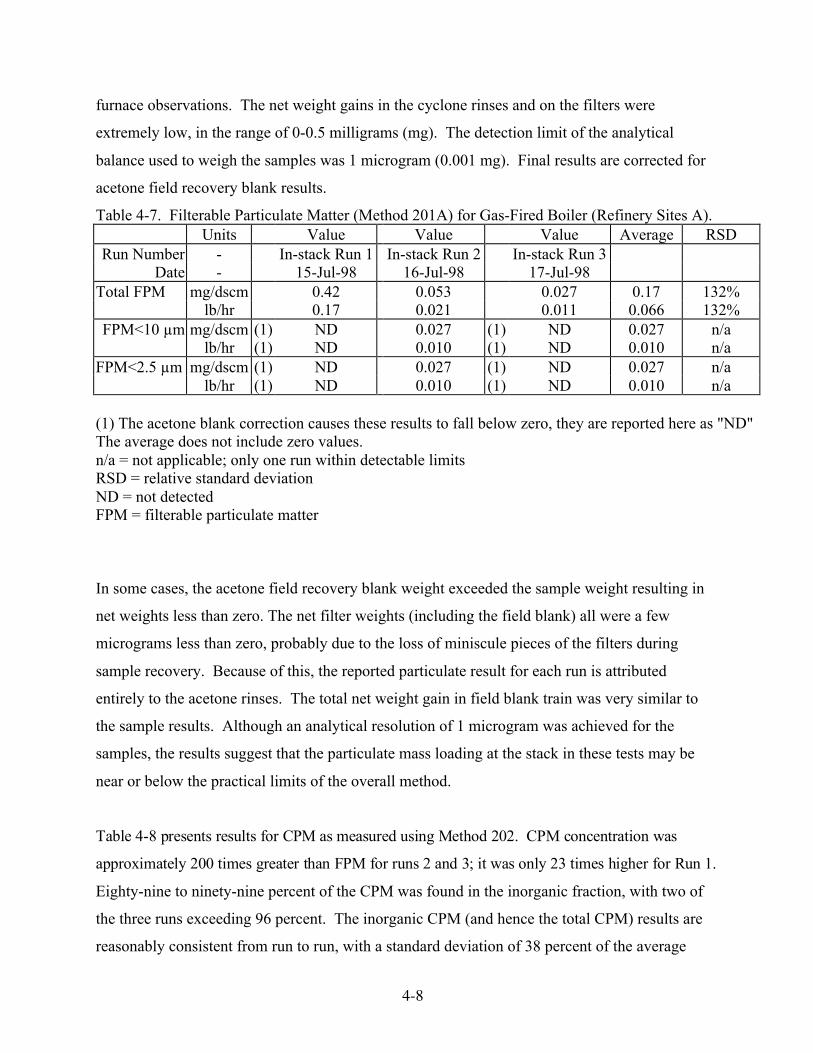
4-8
furnace observations. The net weight gains in the cyclone rinses and on the filters were
extremely low, in the range of 0-0.5 milligrams (mg). The detection limit of the analytical
balance used to weigh the samples was 1 microgram (0.001 mg). Final results are corrected for
acetone field recovery blank results.
Table 4-7. Filterable Particulate Matter (Method 201A) for Gas-Fired Boiler (Refinery Sites A).Units Value Value Value Average RSD
Run Number - In-stack Run 1 In-stack Run 2 In-stack Run 3Date - 15-Jul-98 16-Jul-98 17-Jul-98
Total FPM mg/dscm 0.42 0.053 0.027 0.17 132%lb/hr 0.17 0.021 0.011 0.066 132%
FPM<10 µm mg/dscm (1) ND 0.027 (1) ND 0.027 n/alb/hr (1) ND 0.010 (1) ND 0.010 n/a
FPM<2.5 µm mg/dscm (1) ND 0.027 (1) ND 0.027 n/alb/hr (1) ND 0.010 (1) ND 0.010 n/a
(1) The acetone blank correction causes these results to fall below zero, they are reported here as "ND"The average does not include zero values.n/a = not applicable; only one run within detectable limitsRSD = relative standard deviationND = not detectedFPM = filterable particulate matter
In some cases, the acetone field recovery blank weight exceeded the sample weight resulting in
net weights less than zero. The net filter weights (including the field blank) all were a few
micrograms less than zero, probably due to the loss of miniscule pieces of the filters during
sample recovery. Because of this, the reported particulate result for each run is attributed
entirely to the acetone rinses. The total net weight gain in field blank train was very similar to
the sample results. Although an analytical resolution of 1 microgram was achieved for the
samples, the results suggest that the particulate mass loading at the stack in these tests may be
near or below the practical limits of the overall method.
T able 4- 8 pr esent s resul t s for CPM as m easur ed using Met hod 202. CP M concent rat ion was
approxi m at el y 200 t i mes great er than FP M for r uns 2 and 3; i t was only 23 t im es hi gher for Run 1.
Eighty-nine to ninety-nine percent of the CPM was found in the inorganic fraction, with two of
the three runs exceeding 96 percent. The inorganic CPM (and hence the total CPM) results are
reasonably consistent from run to run, with a standard deviation of 38 percent of the average
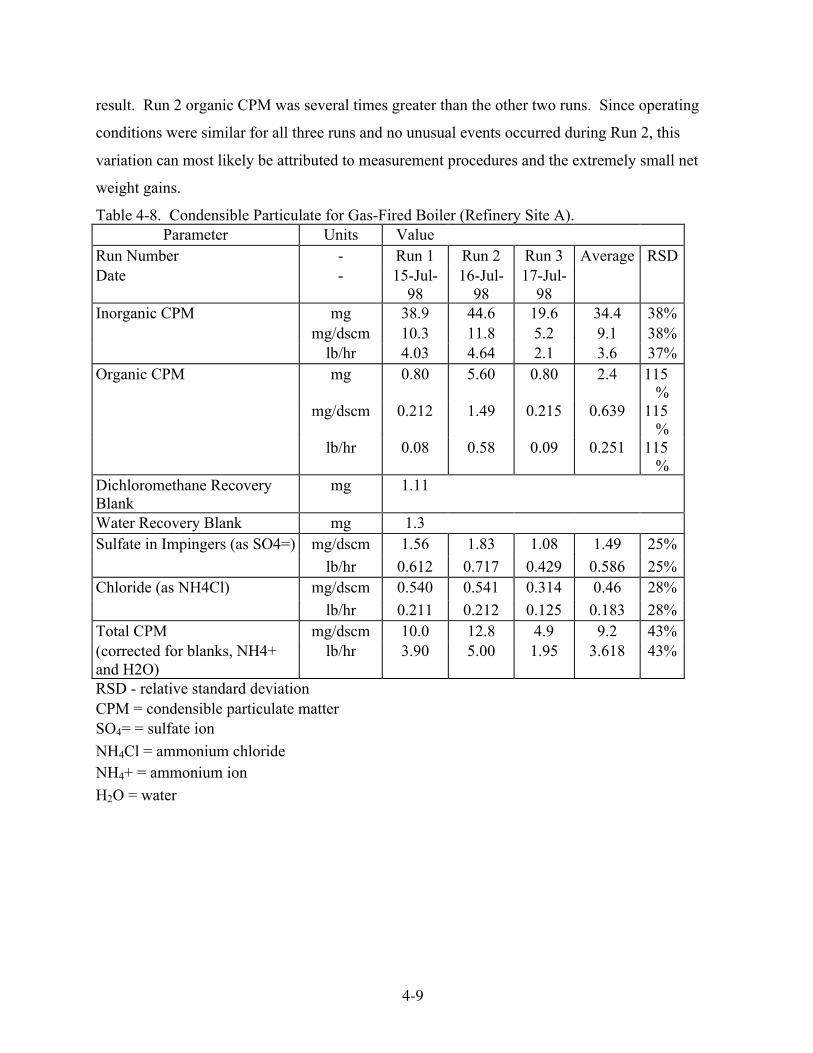
4-9
result. Run 2 organic CPM was several times greater than the other two runs. Since operating
conditions were similar for all three runs and no unusual events occurred during Run 2, this
variation can most likely be attributed to measurement procedures and the extremely small net
weight gains.
Table 4-8. Condensible Particulate for Gas-Fired Boiler (Refinery Site A).Parameter Units Value
Run Number - Run 1 Run 2 Run 3 Average RSDDate - 15-Jul-
9816-Jul-
9817-Jul-
98Inorganic CPM mg 38.9 44.6 19.6 34.4 38%
mg/dscm 10.3 11.8 5.2 9.1 38%lb/hr 4.03 4.64 2.1 3.6 37%
Organic CPM mg 0.80 5.60 0.80 2.4 115%
mg/dscm 0.212 1.49 0.215 0.639 115%
lb/hr 0.08 0.58 0.09 0.251 115%
Dichloromethane RecoveryBlank
mg 1.11
Water Recovery Blank mg 1.3Sulfate in Impingers (as SO4=) mg/dscm 1.56 1.83 1.08 1.49 25%
lb/hr 0.612 0.717 0.429 0.586 25%Chloride (as NH4Cl) mg/dscm 0.540 0.541 0.314 0.46 28%
lb/hr 0.211 0.212 0.125 0.183 28%Total CPM mg/dscm 10.0 12.8 4.9 9.2 43%(corrected for blanks, NH4+and H2O)
lb/hr 3.90 5.00 1.95 3.618 43%
RSD - relative standard deviationCPM = condensible particulate matterSO4= = sulfate ion
NH4Cl = ammonium chlorideNH4+ = ammonium ion
H2O = water
4-10
Total CPM results have been corrected for dichloromethane and water recovery blank results.
The data also are corrected for ammonium ion retained and combined water released in the acid
base titration. These data handling procedures follow Method 202. For two of the runs, the
dichloromethane blank weight exceeded the organic CPM weight. Therefore, separate results for
inorganic and organic CPM shown in Table 4-8 are not blank corrected.
The SO4= content of the raw impinger contents and the Cl- content of the inorganic residue were
determined following Method 202. Sulfate mass, expressed as sulfate ion, accounts for
approximately 60 percent of the total CPM. Although SO4= was measured in an aliquot of the
raw impinger contents prior to the organic extraction, it is assumed that any SO4= present
partitions to the inorganic fraction. Chloride mass in the inorganic residue, expressed as
ammonium chloride, accounts for approximately 20 percent of the total CPM. To confirm these
somewhat surprising results, the inorganic residue was re-analyzed for a broader range of
elements and ions several months after the original analysis. On average, the second analysis
showed SO4 = , Cl- and NH4
+ account f or 6. 0 mg/ dscm , or 77 percent , of the tot al CP M (T abl e 4- 9).
Sodium, K, and Ca account for an average of 0.76 mg/dscm, or 8 percent, of the total average
CPM. The remaining 16 elements and ions that were detected account for an average of 0.3
mg/dscm, or 3 percent, of the average CPM.
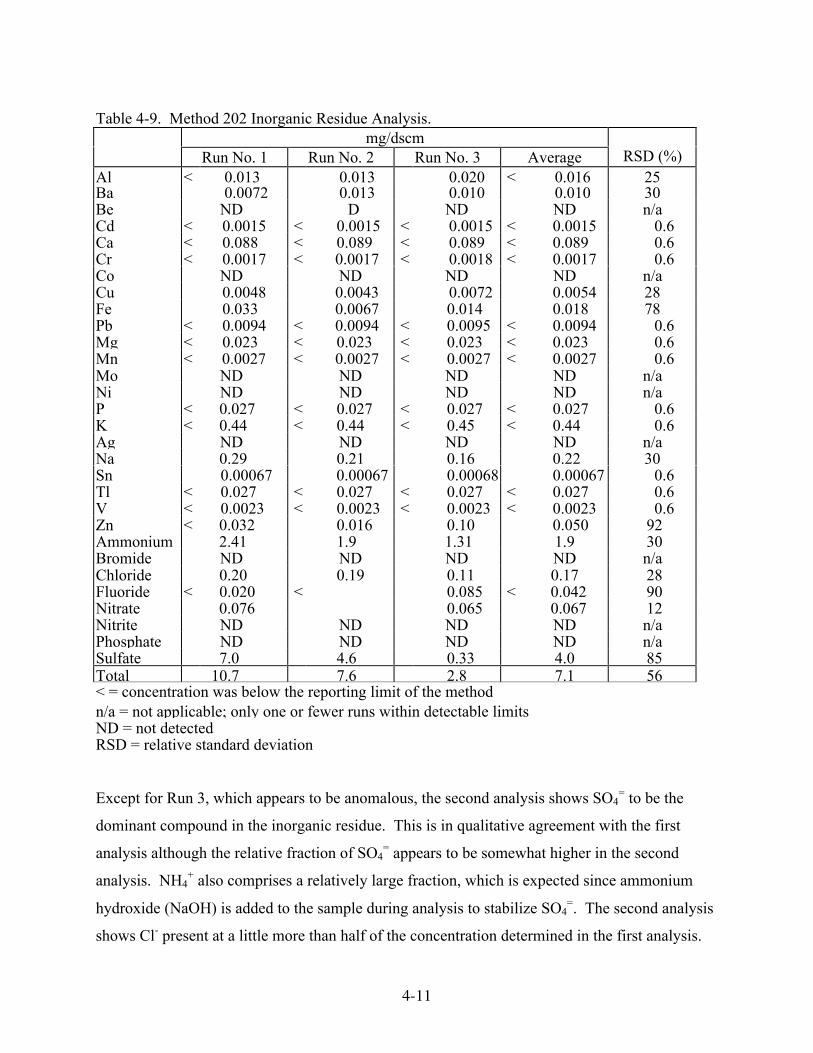
4-11
Table 4-9. Method 202 Inorganic Residue Analysis.mg/dscm
Run No. 1 Run No. 2 Run No. 3 Average RSD (%)Al < 0.013 0.013 0.020 < 0.016 25Ba 0.0072 0.013 0.010 0.010 30Be ND D ND ND n/aCd < 0.0015 < 0.0015 < 0.0015 < 0.0015 0.6Ca < 0.088 < 0.089 < 0.089 < 0.089 0.6Cr < 0.0017 < 0.0017 < 0.0018 < 0.0017 0.6Co ND ND ND ND n/aCu 0.0048 0.0043 0.0072 0.0054 28Fe 0.033 0.0067 0.014 0.018 78Pb < 0.0094 < 0.0094 < 0.0095 < 0.0094 0.6Mg < 0.023 < 0.023 < 0.023 < 0.023 0.6Mn < 0.0027 < 0.0027 < 0.0027 < 0.0027 0.6Mo ND ND ND ND n/aNi ND ND ND ND n/aP < 0.027 < 0.027 < 0.027 < 0.027 0.6K < 0.44 < 0.44 < 0.45 < 0.44 0.6Ag ND ND ND ND n/aNa 0.29 0.21 0.16 0.22 30Sn 0.00067 0.00067 0.00068 0.00067 0.6Tl < 0.027 < 0.027 < 0.027 < 0.027 0.6V < 0.0023 < 0.0023 < 0.0023 < 0.0023 0.6Zn < 0.032 0.016 0.10 0.050 92Ammonium 2.41 1.9 1.31 1.9 30Bromide ND ND ND ND n/aChloride 0.20 0.19 0.11 0.17 28Fluoride < 0.020 < 0.085 < 0.042 90Nitrate 0.076 0.065 0.067 12Nitrite ND ND ND ND n/aPhosphate ND ND ND ND n/aSulfate 7.0 4.6 0.33 4.0 85Total 10.7 7.6 2.8 7.1 56< = concentration was below the reporting limit of the methodn/a = not applicable; only one or fewer runs within detectable limitsND = not detectedRSD = relative standard deviation
Except for Run 3, which appears to be anomalous, the second analysis shows SO4= to be the
dominant compound in the inorganic residue. This is in qualitative agreement with the first
analysis although the relative fraction of SO4= appears to be somewhat higher in the second
analysis. NH4+ also comprises a relatively large fraction, which is expected since ammonium
hydroxide (NaOH) is added to the sample during analysis to stabilize SO4=. The second analysis
shows Cl- present at a little more than half of the concentration determined in the first analysis.
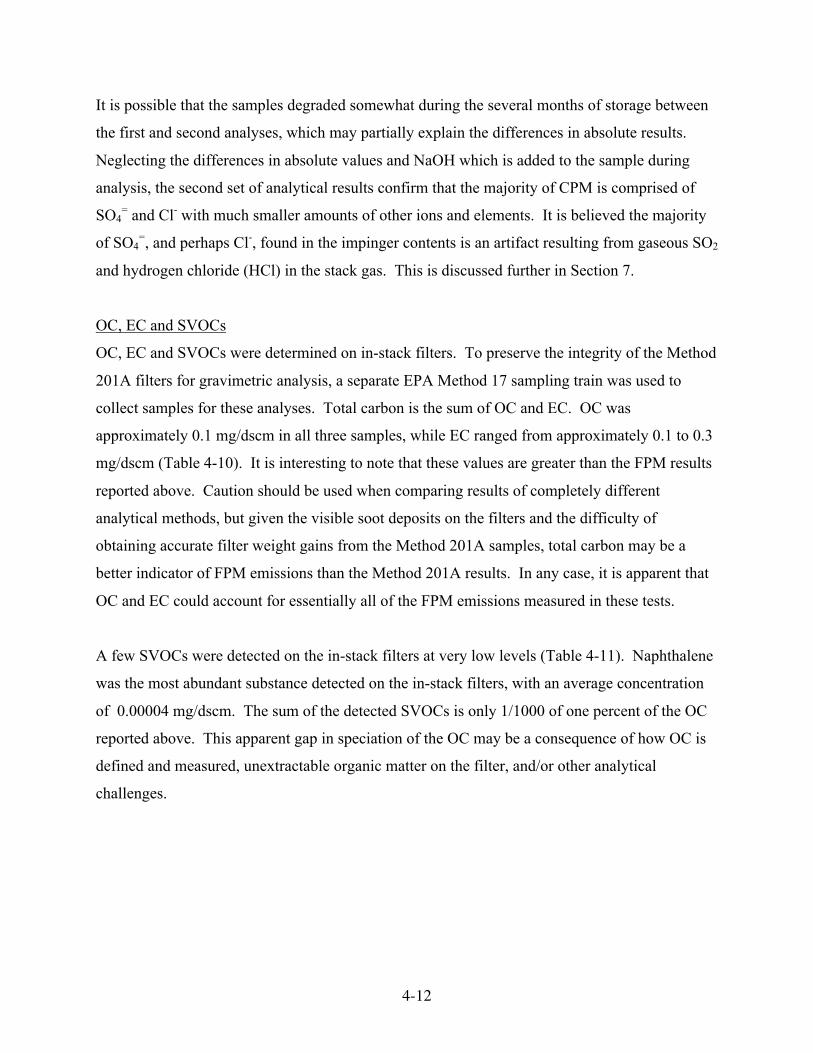
4-12
It is possible that the samples degraded somewhat during the several months of storage between
the first and second analyses, which may partially explain the differences in absolute results.
Neglecting the differences in absolute values and NaOH which is added to the sample during
analysis, the second set of analytical results confirm that the majority of CPM is comprised of
SO4= and Cl- with much smaller amounts of other ions and elements. It is believed the majority
of SO4=, and perhaps Cl-, found in the impinger contents is an artifact resulting from gaseous SO2
and hydrogen chloride (HCl) in the stack gas. This is discussed further in Section 7.
OC, EC and SVOCs
OC, EC and SVOCs were determined on in-stack filters. To preserve the integrity of the Method
201A filters for gravimetric analysis, a separate EPA Method 17 sampling train was used to
collect samples for these analyses. Total carbon is the sum of OC and EC. OC was
approximately 0.1 mg/dscm in all three samples, while EC ranged from approximately 0.1 to 0.3
mg/dscm (Table 4-10). It is interesting to note that these values are greater than the FPM results
reported above. Caution should be used when comparing results of completely different
analytical methods, but given the visible soot deposits on the filters and the difficulty of
obtaining accurate filter weight gains from the Method 201A samples, total carbon may be a
better indicator of FPM emissions than the Method 201A results. In any case, it is apparent that
OC and EC could account for essentially all of the FPM emissions measured in these tests.
A few SVOCs were detected on the in-stack filters at very low levels (Table 4-11). Naphthalene
was the most abundant substance detected on the in-stack filters, with an average concentration
of 0.00004 mg/dscm. The sum of the detected SVOCs is only 1/1000 of one percent of the OC
reported above. This apparent gap in speciation of the OC may be a consequence of how OC is
defined and measured, unextractable organic matter on the filter, and/or other analytical
challenges.
4-13
Table 4-10. In-Stack Organic and Elemental Carbon Results for Gas-Fired BoilerUnits Value
Run Number - Run No. 1 Run No. 2 Run No. 3 Average RSDDate - 15-Jul-98 16-Jul-98 17-Jul-98
Organic mg/dscm 0.13 0.10 0.089 0.11 19%Carbon lb/hr 0.050 0.039 0.035 0.042 18%
Elemental mg/dscm 0.10 0.23 0.27 0.20 44%Carbon lb/hr 0.040 0.092 0.11 0.08 44%
Total mg/dscm 0.23 0.33 0.36 0.31 22%Carbon lb/hr 0.090 0.13 0.14 0.12 23%
ND - not detectedn/a - not applicable; only one run within detectable limitsRSD - relative standard deviation
Figure 4-11. In-Stack SVOC Results for Gas-Fired Boiler (Refinery Site A).mg/dscm
Run Number Run No.1 Run No. 2 Run No. 3 RSDDate 15-Jul-98 16-Jul-98 17-Jul-98 Average (%)Naphthalene 6.4E-5 3.3E-5 2.7E-5 4.1E-5 482-methylnaphthalene 2.1E-5 5.3E-6 ND 1.3E-5 841-methylnaphthalene 1.3E-5 4.8E-6 ND 8.6E-6 63Acenaphthene 1.1E-5 ND 3.2E-6 7.1E-6 77Perinaphthenone 1.0E-5 ND 3.2E-6 6.8E-6 74Biphenyl 5.9E-6 ND ND 5.9E-6 n/aDibenzofuran 4.8E-6 2.1E-6 ND 3.5E-6 54Benzo(a)pyrene ND 2.1E-6 4.3E-6 3.2E-6 48Benz(a)anthracene ND 2.9E-6 ND 2.9E-6 n/a2-methylphenanthrene 2.1E-6 ND 1.6E-6 1.9E-6 19Benzo(b)chrysene 1.3E-6 ND 5.4E-7 9.3E-7 601-methylphenanthrene 8.0E-7 ND 8.1E-7 8.0E-7 0.71,4-chrysenequinone ND 5.3E-7 ND 5.3E-7 n/aAnthrone 5.3E-7 ND ND 5.3E-7 n/aTotal 1.3E-04 5.1E-05 4.0E-05 7.5E-05 0.7ND - not detectedn/a - not applicable; only one run within detectable limitsRSD - relative standard deviation
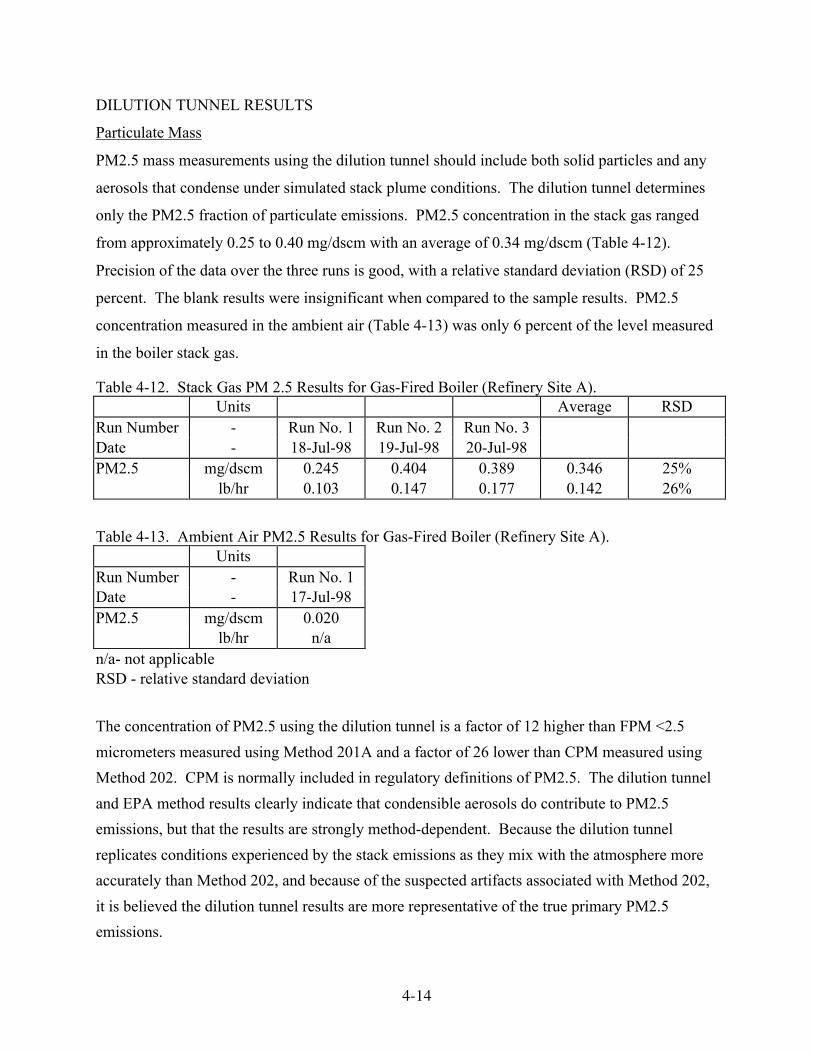
4-14
DILUTION TUNNEL RESULTS
Particulate Mass
PM2.5 mass measurements using the dilution tunnel should include both solid particles and any
aerosols that condense under simulated stack plume conditions. The dilution tunnel determines
only the PM2.5 fraction of particulate emissions. PM2.5 concentration in the stack gas ranged
from approximately 0.25 to 0.40 mg/dscm with an average of 0.34 mg/dscm (Table 4-12).
Precision of the data over the three runs is good, with a relative standard deviation (RSD) of 25
percent. The blank results were insignificant when compared to the sample results. PM2.5
concentration measured in the ambient air (Table 4-13) was only 6 percent of the level measured
in the boiler stack gas.
Table 4-12. Stack Gas PM 2.5 Results for Gas-Fired Boiler (Refinery Site A).Units Average RSD
Run Number - Run No. 1 Run No. 2 Run No. 3Date - 18-Jul-98 19-Jul-98 20-Jul-98PM2.5 mg/dscm 0.245 0.404 0.389 0.346 25%
lb/hr 0.103 0.147 0.177 0.142 26%
Table 4-13. Ambient Air PM2.5 Results for Gas-Fired Boiler (Refinery Site A).Units
Run Number - Run No. 1Date - 17-Jul-98PM2.5 mg/dscm 0.020
lb/hr n/an/a- not applicableRSD - relative standard deviation
The concentration of PM2.5 using the dilution tunnel is a factor of 12 higher than FPM <2.5
micrometers measured using Method 201A and a factor of 26 lower than CPM measured using
Method 202. CPM is normally included in regulatory definitions of PM2.5. The dilution tunnel
and EPA method results clearly indicate that condensible aerosols do contribute to PM2.5
emissions, but that the results are strongly method-dependent. Because the dilution tunnel
replicates conditions experienced by the stack emissions as they mix with the atmosphere more
accurately than Method 202, and because of the suspected artifacts associated with Method 202,
it is believed the dilution tunnel results are more representative of the true primary PM2.5
emissions.
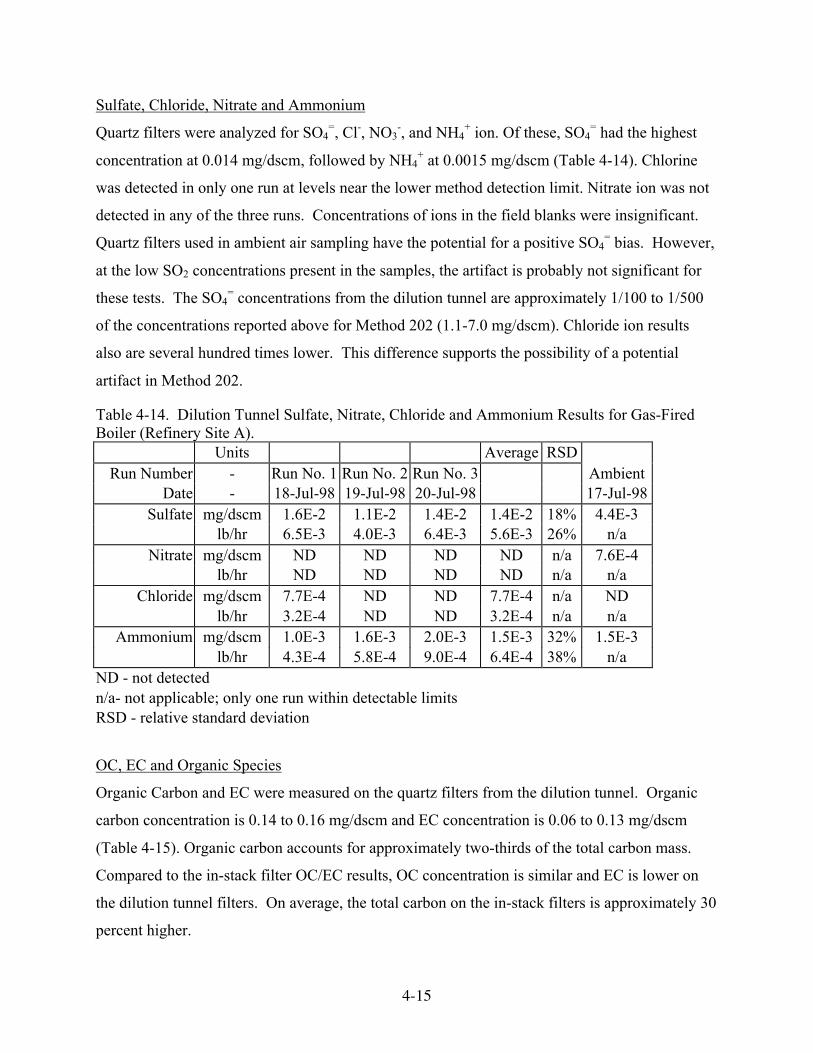
4-15
Sulfate, Chloride, Nitrate and Ammonium
Quartz filters were analyzed for SO4=, Cl-, NO3
-, and NH4+ ion. Of these, SO4
= had the highest
concentration at 0.014 mg/dscm, followed by NH4+ at 0.0015 mg/dscm (Table 4-14). Chlorine
was detected in only one run at levels near the lower method detection limit. Nitrate ion was not
detected in any of the three runs. Concentrations of ions in the field blanks were insignificant.
Quartz filters used in ambient air sampling have the potential for a positive SO4= bias. However,
at the low SO2 concentrations present in the samples, the artifact is probably not significant for
these tests. The SO4= concentrations from the dilution tunnel are approximately 1/100 to 1/500
of the concentrations reported above for Method 202 (1.1-7.0 mg/dscm). Chloride ion results
also are several hundred times lower. This difference supports the possibility of a potential
artifact in Method 202.
Table 4-14. Dilution Tunnel Sulfate, Nitrate, Chloride and Ammonium Results for Gas-FiredBoiler (Refinery Site A).
Units Average RSDRun Number - Run No. 1 Run No. 2 Run No. 3 Ambient
Date - 18-Jul-98 19-Jul-98 20-Jul-98 17-Jul-98Sulfate mg/dscm 1.6E-2 1.1E-2 1.4E-2 1.4E-2 18% 4.4E-3
lb/hr 6.5E-3 4.0E-3 6.4E-3 5.6E-3 26% n/aNitrate mg/dscm ND ND ND ND n/a 7.6E-4
lb/hr ND ND ND ND n/a n/aChloride mg/dscm 7.7E-4 ND ND 7.7E-4 n/a ND
lb/hr 3.2E-4 ND ND 3.2E-4 n/a n/aAmmonium mg/dscm 1.0E-3 1.6E-3 2.0E-3 1.5E-3 32% 1.5E-3
lb/hr 4.3E-4 5.8E-4 9.0E-4 6.4E-4 38% n/aND - not detectedn/a- not applicable; only one run within detectable limitsRSD - relative standard deviation
OC, EC and Organic Species
Organic Carbon and EC were measured on the quartz filters from the dilution tunnel. Organic
carbon concentration is 0.14 to 0.16 mg/dscm and EC concentration is 0.06 to 0.13 mg/dscm
(Table 4-15). Organic carbon accounts for approximately two-thirds of the total carbon mass.
Compared to the in-stack filter OC/EC results, OC concentration is similar and EC is lower on
the dilution tunnel filters. On average, the total carbon on the in-stack filters is approximately 30
percent higher.
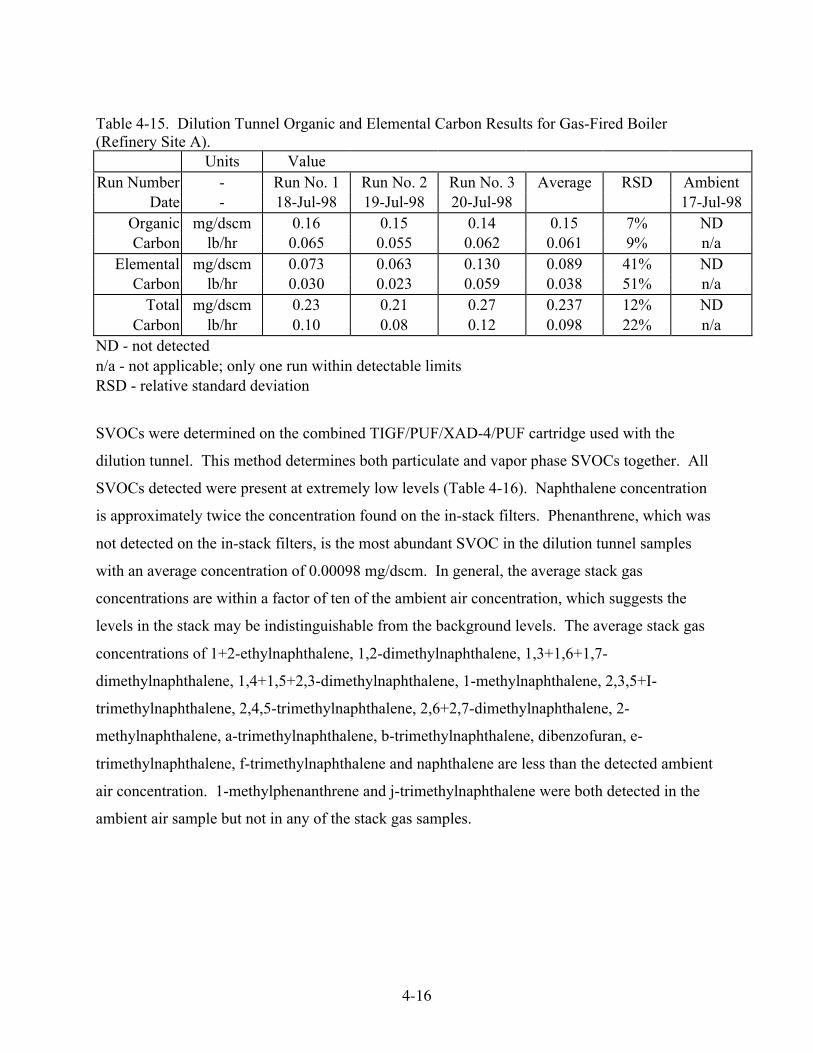
4-16
Table 4-15. Dilution Tunnel Organic and Elemental Carbon Results for Gas-Fired Boiler(Refinery Site A).
Units ValueRun Number - Run No. 1 Run No. 2 Run No. 3 Average RSD Ambient
Date - 18-Jul-98 19-Jul-98 20-Jul-98 17-Jul-98Organic mg/dscm 0.16 0.15 0.14 0.15 7% NDCarbon lb/hr 0.065 0.055 0.062 0.061 9% n/a
Elemental mg/dscm 0.073 0.063 0.130 0.089 41% NDCarbon lb/hr 0.030 0.023 0.059 0.038 51% n/a
Total mg/dscm 0.23 0.21 0.27 0.237 12% NDCarbon lb/hr 0.10 0.08 0.12 0.098 22% n/a
ND - not detectedn/a - not applicable; only one run within detectable limitsRSD - relative standard deviation
SVOCs were determined on the combined TIGF/PUF/XAD-4/PUF cartridge used with the
dilution tunnel. This method determines both particulate and vapor phase SVOCs together. All
SVOCs detected were present at extremely low levels (Table 4-16). Naphthalene concentration
is approximately twice the concentration found on the in-stack filters. Phenanthrene, which was
not detected on the in-stack filters, is the most abundant SVOC in the dilution tunnel samples
with an average concentration of 0.00098 mg/dscm. In general, the average stack gas
concentrations are within a factor of ten of the ambient air concentration, which suggests the
levels in the stack may be indistinguishable from the background levels. The average stack gas
concentrations of 1+2-ethylnaphthalene, 1,2-dimethylnaphthalene, 1,3+1,6+1,7-
dimethylnaphthalene, 1,4+1,5+2,3-dimethylnaphthalene, 1-methylnaphthalene, 2,3,5+I-
trimethylnaphthalene, 2,4,5-trimethylnaphthalene, 2,6+2,7-dimethylnaphthalene, 2-
methylnaphthalene, a-trimethylnaphthalene, b-trimethylnaphthalene, dibenzofuran, e-
trimethylnaphthalene, f-trimethylnaphthalene and naphthalene are less than the detected ambient
air concentration. 1-methylphenanthrene and j-trimethylnaphthalene were both detected in the
ambient air sample but not in any of the stack gas samples.
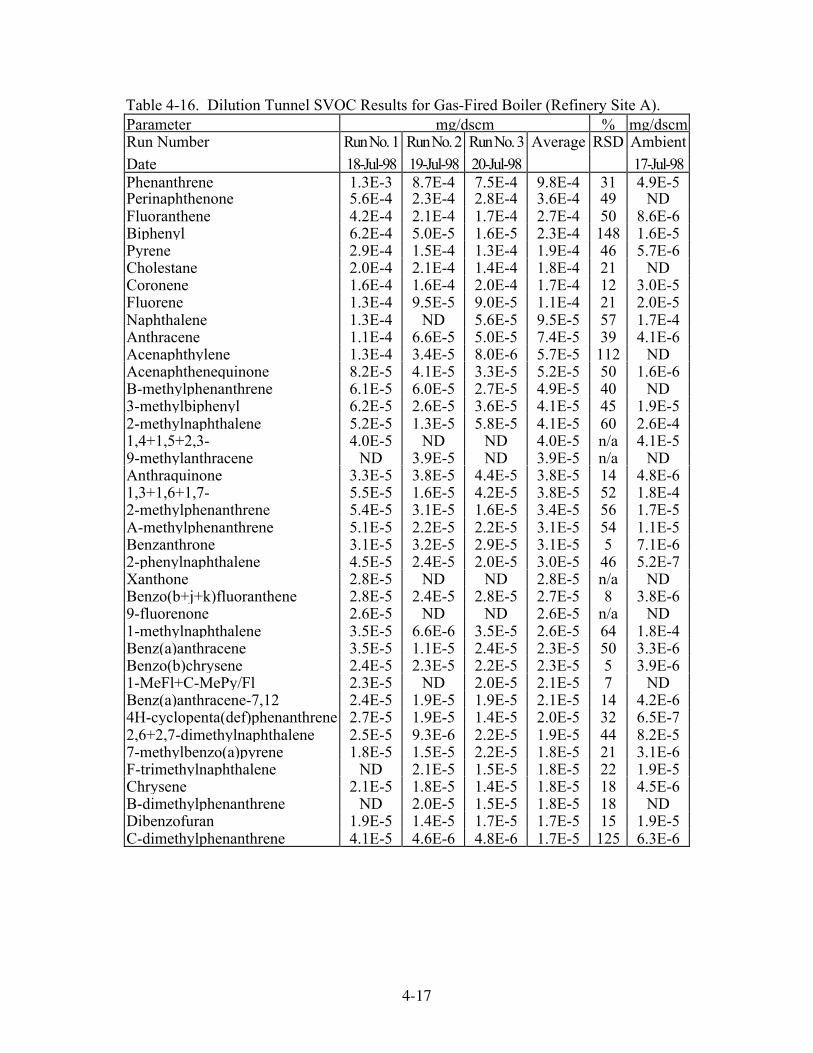
4-17
Table 4-16. Dilution Tunnel SVOC Results for Gas-Fired Boiler (Refinery Site A).Parameter mg/dscm % mg/dscmRun Number Run No. 1 Run No. 2 Run No. 3 Average RSD AmbientDate 18-Jul-98 19-Jul-98 20-Jul-98 17-Jul-98Phenanthrene 1.3E-3 8.7E-4 7.5E-4 9.8E-4 31 4.9E-5Perinaphthenone 5.6E-4 2.3E-4 2.8E-4 3.6E-4 49 NDFluoranthene 4.2E-4 2.1E-4 1.7E-4 2.7E-4 50 8.6E-6Biphenyl 6.2E-4 5.0E-5 1.6E-5 2.3E-4 148 1.6E-5Pyrene 2.9E-4 1.5E-4 1.3E-4 1.9E-4 46 5.7E-6Cholestane 2.0E-4 2.1E-4 1.4E-4 1.8E-4 21 NDCoronene 1.6E-4 1.6E-4 2.0E-4 1.7E-4 12 3.0E-5Fluorene 1.3E-4 9.5E-5 9.0E-5 1.1E-4 21 2.0E-5Naphthalene 1.3E-4 ND 5.6E-5 9.5E-5 57 1.7E-4Anthracene 1.1E-4 6.6E-5 5.0E-5 7.4E-5 39 4.1E-6Acenaphthylene 1.3E-4 3.4E-5 8.0E-6 5.7E-5 112 NDAcenaphthenequinone 8.2E-5 4.1E-5 3.3E-5 5.2E-5 50 1.6E-6B-methylphenanthrene 6.1E-5 6.0E-5 2.7E-5 4.9E-5 40 ND3-methylbiphenyl 6.2E-5 2.6E-5 3.6E-5 4.1E-5 45 1.9E-52-methylnaphthalene 5.2E-5 1.3E-5 5.8E-5 4.1E-5 60 2.6E-41,4+1,5+2,3- 4.0E-5 ND ND 4.0E-5 n/a 4.1E-59-methylanthracene ND 3.9E-5 ND 3.9E-5 n/a NDAnthraquinone 3.3E-5 3.8E-5 4.4E-5 3.8E-5 14 4.8E-61,3+1,6+1,7- 5.5E-5 1.6E-5 4.2E-5 3.8E-5 52 1.8E-42-methylphenanthrene 5.4E-5 3.1E-5 1.6E-5 3.4E-5 56 1.7E-5A-methylphenanthrene 5.1E-5 2.2E-5 2.2E-5 3.1E-5 54 1.1E-5Benzanthrone 3.1E-5 3.2E-5 2.9E-5 3.1E-5 5 7.1E-62-phenylnaphthalene 4.5E-5 2.4E-5 2.0E-5 3.0E-5 46 5.2E-7Xanthone 2.8E-5 ND ND 2.8E-5 n/a NDBenzo(b+j+k)fluoranthene 2.8E-5 2.4E-5 2.8E-5 2.7E-5 8 3.8E-69-fluorenone 2.6E-5 ND ND 2.6E-5 n/a ND1-methylnaphthalene 3.5E-5 6.6E-6 3.5E-5 2.6E-5 64 1.8E-4Benz(a)anthracene 3.5E-5 1.1E-5 2.4E-5 2.3E-5 50 3.3E-6Benzo(b)chrysene 2.4E-5 2.3E-5 2.2E-5 2.3E-5 5 3.9E-61-MeFl+C-MePy/Fl 2.3E-5 ND 2.0E-5 2.1E-5 7 NDBenz(a)anthracene-7,12 2.4E-5 1.9E-5 1.9E-5 2.1E-5 14 4.2E-64H-cyclopenta(def)phenanthrene 2.7E-5 1.9E-5 1.4E-5 2.0E-5 32 6.5E-72,6+2,7-dimethylnaphthalene 2.5E-5 9.3E-6 2.2E-5 1.9E-5 44 8.2E-57-methylbenzo(a)pyrene 1.8E-5 1.5E-5 2.2E-5 1.8E-5 21 3.1E-6F-trimethylnaphthalene ND 2.1E-5 1.5E-5 1.8E-5 22 1.9E-5Chrysene 2.1E-5 1.8E-5 1.4E-5 1.8E-5 18 4.5E-6B-dimethylphenanthrene ND 2.0E-5 1.5E-5 1.8E-5 18 NDDibenzofuran 1.9E-5 1.4E-5 1.7E-5 1.7E-5 15 1.9E-5C-dimethylphenanthrene 4.1E-5 4.6E-6 4.8E-6 1.7E-5 125 6.3E-6
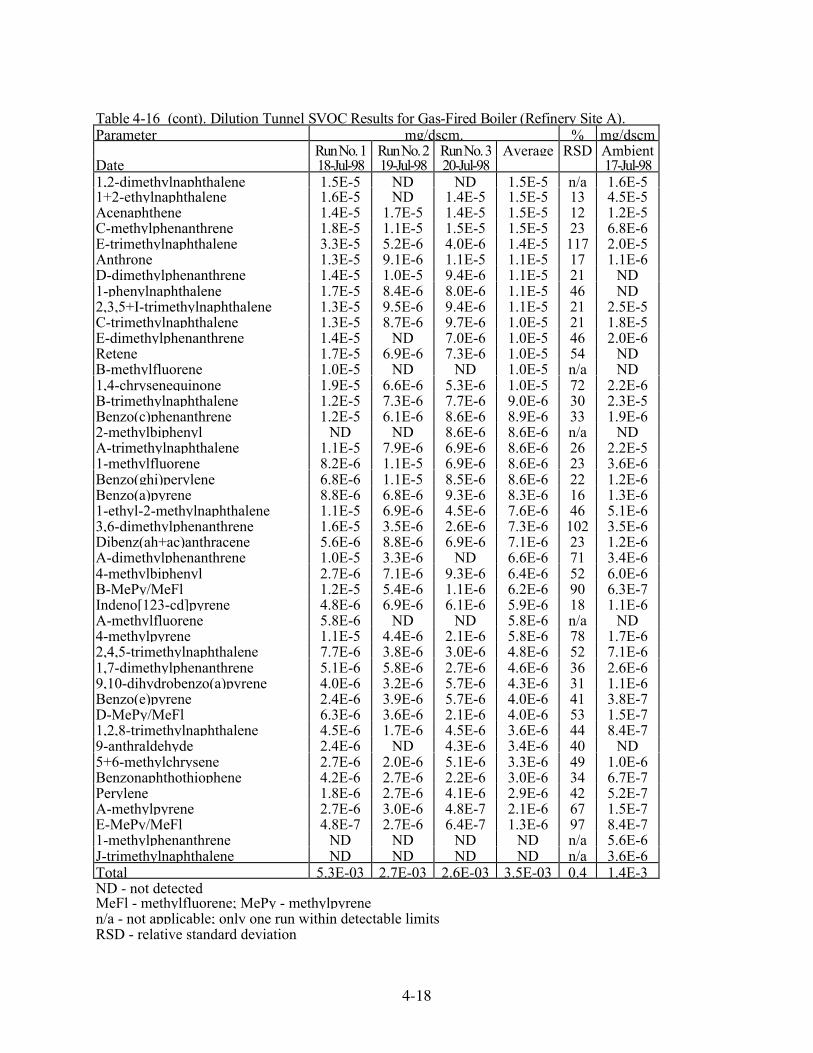
4-18
Ta ble 4 -16 (co nt) . Dilution Tu nne l SVO C Results f or Ga s-Fir ed Boile r ( Ref in ery Site A) .Parameter mg/dscm. % mg/dscm
Run No. 1 Run No. 2 Run No. 3 Average RSD AmbientDate 18-Jul-98 19-Jul-98 20-Jul-98 17-Jul-981,2-dimethylnaphthalene 1.5E-5 ND ND 1.5E-5 n/a 1.6E-51+2-ethylnaphthalene 1.6E-5 ND 1.4E-5 1.5E-5 13 4.5E-5Acenaphthene 1.4E-5 1.7E-5 1.4E-5 1.5E-5 12 1.2E-5C-methylphenanthrene 1.8E-5 1.1E-5 1.5E-5 1.5E-5 23 6.8E-6E-trimethylnaphthalene 3.3E-5 5.2E-6 4.0E-6 1.4E-5 117 2.0E-5Anthrone 1.3E-5 9.1E-6 1.1E-5 1.1E-5 17 1.1E-6D-dimethylphenanthrene 1.4E-5 1.0E-5 9.4E-6 1.1E-5 21 ND1-phenylnaphthalene 1.7E-5 8.4E-6 8.0E-6 1.1E-5 46 ND2,3,5+I-trimethylnaphthalene 1.3E-5 9.5E-6 9.4E-6 1.1E-5 21 2.5E-5C-trimethylnaphthalene 1.3E-5 8.7E-6 9.7E-6 1.0E-5 21 1.8E-5E-dimethylphenanthrene 1.4E-5 ND 7.0E-6 1.0E-5 46 2.0E-6Retene 1.7E-5 6.9E-6 7.3E-6 1.0E-5 54 NDB-methylfluorene 1.0E-5 ND ND 1.0E-5 n/a ND1,4-chrysenequinone 1.9E-5 6.6E-6 5.3E-6 1.0E-5 72 2.2E-6B-trimethylnaphthalene 1.2E-5 7.3E-6 7.7E-6 9.0E-6 30 2.3E-5Benzo(c)phenanthrene 1.2E-5 6.1E-6 8.6E-6 8.9E-6 33 1.9E-62-methylbiphenyl ND ND 8.6E-6 8.6E-6 n/a NDA-trimethylnaphthalene 1.1E-5 7.9E-6 6.9E-6 8.6E-6 26 2.2E-51-methylfluorene 8.2E-6 1.1E-5 6.9E-6 8.6E-6 23 3.6E-6Benzo(ghi)perylene 6.8E-6 1.1E-5 8.5E-6 8.6E-6 22 1.2E-6Benzo(a)pyrene 8.8E-6 6.8E-6 9.3E-6 8.3E-6 16 1.3E-61-ethyl-2-methylnaphthalene 1.1E-5 6.9E-6 4.5E-6 7.6E-6 46 5.1E-63,6-dimethylphenanthrene 1.6E-5 3.5E-6 2.6E-6 7.3E-6 102 3.5E-6Dibenz(ah+ac)anthracene 5.6E-6 8.8E-6 6.9E-6 7.1E-6 23 1.2E-6A-dimethylphenanthrene 1.0E-5 3.3E-6 ND 6.6E-6 71 3.4E-64-methylbiphenyl 2.7E-6 7.1E-6 9.3E-6 6.4E-6 52 6.0E-6B-MePy/MeFl 1.2E-5 5.4E-6 1.1E-6 6.2E-6 90 6.3E-7Indeno[123-cd]pyrene 4.8E-6 6.9E-6 6.1E-6 5.9E-6 18 1.1E-6A-methylfluorene 5.8E-6 ND ND 5.8E-6 n/a ND4-methylpyrene 1.1E-5 4.4E-6 2.1E-6 5.8E-6 78 1.7E-62,4,5-trimethylnaphthalene 7.7E-6 3.8E-6 3.0E-6 4.8E-6 52 7.1E-61,7-dimethylphenanthrene 5.1E-6 5.8E-6 2.7E-6 4.6E-6 36 2.6E-69,10-dihydrobenzo(a)pyrene 4.0E-6 3.2E-6 5.7E-6 4.3E-6 31 1.1E-6Benzo(e)pyrene 2.4E-6 3.9E-6 5.7E-6 4.0E-6 41 3.8E-7D-MePy/MeFl 6.3E-6 3.6E-6 2.1E-6 4.0E-6 53 1.5E-71,2,8-trimethylnaphthalene 4.5E-6 1.7E-6 4.5E-6 3.6E-6 44 8.4E-79-anthraldehyde 2.4E-6 ND 4.3E-6 3.4E-6 40 ND5+6-methylchrysene 2.7E-6 2.0E-6 5.1E-6 3.3E-6 49 1.0E-6Benzonaphthothiophene 4.2E-6 2.7E-6 2.2E-6 3.0E-6 34 6.7E-7Perylene 1.8E-6 2.7E-6 4.1E-6 2.9E-6 42 5.2E-7A-methylpyrene 2.7E-6 3.0E-6 4.8E-7 2.1E-6 67 1.5E-7E-MePy/MeFl 4.8E-7 2.7E-6 6.4E-7 1.3E-6 97 8.4E-71-methylphenanthrene ND ND ND ND n/a 5.6E-6J-trimethylnaphthalene ND ND ND ND n/a 3.6E-6Total 5.3E-03 2.7E-03 2.6E-03 3.5E-03 0.4 1.4E-3ND - not detectedMeFl - methylfluorene; MePy - methylpyrenen/a - not applicable; only one run within detectable limitsRSD - relative standard deviation
4-19
Most of the average SVOC stack gas concentrations are at least a factor of ten greater than their
respective field blank concentrations. The field blank concentrations of 2-methylbiphenyl, 4-
methylbiphenyl, 9,10-dihydrobenzo(a)pyrene, 9-anthraldehyde, a-methylpyrene, anthrone,
cholestane and dibenz(ah+ac)anthracene are greater than their average stack gas concentrations,
which indicates the stack gas results for these SVOCs are unreliable (see Section 6 for further
details).
Tenax sorbent was used for determining VOCs. The analysis focused on VOCs with a carbon
number greater than 7 since these are believed to be the most significant precursors for
secondary organic aerosols. Benzaldehyde was the most abundant VOC detected during
sampling, with an average concentration of 0.057 mg/dscm (Table 4-17). Acetophenone was the
second most abundant on average (0.057 mg/dscm). In general, the average VOC concentration
in the stack gas was within a factor of ten of the ambient air concentration. 1,2,4-
trimethylbenzene, decane, dodecane, m- & p-xylenes, o-xylene, p-isopropyltoluene, pentadecane
and undecane all have average stack gas concentrations that are lower than their respective
ambient air concentration. The average stack gas concentrations of styrene and decane are
within a factor of ten of their concentrations in the field blank sample (see Section 6), which may
indicate unreliable stack gas results for these VOCs.
Elements
Element concentrations were determined by XRF analysis of the TMFs used in the dilution
tunnel. On average, S is the most abundant element and Na the second most abundant (Table 4-
18). The S results are in fair agreement with the dilution tunnel SO4= results presented earlier,
within a factor of two on a mole-for-mole basis. Sodium results are considered semi-quantitative
because of analytical limitations. Chlorine, Ni, V, Cu, and to a lesser degree S and Cr, are
significantly enriched in the stack gas samples compared to the ambient air. Anitomy, Ba, Cd,
Ga, Au, In, La, Mn, Hg, Mo, Pd, P, Se, Ag, Tl, Sn and Y concentrations are below detection
limits in all three sample runs (not listed in the table). In addition, Br, Rb, Sr, and Zr were
detected in the ambient sample but not in the sample runs. The concentration of most
compounds in the stack gas is within a factor of ten of their respective ambient air concentration.
Aluminum and Ca concentrations are higher than in the ambient air than in the stack gas.
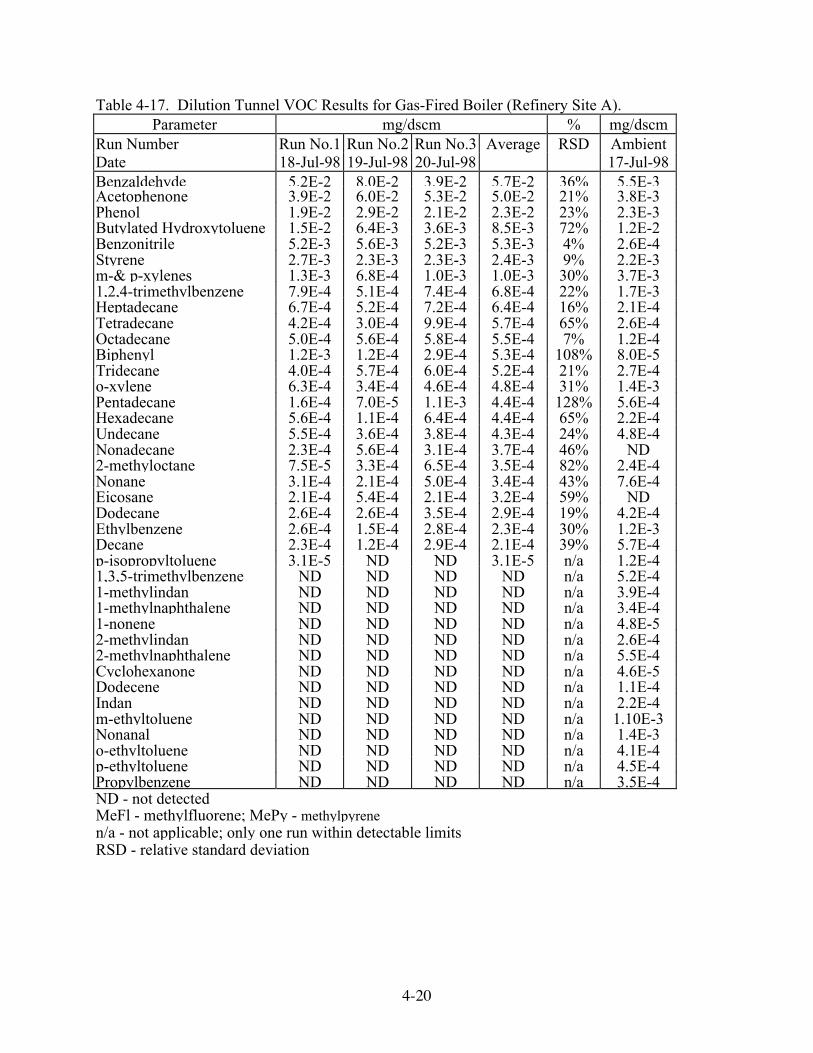
4-20
Table 4-17. Dilution Tunnel VOC Results for Gas-Fired Boiler (Refinery Site A).Parameter mg/dscm % mg/dscm
Run Number Run No.1 Run No.2 Run No.3 Average RSD AmbientDate 18-Jul-98 19-Jul-98 20-Jul-98 17-Jul-98Benzaldehyde 5.2E-2 8.0E-2 3.9E-2 5.7E-2 36% 5.5E-3Acetophenone 3.9E-2 6.0E-2 5.3E-2 5.0E-2 21% 3.8E-3Phenol 1.9E-2 2.9E-2 2.1E-2 2.3E-2 23% 2.3E-3Butylated Hydroxytoluene 1.5E-2 6.4E-3 3.6E-3 8.5E-3 72% 1.2E-2Benzonitrile 5.2E-3 5.6E-3 5.2E-3 5.3E-3 4% 2.6E-4Styrene 2.7E-3 2.3E-3 2.3E-3 2.4E-3 9% 2.2E-3m-& p-xylenes 1.3E-3 6.8E-4 1.0E-3 1.0E-3 30% 3.7E-31,2,4-trimethylbenzene 7.9E-4 5.1E-4 7.4E-4 6.8E-4 22% 1.7E-3Heptadecane 6.7E-4 5.2E-4 7.2E-4 6.4E-4 16% 2.1E-4Tetradecane 4.2E-4 3.0E-4 9.9E-4 5.7E-4 65% 2.6E-4Octadecane 5.0E-4 5.6E-4 5.8E-4 5.5E-4 7% 1.2E-4Biphenyl 1.2E-3 1.2E-4 2.9E-4 5.3E-4 108% 8.0E-5Tridecane 4.0E-4 5.7E-4 6.0E-4 5.2E-4 21% 2.7E-4o-xylene 6.3E-4 3.4E-4 4.6E-4 4.8E-4 31% 1.4E-3Pentadecane 1.6E-4 7.0E-5 1.1E-3 4.4E-4 128% 5.6E-4Hexadecane 5.6E-4 1.1E-4 6.4E-4 4.4E-4 65% 2.2E-4Undecane 5.5E-4 3.6E-4 3.8E-4 4.3E-4 24% 4.8E-4Nonadecane 2.3E-4 5.6E-4 3.1E-4 3.7E-4 46% ND2-methyloctane 7.5E-5 3.3E-4 6.5E-4 3.5E-4 82% 2.4E-4Nonane 3.1E-4 2.1E-4 5.0E-4 3.4E-4 43% 7.6E-4Eicosane 2.1E-4 5.4E-4 2.1E-4 3.2E-4 59% NDDodecane 2.6E-4 2.6E-4 3.5E-4 2.9E-4 19% 4.2E-4Ethylbenzene 2.6E-4 1.5E-4 2.8E-4 2.3E-4 30% 1.2E-3Decane 2.3E-4 1.2E-4 2.9E-4 2.1E-4 39% 5.7E-4p-isopropyltoluene 3.1E-5 ND ND 3.1E-5 n/a 1.2E-41,3,5-trimethylbenzene ND ND ND ND n/a 5.2E-41-methylindan ND ND ND ND n/a 3.9E-41-methylnaphthalene ND ND ND ND n/a 3.4E-41-nonene ND ND ND ND n/a 4.8E-52-methylindan ND ND ND ND n/a 2.6E-42-methylnaphthalene ND ND ND ND n/a 5.5E-4Cyclohexanone ND ND ND ND n/a 4.6E-5Dodecene ND ND ND ND n/a 1.1E-4Indan ND ND ND ND n/a 2.2E-4m-ethyltoluene ND ND ND ND n/a 1.10E-3Nonanal ND ND ND ND n/a 1.4E-3o-ethyltoluene ND ND ND ND n/a 4.1E-4p-ethyltoluene ND ND ND ND n/a 4.5E-4Propylbenzene ND ND ND ND n/a 3.5E-4ND - not detectedMeFl - methylfluorene; MePy - methylpyrenen/a - not applicable; only one run within detectable limitsRSD - relative standard deviation

4-21
Table 4-18. Dilution Tunnel Elemental Results for Gas-Fired Boiler (Refinery Site A).Parameter mg/dscm % mg/dscm
Run Number Run No. 1 Run No. 2 Run No. 3 Average RSD AmbientDate 18-Jul-98 19-Jul-98 20-Jul-98 17-Jul-98Aluminum 2.5E-4 2.7E-4 2.4E-4 2.5E-4 7% 3.6E-4Arsenic 1.5E-4 2.3E-4 2.3E-4 2.0E-4 24% NDBromine ND ND ND ND n/a 2.3E-6Calcium 3.4E-4 2.3E-4 6.8E-4 4.2E-4 55% 6.8E-4Chlorine 6.5E-4 ND ND 6.5E-4 n/a 1.0E-5Cobalt ND 7.3E-6 1.4E-5 1.1E-5 46% NDChromium 1.5E-5 ND ND 1.5E-5 n/a 2.3E-6Copper 1.1E-3 2.2E-3 1.2E-3 1.5E-3 40% 1.5E-4Iron 1.4E-3 1.8E-3 2.3E-3 1.8E-3 24% 4.9E-4Potassium 1.1E-4 1.8E-4 2.6E-4 1.8E-4 42% 1.7E-4Magnesium 1.0E-4 3.2E-4 9.2E-7 1.4E-4 116% 6.9E-5Manganese ND ND ND ND n/a 1.3E-5Nickel 1.6E-4 2.1E-4 2.8E-4 2.1E-4 28% 7.4E-6Lead 2.3E-5 ND 8.3E-5 5.3E-5 81% 1.3E-5Rubidium ND ND ND ND n/a 8.4E-7Silicon 1.0E-3 1.2E-3 1.4E-3 1.2E-3 15% 1.1E-3Sodium 3.4E-3 1.5E-3 1.1E-3 2.0E-3 62% NDStrontium ND ND ND ND n/a 3.6E-6Sulfur 6.87E-3 8.06E-3 1.1E-2 8.5E-3 23% 1.2E-3Titanium ND ND 4.3E-5 4.3E-5 n/a 3.6E-5Uranium ND 1.5E-5 ND 1.5E-5 n/a NDVanadium 2.5E-4 3.6E-4 5.0E-4 3.7E-4 33% 1.9E-5Zinc 1.2E-4 1.3E-4 2.0E-4 1.5E-4 28% 6.6E-5Zirconium ND ND ND ND n/a 2.8E-6ND - not detectedn/a - not applicable; only one run within detectable limitsRSD - relative standard deviation
Indium and P were present at detectable levels in the blank, but not in the field samples.
Magnesium in the field blank was within a factor of ten of the average stack gas concentration.
All other compounds detected in the field blank were present at insignificant levels (see Section
6 for further details).
5-1
Section 5
EMISSION FACTORS AND SPECIATION PROFILES
Emission factors were determined by dividing the emission rate, in lb/hr, by the measured heat
input, in MMBtu/hr, to give pounds per million British thermal unit (lb/MMBtu). Heat input is
the product of the measured fuel flow rate and the average fuel heating value (based on fuel grab
sample analysis and continuous fuel specific gravity monitoring). Average emission factors
were determined by averaging detected data. Undetected data were excluded.
UNCERTAINTY
An uncertainty analysis was performed to determine the 95 percent confidence interval and to
estimate the upper limit of the measured emission factor and the mass speciation results (ASME,
1990). In the tables that follow, the reported results, the total uncertainty, and a 95 percent
confidence upper bound are given for each of the substances of interest. The total uncertainty
represents the 95 percent confidence interval, based on a two-tailed Student "t" distribution. The
95 percent confidence upper bound estimate is based on the single-tailed Student "t" distribution
at the 95 percent confidence level.
EMISSION FACTORS FOR PRIMARY EMISSIONS
Table 5-1 presents emission factors for primary emissions, including filterable and condensable
particulate mass, and elements and ions as measured on the dilution tunnel filters. FPM includes
all particulate captured in the in-stack cyclones, probe and filter. Inorganic and organic CPM
have not been individually blank corrected, however the total CPM has been corrected in
accordance with Method 202 guidelines. The average emission factor for total PM2.5 (including
CPM) measured using in-stack methods is 27 times higher than the emission factor for PM2.5 by
the dilution tunnel. As discussed previously in Section 4, this is believed to be due to sampling
and analytical artifacts associated with the method for CPM. Therefore, the emission factor
derived from the dilution tunnel results is considered the most reliable.
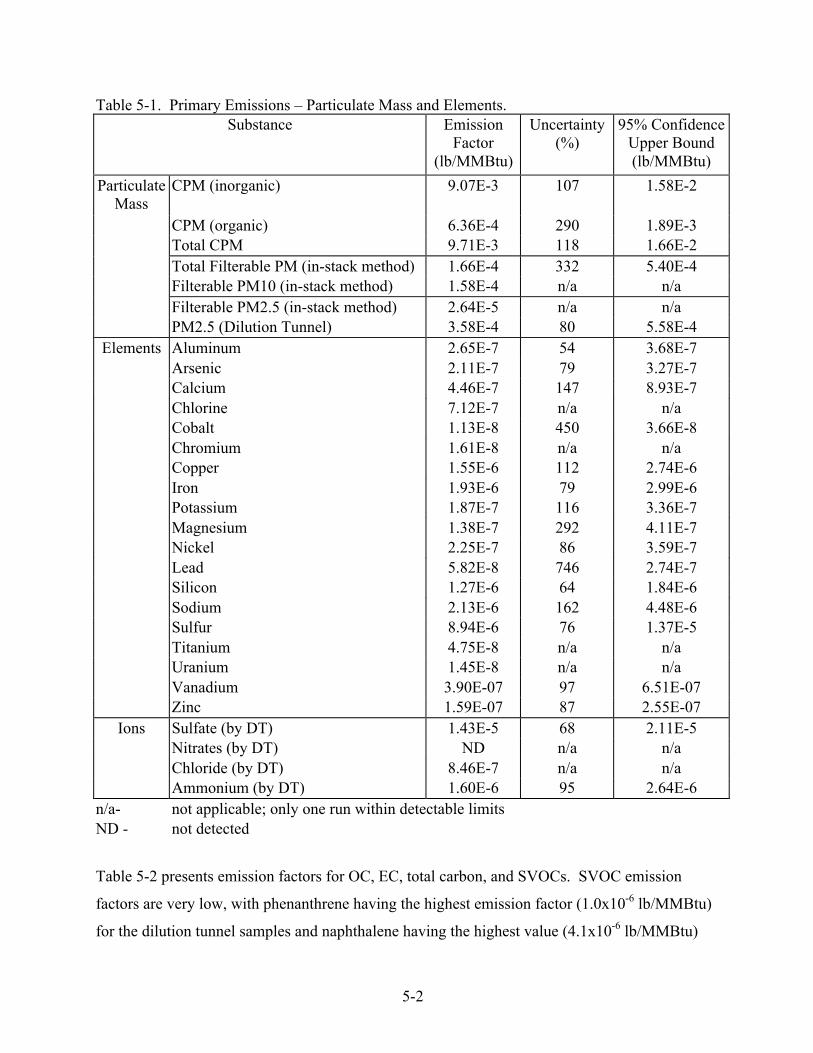
5-2
Table 5-1. Primary Emissions Ð Particulate Mass and Elements.Substance Emission
Factor(lb/MMBtu)
Uncertainty(%)
95% ConfidenceUpper Bound(lb/MMBtu)
ParticulateMass
CPM (inorganic) 9.07E-3 107 1.58E-2
CPM (organic) 6.36E-4 290 1.89E-3Total CPM 9.71E-3 118 1.66E-2Total Filterable PM (in-stack method) 1.66E-4 332 5.40E-4Filterable PM10 (in-stack method) 1.58E-4 n/a n/aFilterable PM2.5 (in-stack method) 2.64E-5 n/a n/aPM2.5 (Dilution Tunnel) 3.58E-4 80 5.58E-4
Elements Aluminum 2.65E-7 54 3.68E-7Arsenic 2.11E-7 79 3.27E-7Calcium 4.46E-7 147 8.93E-7Chlorine 7.12E-7 n/a n/aCobalt 1.13E-8 450 3.66E-8Chromium 1.61E-8 n/a n/aCopper 1.55E-6 112 2.74E-6Iron 1.93E-6 79 2.99E-6Potassium 1.87E-7 116 3.36E-7Magnesium 1.38E-7 292 4.11E-7Nickel 2.25E-7 86 3.59E-7Lead 5.82E-8 746 2.74E-7Silicon 1.27E-6 64 1.84E-6Sodium 2.13E-6 162 4.48E-6Sulfur 8.94E-6 76 1.37E-5Titanium 4.75E-8 n/a n/aUranium 1.45E-8 n/a n/aVanadium 3.90E-07 97 6.51E-07Zinc 1.59E-07 87 2.55E-07
Ions Sulfate (by DT) 1.43E-5 68 2.11E-5Nitrates (by DT) ND n/a n/aChloride (by DT) 8.46E-7 n/a n/aAmmonium (by DT) 1.60E-6 95 2.64E-6
n/a- not applicable; only one run within detectable limitsND - not detected
Table 5-2 presents emission factors for OC, EC, total carbon, and SVOCs. SVOC emission
factors are very low, with phenanthrene having the highest emission factor (1.0x10⁻⁶ lb/MMBtu)
for the dilution tunnel samples and naphthalene having the highest value (4.1x10⁻⁶ lb/MMBtu)
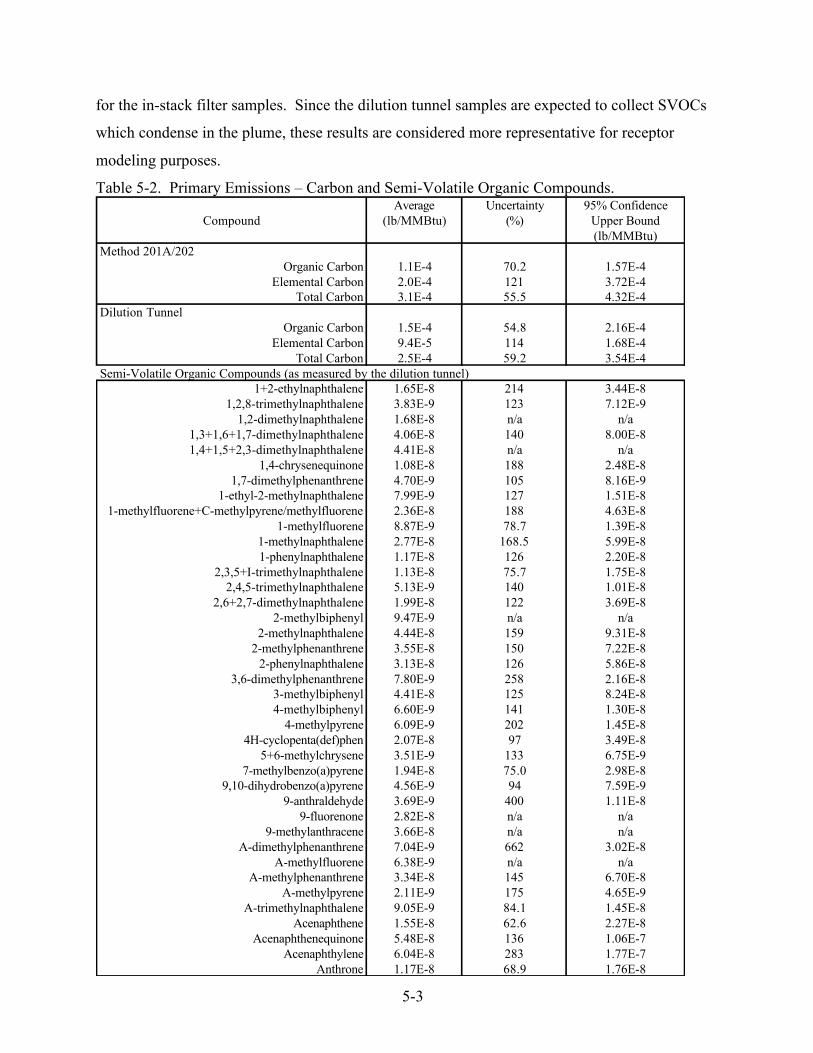
5-3
for the in-stack filter samples. Since the dilution tunnel samples are expected to collect SVOCs
which condense in the plume, these results are considered more representative for receptor
modeling purposes.
Table 5-2. Primary Emissions Ð Carbon and Semi-Volatile Organic Compounds.Average Uncertainty 95% Confidence
Compound (lb/MMBtu) (%) Upper Bound(lb/MMBtu)
Method 201A/202Organic Carbon 1.1E-4 70.2 1.57E-4
Elemental Carbon 2.0E-4 121 3.72E-4Total Carbon 3.1E-4 55.5 4.32E-4
Dilution TunnelOrganic Carbon 1.5E-4 54.8 2.16E-4
Elemental Carbon 9.4E-5 114 1.68E-4Total Carbon 2.5E-4 59.2 3.54E-4
Semi-Volatile Organic Compounds (as measured by the dilution tunnel)1+2-ethylnaphthalene 1.65E-8 214 3.44E-8
1,2,8-trimethylnaphthalene 3.83E-9 123 7.12E-91,2-dimethylnaphthalene 1.68E-8 n/a n/a
1,3+1,6+1,7-dimethylnaphthalene 4.06E-8 140 8.00E-81,4+1,5+2,3-dimethylnaphthalene 4.41E-8 n/a n/a
1,4-chrysenequinone 1.08E-8 188 2.48E-81,7-dimethylphenanthrene 4.70E-9 105 8.16E-9
1-ethyl-2-methylnaphthalene 7.99E-9 127 1.51E-81-methylfluorene+C-methylpyrene/methylfluorene 2.36E-8 188 4.63E-8
1-methylfluorene 8.87E-9 78.7 1.39E-81-methylnaphthalene 2.77E-8 168.5 5.99E-81-phenylnaphthalene 1.17E-8 126 2.20E-8
2,3,5+I-trimethylnaphthalene 1.13E-8 75.7 1.75E-82,4,5-trimethylnaphthalene 5.13E-9 140 1.01E-8
2,6+2,7-dimethylnaphthalene 1.99E-8 122 3.69E-82-methylbiphenyl 9.47E-9 n/a n/a
2-methylnaphthalene 4.44E-8 159 9.31E-82-methylphenanthrene 3.55E-8 150 7.22E-8
2-phenylnaphthalene 3.13E-8 126 5.86E-83,6-dimethylphenanthrene 7.80E-9 258 2.16E-8
3-methylbiphenyl 4.41E-8 125 8.24E-84-methylbiphenyl 6.60E-9 141 1.30E-8
4-methylpyrene 6.09E-9 202 1.45E-84H-cyclopenta(def)phen 2.07E-8 97 3.49E-8
5+6-methylchrysene 3.51E-9 133 6.75E-97-methylbenzo(a)pyrene 1.94E-8 75.0 2.98E-8
9,10-dihydrobenzo(a)pyrene 4.56E-9 94 7.59E-99-anthraldehyde 3.69E-9 400 1.11E-8
9-fluorenone 2.82E-8 n/a n/a9-methylanthracene 3.66E-8 n/a n/a
A-dimethylphenanthrene 7.04E-9 662 3.02E-8A-methylfluorene 6.38E-9 n/a n/a
A-methylphenanthrene 3.34E-8 145 6.70E-8A-methylpyrene 2.11E-9 175 4.65E-9
A-trimethylnaphthalene 9.05E-9 84.1 1.45E-8Acenaphthene 1.55E-8 62.6 2.27E-8
Acenaphthenequinone 5.48E-8 136 1.06E-7Acenaphthylene 6.04E-8 283 1.77E-7
Anthrone 1.17E-8 68.9 1.76E-8
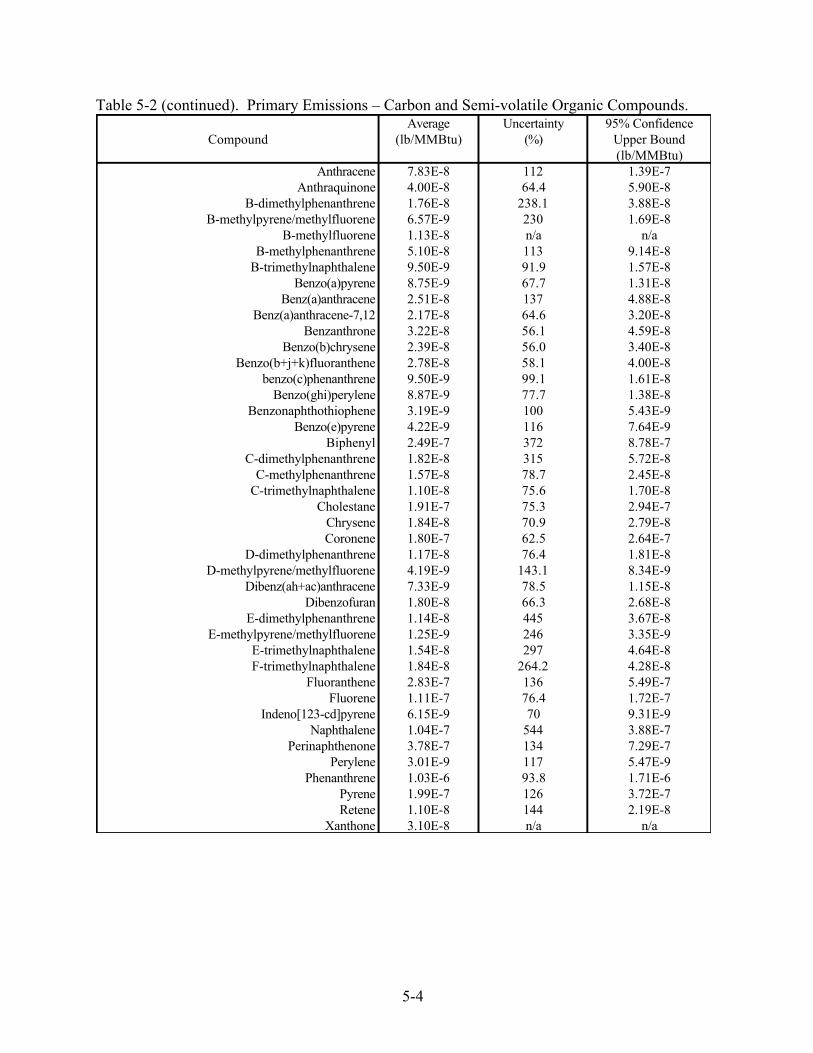
5-4
Table 5-2 (continued). Primary Emissions Ð Carbon and Semi-volatile Organic Compounds.Average Uncertainty 95% Confidence
Compound (lb/MMBtu) (%) Upper Bound(lb/MMBtu)
Anthracene 7.83E-8 112 1.39E-7Anthraquinone 4.00E-8 64.4 5.90E-8
B-dimethylphenanthrene 1.76E-8 238.1 3.88E-8B-methylpyrene/methylfluorene 6.57E-9 230 1.69E-8
B-methylfluorene 1.13E-8 n/a n/aB-methylphenanthrene 5.10E-8 113 9.14E-8
B-trimethylnaphthalene 9.50E-9 91.9 1.57E-8Benzo(a)pyrene 8.75E-9 67.7 1.31E-8
Benz(a)anthracene 2.51E-8 137 4.88E-8Benz(a)anthracene-7,12 2.17E-8 64.6 3.20E-8
Benzanthrone 3.22E-8 56.1 4.59E-8Benzo(b)chrysene 2.39E-8 56.0 3.40E-8
Benzo(b+j+k)fluoranthene 2.78E-8 58.1 4.00E-8benzo(c)phenanthrene 9.50E-9 99.1 1.61E-8
Benzo(ghi)perylene 8.87E-9 77.7 1.38E-8Benzonaphthothiophene 3.19E-9 100 5.43E-9
Benzo(e)pyrene 4.22E-9 116 7.64E-9Biphenyl 2.49E-7 372 8.78E-7
C-dimethylphenanthrene 1.82E-8 315 5.72E-8C-methylphenanthrene 1.57E-8 78.7 2.45E-8
C-trimethylnaphthalene 1.10E-8 75.6 1.70E-8Cholestane 1.91E-7 75.3 2.94E-7
Chrysene 1.84E-8 70.9 2.79E-8Coronene 1.80E-7 62.5 2.64E-7
D-dimethylphenanthrene 1.17E-8 76.4 1.81E-8D-methylpyrene/methylfluorene 4.19E-9 143.1 8.34E-9
Dibenz(ah+ac)anthracene 7.33E-9 78.5 1.15E-8Dibenzofuran 1.80E-8 66.3 2.68E-8
E-dimethylphenanthrene 1.14E-8 445 3.67E-8E-methylpyrene/methylfluorene 1.25E-9 246 3.35E-9
E-trimethylnaphthalene 1.54E-8 297 4.64E-8F-trimethylnaphthalene 1.84E-8 264.2 4.28E-8
Fluoranthene 2.83E-7 136 5.49E-7Fluorene 1.11E-7 76.4 1.72E-7
Indeno[123-cd]pyrene 6.15E-9 70 9.31E-9Naphthalene 1.04E-7 544 3.88E-7
Perinaphthenone 3.78E-7 134 7.29E-7Perylene 3.01E-9 117 5.47E-9
Phenanthrene 1.03E-6 93.8 1.71E-6Pyrene 1.99E-7 126 3.72E-7Retene 1.10E-8 144 2.19E-8
Xanthone 3.10E-8 n/a n/a
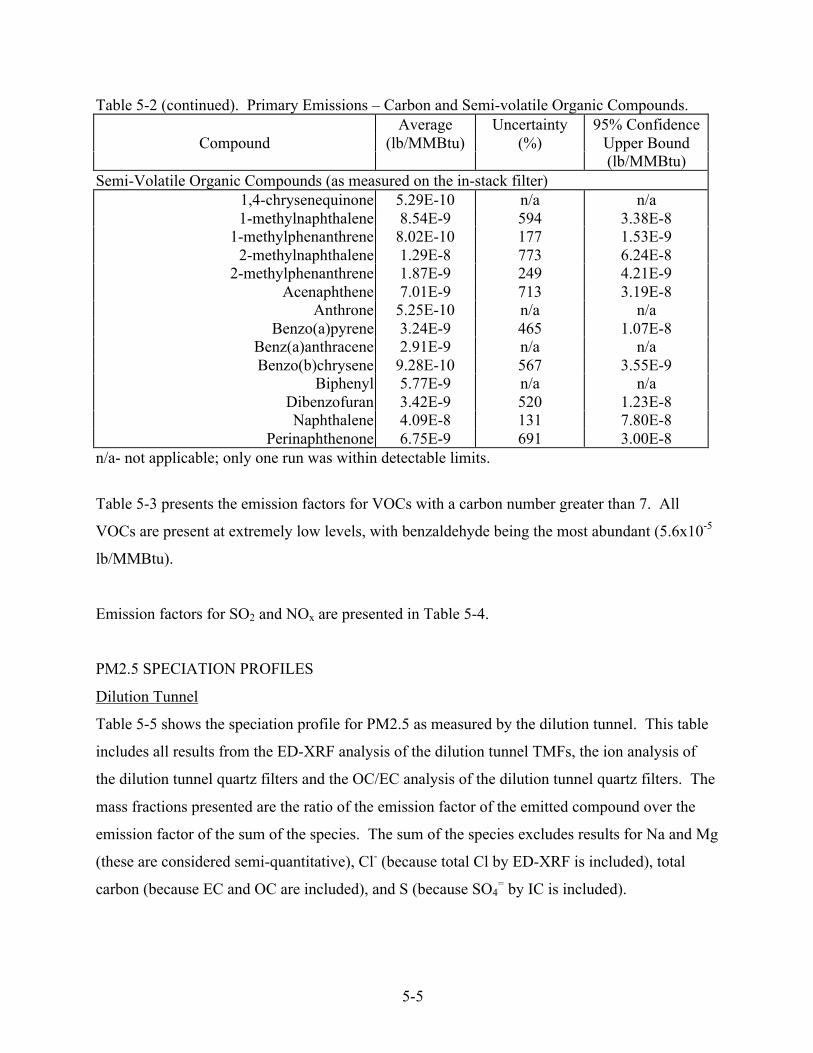
5-5
Table 5-2 (continued). Primary Emissions Ð Carbon and Semi-volatile Organic Compounds.Average Uncertainty 95% Confidence
Compound (lb/MMBtu) (%) Upper Bound(lb/MMBtu)
Semi-Volatile Organic Compounds (as measured on the in-stack filter)1,4-chrysenequinone 5.29E-10 n/a n/a1-methylnaphthalene 8.54E-9 594 3.38E-8
1-methylphenanthrene 8.02E-10 177 1.53E-92-methylnaphthalene 1.29E-8 773 6.24E-8
2-methylphenanthrene 1.87E-9 249 4.21E-9Acenaphthene 7.01E-9 713 3.19E-8
Anthrone 5.25E-10 n/a n/aBenzo(a)pyrene 3.24E-9 465 1.07E-8
Benz(a)anthracene 2.91E-9 n/a n/aBenzo(b)chrysene 9.28E-10 567 3.55E-9
Biphenyl 5.77E-9 n/a n/aDibenzofuran 3.42E-9 520 1.23E-8Naphthalene 4.09E-8 131 7.80E-8
Perinaphthenone 6.75E-9 691 3.00E-8n/a- not applicable; only one run was within detectable limits.
Table 5-3 presents the emission factors for VOCs with a carbon number greater than 7. All
VOCs are present at extremely low levels, with benzaldehyde being the most abundant (5.6x10⁻⁵
lb/MMBtu).
Emission factors for SO2 and NOx are presented in Table 5-4.
PM2.5 SPECIATION PROFILES
Dilution Tunnel
Table 5-5 shows the speciation profile for PM2.5 as measured by the dilution tunnel. This table
includes all results from the ED-XRF analysis of the dilution tunnel TMFs, the ion analysis of
the dilution tunnel quartz filters and the OC/EC analysis of the dilution tunnel quartz filters. The
mass fractions presented are the ratio of the emission factor of the emitted compound over the
emission factor of the sum of the species. The sum of the species excludes results for Na and Mg
(these are considered semi-quantitative), Cl- (because total Cl by ED-XRF is included), total
carbon (because EC and OC are included), and S (because SO4= by IC is included).
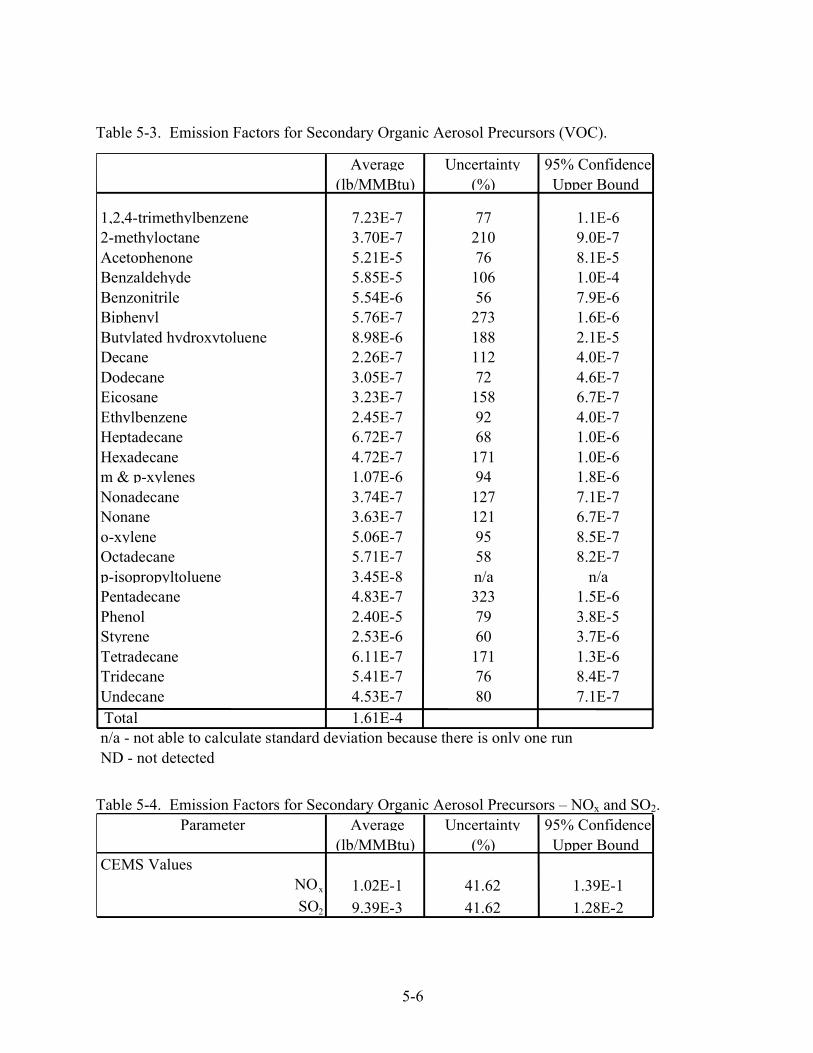
5-6
Table 5-3. Emission Factors for Secondary Organic Aerosol Precursors (VOC).
Table 5-4. Emission Factors for Secondary Organic Aerosol Precursors Ð NOx and SO2.
Average Uncertainty 95% Confidence(lb/MMBtu) (%) Upper Bound
1,2,4-trimethylbenzene 7.23E-7 77 1.1E-62-methyloctane 3.70E-7 210 9.0E-7Acetophenone 5.21E-5 76 8.1E-5Benzaldehyde 5.85E-5 106 1.0E-4Benzonitrile 5.54E-6 56 7.9E-6Biphenyl 5.76E-7 273 1.6E-6Butylated hydroxytoluene 8.98E-6 188 2.1E-5Decane 2.26E-7 112 4.0E-7Dodecane 3.05E-7 72 4.6E-7Eicosane 3.23E-7 158 6.7E-7Ethylbenzene 2.45E-7 92 4.0E-7Heptadecane 6.72E-7 68 1.0E-6Hexadecane 4.72E-7 171 1.0E-6m & p-xylenes 1.07E-6 94 1.8E-6Nonadecane 3.74E-7 127 7.1E-7Nonane 3.63E-7 121 6.7E-7o-xylene 5.06E-7 95 8.5E-7Octadecane 5.71E-7 58 8.2E-7p-isopropyltoluene 3.45E-8 n/a n/aPentadecane 4.83E-7 323 1.5E-6Phenol 2.40E-5 79 3.8E-5Styrene 2.53E-6 60 3.7E-6Tetradecane 6.11E-7 171 1.3E-6Tridecane 5.41E-7 76 8.4E-7Undecane 4.53E-7 80 7.1E-7Total 1.61E-4n/a - not able to calculate standard deviation because there is only one runND - not detected
Parameter Average Uncertainty 95% Confidence(lb/MMBtu) (%) Upper Bound
CEMS ValuesNOx 1.02E-1 41.62 1.39E-1SO2 9.39E-3 41.62 1.28E-2
5-7
Table 5-5. Speciation Profile for Dilution Tunnel Primary Emissions for Gas-Fired Boiler(Refinery Site A).
Average Uncertainty 95% ConfidenceCompound Mass Fraction (1) (%) Upper Bound
(%) (%)Aluminum 9.8E-2 194 2.3E-1Arsenic 7.7E-2 203 1.8E-1Calcium 1.6E-1 237 4.3E-1Chlorine 2.6E-1 n/a n/aCobalt 4.1E-3 810 2.1E-2Chromium 5.9E-3 n/a n/aCopper 5.7E-1 218 1.4E+0Iron 7.1E-1 203 1.7E+0Potassium 6.9E-2 220 1.7E-1Magnesium* 5.1E-2 347 1.7E-1Nickel 8.3E-2 205 2.0E-1Lead 2.1E-2 1005 1.3E-1Silicon 4.7E-1 197 1.1E+0Sodium* 7.8E-1 247 2.1E+0Sulfur* 3.3E+0 202 7.8E+0Titanium 1.7E-2 n/a n/aUranium 5.3E-3 n/a n/aVanadium 1.4E-1 210 3.5E-1Zinc 5.8E-2 206 1.4E-1Organic Carbon 56.8 194 1.3E+2Elemental Carbon 34.6 219 8.6E+1Total Carbon* 91.4 196 2.1E+2Sulfate 5.25 198 1.2E+1Nitrate ND n/a n/aChloride* 0.31 n/a n/aAmmonium 0.59 209 1.4E+0Total 100ND - all three runs were non-detectn/a- not applicable; only one run within detectable limits.1-Mass fraction is emission factor of species divided by emission factor of sum of species. Speciated mass was greater than total PM2.5 mass measured on the dilution tunnel filter.*These compounds are not included in the sum of species.
The average emission factor for the PM2.5 mass (3.6 x 10⁻⁴ lb/MMBtu, measured
gravimetrically) is approximately 30 percent greater than the average emission factor for the sum
5-8
of species (2.7 x 10⁻⁴ lb/MMBtu). This difference is most likely due to the bias associated with
the different analytical methods used to determine the speciation of the mass versus the
gravimetric analysis used to measure total PM2.5 mass. In addition, the dilution sampler used
two different types of filters: TMFs were used for the elemental analysis and particulate mass,
while quartz filters were used for OC/EC analysis and ionic analysis. It is possible that
variations in particle deposition occurred between the different filters, resulting in a bias.
Inhomogeneous deposition on the filter could also cause a bias because the OC/EC analysis and
ion analysis each take only part of the filter for analysis, and the total mass on the filter is
normalized assuming that this mass is evenly distributed over the collection area.
Figure 5-1 shows the data presented in Table 5-5 divided into elements (results of the ED-XRF
analysis and carbon from TOR), ions and OC/EC (subset of total carbon). The majority of the
mass is OC (57 percent) and EC (35 percent). Compounds with all runs below detectable levels
are not included in the figure. Chloride ion, S, Na and Mg were all measured at detectable
levels, but are not included in the sum of species to avoid double counting (Cl- and Cl, S and
SO4=) and because Na and Mg data are semi-quantitative. Therefore, these compounds are not
included as mass fractions in the figure.
Method 201A/202
Table 5-6 shows the speciation profile of the PM2.5 mass as measured by Method 201A/202.
Mass fraction is the ratio of the measured quantity to the total PM2.5 mass (FPM plus CPM). In
this table, blank corrected total CPM data are presented, and have been subdivided to show the
amount accounted for by SO4= and Cl-.
The data from Table 5-6 are shown in Figure 5-2. As can be seen from the figure, nearly all of
the PM2.5 mass comes from inorganic CPM mass (greater than 99 percent).
SPECIATION PROFILES FOR ORGANIC AEROSOLS
Dilution Tunnel Organic Speciation
Table 5-7 shows the organic aerosol speciation profile, expressed as a mass fraction. This mass
fraction is determined by dividing the average emission factor of the emitted quantity by the
average emission factor for OC.
5-9
Figu
re 5
-1.
Spec
iatio
n Pr
ofile
Ð D
ilutio
n T
unne
l PM
2.5
Frac
tions
.
.001
0 .010.
1110100
Aluminu
mArse
nic
Calciu
m Chlorin
eCobal
t Chrom
ium
Copper
Iron Pot
assiu
mM
agne
sium
*Nick
el
Lead
Silico
n Sodiu
m*Sulf
ur* Tita
nium
Uranium
Vanad
ium
Zinc
Organ
ic Car
bon
Elemen
tal C
arbo
nTot
al Car
bon*
Sulfa
te Chlor
ide* Ammoniu
m
Mass Fraction (%)
* E
xclu
ded
from
tota
l sum
of
spec
ies
to a
void
dou
ble
coun
ting
and
use
of s
emi-
quan
titat
ive
data
(N
a an
d M
g).
0.00
1
0.01
5-10
Table 5-6. Speciation Profile for PM2.5 for Gas-Fired Boiler (Refinery Site A)(Method 201A/202.
Average 95% ConfidenceCompound Mass Fraction Uncertainty Upper Bound
(%) (%) (%)Filterable PM2.5 0.29 215 4.5Total CPM 99.9 221 250 -Sulfate (as SO4
=)* 16 203 39
-Chloride (as NH4Cl)* 3.3 206 8
Organic Carbon** 1.1 200 2.7Elemental Carbon** 2.2 223 5.5Total Carbon** 3.3 195 7.7*Sulfate and Chloride are a subset of the total CPM.**Organic, elemental and total carbon are a subset of the filterable particulate.
The data from Table 5-7 are shown in Figure 5-3. As can be seen on the figure, the most
abundant fraction of the speciated organic aerosol is phenanthrene (0.7 percent), followed by
perinaphthenone (0.2 percent).
Method 201A/202 Organic Speciation
Table 5-8 shows the organic aerosol speciation for the Method 201A/202 data.
Figure 5-4 shows the data from Table 5-8. The most abundant of the speciated organics aerosol
measured on the in-stack filter is napththalene (0.04 percent), followed by 2-methylnaphthalene
(0.01 percent).
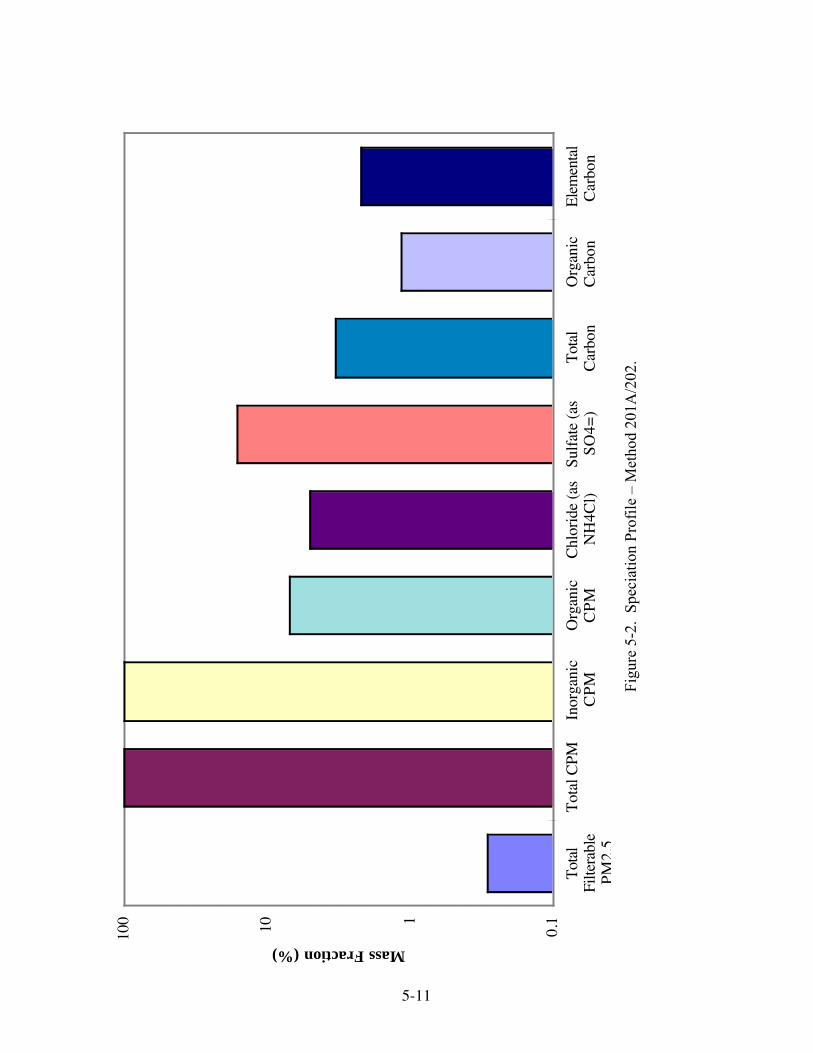
5-11
0.1110100
Tot
alFi
ltera
ble
PM
2.5
Tot
al C
PMIn
orga
nic
CP
MO
rgan
icC
PM
Chl
orid
e (a
sN
H4C
l)Su
lfat
e (a
sS
O4=
)T
otal
Car
bon
Org
anic
Car
bon
Ele
men
tal
Car
bon
Mass Fraction (%)
Figu
re 5
-2.
Spec
iatio
n Pr
ofile
Ð M
etho
d 20
1A/2
02.
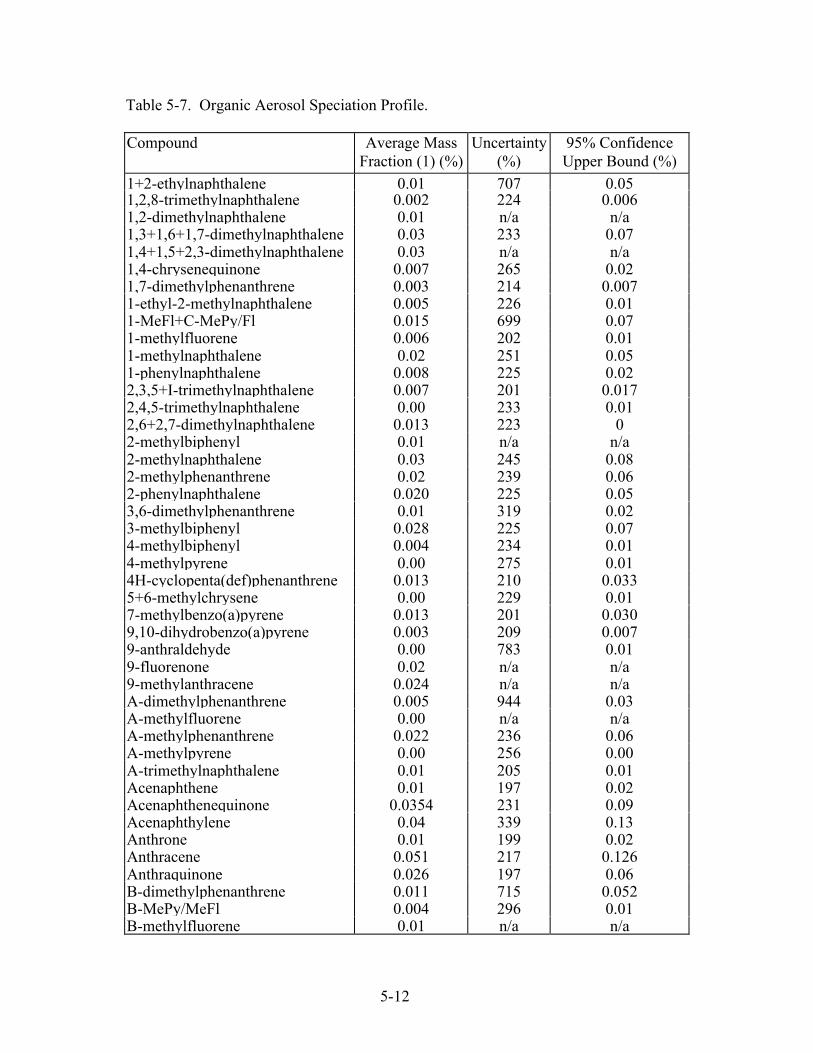
5-12
Table 5-7. Organic Aerosol Speciation Profile.
Compound Average MassFraction (1) (%)
Uncertainty(%)
95% ConfidenceUpper Bound (%)
1+2-ethylnaphthalene 0.01 707 0.051,2,8-trimethylnaphthalene 0.002 224 0.0061,2-dimethylnaphthalene 0.01 n/a n/a1,3+1,6+1,7-dimethylnaphthalene 0.03 233 0.071,4+1,5+2,3-dimethylnaphthalene 0.03 n/a n/a1,4-chrysenequinone 0.007 265 0.021,7-dimethylphenanthrene 0.003 214 0.0071-ethyl-2-methylnaphthalene 0.005 226 0.011-MeFl+C-MePy/Fl 0.015 699 0.071-methylfluorene 0.006 202 0.011-methylnaphthalene 0.02 251 0.051-phenylnaphthalene 0.008 225 0.022,3,5+I-trimethylnaphthalene 0.007 201 0.0172,4,5-trimethylnaphthalene 0.00 233 0.012,6+2,7-dimethylnaphthalene 0.013 223 02-methylbiphenyl 0.01 n/a n/a2-methylnaphthalene 0.03 245 0.082-methylphenanthrene 0.02 239 0.062-phenylnaphthalene 0.020 225 0.053,6-dimethylphenanthrene 0.01 319 0.023-methylbiphenyl 0.028 225 0.074-methylbiphenyl 0.004 234 0.014-methylpyrene 0.00 275 0.014H-cyclopenta(def)phenanthrene 0.013 210 0.0335+6-methylchrysene 0.00 229 0.017-methylbenzo(a)pyrene 0.013 201 0.0309,10-dihydrobenzo(a)pyrene 0.003 209 0.0079-anthraldehyde 0.00 783 0.019-fluorenone 0.02 n/a n/a9-methylanthracene 0.024 n/a n/aA-dimethylphenanthrene 0.005 944 0.03A-methylfluorene 0.00 n/a n/aA-methylphenanthrene 0.022 236 0.06A-methylpyrene 0.00 256 0.00A-trimethylnaphthalene 0.01 205 0.01Acenaphthene 0.01 197 0.02Acenaphthenequinone 0.0354 231 0.09Acenaphthylene 0.04 339 0.13Anthrone 0.01 199 0.02Anthracene 0.051 217 0.126Anthraquinone 0.026 197 0.06B-dimethylphenanthrene 0.011 715 0.052B-MePy/MeFl 0.004 296 0.01B-methylfluorene 0.01 n/a n/a
5-13
Table 5-7 (continued). Organic Aerosol Speciation Profile.Compound Average Mass
Fraction (1) (%)Uncertainty
(%)95% ConfidenceUpper Bound (%)
B-methylphenanthrene 0.033 218 0.08B-trimethylnaphthalene 0.006 208 0.01Benzo(a)pyene 0.01 198 0.01Benz(a)anthracene 0.02 231 0.04Benz(a)anthracene-7,12 0.01 197 0.03Benzanthrone 0.02 195 0.05Benzo(b)chrysene 0.02 195 0.04Benzo(b+j+k)fluoranthene 0.018 195 0.04Benzo(c)phenanthrene 0.006 211 0.02Benzo(ghi)perylene 0.006 202 0.014Benzonaphthothiophene 0.002 212 0.005Benzo(e)pyrene 0.00 220 0.01Biphenyl 0.16 416 0.62C-dimethylphenanthrene 0.012 366 0.04C-methylphenanthrene 0.010 202 0.02C-trimethylnaphthalene 0.01 201 0.02Cholestane 0.12 201 0.29Chrysene 0.01 199 0.03Coronene 0.117 197 0.27D-dimethylphenanthrene 0.008 201 0.018D-MePy/MeFl 0.003 235 0.007Dibenz(ah+ac)anthracene 0.00 202 0.01Dibenzofuran 0.012 198 0.03E-dimethylphenanthrene 0.0074 808 0.037E-MePy/MeFl 0.001 309 0.00E-trimethylnaphthalene 0.01 350 0.03F-trimethylnaphthalene 0.01 724 0.05Fluoranthene 0.18 231 0.47Fluorene 0.072 201 0.171Indeno[123-cd]pyrene 0.0040 199 0.01Naphthalene 0.07 866 0.36Perinaphthenone 0.244 229 0.628Perylene 0.00 220 0.0Phenanthrene 0.67 209 1.62Pyrene 0.129 225 0.33Retene 0.01 236 0.02Xanthone 0.02 n/a n/an/a - not applicable, only one run was within detectable limits.
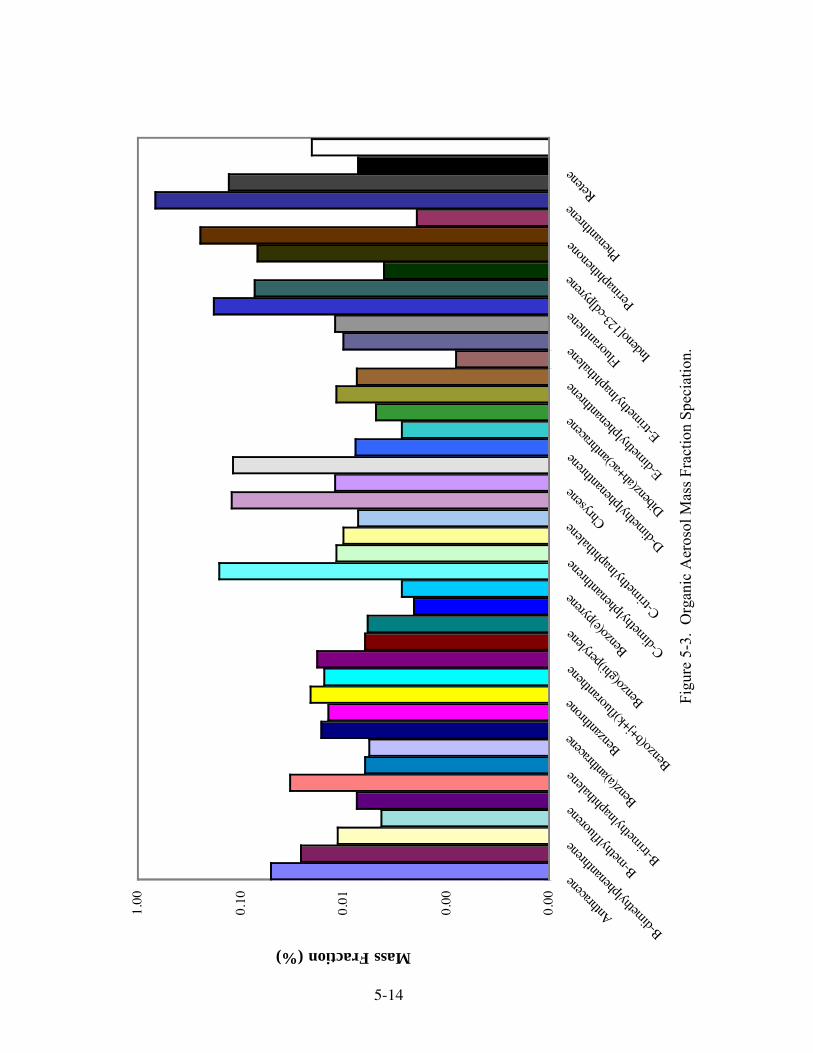
5-14
0.00
0.00
0.01
0.10
1.00
Anthrac
ene
B-dim
ethylp
hena
nthren
e
B-meth
ylfluo
rene
B-trim
ethyln
aphth
alene
Benz(a
)anthr
acen
eBen
zanth
rone
Benzo
(b+j+
k)flu
oran
thene
Benzo
(ghi)
pery
lene
Benzo
(e)py
rene
C-dim
ethylp
hena
nthren
e
C-trim
ethyln
aphth
alene
Chrys
ene
D-dim
ethylp
hena
nthren
e
Dibenz
(ah+ac
)anthr
acen
e
E-dim
ethylp
hena
nthren
e
E-trim
ethyln
aphth
alene Fluo
ranthe
ne
Inden
o[123
-cd]py
rene
Perina
phthe
none Phe
nanth
rene
Retene
Mass Fraction (%)
Figu
re 5
-3.
Org
anic
Aer
osol
Mas
s Fr
actio
n Sp
ecia
tion.
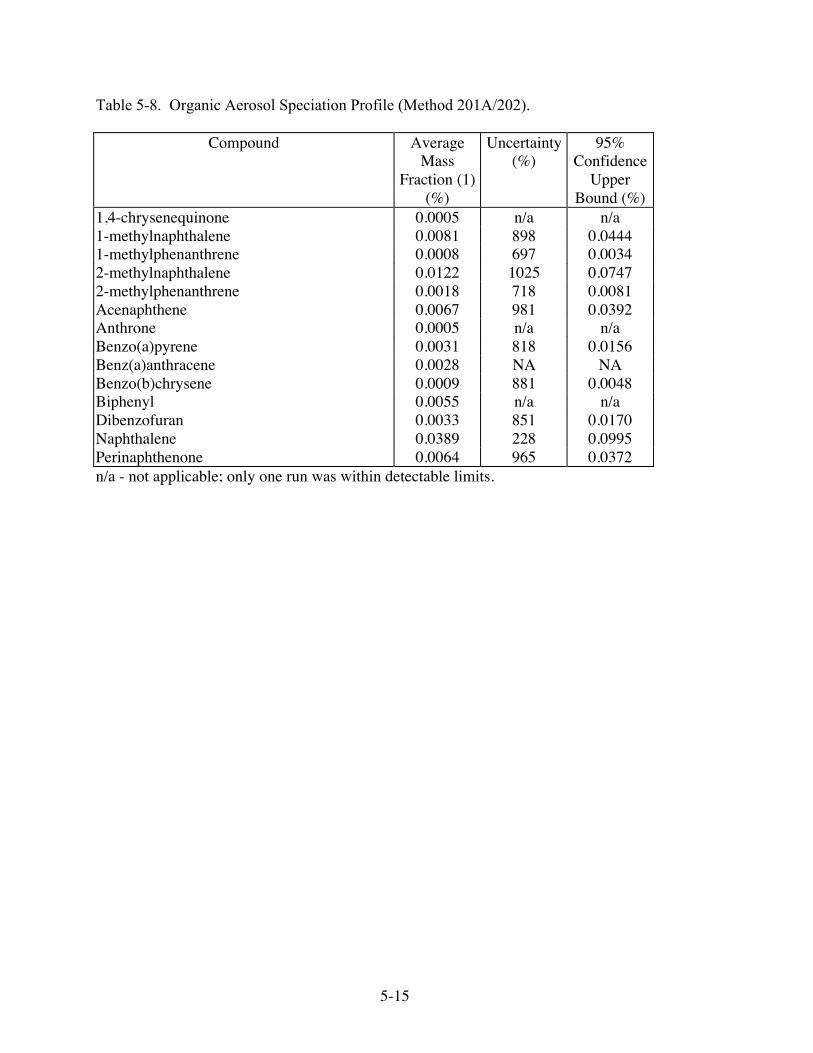
5-15
Table 5-8. Organic Aerosol Speciation Profile (Method 201A/202).
Compound AverageMass
Fraction (1)(%)
Uncertainty(%)
95%Confidence
UpperBound (%)
1,4-chrysenequinone 0.0005 n/a n/a1-methylnaphthalene 0.0081 898 0.04441-methylphenanthrene 0.0008 697 0.00342-methylnaphthalene 0.0122 1025 0.07472-methylphenanthrene 0.0018 718 0.0081Acenaphthene 0.0067 981 0.0392Anthrone 0.0005 n/a n/aBenzo(a)pyrene 0.0031 818 0.0156Benz(a)anthracene 0.0028 NA NABenzo(b)chrysene 0.0009 881 0.0048Biphenyl 0.0055 n/a n/aDibenzofuran 0.0033 851 0.0170Naphthalene 0.0389 228 0.0995Perinaphthenone 0.0064 965 0.0372n/a - not applicable; only one run was within detectable limits.
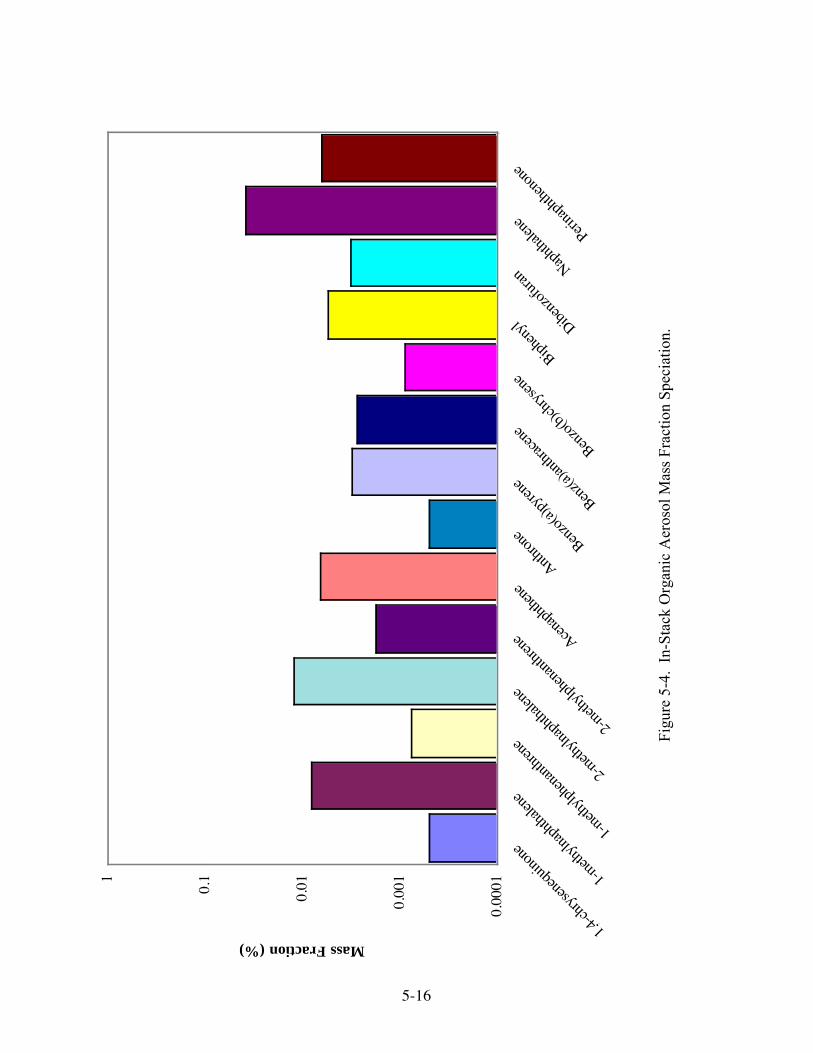
0.00
01
0.00
1
0.010.
11
1,4-ch
ryse
nequ
inone
1-meth
ylnap
hthale
ne
1-meth
ylphe
nanth
rene
2-meth
ylnap
hthale
ne
2-meth
ylphe
nanth
rene Ace
naph
thene
Anthro
ne Benzo
(a)py
rene
Benz(a
)anthr
acen
eBen
zo(b
)chry
sene
Biphen
yl Dibenz
ofur
anNap
hthale
nePeri
naph
theno
ne
Mass Fraction (%)
Figu
re 5
-4.
In-S
tack
Org
anic
Aer
osol
Mas
s Fr
actio
n Sp
ecia
tion.
5-16
6-1
Section 6
QUALITY ASSURANCE
SAMPLE STORAGE AND SHIPPING
All samples were stored on-site in an ice chest prior to shipment to Desert Research Institute
(DRI) for analysis. Samples were shipped and stored in a manner to prevent breakage. Upon
receipt of samples at DRI, those requiring refrigeration were stored at 4ûC.
DILUTION TUNNEL FLOWS
Flows through the various sampling components of the dilution tunnel were determined by
averaging the flow measured before testing commenced and after sampling was completed.
Results from the pre- and post-test flow checks are presented in Table 6-1. All post-test flows
were within 20 percent of their respective pre-test flow values.
GRAVIMETRIC ANALYSIS
Prior to testing, unused filters were stored for at least one month in a controlled environment,
followed by one week of equilibration in the weighing environment, to achieve stable filter tare
weights. New and used filters were equilibrated at 20 ±5°C and a relative humidity of 30 ±5
percent for a minimum of 24 hours prior to weighing. Weighing was performed on a Cahn 31
electro-microbalance with ±1 microgram sensitivity. The electrical charge on each filter was
neutralized by exposure to a polonium source for 30 seconds prior to the filter being placed on
the balance pan. The balance was calibrated with a 20 mg Class M weight and the tare was set
prior to weighing each batch of filters. After every 10 filters were weighed, the calibration and
tare were rechecked. If the results of these performance tests deviated by more than ±5 µg, the
balance was recalibrated. If the difference exceeded ±15 µg, the balance was recalibrated and
the previous 10 samples were reweighed. One hundred percent of initial weights and at least 30
percent of exposed weights were checked by an independent technician, and samples were
reweighed if these check-weights did not agree with the original weights within ±0.015 mg. Pre-
and post-weights, check weights and reweights (if required) were recorded on data sheets as well
as being directly entered into a database via an RS232 connection.
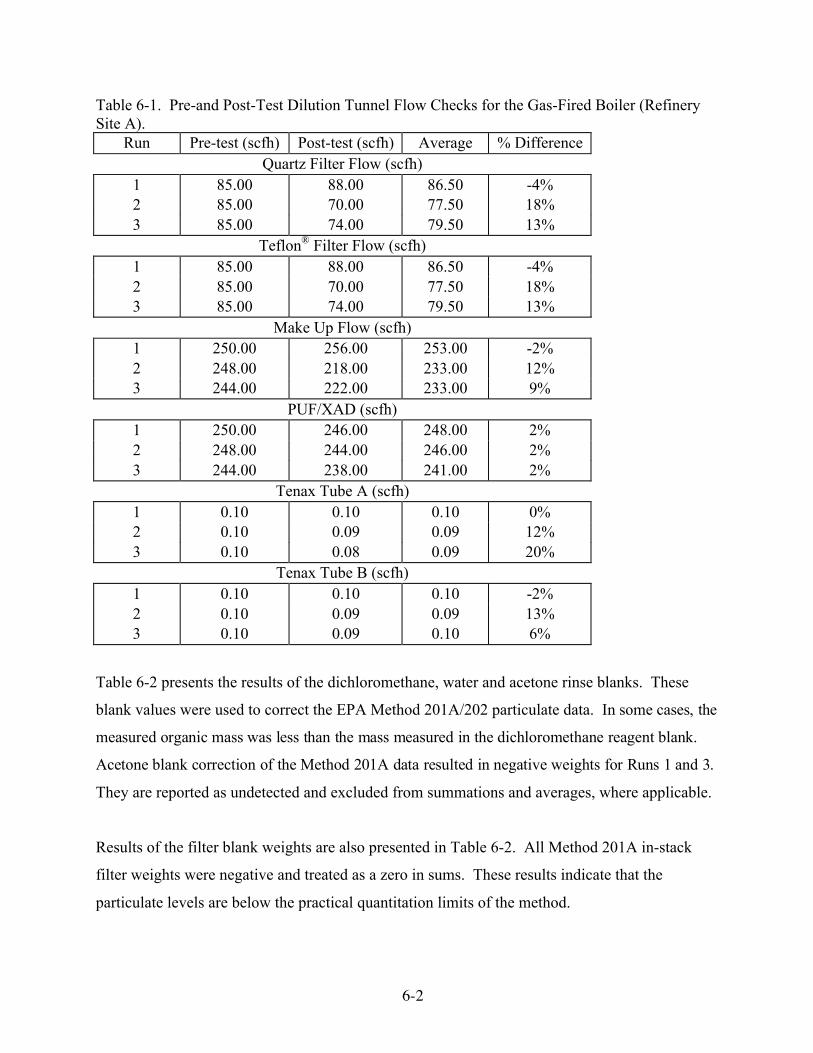
6-2
Table 6-1. Pre-and Post-Test Dilution Tunnel Flow Checks for the Gas-Fired Boiler (RefinerySite A).
Run Pre-test (scfh) Post-test (scfh) Average % DifferenceQuartz Filter Flow (scfh)
1 85.00 88.00 86.50 -4%2 85.00 70.00 77.50 18%3 85.00 74.00 79.50 13%
Teflon¨ Filter Flow (scfh)1 85.00 88.00 86.50 -4%2 85.00 70.00 77.50 18%3 85.00 74.00 79.50 13%
Make Up Flow (scfh)1 250.00 256.00 253.00 -2%2 248.00 218.00 233.00 12%3 244.00 222.00 233.00 9%
PUF/XAD (scfh)1 250.00 246.00 248.00 2%2 248.00 244.00 246.00 2%3 244.00 238.00 241.00 2%
Tenax Tube A (scfh)1 0.10 0.10 0.10 0%2 0.10 0.09 0.09 12%3 0.10 0.08 0.09 20%
Tenax Tube B (scfh)1 0.10 0.10 0.10 -2%2 0.10 0.09 0.09 13%3 0.10 0.09 0.10 6%
Table 6-2 presents the results of the dichloromethane, water and acetone rinse blanks. These
blank values were used to correct the EPA Method 201A/202 particulate data. I n som e cases, the
m easur ed or gani c m ass was less than the mass measured in the di chl or omet hane reagent bl ank.
Acet one bl ank corr ect ion of the Met hod 201A dat a resul t ed in negat i ve wei ght s for Runs 1 and 3.
They are reported as undetected and excluded from summations and averages, where applicable.
Results of the filter blank weights are also presented in Table 6-2. All Method 201A in-stack
filter weights were negative and treated as a zero in sums. These results indicate that the
particulate levels are below the practical quantitation limits of the method.
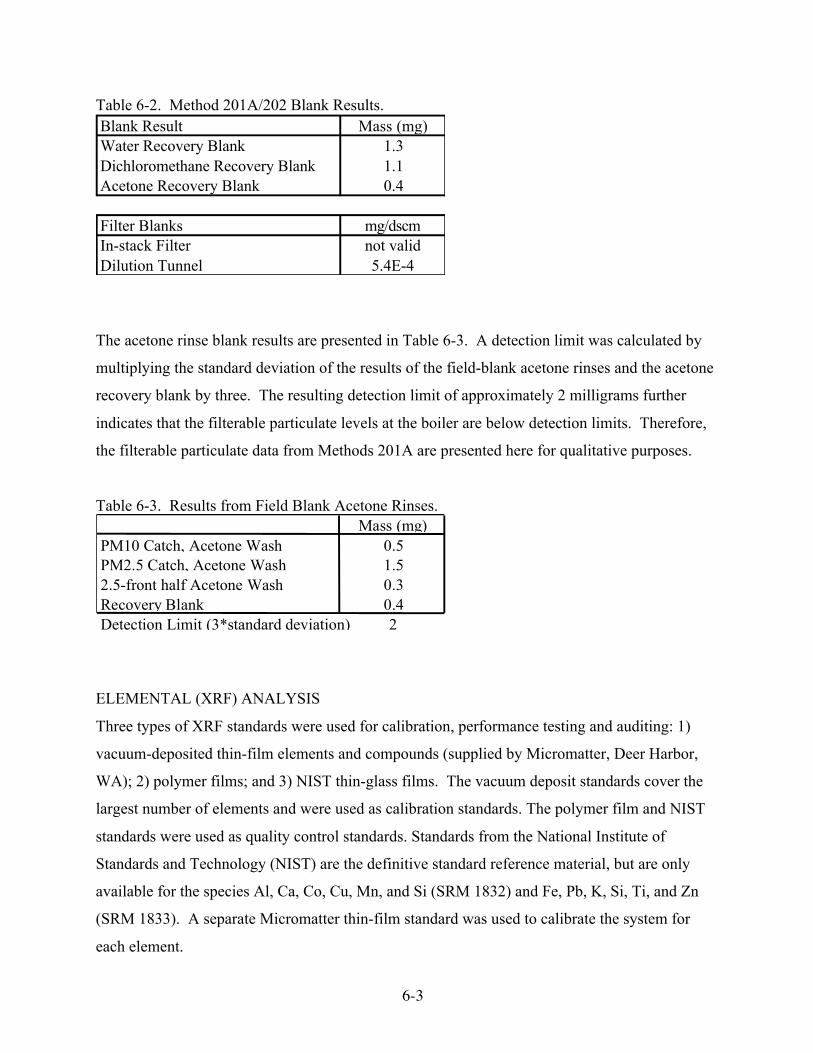
6-3
Table 6-2. Method 201A/202 Blank Results.
The acetone rinse blank results are presented in Table 6-3. A detection limit was calculated by
multiplying the standard deviation of the results of the field-blank acetone rinses and the acetone
recovery blank by three. The resulting detection limit of approximately 2 milligrams further
indicates that the filterable particulate levels at the boiler are below detection limits. Therefore,
the filterable particulate data from Methods 201A are presented here for qualitative purposes.
Table 6-3. Results from Field Blank Acetone Rinses.
ELEMENTAL (XRF) ANALYSIS
Three types of XRF standards were used for calibration, performance testing and auditing: 1)
vacuum-deposited thin-film elements and compounds (supplied by Micromatter, Deer Harbor,
WA); 2) polymer films; and 3) NIST thin-glass films. The vacuum deposit standards cover the
largest number of elements and were used as calibration standards. The polymer film and NIST
standards were used as quality control standards. Standards from the National Institute of
Standards and Technology (NIST) are the definitive standard reference material, but are only
available for the species Al, Ca, Co, Cu, Mn, and Si (SRM 1832) and Fe, Pb, K, Si, Ti, and Zn
(SRM 1833). A separate Micromatter thin-film standard was used to calibrate the system for
each element.
Blank Result Mass (mg)Water Recovery Blank 1.3Dichloromethane Recovery Blank 1.1Acetone Recovery Blank 0.4
Filter Blanks mg/dscmIn-stack Filter not validDilution Tunnel 5.4E-4
Mass (mg)PM10 Catch, Acetone Wash 0.5PM2.5 Catch, Acetone Wash 1.52.5-front half Acetone Wash 0.3Recovery Blank 0.4Detection Limit (3*standard deviation) 2
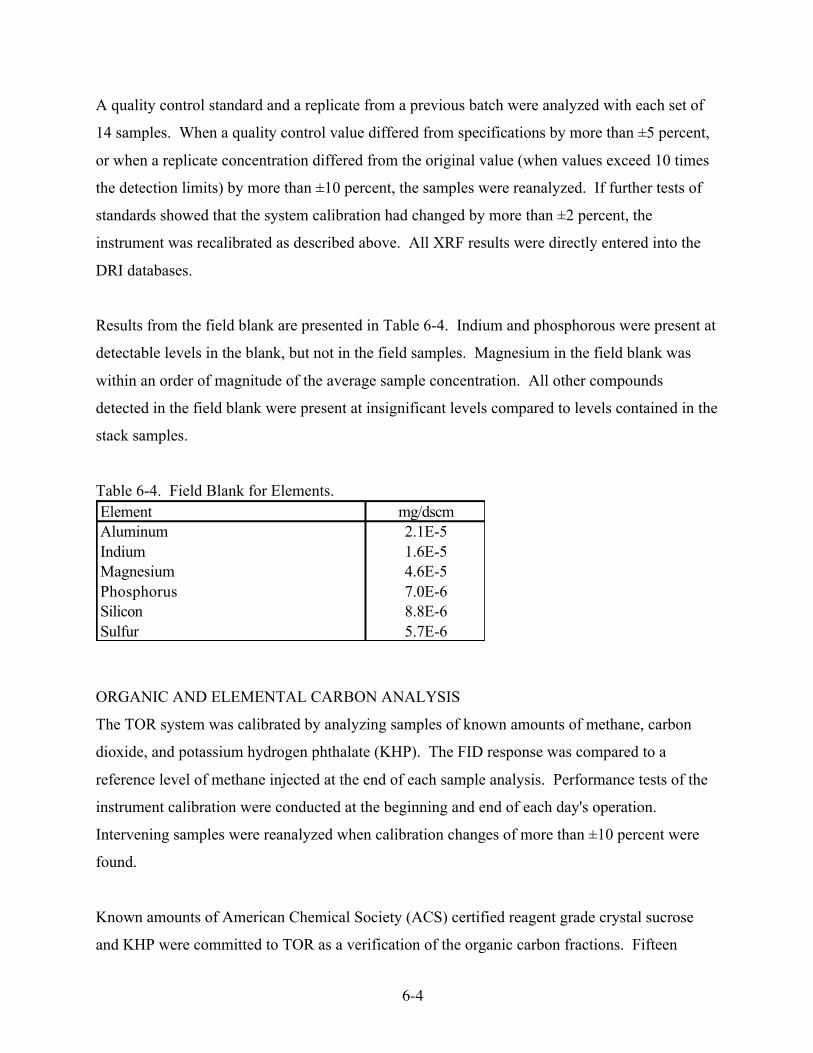
6-4
A quality control standard and a replicate from a previous batch were analyzed with each set of
14 samples. When a quality control value differed from specifications by more than ±5 percent,
or when a replicate concentration differed from the original value (when values exceed 10 times
the detection limits) by more than ±10 percent, the samples were reanalyzed. If further tests of
standards showed that the system calibration had changed by more than ±2 percent, the
instrument was recalibrated as described above. All XRF results were directly entered into the
DRI databases.
Results from the field blank are presented in Table 6-4. Indium and phosphorous were present at
detectable levels in the blank, but not in the field samples. Magnesium in the field blank was
within an order of magnitude of the average sample concentration. All other compounds
detected in the field blank were present at insignificant levels compared to levels contained in the
stack samples.
Table 6-4. Field Blank for Elements.
ORGANIC AND ELEMENTAL CARBON ANALYSIS
The TOR system was calibrated by analyzing samples of known amounts of methane, carbon
dioxide, and potassium hydrogen phthalate (KHP). The FID response was compared to a
reference level of methane injected at the end of each sample analysis. Performance tests of the
instrument calibration were conducted at the beginning and end of each day's operation.
Intervening samples were reanalyzed when calibration changes of more than ±10 percent were
found.
Known amounts of American Chemical Society (ACS) certified reagent grade crystal sucrose
and KHP were committed to TOR as a verification of the organic carbon fractions. Fifteen
Element mg/dscmAluminum 2.1E-5Indium 1.6E-5Magnesium 4.6E-5Phosphorus 7.0E-6Silicon 8.8E-6Sulfur 5.7E-6
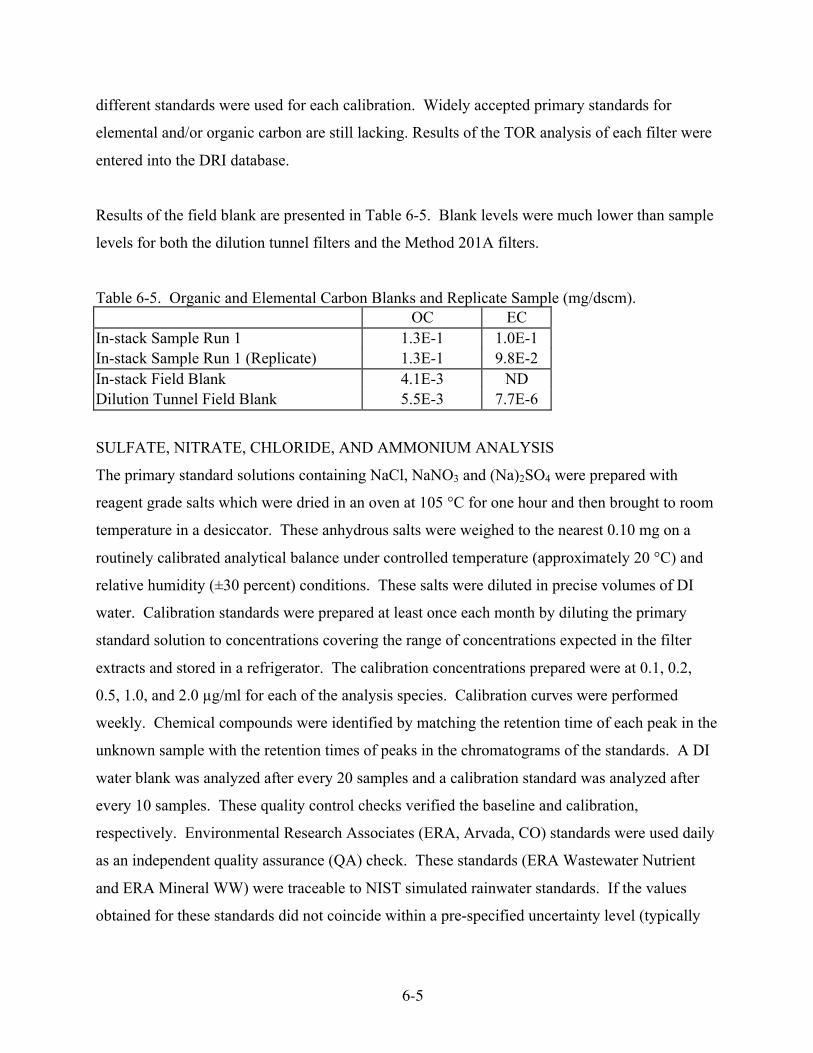
6-5
different standards were used for each calibration. Widely accepted primary standards for
elemental and/or organic carbon are still lacking. Results of the TOR analysis of each filter were
entered into the DRI database.
Results of the field blank are presented in Table 6-5. Blank levels were much lower than sample
levels for both the dilution tunnel filters and the Method 201A filters.
Table 6-5. Organic and Elemental Carbon Blanks and Replicate Sample (mg/dscm).OC EC
In-stack Sample Run 1 1.3E-1 1.0E-1In-stack Sample Run 1 (Replicate) 1.3E-1 9.8E-2In-stack Field Blank 4.1E-3 NDDilution Tunnel Field Blank 5.5E-3 7.7E-6
SULFATE, NITRATE, CHLORIDE, AND AMMONIUM ANALYSIS
The primary standard solutions containing NaCl, NaNO3 and (Na)2SO4 were prepared with
reagent grade salts which were dried in an oven at 105 ¡C for one hour and then brought to room
temperature in a desiccator. These anhydrous salts were weighed to the nearest 0.10 mg on a
routinely calibrated analytical balance under controlled temperature (approximately 20 ¡C) and
relative humidity (±30 percent) conditions. These salts were diluted in precise volumes of DI
water. Calibration standards were prepared at least once each month by diluting the primary
standard solution to concentrations covering the range of concentrations expected in the filter
extracts and stored in a refrigerator. The calibration concentrations prepared were at 0.1, 0.2,
0.5, 1.0, and 2.0 µg/ml for each of the analysis species. Calibration curves were performed
weekly. Chemical compounds were identified by matching the retention time of each peak in the
unknown sample with the retention times of peaks in the chromatograms of the standards. A DI
water blank was analyzed after every 20 samples and a calibration standard was analyzed after
every 10 samples. These quality control checks verified the baseline and calibration,
respectively. Environmental Research Associates (ERA, Arvada, CO) standards were used daily
as an independent quality assurance (QA) check. These standards (ERA Wastewater Nutrient
and ERA Mineral WW) were traceable to NIST simulated rainwater standards. If the values
obtained for these standards did not coincide within a pre-specified uncertainty level (typically
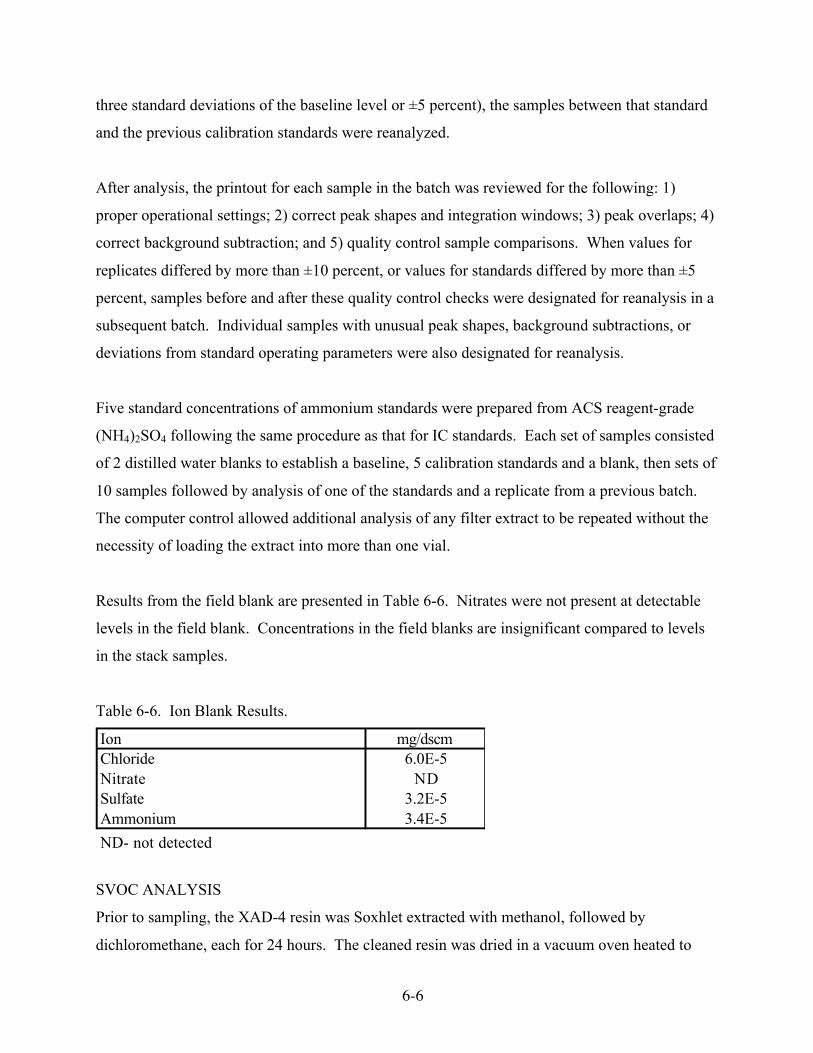
6-6
three standard deviations of the baseline level or ±5 percent), the samples between that standard
and the previous calibration standards were reanalyzed.
After analysis, the printout for each sample in the batch was reviewed for the following: 1)
proper operational settings; 2) correct peak shapes and integration windows; 3) peak overlaps; 4)
correct background subtraction; and 5) quality control sample comparisons. When values for
replicates differed by more than ±10 percent, or values for standards differed by more than ±5
percent, samples before and after these quality control checks were designated for reanalysis in a
subsequent batch. Individual samples with unusual peak shapes, background subtractions, or
deviations from standard operating parameters were also designated for reanalysis.
Five standard concentrations of ammonium standards were prepared from ACS reagent-grade
(NH4)2SO4 following the same procedure as that for IC standards. Each set of samples consisted
of 2 distilled water blanks to establish a baseline, 5 calibration standards and a blank, then sets of
10 samples followed by analysis of one of the standards and a replicate from a previous batch.
The computer control allowed additional analysis of any filter extract to be repeated without the
necessity of loading the extract into more than one vial.
Results from the field blank are presented in Table 6-6. Nitrates were not present at detectable
levels in the field blank. Concentrations in the field blanks are insignificant compared to levels
in the stack samples.
Table 6-6. Ion Blank Results.
SVOC ANALYSIS
Prior to sampling, the XAD-4 resin was Soxhlet extracted with methanol, followed by
dichloromethane, each for 24 hours. The cleaned resin was dried in a vacuum oven heated to
Ion mg/dscmChloride 6.0E-5Nitrate NDSulfate 3.2E-5Ammonium 3.4E-5
ND- not detected
6-7
40¡C and stored in sealed glass containers in a clean freezer. The PUF plugs were Soxhlet
extracted with acetone, followed by 10 percent diethyl ether in hexane. The TIGF filters were
cleaned by sonification in dichloromethane for 30 minutes followed by another 30-minute
sonification in methanol. Then they were dried, placed in aluminum foil, and labeled. Each
batch of precleaned XAD-4 resin and approximately 10 percent of the precleaned TIGF filters
and PUF plugs were checked for purity by solvent extraction and GC/MS analysis of the
extracts. The PUF plugs and XAD-4 resins were assembled into glass cartridges (10 g of XAD
between two PUF plugs), wrapped in hexane-rinsed aluminum foil and stored in a clean freezer
prior to shipment to the field.
Prior to extraction, the following deuterated internal standards were added to each filter-sorbent
pair:
naphthalene-d8 9.76 ng/µlacenaphthene-d8 10.95 ng/µl (for acenapththene and acenaphthylene)biphenyl-d10 7.56 ng/µlphenanthrene-d10 4.61 ng/µlanthracene-d10 3.5 ng/µlpyrene-d10 5.28 ng/µl (for fluoranthene and pyrene)chrysene-d12 3.54 ng/µl (for benz[a]anthracene and chrysene)benzo[e]pyrene-d12 4.20 ng/µlbenzo[a]pyrene-d12 4.68 ng/µlbenzo[k]fluoranthene-d12 2.0 ng/µlbenzo[g,h,i]perylene-d12 1.0 ng/µl (for indeno[1,2,3-cd]pyrene,
dibenzo[ah+ac]anthracne,benzo[ghi]perylene and coronene)
Calibration curves for the GC/MS/MID quantification were made for the molecular ion peaks of
the PAH and all other compounds of interest using the corresponding deuterated species (or the
deuterated species most closely matched in volatility and retention characteristics) as internal
standards. NIST Standard Reference Material (SRM) 1647 (certified PAH), with the addition of
deuterated internal standards and compounds not present in the SRM, was used to make
calibration solutions. Three concentration levels for each analyte were employed, and each
calibration solution was injected twice. After the three-level calibration was completed, a
standard solution was injected to perform calibration checks. If deviation from the true value
6-8
exceeded 20 percent, the system was recalibrated. The mass selective detector (MSD) was tuned
daily for mass sensitivity using perfluorotributylamine.
In addition, one level calibration solution was run daily. If the difference between true and
measured concentrations exceeded 20 percent, the system was recalibrated.
Table 6-7 presents the field blank results for the dilution tunnel SVOCs. Only compounds
present at detectable levels are included. Most of the average SVOC sample concentrations are
at least an order of magnitude greater than their respective field blank concentrations. The field
blank concentrations of 2-methylbiphenyl, 4-methylbiphenyl, 9,10-dihydrobenzo(a)pyrene, 9-
anthraldehyde, a-methylpyrene, anthrone, cholestane and dibenz(ah+ac)anthracene are all greater
than their average sample concentrations. Bibenzene is present at detectable levels in the blank
but not present in the stack samples.
In addition, replicate analyses of a dilution tunnel sample were performed to determine
reproducibility of results (Table 6-8).
VOC ANALYSIS
Calibration curves were performed weekly. Volatile organic compounds were identified by
matching the response factors of each unknown sample with the response factors of the
standards. Tenax cartridges spiked with a mixture of paraffinic (in the C9-C20 range) and
aromatic (C4, C5, and C6 benzenes) hydrocarbons were periodically analyzed by GC/FID to
verify quantitative recovery from the cartridges. Three to five different concentrations of the HC
standard and one zero standard were injected, and the response factors obtained. If the percent
difference of the response factor from the mean was more than 5 percent, the response factors
were corrected before proceeding with the analysis.
Table 6-8 shows the results of the Tenax field blank. Only compounds with concentrations
above the detection limit are shown. The average sample concentrations of styrene and decane
are within an order of magnitude of their concentrations in the field blank sample. 1,2,3-
trimethylbenzene was present at detectable levels in the field blank but not in the stack or

6-9
Table 6-7. SVOC PUF/XAD Field Blank Results.
ambient samples. All other compounds present at detectable levels in the field blank are at least
one order of magnitude lower than those present in the stack samples.
Compound mg/dscm1,4-chrysenequinone 2.46E-51-MeFl+C-MePy/Fl 1.00E-61-methylnaphthalene 2.43E-61-phenylnaphthalene 7.00E-72,3,5+I-trimethylnaphthalene 4.75E-72-methylbiphenyl 1.46E-52-phenylnaphthalene 2.25E-74-methylbiphenyl 7.68E-64H-cyclopenta(def)phenanthrene 7.50E-69,10-dihydrobenzo(a)pyrene 3.63E-59-anthraldehyde 2.95E-5A-methylpyrene 2.25E-6Acenaphthenequinone 2.00E-5Anthracene 9.50E-7Anthraquinone 1.46E-5Anthrone 2.30E-4B-trimethylnaphthalene 2.00E-7Benz(a)anthracene 1.58E-6Benz(a)anthracene-7,12 6.40E-6Benzanthrone 6.78E-6Benzo(a)pyrene 9.25E-7Benzo(b)chrysene 1.63E-6Benzo(b+j+k)fluoranthene 4.25E-7Benzo(e)pyrene 2.18E-6Benzo(ghi)perylene 6.68E-6Bibenzene 2.45E-4C-trimethylnaphthalene 5.50E-7Cholestane 2.26E-5Chrysene 4.18E-6Dibenz(ah+ac)anthracene 1.69E-5Fluoranthene 3.00E-7Indeno[123-cd]pyrene 4.60E-6Perylene 2.20E-6Phenanthrene 1.80E-6Pyrene 2.25E-6Xanthone 7.18E-6
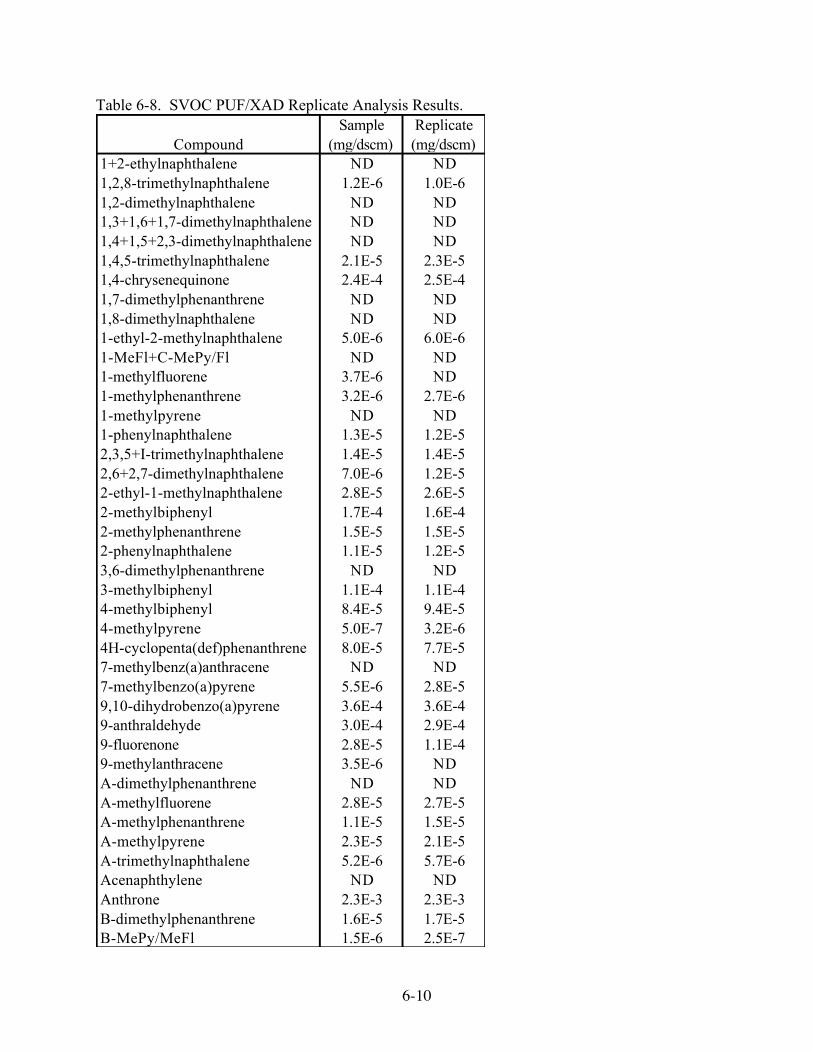
6-10
Table 6-8. SVOC PUF/XAD Replicate Analysis Results.
CompoundSample
(mg/dscm)Replicate (mg/dscm)
1+2-ethylnaphthalene ND ND1,2,8-trimethylnaphthalene 1.2E-6 1.0E-61,2-dimethylnaphthalene ND ND1,3+1,6+1,7-dimethylnaphthalene ND ND1,4+1,5+2,3-dimethylnaphthalene ND ND1,4,5-trimethylnaphthalene 2.1E-5 2.3E-51,4-chrysenequinone 2.4E-4 2.5E-41,7-dimethylphenanthrene ND ND1,8-dimethylnaphthalene ND ND1-ethyl-2-methylnaphthalene 5.0E-6 6.0E-61-MeFl+C-MePy/Fl ND ND1-methylfluorene 3.7E-6 ND1-methylphenanthrene 3.2E-6 2.7E-61-methylpyrene ND ND1-phenylnaphthalene 1.3E-5 1.2E-52,3,5+I-trimethylnaphthalene 1.4E-5 1.4E-52,6+2,7-dimethylnaphthalene 7.0E-6 1.2E-52-ethyl-1-methylnaphthalene 2.8E-5 2.6E-52-methylbiphenyl 1.7E-4 1.6E-42-methylphenanthrene 1.5E-5 1.5E-52-phenylnaphthalene 1.1E-5 1.2E-53,6-dimethylphenanthrene ND ND3-methylbiphenyl 1.1E-4 1.1E-44-methylbiphenyl 8.4E-5 9.4E-54-methylpyrene 5.0E-7 3.2E-64H-cyclopenta(def)phenanthrene 8.0E-5 7.7E-57-methylbenz(a)anthracene ND ND7-methylbenzo(a)pyrene 5.5E-6 2.8E-59,10-dihydrobenzo(a)pyrene 3.6E-4 3.6E-49-anthraldehyde 3.0E-4 2.9E-49-fluorenone 2.8E-5 1.1E-49-methylanthracene 3.5E-6 NDA-dimethylphenanthrene ND NDA-methylfluorene 2.8E-5 2.7E-5A-methylphenanthrene 1.1E-5 1.5E-5A-methylpyrene 2.3E-5 2.1E-5A-trimethylnaphthalene 5.2E-6 5.7E-6Acenaphthylene ND NDAnthrone 2.3E-3 2.3E-3B-dimethylphenanthrene 1.6E-5 1.7E-5B-MePy/MeFl 1.5E-6 2.5E-7

6-11
Table 6-8 (continued). SVOC PUF/XAD Replicate Analysis Results.
CompoundSample
(mg/dscm)Replicate (mg/dscm)
B-methylfluorene ND NDB-methylphenanthrene 1.0E-5 1.3E-5Benz(a)anthracene 2.4E-5 4.3E-5Benz(a)anthracene-7,12 7.9E-5 8.4E-5Benzanthrone 7.9E-5 1.0E-4Benzo(a)pyrene 1.2E-5 3.1E-5Benzo(b)chrysene 2.6E-5 5.5E-5Benzo(b+j+k)fluoranthene 2.6E-5 5.6E-5Benzo(c)phenanthrene 4.2E-6 6.5E-6Benzo(e)pyrene 2.4E-5 3.6E-5Biphenyl 2.5E-5 2.4E-5C-dimethylphenanthrene ND NDC-methylphenanthrene 6.5E-6 1.1E-5C-trimethylnaphthalene 1.2E-5 1.3E-5Chrysene 7.0E-5 7.1E-5Coronene 1.3E-4 3.0E-4D-dimethylphenanthrene 1.6E-5 1.5E-5Dibenz(ah+ac)anthracene 1.7E-4 1.8E-4Dibenzofuran 7.2E-6 6.5E-6E-dimethylphenanthrene ND NDE-trimethylnaphthalene 4.0E-6 3.5E-6F-trimethylnaphthalene 7.0E-6 8.2E-6Fluoranthene 1.0E-4 9.7E-5Fluorene 7.1E-5 6.7E-5Indeno[123-cd]pyrene 4.9E-5 5.5E-5J-trimethylnaphthalene 1.0E-6 NDNaphthalene 8.7E-4 7.7E-4Perinaphthenone 7.3E-5 1.4E-4Perylene 2.3E-5 2.8E-5Phenanthrene 5.6E-4 5.3E-4Pyrene 9.7E-5 9.4E-5Retene 7.5E-6 6.5E-6Xanthone 4.8E-5 5.7E-5
MeFl- MethylfluoreneMePy- MethylpyreneND- not detected
6-12
CEMS ANALYSIS
The response of the CO analyzer to CO2 was determined prior to testing to allow correction of
results for any resulting bias, if necessary. The instruments generally were calibrated, at a
minimum, at the beginning, middle, and end of the test day, with more frequent calibration and
zero drift checks if necessary. Test results were corrected for any drift in excess of the method
specifications (generally ±3 percent).
7-1
Section 7
DISCUSSION AND FINDINGS
PM2.5 MASS MEASUREMENTS
PM2.5 mass measured using in-stack methods (including CPM as measured by Method
201A/202) was approximately 27 times greater than the PM2.5 mass measured by the dilution
tunnel. The PM2.5 mass measured by the dilution tunnel is 17 times greater in the stack than in
the ambient air. The dilution tunnel is designed to capture filterable matter plus any aerosols that
condense under simulated stack plume conditions. The dilution tunnel cools the stack sample to
the ambient temperature, which in these tests was typically between 70-88°F. The in-stack
methods are designed to collect particles that are filterable at the stack temperature plus those
which condense in a series of impingers placed in an ice bath. The gas temperature leaving the
impingers is typically between 55-65°F; thus, both systems cool the sample to similar final
temperatures. The in-stack methods cool the sample rapidly without dilution by quenching the
gas sample in water maintained near freezing, while the dilution tunnel cools the sample more
slowly by mixing it with ambient temperature air. Since aerosol condensation mechanisms
depend on temperature, concentration, residence time and other factors, it is not entirely
surprising that the results of the two methods differ. However the magnitude of the difference in
these tests is greater than can easily be explained by mechanistic differences alone.
Greater than 99 percent of the mass from in-stack methods was contained in the condensible
particulate fraction, approximately 96 percent of which was inorganic (i.e., not extractable in
dichloromethane). While sulfate was found to be a significant component of the inorganic
fraction, most of the inorganic condensibles were unspeciated following the analytical procedure
prescribed by Method 202. Based on a more extensive analysis of the inorganic fraction residue
conducted several months after the initial results were obtained, most of the inorganic CPM mass
is sulfate and ammonium (Figure 7-1). The ammonium is most likely present due to addition of
ammonium hydroxide to the inorganic fraction during analysis to stabilize sulfate for gravimetric
analysis. The large fraction of sulfate, however, was not expected given the very low
concentration of SO2 in the stack gas. Sulfur dioxide levels in the flue gas averaged
approximately 3.6 ppm over the six days of testing at the boiler. Compared to this value, the
7-2
sulfate levels measured by the dilution tunnel accounted for approximately 0.2 percent of the
SO2 in the flue gas, while the levels measured by Method 202 accounted for approximately 16
percent.
Artifacts from SO2 absorption in the impingers of the Method 202 train leading to a positive bias
in the results have been previously documented for SO2 concentrations on the order of 2000 ppm
(Filadelfia and McDannel, 1996). Sulfur dioxide and O2 dissolve in the impinger solution
(water), and some of the SO2 slowly oxidizes to SO3- which is absorbed as SO4
=. To minimize
this bias, Method 202 recommends a purge of the impingers with nitrogen (or, as a lesser
preference, air) immediately following sample collection to remove dissolved SO2 prior to
sample storage. Method 202 optionally allows the post-test purge to be omitted if the pH of the
impingers is above 4.5. The pH of the impingers met this criteria in these tests, therefore the
purge was not performed. Filadelfia and McDannel demonstrated the post-test purge does not
entirely eliminate SO2 bias under the conditions of their study. No literature was found to
evaluate if this artifact would be significant at sub-10 ppm SO2 concentrations.
Figure 7-1. Speciation of Inorganic Impinger Fraction (Refinery Boiler Site A).
K4.90%
Ammonium20.68%
Chloride1.85%
Fluoride0.46%
Nitrate0.74%
Sulfate43.75%
Unknown22% Na
2.47%
Zn0.55%
V0.03%
P0.30%
Mn0.03%
Mg0.25%
Pb0.10%
Fe0.20%
Sn0.01%
Tl0.30%
Ba0.11%Ca
0.98%
Cu0.06%
Cr0.02%
Cd0.02%
Al0.17%
Elements10.50%
7-3
A laboratory scale study was undertaken to evaluate potential bias at low SO2 concentrations and
with long (6-hour) test runs (see Appendix A for complete details). Simulated combustion
products (O2, CO2, NO, N2, and SO2) were passed through Method 202 impinger trains. No
condensible substances were added. Tests were performed with and without a post-test nitrogen
purge and for 1-hour and 6-hour sampling runs at 0, 1, and 10 ppm SO2. The results with no
purging showed that there was significant sulfate present in the samples in proportion to the SO2
concentration in the gas for both 1-hour and for 6-hour runs (Figure 7-2). The post-test purge did
significantly reduce the sulfate concentration but did not entirely eliminate the bias. The purge
was considerably less efficient for the 6-hour runs compared to the 1-hour runs, indicating that
significant SO2 oxidation occurs within this time frame. The figure also compares the sulfate
results from the field tests to the lab results. Although there is significant scatter, the amount of
sulfate detected in the field samples is reasonably consistent with the amount expected from the
lab tests. This clearly shows that the sulfate, and hence most of the condensible particulate,
collected in the Method 202 stack samples results from gaseous SO2 in the stack sample and not
from condensible sulfate species.
The particulate emission factors obtained from the Method 201A/202 trains agree qualitatively
with results reported by EPA in its AP-42 emission factor database for natural gas combustion in
external combustion devices. The EPA results were obtained using the same methods, therefore a
similar bias may be present in those data. Nevertheless, the semi-quantitative agreement of the
results from these tests to EPAÕs using the same methods provides additional confidence in the
integrity of tests.
The above results show that traditional source testing methods (i.e., EPA Method 202) may
significantly overestimate particulate mass emissions and the contribution of sulfates to primary
emissions. All of the Method 201A filter weights were negative due to the loss of small filter
pieces during sample recovery. These low weights indicate that the particulate masses collected
were at or below the practical limits of the method as practiced in these tests. Dilution tunnel
7-4
6 Hour Runs
y = 0.3102xR2 = 0.9892
y = 0.8514xR2 = 0.9616
0
1
2
3
4
5
6
7
8
9
10
0 2 4 6 8 10 12
SO2 (ppm)
Su
lfat
e in
imp
ing
ers
(mg
)
BoilerLab Scale Tests- Not PurgedLab Scale Tests- PurgedSolubility Limit/10Linear (Lab Scale Tests- Purged)Linear (Lab Scale Tests- Not Purged)
Purge Efficiency=64%
1 Hour Runs
y = 0.1315xR2 = 0.131
y = 0.6787xR2 = 0.7886
0
1
2
3
4
5
6
7
8
9
10
0 2 4 6 8 10 12
SO2 (ppm)
Lab Scale Tests- Not PurgedLab Scale Tests- PurgedSolubility Limit/10Linear (Lab Scale Tests- Purged)Linear (Lab Scale Tests- Not Purged)
Purge Efficiency=81%
Figure 7-2. Results of Laboratory Tests Showing Effect of SO2 and Purge on Method 202 Sulfate Bias.
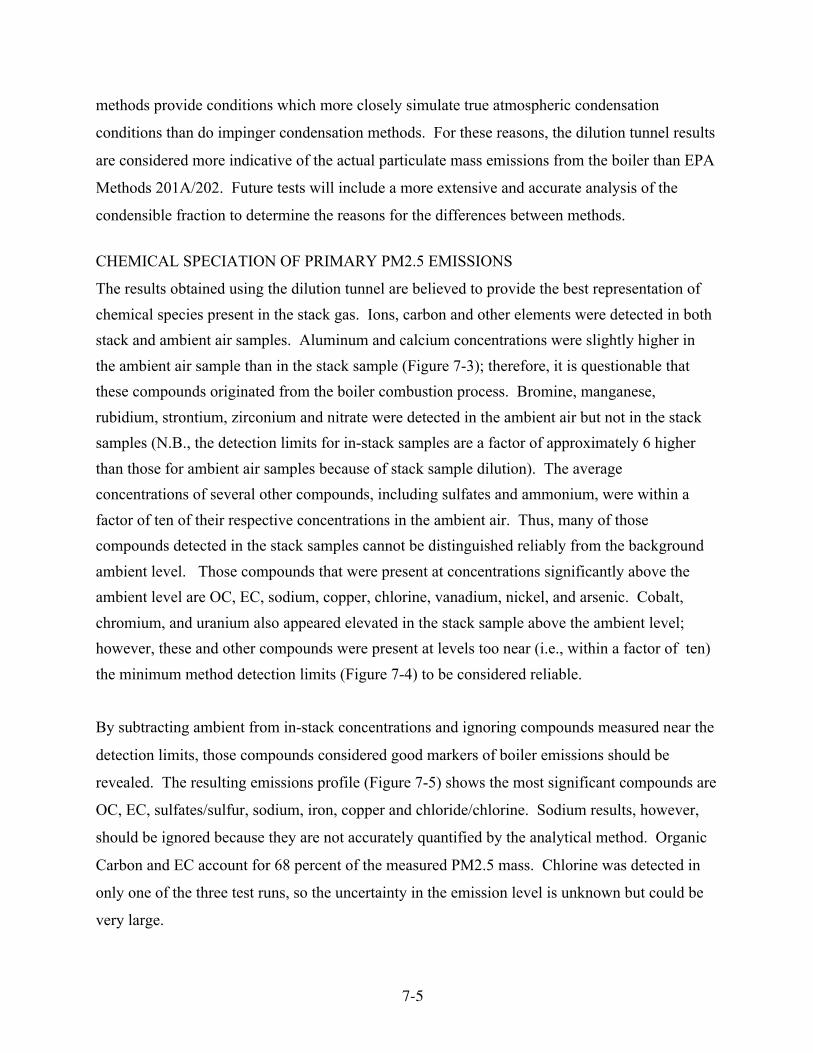
7-5
methods provide conditions which more closely simulate true atmospheric condensation
conditions than do impinger condensation methods. For these reasons, the dilution tunnel results
are considered more indicative of the actual particulate mass emissions from the boiler than EPA
Methods 201A/202. Future tests will include a more extensive and accurate analysis of the
condensible fraction to determine the reasons for the differences between methods.
CHEMICAL SPECIATION OF PRIMARY PM2.5 EMISSIONS
The results obtained using the dilution tunnel are believed to provide the best representation of
chemical species present in the stack gas. Ions, carbon and other elements were detected in both
stack and ambient air samples. Aluminum and calcium concentrations were slightly higher in
the ambient air sample than in the stack sample (Figure 7-3); therefore, it is questionable that
these compounds originated from the boiler combustion process. Bromine, manganese,
rubidium, strontium, zirconium and nitrate were detected in the ambient air but not in the stack
samples (N.B., the detection limits for in-stack samples are a factor of approximately 6 higher
than those for ambient air samples because of stack sample dilution). The average
concentrations of several other compounds, including sulfates and ammonium, were within a
factor of ten of their respective concentrations in the ambient air. Thus, many of those
compounds detected in the stack samples cannot be distinguished reliably from the background
ambient level. Those compounds that were present at concentrations significantly above the
ambient level are OC, EC, sodium, copper, chlorine, vanadium, nickel, and arsenic. Cobalt,
chromium, and uranium also appeared elevated in the stack sample above the ambient level;
however, these and other compounds were present at levels too near (i.e., within a factor of ten)
the minimum method detection limits (Figure 7-4) to be considered reliable.
By subtracting ambient from in-stack concentrations and ignoring compounds measured near the
detection limits, those compounds considered good markers of boiler emissions should be
revealed. The resulting emissions profile (Figure 7-5) shows the most significant compounds are
OC, EC, sulfates/sulfur, sodium, iron, copper and chloride/chlorine. Sodium results, however,
should be ignored because they are not accurately quantified by the analytical method. Organic
Carbon and EC account for 68 percent of the measured PM2.5 mass. Chlorine was detected in
only one of the three test runs, so the uncertainty in the emission level is unknown but could be
very large.
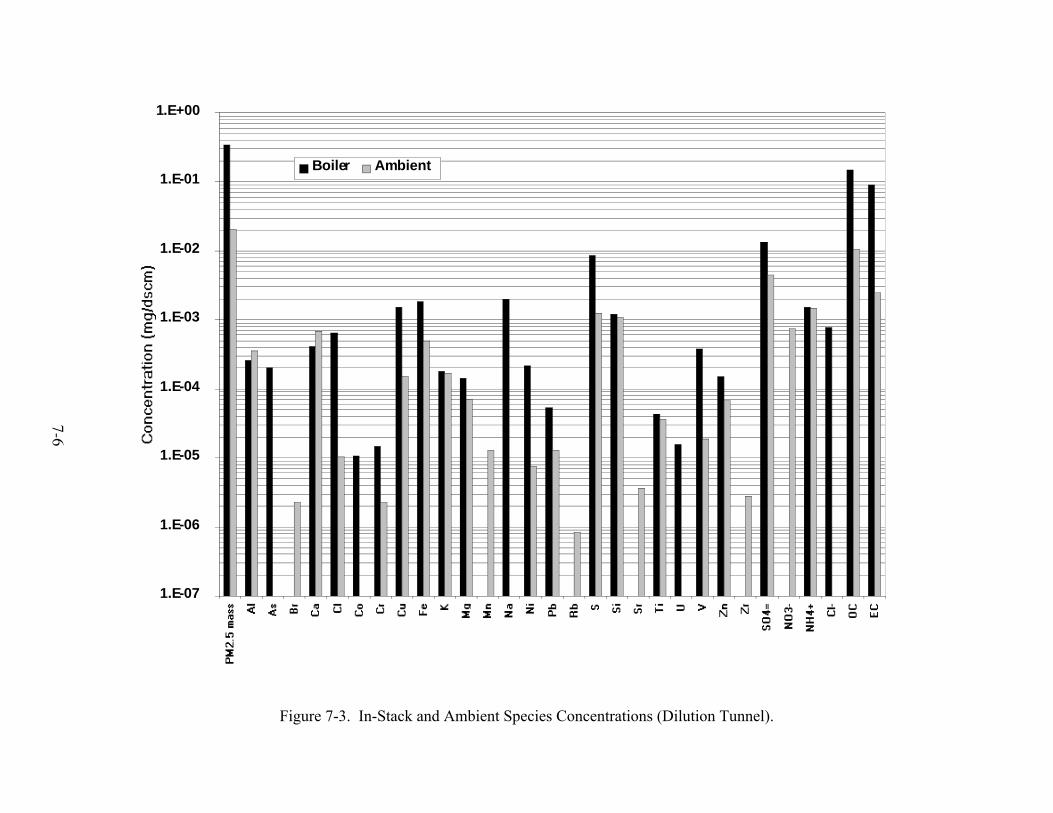
7-6
Figure 7-3. In-Stack and Ambient Species Concentrations (Dilution Tunnel).
1.E-07
1.E-06
1.E-05
1.E-04
1.E-03
1.E-02
1.E-01
1.E+00
Boiler Ambient
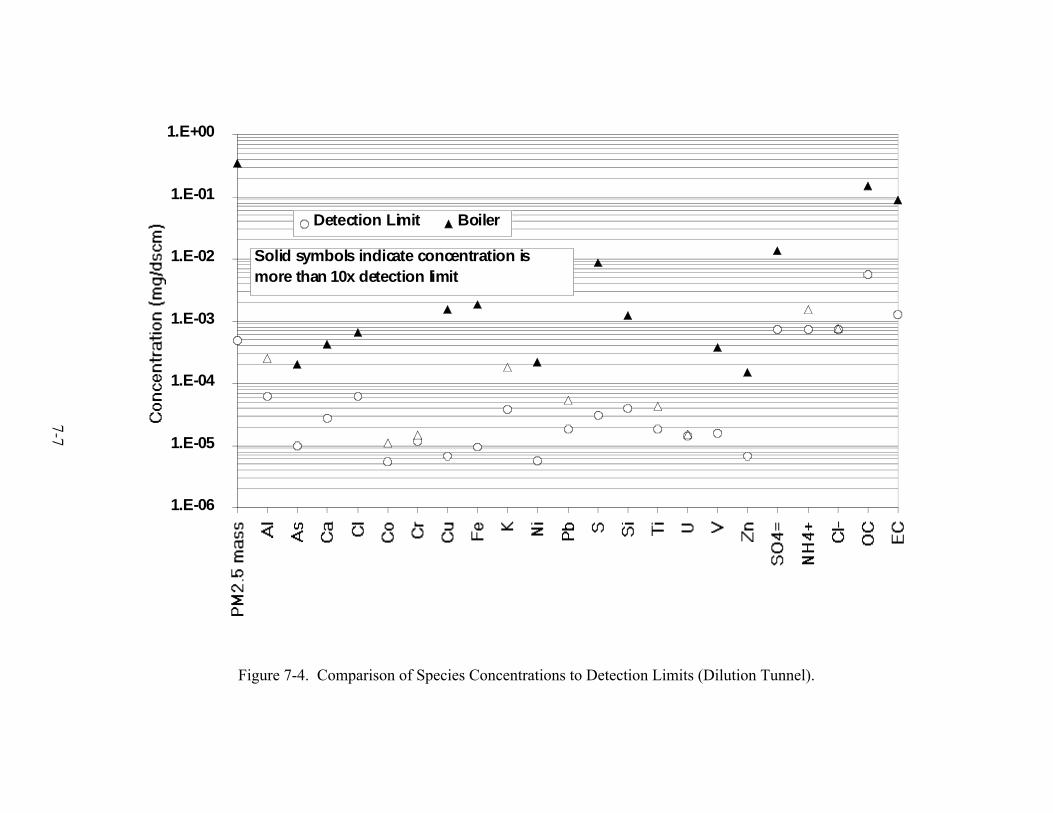
7-7
1.E-06
1.E-05
1.E-04
1.E-03
1.E-02
1.E-01
1.E+00
Detection Limit Boiler
Solid symbols indicate concentration is more than 10x detection limit
Figure 7-4. Comparison of Species Concentrations to Detection Limits (Dilution Tunnel).
7-8
Figure 7-5. Mean Species Concentrations and Standard Deviation (Dilution Tunnel)
1.E-06
1.E-05
1.E-04
1.E-03
1.E-02
1.E-01
1.E+00
Boiler
Standard Deviation
7-9
Arsenic, nickel, vanadium and ammonium are present at levels high enough to be potential
secondary markers, although the scatter in the ammonium data (as indicated by the standard
deviation represented by a dot on Figure 7-5) indicates considerable uncertainty in its emission
level. The absence of a dot (standard deviation) in Figure 7-5 indicates the compound was
detected in only one run. Other compounds were present at lower levels but the low
concentrations and high or unknown standard deviations associated with most of these data tend
to suggest they may not be reliable markers.
The sum of the species represented in Figure 7-5 account for 74 percent of the total PM2.5 mass
generated by the boiler. Part of the difference can be explained by the fact that most of the
elements will be present in the oxide form; the weight of oxygen is not included in the sum of the
elemental species. The overall agreement is good, and is probably within the total uncertainty of
the measurements.
Another potentially useful marker for source emissions is the organic emissions profile. All of
the SVOCs detected were present at extremely low concentrations. Approximately two-thirds of
the SVOCs were detected at concentrations less than 10 times the level detected in the ambient
air, and approximately one-third of the compounds were detected at less than 10 times the field
blank levels. Thus, the SVOCs contributed by the boiler are largely undistinguishable from the
background levels. SVOCs also were measured on the in-stack filters, but very few compounds
were present at detectable levels compared to the dilution tunnel samples. The purpose of
analyzing the in-stack filters for SVOC species was to estimate the particulate-bound SVOCs,
while using the dilution tunnel to collect total particulate, condensed, and gaseous SVOCs. The
sum of SVOCs collected on the in-stack filters (arguably, particulate-bound SVOC) is 2 percent
of the total SVOCs measured in the dilution tunnel samples. The sum of detected SVOCs
accounts for only about 3 percent of OC, indicating the possible presence of unspeciated
organics. This large difference can be explained at least in part by the difference in analytical
methods (the TOR method defines OC somewhat arbitrarily) and the presence of organic species
that are not quantifiable by the methods used in this project. This gap in the speciation of OC
has been observed to varying degrees in most other studies of similar scope (e.g., Hildemann et
al., 1994). Only a handful of SVOCs are present at more than 10 times the ambient air or blank
7-10
concentration (but still at extremely low concentrations): 2-phenylnaphthalene,
acenaphthenequinone, pyrene, fluoranthene, 4h-cyclopenta(def)phenanthrene, d-
methylpyrene/methylfluorene, phenanthrene, anthracene, biphenyl, and benzo(e)pyrene. These
compounds are characteristic of fuel pyrolysis products that escape complete combustion.
SECONDARY PM2.5 PRECURSOR EMISSIONS
Secondary precursor emissions considered in this project were NOX, SO2, ammonia/ammonium,
and VOCs. Nitrogen Oxide emissions arise from three mechanistic sources: Òthermal NOÓ from
high temperature dissociation of molecular nitrogen; Òfuel NOÓ from the oxidation of fixed
nitrogen species present in the fuel; and Òprompt NOÓ from reaction of molecular nitrogen with
oxygen radicals in the early part of the flame. In gas combustion, thermal NO and prompt NO
are the prinicpal sources of Nitrogen Oxide emissions since the fuel is usually free of significant
fixed nitrogen species. Nitrogen Oxide concentration is 73-79 ppm (dry, corrected to 3 percent
oxygen) which is in the range expected for gas combustion in this boiler design and operating
conditions. Sulfur dioxide concentration averaged 3-4 ppm during these tests. This is nominally
consistent with the measured H2S content of the refinery fuel gas. No measurements for gaseous
ammonia were made, since ammonia was not expected in the flue gas. Ammonium
measurements from the dilution tunnel showed ammonium present at very low and variable
levels.
VOCs with a carbon number greater than 7 are believed to be precursors for secondary organic
aerosols (Turpin and Huntzinger, 1991). Of the VOCs with a carbon number greater than 7
detected in the stack samples, the majority were present at concentrations less than a factor of ten
above the ambient air concentration. All VOC concentrations were extremely low.
Benzaldehyde and acetophenone were the first and second highest average concentrations
measured, respectively. The other VOCs present were characteristic of partially combusted fuel
fragments and pyrolysis products which escape complete combustion.

R-1
REFERENCES
ASME. 1990. Measurement Uncertainty. ANSI/ASME PTC 19.1, American Society of
Mechanical Engineers, New York, NY.
England, G. C., B. Toby, and B. Zielinska. 1998. Critical Review of Source Sampling and
Analysis Methodologies for Characterizing Organic Aerosol and Fine Particulate Source
Emission Profiles. Publication No. 344, Health and Environmental Affairs Department,
American Petroleum Institute. Washington, D.C.
Filadelfia, E. J. and McDannel, M. D. 1996. Evaluation of False Positive Interferences
Associated with the Use of EPA Method 202. Air and Waste Management Association 89th
Annual Meeting and Exhibition, Nashville, TN. June 1996.
GE-EER. 1999. Evaluation of False Positive Interference from SO2 on EPA Method 202.
General Electric-Energy and Environmental Research Corporation. Internal Report.
Hildemann, L.M., G.R. Cass, and G.R. Markowski. 1989. A Dilution Stack Sampler for
Organic Aerosol Emissions: Design, Characterization, and Field Tests. Aerosol Science and
Technology. 10: pp. 193-204.
Hil demann, L . M., Kl inedi nst, D. B., Kl ouda, G. A., Cur r ie, L. A. and Cass, G. R., 1994. S our ces
of Ur ban Cont em porar y Car bon Aer osol . E nvironmental Sci ence & Technol ogy. 9: 28.
McDonald, J., Zielinska, B., Fujita, E., Chow, J. , Watson, J., Sagebiel, J., Hayes, T., Sheetz, L.
and Batie, S. 1998. Chemical Speciation of PM2.5 Emissions from Residential Wood
Combustion and Meat Cooking. Air and Waste Management Association Specialty
Conference on PM2.5: A Fine Particulate Standard, Long Beach, CA. January 1998.
R-2
Turpin, B.J. and Huntizicker, J.J. 1991. Secondary Formation Of Organic Aerosol In The Los
Angeles Basin: A Descriptive Analysis Of Organic And Elemental Carbon Concentrations.
Atmospheric Environment. 25A: 207-215.
U. S. EPA. 1998. Supplement D to the Fifth Edition of AP-42. Compilation of Air Pollutant
Emission Factors Volume I: Stationary Point and Area Sources. U.S. Environmental
Protection Agency, Office of Air Quality Planning and Standards, Research Triangle Park,
NC.
U.S. EPA. 1999a. Particulate Matter (PM2.5) Speciation Guidance Document. Draft Guidance
Document. U.S. Environmental Protection Agency, Office of Air Quality Planning and
Standards, Research Triangle Park, NC. pp. 97-108.
U.S. EPA. 1999b. EPA Preliminary Method PRE-4 - Draft Method for Determination of
PM10/PM2.5. U.S. Environmental Protection Agency, Office of Air Quality Planning and
Standards, Research Triangle Park, NC. (http://www.epa.gov/ttn/emc/prelim.html).
Zielinska, B., J. Sagebiel, G. Harshfield, A.W. Gertler and W.R. Pierson. 1996. Volatile
Organic Compounds in the C2-C20 Range Emitted from Motor Vehicles: Measurement
Methods. Atmospheric Environment. 30: 2269-2286.
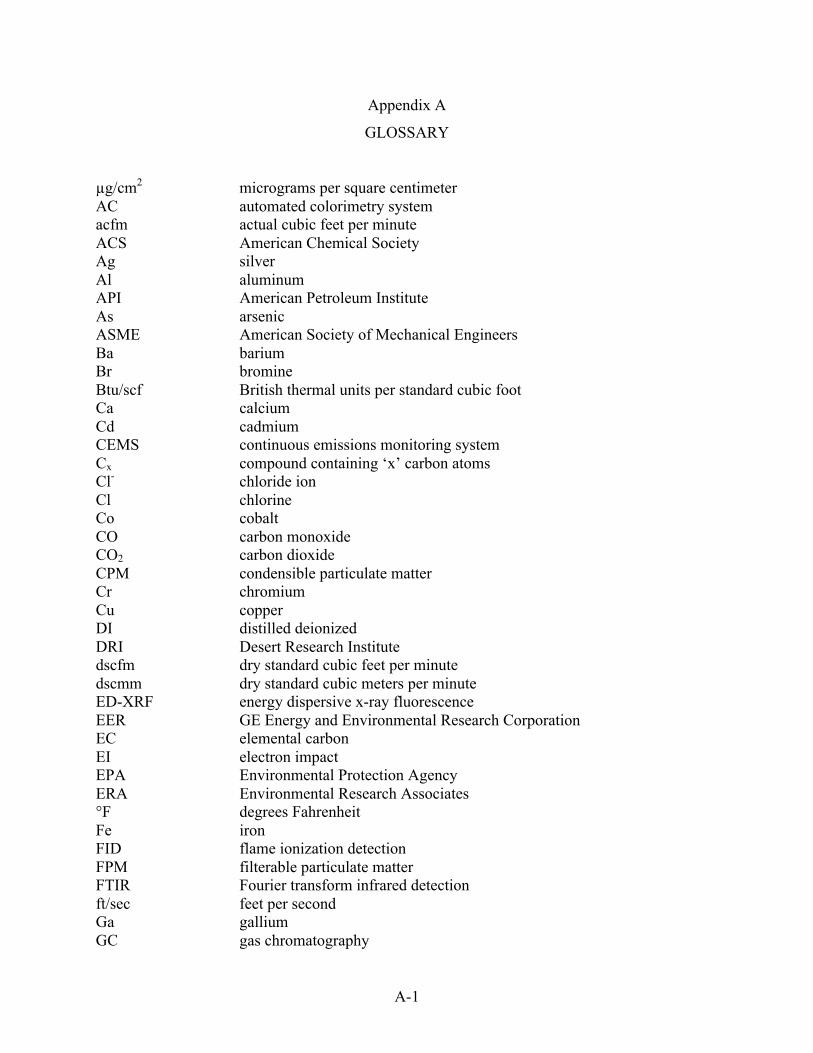
A-1
Appendix A
GLOSSARY
µg/cm2 micrograms per square centimeterAC automated colorimetry systemacfm actual cubic feet per minuteACS American Chemical SocietyAg silverAl aluminumAPI American Petroleum InstituteAs arsenicASME American Society of Mechanical EngineersBa bariumBr bromineBtu/scf British thermal units per standard cubic footCa calciumCd cadmiumCEMS continuous emissions monitoring systemCx compound containing ÔxÕ carbon atomsCl- chloride ionCl chlorineCo cobaltCO carbon monoxideCO2 carbon dioxideCPM condensible particulate matterCr chromiumCu copperDI distilled deionizedDRI Desert Research Institutedscfm dry standard cubic feet per minutedscmm dry standard cubic meters per minuteED-XRF energy dispersive x-ray fluorescenceEER GE Energy and Environmental Research CorporationEC elemental carbonEI electron impactEPA Environmental Protection AgencyERA Environmental Research Associates¡F degrees FahrenheitFe ironFID flame ionization detectionFPM filterable particulate matterFTIR Fourier transform infrared detectionft/sec feet per secondGa galliumGC gas chromatography
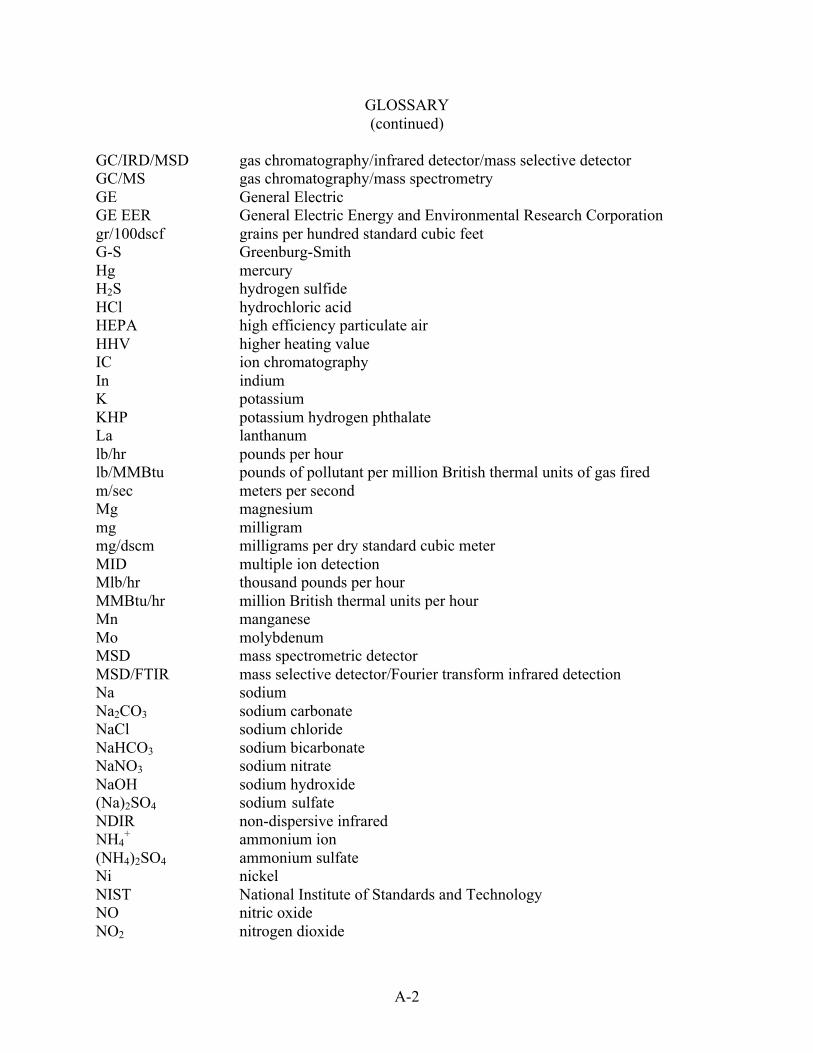
A-2
GLOSSARY(continued)
GC/IRD/MSD gas chromatography/infrared detector/mass selective detectorGC/MS gas chromatography/mass spectrometryGE General ElectricGE EER General Electric Energy and Environmental Research Corporationgr/100dscf grains per hundred standard cubic feetG-S Greenburg-SmithHg mercuryH2S hydrogen sulfideHCl hydrochloric acidHEPA high efficiency particulate airHHV higher heating valueIC ion chromatographyIn indiumK potassiumKHP potassium hydrogen phthalateLa lanthanumlb/hr pounds per hourlb/MMBtu pounds of pollutant per million British thermal units of gas firedm/sec meters per secondMg magnesiummg milligrammg/dscm milligrams per dry standard cubic meterMID multiple ion detectionMlb/hr thousand pounds per hourMMBtu/hr million British thermal units per hourMn manganeseMo molybdenumMSD mass spectrometric detectorMSD/FTIR mass selective detector/Fourier transform infrared detectionNa sodiumNa2CO3 sodium carbonateNaCl sodium chlorideNaHCO3 sodium bicarbonateNaNO3 sodium nitrateNaOH sodium hydroxide(Na)2SO4 sodium sulfateNDIR non-dispersive infraredNH4
+ ammonium ion(NH4)2SO4 ammonium sulfateNi nickelNIST National Institute of Standards and TechnologyNO nitric oxideNO2 nitrogen dioxide
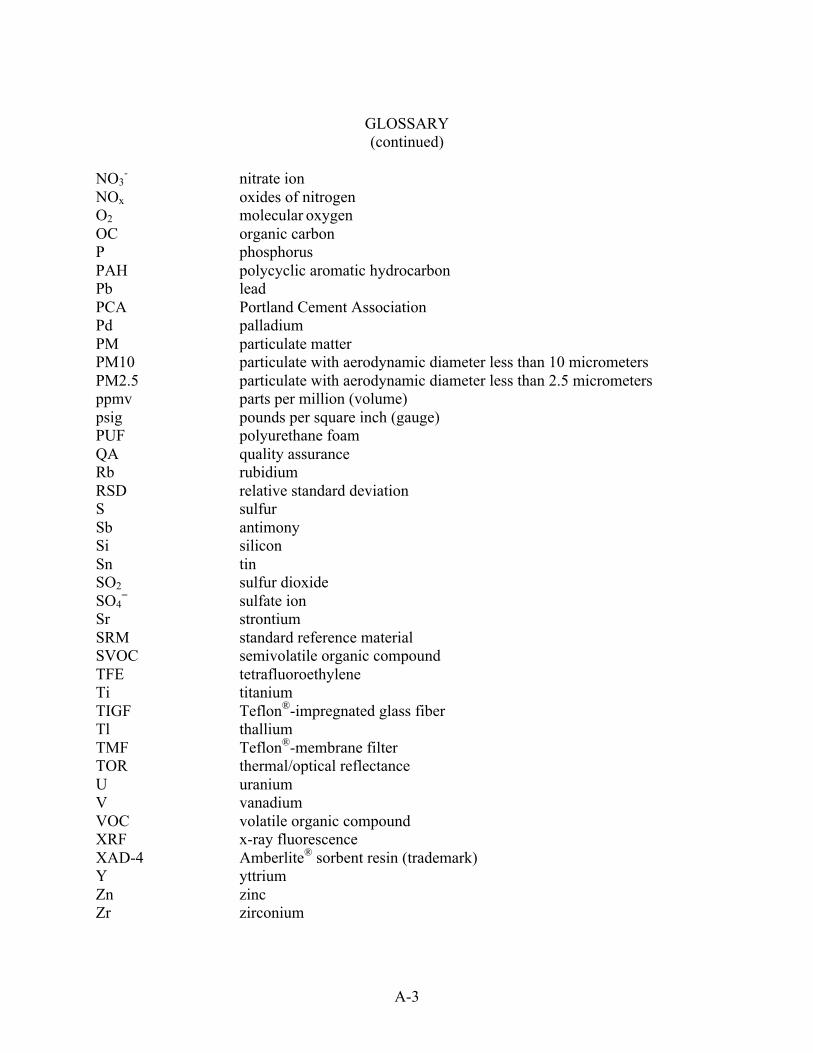
A-3
GLOSSARY(continued)
NO3- nitrate ion
NOx oxides of nitrogenO2 molecular oxygenOC organic carbonP phosphorusPAH polycyclic aromatic hydrocarbonPb leadPCA Portland Cement AssociationPd palladiumPM particulate matterPM10 particulate with aerodynamic diameter less than 10 micrometersPM2.5 particulate with aerodynamic diameter less than 2.5 micrometersppmv parts per million (volume)psig pounds per square inch (gauge)PUF polyurethane foamQA quality assuranceRb rubidiumRSD relative standard deviationS sulfurSb antimonySi siliconSn tinSO2 sulfur dioxideSO4
= sulfate ionSr strontiumSRM standard reference materialSVOC semivolatile organic compoundTFE tetrafluoroethyleneTi titaniumTIGF Teflon¨-impregnated glass fiberTl thalliumTMF Teflon¨-membrane filterTOR thermal/optical reflectanceU uraniumV vanadiumVOC volatile organic compoundXRF x-ray fluorescenceXAD-4 Amberlite¨ sorbent resin (trademark)Y yttriumZn zincZr zirconium
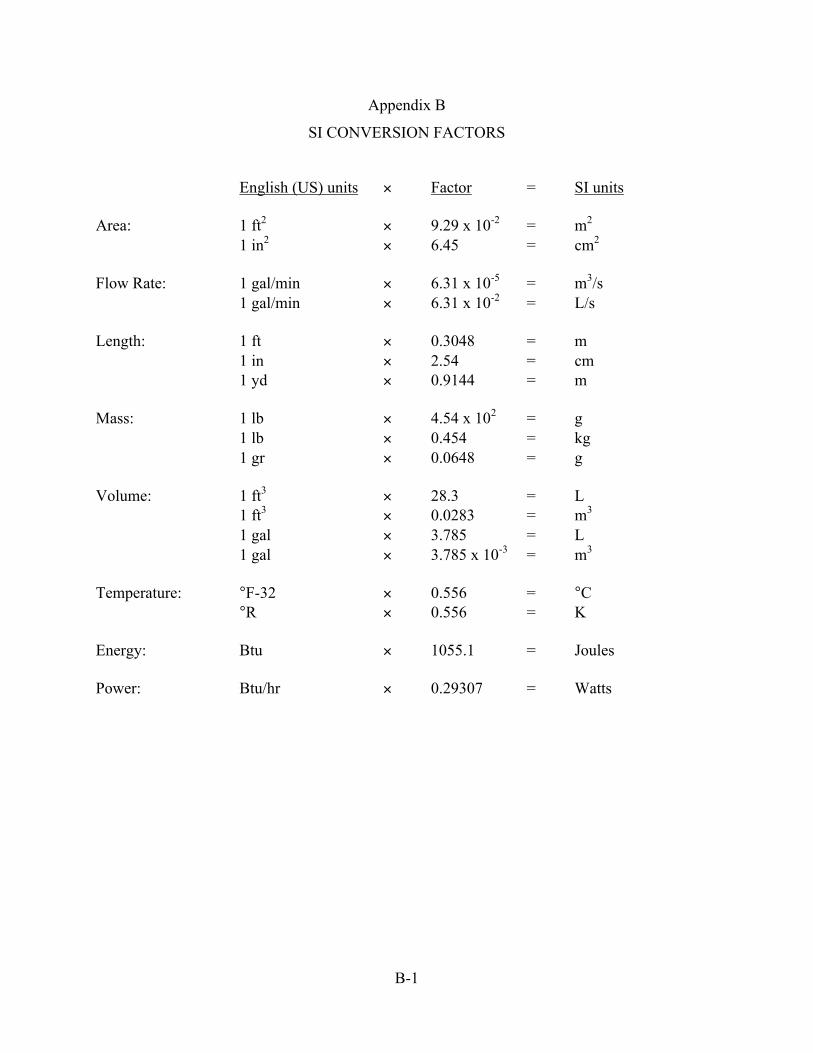
B-1
Appendix B
SI CONVERSION FACTORS
English (US) units ´ Factor = SI units
Area: 1 ft2 ´ 9.29 x 10-2 = m2
1 in2 ´ 6.45 = cm2
Flow Rate: 1 gal/min ´ 6.31 x 10-5 = m3/s1 gal/min ´ 6.31 x 10-2 = L/s
Length: 1 ft ´ 0.3048 = m1 in ´ 2.54 = cm1 yd ´ 0.9144 = m
Mass: 1 lb ´ 4.54 x 102 = g1 lb ´ 0.454 = kg1 gr ´ 0.0648 = g
Volume: 1 ft3 ´ 28.3 = L1 ft3 ´ 0.0283 = m3
1 gal ´ 3.785 = L1 gal ´ 3.785 x 10-3 = m3
Temperature: °F-32 ´ 0.556 = °C°R ´ 0.556 = K
Energy: Btu ´ 1055.1 = Joules
Power: Btu/hr ´ 0.29307 = Watts


07/01

Additional copies are available through Global EngineeringDocuments at (800) 854-7179 or (303) 397-7956
Information about API Publications, Programs and Services isavailable on the World Wide Web at: http://www.api.org
Product No. I47030