Embed Size (px)
Citation preview
Gas Customer ForumTransmission Update
Chris Logue
9th July 2007
Items
Gas Quality Web Site
Introduction to MIPI Winter Outlook
Gas Quality
Commenced UNC Workshops to work up the requirements of Ofgem’s previous consultation process.
NG invest to provide service User commitment to send investment signal to NG
Process currently stalled pending a new consultation document from Ofgem
Market Information Provision Initiative
Market Information Provision
Content of presentation:
Evolution of current system (IE3) Current Presentation of Information Drivers for Change Market Information Provision Initiative (MIPI) MIPI presentation Concepts MIPI future communications
IE3 Evolution – the story so far
Developed in 2000 to provide after the day reports via a web interface on a 9-5 working week basis
Replaced manual creation and paper copy NCORM reports being issued via post to Shippers only.
New reports including within day reports identified as part of DTI Information Initiative added 2003/4
inc NTSAFF, NTSAPF, NTSEOD etc Gradual addition of other reporting, particularly near to real
time information Daily Summary Report introduced for winter 2005/6 GMRS Real Time Flow Data introduced for winter 2006/7 Most comprehensive public gas market information system
in Europe - if not the world
IE3 Current Presentation
Daily Summary Report Provides a snapshot of
prevailing data Provides Alarms, notes and
messages Updated within-day as
information becomes available
Graphical history to give context
Key point of entry for most users Key data not all available on the
screen at the same time
Reports in .PDF and .CSV formats (viewable and/or downloadable)
Within-day Daily Weekly Monthly
Inflexible from a user perspective (date ranges, report content etc)
no automated interface Complicated reports with non-
intuitive names and content
Information provided in 2 ways :
Drivers for Change
Utilisation of IE3 increased 20 fold in the last 3 years
High availability and Timeliness of information publication to promote open market conditions through increased transparency of data to all industry participants:
Increasing future links to global markets and European supplies Evolving market conditions and the dynamic nature of the market
Shift in data use and requirements Data volume required for market modelling Offline analytical and user side decision making tools
Limited extensibility for IE3 to accommodate additional functionality, including Regulatory changes (mod 97a, 104, 130, UNC 140 info review)
MIPI
Market Information Provision Initiative
MIPI07 Future
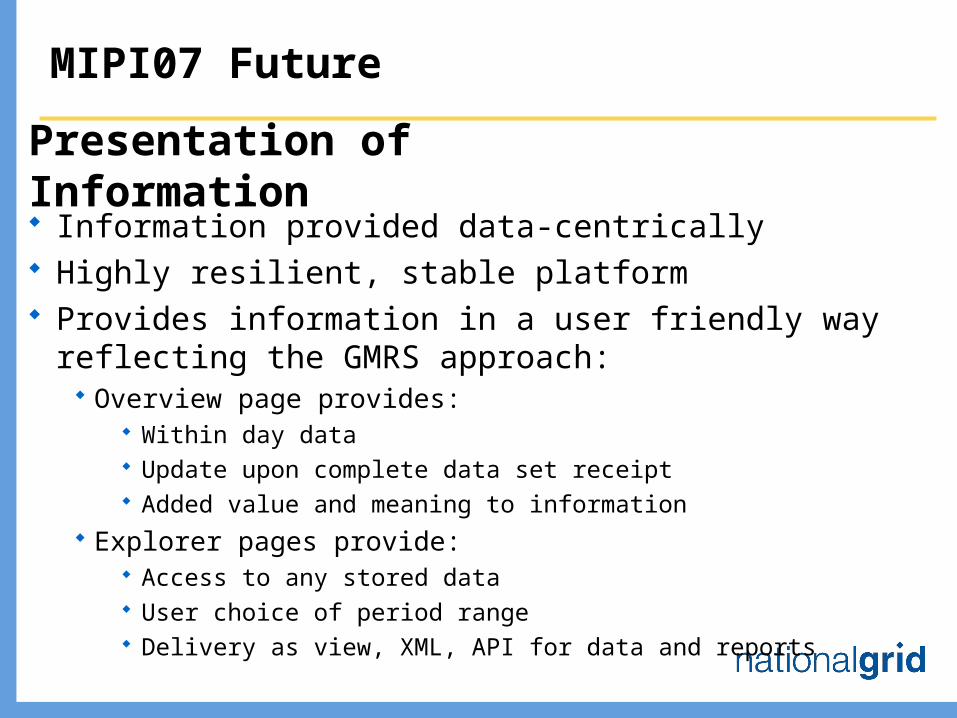
Information provided data-centrically Highly resilient, stable platform Provides information in a user friendly way reflecting the
GMRS approach: Overview page provides:
Within day data Update upon complete data set receipt Added value and meaning to information
Explorer pages provide: Access to any stored data User choice of period range Delivery as view, XML, API for data and reports
Presentation of Information
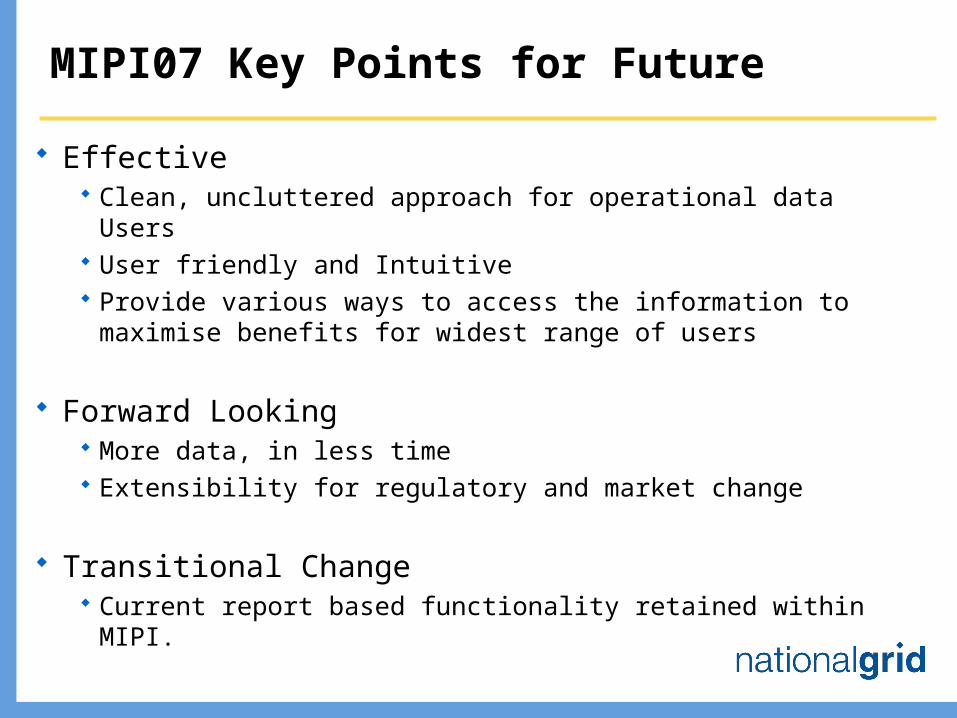
MIPI07 Key Points for Future
Effective Clean, uncluttered approach for operational data Users User friendly and Intuitive Provide various ways to access the information to maximise
benefits for widest range of users
Forward Looking More data, in less time Extensibility for regulatory and market change
Transitional Change Current report based functionality retained within MIPI.
Presentation Concepts
Three Tier
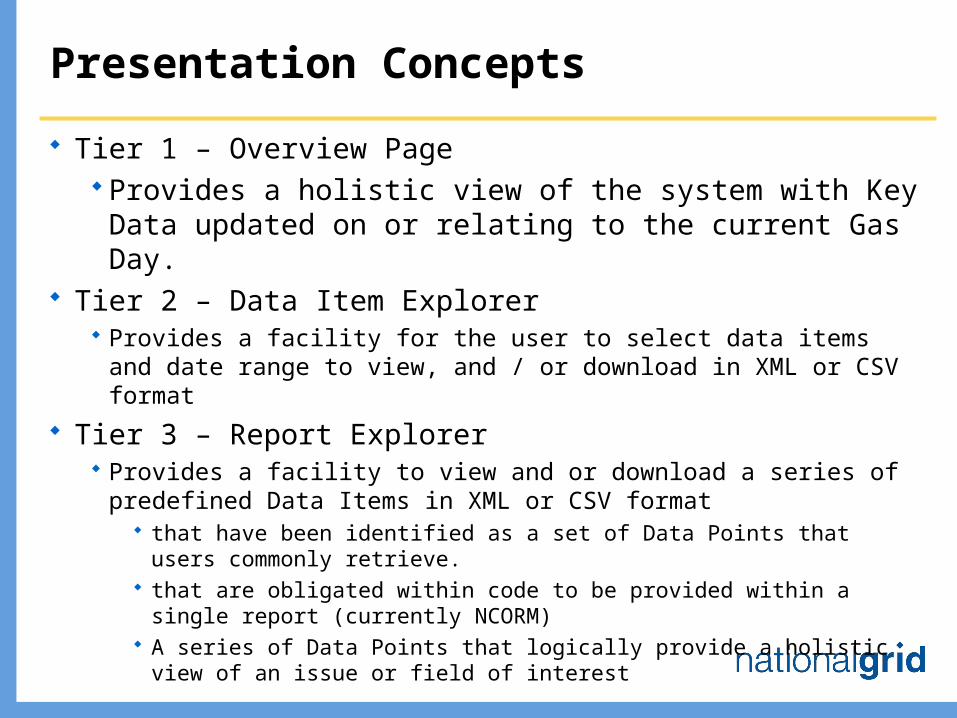
Presentation Concepts
Tier 1 – Overview Page Provides a holistic view of the system with Key Data
updated on or relating to the current Gas Day. Tier 2 – Data Item Explorer
Provides a facility for the user to select data items and date range to view, and / or download in XML or CSV format
Tier 3 – Report Explorer Provides a facility to view and or download a series of predefined
Data Items in XML or CSV format that have been identified as a set of Data Points that users commonly
retrieve. that are obligated within code to be provided within a single report
(currently NCORM) A series of Data Points that logically provide a holistic view of an issue
or field of interest
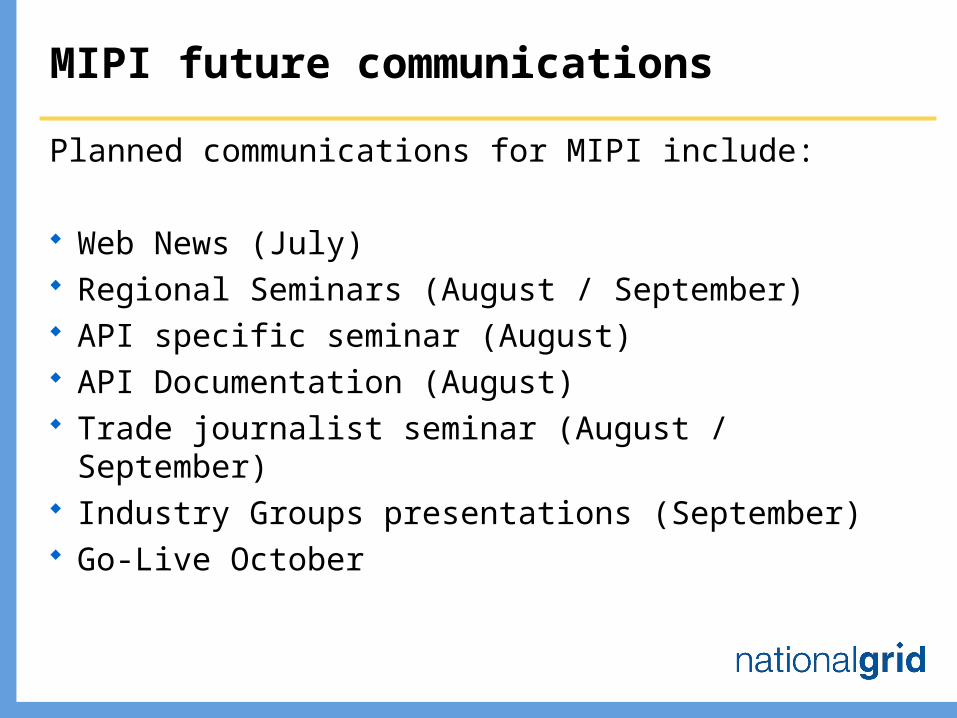
MIPI future communications
Planned communications for MIPI include:
Web News (July) Regional Seminars (August / September) API specific seminar (August) API Documentation (August) Trade journalist seminar (August / September) Industry Groups presentations (September) Go-Live October
Winter Consultation Report – June 2007
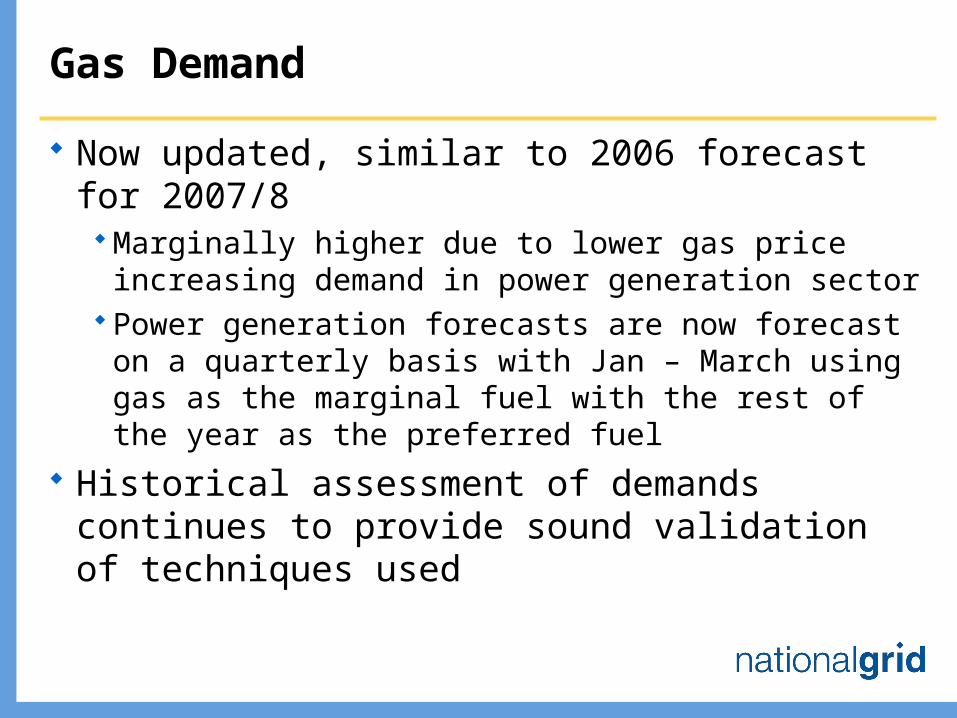
Gas Demand
Now updated, similar to 2006 forecast for 2007/8 Marginally higher due to lower gas price increasing
demand in power generation sector Power generation forecasts are now forecast on a
quarterly basis with Jan – March using gas as the marginal fuel with the rest of the year as the preferred fuel
Historical assessment of demands continues to provide sound validation of techniques used
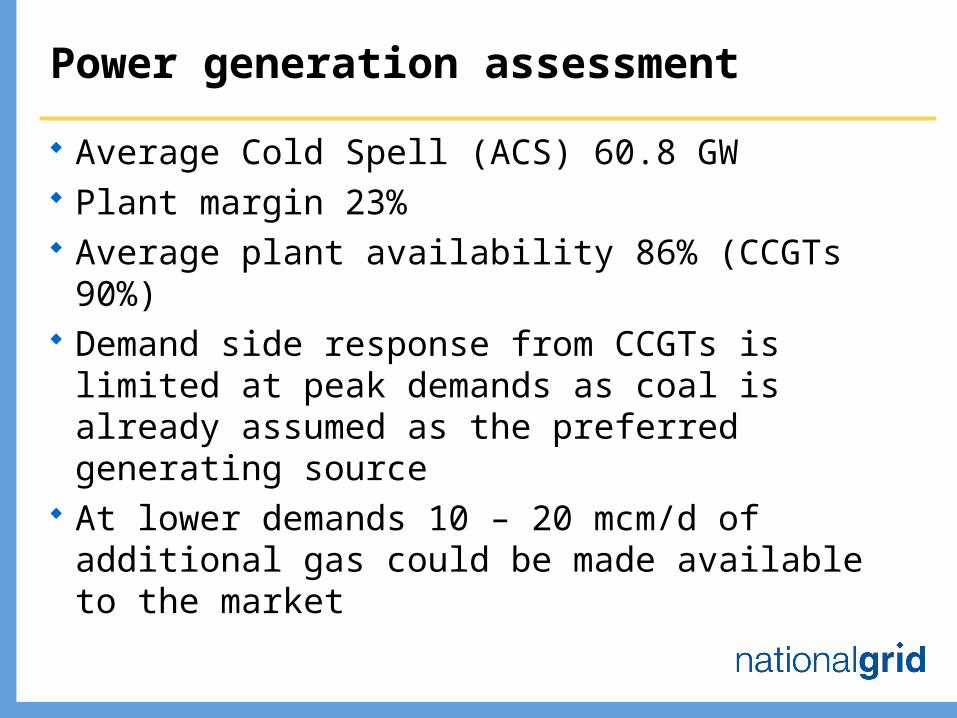
Power generation assessment
Average Cold Spell (ACS) 60.8 GW Plant margin 23% Average plant availability 86% (CCGTs 90%) Demand side response from CCGTs is limited at
peak demands as coal is already assumed as the preferred generating source
At lower demands 10 – 20 mcm/d of additional gas could be made available to the market
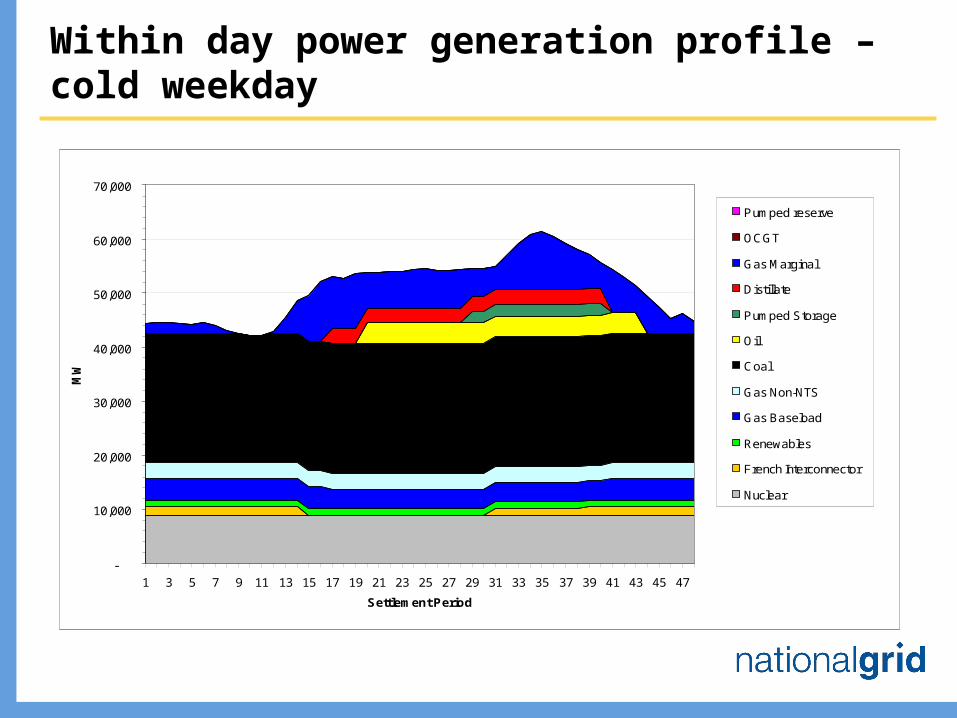
Within day power generation profile – cold weekday
-
10,000
20,000
30,000
40,000
50,000
60,000
70,000
1 3 5 7 9 11 13 15 17 19 21 23 25 27 29 31 33 35 37 39 41 43 45 47
Settlement Period
MW
Pumped reserve
OCGT
Gas Marginal
Distillate
Pumped Storage
Oil
Coal
Gas Non-NTS
Gas Baseload
Renewables
French Interconnector
Nuclear
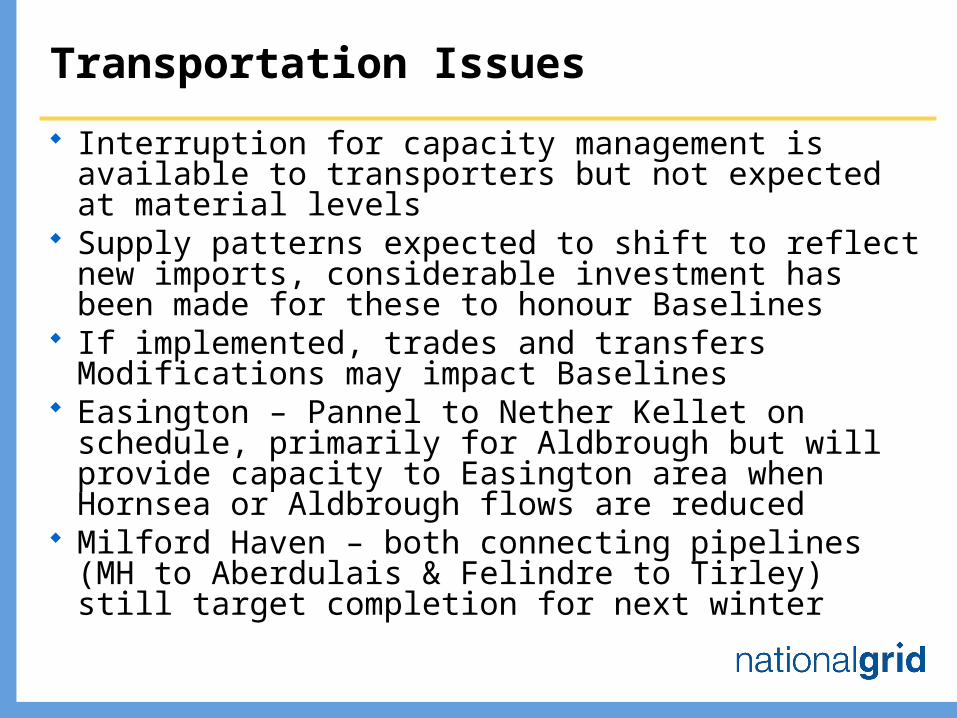
Transportation Issues
Interruption for capacity management is available to transporters but not expected at material levels
Supply patterns expected to shift to reflect new imports, considerable investment has been made for these to honour Baselines
If implemented, trades and transfers Modifications may impact Baselines
Easington – Pannel to Nether Kellet on schedule, primarily for Aldbrough but will provide capacity to Easington area when Hornsea or Aldbrough flows are reduced
Milford Haven – both connecting pipelines (MH to Aberdulais & Felindre to Tirley) still target completion for next winter
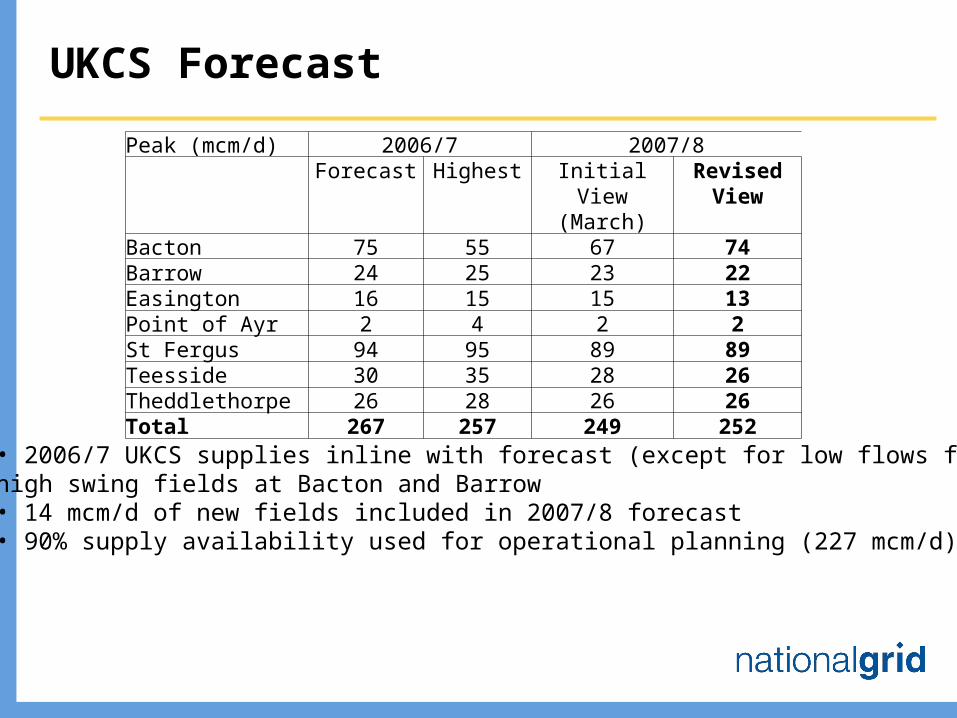
UKCS Forecast
Peak (mcm/d) 2006/7 2007/8Forecast Highest Initial View
(March)Revised
ViewBacton 75 55 67 74Barrow 24 25 23 22Easington 16 15 15 13Point of Ayr 2 4 2 2St Fergus 94 95 89 89Teesside 30 35 28 26Theddlethorpe 26 28 26 26Total 267 257 249 252
• 2006/7 UKCS supplies inline with forecast (except for low flows fromhigh swing fields at Bacton and Barrow • 14 mcm/d of new fields included in 2007/8 forecast• 90% supply availability used for operational planning (227 mcm/d)
Imports (1)
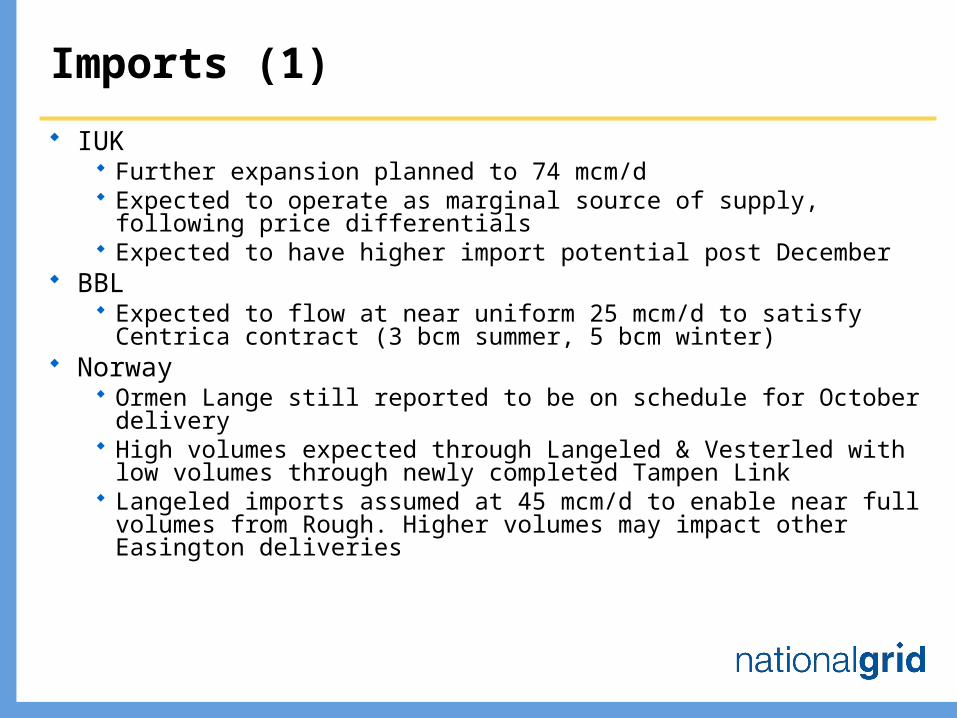
IUK Further expansion planned to 74 mcm/d Expected to operate as marginal source of supply, following price
differentials Expected to have higher import potential post December
BBL Expected to flow at near uniform 25 mcm/d to satisfy Centrica contract (3
bcm summer, 5 bcm winter) Norway
Ormen Lange still reported to be on schedule for October delivery High volumes expected through Langeled & Vesterled with low volumes
through newly completed Tampen Link Langeled imports assumed at 45 mcm/d to enable near full volumes from
Rough. Higher volumes may impact other Easington deliveries
Imports (2)
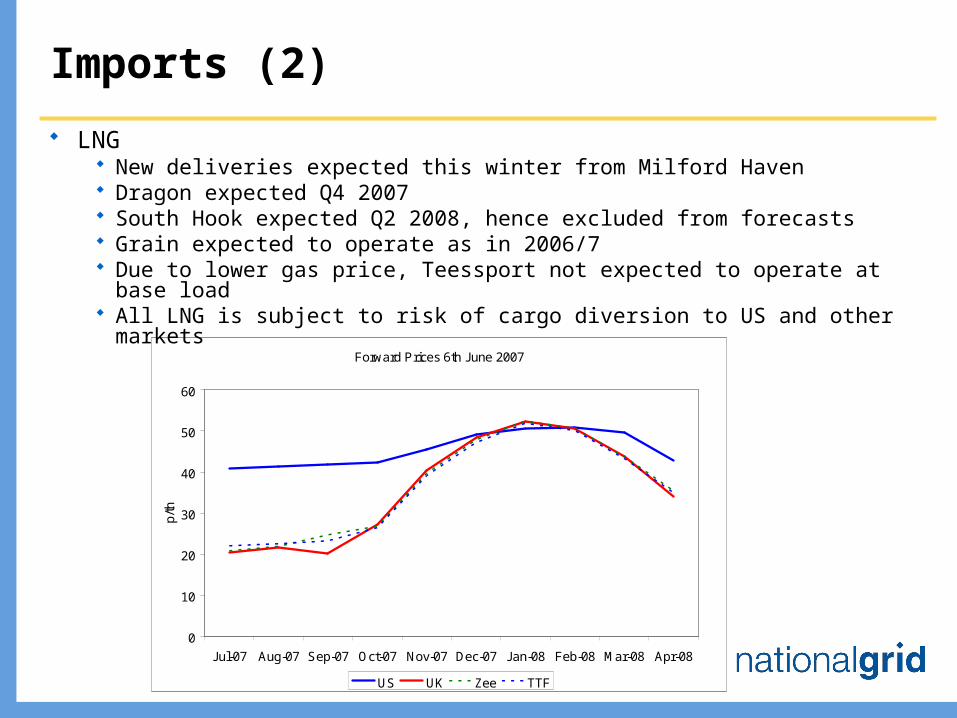
LNG New deliveries expected this winter from Milford Haven Dragon expected Q4 2007 South Hook expected Q2 2008, hence excluded from forecasts Grain expected to operate as in 2006/7 Due to lower gas price, Teessport not expected to operate at base load All LNG is subject to risk of cargo diversion to US and other markets
Forward Prices 6th June 2007
0
10
20
30
40
50
60
Jul-07 Aug-07 Sep-07 Oct-07 Nov-07 Dec-07 Jan-08 Feb-08 Mar-08 Apr-08
p/th
US UK Zee TTF
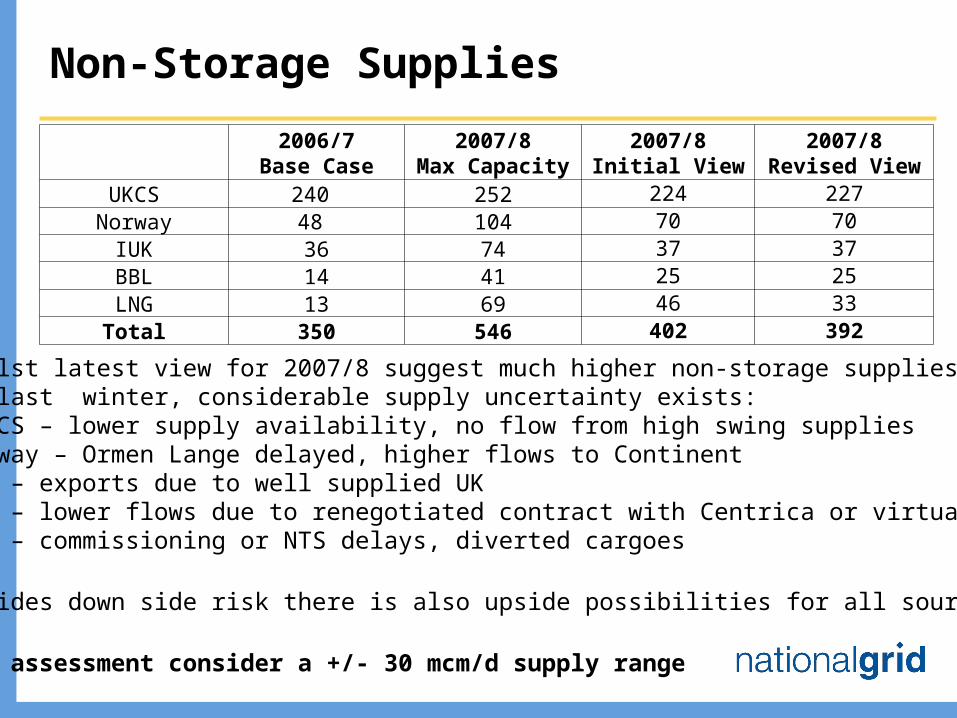
Non-Storage Supplies
2006/7Base Case
2007/8Max Capacity
2007/8Initial View
2007/8Revised View
UKCS 240 252 224 227Norway 48 104 70 70
IUK 36 74 37 37BBL 14 41 25 25LNG 13 69 46 33Total 350 546 402 392
•Whilst latest view for 2007/8 suggest much higher non-storage supplies thanfor last winter, considerable supply uncertainty exists:• UKCS – lower supply availability, no flow from high swing supplies•Norway – Ormen Lange delayed, higher flows to Continent•IUK – exports due to well supplied UK•BBL – lower flows due to renegotiated contract with Centrica or virtual exports•LNG – commissioning or NTS delays, diverted cargoes
•Besides down side risk there is also upside possibilities for all sources
•For assessment consider a +/- 30 mcm/d supply range
Storage
For next winter we anticipate higher storage availability through:
Hole House Farm – increased deliverability Aldbrough – new salt cavity storage, phased build-up of
capacity expected
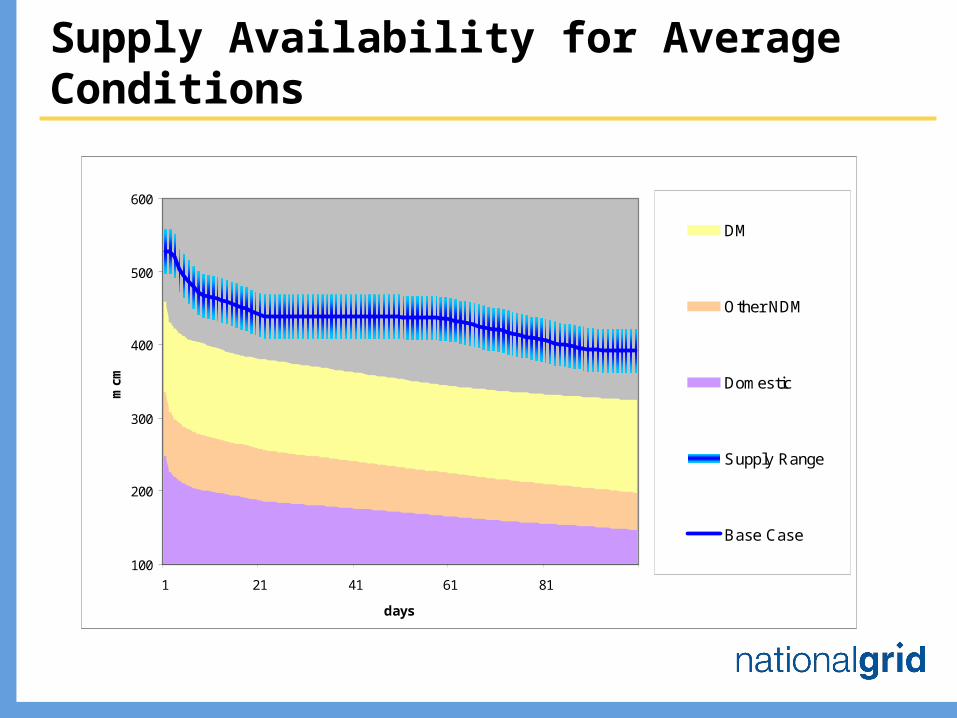
Supply Availability for Average Conditions
100
200
300
400
500
600
1 21 41 61 81
days
mcm
DM
Other NDM
Domestic
Supply Range
Base Case
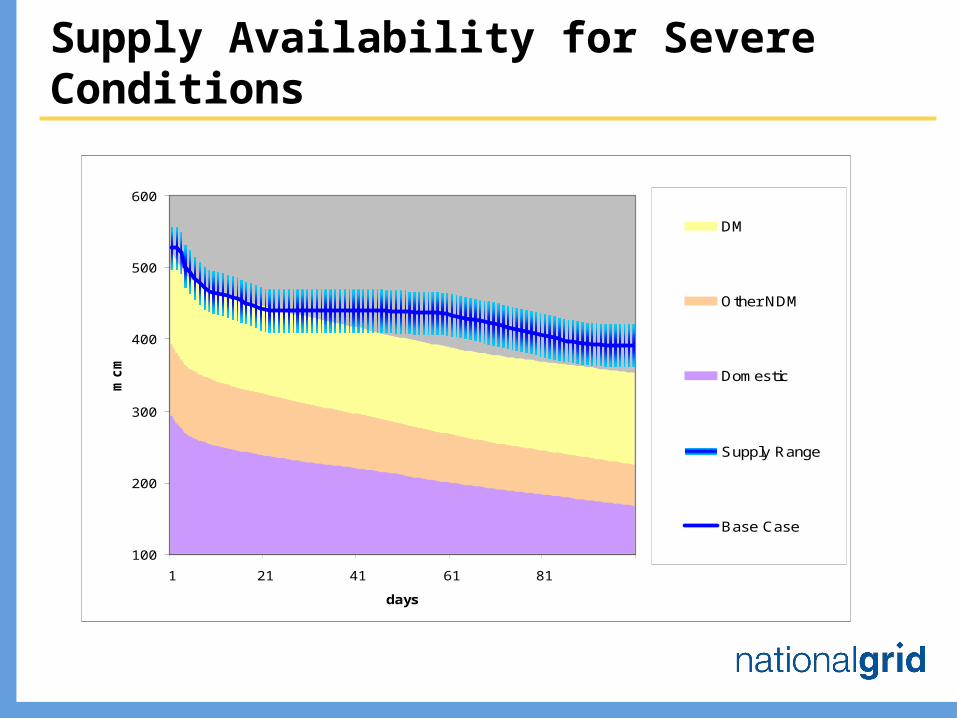
Supply Availability for Severe Conditions
100
200
300
400
500
600
1 21 41 61 81
days
mc
m
DM
Other NDM
Domestic
Supply Range
Base Case
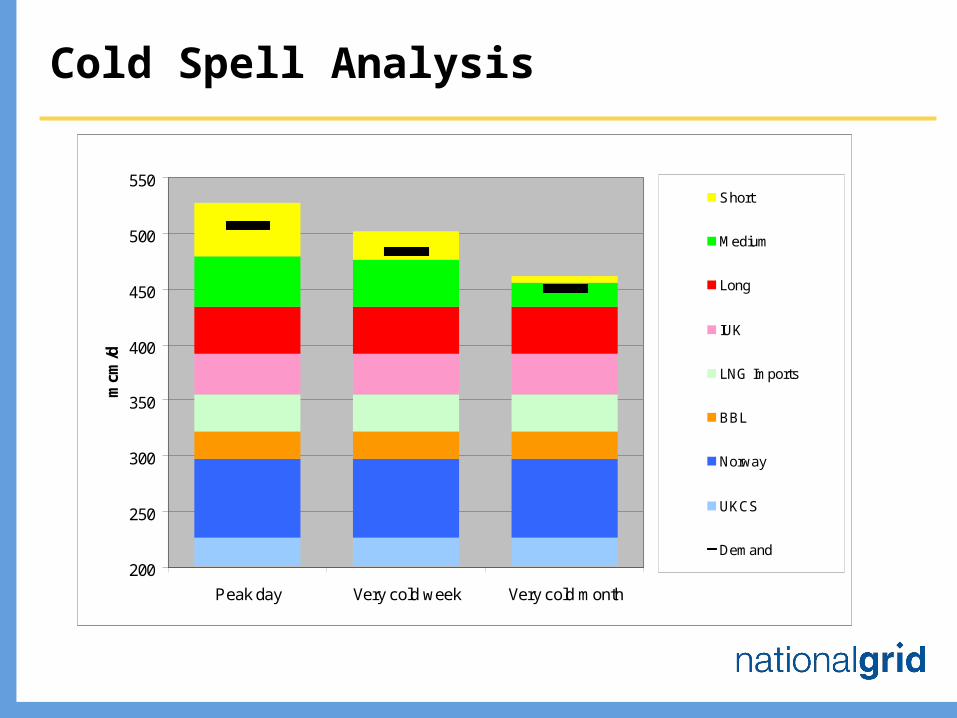
Cold Spell Analysis
200
250
300
350
400
450
500
550
Peak day Very cold week Very cold month
mcm
/d
Short
Medium
Long
IUK
LNG Imports
BBL
Norway
UKCS
Demand
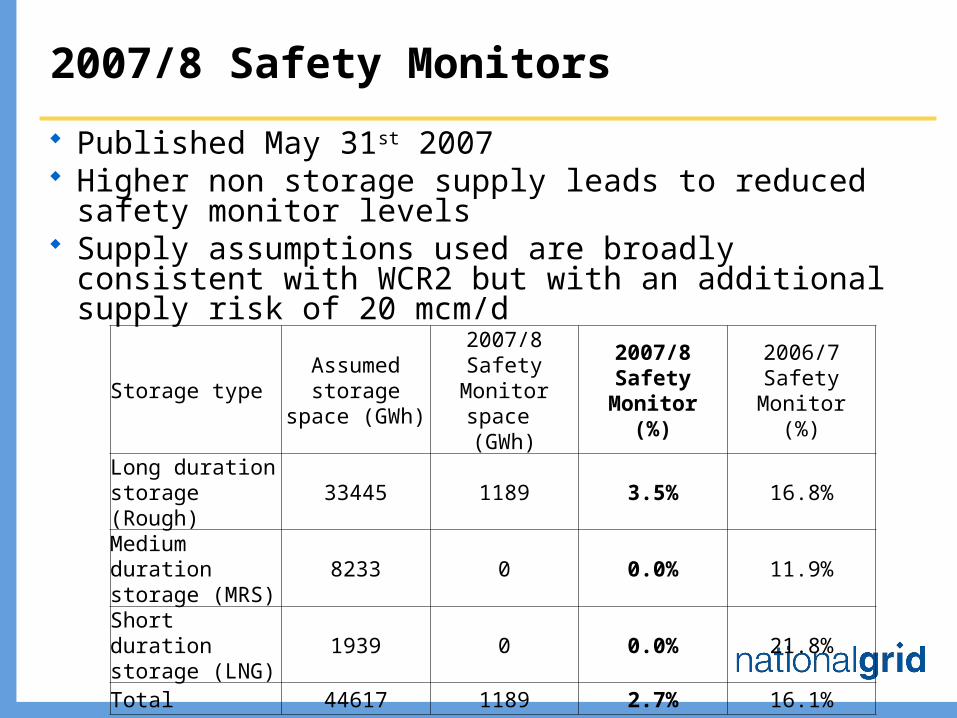
2007/8 Safety Monitors
Published May 31st 2007 Higher non storage supply leads to reduced safety monitor
levels Supply assumptions used are broadly consistent with
WCR2 but with an additional supply risk of 20 mcm/d
Storage typeAssumed
storage space (GWh)
2007/8 Safety Monitor space
(GWh)
2007/8 Safety Monitor
(%)
2006/7 Safety Monitor
(%)
Long duration storage (Rough)
33445 1189 3.5% 16.8%
Medium duration storage (MRS)
8233 0 0.0% 11.9%
Short duration storage (LNG)
1939 0 0.0% 21.8%
Total 44617 1189 2.7% 16.1%