Embed Size (px)
Citation preview
APPLICATION NOTE AN-010
NITRONEX CORPORATION 1 JUNE 2008
GaN Essentials™
AN-010: GaN for LDMOS Users
APPLICATION NOTE AN-010
NITRONEX CORPORATION 2 JUNE 2008
GaN Essentials: GaN for LDMOS Users
1. Table of Contents
1. TABLE OF CONTENTS................................................................................................................................... 2
2. ABSTRACT......................................................................................................................................................... 3
IMPEDANCE PROFILES.......................................................................................................................................... 3
2.1. INPUT IMPEDANCE.................................................................................................................................... 3 2.2. OUTPUT IMPEDANCE................................................................................................................................ 4
3. STABILITY ......................................................................................................................................................... 5
4. CAPACITANCE VS. VOLTAGE ................................................................................................................... 6
4.1. TYPICAL CAPACITANCE-VOLTAGE (CV) CHARACTERISTICS ................................................................ 6 4.2. OUTPUT CAPACITANCE COMPARISON BETWEEN GAN AND LDMOS .................................................. 7
5. BIAS CIRCUITS................................................................................................................................................. 7
5.1. GENERAL BIAS COMMENTS..................................................................................................................... 7 5.2. GATE BIAS................................................................................................................................................ 8 5.3. DRAIN BIAS .............................................................................................................................................. 8
6. THERMAL PRECAUATIONS........................................................................................................................ 8
6.1. TEMPERATURE COMPENSATION .............................................................................................................. 8 6.2. LINEARITY SENSITIVITY TO BIAS ............................................................................................................ 9
7. SATURATED POWER AND COMPRESSION .......................................................................................... 9
7.1. TYPICAL COMPRESSION CURVES............................................................................................................. 9 7.2. GAN IN LINEARITY CORRECTION SYSTEMS.......................................................................................... 10
8. ROBUSTNESS .................................................................................................................................................. 10
8.1. OUTPUT VSWR TESTING ...................................................................................................................... 11
9. MAXIMUM RF DRIVE.................................................................................................................................. 11
10. INSERTION PHASE VARIATION................................................................................................ 13
10.1. WAFER AND DEVICE VARIATION .......................................................................................................... 13 10.2. PHASE VARIATION INTO COMPRESSION ................................................................................................ 14 10.3. PHASE VARIATION OVER SUPPLY VOLTAGE......................................................................................... 15
11. CONCLUSIONS ................................................................................................................................. 15
APPLICATION NOTE AN-010
NITRONEX CORPORATION 3 JUNE 2008
2. Abstract
This application note will compare LDMOS versus GaN for RF power amplifier stages. Basic
concepts/approximations used for LDMOS will be shown to hold true for GaN.
A comparison of equivalent output power devices will be done. This comparison will show some of the
similarities of GaN and LDMOS. Differences will also be shown. Key difference to be illustrated will be the
saturation characteristics of GaN.
Basic characteristics such as ruggedness, stability and combining multiple amplifier stages will also be
presented.
Additional properties of GaN that are significantly different than LDMOS will be presented. One of these
areas is charge trapping effects, in which the device starts to turn off. Another characteristic of GaN that is
significantly different is the behavior of gate current near saturation.
Impedance Profiles
2.1. Input Impedance
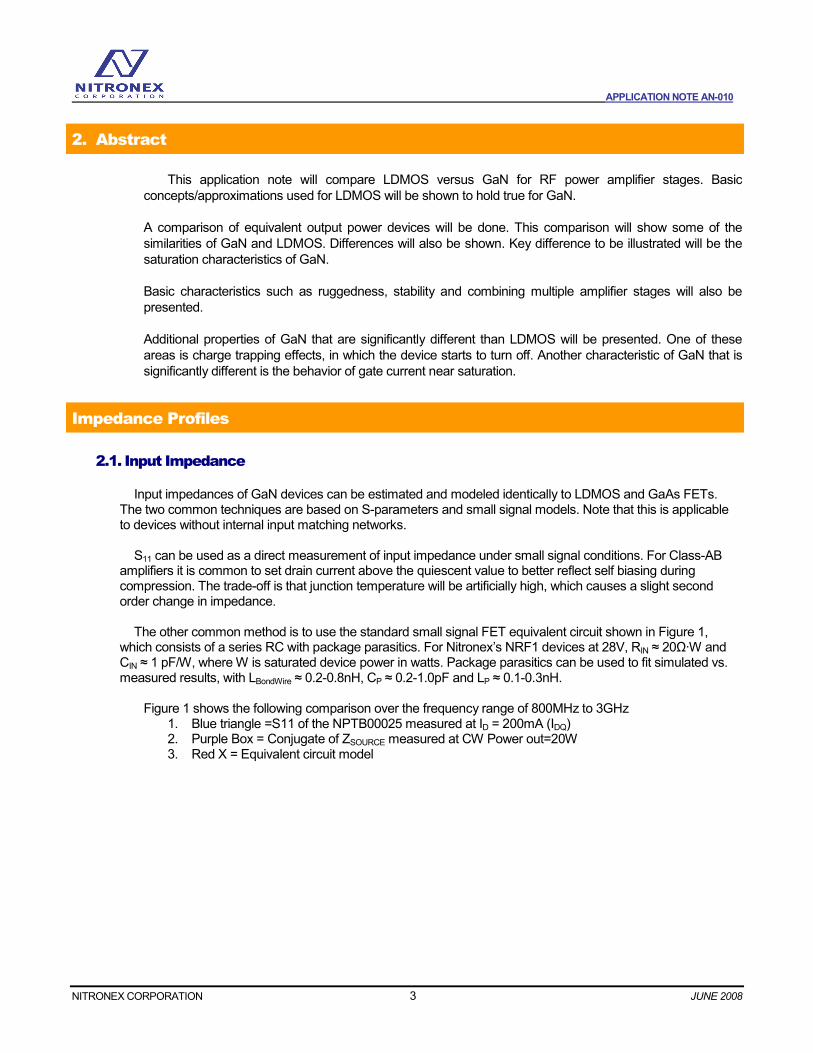
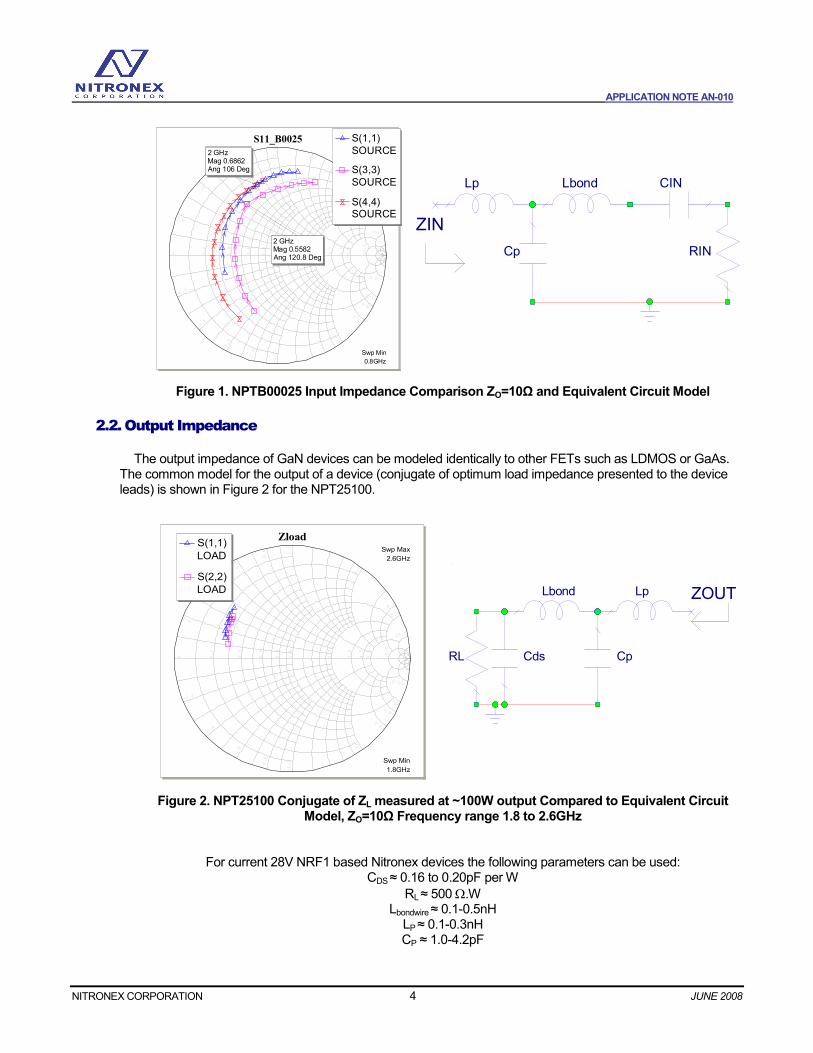
Input impedances of GaN devices can be estimated and modeled identically to LDMOS and GaAs FETs. The two common techniques are based on S-parameters and small signal models. Note that this is applicable to devices without internal input matching networks. S11 can be used as a direct measurement of input impedance under small signal conditions. For Class-AB
amplifiers it is common to set drain current above the quiescent value to better reflect self biasing during compression. The trade-off is that junction temperature will be artificially high, which causes a slight second order change in impedance. The other common method is to use the standard small signal FET equivalent circuit shown in Figure 1,
which consists of a series RC with package parasitics. For Nitronex’s NRF1 devices at 28V, RIN ≈ 20Ω·W and CIN ≈ 1 pF/W, where W is saturated device power in watts. Package parasitics can be used to fit simulated vs. measured results, with LBondWire ≈ 0.2-0.8nH, CP ≈ 0.2-1.0pF and LP ≈ 0.1-0.3nH.
Figure 1 shows the following comparison over the frequency range of 800MHz to 3GHz
1. Blue triangle =S11 of the NPTB00025 measured at ID = 200mA (IDQ) 2. Purple Box = Conjugate of ZSOURCE measured at CW Power out=20W 3. Red X = Equivalent circuit model
APPLICATION NOTE AN-010
NITRONEX CORPORATION 4 JUNE 2008
0 1.0
1.0
-1.0
10.0
10.0
-10.0
5.0
5.0
-5.0
2.0
2.0
-2.0
3.0
3.0
-3.0
4.0
4.0
-4.0
0.2
0.2
-0.2
0.4
0.4
-0.4
0.6
0.6
-0.6
0.8
0.8
-0.8
S11_B0025Swp Max
3GHz
Swp Min
0.8GHz
2 GHzMag 0.5582Ang 120.8 Deg
2 GHzMag 0.6862Ang 106 Deg
S(1,1)
SOURCE
S(3,3)
SOURCE
S(4,4)SOURCE
L=0.5 nH
RINCp
Lbond CIN
ZIN
Lp
Figure 1. NPTB00025 Input Impedance Comparison ZO=10Ω and Equivalent Circuit Model
2.2. Output Impedance
The output impedance of GaN devices can be modeled identically to other FETs such as LDMOS or GaAs. The common model for the output of a device (conjugate of optimum load impedance presented to the device leads) is shown in Figure 2 for the NPT25100.
0 1.0
1.0
-1.0
10.0
10.0
-10.0
5.0
5.0
-5.0
2.0
2.0
-2.0
3.0
3.0
-3.0
4.0
4.0
-4.0
0.2
0.2
-0.2
0.4
0.4
-0.4
0.6
0.6
-0.6
0.8
0.8
-0.8
ZloadSwp Max
2.6GHz
Swp Min
1.8GHz
S(1,1)
LOAD
S(2,2)
LOAD
ID=EN5
RL Cp
Lbond
Cds
ZOUTLp
Figure 2. NPT25100 Conjugate of ZL measured at ~100W output Compared to Equivalent Circuit
Model, ZO=10Ω Frequency range 1.8 to 2.6GHz
For current 28V NRF1 based Nitronex devices the following parameters can be used: CDS ≈ 0.16 to 0.20pF per W
RL ≈ 500 Ω.W Lbondwire ≈ 0.1-0.5nH LP ≈ 0.1-0.3nH CP ≈ 1.0-4.2pF
APPLICATION NOTE AN-010
NITRONEX CORPORATION 5 JUNE 2008
3. Stability
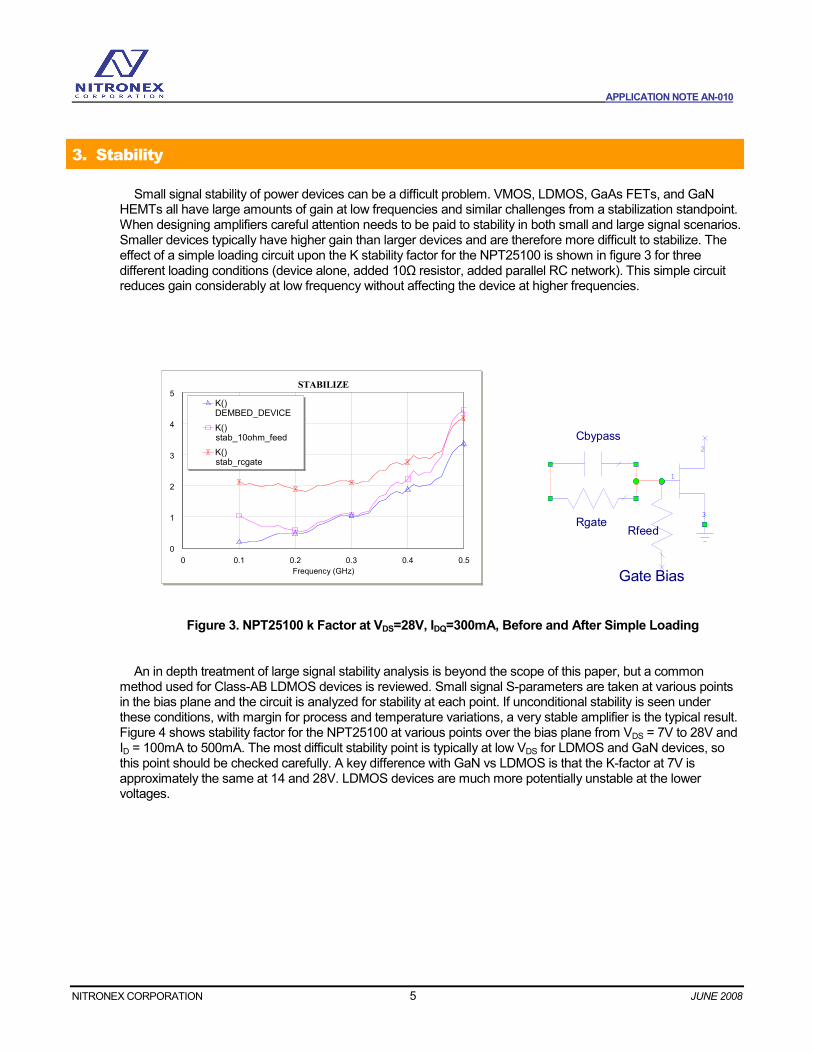
Small signal stability of power devices can be a difficult problem. VMOS, LDMOS, GaAs FETs, and GaN HEMTs all have large amounts of gain at low frequencies and similar challenges from a stabilization standpoint. When designing amplifiers careful attention needs to be paid to stability in both small and large signal scenarios. Smaller devices typically have higher gain than larger devices and are therefore more difficult to stabilize. The effect of a simple loading circuit upon the K stability factor for the NPT25100 is shown in figure 3 for three different loading conditions (device alone, added 10Ω resistor, added parallel RC network). This simple circuit reduces gain considerably at low frequency without affecting the device at higher frequencies.
0 0.1 0.2 0.3 0.4 0.5
Frequency (GHz)
STABILIZE
0
1
2
3
4
5
K()DEMBED_DEVICE
K()stab_10ohm_feed
K()stab_rcgate
1
2
3
Rfeed
Cbypass
Rgate
Gate Bias
Figure 3. NPT25100 k Factor at VDS=28V, IDQ=300mA, Before and After Simple Loading An in depth treatment of large signal stability analysis is beyond the scope of this paper, but a common
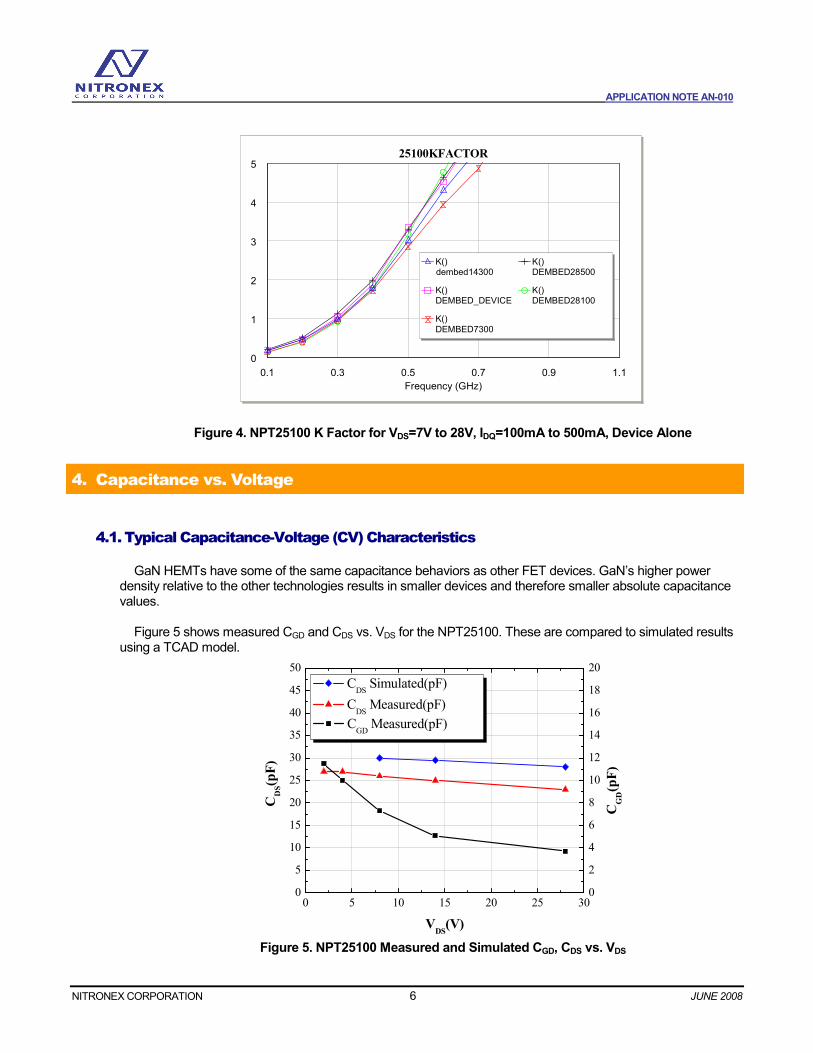
method used for Class-AB LDMOS devices is reviewed. Small signal S-parameters are taken at various points in the bias plane and the circuit is analyzed for stability at each point. If unconditional stability is seen under these conditions, with margin for process and temperature variations, a very stable amplifier is the typical result. Figure 4 shows stability factor for the NPT25100 at various points over the bias plane from VDS = 7V to 28V and ID = 100mA to 500mA. The most difficult stability point is typically at low VDS for LDMOS and GaN devices, so this point should be checked carefully. A key difference with GaN vs LDMOS is that the K-factor at 7V is approximately the same at 14 and 28V. LDMOS devices are much more potentially unstable at the lower voltages.
APPLICATION NOTE AN-010
NITRONEX CORPORATION 6 JUNE 2008
0.1 0.3 0.5 0.7 0.9 1.1
Frequency (GHz)
25100KFACTOR
0
1
2
3
4
5
K()dembed14300
K()DEMBED_DEVICE
K()
DEMBED7300
K()DEMBED28500
K()DEMBED28100
Figure 4. NPT25100 K Factor for VDS=7V to 28V, IDQ=100mA to 500mA, Device Alone
4. Capacitance vs. Voltage
4.1. Typical Capacitance-Voltage (CV) Characteristics
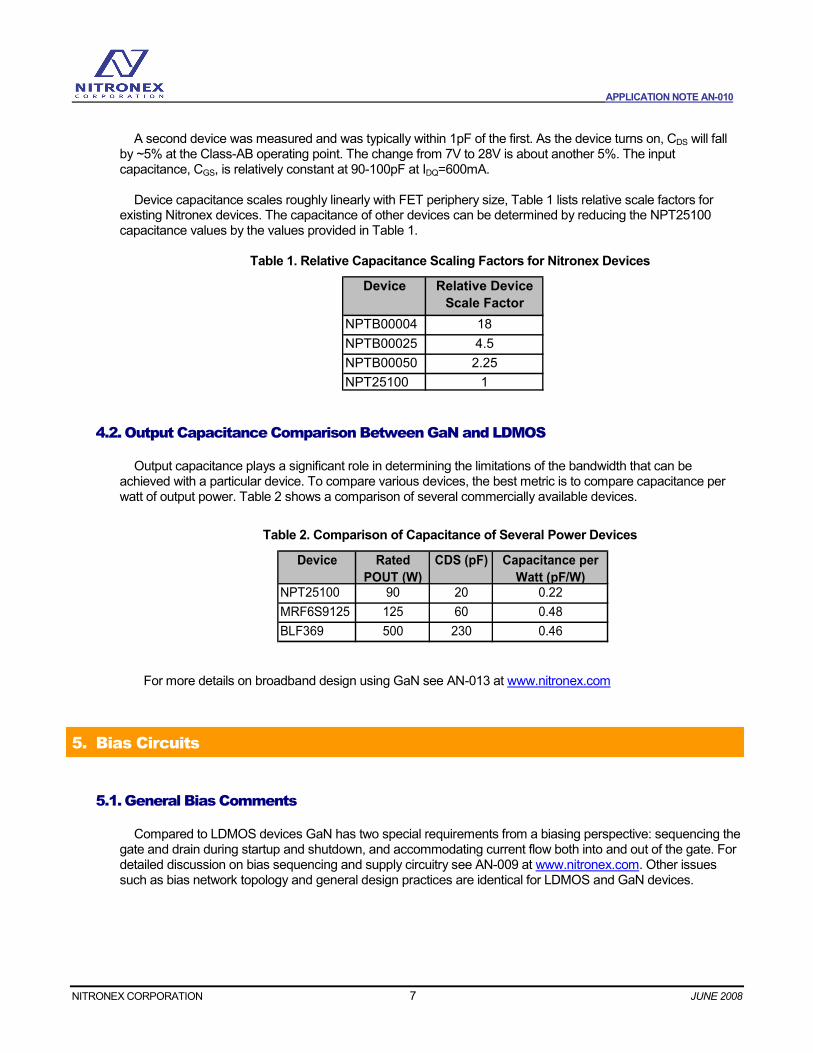
GaN HEMTs have some of the same capacitance behaviors as other FET devices. GaN’s higher power density relative to the other technologies results in smaller devices and therefore smaller absolute capacitance values. Figure 5 shows measured CGD and CDS vs. VDS for the NPT25100. These are compared to simulated results
using a TCAD model.
0 5 10 15 20 25 300
5
10
15
20
25
30
35
40
45
50
0
2
4
6
8
10
12
14
16
18
20
CDS Simulated(pF)
CDS Measured(pF)
CDS(pF)
VDS(V)
CGD(pF)
CGD Measured(pF)
Figure 5. NPT25100 Measured and Simulated CGD, CDS vs. VDS
APPLICATION NOTE AN-010
NITRONEX CORPORATION 7 JUNE 2008
A second device was measured and was typically within 1pF of the first. As the device turns on, CDS will fall
by ~5% at the Class-AB operating point. The change from 7V to 28V is about another 5%. The input capacitance, CGS, is relatively constant at 90-100pF at IDQ=600mA. Device capacitance scales roughly linearly with FET periphery size, Table 1 lists relative scale factors for
existing Nitronex devices. The capacitance of other devices can be determined by reducing the NPT25100 capacitance values by the values provided in Table 1.
Table 1. Relative Capacitance Scaling Factors for Nitronex Devices
Device Relative Device
Scale Factor
NPTB00004 18
NPTB00025 4.5
NPTB00050 2.25
NPT25100 1
4.2. Output Capacitance Comparison Between GaN and LDMOS
Output capacitance plays a significant role in determining the limitations of the bandwidth that can be achieved with a particular device. To compare various devices, the best metric is to compare capacitance per watt of output power. Table 2 shows a comparison of several commercially available devices.
Table 2. Comparison of Capacitance of Several Power Devices
Device Rated
POUT (W)
CDS (pF) Capacitance per
Watt (pF/W)NPT25100 90 20 0.22
MRF6S9125 125 60 0.48
BLF369 500 230 0.46
For more details on broadband design using GaN see AN-013 at www.nitronex.com
5. Bias Circuits
5.1. General Bias Comments
Compared to LDMOS devices GaN has two special requirements from a biasing perspective: sequencing the gate and drain during startup and shutdown, and accommodating current flow both into and out of the gate. For detailed discussion on bias sequencing and supply circuitry see AN-009 at www.nitronex.com. Other issues such as bias network topology and general design practices are identical for LDMOS and GaN devices.
APPLICATION NOTE AN-010
NITRONEX CORPORATION 8 JUNE 2008
5.2. Gate Bias
Gate bias circuits for GaN devices are best implemented with a resistor feeding the gate. As a rule of thumb for Nitronex NRF1 devices at 28V, RG ≈ 1kΩ·W, so a 10Ω resistor would be used with a 100W device. For the NPTB0004, 100Ω is the maximum value that should be used. As with other power devices, this resistor can affect stability and should be taken into account in that analysis.
5.3. Drain Bias
Standard bias decoupling circuits used with other power devices can be used with GaN. Quarter wave lines with capacitive shorts are typical for larger devices to minimize loss. The same precautions used with LDMOS should be used with GaN to address bias line video bandwidth if required.
6. Thermal Precauations
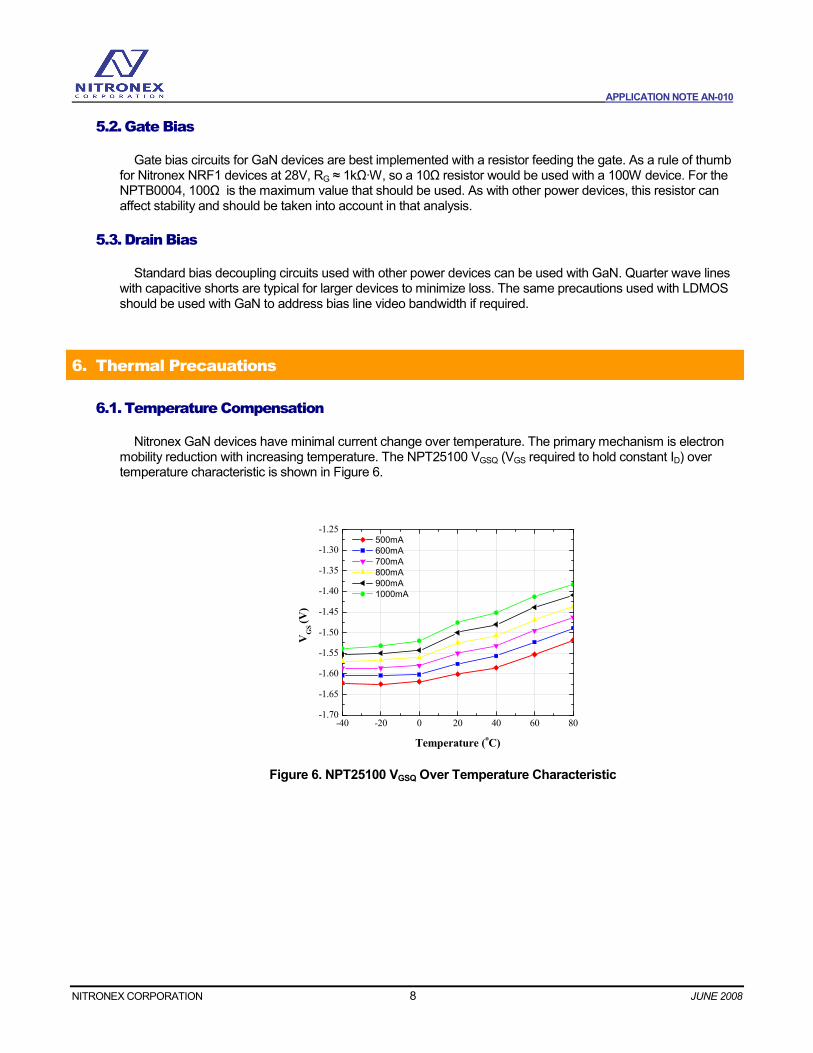
6.1. Temperature Compensation
Nitronex GaN devices have minimal current change over temperature. The primary mechanism is electron mobility reduction with increasing temperature. The NPT25100 VGSQ (VGS required to hold constant ID) over temperature characteristic is shown in Figure 6.
-40 -20 0 20 40 60 80-1.70
-1.65
-1.60
-1.55
-1.50
-1.45
-1.40
-1.35
-1.30
-1.25 500mA
600mA
700mA
800mA
900mA
1000mA
VGS (V)
Temperature (oC)
Figure 6. NPT25100 VGSQ Over Temperature Characteristic
APPLICATION NOTE AN-010
NITRONEX CORPORATION 9 JUNE 2008
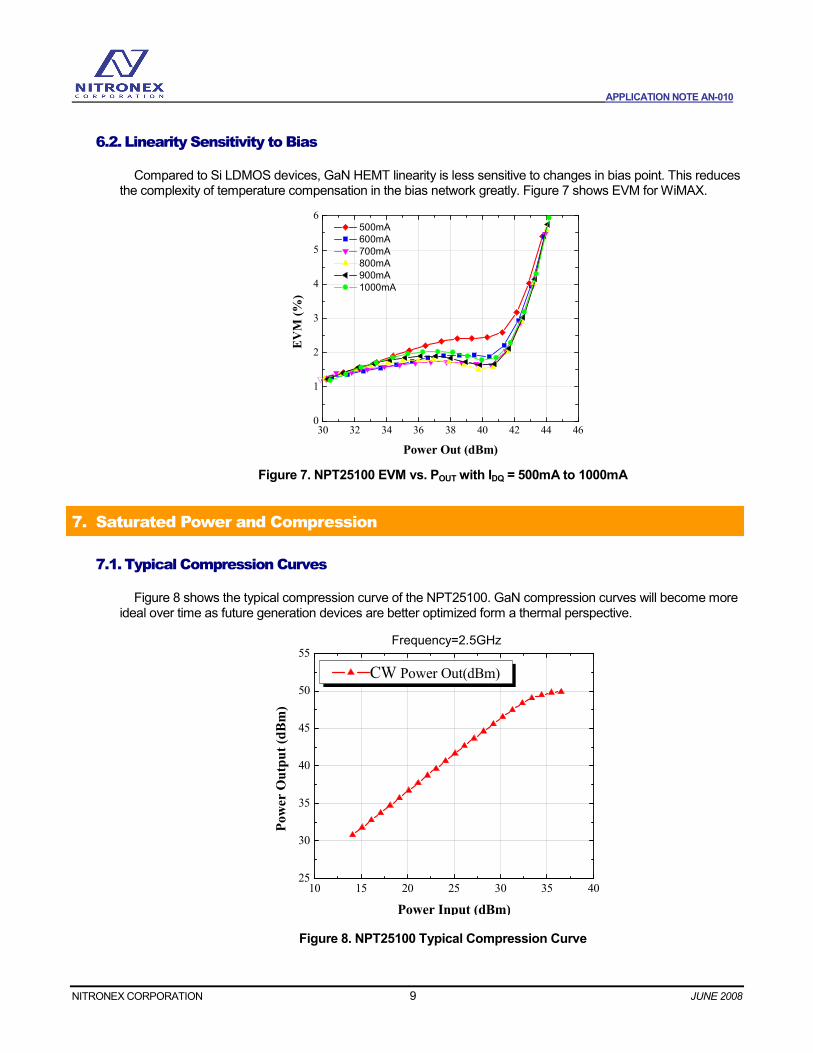
6.2. Linearity Sensitivity to Bias
Compared to Si LDMOS devices, GaN HEMT linearity is less sensitive to changes in bias point. This reduces the complexity of temperature compensation in the bias network greatly. Figure 7 shows EVM for WiMAX.
30 32 34 36 38 40 42 44 460
1
2
3
4
5
6 500mA
600mA
700mA
800mA
900mA
1000mA
EVM (%)
Power Out (dBm)
Figure 7. NPT25100 EVM vs. POUT with IDQ = 500mA to 1000mA
7. Saturated Power and Compression
7.1. Typical Compression Curves
Figure 8 shows the typical compression curve of the NPT25100. GaN compression curves will become more ideal over time as future generation devices are better optimized form a thermal perspective.
10 15 20 25 30 35 4025
30
35
40
45
50
55
CW Power Out(dBm)
Power Output (dBm)
Power Input (dBm)
Frequency=2.5GHz
Figure 8. NPT25100 Typical Compression Curve
APPLICATION NOTE AN-010
NITRONEX CORPORATION 10 JUNE 2008
In pulsed or other high peak to average applications where self heating does not contribute, this compression
curve can look much more ideal, with a sharper roll-off at saturation. Another point of comparison is IM3 at P1dB.Table 3 shows P1dB, P3dB, and PEP at -30dBc IM3 for a few commercially available LDMOS and Nitronex GaN devices.
Table 3. Comparison of P1dB, P3dB, and PEP @ -30dBc IM3 for LDMOS and GaN Devices
Device P1dB (W) P3dB (W) PEP @ -30dBc IM3 (W)
NPT25100 70 90 95
MRF5S9100 117 143 100
MRF6S9125 140 173 125
While it is difficult to make a blanket statement that holds across all devices, it is generally a more equal comparison of GaN P3dB to LDMOS P1dB than to compare the same compression point on both technologies.
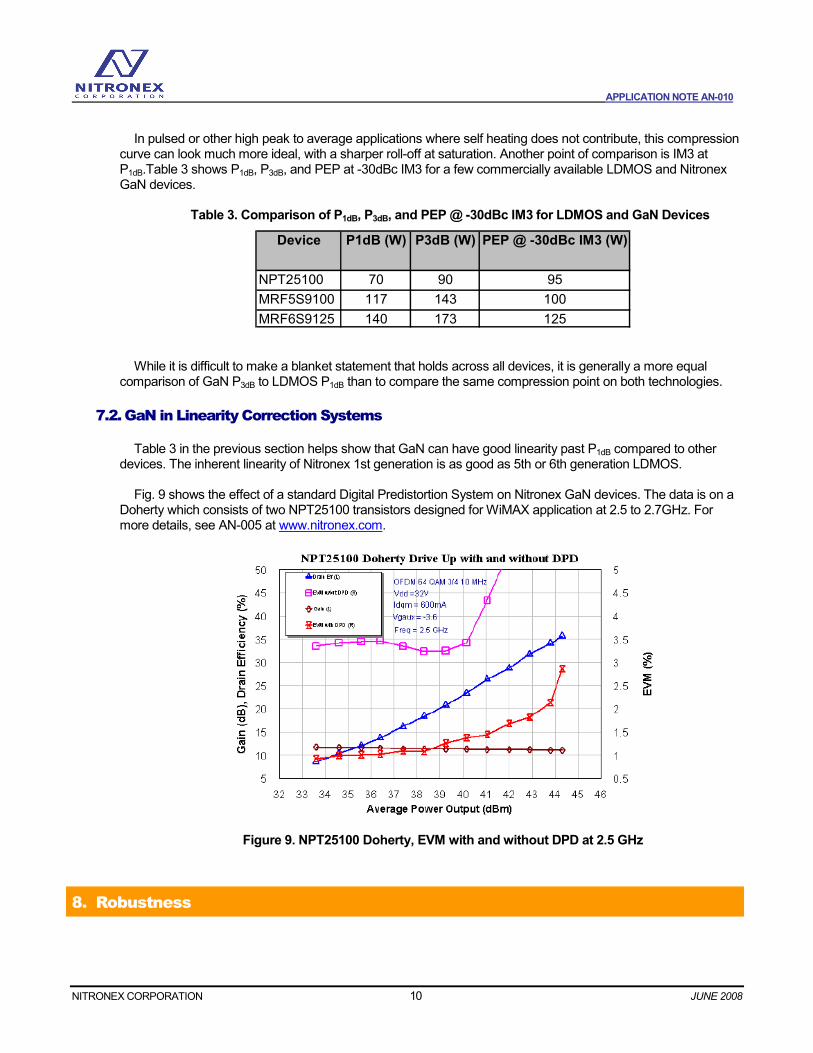
7.2. GaN in Linearity Correction Systems
Table 3 in the previous section helps show that GaN can have good linearity past P1dB compared to other devices. The inherent linearity of Nitronex 1st generation is as good as 5th or 6th generation LDMOS. Fig. 9 shows the effect of a standard Digital Predistortion System on Nitronex GaN devices. The data is on a
Doherty which consists of two NPT25100 transistors designed for WiMAX application at 2.5 to 2.7GHz. For more details, see AN-005 at www.nitronex.com.
Figure 9. NPT25100 Doherty, EVM with and without DPD at 2.5 GHz
8. Robustness
APPLICATION NOTE AN-010
NITRONEX CORPORATION 11 JUNE 2008
8.1. Output VSWR Testing
Nitronex application note AN-004 (available at www.nitronex.com) describes stress testing of the NPTB00050 device operated at P3dB and subjected to 10:1 and 20:1 output VSWR conditions. Qualification testing of Nitronex transistors included stressing devices with 10:1 VSWR mismatch, however in order to meet more stringent customer requirements characterization has been extended to a higher mismatch condition of 20:1. Ten different NPTB00050’s were subjected to a 10:1 and 20:1 VSWR condition while operating at P3dB. No
hard failures were observed on any of the 10 devices and no significant change in small signal gain, DE, or P3dB was observed. The largest power drop from initial to post 20:1 VSWR is ~0.5dB in P3dB with a median change of ~0.3dB. The test was repeated and no additional shift was seen in the devices. The NPTB00050 device has demonstrated to be a very robust RF transistor which is capable of operating
into high mismatch conditions and then continuing to deliver good RF performance.
9. Maximum RF Drive
For CW applications, GaN users may want to operate the device above P1dB. An RF life test was performed on 12 NPT25100 devices. These devices were tested at 3dB compression of ~50W out and a junction temperature of 200°C. All 12 devices showed maximum degradation <0.25dB after 500 hours. Gate current was negative for all of these devices during the test. For these devices to be used past the 1dB compression point, there are 3 criteria that need to be considered:
Junction temperature, gate current, and device variation over process and temperature. At maximum output power, dissipated power is also at a maximum. Junction temperature should always be
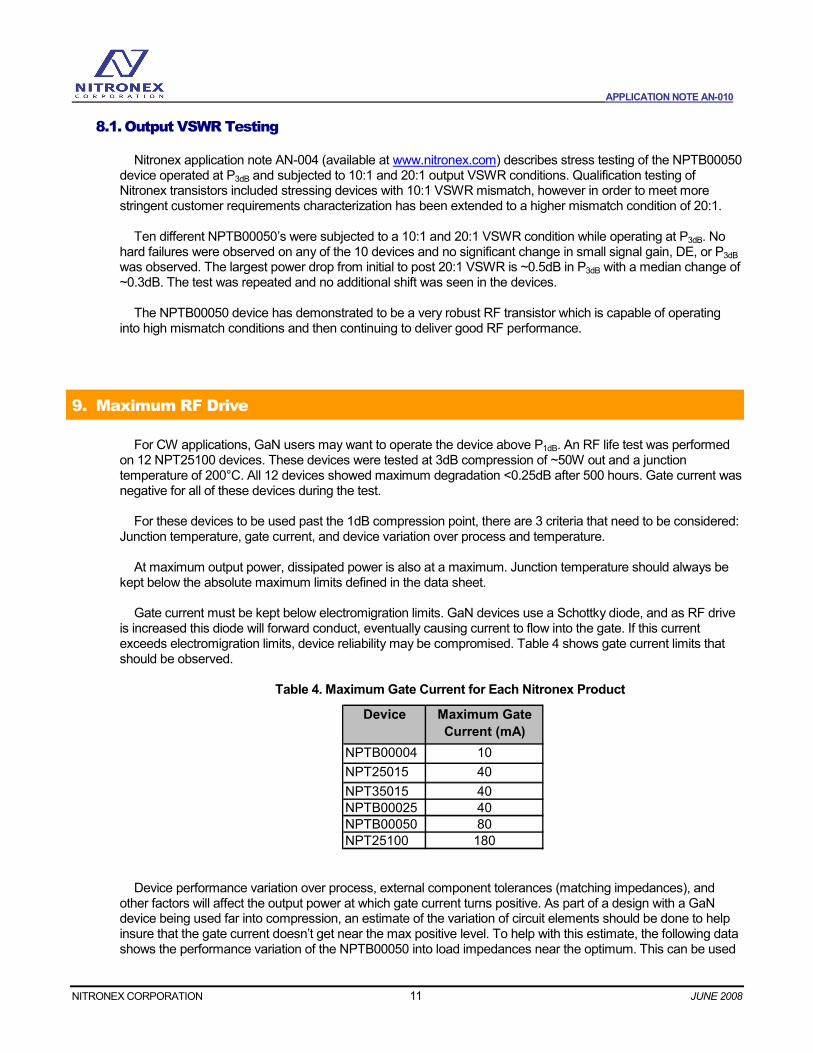
kept below the absolute maximum limits defined in the data sheet. Gate current must be kept below electromigration limits. GaN devices use a Schottky diode, and as RF drive
is increased this diode will forward conduct, eventually causing current to flow into the gate. If this current exceeds electromigration limits, device reliability may be compromised. Table 4 shows gate current limits that should be observed.
Table 4. Maximum Gate Current for Each Nitronex Product
Device Maximum Gate
Current (mA)
NPTB00004 10
NPT25015 40
NPT35015 40
NPTB00025 40
NPTB00050 80
NPT25100 180
Device performance variation over process, external component tolerances (matching impedances), and other factors will affect the output power at which gate current turns positive. As part of a design with a GaN device being used far into compression, an estimate of the variation of circuit elements should be done to help insure that the gate current doesn’t get near the max positive level. To help with this estimate, the following data shows the performance variation of the NPTB00050 into load impedances near the optimum. This can be used
APPLICATION NOTE AN-010
NITRONEX CORPORATION 12 JUNE 2008
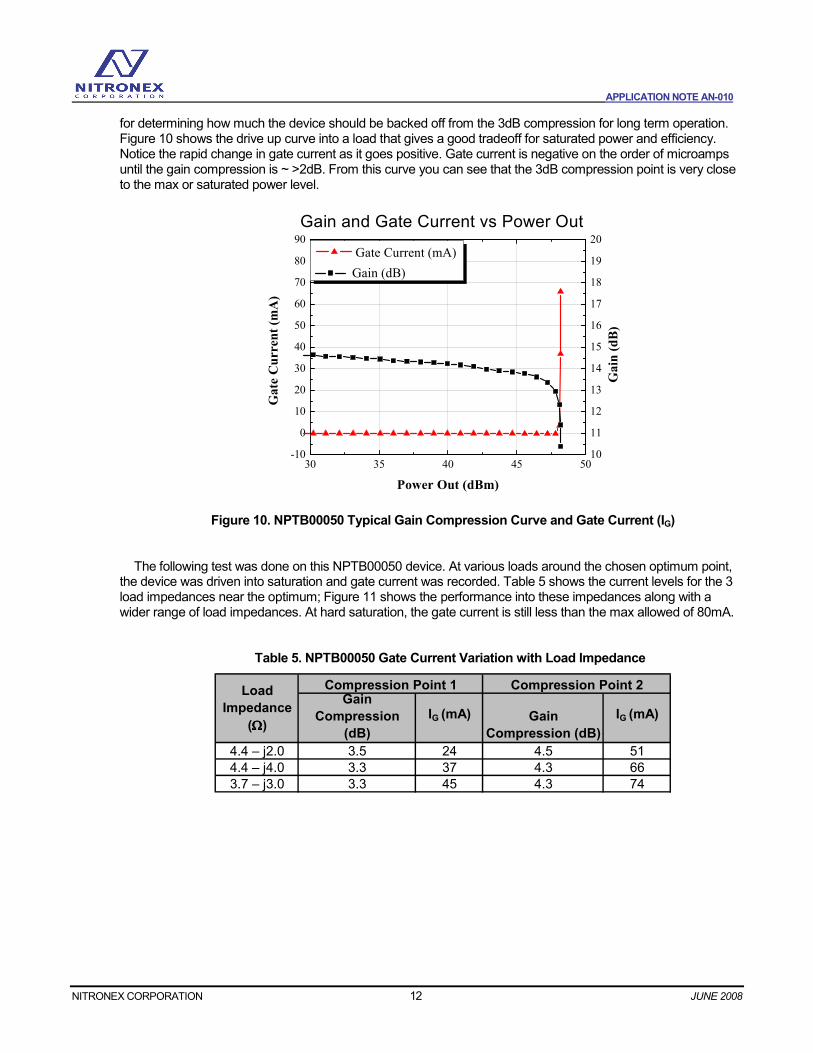
for determining how much the device should be backed off from the 3dB compression for long term operation. Figure 10 shows the drive up curve into a load that gives a good tradeoff for saturated power and efficiency. Notice the rapid change in gate current as it goes positive. Gate current is negative on the order of microamps until the gain compression is ~ >2dB. From this curve you can see that the 3dB compression point is very close to the max or saturated power level.
30 35 40 45 50-10
0
10
20
30
40
50
60
70
80
90
10
11
12
13
14
15
16
17
18
19
20
Gate Current (mA)
Gate Curren
t (m
A)
Power Out (dBm)
Gain and Gate Current vs Power Out
Gain (dB)
Gain (dB)
Figure 10. NPTB00050 Typical Gain Compression Curve and Gate Current (IG)
The following test was done on this NPTB00050 device. At various loads around the chosen optimum point,
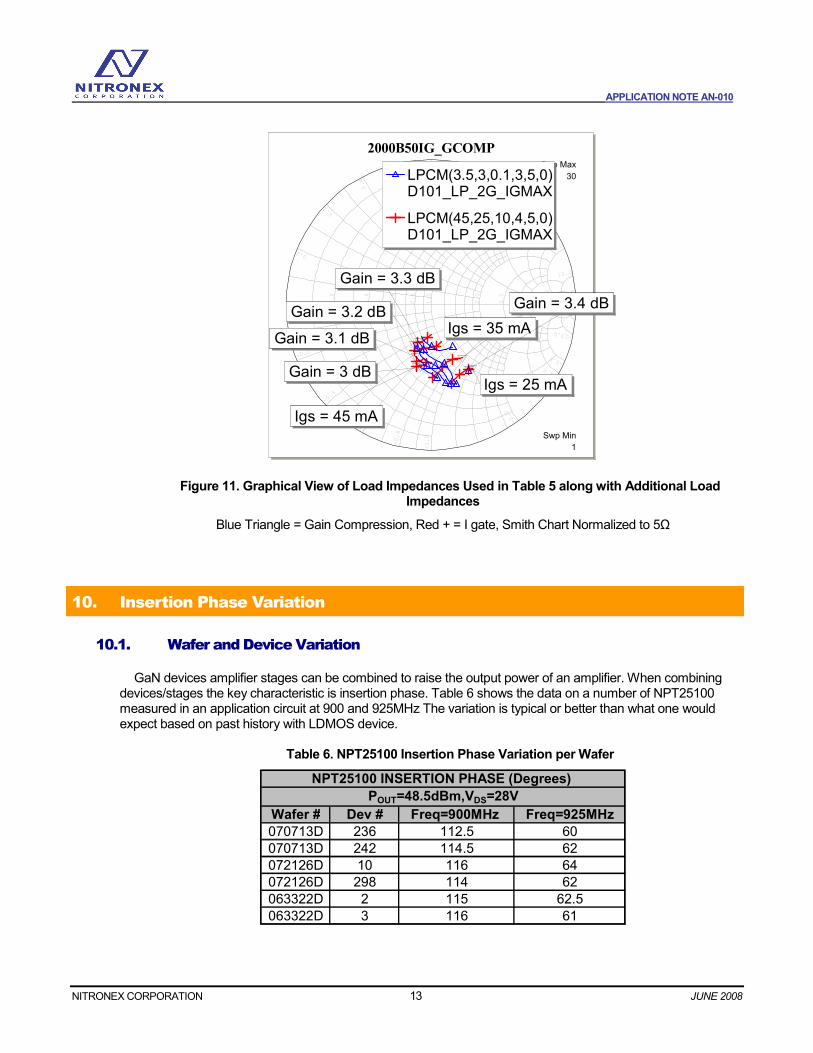
the device was driven into saturation and gate current was recorded. Table 5 shows the current levels for the 3 load impedances near the optimum; Figure 11 shows the performance into these impedances along with a wider range of load impedances. At hard saturation, the gate current is still less than the max allowed of 80mA.
Table 5. NPTB00050 Gate Current Variation with Load Impedance
IG (mA) IG (mA)
4.4 – j2.0 3.5 24 4.5 51
4.4 – j4.0 3.3 37 4.3 66
3.7 – j3.0 3.3 45 4.3 74
Load
Impedance
(ΩΩΩΩ)
Gain
Compression
(dB)
Compression Point 1 Compression Point 2
Gain
Compression (dB)
APPLICATION NOTE AN-010
NITRONEX CORPORATION 13 JUNE 2008
0 1.0
1.0
-1.0
10.0
10.0
-10.0
5.0
5.0
-5.0
2.0
2.0
-2.0
3.0
3.0
-3.0
4.0
4.0
-4.0
0.2
0.2
-0.2
0.4
0.4
-0.4
0.6
0.6
-0.6
0.8
0.8
-0.8
2000B50IG_GCOMPSwp Max
30
Swp Min
1
Igs = 45 mA
Igs = 35 mA
Igs = 25 mA
Gain = 3.4 dB
Gain = 3.3 dB
Gain = 3.2 dB
Gain = 3.1 dB
Gain = 3 dB
LPCM(3.5,3,0.1,3,5,0)D101_LP_2G_IGMAX
LPCM(45,25,10,4,5,0)D101_LP_2G_IGMAX
Figure 11. Graphical View of Load Impedances Used in Table 5 along with Additional Load
Impedances
Blue Triangle = Gain Compression, Red + = I gate, Smith Chart Normalized to 5Ω
10. Insertion Phase Variation
10.1. Wafer and Device Variation
GaN devices amplifier stages can be combined to raise the output power of an amplifier. When combining devices/stages the key characteristic is insertion phase. Table 6 shows the data on a number of NPT25100 measured in an application circuit at 900 and 925MHz The variation is typical or better than what one would expect based on past history with LDMOS device.
Table 6. NPT25100 Insertion Phase Variation per Wafer
Wafer # Dev # Freq=900MHz Freq=925MHz
070713D 236 112.5 60
070713D 242 114.5 62
072126D 10 116 64
072126D 298 114 62
063322D 2 115 62.5
063322D 3 116 61
NPT25100 INSERTION PHASE (Degrees)
POUT=48.5dBm,VDS=28V
APPLICATION NOTE AN-010
NITRONEX CORPORATION 14 JUNE 2008
10.2. Phase Variation into Compression
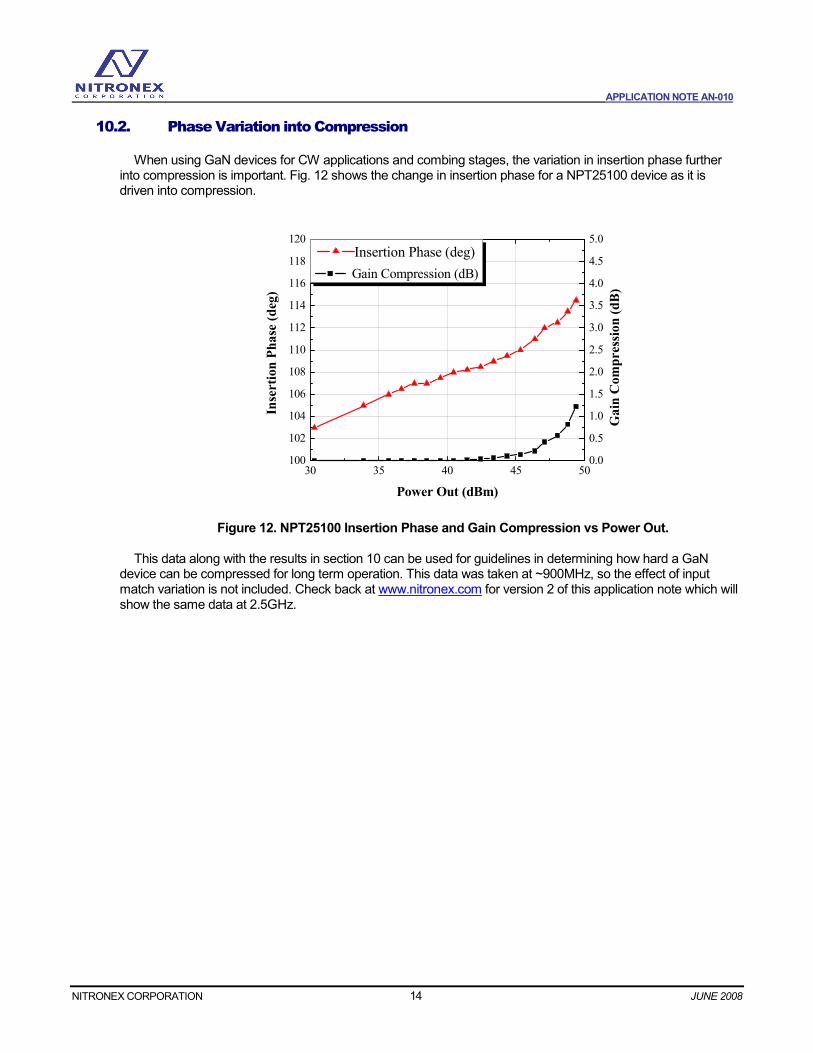
When using GaN devices for CW applications and combing stages, the variation in insertion phase further into compression is important. Fig. 12 shows the change in insertion phase for a NPT25100 device as it is driven into compression.
30 35 40 45 50100
102
104
106
108
110
112
114
116
118
120
0.0
0.5
1.0
1.5
2.0
2.5
3.0
3.5
4.0
4.5
5.0
Insertion Phase (deg)
Insertion Phase (deg)
Power Out (dBm)
Gain Compression (dB)
Gain Compression (dB)
Figure 12. NPT25100 Insertion Phase and Gain Compression vs Power Out.
This data along with the results in section 10 can be used for guidelines in determining how hard a GaN
device can be compressed for long term operation. This data was taken at ~900MHz, so the effect of input match variation is not included. Check back at www.nitronex.com for version 2 of this application note which will show the same data at 2.5GHz.
APPLICATION NOTE AN-010
NITRONEX CORPORATION 15 JUNE 2008
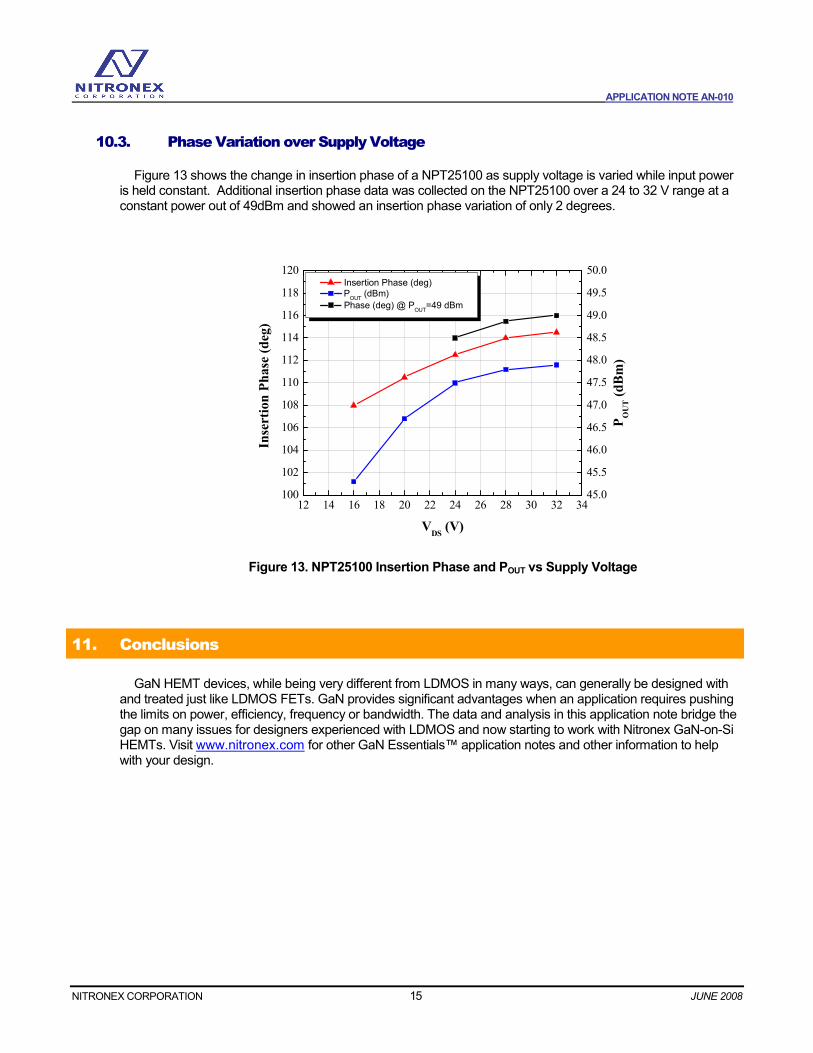
10.3. Phase Variation over Supply Voltage
Figure 13 shows the change in insertion phase of a NPT25100 as supply voltage is varied while input power is held constant. Additional insertion phase data was collected on the NPT25100 over a 24 to 32 V range at a constant power out of 49dBm and showed an insertion phase variation of only 2 degrees.
12 14 16 18 20 22 24 26 28 30 32 34100
102
104
106
108
110
112
114
116
118
120
45.0
45.5
46.0
46.5
47.0
47.5
48.0
48.5
49.0
49.5
50.0 Insertion Phase (deg)
Phase (deg) @ POUT=49 dBm
Insertion Phase (deg)
VDS (V)
POUT (dBm)
POUT (dBm)
Figure 13. NPT25100 Insertion Phase and POUT vs Supply Voltage
11. Conclusions
GaN HEMT devices, while being very different from LDMOS in many ways, can generally be designed with and treated just like LDMOS FETs. GaN provides significant advantages when an application requires pushing the limits on power, efficiency, frequency or bandwidth. The data and analysis in this application note bridge the gap on many issues for designers experienced with LDMOS and now starting to work with Nitronex GaN-on-Si HEMTs. Visit www.nitronex.com for other GaN Essentials™ application notes and other information to help with your design.