Embed Size (px)
Citation preview
Page 1 of 15 Page 1 of 15
APRIL 2018 DRIEHAUS CREDIT COMMENTARY // MARCH 31, 2018 DRIEHAUS ACTIVE INCOME FUND PERFORMANCE SUMMARY
Game of Loans
As I draft this precious document, I look out my windows at the snow falling (yes it’s April 19th) on our office’s castle-like walls. I can’t help but think of the long, hard winter, Winterfell, and that I’ll have to wait another year before seeing Season eight of Game of Thrones. Two years is a long time to wait to hear what happens to the Whitewalkers, or to be mocked by my wife for watching that “nude-y version of Dungeons & Dragons”.
Fortunately in the interim, we get to figure out how to make money in a choppy market to pass the time. We’ve done pretty well in that regard this year, and one big reason is our deci-sion six to nine months ago to shift much of our longs to float-ing rate instruments, with loans comprising the lion’s share of that exposure. There were several reasons why loans appealed to us. In no specific order, they were:
1. Loans typically reside in a secured position at the very top of a corporate capital structure. Since credit spreads were tight, we knew that owning loans would be one effective way to take some of the credit beta out of the portfolio (relative to owning a bond).
2. Since loans have a floating rate coupon, they have much less interest rate exposure to hedge. Given that we were worried about upward pressure on rates, the average duration of less than 0.5 years of loans appealed to us relative to the 4.25 years of duration for high yield bonds and 7.25 years for investment grade bonds.
3. We viewed LIBOR’s steady rise as a nice tailwind for loan investors. The benchmark rate for most loans is three month London inter-bank Offered Rated (LIBOR), which had risen from 1% in January of 2017 to 1.7% by year end. Since most loan coupons are adjusted quarterly, we knew the sharp rise in LIBOR to end 2017 would benefit investors as we headed into 2018.
Sitting here in mid-April and pondering the future, all three of these reasons still hold water. Credit spreads are still tight, we’re still worried about upward pressure on rates, and LIBOR is still rising. Consequently, we still like holding a healthy amount of loans.
Be that as it may, we believe this asset class deserves a few paragraphs of discussion this month. As you know, life is com-plex and multi-faceted. For instance, Jamie Lannister appears to have plenty of evil AND good in him. The Patriots have been a great NFL dynasty, AND have shown a proclivity for cheating, which likely aided their efforts in making this epic run. The Federal Reserve did save us all from another Great Depres-sion by bailing out some of the country’s largest banks during the Credit Crisis, AND likely saved many ill-deserved bankers’ bonuses in doing so. Likewise, loans offer a strong invest-ment opportunity in a market ripe with risks, yet the asset class shows many of the tell-tale signs of classic late-cycle bad behavior.
DisclosuresThis material is not intended to be relied upon as a forecast or research. The opinions expressed are those of Driehaus Capital Management LLC (“Driehaus”) as of April 19, 2018 and are subject to change at any time due to changes in market or economic conditions. The commentary has not been updated since April 19, 2018 and may not reflect recent market activity.
The information and opinions contained in this material are derived from proprietary and non-proprietary sources deemed by Driehaus to be reliable and are not necessarily all inclusive. Driehaus does not guarantee the accuracy or completeness of this information. There is no guarantee that any forecasts made will come to pass. Reliance upon information in this material is at the sole discretion of the reader.
@DriehausCapital
Page 2 of 15 Page 3 of 15
First, I’ll be brief with the positives.
The Loan Index currently yields approximately 5.1%, which is only 86 basis points less than the High Yield Index. Over the past five years, the average spread differential between the two is approximately 110 basis points. (Exhibit 1)
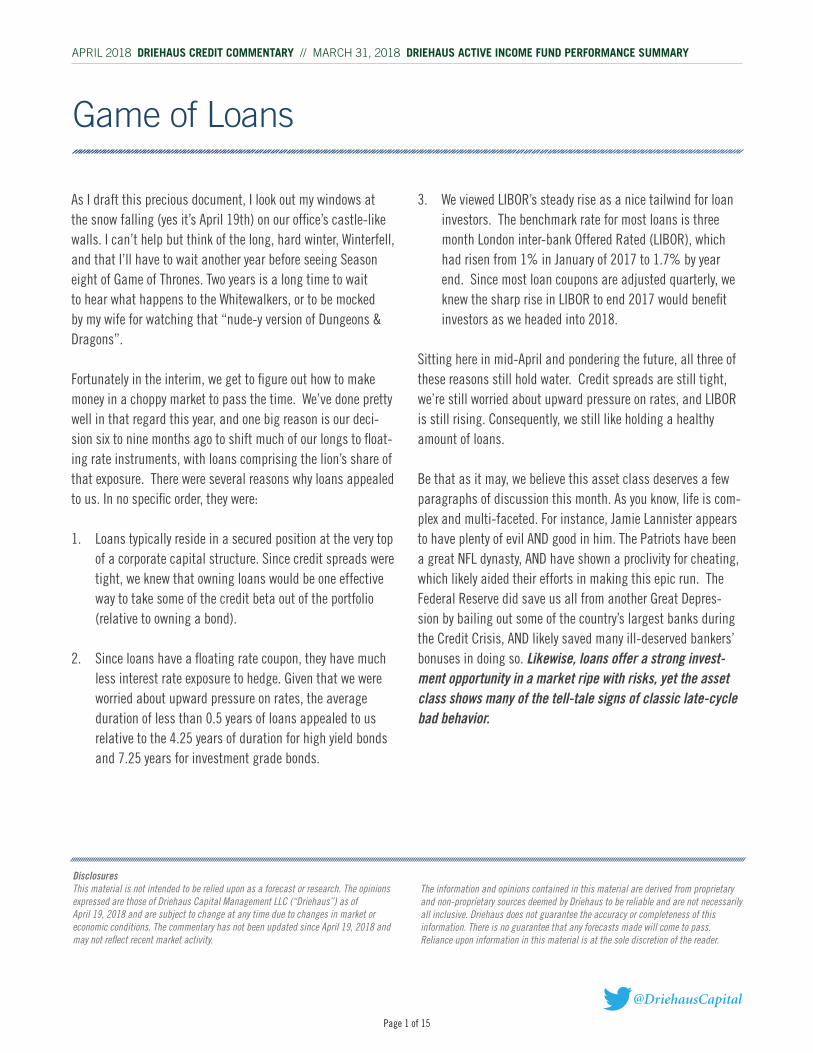
86 basis points seems like an awfully skinny pick-up to me for moving from the secured position of a capital structure to an unsecured position, particularly given that credit spreads are tight. You see, loans are often callable at par with little to no call protection. High yield bonds on the other hand, can have several years of call protection and call prices several points above par. So, one positive of high yield bonds over loans is the capital appreciation argument. If you believe that credit spreads are going tighter (resulting in higher bond prices) and/or risk-free rates are going lower (resulting in higher bond prices), then owning bonds over loans makes sense. But as we’ve said, credit spreads are tight…as in 10 year tights in high yield land. (Exhibit 2) Consequently, we don’t fear the big move lower in credit spreads.
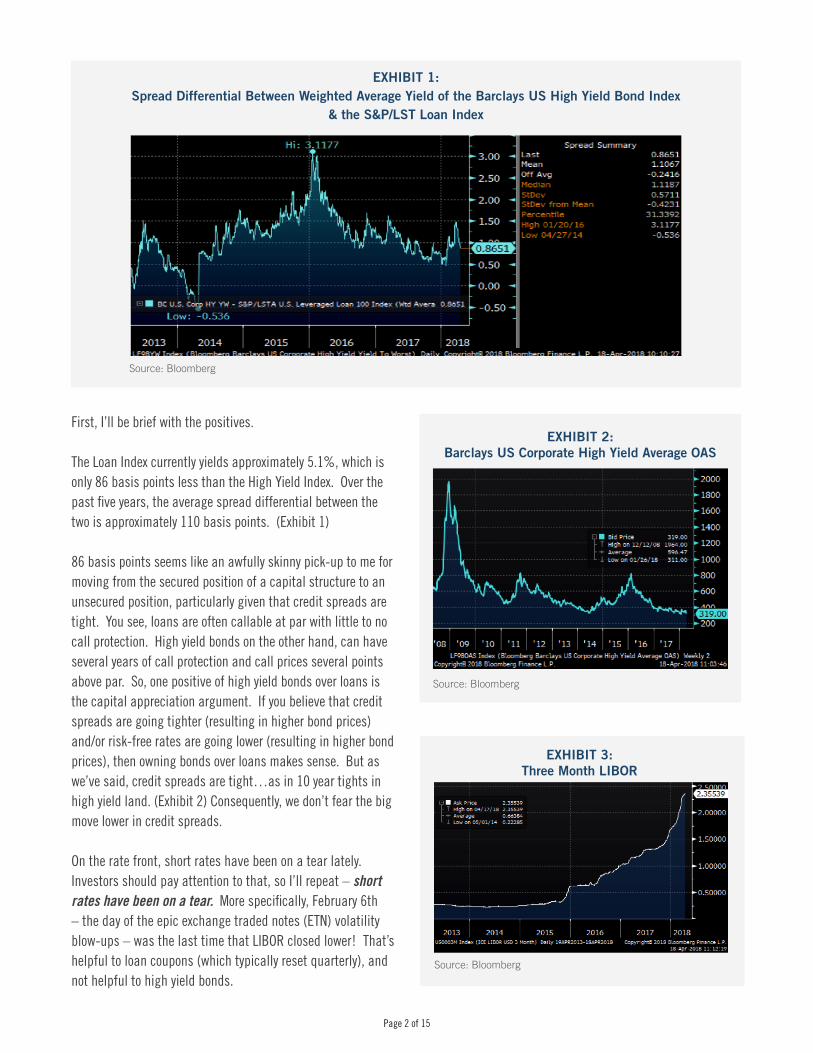
On the rate front, short rates have been on a tear lately. Investors should pay attention to that, so I’ll repeat – short rates have been on a tear. More specifically, February 6th – the day of the epic exchange traded notes (ETN) volatility blow-ups – was the last time that LIBOR closed lower! That’s helpful to loan coupons (which typically reset quarterly), and not helpful to high yield bonds.
EXHIBIT 1: Spread Differential Between Weighted Average Yield of the Barclays US High Yield Bond Index
& the S&P/LST Loan Index
Source: Bloomberg
EXHIBIT 2: Barclays US Corporate High Yield Average OAS
Source: Bloomberg
EXHIBIT 3: Three Month LIBOR
Source: Bloomberg
Page 2 of 15 Page 3 of 15
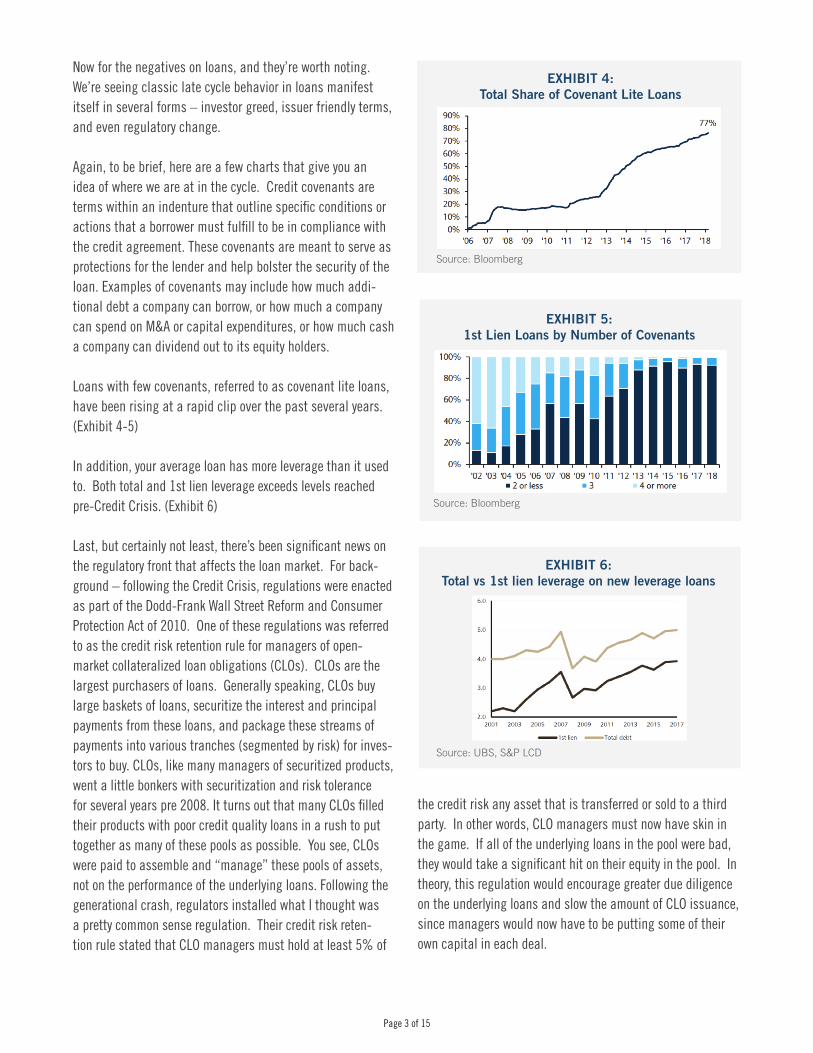
Now for the negatives on loans, and they’re worth noting. We’re seeing classic late cycle behavior in loans manifest itself in several forms – investor greed, issuer friendly terms, and even regulatory change.
Again, to be brief, here are a few charts that give you an idea of where we are at in the cycle. Credit covenants are terms within an indenture that outline specific conditions or actions that a borrower must fulfill to be in compliance with the credit agreement. These covenants are meant to serve as protections for the lender and help bolster the security of the loan. Examples of covenants may include how much addi-tional debt a company can borrow, or how much a company can spend on M&A or capital expenditures, or how much cash a company can dividend out to its equity holders.
Loans with few covenants, referred to as covenant lite loans, have been rising at a rapid clip over the past several years. (Exhibit 4-5)
In addition, your average loan has more leverage than it used to. Both total and 1st lien leverage exceeds levels reached pre-Credit Crisis. (Exhibit 6)
Last, but certainly not least, there’s been significant news on the regulatory front that affects the loan market. For back-ground – following the Credit Crisis, regulations were enacted as part of the Dodd-Frank Wall Street Reform and Consumer Protection Act of 2010. One of these regulations was referred to as the credit risk retention rule for managers of open-market collateralized loan obligations (CLOs). CLOs are the largest purchasers of loans. Generally speaking, CLOs buy large baskets of loans, securitize the interest and principal payments from these loans, and package these streams of payments into various tranches (segmented by risk) for inves-tors to buy. CLOs, like many managers of securitized products, went a little bonkers with securitization and risk tolerance for several years pre 2008. It turns out that many CLOs filled their products with poor credit quality loans in a rush to put together as many of these pools as possible. You see, CLOs were paid to assemble and “manage” these pools of assets, not on the performance of the underlying loans. Following the generational crash, regulators installed what I thought was a pretty common sense regulation. Their credit risk reten-tion rule stated that CLO managers must hold at least 5% of
Source: Bloomberg
EXHIBIT 4: Total Share of Covenant Lite Loans
Source: Bloomberg
EXHIBIT 5: 1st Lien Loans by Number of Covenants
Source: UBS, S&P LCD
EXHIBIT 6: Total vs 1st lien leverage on new leverage loans
the credit risk any asset that is transferred or sold to a third party. In other words, CLO managers must now have skin in the game. If all of the underlying loans in the pool were bad, they would take a significant hit on their equity in the pool. In theory, this regulation would encourage greater due diligence on the underlying loans and slow the amount of CLO issuance, since managers would now have to be putting some of their own capital in each deal.
Page 4 of 15 Page 5 of 15
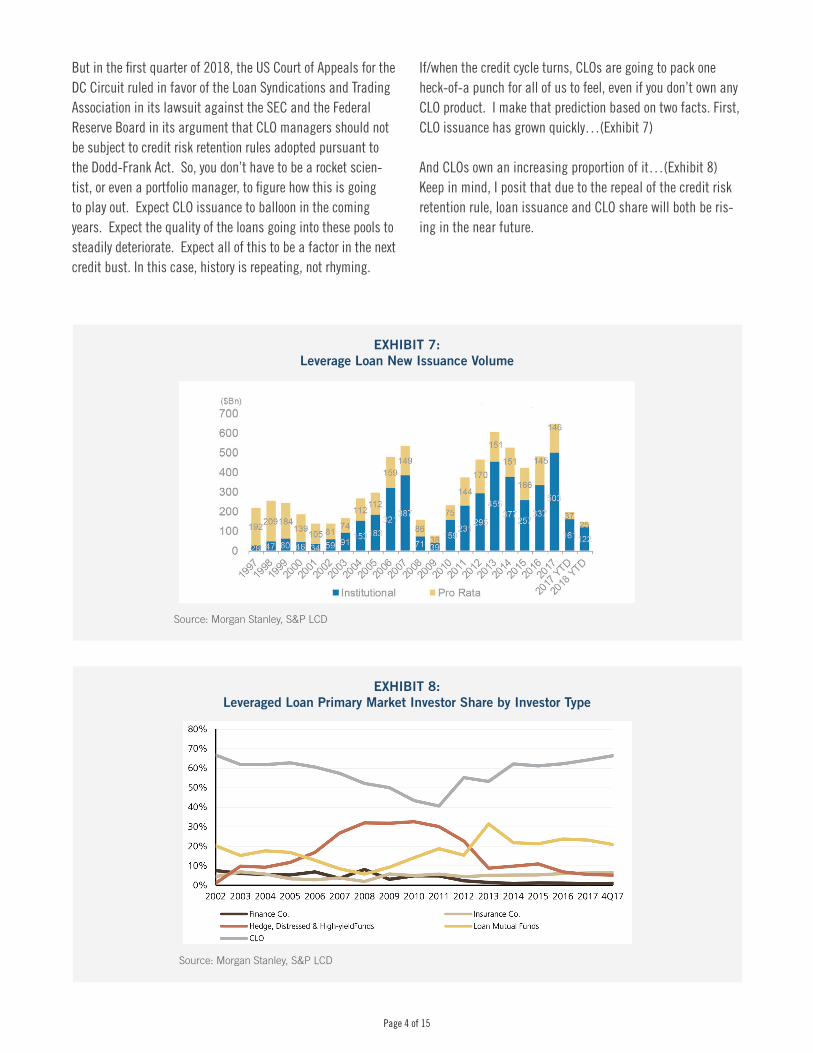
But in the first quarter of 2018, the US Court of Appeals for the DC Circuit ruled in favor of the Loan Syndications and Trading Association in its lawsuit against the SEC and the Federal Reserve Board in its argument that CLO managers should not be subject to credit risk retention rules adopted pursuant to the Dodd-Frank Act. So, you don’t have to be a rocket scien-tist, or even a portfolio manager, to figure how this is going to play out. Expect CLO issuance to balloon in the coming years. Expect the quality of the loans going into these pools to steadily deteriorate. Expect all of this to be a factor in the next credit bust. In this case, history is repeating, not rhyming.
EXHIBIT 7: Leverage Loan New Issuance Volume
Source: Morgan Stanley, S&P LCD
If/when the credit cycle turns, CLOs are going to pack one heck-of-a punch for all of us to feel, even if you don’t own any CLO product. I make that prediction based on two facts. First, CLO issuance has grown quickly…(Exhibit 7)
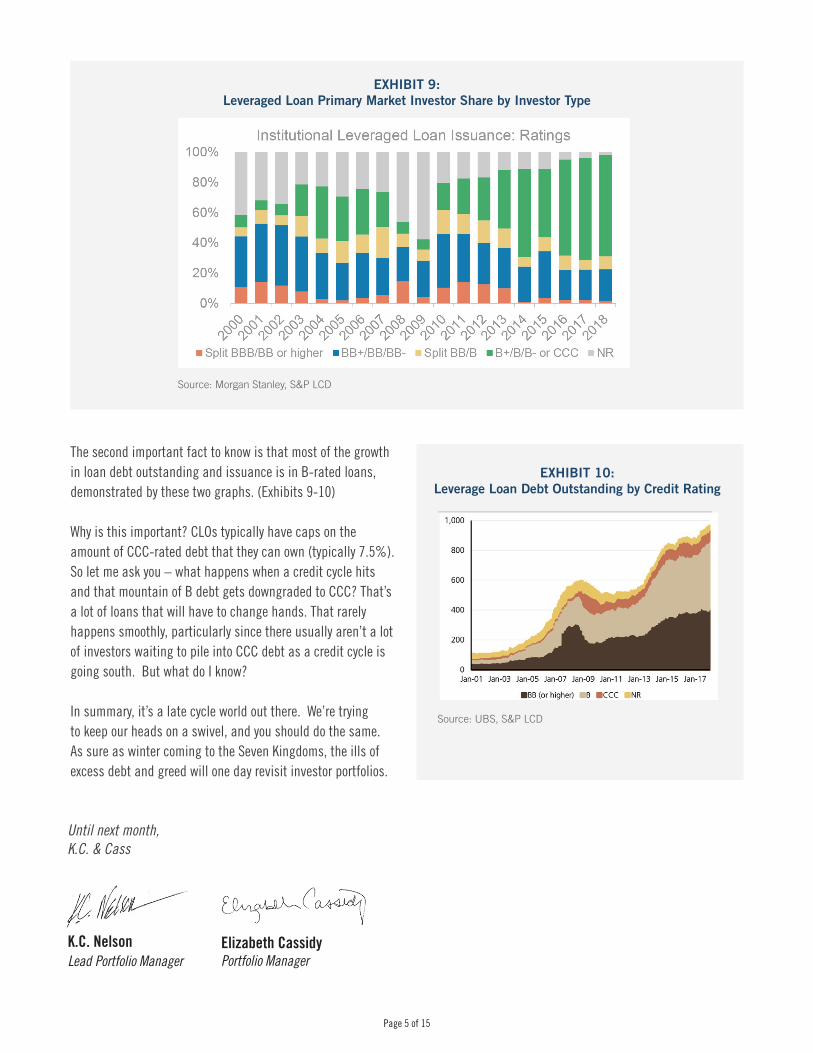
And CLOs own an increasing proportion of it…(Exhibit 8)Keep in mind, I posit that due to the repeal of the credit risk retention rule, loan issuance and CLO share will both be ris-ing in the near future.
EXHIBIT 8: Leveraged Loan Primary Market Investor Share by Investor Type
Source: Morgan Stanley, S&P LCD
Page 4 of 15 Page 5 of 15
K.C. Nelson Lead Portfolio Manager
Elizabeth Cassidy Portfolio Manager
Until next month,K.C. & Cass
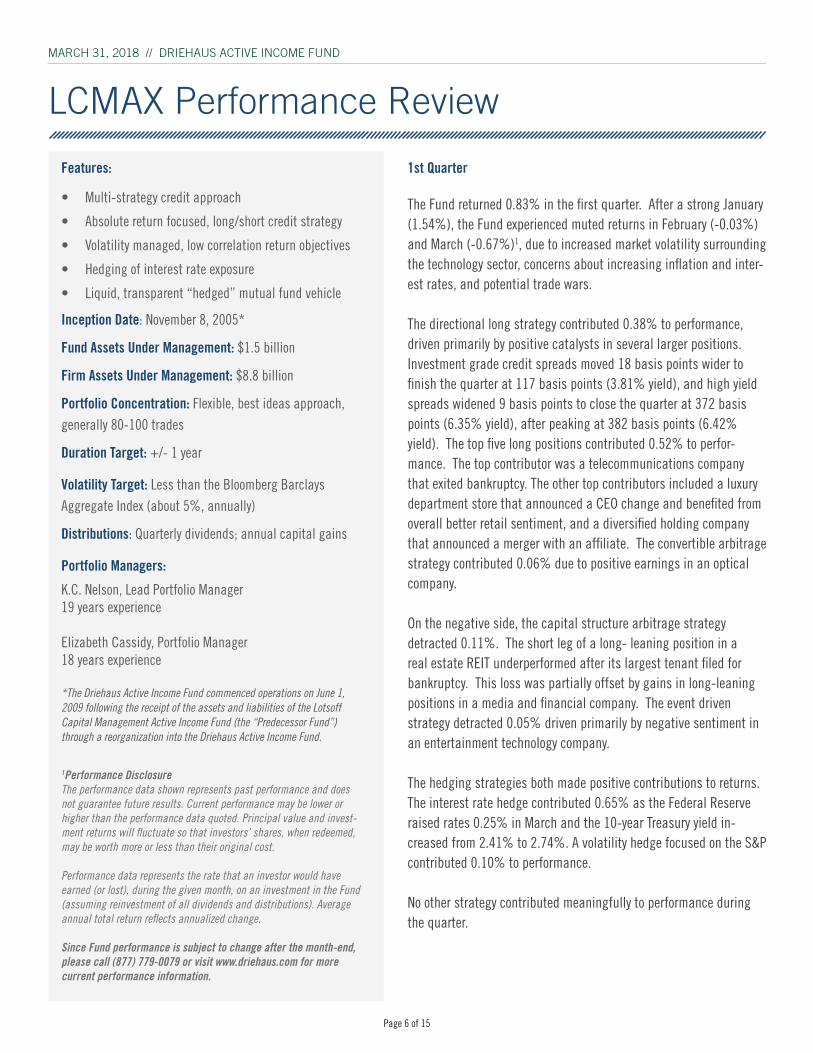
The second important fact to know is that most of the growth in loan debt outstanding and issuance is in B-rated loans, demonstrated by these two graphs. (Exhibits 9-10)
Why is this important? CLOs typically have caps on the amount of CCC-rated debt that they can own (typically 7.5%). So let me ask you – what happens when a credit cycle hits and that mountain of B debt gets downgraded to CCC? That’s a lot of loans that will have to change hands. That rarely happens smoothly, particularly since there usually aren’t a lot of investors waiting to pile into CCC debt as a credit cycle is going south. But what do I know?
In summary, it’s a late cycle world out there. We’re trying to keep our heads on a swivel, and you should do the same. As sure as winter coming to the Seven Kingdoms, the ills of excess debt and greed will one day revisit investor portfolios.
EXHIBIT 10: Leverage Loan Debt Outstanding by Credit Rating
Source: UBS, S&P LCD
EXHIBIT 9: Leveraged Loan Primary Market Investor Share by Investor Type
Source: Morgan Stanley, S&P LCD
Page 6 of 15 Page 7 of 15
1st Quarter
The Fund returned 0.83% in the first quarter. After a strong January (1.54%), the Fund experienced muted returns in February (-0.03%) and March (-0.67%)1, due to increased market volatility surrounding the technology sector, concerns about increasing inflation and inter-est rates, and potential trade wars. The directional long strategy contributed 0.38% to performance, driven primarily by positive catalysts in several larger positions. Investment grade credit spreads moved 18 basis points wider to finish the quarter at 117 basis points (3.81% yield), and high yield spreads widened 9 basis points to close the quarter at 372 basis points (6.35% yield), after peaking at 382 basis points (6.42% yield). The top five long positions contributed 0.52% to perfor-mance. The top contributor was a telecommunications company that exited bankruptcy. The other top contributors included a luxury department store that announced a CEO change and benefited from overall better retail sentiment, and a diversified holding company that announced a merger with an affiliate. The convertible arbitrage strategy contributed 0.06% due to positive earnings in an optical company.
On the negative side, the capital structure arbitrage strategy detracted 0.11%. The short leg of a long- leaning position in a real estate REIT underperformed after its largest tenant filed for bankruptcy. This loss was partially offset by gains in long-leaning positions in a media and financial company. The event driven strategy detracted 0.05% driven primarily by negative sentiment in an entertainment technology company.
The hedging strategies both made positive contributions to returns. The interest rate hedge contributed 0.65% as the Federal Reserve raised rates 0.25% in March and the 10-year Treasury yield in-creased from 2.41% to 2.74%. A volatility hedge focused on the S&P contributed 0.10% to performance. No other strategy contributed meaningfully to performance during the quarter.
LCMAX Performance Review
MARCH 31, 2018 // DRIEHAUS ACTIVE INCOME FUND
Features:
• Multi-strategy credit approach
• Absolute return focused, long/short credit strategy
• Volatility managed, low correlation return objectives
• Hedging of interest rate exposure
• Liquid, transparent “hedged” mutual fund vehicle
Inception Date: November 8, 2005*
Fund Assets Under Management: $1.5 billion
Firm Assets Under Management: $8.8 billion
Portfolio Concentration: Flexible, best ideas approach, generally 80-100 trades
Duration Target: +/- 1 year
Volatility Target: Less than the Bloomberg Barclays Aggregate Index (about 5%, annually)
Distributions: Quarterly dividends; annual capital gains
Portfolio Managers:
K.C. Nelson, Lead Portfolio Manager 19 years experience
Elizabeth Cassidy, Portfolio Manager 18 years experience
*The Driehaus Active Income Fund commenced operations on June 1, 2009 following the receipt of the assets and liabilities of the Lotsoff Capital Management Active Income Fund (the “Predecessor Fund”) through a reorganization into the Driehaus Active Income Fund.
1Performance DisclosureThe performance data shown represents past performance and does not guarantee future results. Current performance may be lower or higher than the performance data quoted. Principal value and invest-ment returns will fluctuate so that investors’ shares, when redeemed, may be worth more or less than their original cost.
Performance data represents the rate that an investor would have earned (or lost), during the given month, on an investment in the Fund (assuming reinvestment of all dividends and distributions). Average annual total return reflects annualized change.
Since Fund performance is subject to change after the month-end, please call (877) 779-0079 or visit www.driehaus.com for more current performance information.
Page 6 of 15 Page 7 of 15
The performance data shown represents past performance and does not guarantee future results. Current performance may be lower or higher than the performance data quoted. Principal value and investment returns will fluctuate so that investors’ shares, when redeemed, may be worth more or less than their original cost. Performance data represents the rate that an investor would have earned (or lost), during the given month, on an investment in the Fund (assuming reinvestment of all dividends and distribu-tions). Average annual total return reflects annualized change. Since Fund performance is subject to change after the month-end, please call (877) 779-0079 or visit www.driehaus.com for more current performance information.
1Inception Date: 11/8/2005. 2The Driehaus Active Income Fund commenced operations on June 1, 2009 following the receipt of the assets and liabilities of the Lotsoff Capital Management Active Income Fund (the “Predecessor Fund”) through a reorganization into the Driehaus Active Income Fund (the “Fund”). Lotsoff Capital Management was the investment adviser from inception through April 2, 2009. Driehaus Capital Management LLC (the “Adviser”) became the interim investment adviser to the Predecessor Fund on April 3, 2009. 3The FTSE 3-Month T-Bill Index is designed to mirror the performance of the 3-Month U.S. Treasury Bill. The FTSE 3-Month T-Bill Index is unmanaged and its returns include reinvested dividends. 4The Bloomberg Barclays Aggregate Index, an unmanaged index, represents securities that are SEC-registered, taxable and dollar denominated. This index covers the U.S. investment grade fixed rate bond market, with index components for government and corporate securities, mortgage pass-through securities and asset-backed securities. These major sectors are subdivided into more specific indices that are calculated and reported on a regular basis. 5Represents the Annual Fund Operating Expenses as disclosed in the current prospectus dated April 30, 2017. It is important to understand that a decline in the Fund’s average net assets due to unprecedented market volatility or other factors could cause the Fund’s expense ratio for the current fiscal year to be higher than the expense information presented.
LCMAX Performance Review
MARCH 31, 2018 // DRIEHAUS ACTIVE INCOME FUND
The Driehaus Active Income Fund (the “Fund”), in addition to investing in unrated and investment grade bonds, may also invest in junk bonds, which involve greater credit risk, including the risk of default. The prices of high yield bonds are more sensitive to chang-ing economic conditions and can fall dramatically in response to negative news about the issuer or its industry, or the economy in general. The use of derivatives involves risks different from, and possibly greater than, the risks associated with investing directly in the underlying assets. Derivatives can be highly volatile, illiquid and difficult to value, and there is a risk that changes in the value of a derivative held by the Fund will not cor-relate with the Fund’s other investments. Further, the Fund may invest in derivatives for speculative purposes. Gains or losses from speculative positions in a derivative may be much greater than the derivative’s original cost and potential losses may be substantial. The Fund may make short sales. Short sales expose the Fund to the risk of loss. It is anticipated that the Fund will experience high rates of portfolio turnover, which may result in payment by the Fund of above-average transaction costs. This is a nondiversi-fied fund; compared to other funds, the Fund may invest a greater percentage of assets in a particular issuer or a small number of issuers. As a consequence, the Fund may be subject to greater risks and larger losses than diversified funds. No investment strategy, including an absolute return strategy, can ensure a profit or protect against loss. Ad-ditionally, investing in an absolute return strategy may lead to underperforming results during an upward moving market. When interest rates increase, bond prices decrease and bond funds become more volatile.
Please consider the investment objectives, risks, fees and expenses of the Fund carefully prior to investing. The prospectus and summary prospectus contain this and other important information about the Fund. To obtain a copy of the prospectus and/or summary prospectus, please call us at (877) 779-0079. Please read the prospectus and summary prospectus carefully before investing.
Driehaus Securities LLC, Distributor
Month-end Performance as of 3/31/18Average Annual Total Return
Fund/Index MTH YTD 1 Year 3 Year 5 Year 10 Year Since Inception1
Driehaus Active Income Fund2 -0.70% 0.81% 1.29% 1.48% 1.40% 3.57% 3.50%
FTSE 3-Month T-Bill Index3 0.13% 0.35% 1.07% 0.49% 0.31% 0.31% 1.11%
Bloomberg Barclays Aggregate Index4 0.64% -1.46% 1.20% 1.20% 1.82% 3.63% 4.16%
Calendar Quarter-end Performance as of 3/31/18
Annual Fund Operating Expenses5
Management Fee 0.55%
Other Expenses Excluding Dividends and Interest on Short Sales
0.25%
Dividends and Interest on Short Sales 0.58%
Total Annual Fund Operating Expenses 1.38%
Average Annual Total Return
Fund/Index QTR YTD 1 Year 3 Year 5 Year 10 Year Since Inception1
Driehaus Active Income Fund2 0.81% 0.81% 1.29% 1.48% 1.40% 3.57% 3.50%
FTSE 3-Month T-Bill Index3 0.35% 0.35% 1.07% 0.49% 0.31% 0.31% 1.11%
Bloomberg Barclays Aggregate Index4 -1.46% -1.46% 1.20% 1.20% 1.82% 3.63% 4.16%
Page 8 of 15 Page 9 of 15
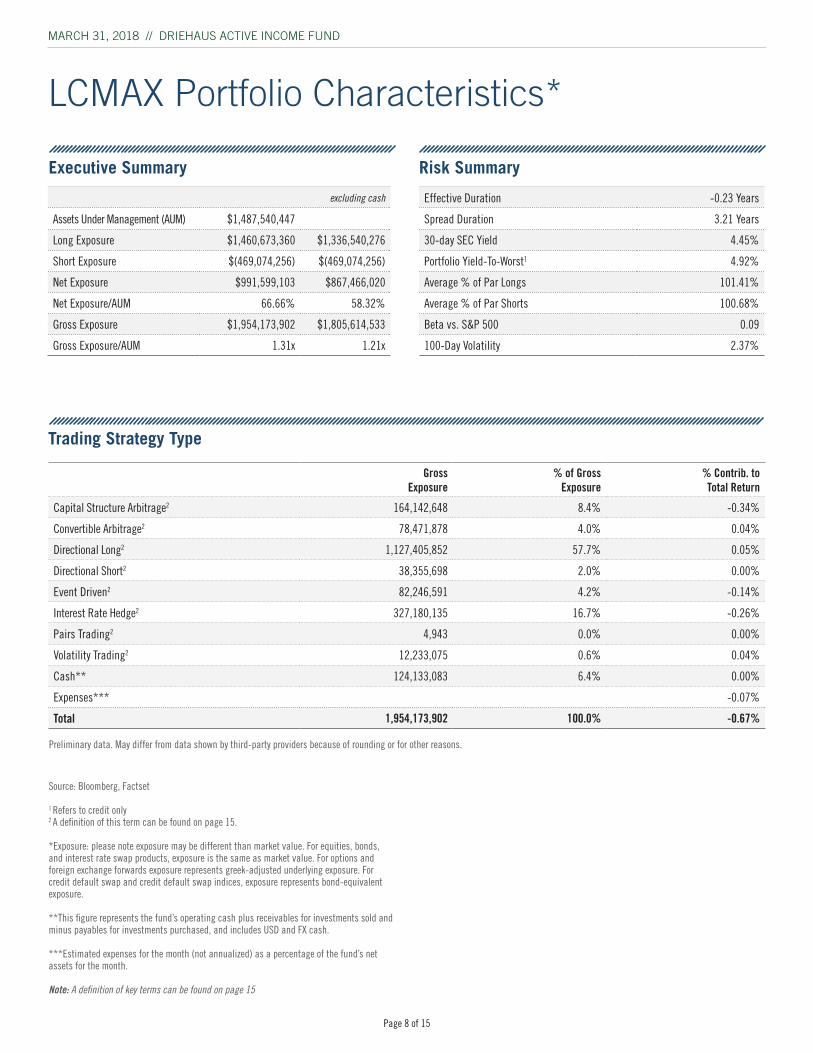
Effective Duration -0.23 Years
Spread Duration 3.21 Years
30-day SEC Yield 4.45%
Portfolio Yield-To-Worst1 4.92%
Average % of Par Longs 101.41%
Average % of Par Shorts 100.68%
Beta vs. S&P 500 0.09
100-Day Volatility 2.37%
Source: Bloomberg, Factset
1 Refers to credit only2 A definition of this term can be found on page 15.
*Exposure: please note exposure may be different than market value. For equities, bonds, and interest rate swap products, exposure is the same as market value. For options and foreign exchange forwards exposure represents greek-adjusted underlying exposure. For credit default swap and credit default swap indices, exposure represents bond-equivalent exposure.
**This figure represents the fund’s operating cash plus receivables for investments sold and minus payables for investments purchased, and includes USD and FX cash.
***Estimated expenses for the month (not annualized) as a percentage of the fund’s net assets for the month.
Note: A definition of key terms can be found on page 15
Gross Exposure
% of Gross Exposure
% Contrib. to Total Return
Capital Structure Arbitrage2 164,142,648 8.4% -0.34%
Convertible Arbitrage2 78,471,878 4.0% 0.04%
Directional Long2 1,127,405,852 57.7% 0.05%
Directional Short2 38,355,698 2.0% 0.00%
Event Driven2 82,246,591 4.2% -0.14%
Interest Rate Hedge2 327,180,135 16.7% -0.26%
Pairs Trading2 4,943 0.0% 0.00%
Volatility Trading2 12,233,075 0.6% 0.04%
Cash** 124,133,083 6.4% 0.00%
Expenses*** -0.07%
Total 1,954,173,902 100.0% -0.67%
LCMAX Portfolio Characteristics*
Executive Summary Risk Summary
MARCH 31, 2018 // DRIEHAUS ACTIVE INCOME FUND
Trading Strategy Type
Preliminary data. May differ from data shown by third-party providers because of rounding or for other reasons.
excluding cash
Assets Under Management (AUM) $1,487,540,447
Long Exposure $1,460,673,360 $1,336,540,276
Short Exposure $(469,074,256) $(469,074,256)
Net Exposure $991,599,103 $867,466,020
Net Exposure/AUM 66.66% 58.32%
Gross Exposure $1,954,173,902 $1,805,614,533
Gross Exposure/AUM 1.31x 1.21x
Page 8 of 15 Page 9 of 15
MARCH 31, 2018 // DRIEHAUS ACTIVE INCOME FUND
Long Exposure
($)
% of Long Exposure
Short Exposure
($)
% of Short Exposure
Gross Exposure
($)
% of Gross Exposure
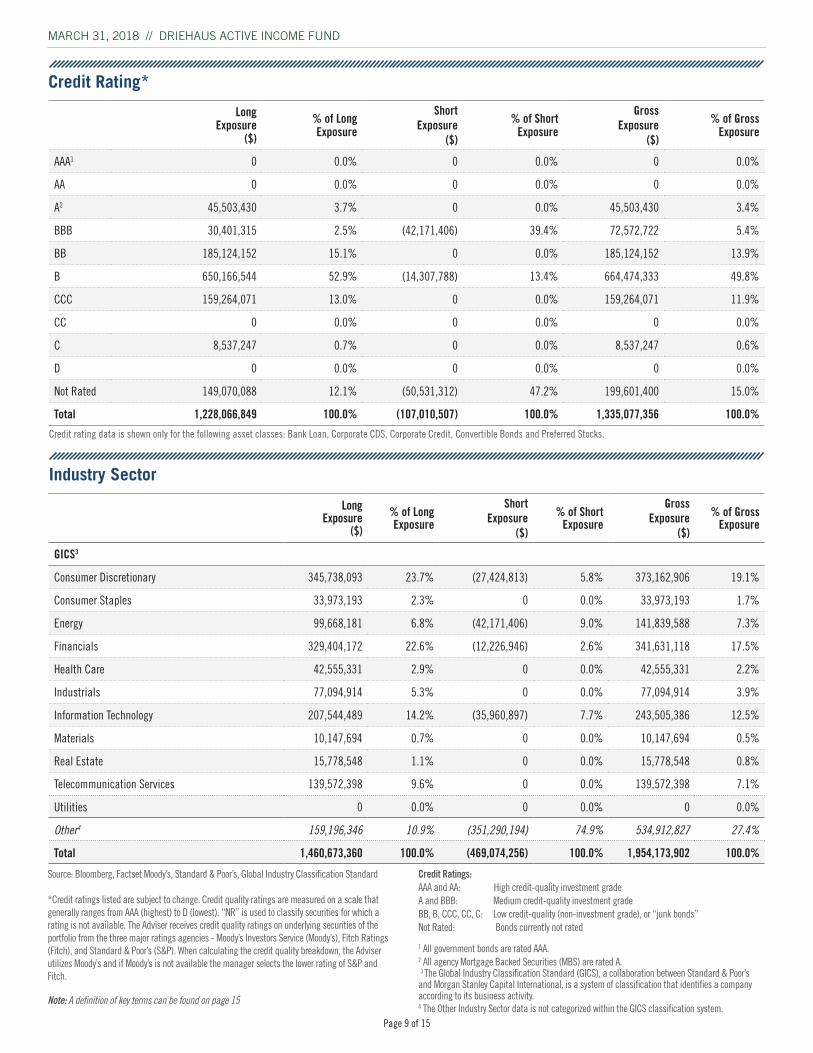
AAA1 0 0.0% 0 0.0% 0 0.0%
AA 0 0.0% 0 0.0% 0 0.0%
A2 45,503,430 3.7% 0 0.0% 45,503,430 3.4%
BBB 30,401,315 2.5% (42,171,406) 39.4% 72,572,722 5.4%
BB 185,124,152 15.1% 0 0.0% 185,124,152 13.9%
B 650,166,544 52.9% (14,307,788) 13.4% 664,474,333 49.8%
CCC 159,264,071 13.0% 0 0.0% 159,264,071 11.9%
CC 0 0.0% 0 0.0% 0 0.0%
C 8,537,247 0.7% 0 0.0% 8,537,247 0.6%
D 0 0.0% 0 0.0% 0 0.0%
Not Rated 149,070,088 12.1% (50,531,312) 47.2% 199,601,400 15.0%
Total 1,228,066,849 100.0% (107,010,507) 100.0% 1,335,077,356 100.0%
Credit Rating*
Long Exposure
($)
% of Long Exposure
Short Exposure
($)
% of Short Exposure
Gross Exposure
($)
% of Gross Exposure
GICS3
Consumer Discretionary 345,738,093 23.7% (27,424,813) 5.8% 373,162,906 19.1%
Consumer Staples 33,973,193 2.3% 0 0.0% 33,973,193 1.7%
Energy 99,668,181 6.8% (42,171,406) 9.0% 141,839,588 7.3%
Financials 329,404,172 22.6% (12,226,946) 2.6% 341,631,118 17.5%
Health Care 42,555,331 2.9% 0 0.0% 42,555,331 2.2%
Industrials 77,094,914 5.3% 0 0.0% 77,094,914 3.9%
Information Technology 207,544,489 14.2% (35,960,897) 7.7% 243,505,386 12.5%
Materials 10,147,694 0.7% 0 0.0% 10,147,694 0.5%
Real Estate 15,778,548 1.1% 0 0.0% 15,778,548 0.8%
Telecommunication Services 139,572,398 9.6% 0 0.0% 139,572,398 7.1%
Utilities 0 0.0% 0 0.0% 0 0.0%
Other4 159,196,346 10.9% (351,290,194) 74.9% 534,912,827 27.4%
Total 1,460,673,360 100.0% (469,074,256) 100.0% 1,954,173,902 100.0%
Industry Sector
Source: Bloomberg, Factset Moody’s, Standard & Poor’s, Global Industry Classification Standard
*Credit ratings listed are subject to change. Credit quality ratings are measured on a scale that generally ranges from AAA (highest) to D (lowest). “NR” is used to classify securities for which a rating is not available. The Adviser receives credit quality ratings on underlying securities of the portfolio from the three major ratings agencies - Moody’s Investors Service (Moody’s), Fitch Ratings (Fitch), and Standard & Poor’s (S&P). When calculating the credit quality breakdown, the Adviser utilizes Moody’s and if Moody’s is not available the manager selects the lower rating of S&P and Fitch.
Note: A definition of key terms can be found on page 15
Credit Ratings:AAA and AA: High credit-quality investment gradeA and BBB: Medium credit-quality investment gradeBB, B, CCC, CC, C: Low credit-quality (non-investment grade), or “junk bonds” Not Rated: Bonds currently not rated
1 All government bonds are rated AAA.2 All agency Mortgage Backed Securities (MBS) are rated A. 3 The Global Industry Classification Standard (GICS), a collaboration between Standard & Poor’s and Morgan Stanley Capital International, is a system of classification that identifies a company according to its business activity. 4 The Other Industry Sector data is not categorized within the GICS classification system.
Credit rating data is shown only for the following asset classes: Bank Loan, Corporate CDS, Corporate Credit, Convertible Bonds and Preferred Stocks.
Page 10 of 15 Page 11 of 15
Long Exposure
($)
% of Long Exposure
Short Exposure
($)
% of Short Exposure
Gross Exposure
($)
% of Gross Exposure
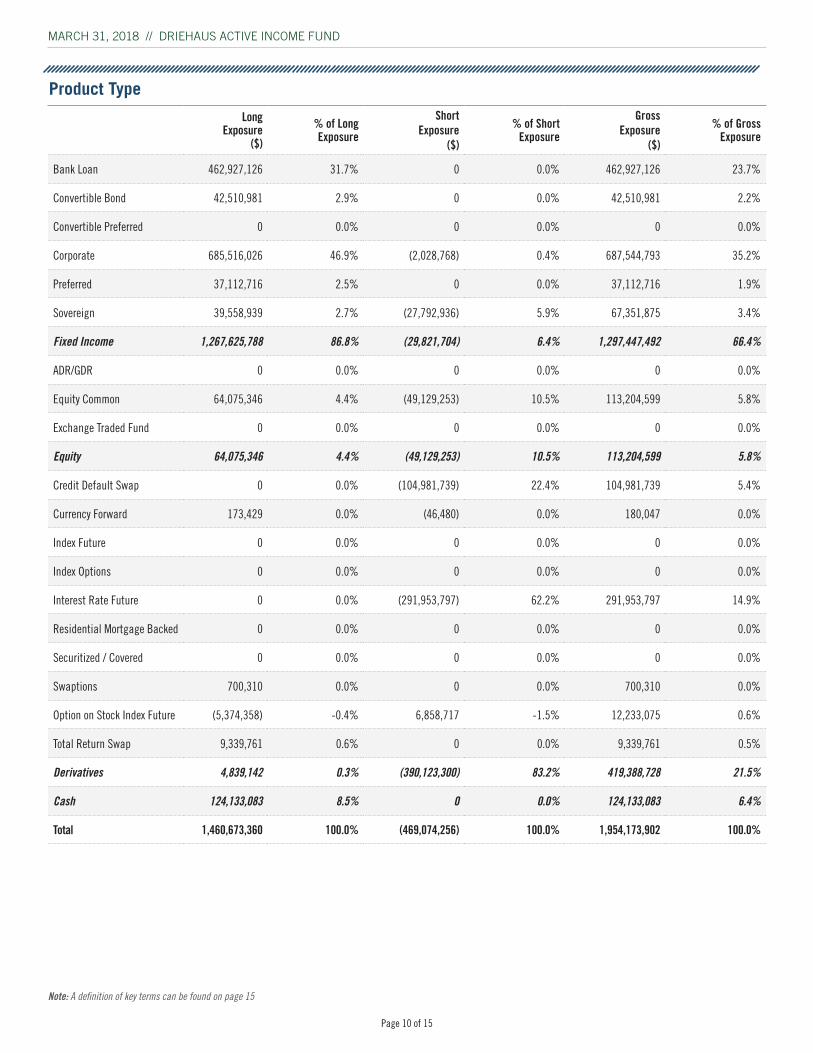
Bank Loan 462,927,126 31.7% 0 0.0% 462,927,126 23.7%
Convertible Bond 42,510,981 2.9% 0 0.0% 42,510,981 2.2%
Convertible Preferred 0 0.0% 0 0.0% 0 0.0%
Corporate 685,516,026 46.9% (2,028,768) 0.4% 687,544,793 35.2%
Preferred 37,112,716 2.5% 0 0.0% 37,112,716 1.9%
Sovereign 39,558,939 2.7% (27,792,936) 5.9% 67,351,875 3.4%
Fixed Income 1,267,625,788 86.8% (29,821,704) 6.4% 1,297,447,492 66.4%
ADR/GDR 0 0.0% 0 0.0% 0 0.0%
Equity Common 64,075,346 4.4% (49,129,253) 10.5% 113,204,599 5.8%
Exchange Traded Fund 0 0.0% 0 0.0% 0 0.0%
Equity 64,075,346 4.4% (49,129,253) 10.5% 113,204,599 5.8%
Credit Default Swap 0 0.0% (104,981,739) 22.4% 104,981,739 5.4%
Currency Forward 173,429 0.0% (46,480) 0.0% 180,047 0.0%
Index Future 0 0.0% 0 0.0% 0 0.0%
Index Options 0 0.0% 0 0.0% 0 0.0%
Interest Rate Future 0 0.0% (291,953,797) 62.2% 291,953,797 14.9%
Residential Mortgage Backed 0 0.0% 0 0.0% 0 0.0%
Securitized / Covered 0 0.0% 0 0.0% 0 0.0%
Swaptions 700,310 0.0% 0 0.0% 700,310 0.0%
Option on Stock Index Future (5,374,358) -0.4% 6,858,717 -1.5% 12,233,075 0.6%
Total Return Swap 9,339,761 0.6% 0 0.0% 9,339,761 0.5%
Derivatives 4,839,142 0.3% (390,123,300) 83.2% 419,388,728 21.5%
Cash 124,133,083 8.5% 0 0.0% 124,133,083 6.4%
Total 1,460,673,360 100.0% (469,074,256) 100.0% 1,954,173,902 100.0%
MARCH 31, 2018 // DRIEHAUS ACTIVE INCOME FUND
Product Type
Note: A definition of key terms can be found on page 15
Page 10 of 15 Page 11 of 15
0.0
0.5
1.0
1.5
2.0
2.5
3.0
3.5
4.0(years)
E�ective spreadduration
Oct-
09
Apr-1
0
Oct-
10
Apr-1
1
Oct-
11
Apr-1
2
Oct-
12
Apr-1
3
Oct-
13
Apr-1
4
Oct-
14
Apr-1
5
Oct-
15
Apr-1
6
Oct-
16
Apr-1
7
Mar
-18
0%
1%
2%
3%
4%
5%
6%
7%
8%
Oct-
09
Apr-1
0
Oct-
10
Apr-1
1
Oct-
11
Apr-1
2
Oct-
12
Apr-1
3
Oct-
13
Apr-1
4
Oct-
14
Apr-1
5
Oct-
15
Apr-1
6
Oct-
16
Apr-1
7
Mar
-18
0%
10%
20%
30%
40%
50%
60%
70%
80%
Net exposure over AUM(one to the right)
Oct-
09
Apr-1
0
Oct-
10
Apr-1
1
Oct-
11
Apr-1
2
Oct-
12
Apr-1
3
Oct-
13
Apr-1
4
Oct-
14
Apr-1
5
Oct-
15
Apr-1
6
Oct-
16
Apr-1
7
Mar
-18
0.0x
0.5x
1.0x
1.5x
2.0x
Aug-
09
Feb-
10
Aug-
10
Feb-
11
Aug-
11
Feb-
12
Aug-
12
Feb-
13
Aug-
13
Feb-
14
gross exposure over AUM(x cash number, to the right) Oc
t-09
Apr-1
0
Oct-
10
Apr-1
1
Oct-
11
Apr-1
2
Oct-
12
Apr-1
3
Oct-
13
Apr-1
4
Oct-
14
Apr-1
5
Oct-
15
Apr-1
6
Oct-
16
Apr-1
7
Mar
-18
-5%
-3%
-1%
1%
3%
5%
Monthly returnnumber
Oct-
09
Apr-1
0
Oct-
10
Apr-1
1
Oct-
11
Apr-1
2
Oct-
12
Apr-1
3
Oct-
13
Apr-1
4
Oct-
14
Apr-1
5
Oct-
15
Apr-1
6
Oct-
16
Apr-1
7
Mar
-18
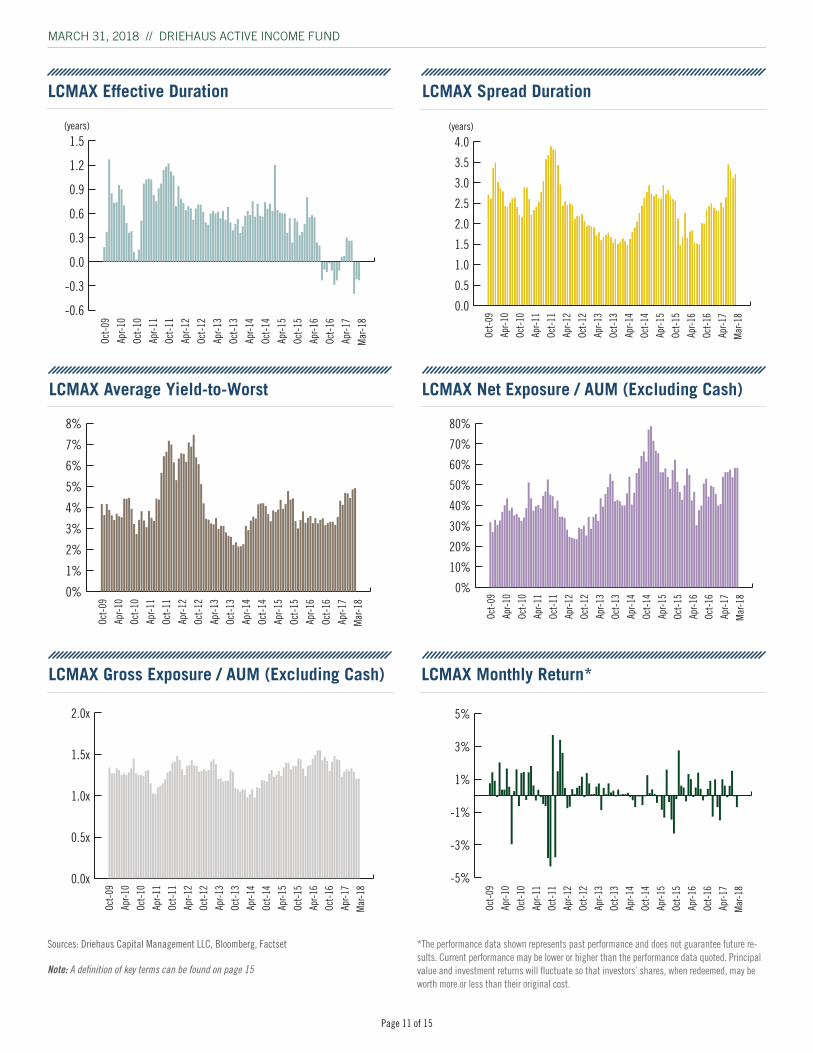
LCMAX Effective Duration
LCMAX Net Exposure / AUM (Excluding Cash)
LCMAX Monthly Return*
Sources: Driehaus Capital Management LLC, Bloomberg, Factset
Note: A definition of key terms can be found on page 15
LCMAX Gross Exposure / AUM (Excluding Cash)
*The performance data shown represents past performance and does not guarantee future re-sults. Current performance may be lower or higher than the performance data quoted. Principal value and investment returns will fluctuate so that investors’ shares, when redeemed, may be worth more or less than their original cost.
LCMAX Spread Duration
LCMAX Average Yield-to-Worst
MARCH 31, 2018 // DRIEHAUS ACTIVE INCOME FUND
-0.6
-0.3
0.0
0.3
0.6
0.9
1.2
1.5(years)
Oct-
09
Apr-1
0
Oct-
10
Apr-1
1
Oct-
11
Apr-1
2
Oct-
12
Apr-1
3
Oct-
13
Apr-1
4
Oct-
14
Apr-1
5
Oct-
15
Apr-1
6
Oct-
16
Apr-1
7
Mar
-18
Page 12 of 15 Page 13 of 15
Long Exposure
($)
% of Long Exposure
Short Exposure
($)
% of Short Exposure
Gross Exposure
($)
% of Gross Exposure
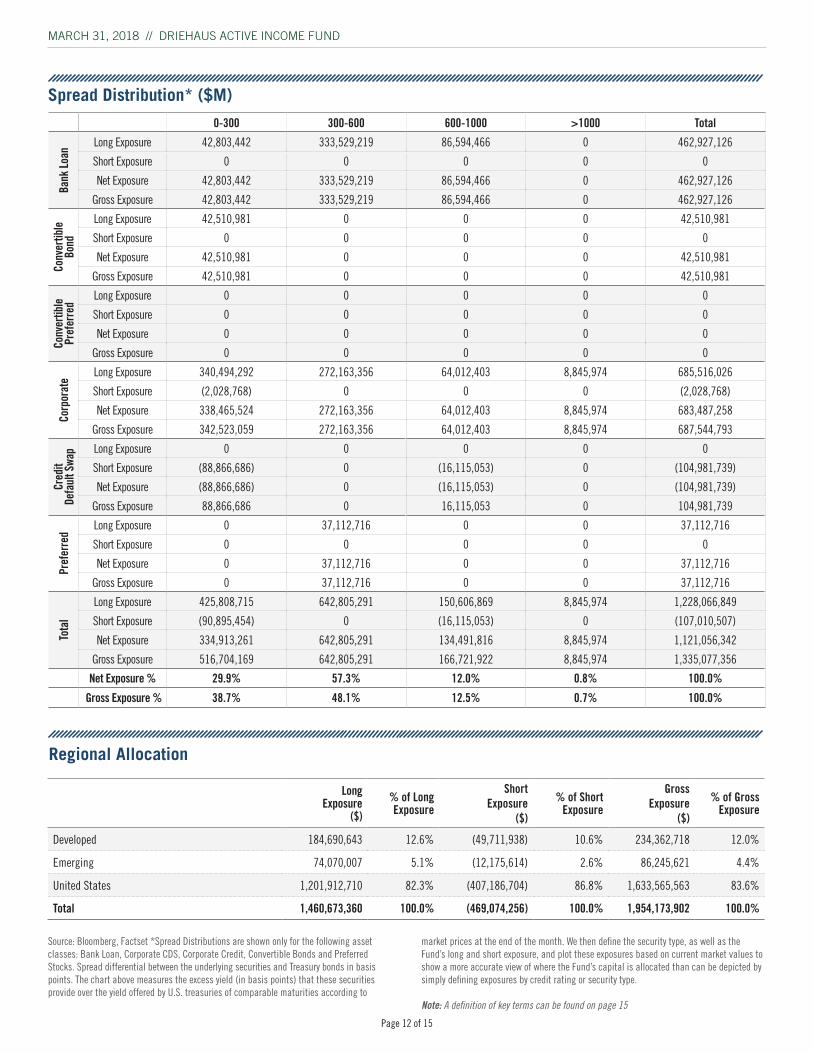
Developed 184,690,643 12.6% (49,711,938) 10.6% 234,362,718 12.0%
Emerging 74,070,007 5.1% (12,175,614) 2.6% 86,245,621 4.4%
United States 1,201,912,710 82.3% (407,186,704) 86.8% 1,633,565,563 83.6%
Total 1,460,673,360 100.0% (469,074,256) 100.0% 1,954,173,902 100.0%
MARCH 31, 2018 // DRIEHAUS ACTIVE INCOME FUND
Regional Allocation
0-300 300-600 600-1000 >1000 Total
Bank
Loan
Long Exposure 42,803,442 333,529,219 86,594,466 0 462,927,126
Short Exposure 0 0 0 0 0
Net Exposure 42,803,442 333,529,219 86,594,466 0 462,927,126
Gross Exposure 42,803,442 333,529,219 86,594,466 0 462,927,126
Conv
ertib
le
Bond
Long Exposure 42,510,981 0 0 0 42,510,981
Short Exposure 0 0 0 0 0
Net Exposure 42,510,981 0 0 0 42,510,981
Gross Exposure 42,510,981 0 0 0 42,510,981
Conv
ertib
le
Pref
erre
d
Long Exposure 0 0 0 0 0
Short Exposure 0 0 0 0 0
Net Exposure 0 0 0 0 0
Gross Exposure 0 0 0 0 0
Corp
orat
e
Long Exposure 340,494,292 272,163,356 64,012,403 8,845,974 685,516,026
Short Exposure (2,028,768) 0 0 0 (2,028,768)
Net Exposure 338,465,524 272,163,356 64,012,403 8,845,974 683,487,258
Gross Exposure 342,523,059 272,163,356 64,012,403 8,845,974 687,544,793
Cred
it
Defa
ult S
wap Long Exposure 0 0 0 0 0
Short Exposure (88,866,686) 0 (16,115,053) 0 (104,981,739)
Net Exposure (88,866,686) 0 (16,115,053) 0 (104,981,739)
Gross Exposure 88,866,686 0 16,115,053 0 104,981,739
Pref
erre
d
Long Exposure 0 37,112,716 0 0 37,112,716
Short Exposure 0 0 0 0 0
Net Exposure 0 37,112,716 0 0 37,112,716
Gross Exposure 0 37,112,716 0 0 37,112,716
Tota
l
Long Exposure 425,808,715 642,805,291 150,606,869 8,845,974 1,228,066,849
Short Exposure (90,895,454) 0 (16,115,053) 0 (107,010,507)
Net Exposure 334,913,261 642,805,291 134,491,816 8,845,974 1,121,056,342
Gross Exposure 516,704,169 642,805,291 166,721,922 8,845,974 1,335,077,356
Net Exposure % 29.9% 57.3% 12.0% 0.8% 100.0%
Gross Exposure % 38.7% 48.1% 12.5% 0.7% 100.0%
Spread Distribution* ($M)
Source: Bloomberg, Factset *Spread Distributions are shown only for the following asset classes: Bank Loan, Corporate CDS, Corporate Credit, Convertible Bonds and Preferred Stocks. Spread differential between the underlying securities and Treasury bonds in basis points. The chart above measures the excess yield (in basis points) that these securities provide over the yield offered by U.S. treasuries of comparable maturities according to
market prices at the end of the month. We then define the security type, as well as the Fund’s long and short exposure, and plot these exposures based on current market values to show a more accurate view of where the Fund’s capital is allocated than can be depicted by simply defining exposures by credit rating or security type. Note: A definition of key terms can be found on page 15
Page 12 of 15 Page 13 of 15
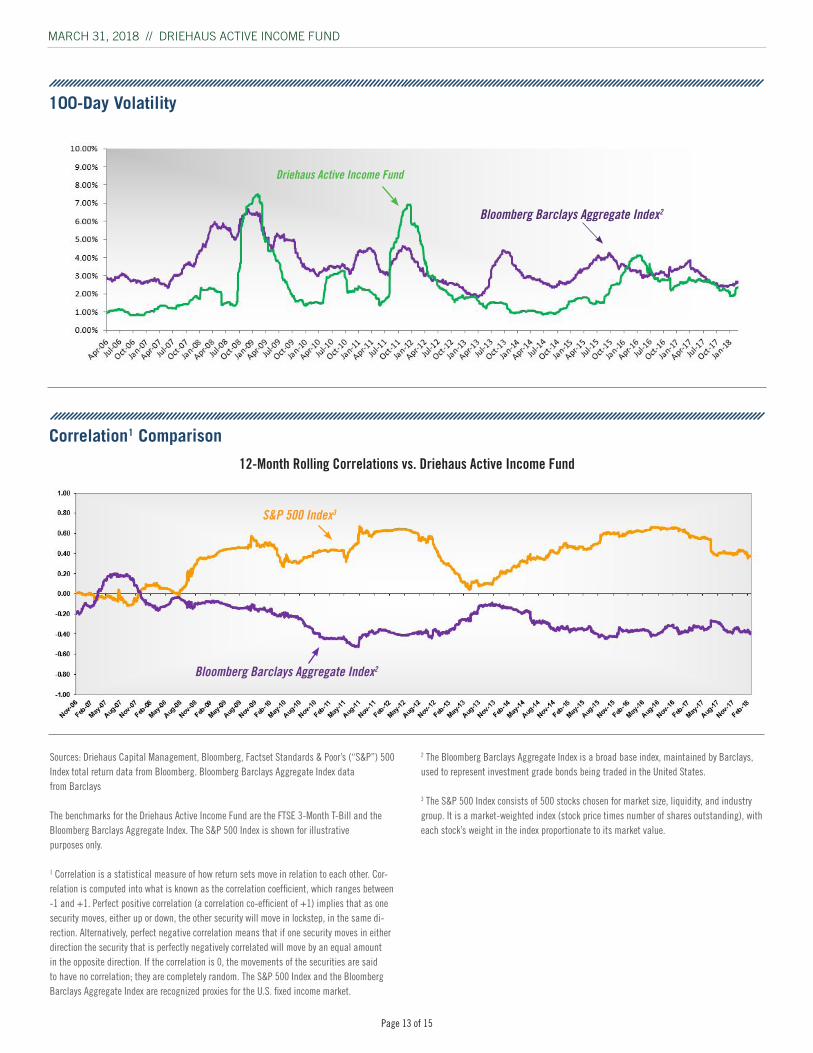
Sources: Driehaus Capital Management, Bloomberg, Factset Standards & Poor’s (“S&P”) 500 Index total return data from Bloomberg. Bloomberg Barclays Aggregate Index data from Barclays
The benchmarks for the Driehaus Active Income Fund are the FTSE 3-Month T-Bill and the Bloomberg Barclays Aggregate Index. The S&P 500 Index is shown for illustrative purposes only.
1 Correlation is a statistical measure of how return sets move in relation to each other. Cor-relation is computed into what is known as the correlation coefficient, which ranges between -1 and +1. Perfect positive correlation (a correlation co-efficient of +1) implies that as one security moves, either up or down, the other security will move in lockstep, in the same di-rection. Alternatively, perfect negative correlation means that if one security moves in either direction the security that is perfectly negatively correlated will move by an equal amount in the opposite direction. If the correlation is 0, the movements of the securities are said to have no correlation; they are completely random. The S&P 500 Index and the Bloomberg Barclays Aggregate Index are recognized proxies for the U.S. fixed income market.
12-Month Rolling Correlations vs. Driehaus Active Income Fund
Bloomberg Barclays Aggregate Index2
Bloomberg Barclays Aggregate Index2
S&P 500 Index3
100-Day Volatility
MARCH 31, 2018 // DRIEHAUS ACTIVE INCOME FUND
Correlation1 Comparison
2 The Bloomberg Barclays Aggregate Index is a broad base index, maintained by Barclays, used to represent investment grade bonds being traded in the United States.
3 The S&P 500 Index consists of 500 stocks chosen for market size, liquidity, and industry group. It is a market-weighted index (stock price times number of shares outstanding), with each stock’s weight in the index proportionate to its market value.
Driehaus Active Income Fund
Page 14 of 15 Page 15 of 15
The Driehaus Active Income Fund (the “Fund”), in addition to investing in unrated and investment grade bonds, may also invest in junk bonds, which involve greater credit risk, including the risk of default. The prices of high yield bonds are more sensitive to changing economic conditions and can fall dramatically in response to negative news about the issuer or its industry, or the economy in general. The use of derivatives involves risks different from, and possibly greater than, the risks associated with invest-ing directly in the underlying assets. Derivatives can be highly volatile, illiquid and difficult to value, and there is a risk that changes in the value of a derivative held by the Fund will not correlate with the Fund’s other investments. Further, the Fund may invest in derivatives for speculative purposes. Gains or losses from speculative positions in a derivative may be much greater than the derivative’s original cost and potential losses may be substantial. The Fund may make short sales. Short sales expose the Fund to the risk of loss. It is anticipated that the Fund will experi-ence high rates of portfolio turnover, which may result in payment by the Fund of above-average transaction costs. This is a nondiversified fund; compared to other funds, the Fund may invest a greater percentage of as-sets in a particular issuer or a small number of issuers. As a consequence, the Fund may be subject to greater risks and larger losses than diversified funds. No investment strategy, including an absolute return strategy, can ensure a profit or protect against loss. Additionally, investing in an abso-lute return strategy may lead to underperforming results during an upward moving market. When interest rates increase, bond prices decrease and bond funds become more volatile.
This material is not intended to provide investment advice. Nothing herein should be construed as a solicitation or a recommendation to buy or sell securities or other investments. You should assess your own investment needs based on your individual financial circumstances and investment objectives. The opinions expressed are those of Driehaus Capital Manage-ment LLC (“Driehaus”) and are subject to change at any time due to changes in market or economic conditions. Driehaus does not guarantee the accuracy or completeness of this information. This data was prepared on April 19, 2018 and has not been updated since then. It may not reflect recent market activity. Driehaus assumes no obligation to update or supplement this information to reflect subsequent changes.
The information and opinions contained in this material are derived from proprietary and non-proprietary sources deemed by Driehaus to be reliable and are not necessarily all inclusive. Driehaus does not guarantee the accuracy or completeness of this information. There is no guarantee that any forecasts made will come to pass. Reliance upon information in this material is at the sole discretion of the reader.
Please consider the investment objectives, risks, fees and expenses of the Fund carefully prior to investing. The prospectus and summary prospectus contain this and other important information about the Fund. To obtain a copy of the prospectus and/or summary prospectus, please call us at (877) 779-0079. Please read the prospectus and summary prospectus carefully before investing.
Driehaus Securities LLC, Distributor
MARCH 31, 2018 // DRIEHAUS ACTIVE INCOME FUND
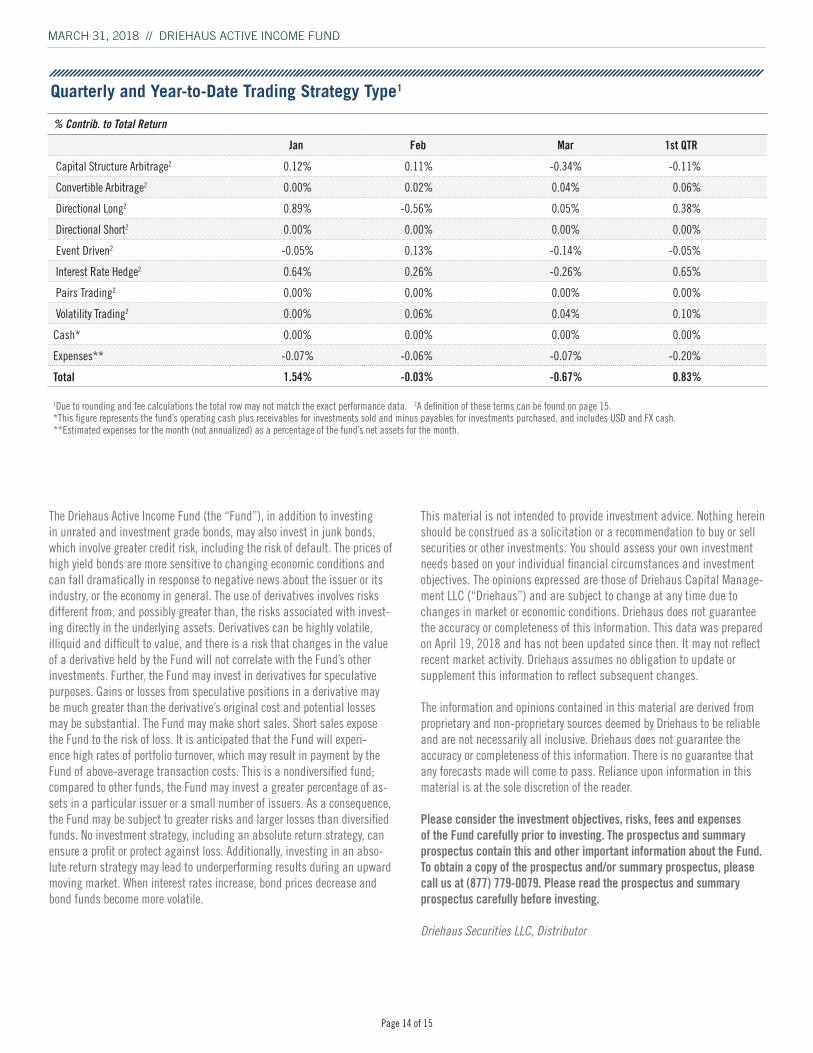
% Contrib. to Total Return
Jan Feb Mar 1st QTR
Capital Structure Arbitrage2 0.12% 0.11% -0.34% -0.11%
Convertible Arbitrage2 0.00% 0.02% 0.04% 0.06%
Directional Long2 0.89% -0.56% 0.05% 0.38%
Directional Short2 0.00% 0.00% 0.00% 0.00%
Event Driven2 -0.05% 0.13% -0.14% -0.05%
Interest Rate Hedge2 0.64% 0.26% -0.26% 0.65%
Pairs Trading2 0.00% 0.00% 0.00% 0.00%
Volatility Trading2 0.00% 0.06% 0.04% 0.10%
Cash* 0.00% 0.00% 0.00% 0.00%
Expenses** -0.07% -0.06% -0.07% -0.20%
Total 1.54% -0.03% -0.67% 0.83%
1Due to rounding and fee calculations the total row may not match the exact performance data. 2A definition of these terms can be found on page 15.*This figure represents the fund’s operating cash plus receivables for investments sold and minus payables for investments purchased, and includes USD and FX cash.**Estimated expenses for the month (not annualized) as a percentage of the fund’s net assets for the month.
Quarterly and Year-to-Date Trading Strategy Type1

Page 14 of 15 Page 15 of 15
FUND INFORMATION
The Fund invests primarily in U.S. fixed income and floating rate securi-ties, of both investment and non-investment grade credit quality, as well as equities and derivative instruments. The Fund intends to pursue its fundamental opportunistic “bottom-up” trading approach using the following investment strategies:
Capital Structure Arbitrage – attempt to exploit pricing inefficiencies between two securities of the same company. Example: buying a debt instrument that is believed to be undervalued while simultaneously shorting a subordinated debt instrument of the same issuer that is believed to be overvalued.
Convertible Arbitrage – attempt to profit from changes in a company’s equity volatility or credit quality by purchasing a convertible bond and simultaneously shorting the same issuer’s common stock.
Directional Trading – taking long or short positions in equity or corporate debt instruments in anticipation of profiting from movements in the prices of these assets.
Event Driven – attempt to profit from the consummation of a given event, e.g. a takeover, merger, reorganization or conclusion of material litigation, or based upon the perceptions of a potential pending corporate event.
Pairs Trading – attempt to exploit pricing inefficiencies between the securities of two similar companies by buying the security of one company and shorting the security of the other.
Interest Rate Hedging – attempt to reduce the performance impact of rising or falling interest rates.
Volatility Hedging – attempt to profit from extreme market volatility.
DEFINITIONS OF KEY TERMS
Agency Mortgage-Backed Security - A mortgage-backed security issued and guaranteed by a government agency such as the Federal National Mortgage Association, Federal Home Loan Mortgage Corporation, or Government National Mortgage Association.
Asset-Backed Security (ABS) - A security whose value and income payments are derived from and collateralized (or “backed”) by a specified pool of underlying assets.
Average % of Par-Longs - The average dollar price of a bond the Fund is long as a percentage of par.
Average % of Par-Shorts - The average dollar price of a bond the Fund is short as a percentage of par.
Credit Default Swap (CDS) - A contract in which the buyer of the CDS makes a series of payments to the seller and, in exchange, receives a payoff if a credit instrument (typically a bond or loan) goes into default. In its simplest form, a credit default swap is a bilateral contract between the buyer and seller of protection.
Equity Beta - A measure describing the relation of a portfolio’s returns with that of the financial market as a whole. A portfolio with a beta of 0 means that its price is not at all correlated with the market. A positive beta means that the portfolio generally follows the market. A negative beta shows that the portfolio inversely follows the market; the portfolio generally decreases in value if the market goes up and vice versa.
Effective Duration - A duration calculation for bonds with embedded op-tions. Effective duration takes into account that expected cash flows will fluctuate as interest rates change.
Spread Duration - The sensitivity of the price of a bond to a 100 basis point change to its option-adjusted spread. As the rate of the Treasury security in the option-adjusted spread increases, the rate of the option-adjusted spread also increases.
Mortgage-Backed Security (MBS) - An asset-backed security or debt ob-ligation that represents a claim on the cash flows from mortgage loans, most commonly on residential property.
Portfolio Coupon - The annualized interest earned for the portfolio.
Portfolio Current Yield - The annual income (interest or dividends) divided by the current price of the security, aggregated to the portfolio level.
Portfolio Yield-to-Worst - The lowest potential yield that can be received on a bond without the issuer actually defaulting, aggregated to the portfolio level. The yield to worst is calculated by making worst-case scenario assumptions on the issue by calculating the returns that would be received if provisions, including prepayment, call or sinking fund, are used by the issuer.
Sharpe ratio - A measure of return per unit of risk, it is calculated by finding the portfolio’s excess return and then dividing by the portfolio’s standard deviation.
Stock Vega - The change in the price of an option that results from a 1% change in volatility. Vega changes when there are large price move-ments in the underlying asset and Vega falls as the option gets closer to maturity. Vega can change even if there is no change in the price of the underlying asset (e.g., if there is a change in expected volatility).
Swap - A derivative in which two counterparties exchange certain benefits of one party’s financial instrument for those of the other party’s financial instrument.
MARCH 31, 2018 // DRIEHAUS ACTIVE INCOME FUND