Embed Size (px)
Citation preview
Page 1 of 12 Page 1 of 12
DECEMBER 2017 DRIEHAUS CREDIT COMMENTARY // NOVEMBER 30, 2017 DRIEHAUS ACTIVE INCOME FUND PERFORMANCE SUMMARY
The Rolling Tide
“Roll Tide!” was surely exclaimed across the country on Sunday afternoon, as virtually everyone outside of the Big 10 was thankful that the College Football Playoff selection committee made the right choice and included Bama over Ohio State. I have to be honest, I was worried. Yes it’s pretty obvious what the right choice was (Vegas sportsbooks project Alabama as a 3 point favorite over Ohio St. on a neutral field), but the Big 10 contingent is strong. Many have had a hard time accepting that the best athletes no longer seek the historic powerhouses of Michigan, Penn St., Ohio St., and even Notre Dame (they’re like an honorary Big 10 team). The youngins nowadays want warm weather, cool uniforms, and inventive offenses run by top quarterbacks (the last Big 10 quarterback chosen in the first round of the NFL draft was???????? Kerry Collins from Penn St……in 1995).
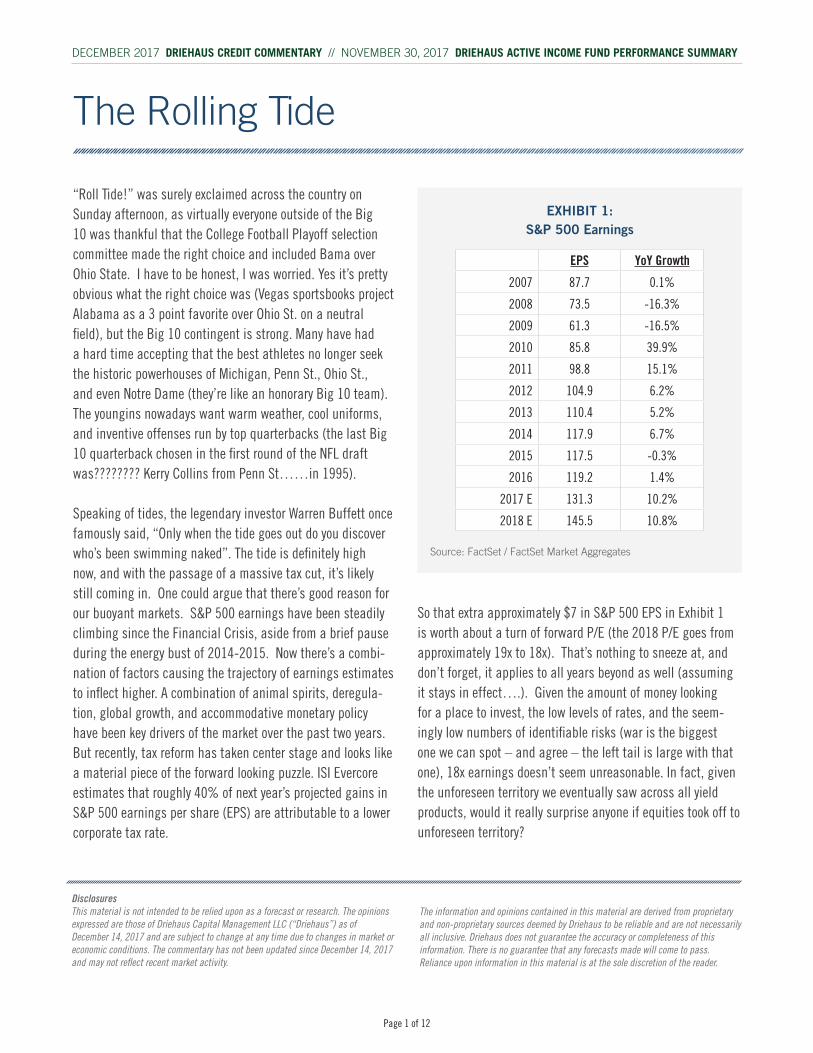
Speaking of tides, the legendary investor Warren Buffett once famously said, “Only when the tide goes out do you discover who’s been swimming naked”. The tide is definitely high now, and with the passage of a massive tax cut, it’s likely still coming in. One could argue that there’s good reason for our buoyant markets. S&P 500 earnings have been steadily climbing since the Financial Crisis, aside from a brief pause during the energy bust of 2014-2015. Now there’s a combi-nation of factors causing the trajectory of earnings estimates to inflect higher. A combination of animal spirits, deregula-tion, global growth, and accommodative monetary policy have been key drivers of the market over the past two years. But recently, tax reform has taken center stage and looks like a material piece of the forward looking puzzle. ISI Evercore estimates that roughly 40% of next year’s projected gains in S&P 500 earnings per share (EPS) are attributable to a lower corporate tax rate.
S&P 500 EarningsEXHIBIT 1:
Source: FactSet / FactSet Market Aggregates
So that extra approximately $7 in S&P 500 EPS in Exhibit 1 is worth about a turn of forward P/E (the 2018 P/E goes from approximately 19x to 18x). That’s nothing to sneeze at, and don’t forget, it applies to all years beyond as well (assuming it stays in effect….). Given the amount of money looking for a place to invest, the low levels of rates, and the seem-ingly low numbers of identifiable risks (war is the biggest one we can spot – and agree – the left tail is large with that one), 18x earnings doesn’t seem unreasonable. In fact, given the unforeseen territory we eventually saw across all yield products, would it really surprise anyone if equities took off to unforeseen territory?
DisclosuresThis material is not intended to be relied upon as a forecast or research. The opinions expressed are those of Driehaus Capital Management LLC (“Driehaus”) as of December 14, 2017 and are subject to change at any time due to changes in market or economic conditions. The commentary has not been updated since December 14, 2017 and may not reflect recent market activity.
The information and opinions contained in this material are derived from proprietary and non-proprietary sources deemed by Driehaus to be reliable and are not necessarily all inclusive. Driehaus does not guarantee the accuracy or completeness of this information. There is no guarantee that any forecasts made will come to pass. Reliance upon information in this material is at the sole discretion of the reader.
EPS YoY Growth
2007 87.7 0.1%
2008 73.5 -16.3%
2009 61.3 -16.5%
2010 85.8 39.9%
2011 98.8 15.1%
2012 104.9 6.2%
2013 110.4 5.2%
2014 117.9 6.7%
2015 117.5 -0.3%
2016 119.2 1.4%
2017 E 131.3 10.2%
2018 E 145.5 10.8%
Page 2 of 12 Page 3 of 12
K.C. Nelson Lead Portfolio Manager
Elizabeth Cassidy Portfolio Manager
Until next month,K.C. & Cass
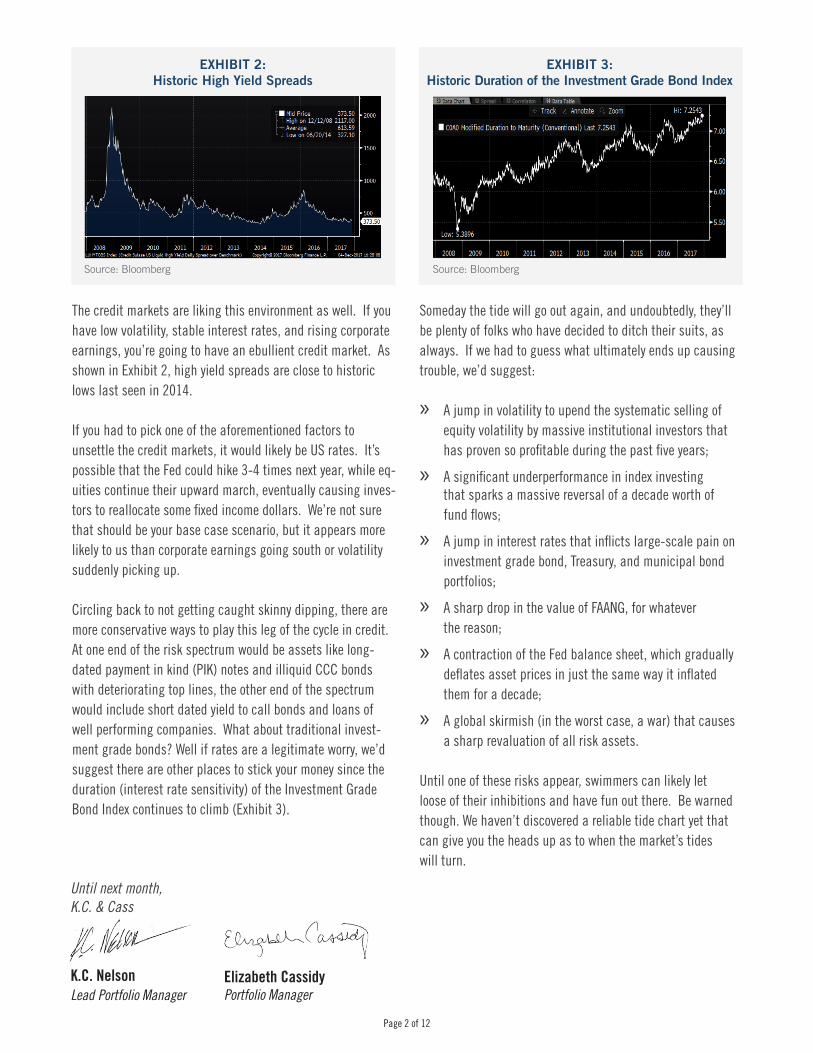
The credit markets are liking this environment as well. If you have low volatility, stable interest rates, and rising corporate earnings, you’re going to have an ebullient credit market. As shown in Exhibit 2, high yield spreads are close to historic lows last seen in 2014.
If you had to pick one of the aforementioned factors to unsettle the credit markets, it would likely be US rates. It’s possible that the Fed could hike 3-4 times next year, while eq-uities continue their upward march, eventually causing inves-tors to reallocate some fixed income dollars. We’re not sure that should be your base case scenario, but it appears more likely to us than corporate earnings going south or volatility suddenly picking up.
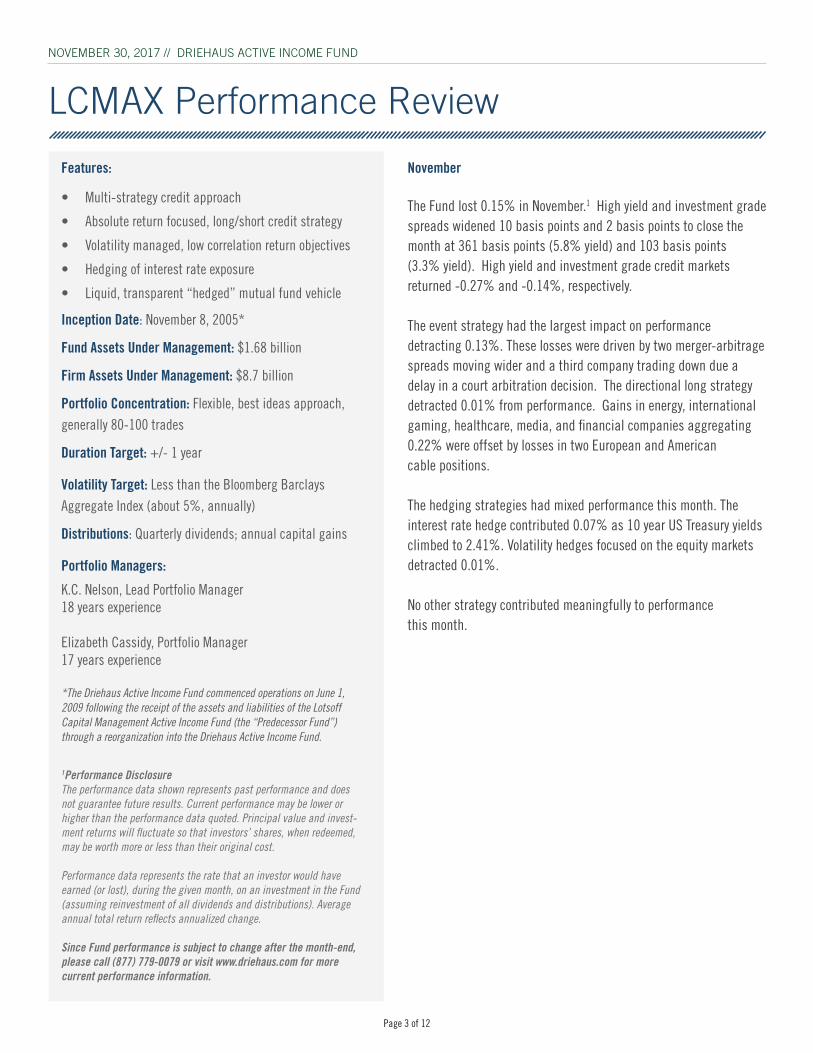
Circling back to not getting caught skinny dipping, there are more conservative ways to play this leg of the cycle in credit. At one end of the risk spectrum would be assets like long-dated payment in kind (PIK) notes and illiquid CCC bonds with deteriorating top lines, the other end of the spectrum would include short dated yield to call bonds and loans of well performing companies. What about traditional invest-ment grade bonds? Well if rates are a legitimate worry, we’d suggest there are other places to stick your money since the duration (interest rate sensitivity) of the Investment Grade Bond Index continues to climb (Exhibit 3).
Someday the tide will go out again, and undoubtedly, they’ll be plenty of folks who have decided to ditch their suits, as always. If we had to guess what ultimately ends up causing trouble, we’d suggest:
» A jump in volatility to upend the systematic selling of equity volatility by massive institutional investors that has proven so profitable during the past five years;
» A significant underperformance in index investing that sparks a massive reversal of a decade worth of fund flows;
» A jump in interest rates that inflicts large-scale pain on investment grade bond, Treasury, and municipal bond portfolios;
» A sharp drop in the value of FAANG, for whatever the reason;
» A contraction of the Fed balance sheet, which gradually deflates asset prices in just the same way it inflated them for a decade;
» A global skirmish (in the worst case, a war) that causes a sharp revaluation of all risk assets.
Until one of these risks appear, swimmers can likely let loose of their inhibitions and have fun out there. Be warned though. We haven’t discovered a reliable tide chart yet that can give you the heads up as to when the market’s tides will turn.
Source: Bloomberg Source: Bloomberg
EXHIBIT 2: Historic High Yield Spreads
EXHIBIT 3: Historic Duration of the Investment Grade Bond Index
Page 2 of 12 Page 3 of 12
November
The Fund lost 0.15% in November.1 High yield and investment grade spreads widened 10 basis points and 2 basis points to close the month at 361 basis points (5.8% yield) and 103 basis points (3.3% yield). High yield and investment grade credit markets returned -0.27% and -0.14%, respectively.
The event strategy had the largest impact on performance detracting 0.13%. These losses were driven by two merger-arbitrage spreads moving wider and a third company trading down due a delay in a court arbitration decision. The directional long strategy detracted 0.01% from performance. Gains in energy, international gaming, healthcare, media, and financial companies aggregating 0.22% were offset by losses in two European and American cable positions.
The hedging strategies had mixed performance this month. The interest rate hedge contributed 0.07% as 10 year US Treasury yields climbed to 2.41%. Volatility hedges focused on the equity markets detracted 0.01%.
No other strategy contributed meaningfully to performance this month.
LCMAX Performance Review
NOVEMBER 30, 2017 // DRIEHAUS ACTIVE INCOME FUND
Features:
• Multi-strategy credit approach
• Absolute return focused, long/short credit strategy
• Volatility managed, low correlation return objectives
• Hedging of interest rate exposure
• Liquid, transparent “hedged” mutual fund vehicle
Inception Date: November 8, 2005*
Fund Assets Under Management: $1.68 billion
Firm Assets Under Management: $8.7 billion
Portfolio Concentration: Flexible, best ideas approach, generally 80-100 trades
Duration Target: +/- 1 year
Volatility Target: Less than the Bloomberg Barclays Aggregate Index (about 5%, annually)
Distributions: Quarterly dividends; annual capital gains
Portfolio Managers:
K.C. Nelson, Lead Portfolio Manager 18 years experience
Elizabeth Cassidy, Portfolio Manager 17 years experience
*The Driehaus Active Income Fund commenced operations on June 1, 2009 following the receipt of the assets and liabilities of the Lotsoff Capital Management Active Income Fund (the “Predecessor Fund”) through a reorganization into the Driehaus Active Income Fund.
1Performance DisclosureThe performance data shown represents past performance and does not guarantee future results. Current performance may be lower or higher than the performance data quoted. Principal value and invest-ment returns will fluctuate so that investors’ shares, when redeemed, may be worth more or less than their original cost.
Performance data represents the rate that an investor would have earned (or lost), during the given month, on an investment in the Fund (assuming reinvestment of all dividends and distributions). Average annual total return reflects annualized change.
Since Fund performance is subject to change after the month-end, please call (877) 779-0079 or visit www.driehaus.com for more current performance information.
Page 4 of 12 Page 5 of 12
The performance data shown represents past performance and does not guarantee future results. Current performance may be lower or higher than the performance data quoted. Principal value and investment returns will fluctuate so that investors’ shares, when redeemed, may be worth more or less than their original cost. Performance data represents the rate that an investor would have earned (or lost), during the given month, on an investment in the Fund (assuming reinvestment of all dividends and distribu-tions). Average annual total return reflects annualized change. Since Fund performance is subject to change after the month-end, please call (877) 779-0079 or visit www.driehaus.com for more current performance information.
1Inception Date: 11/8/2005. 2The Driehaus Active Income Fund commenced operations on June 1, 2009 following the receipt of the assets and liabilities of the Lotsoff Capital Management Active Income Fund (the “Predecessor Fund”) through a reorganization into the Driehaus Active Income Fund (the “Fund”). Lotsoff Capital Management was the investment adviser from inception through April 2, 2009. Driehaus Capital Management LLC (the “Adviser”) became the interim investment adviser to the Predecessor Fund on April 3, 2009. 3The FTSE 3-Month T-Bill Index is designed to mirror the performance of the 3-Month U.S. Treasury Bill. The FTSE 3-Month T-Bill Index is unmanaged and its returns include reinvested dividends. 4The Bloomberg Barclays Aggregate Index, an unmanaged index, represents securities that are SEC-registered, taxable and dollar denominated. This index covers the U.S. investment grade fixed rate bond market, with index components for government and corporate securities, mortgage pass-through securities and asset-backed securities. These major sectors are subdivided into more specific indices that are calculated and reported on a regular basis. 5Represents the Annual Fund Operating Expenses as disclosed in the current prospectus dated April 30, 2017. It is important to understand that a decline in the Fund’s average net assets due to unprecedented market volatility or other factors could cause the Fund’s expense ratio for the current fiscal year to be higher than the expense information presented.
LCMAX Performance Review
NOVEMBER 30, 2017 // DRIEHAUS ACTIVE INCOME FUND
The Driehaus Active Income Fund (the “Fund”), in addition to investing in unrated and investment grade bonds, may also invest in junk bonds, which involve greater credit risk, including the risk of default. The prices of high yield bonds are more sensitive to chang-ing economic conditions and can fall dramatically in response to negative news about the issuer or its industry, or the economy in general. The use of derivatives involves risks different from, and possibly greater than, the risks associated with investing directly in the underlying assets. Derivatives can be highly volatile, illiquid and difficult to value, and there is a risk that changes in the value of a derivative held by the Fund will not cor-relate with the Fund’s other investments. Further, the Fund may invest in derivatives for speculative purposes. Gains or losses from speculative positions in a derivative may be much greater than the derivative’s original cost and potential losses may be substantial. The Fund may make short sales. Short sales expose the Fund to the risk of loss. It is anticipated that the Fund will experience high rates of portfolio turnover, which may result in payment by the Fund of above-average transaction costs. This is a nondiversi-fied fund; compared to other funds, the Fund may invest a greater percentage of assets in a particular issuer or a small number of issuers. As a consequence, the Fund may be subject to greater risks and larger losses than diversified funds. No investment strategy, including an absolute return strategy, can ensure a profit or protect against loss. Ad-ditionally, investing in an absolute return strategy may lead to underperforming results during an upward moving market. When interest rates increase, bond prices decrease and bond funds become more volatile.
Please consider the investment objectives, risks, fees and expenses of the Fund carefully prior to investing. The prospectus and summary prospectus contain this and other important information about the Fund. To obtain a copy of the prospectus and/or summary prospectus, please call us at (877) 779-0079. Please read the prospectus and summary prospectus carefully before investing.
Driehaus Securities LLC, Distributor
Month-end Performance as of 11/30/17Average Annual Total Return
Fund/Index MTH YTD 1 Year 3 Year 5 Year 10 Year Since Inception1
Driehaus Active Income Fund2 -0.10% -0.01% 0.40% 1.27% 1.58% 3.55% 3.48%
FTSE 3-Month T-Bill Index3 0.09% 0.74% 0.77% 0.35% 0.23% 0.37% 1.10%
Bloomberg Barclays Aggregate Index4 -0.13% 3.07% 3.21% 2.11% 1.98% 3.99% 4.37%
Calendar Quarter-end Performance as of 9/30/17
Annual Fund Operating Expenses5
Management Fee 0.55%
Other Expenses Excluding Dividends and Interest on Short Sales
0.25%
Dividends and Interest on Short Sales 0.58%
Total Annual Fund Operating Expenses 1.38%
Average Annual Total Return
Fund/Index QTR YTD 1 Year 3 Year 5 Year 10 Year Since Inception1
Driehaus Active Income Fund2 -1.21% -0.52% 1.80% 1.10% 1.69% 3.54% 3.48%
FTSE 3-Month T-Bill Index3 0.26% 0.56% 0.64% 0.29% 0.19% 0.42% 1.10%
Bloomberg Barclays Aggregate Index4 0.85% 3.14% 0.07% 2.71% 2.06% 4.27% 4.44%
Page 4 of 12 Page 5 of 12
Effective Duration 0.26 Years
Spread Duration 2.64 Years
30-day SEC Yield 3.72%
Portfolio Yield-To-Worst1 4.69%
Average % of Par Longs 101.32%
Average % of Par Shorts 102.66%
Beta vs. S&P 500 0.16
100-Day Volatility 2.20%
Source: Bloomberg, Factset
1 Refers to credit only2 A definition of this term can be found on page 12.
*Exposure: please note exposure may be different than market value. For equities, bonds, and interest rate swap products, exposure is the same as market value. For options and foreign exchange forwards exposure represents greek-adjusted underlying exposure. For credit default swap and credit default swap indices, exposure represents bond-equivalent exposure.
**This figure represents the fund’s operating cash plus receivables for investments sold and minus payables for investments purchased, and includes USD and FX cash.
***Estimated expenses for the month (not annualized) as a percentage of the fund’s net assets for the month.
Note: A definition of key terms can be found on page 12
Gross Exposure
% of Gross Exposure
% Contrib. to Total Return
Capital Structure Arbitrage2 166,214,348 7.4% 0.00%
Convertible Arbitrage2 167,266,268 7.4% 0.00%
Directional Long2 1,237,224,012 54.8% -0.01%
Directional Short2 54,722,690 2.4% -0.01%
Event Driven2 138,270,487 6.1% -0.13%
Interest Rate Hedge2 409,669,412 18.2% 0.07%
Pairs Trading2 4,795 0.0% 0.00%
Volatility Trading2 0 0.0% -0.01%
Cash** 82,390,409 3.7% 0.00%
Expenses*** -0.07%
Total 2,255,762,421 100.0% -0.15%
LCMAX Portfolio Characteristics*
Executive Summary Risk Summary
NOVEMBER 30, 2017 // DRIEHAUS ACTIVE INCOME FUND
Trading Strategy Type
Preliminary data. May differ from data shown by third-party providers because of rounding or for other reasons.
excluding cash
Assets Under Management (AUM) $1,676,791,655
Long Exposure $1,640,563,060 $1,558,172,651
Short Exposure $(615,189,483) $(615,189,483)
Net Exposure $1,025,373,577 $942,983,169
Net Exposure/AUM 61.15% 56.24%
Gross Exposure $2,255,762,421 $2,173,362,134
Gross Exposure/AUM 1.35x 1.30x
Page 6 of 12 Page 7 of 12
NOVEMBER 30, 2017 // DRIEHAUS ACTIVE INCOME FUND
Long Exposure
($)
% of Long Exposure
Short Exposure
($)
% of Short Exposure
Gross Exposure
($)
% of Gross Exposure
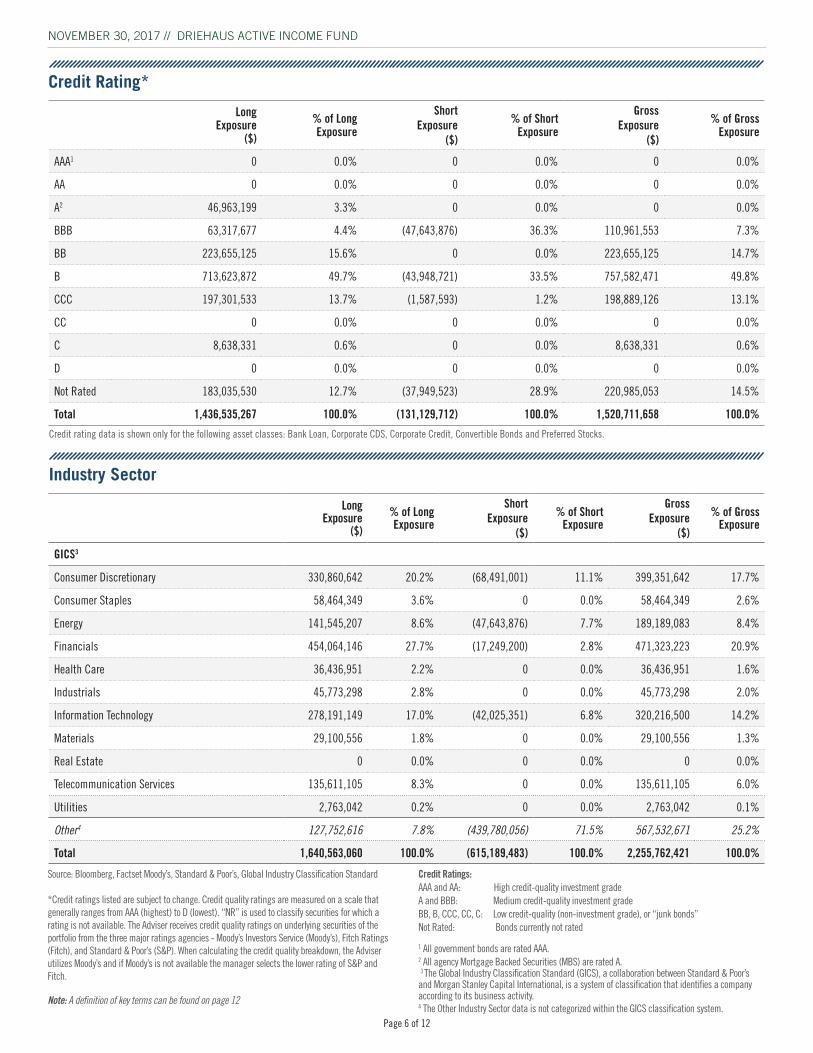
AAA1 0 0.0% 0 0.0% 0 0.0%
AA 0 0.0% 0 0.0% 0 0.0%
A2 46,963,199 3.3% 0 0.0% 0 0.0%
BBB 63,317,677 4.4% (47,643,876) 36.3% 110,961,553 7.3%
BB 223,655,125 15.6% 0 0.0% 223,655,125 14.7%
B 713,623,872 49.7% (43,948,721) 33.5% 757,582,471 49.8%
CCC 197,301,533 13.7% (1,587,593) 1.2% 198,889,126 13.1%
CC 0 0.0% 0 0.0% 0 0.0%
C 8,638,331 0.6% 0 0.0% 8,638,331 0.6%
D 0 0.0% 0 0.0% 0 0.0%
Not Rated 183,035,530 12.7% (37,949,523) 28.9% 220,985,053 14.5%
Total 1,436,535,267 100.0% (131,129,712) 100.0% 1,520,711,658 100.0%
Credit Rating*
Long Exposure
($)
% of Long Exposure
Short Exposure
($)
% of Short Exposure
Gross Exposure
($)
% of Gross Exposure
GICS3
Consumer Discretionary 330,860,642 20.2% (68,491,001) 11.1% 399,351,642 17.7%
Consumer Staples 58,464,349 3.6% 0 0.0% 58,464,349 2.6%
Energy 141,545,207 8.6% (47,643,876) 7.7% 189,189,083 8.4%
Financials 454,064,146 27.7% (17,249,200) 2.8% 471,323,223 20.9%
Health Care 36,436,951 2.2% 0 0.0% 36,436,951 1.6%
Industrials 45,773,298 2.8% 0 0.0% 45,773,298 2.0%
Information Technology 278,191,149 17.0% (42,025,351) 6.8% 320,216,500 14.2%
Materials 29,100,556 1.8% 0 0.0% 29,100,556 1.3%
Real Estate 0 0.0% 0 0.0% 0 0.0%
Telecommunication Services 135,611,105 8.3% 0 0.0% 135,611,105 6.0%
Utilities 2,763,042 0.2% 0 0.0% 2,763,042 0.1%
Other4 127,752,616 7.8% (439,780,056) 71.5% 567,532,671 25.2%
Total 1,640,563,060 100.0% (615,189,483) 100.0% 2,255,762,421 100.0%
Industry Sector
Source: Bloomberg, Factset Moody’s, Standard & Poor’s, Global Industry Classification Standard
*Credit ratings listed are subject to change. Credit quality ratings are measured on a scale that generally ranges from AAA (highest) to D (lowest). “NR” is used to classify securities for which a rating is not available. The Adviser receives credit quality ratings on underlying securities of the portfolio from the three major ratings agencies - Moody’s Investors Service (Moody’s), Fitch Ratings (Fitch), and Standard & Poor’s (S&P). When calculating the credit quality breakdown, the Adviser utilizes Moody’s and if Moody’s is not available the manager selects the lower rating of S&P and Fitch.
Note: A definition of key terms can be found on page 12
Credit Ratings:AAA and AA: High credit-quality investment gradeA and BBB: Medium credit-quality investment gradeBB, B, CCC, CC, C: Low credit-quality (non-investment grade), or “junk bonds” Not Rated: Bonds currently not rated
1 All government bonds are rated AAA.2 All agency Mortgage Backed Securities (MBS) are rated A. 3 The Global Industry Classification Standard (GICS), a collaboration between Standard & Poor’s and Morgan Stanley Capital International, is a system of classification that identifies a company according to its business activity. 4 The Other Industry Sector data is not categorized within the GICS classification system.
Credit rating data is shown only for the following asset classes: Bank Loan, Corporate CDS, Corporate Credit, Convertible Bonds and Preferred Stocks.
Page 6 of 12 Page 7 of 12
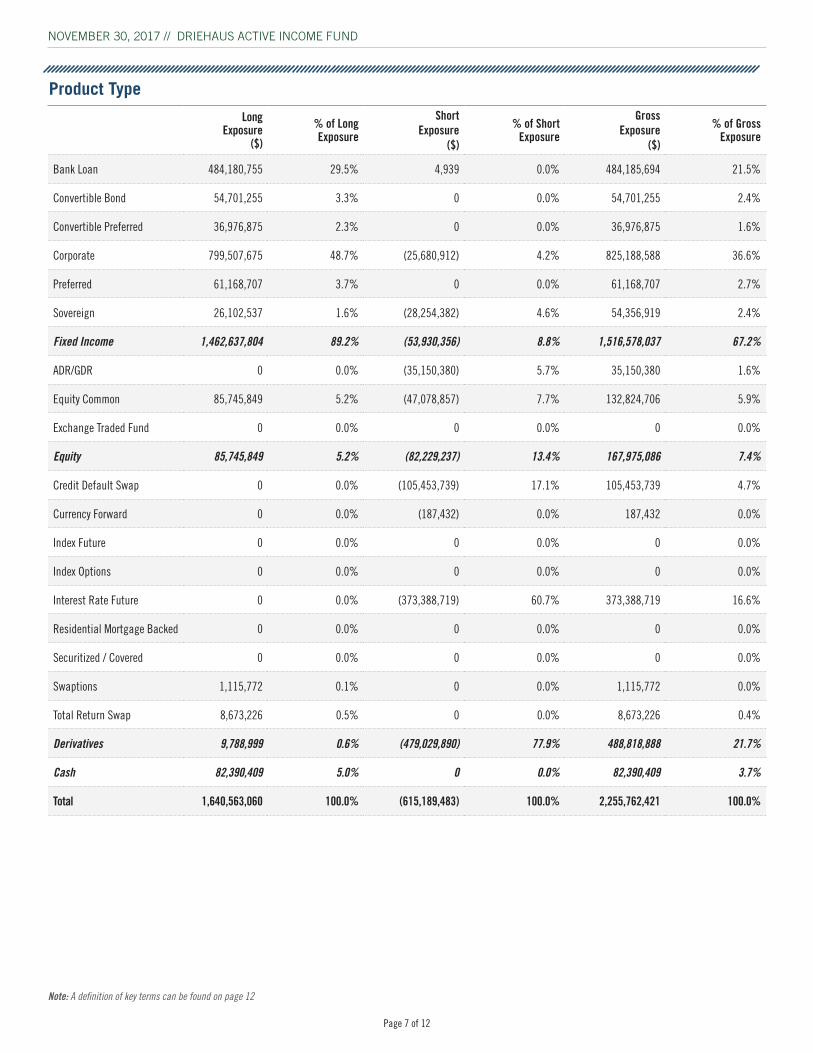
Long Exposure
($)
% of Long Exposure
Short Exposure
($)
% of Short Exposure
Gross Exposure
($)
% of Gross Exposure
Bank Loan 484,180,755 29.5% 4,939 0.0% 484,185,694 21.5%
Convertible Bond 54,701,255 3.3% 0 0.0% 54,701,255 2.4%
Convertible Preferred 36,976,875 2.3% 0 0.0% 36,976,875 1.6%
Corporate 799,507,675 48.7% (25,680,912) 4.2% 825,188,588 36.6%
Preferred 61,168,707 3.7% 0 0.0% 61,168,707 2.7%
Sovereign 26,102,537 1.6% (28,254,382) 4.6% 54,356,919 2.4%
Fixed Income 1,462,637,804 89.2% (53,930,356) 8.8% 1,516,578,037 67.2%
ADR/GDR 0 0.0% (35,150,380) 5.7% 35,150,380 1.6%
Equity Common 85,745,849 5.2% (47,078,857) 7.7% 132,824,706 5.9%
Exchange Traded Fund 0 0.0% 0 0.0% 0 0.0%
Equity 85,745,849 5.2% (82,229,237) 13.4% 167,975,086 7.4%
Credit Default Swap 0 0.0% (105,453,739) 17.1% 105,453,739 4.7%
Currency Forward 0 0.0% (187,432) 0.0% 187,432 0.0%
Index Future 0 0.0% 0 0.0% 0 0.0%
Index Options 0 0.0% 0 0.0% 0 0.0%
Interest Rate Future 0 0.0% (373,388,719) 60.7% 373,388,719 16.6%
Residential Mortgage Backed 0 0.0% 0 0.0% 0 0.0%
Securitized / Covered 0 0.0% 0 0.0% 0 0.0%
Swaptions 1,115,772 0.1% 0 0.0% 1,115,772 0.0%
Total Return Swap 8,673,226 0.5% 0 0.0% 8,673,226 0.4%
Derivatives 9,788,999 0.6% (479,029,890) 77.9% 488,818,888 21.7%
Cash 82,390,409 5.0% 0 0.0% 82,390,409 3.7%
Total 1,640,563,060 100.0% (615,189,483) 100.0% 2,255,762,421 100.0%
NOVEMBER 30, 2017 // DRIEHAUS ACTIVE INCOME FUND
Product Type
Note: A definition of key terms can be found on page 12
Page 8 of 12 Page 9 of 12
0.0
0.5
1.0
1.5
2.0
2.5
3.0
3.5
4.0(years)
E�ective spreadduration
Oct-
09
Apr-1
0
Oct-
10
Apr-1
1
Oct-
11
Apr-1
2
Oct-
12
Apr-1
3
Oct-
13
Apr-1
4
Oct-
14
Apr-1
5
Oct-
15
Apr-1
6
Oct-
16
Apr-1
7
Nov-
17
0%
1%
2%
3%
4%
5%
6%
7%
8%
Oct-
09
Apr-1
0
Oct-
10
Apr-1
1
Oct-
11
Apr-1
2
Oct-
12
Apr-1
3
Oct-
13
Apr-1
4
Oct-
14
Apr-1
5
Oct-
15
Apr-1
6
Oct-
16
Apr-1
7
Nov-
17
0%
10%
20%
30%
40%
50%
60%
70%
80%
Net exposure over AUM(one to the right)
Oct-
09
Apr-1
0
Oct-
10
Apr-1
1
Oct-
11
Apr-1
2
Oct-
12
Apr-1
3
Oct-
13
Apr-1
4
Oct-
14
Apr-1
5
Oct-
15
Apr-1
6
Oct-
16
Apr-1
7
Nov-
17
0.0x
0.5x
1.0x
1.5x
2.0x
Aug-
09
Feb-
10
Aug-
10
Feb-
11
Aug-
11
Feb-
12
Aug-
12
Feb-
13
Aug-
13
Feb-
14
gross exposure over AUM(x cash number, to the right) Oc
t-09
Apr-1
0
Oct-
10
Apr-1
1
Oct-
11
Apr-1
2
Oct-
12
Apr-1
3
Oct-
13
Apr-1
4
Oct-
14
Apr-1
5
Oct-
15
Apr-1
6
Oct-
16
Apr-1
7
Nov-
17
-5%
-3%
-1%
1%
3%
5%
Monthly returnnumber
Oct-
09
Apr-1
0
Oct-
10
Apr-1
1
Oct-
11
Apr-1
2
Oct-
12
Apr-1
3
Oct-
13
Apr-1
4
Oct-
14
Apr-1
5
Oct-
15
Apr-1
6
Oct-
16
Apr-1
7
Nov-
17
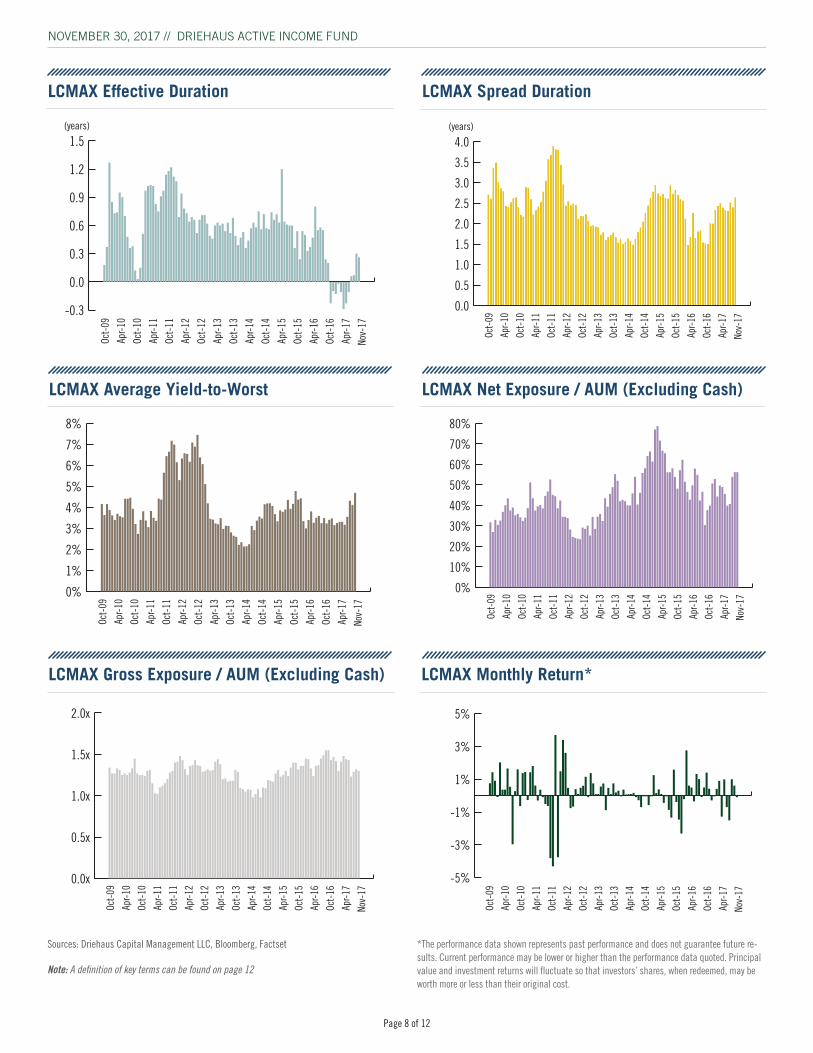
LCMAX Effective Duration
LCMAX Net Exposure / AUM (Excluding Cash)
LCMAX Monthly Return*
Sources: Driehaus Capital Management LLC, Bloomberg, Factset
Note: A definition of key terms can be found on page 12
LCMAX Gross Exposure / AUM (Excluding Cash)
*The performance data shown represents past performance and does not guarantee future re-sults. Current performance may be lower or higher than the performance data quoted. Principal value and investment returns will fluctuate so that investors’ shares, when redeemed, may be worth more or less than their original cost.
LCMAX Spread Duration
LCMAX Average Yield-to-Worst
NOVEMBER 30, 2017 // DRIEHAUS ACTIVE INCOME FUND
-0.3
0.0
0.3
0.6
0.9
1.2
1.5(years)
Oct-
09
Apr-1
0
Oct-
10
Apr-1
1
Oct-
11
Apr-1
2
Oct-
12
Apr-1
3
Oct-
13
Apr-1
4
Oct-
14
Apr-1
5
Oct-
15
Apr-1
6
Oct-
16
Apr-1
7
Nov-
17
Page 8 of 12 Page 9 of 12
Long Exposure
($)
% of Long Exposure
Short Exposure
($)
% of Short Exposure
Gross Exposure
($)
% of Gross Exposure
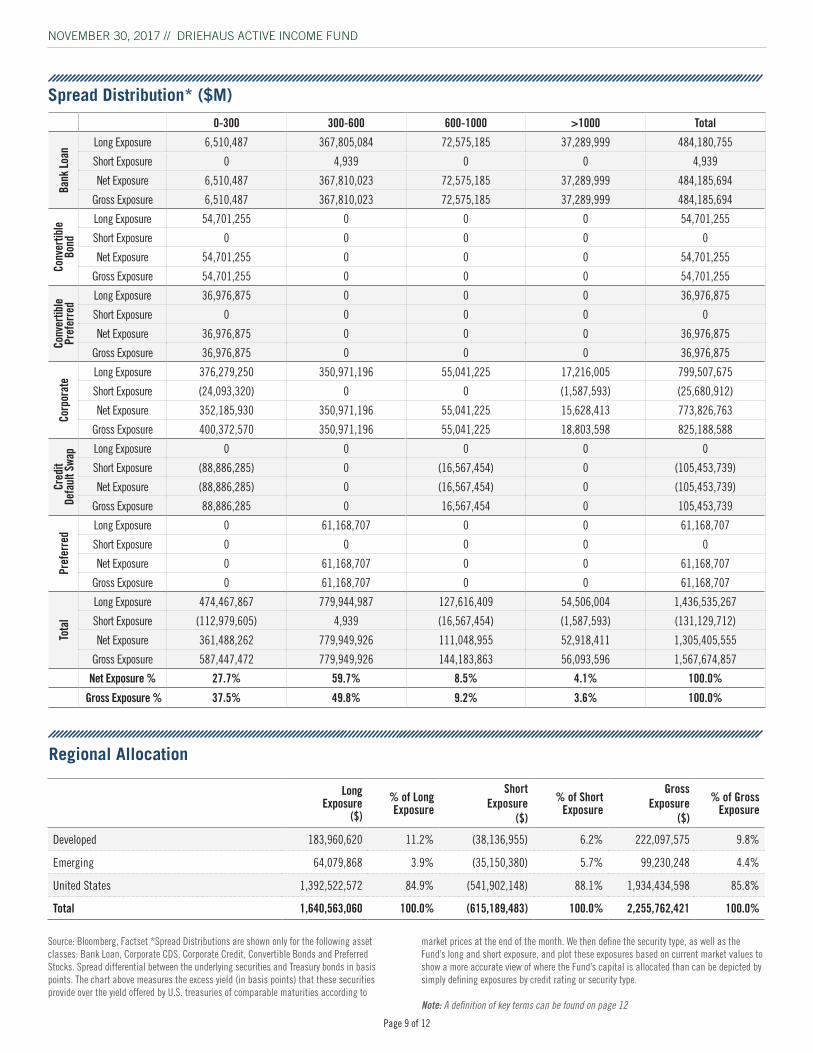
Developed 183,960,620 11.2% (38,136,955) 6.2% 222,097,575 9.8%
Emerging 64,079,868 3.9% (35,150,380) 5.7% 99,230,248 4.4%
United States 1,392,522,572 84.9% (541,902,148) 88.1% 1,934,434,598 85.8%
Total 1,640,563,060 100.0% (615,189,483) 100.0% 2,255,762,421 100.0%
NOVEMBER 30, 2017 // DRIEHAUS ACTIVE INCOME FUND
Regional Allocation
0-300 300-600 600-1000 >1000 Total
Bank
Loan
Long Exposure 6,510,487 367,805,084 72,575,185 37,289,999 484,180,755
Short Exposure 0 4,939 0 0 4,939
Net Exposure 6,510,487 367,810,023 72,575,185 37,289,999 484,185,694
Gross Exposure 6,510,487 367,810,023 72,575,185 37,289,999 484,185,694
Conv
ertib
le
Bond
Long Exposure 54,701,255 0 0 0 54,701,255
Short Exposure 0 0 0 0 0
Net Exposure 54,701,255 0 0 0 54,701,255
Gross Exposure 54,701,255 0 0 0 54,701,255
Conv
ertib
le
Pref
erre
d
Long Exposure 36,976,875 0 0 0 36,976,875
Short Exposure 0 0 0 0 0
Net Exposure 36,976,875 0 0 0 36,976,875
Gross Exposure 36,976,875 0 0 0 36,976,875
Corp
orat
e
Long Exposure 376,279,250 350,971,196 55,041,225 17,216,005 799,507,675
Short Exposure (24,093,320) 0 0 (1,587,593) (25,680,912)
Net Exposure 352,185,930 350,971,196 55,041,225 15,628,413 773,826,763
Gross Exposure 400,372,570 350,971,196 55,041,225 18,803,598 825,188,588
Cred
it
Defa
ult S
wap Long Exposure 0 0 0 0 0
Short Exposure (88,886,285) 0 (16,567,454) 0 (105,453,739)
Net Exposure (88,886,285) 0 (16,567,454) 0 (105,453,739)
Gross Exposure 88,886,285 0 16,567,454 0 105,453,739
Pref
erre
d
Long Exposure 0 61,168,707 0 0 61,168,707
Short Exposure 0 0 0 0 0
Net Exposure 0 61,168,707 0 0 61,168,707
Gross Exposure 0 61,168,707 0 0 61,168,707
Tota
l
Long Exposure 474,467,867 779,944,987 127,616,409 54,506,004 1,436,535,267
Short Exposure (112,979,605) 4,939 (16,567,454) (1,587,593) (131,129,712)
Net Exposure 361,488,262 779,949,926 111,048,955 52,918,411 1,305,405,555
Gross Exposure 587,447,472 779,949,926 144,183,863 56,093,596 1,567,674,857
Net Exposure % 27.7% 59.7% 8.5% 4.1% 100.0%
Gross Exposure % 37.5% 49.8% 9.2% 3.6% 100.0%
Spread Distribution* ($M)
Source: Bloomberg, Factset *Spread Distributions are shown only for the following asset classes: Bank Loan, Corporate CDS, Corporate Credit, Convertible Bonds and Preferred Stocks. Spread differential between the underlying securities and Treasury bonds in basis points. The chart above measures the excess yield (in basis points) that these securities provide over the yield offered by U.S. treasuries of comparable maturities according to
market prices at the end of the month. We then define the security type, as well as the Fund’s long and short exposure, and plot these exposures based on current market values to show a more accurate view of where the Fund’s capital is allocated than can be depicted by simply defining exposures by credit rating or security type. Note: A definition of key terms can be found on page 12
Page 10 of 12 Page 11 of 12
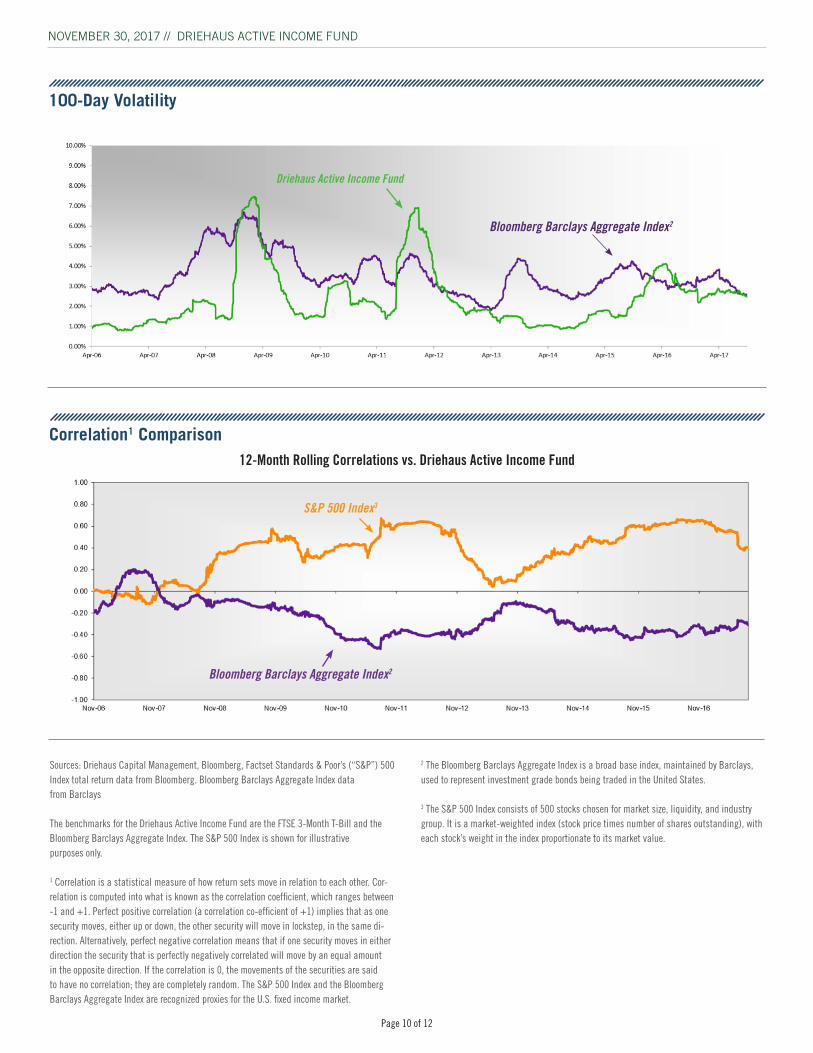
Sources: Driehaus Capital Management, Bloomberg, Factset Standards & Poor’s (“S&P”) 500 Index total return data from Bloomberg. Bloomberg Barclays Aggregate Index data from Barclays
The benchmarks for the Driehaus Active Income Fund are the FTSE 3-Month T-Bill and the Bloomberg Barclays Aggregate Index. The S&P 500 Index is shown for illustrative purposes only.
1 Correlation is a statistical measure of how return sets move in relation to each other. Cor-relation is computed into what is known as the correlation coefficient, which ranges between -1 and +1. Perfect positive correlation (a correlation co-efficient of +1) implies that as one security moves, either up or down, the other security will move in lockstep, in the same di-rection. Alternatively, perfect negative correlation means that if one security moves in either direction the security that is perfectly negatively correlated will move by an equal amount in the opposite direction. If the correlation is 0, the movements of the securities are said to have no correlation; they are completely random. The S&P 500 Index and the Bloomberg Barclays Aggregate Index are recognized proxies for the U.S. fixed income market.
12-Month Rolling Correlations vs. Driehaus Active Income Fund
Bloomberg Barclays Aggregate Index2
Bloomberg Barclays Aggregate Index2
S&P 500 Index3
100-Day Volatility
NOVEMBER 30, 2017 // DRIEHAUS ACTIVE INCOME FUND
Correlation1 Comparison
2 The Bloomberg Barclays Aggregate Index is a broad base index, maintained by Barclays, used to represent investment grade bonds being traded in the United States.
3 The S&P 500 Index consists of 500 stocks chosen for market size, liquidity, and industry group. It is a market-weighted index (stock price times number of shares outstanding), with each stock’s weight in the index proportionate to its market value.
Driehaus Active Income Fund

Page 10 of 12 Page 11 of 12
NOVEMBER 30, 2017 // DRIEHAUS ACTIVE INCOME FUND
The Driehaus Active Income Fund (the “Fund”), in addition to investing in unrated and investment grade bonds, may also invest in junk bonds, which involve greater credit risk, including the risk of default. The prices of high yield bonds are more sensitive to changing economic conditions and can fall dramatically in response to negative news about the issuer or its industry, or the economy in general. The use of derivatives involves risks different from, and possibly greater than, the risks associated with invest-ing directly in the underlying assets. Derivatives can be highly volatile, illiquid and difficult to value, and there is a risk that changes in the value of a derivative held by the Fund will not correlate with the Fund’s other investments. Further, the Fund may invest in derivatives for speculative purposes. Gains or losses from speculative positions in a derivative may be much greater than the derivative’s original cost and potential losses may be substantial. The Fund may make short sales. Short sales expose the Fund to the risk of loss. It is anticipated that the Fund will experi-ence high rates of portfolio turnover, which may result in payment by the Fund of above-average transaction costs. This is a nondiversified fund; compared to other funds, the Fund may invest a greater percentage of as-sets in a particular issuer or a small number of issuers. As a consequence, the Fund may be subject to greater risks and larger losses than diversified funds. No investment strategy, including an absolute return strategy, can ensure a profit or protect against loss. Additionally, investing in an abso-lute return strategy may lead to underperforming results during an upward moving market. When interest rates increase, bond prices decrease and bond funds become more volatile.
This material is not intended to provide investment advice. Nothing herein should be construed as a solicitation or a recommendation to buy or sell securities or other investments. You should assess your own investment needs based on your individual financial circumstances and investment objectives. The opinions expressed are those of Driehaus Capital Manage-ment LLC (“Driehaus”) and are subject to change at any time due to changes in market or economic conditions. Driehaus does not guarantee the accuracy or completeness of this information. This data was prepared on December 14, 2017 and has not been updated since then. It may not reflect recent market activity. Driehaus assumes no obligation to update or supplement this information to reflect subsequent changes.
The information and opinions contained in this material are derived from proprietary and non-proprietary sources deemed by Driehaus to be reliable and are not necessarily all inclusive. Driehaus does not guarantee the accuracy or completeness of this information. There is no guarantee that any forecasts made will come to pass. Reliance upon information in this material is at the sole discretion of the reader.
Please consider the investment objectives, risks, fees and expenses of the Fund carefully prior to investing. The prospectus and summary prospectus contain this and other important information about the Fund. To obtain a copy of the prospectus and/or summary prospectus, please call us at (877) 779-0079. Please read the prospectus and summary prospectus carefully before investing.
Driehaus Securities LLC, Distributor
Page 12 of 12 Page 12 of 12
FUND INFORMATION
The Fund invests primarily in U.S. fixed income and floating rate securi-ties, of both investment and non-investment grade credit quality, as well as equities and derivative instruments. The Fund intends to pursue its fundamental opportunistic “bottom-up” trading approach using the following investment strategies:
Capital Structure Arbitrage – attempt to exploit pricing inefficiencies between two securities of the same company. Example: buying a debt instrument that is believed to be undervalued while simultaneously shorting a subordinated debt instrument of the same issuer that is believed to be overvalued.
Convertible Arbitrage – attempt to profit from changes in a company’s equity volatility or credit quality by purchasing a convertible bond and simultaneously shorting the same issuer’s common stock.
Directional Trading – taking long or short positions in equity or corporate debt instruments in anticipation of profiting from movements in the prices of these assets.
Event Driven – attempt to profit from the consummation of a given event, e.g. a takeover, merger, reorganization or conclusion of material litigation, or based upon the perceptions of a potential pending corporate event.
Pairs Trading – attempt to exploit pricing inefficiencies between the securities of two similar companies by buying the security of one company and shorting the security of the other.
Interest Rate Hedging – attempt to reduce the performance impact of rising or falling interest rates.
Volatility Hedging – attempt to profit from extreme market volatility.
DEFINITIONS OF KEY TERMS
Agency Mortgage-Backed Security - A mortgage-backed security issued and guaranteed by a government agency such as the Federal National Mortgage Association, Federal Home Loan Mortgage Corporation, or Government National Mortgage Association.
Asset-Backed Security (ABS) - A security whose value and income payments are derived from and collateralized (or “backed”) by a specified pool of underlying assets.
Average % of Par-Longs - The average dollar price of a bond the Fund is long as a percentage of par.
Average % of Par-Shorts - The average dollar price of a bond the Fund is short as a percentage of par.
Credit Default Swap (CDS) - A contract in which the buyer of the CDS makes a series of payments to the seller and, in exchange, receives a payoff if a credit instrument (typically a bond or loan) goes into default. In its simplest form, a credit default swap is a bilateral contract between the buyer and seller of protection.
Equity Beta - A measure describing the relation of a portfolio’s returns with that of the financial market as a whole. A portfolio with a beta of 0 means that its price is not at all correlated with the market. A positive beta means that the portfolio generally follows the market. A negative beta shows that the portfolio inversely follows the market; the portfolio generally decreases in value if the market goes up and vice versa.
Effective Duration - A duration calculation for bonds with embedded op-tions. Effective duration takes into account that expected cash flows will fluctuate as interest rates change.
Spread Duration - The sensitivity of the price of a bond to a 100 basis point change to its option-adjusted spread. As the rate of the Treasury security in the option-adjusted spread increases, the rate of the option-adjusted spread also increases.
Mortgage-Backed Security (MBS) - An asset-backed security or debt ob-ligation that represents a claim on the cash flows from mortgage loans, most commonly on residential property.
Portfolio Coupon - The annualized interest earned for the portfolio.
Portfolio Current Yield - The annual income (interest or dividends) divided by the current price of the security, aggregated to the portfolio level.
Portfolio Yield-to-Worst - The lowest potential yield that can be received on a bond without the issuer actually defaulting, aggregated to the portfolio level. The yield to worst is calculated by making worst-case scenario assumptions on the issue by calculating the returns that would be received if provisions, including prepayment, call or sinking fund, are used by the issuer.
Sharpe ratio - A measure of return per unit of risk, it is calculated by finding the portfolio’s excess return and then dividing by the portfolio’s standard deviation.
Stock Vega - The change in the price of an option that results from a 1% change in volatility. Vega changes when there are large price move-ments in the underlying asset and Vega falls as the option gets closer to maturity. Vega can change even if there is no change in the price of the underlying asset (e.g., if there is a change in expected volatility).
Swap - A derivative in which two counterparties exchange certain benefits of one party’s financial instrument for those of the other party’s financial instrument.
NOVEMBER 30, 2017 // DRIEHAUS ACTIVE INCOME FUND