Embed Size (px)
Citation preview

GGGG
General Plan 2030
Circulation Element
Chapter 5
5-1
Chapter 5
CIRCULATION ELEMENT
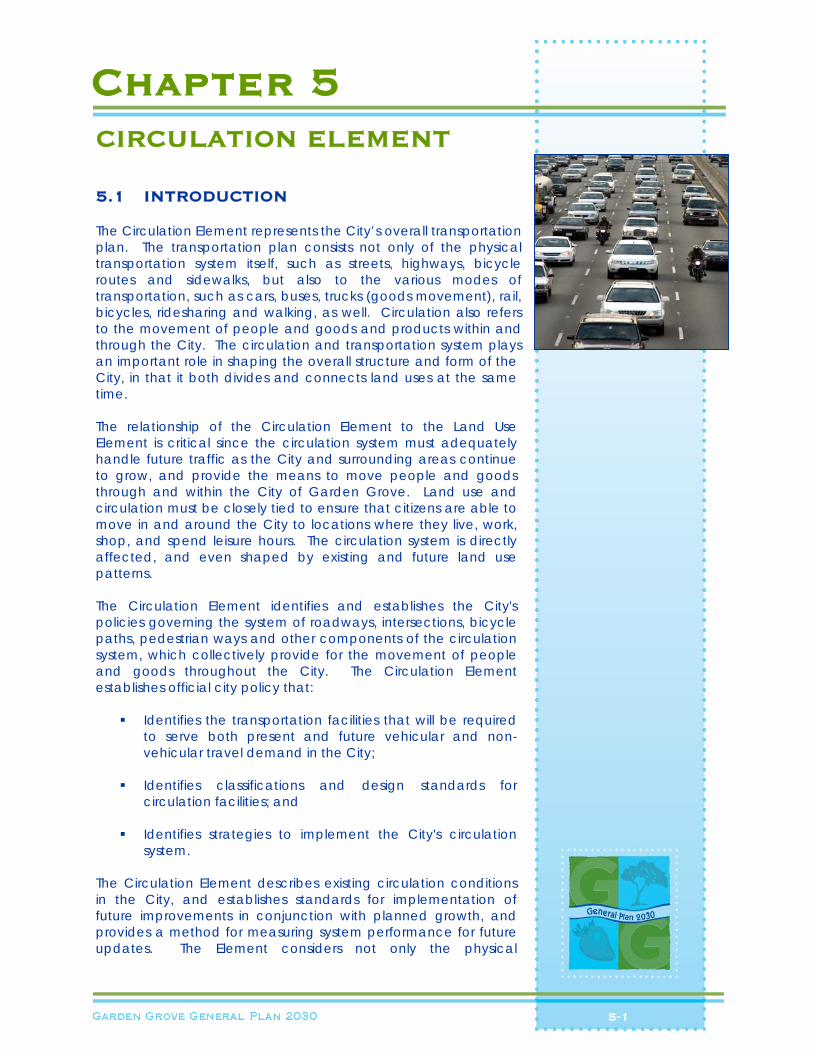
5.1 INTRODUCTION The Circulation Element represents the City’s overall transportation plan. The transportation plan consists not only of the physical transportation system itself, such as streets, highways, bicycle routes and sidewalks, but also to the various modes of transportation, such as cars, buses, trucks (goods movement), rail, bicycles, ridesharing and walking, as well. Circulation also refers to the movement of people and goods and products within and through the City. The circulation and transportation system plays an important role in shaping the overall structure and form of the City, in that it both divides and connects land uses at the same time. The relationship of the Circulation Element to the Land Use Element is critical since the circulation system must adequately handle future traffic as the City and surrounding areas continue to grow, and provide the means to move people and goods through and within the City of Garden Grove. Land use and circulation must be closely tied to ensure that citizens are able to move in and around the City to locations where they live, work, shop, and spend leisure hours. The circulation system is directly affected, and even shaped by existing and future land use patterns. The Circulation Element identifies and establishes the City's policies governing the system of roadways, intersections, bicycle paths, pedestrian ways and other components of the circulation system, which collectively provide for the movement of people and goods throughout the City. The Circulation Element establishes official city policy that:
Identifies the transportation facilities that will be required to serve both present and future vehicular and non-vehicular travel demand in the City;
Identifies classifications and design standards for
circulation facilities; and Identifies strategies to implement the City's circulation
system. The Circulation Element describes existing circulation conditions in the City, and establishes standards for implementation of future improvements in conjunction with planned growth, and provides a method for measuring system performance for future updates. The Element considers not only the physical
5-2
requirements of the transportation system (roadway facility type, number of lanes, etc.), but also operational issues such as the provision of transit services, and programs and policies that encourage use of alternative transit modes. 5.2 AUTHORITY FOR ELEMENT Government Code Section 65302 (b) requires that a General Plan include:
“A circulation element consisting of the general location and extent of existing and proposed major thoroughfares, transportation routes, terminals, and other local public utilities and facilities, all correlated with the land use element of the plan.”
5.3 RELATIONSHIP TO OTHER PLANS CONGESTION MANAGEMENT PROGRAM The City of Garden Grove is required to show continued compliance with the countywide Congestion Management Program (CMP). Currently, SR-22 Freeway, Valley View Street, Katella Avenue, Harbor Boulevard, and Westminster Avenue are arterials in the CMP Highway System. In addition, the intersections of SR-22/Harbor Boulevard and SR-22/Valley View Street are included in the highway system for level of service determination. Since the inception of the countywide CMP guidelines, the City of Garden Grove has enjoyed compliance with all provisions of the program. The benefits of compliance with the CMP provisions include the allocation of the City's fair share of gas tax subventions collected by the State of California. GROWTH MANAGEMENT PROGRAM AND MEASURE M AND RENEWED MEASURE M COMPLIANCE The City of Garden Grove participates, and will continue to participate, in the inter-jurisdictional forums as part of the Measure M and Renewed Measure M Growth Management Program. Measure M began in 1991; the projected amount of Measure M towards the City of Garden Grove was about $30 million and the projected amount for the Renewed Measure M is about $98 million. The revenues generated under this measure will be allocated through a variety of programs to fund freeway, transit, and local streets and roads projects. As part of Growth Management Areas (GMA) 2, 3, and 6, Garden Grove shares in these forums with the Cities of Anaheim, Orange, Villa Park, Santa Ana, Stanton, Los Alamitos, Seal Beach, Fountain Valley, Cypress, La Palma, Westminster, Huntington Beach and Buena Park. The purpose of these forums, as stated in the Measure M Ordinance is “to cooperate in easing cumulative traffic impacts and coordinating improvements in transportation and other facilities at the inter-jurisdictional level.” Provision that are part of the Measure M program in the City of Garden Grove include traffic signal synchronization demonstration projects along Euclid Street and OCTA Bus service discounts for Garden Grove’s seniors and disabled community members. A Renewed Measure M Early Action Plan is in place and will continue transportation improvement in Orange County for another 30 years until 2041. Pursuant to Measure M policy requirements, cities in Orange County, including Garden Grove, must satisfy the specific requirements to be eligible for receiving Measure M funds. Those requirements are detailed in the General Plan EIR.
5-3
The City of Garden Grove has complied with all of the Measure M requirements, including adoption of a Growth Management Element (March 26, 1992) and a TDM Ordinance (April 23, 1991). REGIONAL TRANSPORTATION IMPROVEMENT PROGRAM The Regional Transportation Improvement Program (RTIP) is the Southern California Association of Government’s compilation of state, federal, and local funded transportation projects. In addition to projects identified in the STIP, the RTIP includes federal Congestion Mitigation Air Quality (CMAQ) and Surface Transportation Program (STP) funds, other federal funds, and projects entirely funded out of local and private funds. The following projects that are included in the 2008 RTIP are partially or entirely within the Plan area:
Harbor Boulevard ITS; and Connect 21 Signals on the west side of the City to the TMC.
5.4 EXISTING CIRCULATION SYSTEM (2007/2008) The existing regional and local roadway network in Garden Grove is a hierarchical system of highways and local streets developed to provide regional traffic movement and local access. The following section provides a description of the functional classification of the facilities within the City. Exhibit CIR-1, Existing Circulation System and MPAH Designations, illustrates the existing circulation system within the City. REGIONAL ACCESS Regional roadways include those facilities that serve regional demand and under the jurisdiction of other agencies, such as Caltrans. Within the city limits of Garden Grove, the Garden Grove Freeway (SR-22) is the primary regional facility. SR-22 is the primary regional facility that provides access to the City of Garden Grove. The facility has four general-purpose lanes and one carpool lane in each direction, plus auxiliary lanes between interchanges. It is considered as a limited-access corridor between the Costa Mesa Freeway (SR-55) to the east and the San Diego Freeway (I-405) to the west. There are eight full-access interchanges on SR-22 within the City. These interchanges are: Garden Grove Boulevard/Haster Street; Harbor Boulevard; Euclid Street; Brookhurst Street; Magnolia Street; Beach Boulevard; Knott Street; and Valley View Street. I-405 also provides regional access and circulation in the westerly end of Garden Grove at Bolsa Chica Road/Valley View Street. In the vicinity of Garden Grove, I-405 is a ten-lane limited access corridor that provides regional circulation from Orange County in the south to Los Angeles County in the north. While not in the city limits, access to the Santa Ana Freeway (I-5) is provided less than one mile from the City’s easterly border, at State College Boulevard and Chapman Avenue. I-5 is a major regional transportation corridor traversing the State of California from the Mexico border to the south to the Oregon border to the north. Currently, I-5 proximate to Garden Grove is a ten-lane freeway plus carpool lanes.
LOCAL CIRCULATION Local circulation within the City of Garden Grove is provided by a primarily grid-pattern system of arterial streets, most of which are under the sole jurisdiction of the City. The local arterial street system is classified by a functional hierarchy.

5-4
The network of major roadways is primarily designed in a north-south and east-west grid pattern with major and primary arterials spaced between one mile and one-half mile intervals. Many of the major and primary arterials within the City of Garden Grove are built out to the full paved cross-section along the entire length. Local streets generally follow the same grid pattern. Exhibit CIR-2, General Plan Typical Roadway Cross-Sections, depicts typical cross-sections for all of the roadway classifications.
Table 5-1 Arterial Highway Classification
Type Number of Lanes Median Right-of-
Way (ft)1 Daily Volume
Capacity2 Function
Principal 8 Yes 160 72,000 Carry large volume of regional traffic on high capacity thoroughfare.
Major 6 Yes 120 56,300 Carry large volume of regional traffic not handled by freeways.
Primary 4 Yes 100 37,500 Carry regional traffic, but with less capacity than Major arterial.
Secondary 4 No 80 25,000 Distribute traffic between local streets and Major and Primary arterials.
1 Right-of-way width is a general guide, as consistency with the County MPAH is measured by number of lanes. 2 Capacity volume is based on County of Orange MPAH standards for an acceptable LOS E. It should be noted that the City of
Garden Grove LOS threshold for streets is LOS D. Principal Arterials Principal arterials are eight-lane facilities that provide service to non-local through trips with minimal direct access to adjacent land uses. They have a design cross-section of eight lanes (four in each direction) with medians and turn lanes at a limited number of access points. Regional arterials are typically within a 160-foot right-of-way. At the Level of Service (LOS) E, most regional arterials can carry up to 72,000 vehicles per day. Bike lanes may also be included on regional arterials where separate facilities are not available. Principal arterials comprise approximately three miles of the circulation system of the City of Garden Grove. Principal arterials include the following roadways:
Beach Boulevard – Garden Grove Boulevard to Trask Avenue Katella Avenue - Euclid Street to Dale Street
Major Arterials Major arterials are primarily intended to serve through, non-local traffic and provide limited local access. They generally have a cross-section of three through lanes, and a median for left-turning traffic in each direction. Major arterials are designated within a 120-foot right-of-way. Bike routes may be included on major arterials when separate facilities are not available. However, the wide right-of-way sometimes allows for the development of off-street facilities. At LOS E, major arterials can accommodate up to 56,300 vehicles per day.

5-5
Major arterials comprise approximately ten miles of the circulation system of the City of Garden Grove. Major arterials include the following roadways:
Valley View Street - Catalina Avenue to SR-22 Freeway Brookhurst Street – Katella Avenue to Hazard Avenue Harbor Boulevard - Chapman Avenue to Westminster Boulevard Bolsa Avenue - Ward Street to Starboard Street Westminster Avenue - Euclid Street to eastern City limit Fairview Road - south of Trask Avenue to Garden Grove Boulevard Knott Avenue - Patterson Drive to Garden Grove Boulevard
Primary Arterials Primary Arterials are intended to service through, non-local traffic and provide limited local access. They have a cross-section of two through lanes traffic in each direction and a median for left-turning. Primary arterials are four-lane divided highways. The function of a Primary Arterial is similar to that of a Major Arterial; the principal difference is capacity. Primary Arterials are designated within a 100-foot right-of-way. Bike lanes may be included on primary arterials when separate facilities are not available. However, the wide right-of-way sometimes allows for the development of off-street facilities. At LOS E, Primary Arterials can accommodate up to 37,500 vehicles per day. Primary arterials comprise approximately 23 miles of the total citywide circulation system. Primary arterials in the City of Garden Grove include the following roadways:
Magnolia Street - Katella Avenue to Westminster Boulevard Euclid Street - Katella Avenue to Chapman Avenue Euclid Street – Chapman Avenue to Hazard Avenue (six-lane section) Haster Street - Tiller Street to SR-22 Freeway Chapman Avenue - Knott Avenue to west of Beach Boulevard, west of Dale Street to
Lewis Street Garden Grove Boulevard - Knott Avenue to west of Park Vine Street Westminster Boulevard - west of Erin Street to Euclid Street
Secondary Arterials Secondary arterials provide more local access than the major arterials and primary arterials, while also providing a lesser level of non-local through traffic service. A secondary arterial serves as a collector distributing traffic between local streets, major and primary arterials in the City of Garden Grove. Secondary arterials have a cross-section of four through lanes and a left-turn lane within an 80-foot wide right-of-way. Bike lanes may be included on secondary arterials when separate facilities are not available. These roadways are usually undivided with possible limited on-street parking, turn lanes at major intersections, and may have partial control of vehicular and pedestrian access from driveways, cross streets, and crosswalks. Secondary Arterials can accommodate between up to 25,000 vehicles per day at level of service E. In the City of Garden Grove, Secondary arterials make up approximately 25 miles of the circulation system. Secondary arterials include the following roadways:
Western Avenue - Simmons Place to Garden Grove Boulevard Dale Street - Katella Avenue to Orangewood Avenue, near Linmar Meadows to Chapman Avenue, Enault Lane to Garden Grove Boulevard Gilbert Street - Katella Avenue to Garden Grove Boulevard

5-6
Ninth Street - Orangewood Avenue to Garden Grove Boulevard West Street - Orangewood Avenue to Garden Grove Boulevard Lewis Street - Chapman Avenue to Garden Grove Boulevard Orangewood Avenue – Knott Avenue to Western Avenue, west of Nearing Way to Euclid
Street, Ninth Street to west of Harbor Boulevard Lampson Avenue - west of Manley Street to Hoover Street, east of Beach Boulevard to
Lewis Street Trask Avenue - Beach Boulevard to Fairview Street Springdale Street - SR-22 Freeway to north of Santa Barbara Street Newhope Street - Westminster Avenue to Garden Grove Boulevard Newland Avenue - Westminster Avenue to Garden Grove Boulevard Ward Street - Edinger Avenue to Hazard Avenue Hazard Avenue - east of Bushard Street to Euclid Street Mc Fadden Avenue – Ward Street to Reeve Street
Local Residential Streets These streets serve adjacent residential land uses only, allowing access to residential driveways and providing on-street parking for neighborhoods. Local residential streets in Garden Grove are designated 36-foot roadways within either 50-foot, 56-foot, or 60-foot rights-of-way. These streets are not intended to serve through traffic traveling from one street to another. Traffic volumes on these streets should not exceed 2,500 vehicles per day and 200-300 vehicles per hour. OCTA Smart Streets The Smart Street concept seeks to improve roadway traffic capacity and smooth traffic flow through measures such as traffic signal synchronization, bus turnouts, intersection improvements and addition of travel lanes by removing on-street parking and consolidating driveways. Along with the State highways, the Smart Street network comprises the Congestion Management Program (CMP) highway system, the performance of which determines compliance with CMP level of service (LOS) thresholds. This special street designation allows for the development of improvements that enhance the traffic carrying capacity of this roadway in excess of the Major arterial designation. Beach Boulevard was the first Smart Street project to be implemented. Other Smart Streets in the City of Garden Grove include Katella Avenue, Harbor Boulevard, Bolsa Avenue, and Valley View Streets. All are designated as Smart Streets in the County of Orange Congestion Management Program highway system. SMART STREETS IN THE CITY OF GARDEN GROVE
Beach Boulevard (SR-39) – Pacific Coast Highway (SR-1) to Imperial Highway (SR-90) Bolsa Avenue/First Street – Bolsa Chica Road to Santa Ana Freeway (I-5) Harbor Boulevard – Imperial Highway (SR-90) to Costa Mesa Freeway (SR-55) extended Katella Avenue – San Gabriel River Freeway (I-605) to Costa Mesa Freeway (SR-55) Valley View Street – Garden Grove Freeway (SR-22) to Riverside Freeway (SR-91)
5.5 EXISTING VOLUMES AND LEVELS OF SERVICE Sixty-three intersections and 133 roadway segments were selected for the evaluation of current traffic conditions in the City. Intersection turning movement counts at the 63 locations were conducted during the month of June in 2007; twenty-four hour traffic counts were conducted in
5-7
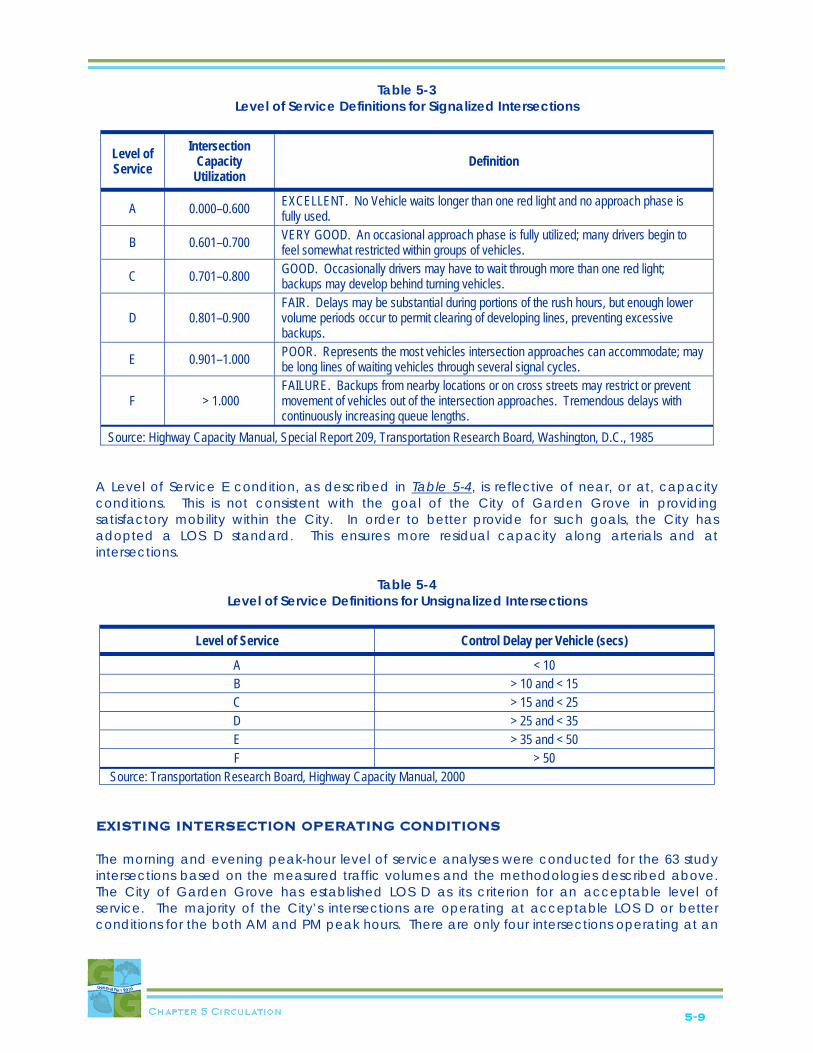
April 2008 by the City at selected roadway segments. The evaluation methodology and analysis results are presented below. Table 5-2, Roadway Segment Level of Service Criteria, defines and describes the level of service criteria for roadway segments. The levels of service indicators for the roadway system are based on the volume of traffic for designated sections of roadway during a typical day and the practical vehicular capacity of that segment. These two measures for each monitored segment of the roadway system are expressed as a ratio. The volume-to-capacity ratio (V/C) is then converted to an alpha descriptor identifying operating conditions and expressed as a level of service, LOS A through LOS F. LOS A identifies the best operating conditions along a section of roadway and is characterized by free-flow traffic, low volumes, and little or no restrictions on maneuverability. LOS F characterizes forced traffic flow with high traffic densities, slow travel speeds, and often stop-and-go conditions. City of Garden Grove has established LOS D as its criterion for an acceptable LOS.
Table 5-2 Roadway Segment Level of Service Criteria
ROADWAY CAPACITIES The capacity per lane for each roadway type can be defined for different analysis periods. The theoretical daily capacities of roadways determined by the number of lanes and type of roadway were previously shown in Table 5-1. These capacity assumptions were used to calculate the LOS for the City’s roadway segments.
EXISTING ROADWAY SEGMENT OPERATING CONDITIONS The General Plan EIR provides a detailed summary of existing conditions, which will include text, tables and exhibits. This section of the Element will just highlight key points about the existing conditions. The majority of the City’s arterial segments are operating at an acceptable LOS D or better conditions. Those roadway segments operating with a V/C ratio of 0.90 or higher (i.e., volume
Level of Service Interpretation Volume-to-
Capacity Ratio
A Free-flow speeds prevail. Vehicles are almost unimpeded in their ability to maneuver within the traffic stream 0.00 - 0.60
B Reasonably free-flow speeds are maintained. The ability to maneuver within traffic is only slightly restricted. 0.61 - 0.70
C Flow with speeds at or near free-flow speed of the roadway. Freedom to maneuver within the traffic stream is noticeably restricted and lane changes require more care and vigilance on the part of the driver.
0.71 - 0.80
D Speeds begin to decline slightly with increasing flows. In this range, density begins to increase somewhat more quickly with increasing flow. Freedom to maneuver within the traffic stream is noticeably limited.
0.81 - 0.90
E Operation at capacity with no usable gaps in the traffic stream. Any disruption to the traffic stream has little or no room to dissipate. 0.91 - 1.0
F Breakdown the traffic flow with long queues of traffic. Unacceptable conditions. >1.0 Source: Highway Capacity Manual, 2000.
5-8
greater than 90 percent of capacity, the LOS D threshold) are considered to be operating deficiently according to the City’s standards. The following roadway segments are operating at LOS E or F:
Harbor Boulevard from Hazard Avenue to Garden Grove Boulevard Magnolia Street from Trask Avenue to Garden Grove Boulevard Newhope Street from Westminster Boulevard to Trask Avenue Western Avenue from Chapman Avenue to Orangewood Avenue Valley View Street from south of Garden Grove Boulevard to Santa Catalina Avenue Chapman Avenue from Haster Street to Lewis Street Garden Grove Boulevard from Valley View Street to Holder Avenue Garden Grove Boulevard from Beach Boulevard to Dale Street Lampson Avenue from Dale Street to Magnolia Street Lampson Avenue from West Street to Lewis Street Trask Avenue from Magnolia Street to Galway Street Trask Avenue from Euclid Street to Newhope Street Westminster Boulevard from Brookhurst Street to Bowen Street Beach Boulevard from Trask Avenue to Lampson Avenue Fairview Street from Trask Avenue to Garden Grove Boulevard
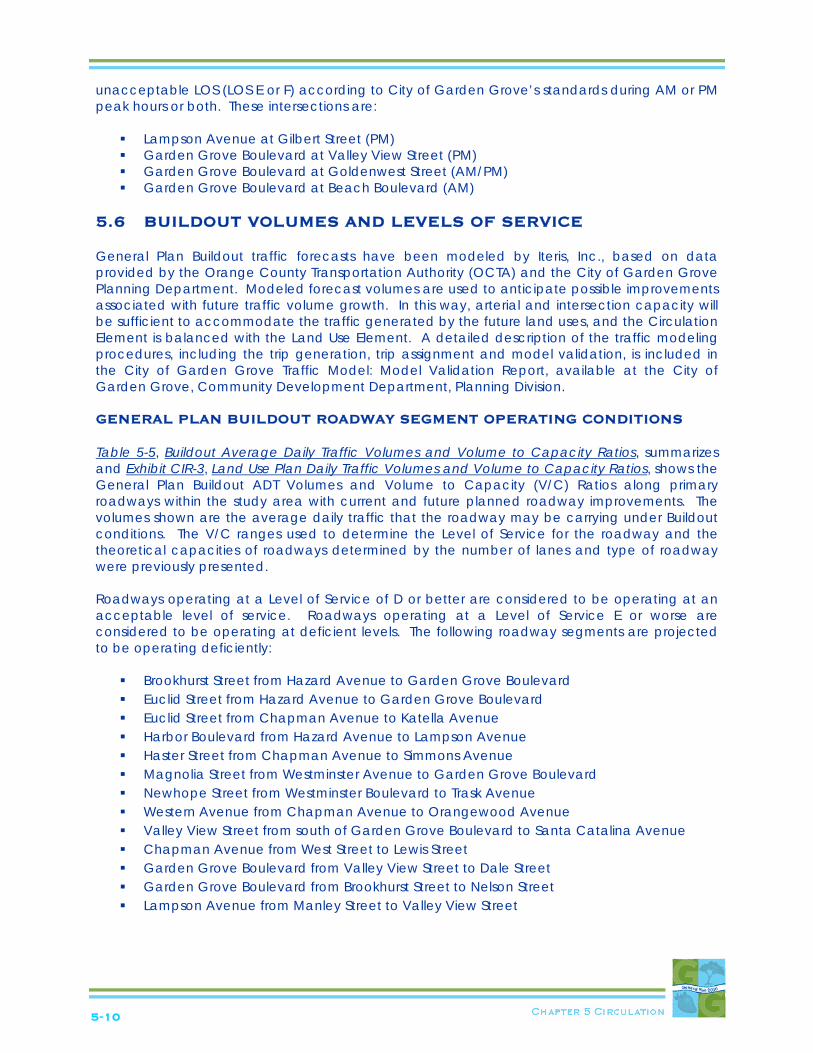
Although these segments exceed the LOS D threshold, other factors such as intersection level of service and freeway access intersection operation, will determine actual operational performance. INTERSECTION LEVEL OF SERVICE The efficiency of traffic operations at an intersection is also measured in terms of Level of Service (LOS). The intersection level of service concept is a measure of average operating conditions at intersections during an hour and is based on a volume-to-capacity (V/C) ratio for signalized locations and average delay per vehicle in seconds for stop sign-controlled intersections. Traffic operating conditions in the City were analyzed using the “Intersection Capacity Utilization” (ICU) methodology for signalized intersections and the “Highway Capacity Manual” (HCM) for unsignalized intersections per the City of Garden Grove guidelines. Levels range from A to F with A representing excellent (free-flow) conditions and F representing extreme congestion. The ICU methodology compares the amount of traffic a through or turn lane is able to process (the capacity) to the level of traffic during the peak hours (volume). The critical V/C ratios are combined to determine the ICU value (V/C ratio) for the entire intersection. The levels of service definitions for signalized and unsignalized intersections are provided in Table 5-3, Level of Service Definitions for Signalized Intersections, and Table 5-4, Level of Service Definitions for Unsignalized Intersections, respectively. It should be noted that the LOS definitions shown in the tables represent average conditions for all vehicles at an intersection across a one-hour period. Table 5-3 provides the relationship between the volume/capacity ratio for signalized intersections and the associated level of service. Table 5-4 represents the relationship between the average delay and its associated LOS for unsignalized intersections. Due to State legislation and the Orange County Congestion Management Program (CMP) requirements, a CMP highway network and level of service standards have been adopted. The CMP arterials in the City of Garden Grove are: the SR-22 Freeway, Valley View Street, Katella Avenue, Harbor Boulevard, and Westminster Avenue. The minimum level of service for CMP facilities is Level of Service E.
5-9
Table 5-3 Level of Service Definitions for Signalized Intersections
Level of Service
Intersection Capacity
Utilization Definition
A 0.000–0.600 EXCELLENT. No Vehicle waits longer than one red light and no approach phase is fully used.
B 0.601–0.700 VERY GOOD. An occasional approach phase is fully utilized; many drivers begin to feel somewhat restricted within groups of vehicles.
C 0.701–0.800 GOOD. Occasionally drivers may have to wait through more than one red light; backups may develop behind turning vehicles.
D 0.801–0.900 FAIR. Delays may be substantial during portions of the rush hours, but enough lower volume periods occur to permit clearing of developing lines, preventing excessive backups.
E 0.901–1.000 POOR. Represents the most vehicles intersection approaches can accommodate; may be long lines of waiting vehicles through several signal cycles.
F > 1.000 FAILURE. Backups from nearby locations or on cross streets may restrict or prevent movement of vehicles out of the intersection approaches. Tremendous delays with continuously increasing queue lengths.
Source: Highway Capacity Manual, Special Report 209, Transportation Research Board, Washington, D.C., 1985
A Level of Service E condition, as described in Table 5-4, is reflective of near, or at, capacity conditions. This is not consistent with the goal of the City of Garden Grove in providing satisfactory mobility within the City. In order to better provide for such goals, the City has adopted a LOS D standard. This ensures more residual capacity along arterials and at intersections.
Table 5-4
Level of Service Definitions for Unsignalized Intersections
Level of Service Control Delay per Vehicle (secs)
A < 10 B > 10 and < 15 C > 15 and < 25 D > 25 and < 35 E > 35 and < 50 F > 50
Source: Transportation Research Board, Highway Capacity Manual, 2000 EXISTING INTERSECTION OPERATING CONDITIONS The morning and evening peak-hour level of service analyses were conducted for the 63 study intersections based on the measured traffic volumes and the methodologies described above. The City of Garden Grove has established LOS D as its criterion for an acceptable level of service. The majority of the City’s intersections are operating at acceptable LOS D or better conditions for the both AM and PM peak hours. There are only four intersections operating at an
5-10
unacceptable LOS (LOS E or F) according to City of Garden Grove’s standards during AM or PM peak hours or both. These intersections are:
Lampson Avenue at Gilbert Street (PM) Garden Grove Boulevard at Valley View Street (PM) Garden Grove Boulevard at Goldenwest Street (AM/PM) Garden Grove Boulevard at Beach Boulevard (AM)
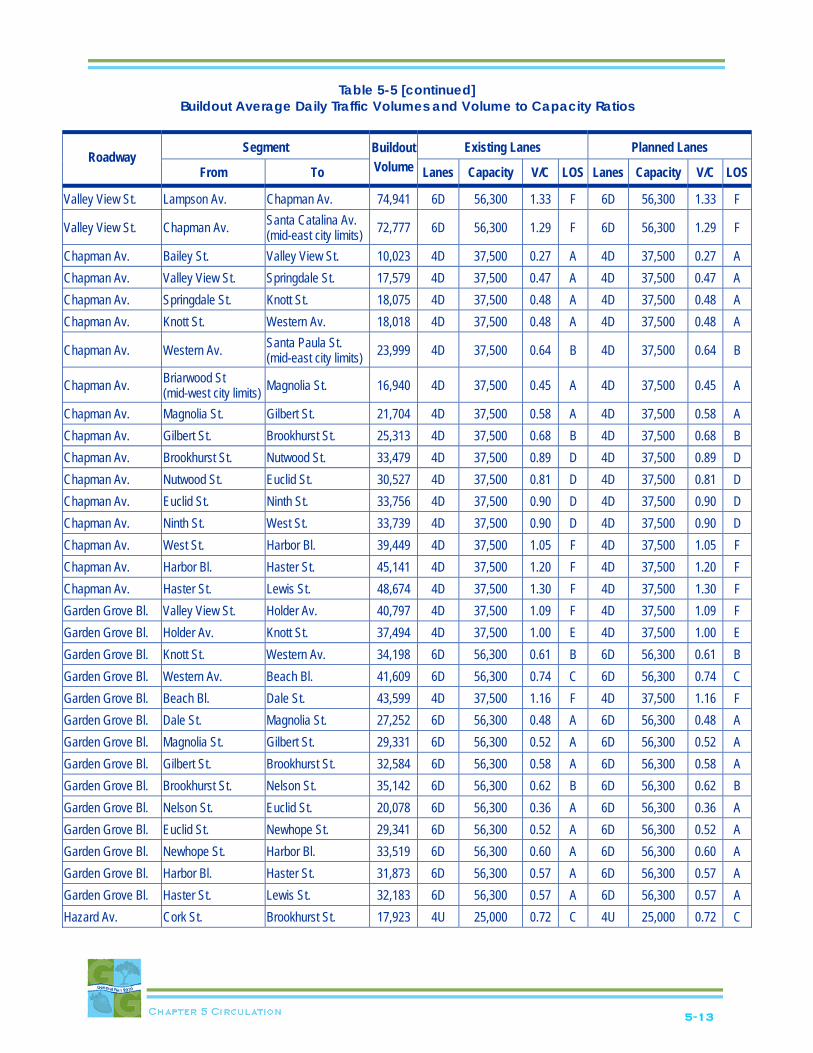
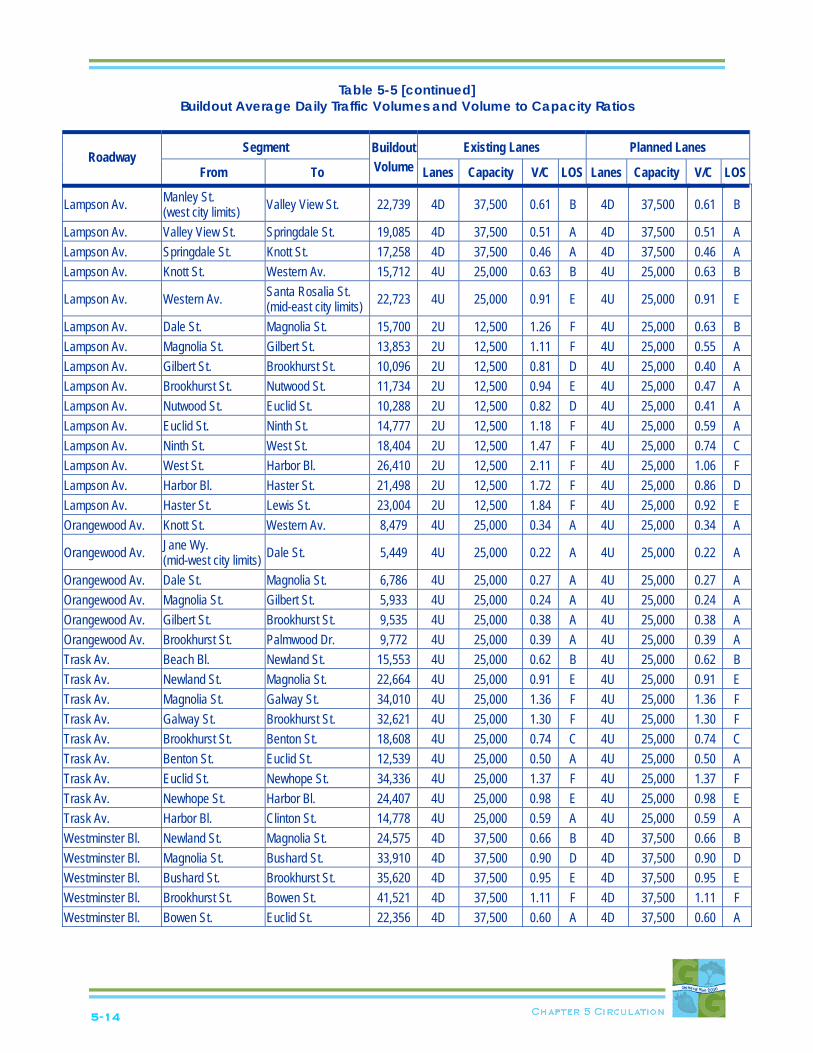
5.6 BUILDOUT VOLUMES AND LEVELS OF SERVICE General Plan Buildout traffic forecasts have been modeled by Iteris, Inc., based on data provided by the Orange County Transportation Authority (OCTA) and the City of Garden Grove Planning Department. Modeled forecast volumes are used to anticipate possible improvements associated with future traffic volume growth. In this way, arterial and intersection capacity will be sufficient to accommodate the traffic generated by the future land uses, and the Circulation Element is balanced with the Land Use Element. A detailed description of the traffic modeling procedures, including the trip generation, trip assignment and model validation, is included in the City of Garden Grove Traffic Model: Model Validation Report, available at the City of Garden Grove, Community Development Department, Planning Division. GENERAL PLAN BUILDOUT ROADWAY SEGMENT OPERATING CONDITIONS Table 5-5, Buildout Average Daily Traffic Volumes and Volume to Capacity Ratios, summarizes and Exhibit CIR-3, Land Use Plan Daily Traffic Volumes and Volume to Capacity Ratios, shows the General Plan Buildout ADT Volumes and Volume to Capacity (V/C) Ratios along primary roadways within the study area with current and future planned roadway improvements. The volumes shown are the average daily traffic that the roadway may be carrying under Buildout conditions. The V/C ranges used to determine the Level of Service for the roadway and the theoretical capacities of roadways determined by the number of lanes and type of roadway were previously presented. Roadways operating at a Level of Service of D or better are considered to be operating at an acceptable level of service. Roadways operating at a Level of Service E or worse are considered to be operating at deficient levels. The following roadway segments are projected to be operating deficiently:
Brookhurst Street from Hazard Avenue to Garden Grove Boulevard Euclid Street from Hazard Avenue to Garden Grove Boulevard Euclid Street from Chapman Avenue to Katella Avenue Harbor Boulevard from Hazard Avenue to Lampson Avenue Haster Street from Chapman Avenue to Simmons Avenue Magnolia Street from Westminster Avenue to Garden Grove Boulevard Newhope Street from Westminster Boulevard to Trask Avenue Western Avenue from Chapman Avenue to Orangewood Avenue Valley View Street from south of Garden Grove Boulevard to Santa Catalina Avenue Chapman Avenue from West Street to Lewis Street Garden Grove Boulevard from Valley View Street to Dale Street Garden Grove Boulevard from Brookhurst Street to Nelson Street Lampson Avenue from Manley Street to Valley View Street

5-11
Lampson Avenue from Western Avenue to Santa Rosalia Street Lampson Avenue from West Street to Harbor Boulevard Lampson Avenue from Haster Street to Lewis Street Trask Avenue from Newland Street to Brookhurst Street Trask Avenue from Euclid Street to Harbor Boulevard Westminster Boulevard from Bushard Street to Bowen Street Beach Boulevard from Trask Avenue to Lampson Avenue
A significant reason for the above segments to operate at deficient levels of service is the impacts of regional traffic on the area. Even with the expansion of the SR-22 corridor, many of the arterial corridors will continue to experience high traffic volumes. Although these segments exceed the LOS D threshold, other factors such as intersection level of service and freeway access intersection operation, will determine actual system operational performance.
Table 5-5 Buildout Average Daily Traffic Volumes and Volume to Capacity Ratios
Segment Existing Lanes Planned Lanes Roadway
From To Buildout Volume Lanes Capacity V/C LOS Lanes Capacity V/C LOS
Brookhurst St. Hazard Av. Westminster Bl. 54,871 6D 56,300 0.97 E 6D 56,300 0.97 E Brookhurst St. Westminster Bl. Trask Av. 61,820 6D 56,300 1.10 F 6D 56,300 1.10 F Brookhurst St. Trask Av. Garden Grove Bl. 55,847 6D 56,300 0.99 E 6D 56,300 0.99 E Brookhurst St. Garden Grove Bl. Lampson Av. 47,424 6D 56,300 0.84 D 6D 56,300 0.84 D Brookhurst St. Lampson Av. Chapman Av. 46,672 6D 56,300 0.83 D 6D 56,300 0.83 D Brookhurst St. Chapman Av. Orangewood Av. 45,456 6D 56,300 0.81 D 6D 56,300 0.81 D Brookhurst St. Orangewood Av. Katella Av. 41,696 6D 56,300 0.74 C 6D 56,300 0.74 C Dale St. Garden Grove Bl. Lampson Av. 11,867 4U 25,000 0.47 A 4U 25,000 0.47 A Dale St. Chapman Av. Orangewood Av. 13,981 4U 25,000 0.56 A 4U 25,000 0.56 A Dale St. Orangewood Av. Katella Av. 16,521 4U 25,000 0.66 B 4U 25,000 0.66 B Euclid St. Hazard Av. Westminster Bl. 52,623 6D 56,300 0.93 E 6D 56,300 0.93 E Euclid St. Westminster Bl. Trask Av. 56,264 6D 56,300 1.00 E 6D 56,300 1.00 E Euclid St. Trask Av. Garden Grove Bl. 57,643 6D 56,300 1.02 F 6D 56,300 1.02 F Euclid St. Garden Grove Bl. Lampson Av. 38,190 6D 56,300 0.68 B 6D 56,300 0.68 B Euclid St. Lampson Av. Chapman Av. 39,799 6D 56,300 0.71 C 6D 56,300 0.71 C Euclid St. Chapman Av. Orangewood Av. 37,979 4D 37,500 1.01 F 4D 37,500 1.01 F Euclid St. Orangewood Av. Katella Av. 38,939 4D 37,500 1.04 F 4D 37,500 1.04 F Gilbert St. Trask Av. Garden Grove Bl. 8,415 2U 15,000 0.56 A 4U 25,000 0.34 A Gilbert St. Garden Grove Bl. Lampson Av. 12,064 2U 15,000 0.80 C 4U 25,000 0.48 A Gilbert St. Lampson Av. Chapman Av. 10,992 2U 15,000 0.73 C 4U 25,000 0.44 A Gilbert St. Chapman Av. Orangewood Av. 15,467 4U 25,000 0.62 B 4U 25,000 0.62 B Gilbert St. Orangewood Av. Katella Av. 15,488 4U 25,000 0.62 B 4U 25,000 0.62 B Harbor Bl. Hazard Av. Westminster Bl. 54,376 6D 56,300 0.97 E 6D 56,300 0.97 E Harbor Bl. Westminster Bl. Trask Av. 62,305 6D 56,300 1.11 F 6D 56,300 1.11 F Harbor Bl. Trask Av. Garden Grove Bl. 62,239 6D 56,300 1.11 F 6D 56,300 1.11 F Harbor Bl. Garden Grove Bl. Lampson Av. 52,413 6D 56,300 0.93 E 6D 56,300 0.93 E

5-12
Table 5-5 [continued] Buildout Average Daily Traffic Volumes and Volume to Capacity Ratios
Segment Existing Lanes Planned Lanes Roadway
From To
Buildout Volume Lanes Capacity V/C LOS Lanes Capacity V/C LOS
Harbor Bl. Lampson Av. Chapman Av. 45,103 6D 56,300 0.80 C 6D 56,300 0.80 C
Harbor Bl. Chapman Av. Wilken Way (north city limits) 42,564 6D 56,300 0.76 C 6D 56,300 0.76 C
Haster St. Garden Grove Bl. Lampson Av. 30,264 4D 37,500 0.81 D 4D 37,500 0.81 D Haster St. Lampson Av. Chapman Av. 33,727 4D 37,500 0.90 D 4D 37,500 0.90 D
Haster St. Chapman Av. Simmons Av. (north city limits) 33,991 4D 37,500 0.91 E 4D 37,500 0.91 E
Goldenwest St. Trask Av. Garden Grove Bl. 46,873 6D 56,300 0.83 D 6D 56,300 0.83 D Knott St. Garden Grove Bl. Lampson Av. 49,204 6D 56,300 0.87 D 6D 56,300 0.87 D Knott St. Lampson Av. Chapman Av. 46,596 6D 56,300 0.83 D 6D 56,300 0.83 D Knott St. Chapman Av. Orangewood Av. 40,694 6D 56,300 0.72 C 6D 56,300 0.72 C Magnolia St. Hazard Av. Westminster Bl. 49,090 6D 56,300 0.87 D 6D 56,300 0.87 D Magnolia St. Westminster Bl. Trask Av. 45,581 6D 56,300 0.81 D 6D 56,300 0.81 D Magnolia St. Trask Av. Garden Grove Bl. 41,765 4D 37,500 1.11 F 4D 37,500 1.11 F Magnolia St. Garden Grove Bl. Lampson Av. 30,938 4D 37,500 0.83 D 4D 37,500 0.83 D Magnolia St. Lampson Av. Chapman Av. 28,592 4D 37,500 0.76 C 4D 37,500 0.76 C Magnolia St. Chapman Av. Orangewood Av. 19,542 4D 37,500 0.52 A 4D 37,500 0.52 A Magnolia St. Orangewood Av. Katella Av. 20,511 4D 37,500 0.55 A 4D 37,500 0.55 A Newhope St. Westminster Bl. Trask Av. 32,706 4U 25,000 1.31 F 4U 25,000 1.31 F Newhope St. Trask Av. Garden Grove Bl. 25,577 4U 25,000 1.02 F 4U 25,000 1.02 F Newland St. Westminster Bl. Trask Av. 25,178 4U 25,000 1.01 F 4U 25,000 1.01 F Newland St. Trask Av. Garden Grove Bl. 22,235 4U 25,000 0.89 D 4U 25,000 0.89 D Ninth St. Garden Grove Bl. Lampson Av. 13,165 2U 15,000 0.88 D 4U 25,000 0.53 A Ninth St. Lampson Av. Chapman Av. 12,001 2U 15,000 0.80 C 4U 25,000 0.48 A Ninth St. Chapman Av. Orangewood Av. 14,307 2U 15,000 0.95 E 4U 25,000 0.57 A Springdale St. Garden Grove Bl. Lampson Av. 19,625 4U 25,000 0.79 C 4U 25,000 0.79 C Springdale St. Lampson Av. Chapman Av. 18,614 4U 25,000 0.74 C 4U 25,000 0.74 C
Springdale St. Chapman Av. Santa Catalina Av. (north city limits) 11,303 4U 25,000 0.45 A 4U 25,000 0.45 A
West St. Garden Grove Bl. Lampson Av. 20,039 4U 25,000 0.80 C 4U 25,000 0.80 C West St. Lampson Av. Chapman Av. 19,453 4U 25,000 0.78 C 4U 25,000 0.78 C West St. Chapman Av. Orangewood Av. 19,034 4U 25,000 0.76 C 4U 25,000 0.76 C Western Av. Garden Grove Bl. Lampson Av. 19,571 4U 25,000 0.78 C 4U 25,000 0.78 C Western Av. Lampson Av. Chapman Av. 21,773 4U 25,000 0.87 D 4U 25,000 0.87 D Western Av. Chapman Av. Orangewood Av. 25,461 4U 25,000 1.02 F 4U 25,000 1.02 F
Valley View St. s/o Garden Grove Bl. Garden Grove Bl. 76,527 6D 56,300 1.36 F 6D 56,300 1.36 F
Valley View St. Garden Grove Bl. Lampson Av. 73,820 6D 56,300 1.31 F 6D 56,300 1.31 F
5-13
Table 5-5 [continued] Buildout Average Daily Traffic Volumes and Volume to Capacity Ratios
Segment Existing Lanes Planned Lanes Roadway
From To
Buildout Volume Lanes Capacity V/C LOS Lanes Capacity V/C LOS
Valley View St. Lampson Av. Chapman Av. 74,941 6D 56,300 1.33 F 6D 56,300 1.33 F
Valley View St. Chapman Av. Santa Catalina Av. (mid-east city limits) 72,777 6D 56,300 1.29 F 6D 56,300 1.29 F
Chapman Av. Bailey St. Valley View St. 10,023 4D 37,500 0.27 A 4D 37,500 0.27 A Chapman Av. Valley View St. Springdale St. 17,579 4D 37,500 0.47 A 4D 37,500 0.47 A Chapman Av. Springdale St. Knott St. 18,075 4D 37,500 0.48 A 4D 37,500 0.48 A Chapman Av. Knott St. Western Av. 18,018 4D 37,500 0.48 A 4D 37,500 0.48 A
Chapman Av. Western Av. Santa Paula St. (mid-east city limits) 23,999 4D 37,500 0.64 B 4D 37,500 0.64 B
Chapman Av. Briarwood St (mid-west city limits) Magnolia St. 16,940 4D 37,500 0.45 A 4D 37,500 0.45 A
Chapman Av. Magnolia St. Gilbert St. 21,704 4D 37,500 0.58 A 4D 37,500 0.58 A Chapman Av. Gilbert St. Brookhurst St. 25,313 4D 37,500 0.68 B 4D 37,500 0.68 B Chapman Av. Brookhurst St. Nutwood St. 33,479 4D 37,500 0.89 D 4D 37,500 0.89 D Chapman Av. Nutwood St. Euclid St. 30,527 4D 37,500 0.81 D 4D 37,500 0.81 D Chapman Av. Euclid St. Ninth St. 33,756 4D 37,500 0.90 D 4D 37,500 0.90 D Chapman Av. Ninth St. West St. 33,739 4D 37,500 0.90 D 4D 37,500 0.90 D Chapman Av. West St. Harbor Bl. 39,449 4D 37,500 1.05 F 4D 37,500 1.05 F Chapman Av. Harbor Bl. Haster St. 45,141 4D 37,500 1.20 F 4D 37,500 1.20 F Chapman Av. Haster St. Lewis St. 48,674 4D 37,500 1.30 F 4D 37,500 1.30 F Garden Grove Bl. Valley View St. Holder Av. 40,797 4D 37,500 1.09 F 4D 37,500 1.09 F Garden Grove Bl. Holder Av. Knott St. 37,494 4D 37,500 1.00 E 4D 37,500 1.00 E Garden Grove Bl. Knott St. Western Av. 34,198 6D 56,300 0.61 B 6D 56,300 0.61 B Garden Grove Bl. Western Av. Beach Bl. 41,609 6D 56,300 0.74 C 6D 56,300 0.74 C Garden Grove Bl. Beach Bl. Dale St. 43,599 4D 37,500 1.16 F 4D 37,500 1.16 F Garden Grove Bl. Dale St. Magnolia St. 27,252 6D 56,300 0.48 A 6D 56,300 0.48 A Garden Grove Bl. Magnolia St. Gilbert St. 29,331 6D 56,300 0.52 A 6D 56,300 0.52 A Garden Grove Bl. Gilbert St. Brookhurst St. 32,584 6D 56,300 0.58 A 6D 56,300 0.58 A Garden Grove Bl. Brookhurst St. Nelson St. 35,142 6D 56,300 0.62 B 6D 56,300 0.62 B Garden Grove Bl. Nelson St. Euclid St. 20,078 6D 56,300 0.36 A 6D 56,300 0.36 A Garden Grove Bl. Euclid St. Newhope St. 29,341 6D 56,300 0.52 A 6D 56,300 0.52 A Garden Grove Bl. Newhope St. Harbor Bl. 33,519 6D 56,300 0.60 A 6D 56,300 0.60 A Garden Grove Bl. Harbor Bl. Haster St. 31,873 6D 56,300 0.57 A 6D 56,300 0.57 A Garden Grove Bl. Haster St. Lewis St. 32,183 6D 56,300 0.57 A 6D 56,300 0.57 A Hazard Av. Cork St. Brookhurst St. 17,923 4U 25,000 0.72 C 4U 25,000 0.72 C
5-14
Table 5-5 [continued] Buildout Average Daily Traffic Volumes and Volume to Capacity Ratios
Segment Existing Lanes Planned Lanes Roadway
From To
Buildout Volume Lanes Capacity V/C LOS Lanes Capacity V/C LOS
Lampson Av. Manley St. (west city limits) Valley View St. 22,739 4D 37,500 0.61 B 4D 37,500 0.61 B
Lampson Av. Valley View St. Springdale St. 19,085 4D 37,500 0.51 A 4D 37,500 0.51 A Lampson Av. Springdale St. Knott St. 17,258 4D 37,500 0.46 A 4D 37,500 0.46 A Lampson Av. Knott St. Western Av. 15,712 4U 25,000 0.63 B 4U 25,000 0.63 B
Lampson Av. Western Av. Santa Rosalia St. (mid-east city limits) 22,723 4U 25,000 0.91 E 4U 25,000 0.91 E
Lampson Av. Dale St. Magnolia St. 15,700 2U 12,500 1.26 F 4U 25,000 0.63 B Lampson Av. Magnolia St. Gilbert St. 13,853 2U 12,500 1.11 F 4U 25,000 0.55 A Lampson Av. Gilbert St. Brookhurst St. 10,096 2U 12,500 0.81 D 4U 25,000 0.40 A Lampson Av. Brookhurst St. Nutwood St. 11,734 2U 12,500 0.94 E 4U 25,000 0.47 A Lampson Av. Nutwood St. Euclid St. 10,288 2U 12,500 0.82 D 4U 25,000 0.41 A Lampson Av. Euclid St. Ninth St. 14,777 2U 12,500 1.18 F 4U 25,000 0.59 A Lampson Av. Ninth St. West St. 18,404 2U 12,500 1.47 F 4U 25,000 0.74 C Lampson Av. West St. Harbor Bl. 26,410 2U 12,500 2.11 F 4U 25,000 1.06 F Lampson Av. Harbor Bl. Haster St. 21,498 2U 12,500 1.72 F 4U 25,000 0.86 D Lampson Av. Haster St. Lewis St. 23,004 2U 12,500 1.84 F 4U 25,000 0.92 E Orangewood Av. Knott St. Western Av. 8,479 4U 25,000 0.34 A 4U 25,000 0.34 A
Orangewood Av. Jane Wy. (mid-west city limits) Dale St. 5,449 4U 25,000 0.22 A 4U 25,000 0.22 A
Orangewood Av. Dale St. Magnolia St. 6,786 4U 25,000 0.27 A 4U 25,000 0.27 A Orangewood Av. Magnolia St. Gilbert St. 5,933 4U 25,000 0.24 A 4U 25,000 0.24 A Orangewood Av. Gilbert St. Brookhurst St. 9,535 4U 25,000 0.38 A 4U 25,000 0.38 A Orangewood Av. Brookhurst St. Palmwood Dr. 9,772 4U 25,000 0.39 A 4U 25,000 0.39 A Trask Av. Beach Bl. Newland St. 15,553 4U 25,000 0.62 B 4U 25,000 0.62 B Trask Av. Newland St. Magnolia St. 22,664 4U 25,000 0.91 E 4U 25,000 0.91 E Trask Av. Magnolia St. Galway St. 34,010 4U 25,000 1.36 F 4U 25,000 1.36 F Trask Av. Galway St. Brookhurst St. 32,621 4U 25,000 1.30 F 4U 25,000 1.30 F Trask Av. Brookhurst St. Benton St. 18,608 4U 25,000 0.74 C 4U 25,000 0.74 C Trask Av. Benton St. Euclid St. 12,539 4U 25,000 0.50 A 4U 25,000 0.50 A Trask Av. Euclid St. Newhope St. 34,336 4U 25,000 1.37 F 4U 25,000 1.37 F Trask Av. Newhope St. Harbor Bl. 24,407 4U 25,000 0.98 E 4U 25,000 0.98 E Trask Av. Harbor Bl. Clinton St. 14,778 4U 25,000 0.59 A 4U 25,000 0.59 A Westminster Bl. Newland St. Magnolia St. 24,575 4D 37,500 0.66 B 4D 37,500 0.66 B Westminster Bl. Magnolia St. Bushard St. 33,910 4D 37,500 0.90 D 4D 37,500 0.90 D Westminster Bl. Bushard St. Brookhurst St. 35,620 4D 37,500 0.95 E 4D 37,500 0.95 E Westminster Bl. Brookhurst St. Bowen St. 41,521 4D 37,500 1.11 F 4D 37,500 1.11 F Westminster Bl. Bowen St. Euclid St. 22,356 4D 37,500 0.60 A 4D 37,500 0.60 A
5-15
Table 5-5 [continued] Buildout Average Daily Traffic Volumes and Volume to Capacity Ratios
Segment Existing Lanes Planned Lanes Roadway
From To
Buildout Volume Lanes Capacity V/C LOS Lanes Capacity V/C LOS
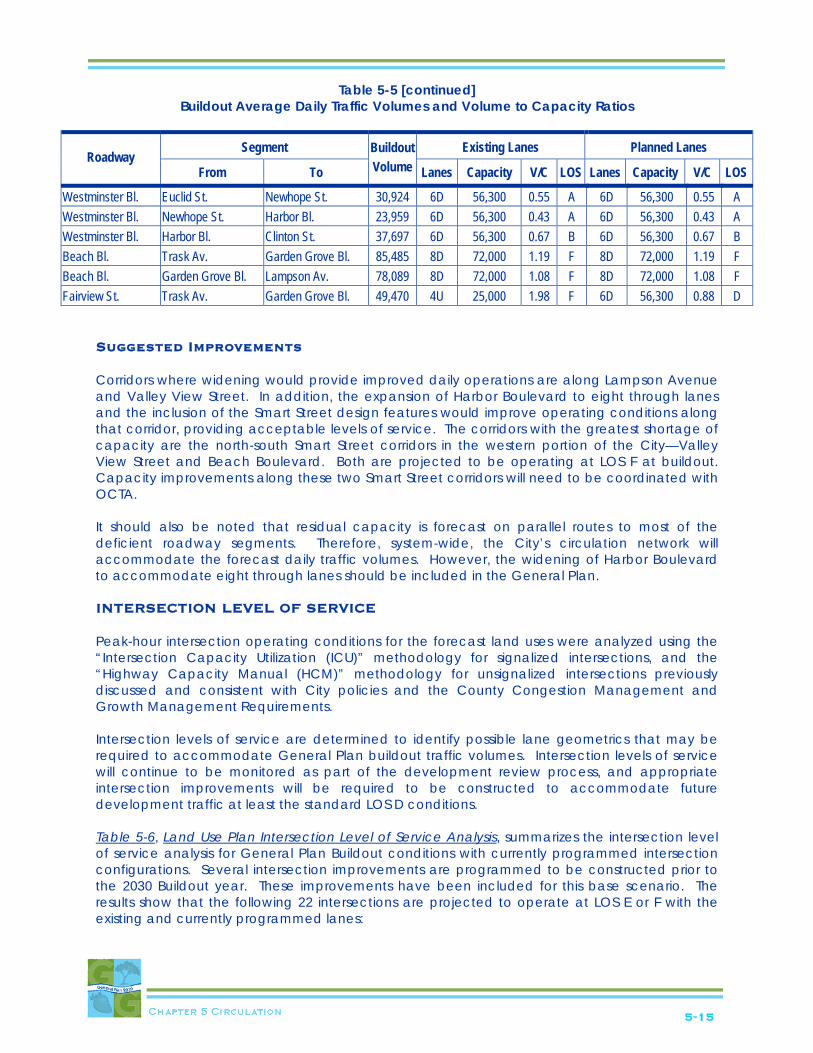
Westminster Bl. Euclid St. Newhope St. 30,924 6D 56,300 0.55 A 6D 56,300 0.55 A Westminster Bl. Newhope St. Harbor Bl. 23,959 6D 56,300 0.43 A 6D 56,300 0.43 A Westminster Bl. Harbor Bl. Clinton St. 37,697 6D 56,300 0.67 B 6D 56,300 0.67 B Beach Bl. Trask Av. Garden Grove Bl. 85,485 8D 72,000 1.19 F 8D 72,000 1.19 F Beach Bl. Garden Grove Bl. Lampson Av. 78,089 8D 72,000 1.08 F 8D 72,000 1.08 F Fairview St. Trask Av. Garden Grove Bl. 49,470 4U 25,000 1.98 F 6D 56,300 0.88 D
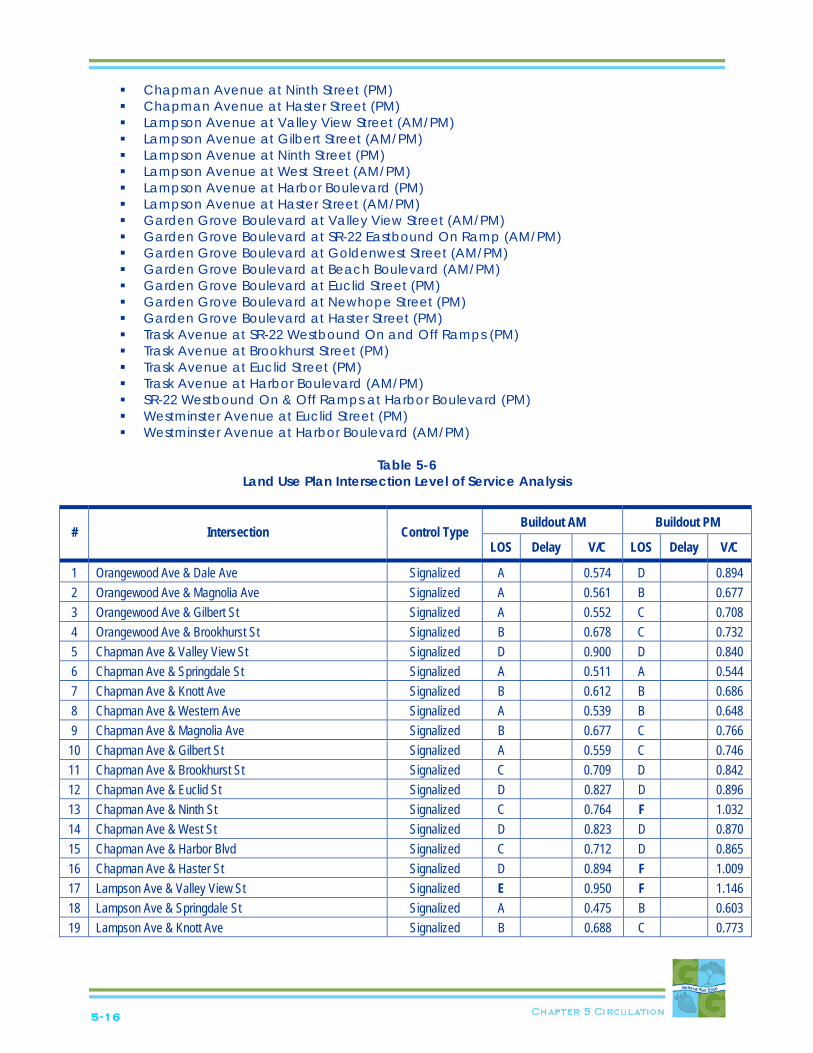
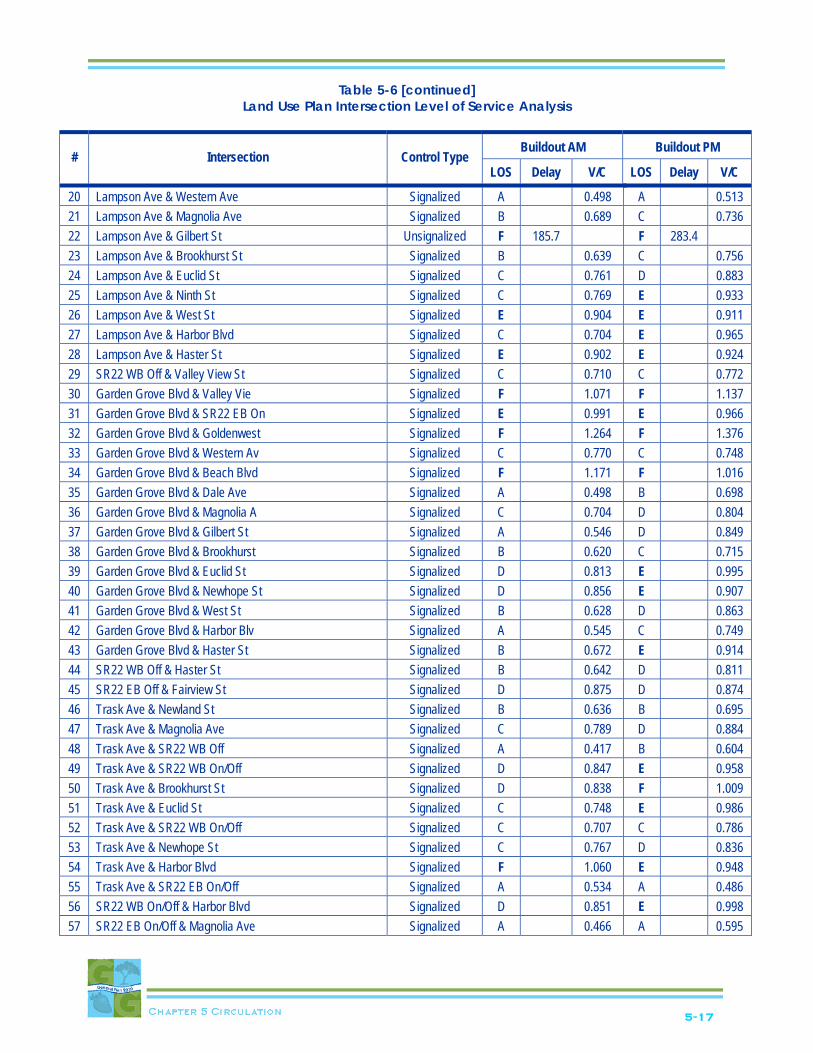
Suggested Improvements Corridors where widening would provide improved daily operations are along Lampson Avenue and Valley View Street. In addition, the expansion of Harbor Boulevard to eight through lanes and the inclusion of the Smart Street design features would improve operating conditions along that corridor, providing acceptable levels of service. The corridors with the greatest shortage of capacity are the north-south Smart Street corridors in the western portion of the City—Valley View Street and Beach Boulevard. Both are projected to be operating at LOS F at buildout. Capacity improvements along these two Smart Street corridors will need to be coordinated with OCTA. It should also be noted that residual capacity is forecast on parallel routes to most of the deficient roadway segments. Therefore, system-wide, the City’s circulation network will accommodate the forecast daily traffic volumes. However, the widening of Harbor Boulevard to accommodate eight through lanes should be included in the General Plan. INTERSECTION LEVEL OF SERVICE Peak-hour intersection operating conditions for the forecast land uses were analyzed using the “Intersection Capacity Utilization (ICU)” methodology for signalized intersections, and the “Highway Capacity Manual (HCM)” methodology for unsignalized intersections previously discussed and consistent with City policies and the County Congestion Management and Growth Management Requirements. Intersection levels of service are determined to identify possible lane geometrics that may be required to accommodate General Plan buildout traffic volumes. Intersection levels of service will continue to be monitored as part of the development review process, and appropriate intersection improvements will be required to be constructed to accommodate future development traffic at least the standard LOS D conditions. Table 5-6, Land Use Plan Intersection Level of Service Analysis, summarizes the intersection level of service analysis for General Plan Buildout conditions with currently programmed intersection configurations. Several intersection improvements are programmed to be constructed prior to the 2030 Buildout year. These improvements have been included for this base scenario. The results show that the following 22 intersections are projected to operate at LOS E or F with the existing and currently programmed lanes:
5-16
Chapman Avenue at Ninth Street (PM) Chapman Avenue at Haster Street (PM) Lampson Avenue at Valley View Street (AM/PM) Lampson Avenue at Gilbert Street (AM/PM) Lampson Avenue at Ninth Street (PM) Lampson Avenue at West Street (AM/PM) Lampson Avenue at Harbor Boulevard (PM) Lampson Avenue at Haster Street (AM/PM) Garden Grove Boulevard at Valley View Street (AM/PM) Garden Grove Boulevard at SR-22 Eastbound On Ramp (AM/PM) Garden Grove Boulevard at Goldenwest Street (AM/PM) Garden Grove Boulevard at Beach Boulevard (AM/PM) Garden Grove Boulevard at Euclid Street (PM) Garden Grove Boulevard at Newhope Street (PM) Garden Grove Boulevard at Haster Street (PM) Trask Avenue at SR-22 Westbound On and Off Ramps (PM) Trask Avenue at Brookhurst Street (PM) Trask Avenue at Euclid Street (PM) Trask Avenue at Harbor Boulevard (AM/PM) SR-22 Westbound On & Off Ramps at Harbor Boulevard (PM) Westminster Avenue at Euclid Street (PM) Westminster Avenue at Harbor Boulevard (AM/PM)
Table 5-6
Land Use Plan Intersection Level of Service Analysis
Buildout AM Buildout PM # Intersection Control Type
LOS Delay V/C LOS Delay V/C
1 Orangewood Ave & Dale Ave Signalized A 0.574 D 0.894 2 Orangewood Ave & Magnolia Ave Signalized A 0.561 B 0.677 3 Orangewood Ave & Gilbert St Signalized A 0.552 C 0.708 4 Orangewood Ave & Brookhurst St Signalized B 0.678 C 0.732 5 Chapman Ave & Valley View St Signalized D 0.900 D 0.840 6 Chapman Ave & Springdale St Signalized A 0.511 A 0.544 7 Chapman Ave & Knott Ave Signalized B 0.612 B 0.686 8 Chapman Ave & Western Ave Signalized A 0.539 B 0.648 9 Chapman Ave & Magnolia Ave Signalized B 0.677 C 0.766 10 Chapman Ave & Gilbert St Signalized A 0.559 C 0.746 11 Chapman Ave & Brookhurst St Signalized C 0.709 D 0.842 12 Chapman Ave & Euclid St Signalized D 0.827 D 0.896 13 Chapman Ave & Ninth St Signalized C 0.764 F 1.032 14 Chapman Ave & West St Signalized D 0.823 D 0.870 15 Chapman Ave & Harbor Blvd Signalized C 0.712 D 0.865 16 Chapman Ave & Haster St Signalized D 0.894 F 1.009 17 Lampson Ave & Valley View St Signalized E 0.950 F 1.146 18 Lampson Ave & Springdale St Signalized A 0.475 B 0.603 19 Lampson Ave & Knott Ave Signalized B 0.688 C 0.773
5-17
Table 5-6 [continued] Land Use Plan Intersection Level of Service Analysis
Buildout AM Buildout PM # Intersection Control Type
LOS Delay V/C LOS Delay V/C
20 Lampson Ave & Western Ave Signalized A 0.498 A 0.513 21 Lampson Ave & Magnolia Ave Signalized B 0.689 C 0.736 22 Lampson Ave & Gilbert St Unsignalized F 185.7 F 283.4 23 Lampson Ave & Brookhurst St Signalized B 0.639 C 0.756 24 Lampson Ave & Euclid St Signalized C 0.761 D 0.883 25 Lampson Ave & Ninth St Signalized C 0.769 E 0.933 26 Lampson Ave & West St Signalized E 0.904 E 0.911 27 Lampson Ave & Harbor Blvd Signalized C 0.704 E 0.965 28 Lampson Ave & Haster St Signalized E 0.902 E 0.924 29 SR22 WB Off & Valley View St Signalized C 0.710 C 0.772 30 Garden Grove Blvd & Valley Vie Signalized F 1.071 F 1.137 31 Garden Grove Blvd & SR22 EB On Signalized E 0.991 E 0.966 32 Garden Grove Blvd & Goldenwest Signalized F 1.264 F 1.376 33 Garden Grove Blvd & Western Av Signalized C 0.770 C 0.748 34 Garden Grove Blvd & Beach Blvd Signalized F 1.171 F 1.016 35 Garden Grove Blvd & Dale Ave Signalized A 0.498 B 0.698 36 Garden Grove Blvd & Magnolia A Signalized C 0.704 D 0.804 37 Garden Grove Blvd & Gilbert St Signalized A 0.546 D 0.849 38 Garden Grove Blvd & Brookhurst Signalized B 0.620 C 0.715 39 Garden Grove Blvd & Euclid St Signalized D 0.813 E 0.995 40 Garden Grove Blvd & Newhope St Signalized D 0.856 E 0.907 41 Garden Grove Blvd & West St Signalized B 0.628 D 0.863 42 Garden Grove Blvd & Harbor Blv Signalized A 0.545 C 0.749 43 Garden Grove Blvd & Haster St Signalized B 0.672 E 0.914 44 SR22 WB Off & Haster St Signalized B 0.642 D 0.811 45 SR22 EB Off & Fairview St Signalized D 0.875 D 0.874 46 Trask Ave & Newland St Signalized B 0.636 B 0.695 47 Trask Ave & Magnolia Ave Signalized C 0.789 D 0.884 48 Trask Ave & SR22 WB Off Signalized A 0.417 B 0.604 49 Trask Ave & SR22 WB On/Off Signalized D 0.847 E 0.958 50 Trask Ave & Brookhurst St Signalized D 0.838 F 1.009 51 Trask Ave & Euclid St Signalized C 0.748 E 0.986 52 Trask Ave & SR22 WB On/Off Signalized C 0.707 C 0.786 53 Trask Ave & Newhope St Signalized C 0.767 D 0.836 54 Trask Ave & Harbor Blvd Signalized F 1.060 E 0.948 55 Trask Ave & SR22 EB On/Off Signalized A 0.534 A 0.486 56 SR22 WB On/Off & Harbor Blvd Signalized D 0.851 E 0.998 57 SR22 EB On/Off & Magnolia Ave Signalized A 0.466 A 0.595
5-18
Table 5-6 [continued] Land Use Plan Intersection Level of Service Analysis
Buildout AM Buildout PM # Intersection Control Type
LOS Delay V/C LOS Delay V/C
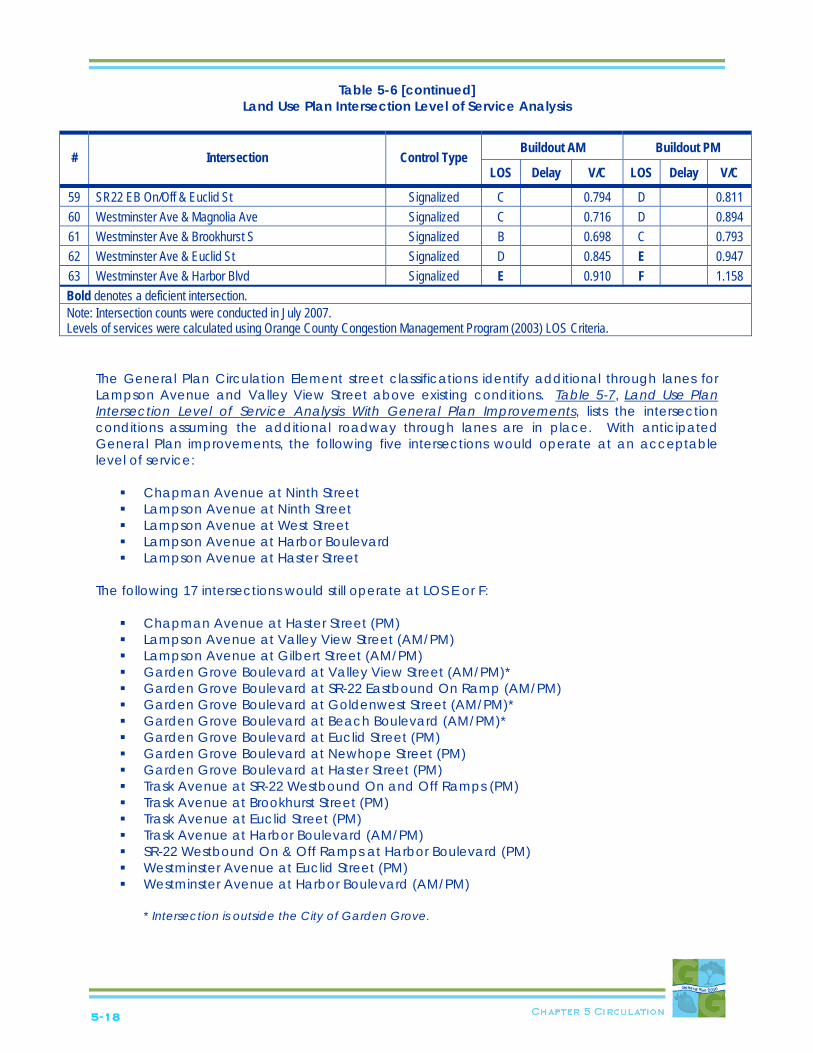
59 SR22 EB On/Off & Euclid St Signalized C 0.794 D 0.811 60 Westminster Ave & Magnolia Ave Signalized C 0.716 D 0.894 61 Westminster Ave & Brookhurst S Signalized B 0.698 C 0.793 62 Westminster Ave & Euclid St Signalized D 0.845 E 0.947 63 Westminster Ave & Harbor Blvd Signalized E 0.910 F 1.158 Bold denotes a deficient intersection. Note: Intersection counts were conducted in July 2007. Levels of services were calculated using Orange County Congestion Management Program (2003) LOS Criteria.
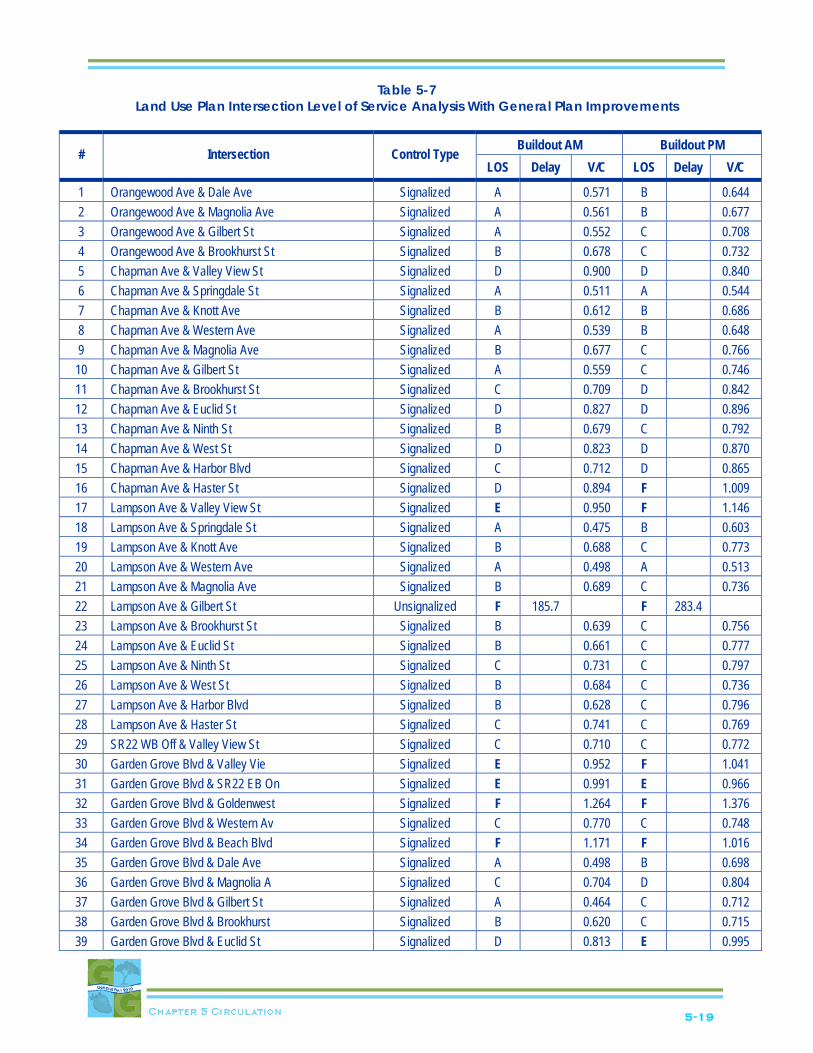
The General Plan Circulation Element street classifications identify additional through lanes for Lampson Avenue and Valley View Street above existing conditions. Table 5-7, Land Use Plan Intersection Level of Service Analysis With General Plan Improvements, lists the intersection conditions assuming the additional roadway through lanes are in place. With anticipated General Plan improvements, the following five intersections would operate at an acceptable level of service:
Chapman Avenue at Ninth Street Lampson Avenue at Ninth Street Lampson Avenue at West Street Lampson Avenue at Harbor Boulevard Lampson Avenue at Haster Street
The following 17 intersections would still operate at LOS E or F:
Chapman Avenue at Haster Street (PM) Lampson Avenue at Valley View Street (AM/PM) Lampson Avenue at Gilbert Street (AM/PM) Garden Grove Boulevard at Valley View Street (AM/PM)* Garden Grove Boulevard at SR-22 Eastbound On Ramp (AM/PM) Garden Grove Boulevard at Goldenwest Street (AM/PM)* Garden Grove Boulevard at Beach Boulevard (AM/PM)* Garden Grove Boulevard at Euclid Street (PM) Garden Grove Boulevard at Newhope Street (PM) Garden Grove Boulevard at Haster Street (PM) Trask Avenue at SR-22 Westbound On and Off Ramps (PM) Trask Avenue at Brookhurst Street (PM) Trask Avenue at Euclid Street (PM) Trask Avenue at Harbor Boulevard (AM/PM) SR-22 Westbound On & Off Ramps at Harbor Boulevard (PM) Westminster Avenue at Euclid Street (PM) Westminster Avenue at Harbor Boulevard (AM/PM)
* Intersection is outside the City of Garden Grove.
5-19
Table 5-7 Land Use Plan Intersection Level of Service Analysis With General Plan Improvements
Buildout AM Buildout PM # Intersection Control Type
LOS Delay V/C LOS Delay V/C
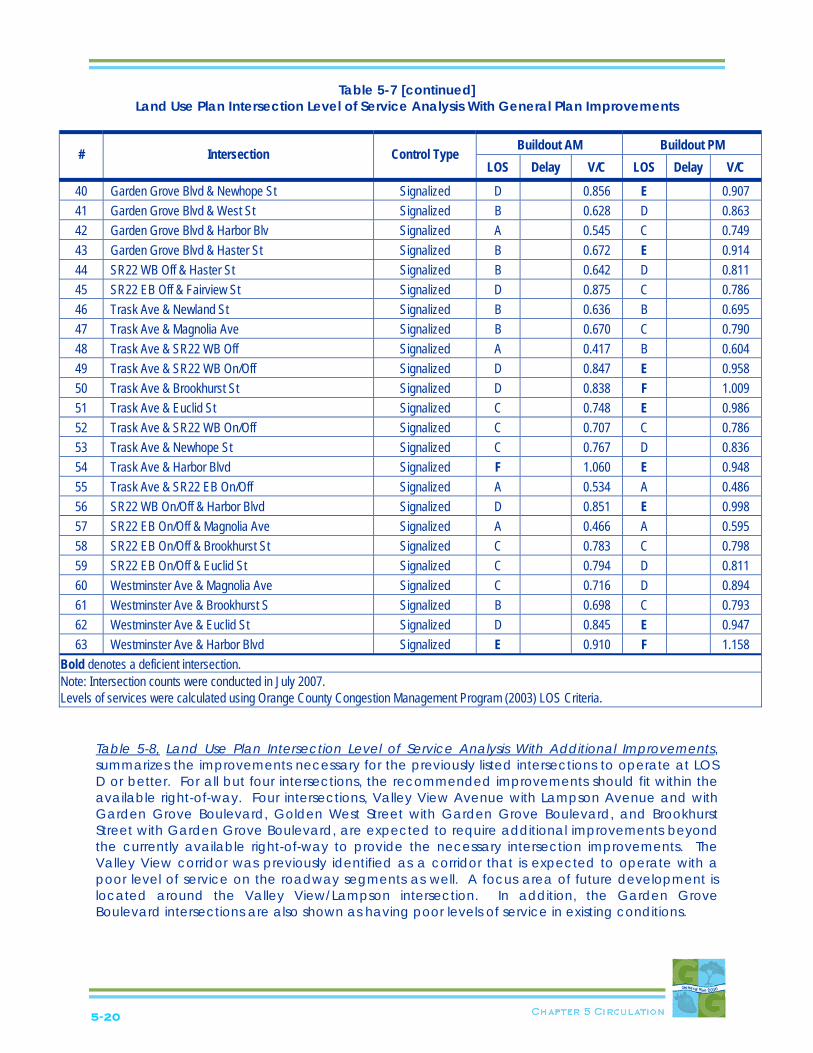
1 Orangewood Ave & Dale Ave Signalized A 0.571 B 0.644 2 Orangewood Ave & Magnolia Ave Signalized A 0.561 B 0.677 3 Orangewood Ave & Gilbert St Signalized A 0.552 C 0.708 4 Orangewood Ave & Brookhurst St Signalized B 0.678 C 0.732 5 Chapman Ave & Valley View St Signalized D 0.900 D 0.840 6 Chapman Ave & Springdale St Signalized A 0.511 A 0.544 7 Chapman Ave & Knott Ave Signalized B 0.612 B 0.686 8 Chapman Ave & Western Ave Signalized A 0.539 B 0.648 9 Chapman Ave & Magnolia Ave Signalized B 0.677 C 0.766 10 Chapman Ave & Gilbert St Signalized A 0.559 C 0.746 11 Chapman Ave & Brookhurst St Signalized C 0.709 D 0.842 12 Chapman Ave & Euclid St Signalized D 0.827 D 0.896 13 Chapman Ave & Ninth St Signalized B 0.679 C 0.792 14 Chapman Ave & West St Signalized D 0.823 D 0.870 15 Chapman Ave & Harbor Blvd Signalized C 0.712 D 0.865 16 Chapman Ave & Haster St Signalized D 0.894 F 1.009 17 Lampson Ave & Valley View St Signalized E 0.950 F 1.146 18 Lampson Ave & Springdale St Signalized A 0.475 B 0.603 19 Lampson Ave & Knott Ave Signalized B 0.688 C 0.773 20 Lampson Ave & Western Ave Signalized A 0.498 A 0.513 21 Lampson Ave & Magnolia Ave Signalized B 0.689 C 0.736 22 Lampson Ave & Gilbert St Unsignalized F 185.7 F 283.4 23 Lampson Ave & Brookhurst St Signalized B 0.639 C 0.756 24 Lampson Ave & Euclid St Signalized B 0.661 C 0.777 25 Lampson Ave & Ninth St Signalized C 0.731 C 0.797 26 Lampson Ave & West St Signalized B 0.684 C 0.736 27 Lampson Ave & Harbor Blvd Signalized B 0.628 C 0.796 28 Lampson Ave & Haster St Signalized C 0.741 C 0.769 29 SR22 WB Off & Valley View St Signalized C 0.710 C 0.772 30 Garden Grove Blvd & Valley Vie Signalized E 0.952 F 1.041 31 Garden Grove Blvd & SR22 EB On Signalized E 0.991 E 0.966 32 Garden Grove Blvd & Goldenwest Signalized F 1.264 F 1.376 33 Garden Grove Blvd & Western Av Signalized C 0.770 C 0.748 34 Garden Grove Blvd & Beach Blvd Signalized F 1.171 F 1.016 35 Garden Grove Blvd & Dale Ave Signalized A 0.498 B 0.698 36 Garden Grove Blvd & Magnolia A Signalized C 0.704 D 0.804 37 Garden Grove Blvd & Gilbert St Signalized A 0.464 C 0.712 38 Garden Grove Blvd & Brookhurst Signalized B 0.620 C 0.715 39 Garden Grove Blvd & Euclid St Signalized D 0.813 E 0.995
5-20
Table 5-7 [continued] Land Use Plan Intersection Level of Service Analysis With General Plan Improvements
Buildout AM Buildout PM # Intersection Control Type
LOS Delay V/C LOS Delay V/C
40 Garden Grove Blvd & Newhope St Signalized D 0.856 E 0.907 41 Garden Grove Blvd & West St Signalized B 0.628 D 0.863 42 Garden Grove Blvd & Harbor Blv Signalized A 0.545 C 0.749 43 Garden Grove Blvd & Haster St Signalized B 0.672 E 0.914 44 SR22 WB Off & Haster St Signalized B 0.642 D 0.811 45 SR22 EB Off & Fairview St Signalized D 0.875 C 0.786 46 Trask Ave & Newland St Signalized B 0.636 B 0.695 47 Trask Ave & Magnolia Ave Signalized B 0.670 C 0.790 48 Trask Ave & SR22 WB Off Signalized A 0.417 B 0.604 49 Trask Ave & SR22 WB On/Off Signalized D 0.847 E 0.958 50 Trask Ave & Brookhurst St Signalized D 0.838 F 1.009 51 Trask Ave & Euclid St Signalized C 0.748 E 0.986 52 Trask Ave & SR22 WB On/Off Signalized C 0.707 C 0.786 53 Trask Ave & Newhope St Signalized C 0.767 D 0.836 54 Trask Ave & Harbor Blvd Signalized F 1.060 E 0.948 55 Trask Ave & SR22 EB On/Off Signalized A 0.534 A 0.486 56 SR22 WB On/Off & Harbor Blvd Signalized D 0.851 E 0.998 57 SR22 EB On/Off & Magnolia Ave Signalized A 0.466 A 0.595 58 SR22 EB On/Off & Brookhurst St Signalized C 0.783 C 0.798 59 SR22 EB On/Off & Euclid St Signalized C 0.794 D 0.811 60 Westminster Ave & Magnolia Ave Signalized C 0.716 D 0.894 61 Westminster Ave & Brookhurst S Signalized B 0.698 C 0.793 62 Westminster Ave & Euclid St Signalized D 0.845 E 0.947 63 Westminster Ave & Harbor Blvd Signalized E 0.910 F 1.158
Bold denotes a deficient intersection. Note: Intersection counts were conducted in July 2007. Levels of services were calculated using Orange County Congestion Management Program (2003) LOS Criteria.
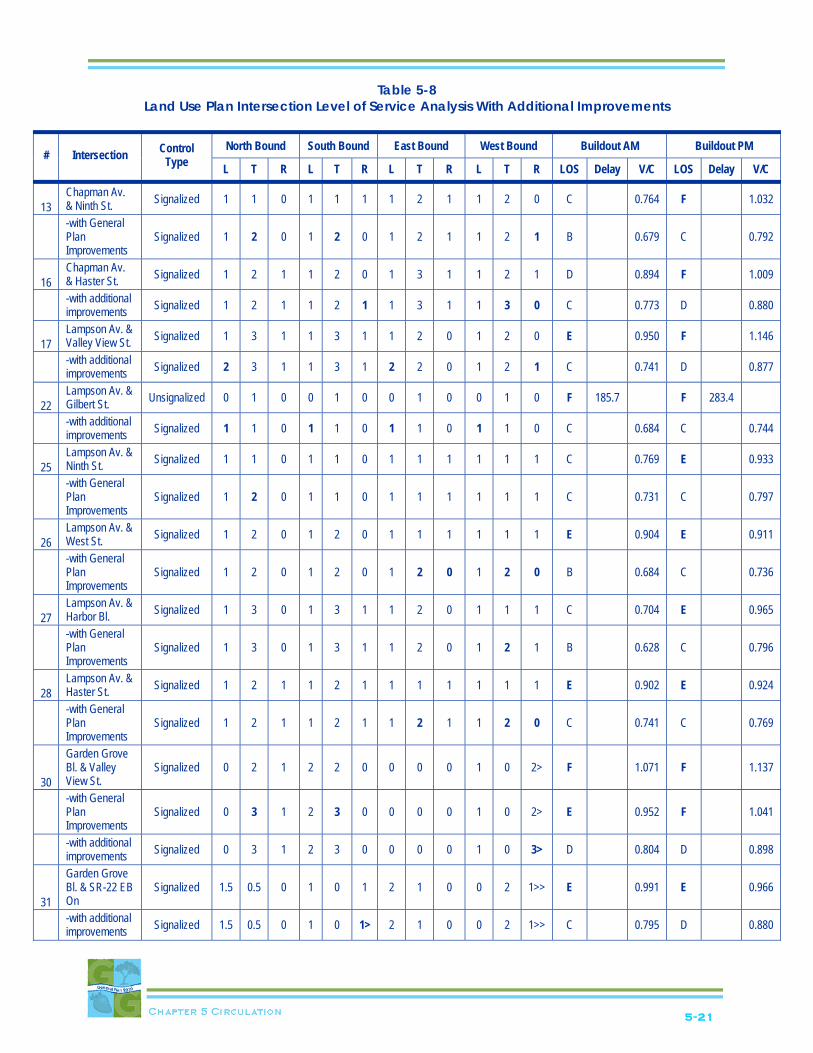
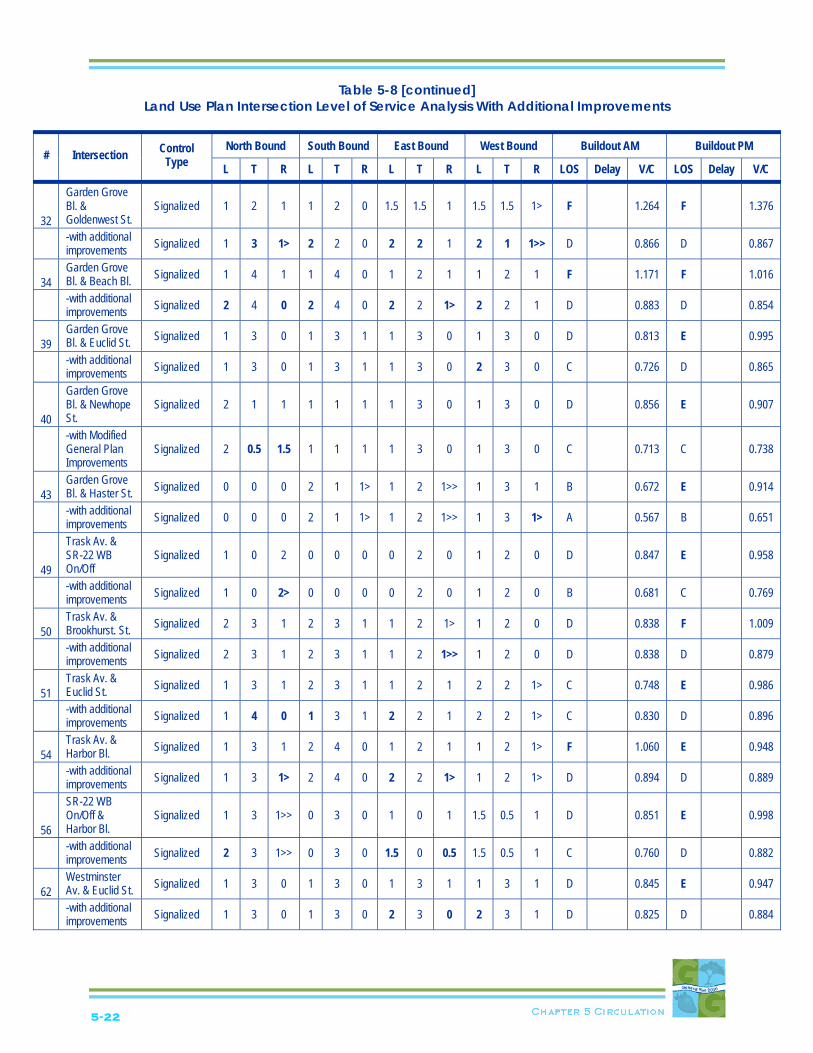
Table 5-8, Land Use Plan Intersection Level of Service Analysis With Additional Improvements, summarizes the improvements necessary for the previously listed intersections to operate at LOS D or better. For all but four intersections, the recommended improvements should fit within the available right-of-way. Four intersections, Valley View Avenue with Lampson Avenue and with Garden Grove Boulevard, Golden West Street with Garden Grove Boulevard, and Brookhurst Street with Garden Grove Boulevard, are expected to require additional improvements beyond the currently available right-of-way to provide the necessary intersection improvements. The Valley View corridor was previously identified as a corridor that is expected to operate with a poor level of service on the roadway segments as well. A focus area of future development is located around the Valley View/Lampson intersection. In addition, the Garden Grove Boulevard intersections are also shown as having poor levels of service in existing conditions.
5-21
Table 5-8 Land Use Plan Intersection Level of Service Analysis With Additional Improvements
North Bound South Bound East Bound West Bound Buildout AM Buildout PM
# Intersection Control Type L T R L T R L T R L T R LOS Delay V/C LOS Delay V/C
13 Chapman Av. & Ninth St. Signalized 1 1 0 1 1 1 1 2 1 1 2 0 C 0.764 F 1.032
-with General Plan Improvements
Signalized 1 2 0 1 2 0 1 2 1 1 2 1 B 0.679 C 0.792
16 Chapman Av. & Haster St. Signalized 1 2 1 1 2 0 1 3 1 1 2 1 D 0.894 F 1.009
-with additional improvements Signalized 1 2 1 1 2 1 1 3 1 1 3 0 C 0.773 D 0.880
17 Lampson Av. & Valley View St. Signalized 1 3 1 1 3 1 1 2 0 1 2 0 E 0.950 F 1.146
-with additional improvements Signalized 2 3 1 1 3 1 2 2 0 1 2 1 C 0.741 D 0.877
22 Lampson Av. & Gilbert St. Unsignalized 0 1 0 0 1 0 0 1 0 0 1 0 F 185.7 F 283.4
-with additional improvements Signalized 1 1 0 1 1 0 1 1 0 1 1 0 C 0.684 C 0.744
25 Lampson Av. & Ninth St. Signalized 1 1 0 1 1 0 1 1 1 1 1 1 C 0.769 E 0.933
-with General Plan Improvements
Signalized 1 2 0 1 1 0 1 1 1 1 1 1 C 0.731 C 0.797
26 Lampson Av. & West St. Signalized 1 2 0 1 2 0 1 1 1 1 1 1 E 0.904 E 0.911
-with General Plan Improvements
Signalized 1 2 0 1 2 0 1 2 0 1 2 0 B 0.684 C 0.736
27 Lampson Av. & Harbor Bl. Signalized 1 3 0 1 3 1 1 2 0 1 1 1 C 0.704 E 0.965
-with General Plan Improvements
Signalized 1 3 0 1 3 1 1 2 0 1 2 1 B 0.628 C 0.796
28 Lampson Av. & Haster St. Signalized 1 2 1 1 2 1 1 1 1 1 1 1 E 0.902 E 0.924
-with General Plan Improvements
Signalized 1 2 1 1 2 1 1 2 1 1 2 0 C 0.741 C 0.769
30
Garden Grove Bl. & Valley View St.
Signalized 0 2 1 2 2 0 0 0 0 1 0 2> F 1.071 F 1.137
-with General Plan Improvements
Signalized 0 3 1 2 3 0 0 0 0 1 0 2> E 0.952 F 1.041
-with additional improvements Signalized 0 3 1 2 3 0 0 0 0 1 0 3> D 0.804 D 0.898
31
Garden Grove Bl. & SR-22 EB On
Signalized 1.5 0.5 0 1 0 1 2 1 0 0 2 1>> E 0.991 E 0.966
-with additional improvements Signalized 1.5 0.5 0 1 0 1> 2 1 0 0 2 1>> C 0.795 D 0.880
5-22
Table 5-8 [continued] Land Use Plan Intersection Level of Service Analysis With Additional Improvements
North Bound South Bound East Bound West Bound Buildout AM Buildout PM
# Intersection Control Type L T R L T R L T R L T R LOS Delay V/C LOS Delay V/C
32
Garden Grove Bl. & Goldenwest St.
Signalized 1 2 1 1 2 0 1.5 1.5 1 1.5 1.5 1> F 1.264 F 1.376
-with additional improvements Signalized 1 3 1> 2 2 0 2 2 1 2 1 1>> D 0.866 D 0.867
34 Garden Grove Bl. & Beach Bl. Signalized 1 4 1 1 4 0 1 2 1 1 2 1 F 1.171 F 1.016
-with additional improvements Signalized 2 4 0 2 4 0 2 2 1> 2 2 1 D 0.883 D 0.854
39 Garden Grove Bl. & Euclid St. Signalized 1 3 0 1 3 1 1 3 0 1 3 0 D 0.813 E 0.995
-with additional improvements Signalized 1 3 0 1 3 1 1 3 0 2 3 0 C 0.726 D 0.865
40
Garden Grove Bl. & Newhope St.
Signalized 2 1 1 1 1 1 1 3 0 1 3 0 D 0.856 E 0.907
-with Modified General Plan Improvements
Signalized 2 0.5 1.5 1 1 1 1 3 0 1 3 0 C 0.713 C 0.738
43 Garden Grove Bl. & Haster St. Signalized 0 0 0 2 1 1> 1 2 1>> 1 3 1 B 0.672 E 0.914
-with additional improvements Signalized 0 0 0 2 1 1> 1 2 1>> 1 3 1> A 0.567 B 0.651
49
Trask Av. & SR-22 WB On/Off
Signalized 1 0 2 0 0 0 0 2 0 1 2 0 D 0.847 E 0.958
-with additional improvements Signalized 1 0 2> 0 0 0 0 2 0 1 2 0 B 0.681 C 0.769
50 Trask Av. & Brookhurst. St. Signalized 2 3 1 2 3 1 1 2 1> 1 2 0 D 0.838 F 1.009
-with additional improvements Signalized 2 3 1 2 3 1 1 2 1>> 1 2 0 D 0.838 D 0.879
51 Trask Av. & Euclid St. Signalized 1 3 1 2 3 1 1 2 1 2 2 1> C 0.748 E 0.986
-with additional improvements Signalized 1 4 0 1 3 1 2 2 1 2 2 1> C 0.830 D 0.896
54 Trask Av. & Harbor Bl. Signalized 1 3 1 2 4 0 1 2 1 1 2 1> F 1.060 E 0.948
-with additional improvements Signalized 1 3 1> 2 4 0 2 2 1> 1 2 1> D 0.894 D 0.889
56
SR-22 WB On/Off & Harbor Bl.
Signalized 1 3 1>> 0 3 0 1 0 1 1.5 0.5 1 D 0.851 E 0.998
-with additional improvements Signalized 2 3 1>> 0 3 0 1.5 0 0.5 1.5 0.5 1 C 0.760 D 0.882
62 Westminster Av. & Euclid St. Signalized 1 3 0 1 3 0 1 3 1 1 3 1 D 0.845 E 0.947
-with additional improvements Signalized 1 3 0 1 3 0 2 3 0 2 3 1 D 0.825 D 0.884
5-23
Table 5-8 [continued] Land Use Plan Intersection Level of Service Analysis With Additional Improvements
North Bound South Bound East Bound West Bound Buildout AM Buildout PM
# Intersection Control Type L T R L T R L T R L T R LOS Delay V/C LOS Delay V/C
63
Westminster Av. & Harbor Bl.
Signalized 1 3 1 1 3 1 1 3 0 1 3 1 E 0.910 F 1.158
-with additional improvements Signalized 1 3 1 2 3 0 1 3 0 1 3 1> D 0.832 D 0.891
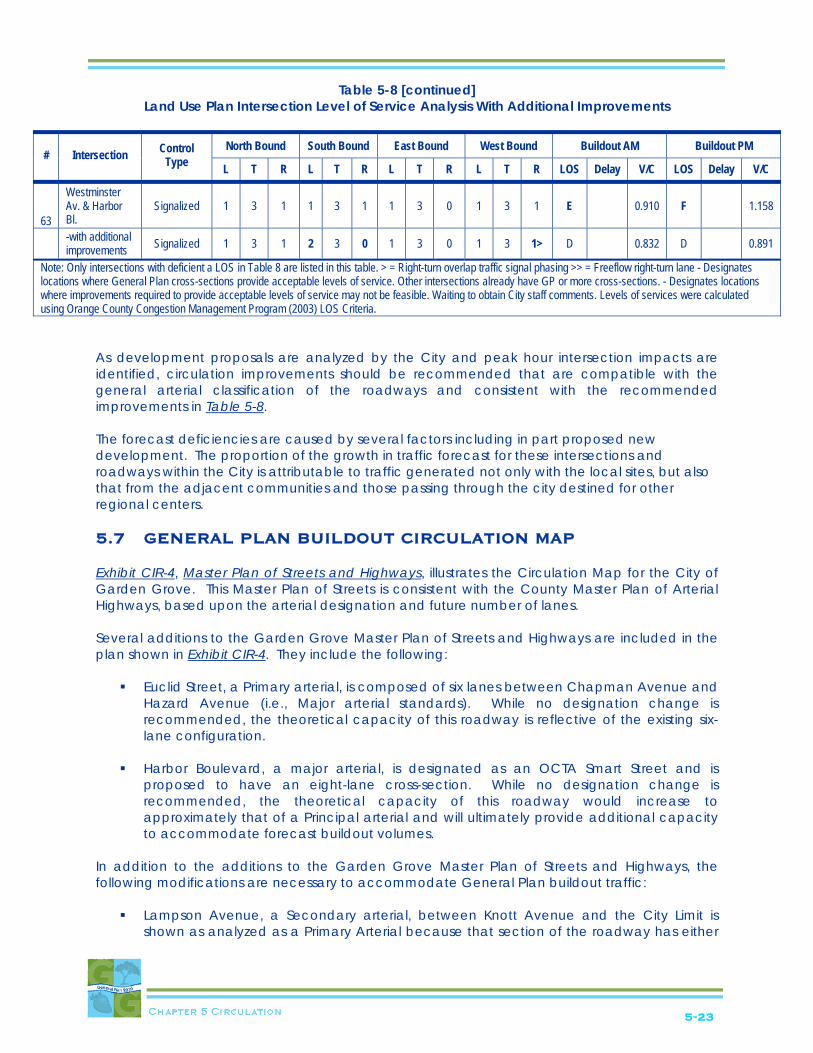
Note: Only intersections with deficient a LOS in Table 8 are listed in this table. > = Right-turn overlap traffic signal phasing >> = Freeflow right-turn lane - Designates locations where General Plan cross-sections provide acceptable levels of service. Other intersections already have GP or more cross-sections. - Designates locations where improvements required to provide acceptable levels of service may not be feasible. Waiting to obtain City staff comments. Levels of services were calculated using Orange County Congestion Management Program (2003) LOS Criteria.
As development proposals are analyzed by the City and peak hour intersection impacts are identified, circulation improvements should be recommended that are compatible with the general arterial classification of the roadways and consistent with the recommended improvements in Table 5-8. The forecast deficiencies are caused by several factors including in part proposed new development. The proportion of the growth in traffic forecast for these intersections and roadways within the City is attributable to traffic generated not only with the local sites, but also that from the adjacent communities and those passing through the city destined for other regional centers. 5.7 GENERAL PLAN BUILDOUT CIRCULATION MAP Exhibit CIR-4, Master Plan of Streets and Highways, illustrates the Circulation Map for the City of Garden Grove. This Master Plan of Streets is consistent with the County Master Plan of Arterial Highways, based upon the arterial designation and future number of lanes. Several additions to the Garden Grove Master Plan of Streets and Highways are included in the plan shown in Exhibit CIR-4. They include the following:
Euclid Street, a Primary arterial, is composed of six lanes between Chapman Avenue and Hazard Avenue (i.e., Major arterial standards). While no designation change is recommended, the theoretical capacity of this roadway is reflective of the existing six-lane configuration.
Harbor Boulevard, a major arterial, is designated as an OCTA Smart Street and is
proposed to have an eight-lane cross-section. While no designation change is recommended, the theoretical capacity of this roadway would increase to approximately that of a Principal arterial and will ultimately provide additional capacity to accommodate forecast buildout volumes.
In addition to the additions to the Garden Grove Master Plan of Streets and Highways, the following modifications are necessary to accommodate General Plan buildout traffic:
Lampson Avenue, a Secondary arterial, between Knott Avenue and the City Limit is shown as analyzed as a Primary Arterial because that section of the roadway has either
5-24
no driveways directly accessing the street and a raised median in the section that does. This increases the capacity of the street from 25,000 ADT to 37,500 ADT and will ultimately provide additional capacity to accommodate forecast buildout volumes.
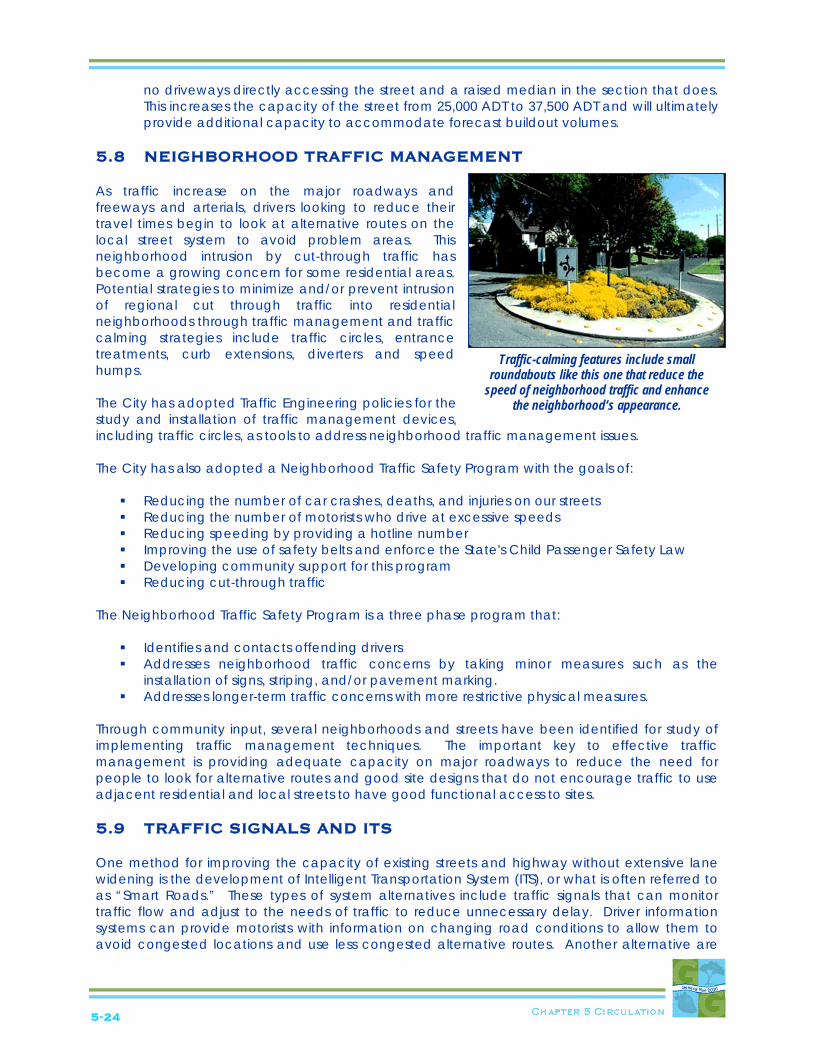
5.8 NEIGHBORHOOD TRAFFIC MANAGEMENT As traffic increase on the major roadways and freeways and arterials, drivers looking to reduce their travel times begin to look at alternative routes on the local street system to avoid problem areas. This neighborhood intrusion by cut-through traffic has become a growing concern for some residential areas. Potential strategies to minimize and/or prevent intrusion of regional cut through traffic into residential neighborhoods through traffic management and traffic calming strategies include traffic circles, entrance treatments, curb extensions, diverters and speed humps. The City has adopted Traffic Engineering policies for the study and installation of traffic management devices, including traffic circles, as tools to address neighborhood traffic management issues. The City has also adopted a Neighborhood Traffic Safety Program with the goals of:
Reducing the number of car crashes, deaths, and injuries on our streets Reducing the number of motorists who drive at excessive speeds Reducing speeding by providing a hotline number Improving the use of safety belts and enforce the State's Child Passenger Safety Law Developing community support for this program Reducing cut-through traffic
The Neighborhood Traffic Safety Program is a three phase program that:
Identifies and contacts offending drivers Addresses neighborhood traffic concerns by taking minor measures such as the
installation of signs, striping, and/or pavement marking. Addresses longer-term traffic concerns with more restrictive physical measures.
Through community input, several neighborhoods and streets have been identified for study of implementing traffic management techniques. The important key to effective traffic management is providing adequate capacity on major roadways to reduce the need for people to look for alternative routes and good site designs that do not encourage traffic to use adjacent residential and local streets to have good functional access to sites. 5.9 TRAFFIC SIGNALS AND ITS One method for improving the capacity of existing streets and highway without extensive lane widening is the development of Intelligent Transportation System (ITS), or what is often referred to as “Smart Roads.” These types of system alternatives include traffic signals that can monitor traffic flow and adjust to the needs of traffic to reduce unnecessary delay. Driver information systems can provide motorists with information on changing road conditions to allow them to avoid congested locations and use less congested alternative routes. Another alternative are
Traffic-calming features include small roundabouts like this one that reduce the
speed of neighborhood traffic and enhance the neighborhood’s appearance.
5-25
video monitors so that intersections and roadway segments can be monitored to identify developing conditions and identify potential problem conditions. The OCTA Smart Street concept seeks to improve roadway traffic capacity and smooth traffic flow through measures such as traffic signal synchronization, bus turnouts, intersection improvements and addition of travel lanes by removing on-street parking and consolidating driveways. The Renewed Measure M Plan includes monies to develop a Regional Traffic Signal Synchronization program. The goal of the program is to improve the flow of traffic by developing and implementing regional signal coordination across jurisdictional boundaries. When implemented, drivers in a synchronized signal corridor can often pass through a series of green lights before stopping. Expanding signal synchronization is a cost-effective way to increase roadway capacity without major new construction. These systems are usually applied during peak morning and evening hours. OCTA is proposing a countywide signal synchronization program, which targets more than 2,000 signalized intersections across the county. The first corridor to be coordinated under this program in the City of Garden Grove is Euclid Street. 5.10 RAIL FREIGHT The Union Pacific Railroad provides rail freight spur line service in western Garden Grove in the area generally bounded by Knott Avenue on the west, the City boundary on the north, Beach Boulevard on the east, and Garden Grove Boulevard on the south. All crossings with streets in this area are at-grade. In the City of Garden Grove, the rail lines cross the following arterial streets:
Garden Grove Boulevard Lampson Avenue Chapman Avenue Western Avenue
5.11 TRUCK ROUTES The City of Garden Grove has adopted a truck route system (Municipal Code 10.40 et. seq.) to provide access to those land uses requiring truck transportation, while protecting those land uses sensitive to the impacts of truck travel (i.e., noise, vibration, congestion, etc.). The truck route is illustrated in Exhibit CIR-5, City of Garden Grove Designated Truck Routes, and is intended to designate those roadways for use by commercial vehicles exceeding a maximum gross weight of 6,000 pounds and with a maximum length from the kingpin to the rearmost axle not exceeding 38 feet (Municipal Code 10.40.030). In addition, “large truck routes” are also indicated for roadway designated for use by any commercial vehicle exceeding 38 feet in length from the kingpin to the rearmost axle. These arterials are part of the truck route, and include the following routes.
Name of Street Segment Designated as Truck Route
Beach Boulevard Garden Grove Boulevard, south to Trask Avenue Brookhurst Street Katella Avenue, south to Hazard Avenue Chapman Avenue Valley View Street, east to Beach Boulevard Euclid Street Garden Grove Boulevard, south to Hazard Avenue Garden Grove Boulevard Knott Street, east to Beach Boulevard

5-26
Harbor Boulevard Garden Grove Boulevard, south to Westminster Avenue Katella Avenue Dale Street, east to Euclid Street Knott Street City limits north of Orangewood Avenue, south to Garden Grove
Boulevard Valley View Street City limits north of Chapman Avenue, south to Garden Grove
Freeway Western Avenue City limits north of Orangewood Avenue, south to Garden Grove
Boulevard Western Avenue Newland Street, east to Fairview Street
5.12 PUBLIC TRANSIT OCTA provides extensive bus and rail transit service throughout Orange County. Public transit service in Garden Grove includes local fixed-route bus service, commuter bus service, and paratransit services. The existing transit routes in the study area are illustrated in Exhibit CIR-6, Existing Transit Routes. OCTA FIXED-ROUTE SERVICES Nineteen OCTA bus routes have stops within the City of Garden Grove. These include local service, community shuttles, intra-county express routes serving connecting cities, and inter-county express routes. The routes currently serving the City of Garden Grove are detailed in the General Plan EIR. BUS RAPID TRANSIT Bus Rapid Transit (BRT) is a new approach to traditional bus travel. The new buses will only stop at key destinations in order to provide faster service in existing transit corridors. BRT is planned to offer frequent service, have its own distinct identity, offer traffic signal priority, and serve customized bus shelters that display real-time bus arrival information. Harbor Boulevard BRT The Harbor Boulevard BRT Project is the first of three BRT projects to be implemented by the Orange County Transportation Authority (OCTA) in the next four years, and is scheduled for completion in late 2008. Route 43, which travels along Harbor Boulevard, is the busiest bus route in the county. The goal for the Harbor Boulevard BRT Project is to decrease travel time for customers and improve travel speed. Westminster Boulevard/17th Street BRT The Westminster Boulevard/17th Street BRT Project is the second of three BRT projects to be implemented by OCTA in the next four years, and is scheduled for completion in late 2009. Service on Westminster/17th will operate over a 22-mile, east-west route between Santa Ana and Long Beach, becoming the first truly regional BRT service operated by OCTA by providing direct connections to multimodal transit services in Los Angeles County at the Long Beach Transit Mall. PARK-N-RIDE There is a City-operated Park-n-Ride facility located on the northwest corner of Euclid Avenue and Trask Avenue. The lot has about 30 spaces designated for park-n-ride customers. Direct connections to OCTA routes 37 and 56 are available from the lot.
5-27
There are no other transit centers currently in the City of Garden Grove. OTHER OCTA TRANSIT SERVICES
OCTA provides ACCESS bus service for senior citizens & people with disabilities. ACCESS is a shared-ride service for people who are unable to use the regular, fixed-route bus service because of functional limitations caused by a disability. These passengers must be certified by OCTA to use the ACCESS system by meeting the Americans with Disabilities Act (ADA) eligibility criteria. OCTA’s Ridematch program helps registered users find a carpool partner to ride with, based on both the commuters schedules. OCTA also has vanpool services. Commuters can form groups and can apply for the vanpool service through OCTA. Commuters can get subsidies from OCTA or their employers
LONG RANGE TRANSIT CONCEPTS A Joint Powers Authority (including one Orange County city — Los Alamitos) has been created to oversee the planning and development of the proposed Orangeline Maglev line, proposed to travel from Los Angeles’ Union Station (Union Passenger Terminal), generally along Union Pacific’s Stanton Branch and the Pacific Electric right-of-way into Orange County, to a terminus yet to be determined. The system, which is proposed as an elevated high-speed Maglev system, might go as far north as Palmdale and as far south as Irvine. GO LOCAL PROJECT The Cities of Garden Grove and Santa Ana have entered into a partnership for the Transit Vision and Go Local Project (Go Local). The Go Local program is a four-step process to plan and implement city-initiated transit extensions to OCTA’s Metrolink commuter rail line. The Metrolink rail line is the backbone of transit in Orange County. Two-thirds of Orange County’s population and jobs are within a four-mile radius of each of the County’s 11 Metrolink stations. The Santa Ana-Garden Grove Go Local would create a five-mile transportation corridor that links Garden Grove (at the Pacific Electric right-of-way/SR-22) to both the Santa Ana Civic Center and the Santa Ana Regional Transportation Center and Metrolink station. The Go Local program intends to expand the multi-modal transportation network by accommodating streetcars, bus rapid transit, automobiles, bicycles, and pedestrians. 5.13 BIKEWAYS AND TRAILS BICYCLE FACILITIES With the increased popularity of cycling as a form of recreation and alternate transportation, the City of Garden Grove has established bicycle routes to meet the growing demand for safe places to ride bicycles. All proposed and existing bikeway routes in Garden Grove and the surrounding area are classified in three types of facilities, as shown on Exhibit CIR-7, Master Plan of Bikeway Facilities. A Class I bicycle trail is a facility that is physically separated from a roadway and designated primarily for the use of bicycles. A Class II bicycle lane facility is a facility featuring a striped lane on the paved area of a road for preferential use by bicycles. A Class III bicycle route is a facility typically identified by green and white “Bike Route” guide signage only. Several Class III bikeway segments exist in Garden Grove. Along portions of Lampson and Trask Avenue, Class III facilities total 0.5 miles.
5-28
Several Class II bikeways have been developed in the City. These include:
Chapman Avenue Lampson Avenue Brookhurst Street Trask Avenue east of Euclid Avenue Orangewood Avenue between Gilbert and Dale Streets Newhope Street between Westminster Avenue and Garden Grove Boulevard Western Avenue between north city limit and Seaboard Circle
Located along portions of Lampson and Trask Avenues and Ward and 9th Streets, Class II facilities total 22.75 miles. These Class II bicycle lane segments are located along the edge of the paved area outside the motor vehicle travel lanes, and are restricted to vehicular parking. However, if sufficient pavement exists, the bicycle lane will be located between the parking lane and the outside motor vehicle travel lane. The three segments of bicycle routes in Garden Grove are characterized as bicycle facilities with typical widths of four feet (striping to curb), and widths of 12 feet (striping to curb) where on-street parking is permitted. One very short Class I bikeway is located along Knott Avenue and totals 0.5 miles in length. No existing bicycle parking facilities have been identified in the City. According to the City Master Plan of Bikeway Facilities, facilities that are most needed in Garden Grove are those proposed constructed or completed along Lampson Avenue, Orangewood Avenue, Ninth Street, and Bushard Street. These routes have been proposed by the Orange County Environmental Management Agency (OCEMA) because they provide vital links to major activity centers, while allowing continuous travel from one regional route to another. Other routes needed, not in OCEMA's Master Plan, that would connect longer routes together, providing links to areas of the City not served by major routes, are routes along Springdale Street, Gilbert Street, and Ward Street. OCTA BICYCLE MASTER PLAN
On August 2001, the Orange County Transportation Authority (OCTA) adopted the Commuter Bikeways Strategic Plan (CBSP) with the intent of creating a comprehensive blueprint of the existing bikeways in the county, as well as proposing new facilities to complete a network of bikeways. The 2001 CBSP was provided to the cities and the County to adopt, if they chose to. Through the cooperation of the cities and the County, an inventory was taken of existing bikeways, and priority corridors for new bikeways were identified. The CBSP complies with the eligibility requirements of the Bicycle Transportation Account (BTA), which are the most stringent requirements of the available funding programs. The BTA is administered by Caltrans. The BTA is a desirable funding source, and OCTA encourages all cities and the County to pursue these funds.
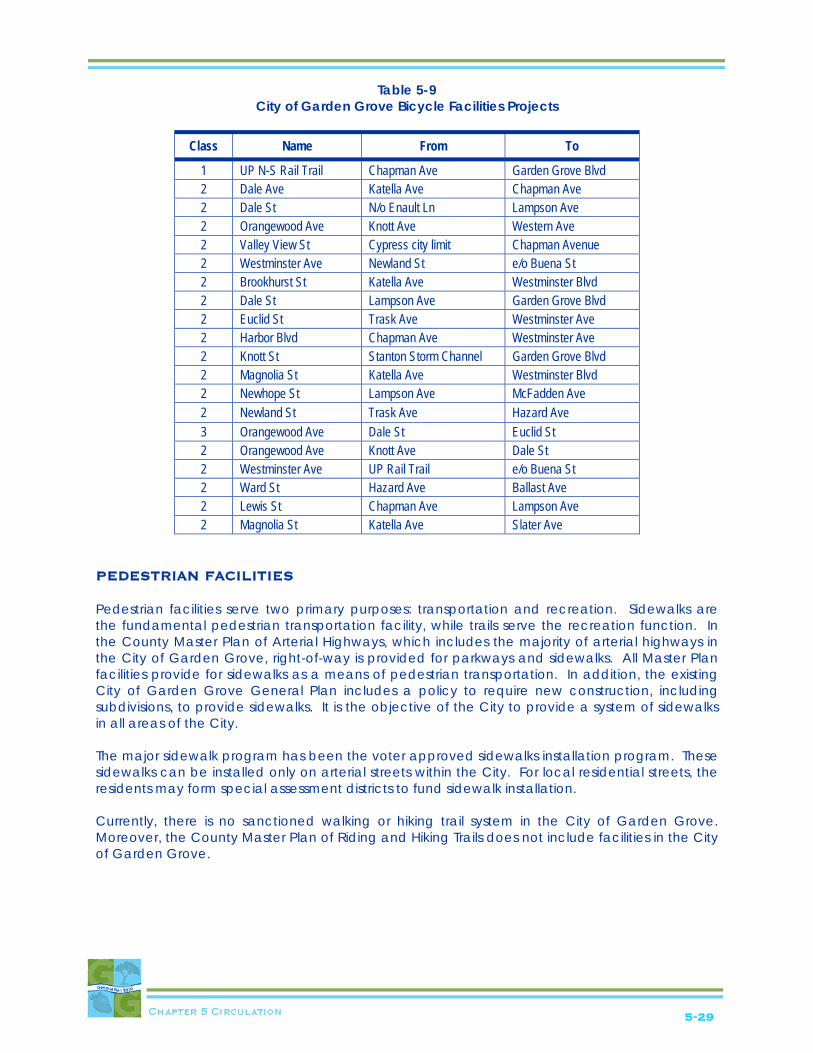
PLANNED IMPROVEMENTS Garden Grove has one Class I top priority bikeway project totaling 1 mile. This project is along a north-south Union Pacific rail corridor near Stanton. Top priority Class II projects total 11.75 miles. Table 5-9, City of Garden Grove Bicycle Facilities Projects, shows the prioritization of bikeway projects in the City.
5-29
Table 5-9 City of Garden Grove Bicycle Facilities Projects
Class Name From To
1 UP N-S Rail Trail Chapman Ave Garden Grove Blvd 2 Dale Ave Katella Ave Chapman Ave 2 Dale St N/o Enault Ln Lampson Ave 2 Orangewood Ave Knott Ave Western Ave 2 Valley View St Cypress city limit Chapman Avenue 2 Westminster Ave Newland St e/o Buena St 2 Brookhurst St Katella Ave Westminster Blvd 2 Dale St Lampson Ave Garden Grove Blvd 2 Euclid St Trask Ave Westminster Ave 2 Harbor Blvd Chapman Ave Westminster Ave 2 Knott St Stanton Storm Channel Garden Grove Blvd 2 Magnolia St Katella Ave Westminster Blvd 2 Newhope St Lampson Ave McFadden Ave 2 Newland St Trask Ave Hazard Ave 3 Orangewood Ave Dale St Euclid St 2 Orangewood Ave Knott Ave Dale St 2 Westminster Ave UP Rail Trail e/o Buena St 2 Ward St Hazard Ave Ballast Ave 2 Lewis St Chapman Ave Lampson Ave 2 Magnolia St Katella Ave Slater Ave
PEDESTRIAN FACILITIES Pedestrian facilities serve two primary purposes: transportation and recreation. Sidewalks are the fundamental pedestrian transportation facility, while trails serve the recreation function. In the County Master Plan of Arterial Highways, which includes the majority of arterial highways in the City of Garden Grove, right-of-way is provided for parkways and sidewalks. All Master Plan facilities provide for sidewalks as a means of pedestrian transportation. In addition, the existing City of Garden Grove General Plan includes a policy to require new construction, including subdivisions, to provide sidewalks. It is the objective of the City to provide a system of sidewalks in all areas of the City. The major sidewalk program has been the voter approved sidewalks installation program. These sidewalks can be installed only on arterial streets within the City. For local residential streets, the residents may form special assessment districts to fund sidewalk installation. Currently, there is no sanctioned walking or hiking trail system in the City of Garden Grove. Moreover, the County Master Plan of Riding and Hiking Trails does not include facilities in the City of Garden Grove.
5-30
5.14 KEY THEMES AND VISION FOR GENERAL PLAN TRAFFIC OPERATIONS Traffic operations are a continuing significant concern for Garden Grove residents. Of main concern are: signal synchronization, coordination of Caltrans and City signal synchronization operations, overflow into residential areas due to congestion, and use of traffic control devices. MINIMIZE INTRUSION INTO RESIDENTIAL NEIGHBORHOODS Neighborhood intrusion by cut-through traffic has become a growing concern for some residential areas. As new development occurs in the Focus Areas along major arterials, there is the potential for drivers to look for alternative routes. The General Plan will look for ways to minimize traffic intrusion into established residential neighborhoods. REDUCED VEHICLE TRIPS The Southern California Association of Governments (SCAG) has several overall goals for the region, including improving the standard of living, maintaining the regional quality of life, and providing social, political, and cultural equity. Many policies to implement these goals focus on the reduction of vehicle miles traveled. ACCESS AND TRAFFIC FLOW IN PARKING AREAS Ingress and egress to commercial centers and access within parking areas inhibit the flow of traffic. TRUCK TRAFFIC Truck traffic through the City and the parking of these vehicles are concerns shared by many residents. ATTRACTIVE STREETSCAPES The aesthetic quality of the City’s streets has been overlooked in years past. There is a renewed pride evident in the community and a desire to enhance the City’s image. INTERJURISDICTIONAL TRANSPORTATION PLANNING There are a number of federal, state, regional, and local transportation programs that provide funding to cities. Compliance with these programs is important to maintain funding sources. There is concern that some regional roadway improvement projects do not benefit the residents of Garden Grove. It is important that Garden Grove is represented in inter-jurisdictional programs that affect roadways within the City. TRANSPORTATION PLAN COMPLIANCE The City of Garden Grove is in compliance with the county-wide Congestion Management Program and the Orange County Traffic Improvement and Growth Management Ordinance (Measure M), as well as the Air Quality Management Plan. Continued compliance with these, as well as other programs will ensure that the City receives revenues for a variety of infrastructure improvements.
5-31
OCTA RIGHT-OF-WAY The OCTA right-of-way has been reserved for a potential alternative transportation system for several years. The community supports such a system along this alignment. BIKEWAYS Bikeways provide connections not offered by the automobile and bikeway facilities promote health and wellness in the community. Currently, the City has limited bicycle facilities and amenities. The County of Orange and the City of Garden Grove have both proposed new routes throughout the City. Securing funding and completion of these routes will provide local and regional connections and create mobility options for residents, which will also contribute to relief of traffic congestion citywide. 5.15 GOALS, POLICIES, AND IMPLEMENTATION PROGRAM This Element is organized into goals, policies, and implementation programs. A description of each is provided in Chapter 1, Introduction. It is important to note that the implementation programs are specific actions to carry out all of the preceding goals and policies. TRAFFIC OPERATIONS
Goal CIR-1 A transportation system that maximizes freedom of movement and maintains a balance between mobility, safety, cost efficiency of maintenance, and the quality of the City’s environment.
Policy CIR-1.1 Maintain a citywide circulation system that is balanced with the future land use
development anticipated in the General Plan Land Use Element. Policy CIR-1.2 Encourage a goal of Level of Service (LOS) D or better from arterial intersections
under the jurisdiction of the City of Garden Grove. Policy CIR-1.3 Strive to achieve a minimum traffic Level of Service (LOS) D throughout the City,
except for major development areas at those intersections that are impacted by factors beyond the City’s control or at those intersections included on the Deficient Intersection List.
Policy CIR-1.4 Improve those intersections that are impacted by factors beyond the control of
the City, and that operate at an unacceptable Level of Service. Policy CIR-1.5 Identify roadway corridors within the City of Garden Grove where LOS E
operations may be acceptable if it supports transit-oriented development or other appropriate travel demand reduction strategies.
Policy CIR-1.6 Adopt typical street sections consistent with the County of Orange Master Plan
of Arterial Highways (MPAH), and encourage their implementation. Policy CIR-1.7 Continue to work with OCTA to implement and maintain the “Smart Street”
corridors in the City to provide improved multi-modal traffic operations along those corridors.

5-32
Policy CIR-1.8 Ensure that new development can be accommodated within the existing circulation system, or planned circulation improvements, such that the standard of Level of Service (LOS) D is maintained.
Policy CIR-1.9 Review and determine if there are corridors or intersections where a future
operating condition of Level of service E may be acceptable if the impact of the mitigation to address that condition would prohibit other important goals from being achieved.
Policy CIR-1.10 Continue to monitor land use development in adjacent cities to identify impacts
and implement improvements to the Garden Grove circulation system. Policy CIR-1.11 Continue to monitor the railroad operations in the Central Industrial Area along
the Stanton Line of the Southern Pacific Transportation Company to ensure that these operations do not inhibit traffic flow through the area.
CIR-IMP-1A Continue to evaluate and pursue design and operational improvements (i.e.,
medians, driveway consolidations, left-turn channelization, parking or turning restrictions, cul-de-sacs, deceleration lanes, etc.) to improve the efficiency of the arterials and intersections in the City of Garden Grove to more closely approximate theoretical carrying capacities.
CIR-IMP-1B Continue to update, as necessary, the Master Plan of Traffic Signals and Traffic
Controls for the City of Garden Grove. CIR-IMP-1C Adopt the Circulation Element, and ensure its consistency with the Orange
County Master Plan of Arterial Highways (MPAH). CIR-IMP-1D Utilize the Master Plan of Arterial Highways (MPAH) Cooperative Study process
to amend the Circulation Element, as necessary. CIR-IMP-1E Prioritize capital improvements, focusing on those areas of the City that operate
at unacceptable Levels of Service, to enhance traffic safety, improve Levels of Service, and implement the buildout of the Orange County Master Plan of Arterial Highways (MPAH).
CIR-IMP-1F Monitor key intersections where congestion is likely to occur as a result of
increasing traffic volumes. CIR-IMP-1G Perform an evaluation of the circulation system every five years to determine
segments and intersections that are not meeting the Level of Service standards. If necessary, develop a deficiency plan to identify mitigations to achieve Level of Service standards.
CIR-IMP-1H Use the development review and capital improvement processes to develop
consistent street and sidewalk widths citywide. CIR-IMP-1I Require new development or redevelopment projects to identify direct project
impacts and provide associated mitigation at the time of key decision points, such as site plan approval or significant change in the land use of an approved development.
5-33
CIR-IMP-1J Look for opportunities to have new development or redevelopment, or expansion of existing development to pay the full cost of circulation improvements needed to serve the development (i.e., signalization, turn lanes, etc.).
CIR-IMP-1K Periodically evaluate development impact fees to ensure that circulation
infrastructure funding required of new development or redevelopment projects is adequate to improve and/or maintain Garden Grove’s circulation system to meet Level of Service standards.
IMPROVED TRAFFIC CONDITIONS AT AND ALONG FREEWAYS
Goal CIR-2 Improved traffic flows along the Garden Grove Freeway, as well as improved access along the Freeway, within the City of Garden Grove.
Policy CIR-2.1 Continue to coordinate with Caltrans to monitor and improve the interface
between the City’s circulation network with that of the State. Policy CIR-2.2 Continue to coordinate with adjacent cities and Caltrans to monitor all Freeway
improvements. CIR-IMP-2A Continue to work with Caltrans to synchronize and coordinate traffic signals on
arterials at intersections controlled solely by Caltrans. CIR-IMP-2B Coordinate concept design, final engineering, and construction of
improvements with Caltrans to provide for the standard of Level of Service D or better operations at intersections under the control of Caltrans.
CIR-IMP-2C Pursue agreements with Caltrans to interconnect arterial/ramp intersection
traffic signals with the City of Garden Grove master signalization system. CIR-IMP-2D Coordinate with Caltrans to provide adequate freeway access signage to all
freeways within the City of Garden Grove. CIR-IMP-2E Work with Caltrans to review, monitor, and improve as necessary on-/off-ramps
at the Garden Grove Freeway. MINIMIZE INTRUSION INTO RESIDENTIAL NEIGHBORHOODS
Goal CIR-3 Minimized intrusion of commuter traffic on local streets through residential neighborhoods.
Policy CIR-3.1 Conduct neighborhood circulation studies to determine the nature and extent
of actual and perceived traffic through these areas. Policy CIR-3.2 Create disincentives for traffic traveling through neighborhoods, where feasible. Policy CIR-3.3 Review new development or redevelopment projects adjacent to established
residential neighborhoods for potential traffic intrusion impacts. The review should recommend methods, such as but not limited to 1) expanding parkways to reduce the roadway width, 2) limiting the number of ingress/egress locations

5-34
on-site, 3) traffic circles, 4) diverters, or speed humps, 5) curb extensions, 6) entrance treatments, or other effective traffic management techniques that reduce or eliminate the traffic intrusion impacts.
Policy CIR-3.4 Prioritize circulation improvements that enhance through traffic flow on Major,
Modified Major, Primary, and Secondary Arterials that provide parallel routes to residential streets, in order to reduce through traffic during peak commute periods.
Policy CIR-3.5 Require new developments to implement access and traffic management
plans that will reduce the potential for neighborhood traffic intrusion through factors such as driveway location, turn restrictions, shuttle bus operations, and/or travel demand strategies.
CIR-IMP-3A Continue to work with citizens to identify and implement appropriate
neighborhood traffic management strategies to minimize non-local traffic volumes in residential areas.
CIR-IMP-3B Continue to enforce the City’s posted speed limits. To this end, implement
vehicular speed awareness programs (e.g., mobile radar trailers, traffic stops, etc.). Particular attention should be focused on those areas immediately adjacent to the Garden Grove Freeway.
Also refer to Goals and Polices in the Community Design Element. REDUCED VEHICLE TRIPS
Goal CIR-4 A reduction in vehicle miles traveled in order to create a more efficient urban form.
Policy CIR-4.1 Strive to achieve a balance of land uses whereby residential, commercial,
and public land uses are proportionally balanced. Policy CIR-4.2 Strive to reduce the number of miles traveled by residents to their places of
employment. Policy CIR-4.3 Ensure the reduction in vehicle miles traveled through the approval of mixed
use development proposals. CIR-IMP-4A Encourage the development of mixed use projects as a means of reducing
peak commute period traffic. Also refer to Economic Development Goals 3, 4, and 5 that pertain to the expanding retail offerings in the City, as well as expanding industrial, office and research and development employment sectors in the City. In addition, refer to implementation measures for Circulation Goals 10 and 11.
5-35
ALTERNATIVE FORMS OF TRANSPORTATION
Goal CIR-5 Increased awareness and use of alternate forms of transportation generated in, and traveling through, the City of Garden Grove.
Policy CIR-5.1 Promote the use of public transit. Policy CIR-5.2 Continue to work with OCTA to implement and maintain the “Smart Street”
corridors in the City to provide improved multi-modal traffic operations along those corridors.
Policy CIR-5.3 Provide appropriate bicycle access throughout the City of Garden Grove. Policy CIR-5.4 Provide appropriate pedestrian access throughout the City of Garden Grove. Policy CIR-5.5 Continue to implement the provisions of the Transportation Demand
Ordinance. CIR-IMP-5A Promote the use of Transportation Demand Management (TDM) Measures. CIR-IMP-5B Encourage the creation of programs such as Transportation Systems
Management (TSM), public transit, carpools/ vanpools, ride-match, bicycling, and other alternatives to the energy-inefficient use of vehicles.
CIR-IMP-5C Encourage incentives for the creation and use of car or vanpools for City
employees. BIKEWAYS
Goal CIR-6 A safe, appealing, and comprehensive bicycle network provides additional recreational opportunities for Garden Grove residents and employees.
Policy CIR-6.1 Continue to implement an updated Master Plan of Bikeways and its
amendments. Policy CIR-6.2 Continue to maintain roadways and remove barriers on streets with bikeway
facilities. Policy CIR-6.3 Encourage existing major traffic generators, and new major traffic generators
to incorporate facilities, such as bicycle racks and showers, into the development.
Policy CIR-6.4 Continue to pursue and monitor funding sources for bikeway facilities. Policy CIR-6.5 Sponsor bicycle safety and education programs.
CIR-IMP-6A Encourage the Public Works Department to consider bikeways in their
prioritization of re-paving, and street sweeping. CIR-IMP-6B Consider amending the City’s Zoning Code to require major traffic generators
to include bikeway facilities.
5-36
CIR-IMP-6C Provide incentives to developers who incorporate bikeways into developments.
CIR-IMP-6D Update the existing Master Plan of Bikeways to comply with Caltrans standards
in order to qualify for funding of new bikeway facilities. CIR-IMP-6E Consider implementing the Safe Routes to schools program to qualify for
funding. CIR-IMP-6F Maintain awareness of Orange County Transit Authority (OCTA) grant
opportunities. CIR-IMP-6G Encourage bicycle safety awareness classes at community centers or parks
where facilities are currently located. CIR-IMP-6H Encourage the placement of signage that educates and informs automobiles
and bicyclists that use the facility. ACCESS AND TRAFFIC FLOW IN PARKING AREAS
Goal CIR-7 Adequate access to appropriate parking areas within the City. Policy CIR-7.1 Design safe and efficient vehicular access to properties from arterial streets to
ensure efficient vehicular ingress and egress. Policy CIR-7.2 Review development plans and encourage designs that consolidate access
locations onto streets and provide adequate turn lanes into sites to minimize conflicts with through traffic on adjacent streets.
Policy CIR-7.3 Continue to evaluate the City’s zoning ordinance to ensure that adequate
parking, and access to that parking, is provided for all land uses. Policy CIR-7.4 Require developments to provide adequate storage for exiting vehicles
including multiple turning lanes at signalized access drives to reduce the time needed to exit vehicles from the site and improve intersection operations.
Policy CIR-7.5 Evaluate and determine restrictions for on-street parking along arterials in the
City of Garden Grove. CIR-IMP-7A Minimize access on the City’s arterials by consolidating driveways and
encouraging reciprocal access agreements with adjoining property owners. CIR-IMP-7B Require common entries and parking areas for commercial developments
facing onto an arterial street. Supplemental drives may be provided on alleys or adjacent collector streets.
CIR-IMP-7C Create internal circulation and parking area guidelines for new commercial
and industrial development, and utilize these guidelines as part of the development review process.
CIR-IMP-7D Revise the City’s parking standards to possibly include: requirements for paid
parking, parking at major employment centers, and similar issues.
5-37
CIR-IMP-7E Consider the application of parking management tools that may include, but not be limited to: parking fees, provision of peak period street parking, preferential parking, establishment of parking zone permit programs, park and ride lots and shuttle service.
CIR-IMP-7F Consider the prohibition of on-street parking on arterials to increase the traffic
capacity and improve vehicular and pedestrian safety. CIR-IMP-7G Develop a permit parking program for on-street parking in multi-family
residential neighborhoods, where feasible and necessary. TRUCK TRAFFIC
Goal CIR-8 Minimized impacts associated with truck traffic through the City, as well as the parking locations of these vehicles.
Policy CIR-8.1 Continue to enforce the City’s adopted truck route system. Policy CIR-8.2 Prioritize capacity and operational enhancements along designated truck
routes. Policy CIR-8.3 Work with adjacent communities and regional agencies to identify alternative
systems for goods movement. Policy CIR-8.4 Review current goods movement patterns and determine if possible
restrictions on hours of truck traffic may reduce impacts to area streets. CIR-IMP-8A Periodically re-evaluate the City’s adopted truck route system to ensure that
all truck routes, “large truck routes,” and parking locations for these vehicles are appropriate.
ATTRACTIVE STREETSCAPES
Goal CIR-9 Improved aesthetic quality and maintenance of arterial highways and local roadways.
Policy CIR9.1 Strive to achieve adequate funding levels for street and parkway
maintenance in each budgetary cycle. Policy CIR-9.2 Provide landscaped medians and greenbelts along major arterials, highways,
and freeways, when economically feasible. Policy CIR-9.3 Ensure the aesthetic quality and maintenance of facilities within the City
under the jurisdiction of other agencies. Policy CIR-9.4 Target and prioritize street beautification programs along Major arterials within
the City. CIR-IMP-9A Through design guidelines and zoning requirements, require the provision of
landscaped medians and parkways for all new development or redevelopment projects.

5-38
CIR-IMP-9B Work with Caltrans to ensure that soundwalls along State facilities are landscaped and maintained with plant materials.
Also refer to related Goals and Policies in the Community Design Element. INTERJURISDICTIONAL TRANSPORTATION PLANNING
Goal CIR-10 Participation in regional transportation planning efforts to address inter-jurisdictional issues, and maintain competitive advantage in capital improvement funding programs, as appropriate.
Policy CIR-10.1 Continue to comply with, and participate in, federal, state, and regional
planning efforts as a means of maintaining eligibility for future roadway funding, as appropriate.
Policy CIR-10.2 Actively pursue federal, state, and regional funds for local and regional
roadway improvements, Policy CIR-10.3 Encourage employers to reduce employee-related travel. Policy CIR-10.4 Examine the potential impacts to the community associated with county-wide
street projects (i.e., effects on property values, increased noise and air quality impacts, potential improvement to marginal commercial areas, etc.)
CIR-IMP-10A Continue to participate in interjurisdictional planning forums, in order to
coordinate circulation improvements in the area. CIR-IMP-10B Continue to foster coordination with adjoining cities and regional agencies, as
well as utility companies and transportation agencies with right-of-ways within the City, in order to facilitate transit opportunities.
CIR-IMP-10C Continue to investigate the possibility of park-and-ride facilities within the City. CIR-IMP-10D Support ride sharing, flexible work scheduling, and telecommuting for City
employees, as well as for major businesses and industries within the City. CIR-IMP-10E Investigate the feasibility of an intra-City van or municipal bus service for
shopping, recreation, and other transportation needs of residents, workers, and the transit dependent.
CIR-IMP-10F Pursue every effort possible the investigation and development of a fix
rail/light rail transit system to connect downtown Anaheim to Huntington Beach with various stops along the route, which would run through the Cities of Anaheim, Stanton, Garden Grove, Westminster and Huntington Beach. The investigation should consider the use of diesel- or electric-powered railcars for the rail transit system, such as a diesel multiple unit (DMU), which is a self-propelled commuter rail passenger car that is capable of pulling additional coaches.
5-39
TRANSPORTATION PLAN COMPLIANCE
Goal CIR-11 Continued compliance with regional congestion management, transportation demand, traffic improvement, air quality management, and growth management programs.
Policy CIR-11.1 Strive to facilitate compliance with the Congestion Management Program
(CMP). Policy CIR-11.2 Continue compliance with Measure M, as amended. Policy CIR-11.3 Continue to meet Measure M requirements to ensure the City’s eligibility to
receive Measure M funds. Policy CIR-11.4 Continue to investigate the possibility of park-and-ride facilities within the City. Policy CIR-11.5 Encourage employers to reduce employee-related travel. CIR-IMP-11A Continue land use coordination through the utilization of standardized traffic
impact analysis methodologies. CIR-IMP-11B Agree to expend all Measure M revenues within all three years of receipt. CIR-IMP-11C Continue to encourage major employers to use van pools and other high
occupancy vehicles (HOVs) for home to work journeys. CIR-IMP-11D Continue to encourage employers to use vans, small buses, and other HOVs to
link work places with potential park-and-ride facilities and transit centers. CIR-IMP-11E Encourage the provision of convenient eating and recreational facilities on-
site for businesses employing more than 100 people. CIR-IMP-11F Encourage businesses to establish incentives and regulations to spread work
trips over a longer period to reduce peak period congestion. MEASURE M DEVELOPMENT PHASING AND MONITORING PROGRAM Goal CIR-12 A Citywide development phasing and monitoring program, as required by
Measure M. Policy CIR-12.1 Continue to require for all new development or redevelopment projects a
development phasing plan that phases approval of development commensurate with required improvements.
CIR-IMP-12A Ensure that adequate time is allocated to design and construct infrastructure,
specifically transportation improvements, for approved development projects. CIR-IMP-12B Maintain the annual performance monitoring program of the development
phasing plans within the City.
5-40
OCTA RIGHT-OF-WAY
Goal CIR-13 Use of the OCTA right-of-way for alternative transportation systems. Policy CIR-13.1 Coordinate with the OCTA to facilitate the potential development of an
alternative transportation system along the OCTA right-of-way. The City shall support such a use while recognizing that any impacts to the community must be appropriately mitigated.
CIR-IMP-13A Participate in the OCTA planning efforts to identify potential mass transit
corridors that will interface with the City of Garden Grove. CIR-IMP-13B Coordinate with the OCTA to locate transportation station(s) along the right-
of-way. To this end, consider the following in the planning of these facilities: parking; transportation centers adjacent to the line and convenient passenger transfer between transit lines; shopping and services for commuters adjacent to the station site; as well as other activity or commercial nodes in the City.
CIR-IMP-13C Once developed, encourage the community to use the alternative
transportation system. To this end, work with OCTA to advertise the system’s benefits, operations, destinations, etc.
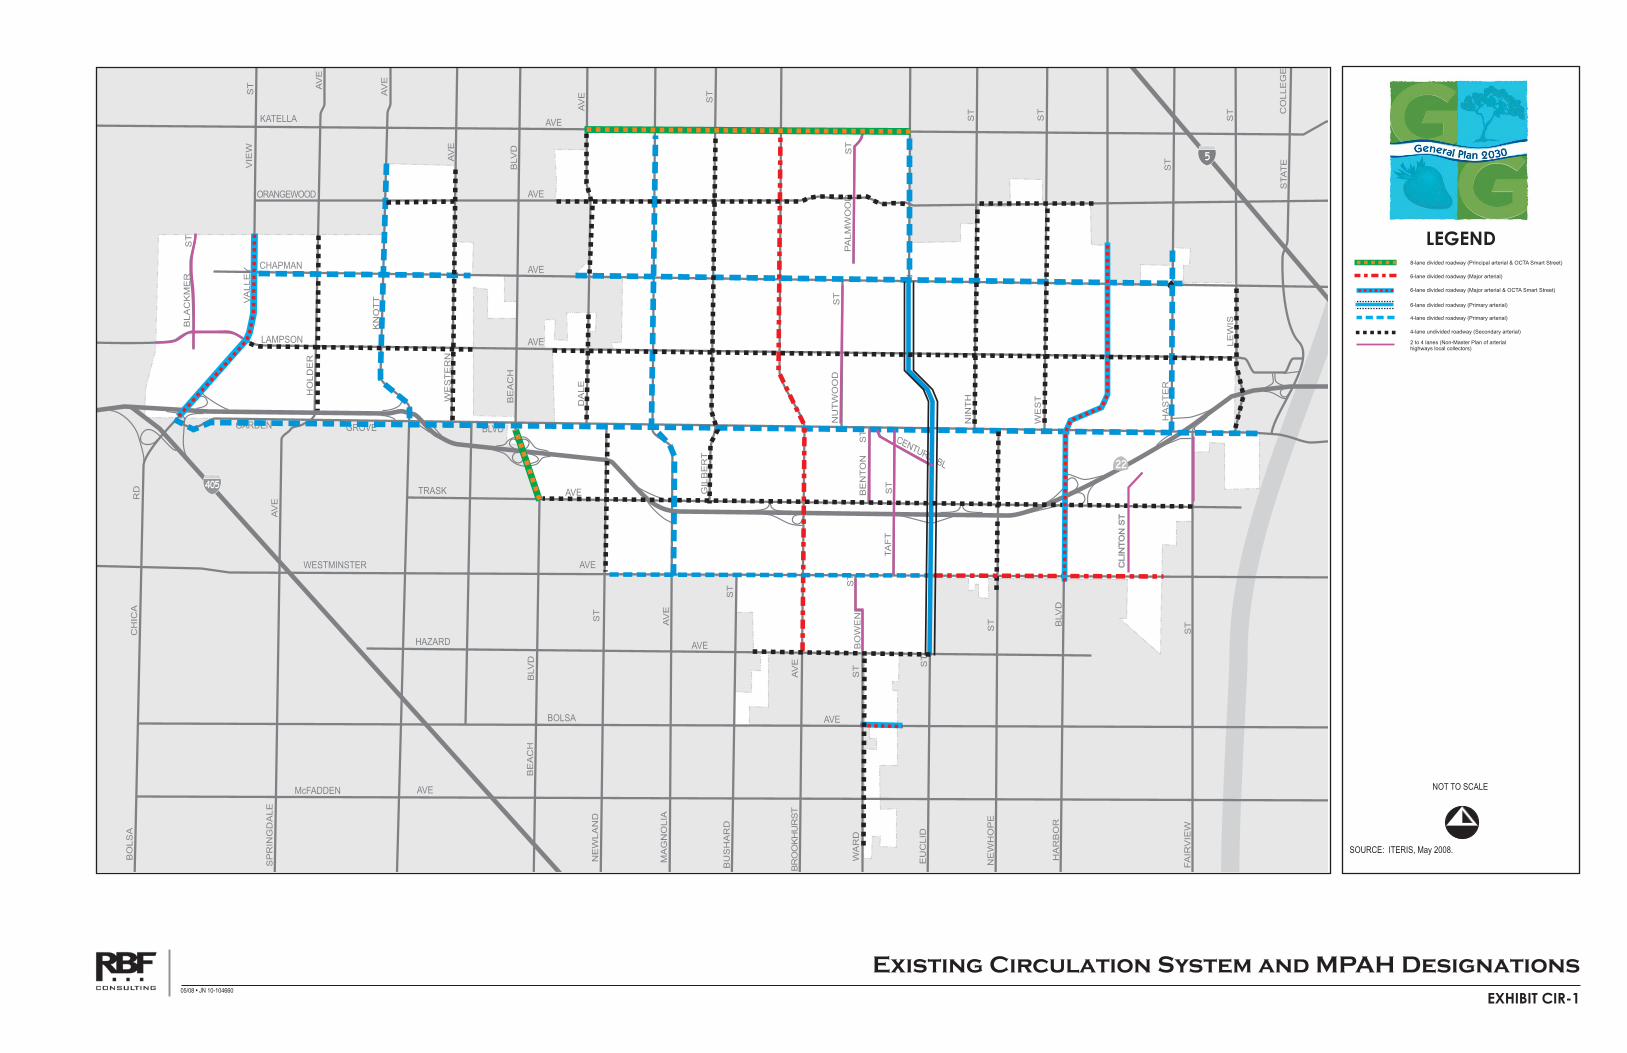
EXHIBIT CIR-1
Existing Circulation System and MPAH Designations05/08 • JN 10-104660
KATELLA AVE
ORANGEWOOD AVE
CHAPMAN AVE
LAMPSON AVE
GARDEN GROVE BLVD
TRASK AVE
WESTMINSTER AVE
HAZARD AVE
BOLSA AVE
McFADDEN AVE
BOLSA
CHICA
RD
SPRINGDALE
AVE
HOLDER
AVE
KNOTTVALLEY
VIEW
ST
AVE
WESTERN
AVE
BEACH
BLVD
DALE
AVE
MAGNOLIA
AVE
GILBERT
ST
BROOKHURST
AVE
EUCLID
ST
BEACH
BLVD
NEWHOPE
ST
HARBOR
BLVD
FAIRVIEW
ST
STATE
LEWIS
COLLEGE
ST
HASTER
ST
BUSHARD
ST
NEWLAND
ST
TS
DRA
W
WEST
NINTH
ST
ST
NUTWOOD
ST
PALMWOOD
ST
BENTON
ST
TAFT
ST
CENTURYBL
BOWEN
ST
BLACKMER
ST
CLINTONST
SOURCE: ITERIS, May 2008.
LEGEND8-lane divided roadway (Principal arterial & OCTA Smart Street)
6-lane divided roadway (Major arterial)
4-lane divided roadway (Primary arterial)
4-lane undivided roadway (Secondary arterial)
2 to 4 lanes (Non-Master Plan of arterialhighways local collectors)
6-lane divided roadway (Major arterial & OCTA Smart Street)
6-lane divided roadway (Primary arterial)
NOT TO SCALE
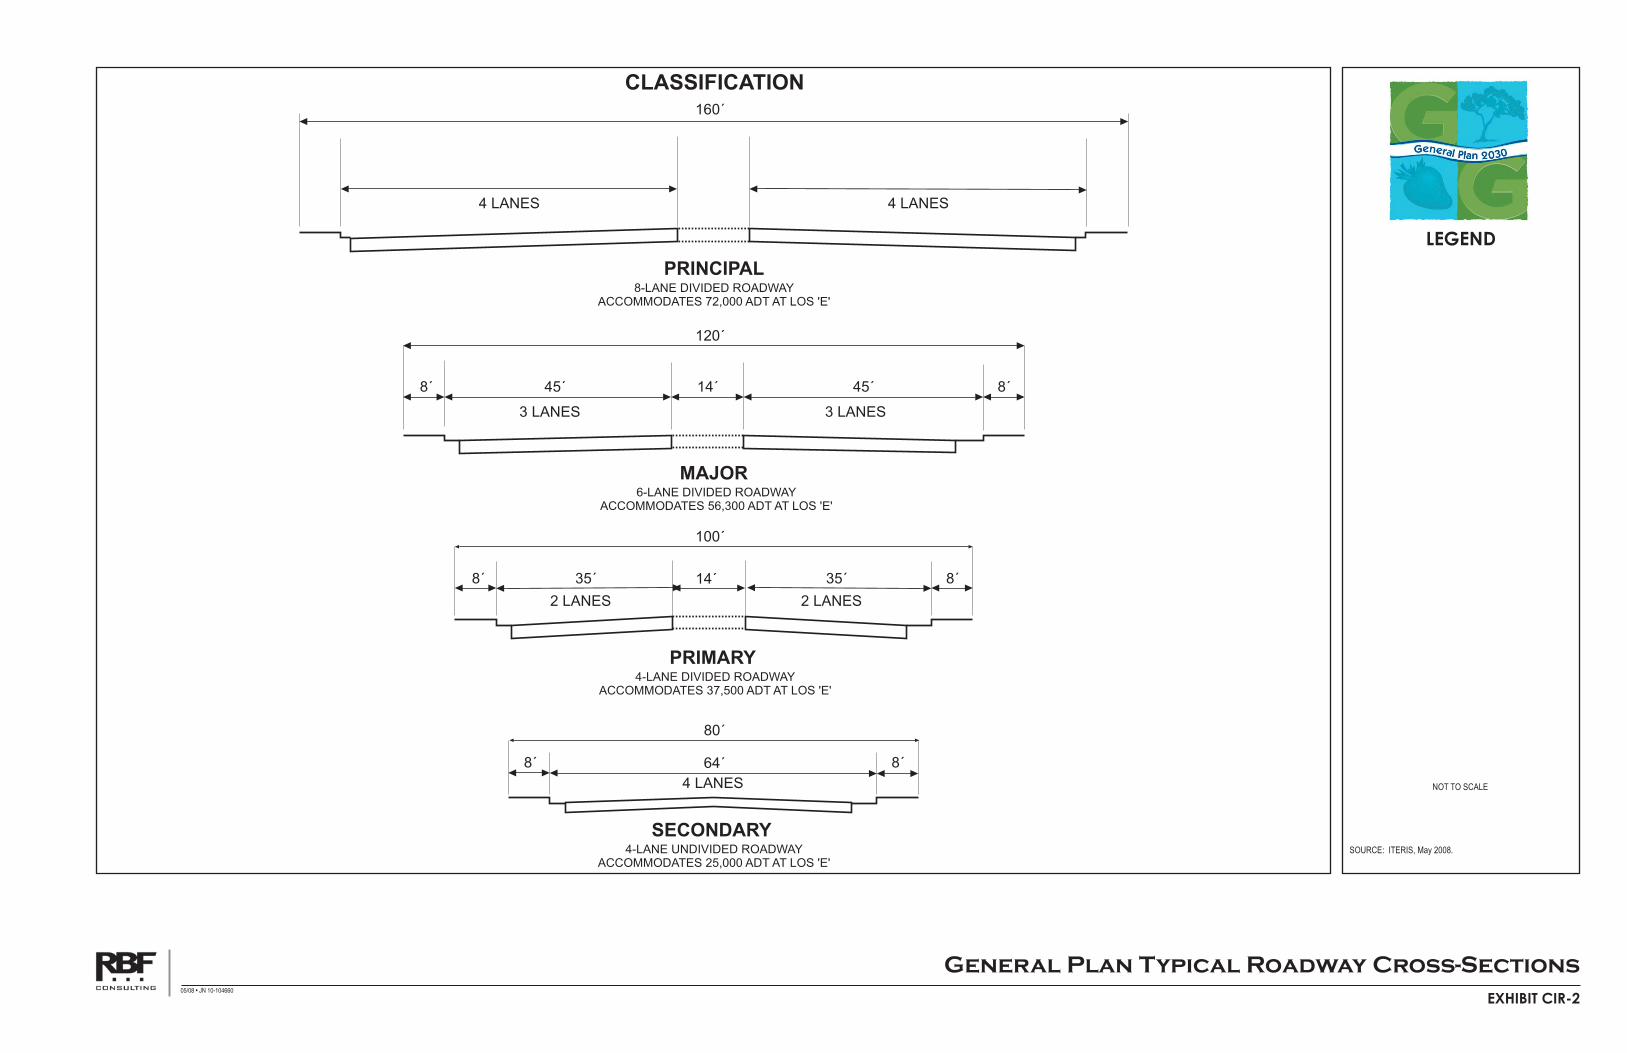
EXHIBIT CIR-2
General Plan Typical Roadway Cross-Sections05/08 • JN 10-104660
SENAL4SENAL4
160´
120´
SENAL3SENAL3
´54´54 14´
80´
4 LANES
SENAL2SENAL2
100´
35´14´35´
´8´8
64´
CLASSIFICATION
PRINCIPAL8-LANE DIVIDED ROADWAY
ACCOMMODATES 72,000 ADT AT LOS 'E'
MAJOR6-LANE DIVIDED ROADWAY
ACCOMMODATES 56,300 ADT AT LOS 'E'
PRIMARY4-LANE DIVIDED ROADWAY
ACCOMMODATES 37,500 ADT AT LOS 'E'
SECONDARY4-LANE UNDIVIDED ROADWAY
ACCOMMODATES 25,000 ADT AT LOS 'E'
8´8´
´8´8
SOURCE: ITERIS, May 2008.
LEGEND
NOT TO SCALE
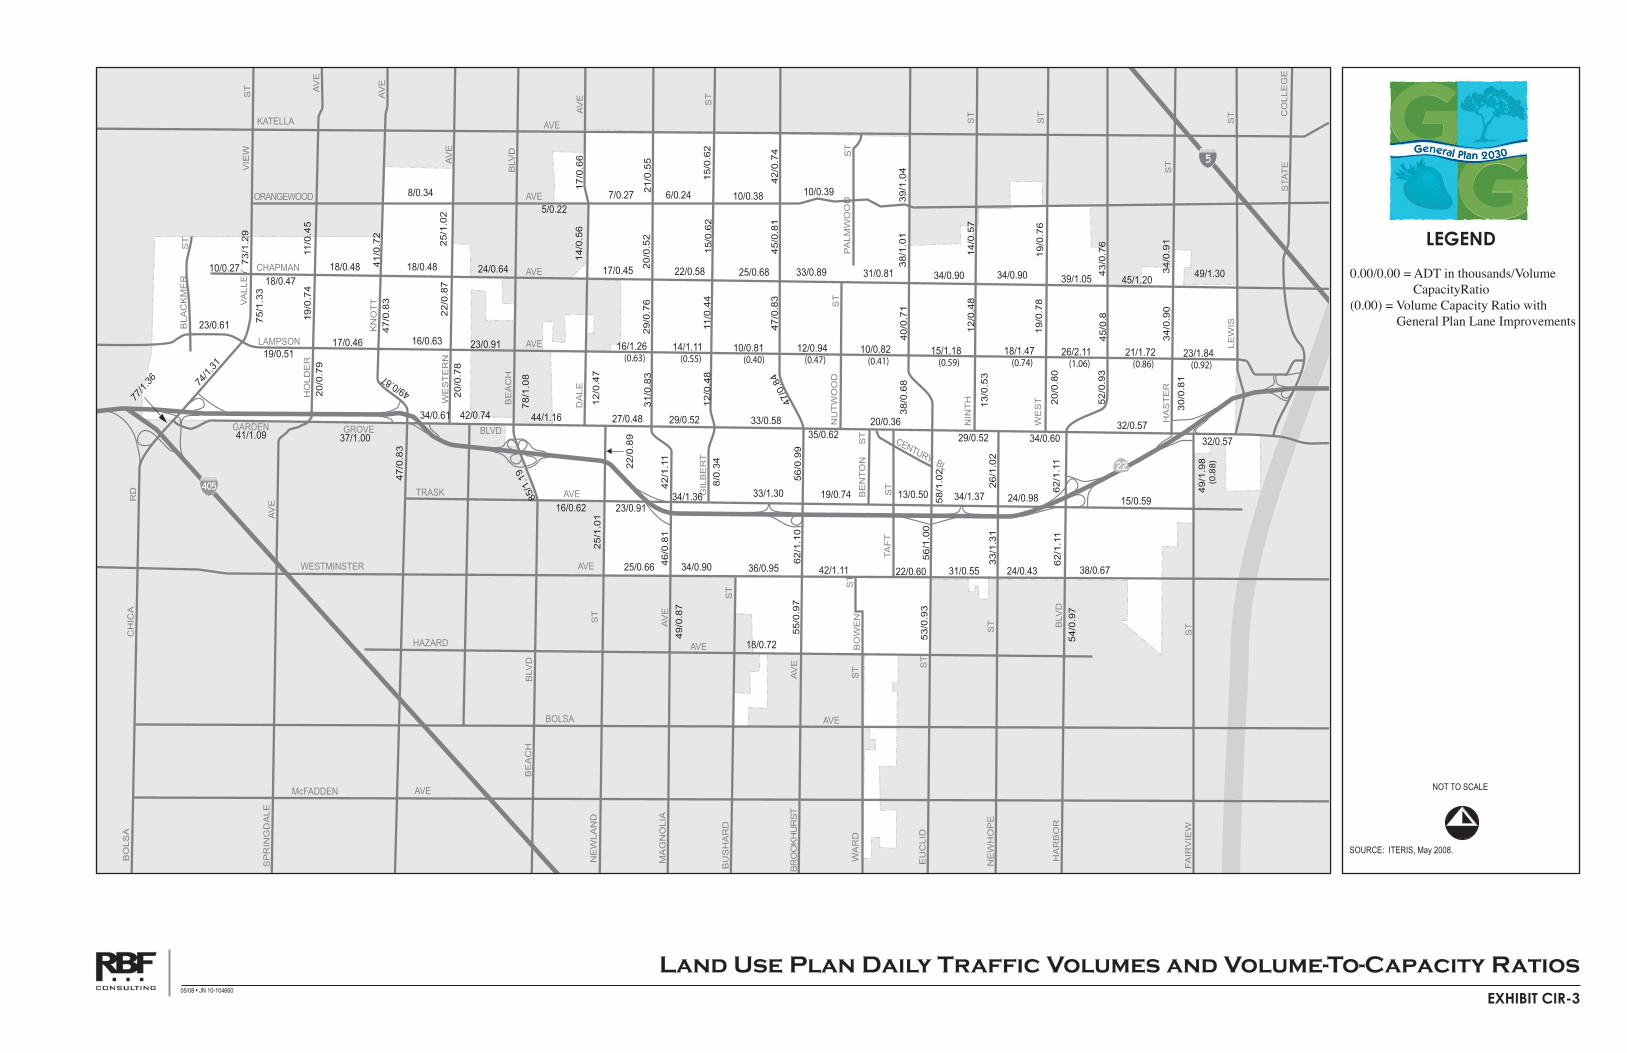
EXHIBIT CIR-3
Land Use Plan Daily Traffic Volumes and Volume-To-Capacity Ratios05/08 • JN 10-104660
0.00/0.00 = ADT in thousands/Volume CapacityRatio (0.00) = Volume Capacity Ratio with General Plan Lane Improvements
L E G E N D
City boundary
Analyzed intersection
NOT TO SCALE
KATELLA AVE
ORANGEWOOD AVE
CHAPMAN AVE
LAMPSON AVE
GARDEN GROVE BLVD
TRASK AVE
WESTMINSTER AVE
HAZARD AVE
BOLSA AVE
McFADDEN AVE
BOLSA
CHICA
RD
SPRINGDALE
AVE
HOLDER
AVE
KNOTTVALLEY
VIEW
ST
AVE
WESTERN
AVE
BEACH
BLVD
DALE
AVE
MAGNOLIA
AVE
GILBERT
ST
BROOKHURST
AVE
EUCLID
ST
BEACH
BLVD
NEWHOPE
ST
HARBOR
BLVD
FAIRVIEW
ST
STATE
LEWIS
COLLEGE
ST
HASTER
ST
BUSHARD
ST
NEWLAND
ST
TS
DRA
W
WEST
NINTH
ST
ST
NUTWOOD
ST
PALMWOOD
ST
BENTON
ST
TAFT
ST
CENTURYBL
BOWEN
ST
BLACKMER
ST
55/0.97
62/1.10
56/0.99
47/0.84
47/0.83
45/0.81
42/0.74
12/0.47
14/0.56
17/0.66
41/0.72
49/0.87
46/0.81
42/1.11
31/0.83
29/0.76
20/0.52
21/0.55
33/1.31
26/1.02
25/1.01
22/0.89
53/0.93
56/1.00
58/1.02
38/0.68
40/0.71
38/1.01
39/1.04
8/0.34
12/0.48
11/0.44
15/0.62
15/0.62
54/0.97
62/1.11
62/1.11
52/0.93
45/0.8
43/0.76
47/0.83
49/0.87
47/0.83
30/0.81
34/0.90
34/0.91
13/0.53
12/0.48
14/0.57
20/0.79
19/0.74
11/0.45
20/0.80
19/0.78
19/0.76
20/0.78
22/0.87
25/1.02
77/1.36
74/1.31
75/1.33
73/1.29
10/0.27
18/0.47
18/0.48 18/0.48 24/0.64 17/0.45 22/0.58 25/0.68 33/0.89 31/0.81 34/0.90 34/0.90 39/1.05 45/1.2049/1.30
41/1.09 37/1.00
34/0.61 42/0.74 44/1.16 27/0.48 29/0.52 33/0.58
35/0.62
20/0.36
29/0.52 34/0.60
32/0.57
32/0.57
18/0.72
23/0.61
19/0.5117/0.46 16/0.63 23/0.91 16/1.26
(0.63)14/1.11(0.55)
10/0.81(0.40)
12/0.94(0.47)
10/0.82(0.41)
15/1.18(0.59)
18/1.47(0.74)
26/2.11(1.06)
21/1.72(0.86)
23/1.84(0.92)
8/0.34
5/0.22
7/0.27 6/0.24 10/0.38 10/0.39
16/0.62 23/0.9134/1.36 33/1.30 19/0.74 13/0.50 34/1.37 24/0.98 15/0.59
25/0.66 34/0.90 36/0.95 42/1.11 22/0.60 31/0.55 24/0.43 38/0.67
85/1.19
78/1.08
49/1.98
(0.88)
SOURCE: ITERIS, May 2008.
LEGEND
NOT TO SCALE
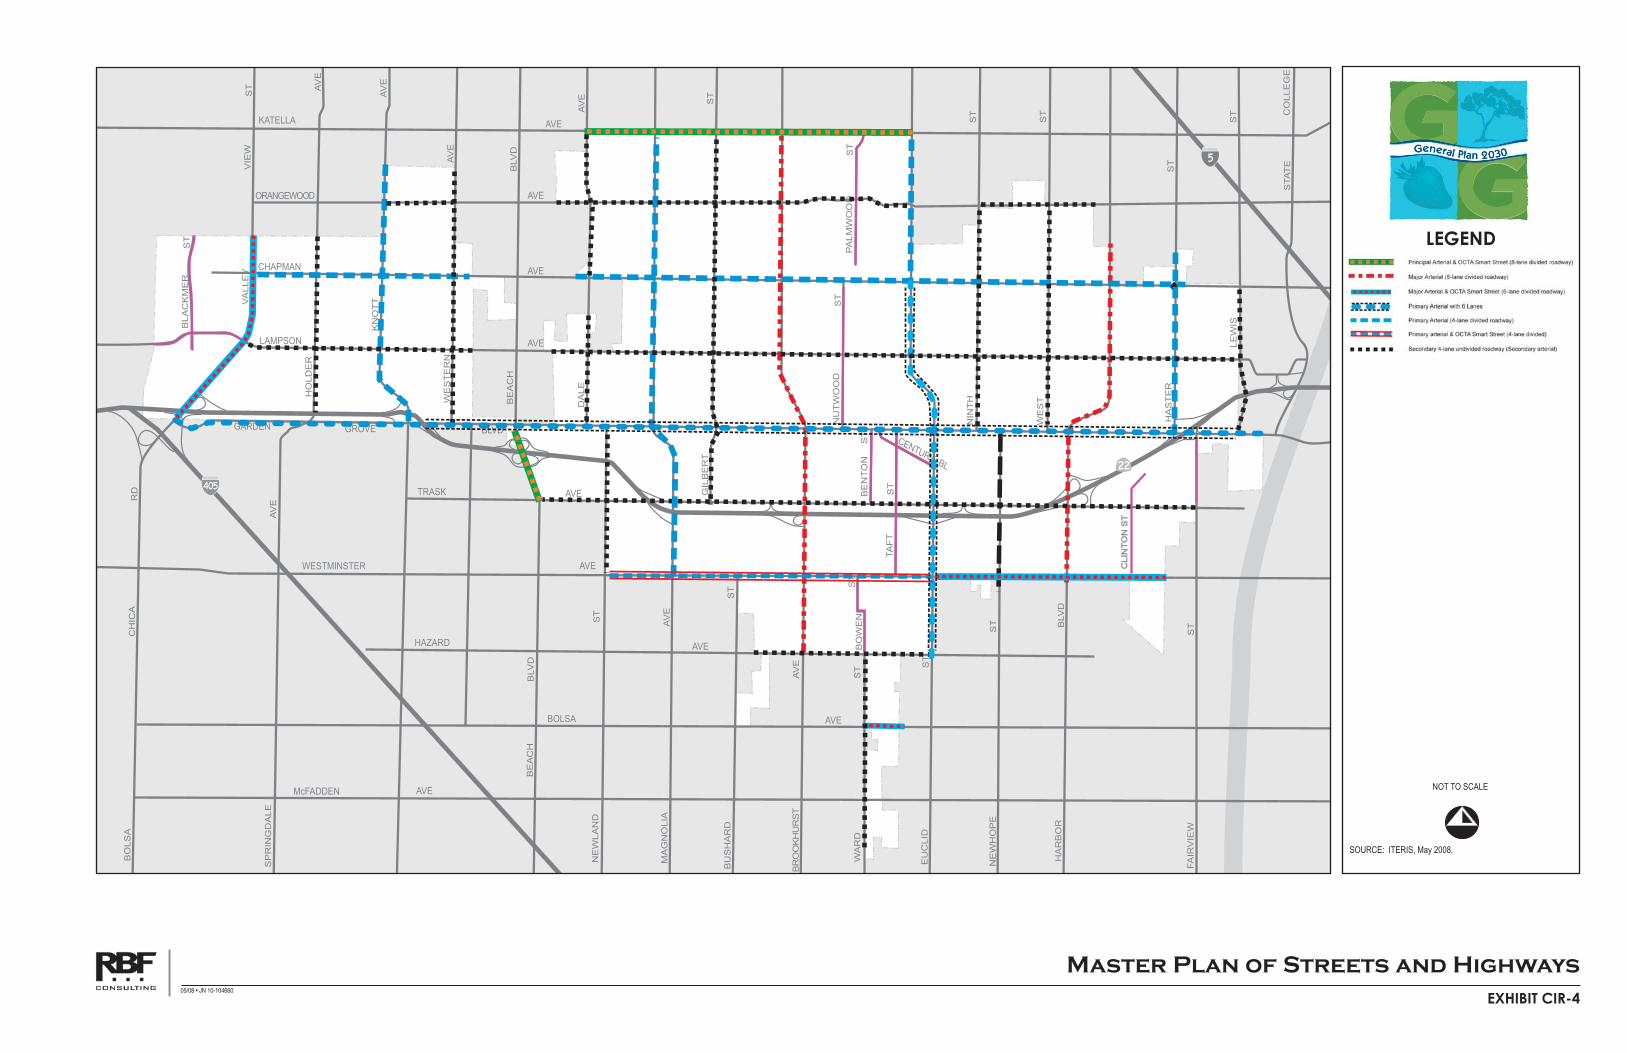
EXHIBIT CIR-4
Master Plan of Streets and Highways05/08 • JN 10-104660
KATELLA AVE
ORANGEWOOD AVE
CHAPMAN AVE
LAMPSON AVE
GARDEN GROVE BLVD
TRASK AVE
WESTMINSTER AVE
HAZARD AVE
BOLSA AVE
McFADDEN AVE
BOLSA
CHICA
RD
SPRINGDALE
AVE
HOLDER
AVE
KNOTTVALLEY
VIEW
ST
AVE
WESTERN
AVE
BEACH
BLVD
DALE
AVE
MAGNOLIA
AVE
GILBERT
ST
BROOKHURST
AVE
EUCLID
ST
BEACH
BLVD
NEWHOPE
ST
HARBOR
BLVD
FAIRVIEW
ST
STATE
LEWIS
COLLEGE
ST
HASTER
ST
BUSHARD
ST
NEWLAND
ST
TS
DRA
W
WEST
NINTH
ST
ST
NUTWOOD
ST
PALMWOOD
ST
BENTON
ST
TAFT
ST
CENTURYBL
BOWEN
ST
BLACKMER
ST
CLINTONST
SOURCE: ITERIS, May 2008.
LEGEND
NOT TO SCALE
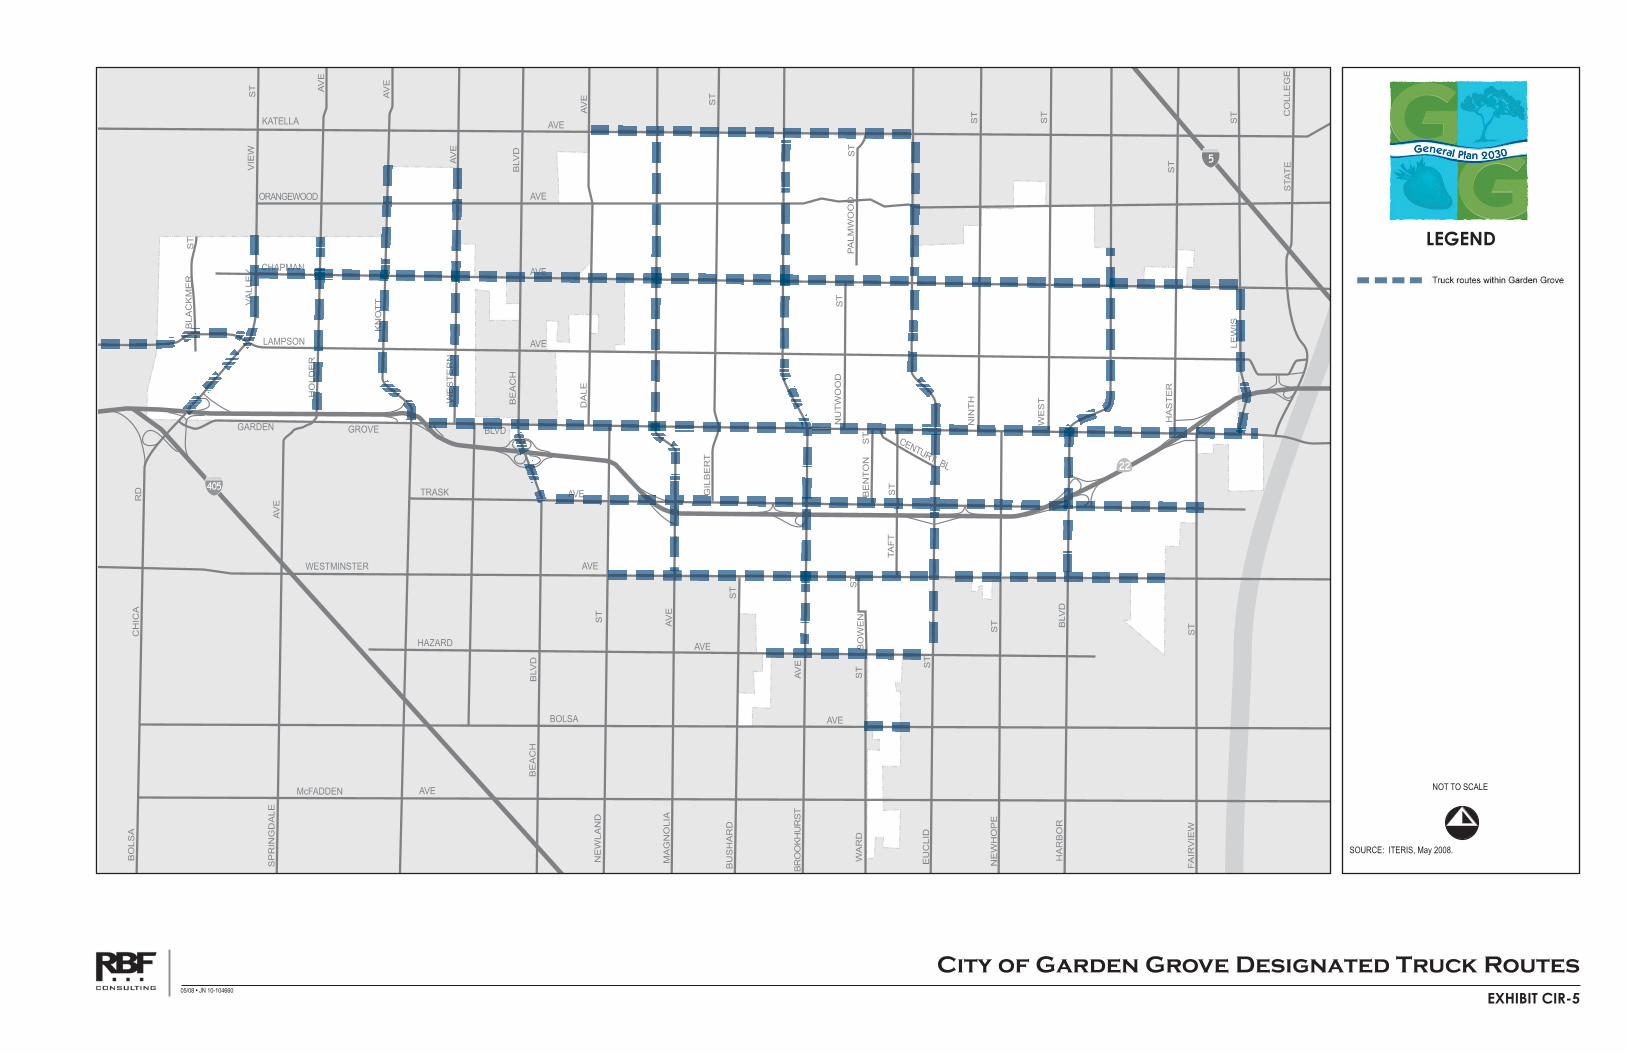
EXHIBIT CIR-5
City of Garden Grove Designated Truck Routes05/08 • JN 10-104660
KATELLA AVE
ORANGEWOOD AVE
CHAPMAN AVE
LAMPSON AVE
GARDEN GROVE BLVD
TRASK AVE
WESTMINSTER AVE
HAZARD AVE
BOLSA AVE
McFADDEN AVE
BOLSA
CHICA
RD
SPRINGDALE
AVE
HOLDER
AVE
KNOTTVALLEY
VIEW
ST
AVE
WESTERN
AVE
BEACH
BLVD
DALE
AVE
MAGNOLIA
AVE
GILBERT
ST
BROOKHURST
AVE
EUCLID
ST
BEACH
BLVD
NEWHOPE
ST
HARBOR
BLVD
FAIRVIEW
ST
STATE
LEWIS
COLLEGE
ST
HASTER
ST
BUSHARD
ST
NEWLAND
ST
TS
DRA
W
WEST
NINTH
ST
ST
NUTWOOD
ST
PALMWOOD
ST
BENTON
ST
TAFT
ST
CENTURYBL
BOWEN
ST
BLACKMER
ST
SOURCE: ITERIS, May 2008.
LEGEND
NOT TO SCALE
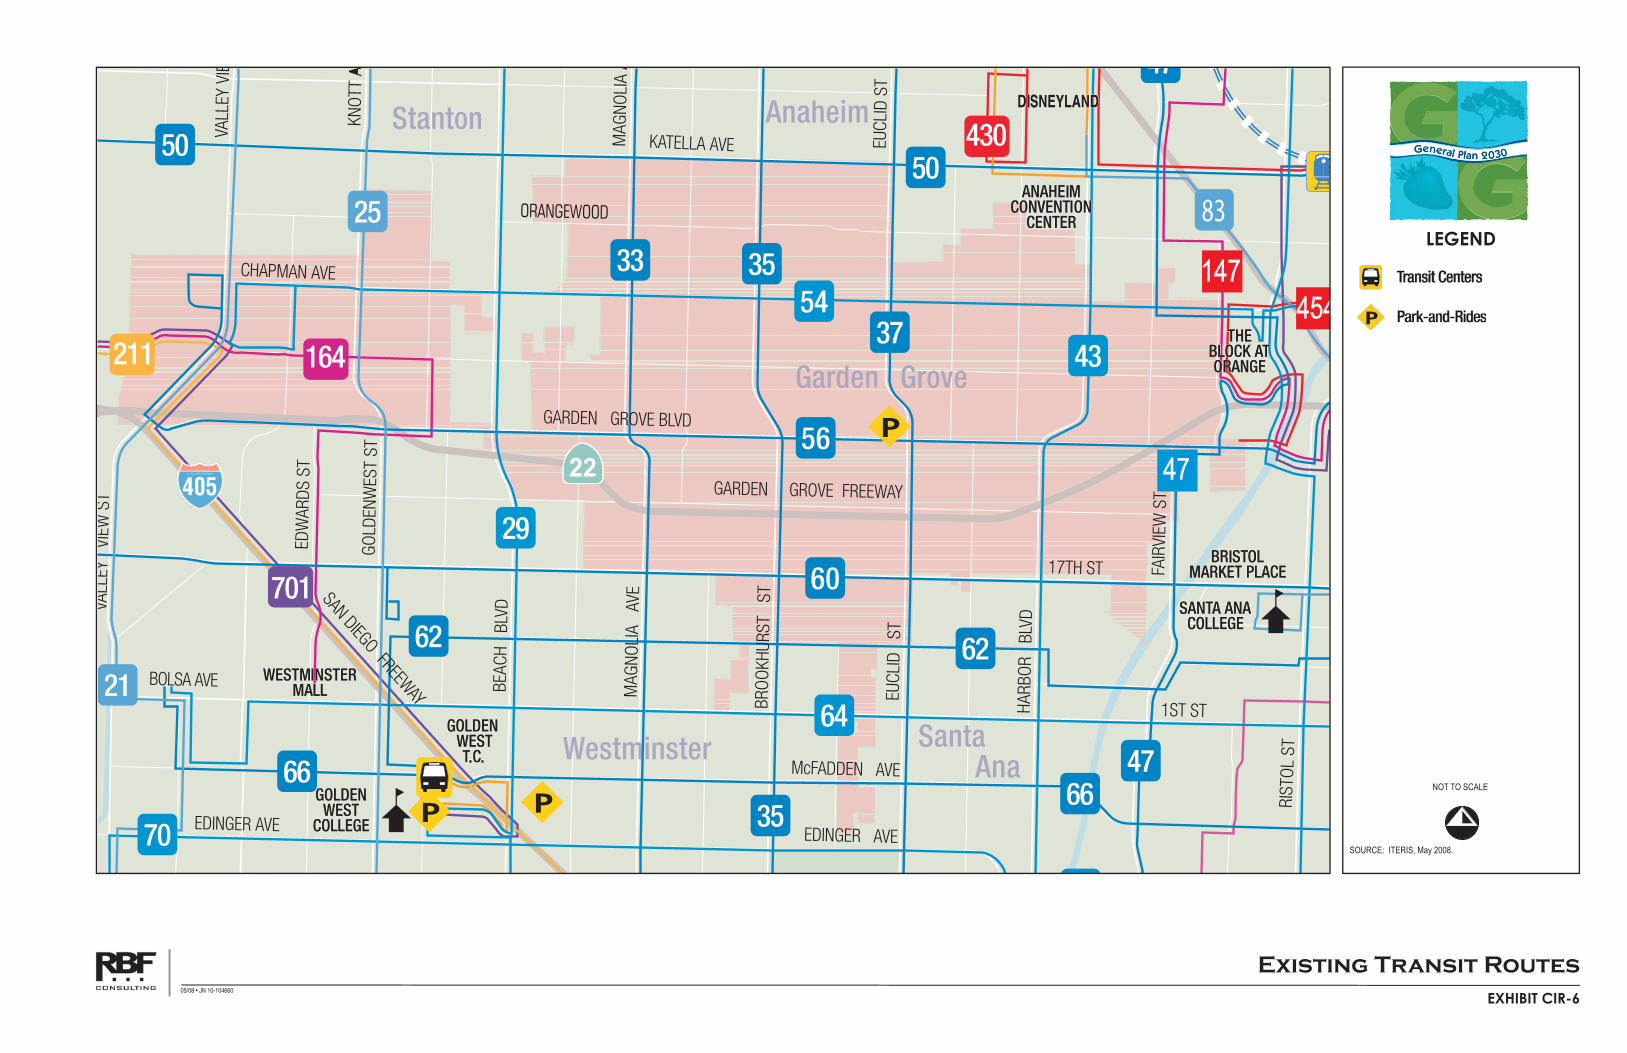
EXHIBIT CIR-6
Existing Transit Routes05/08 • JN 10-104660
83
147454
47
SOURCE: ITERIS, May 2008.
LEGEND
NOT TO SCALE
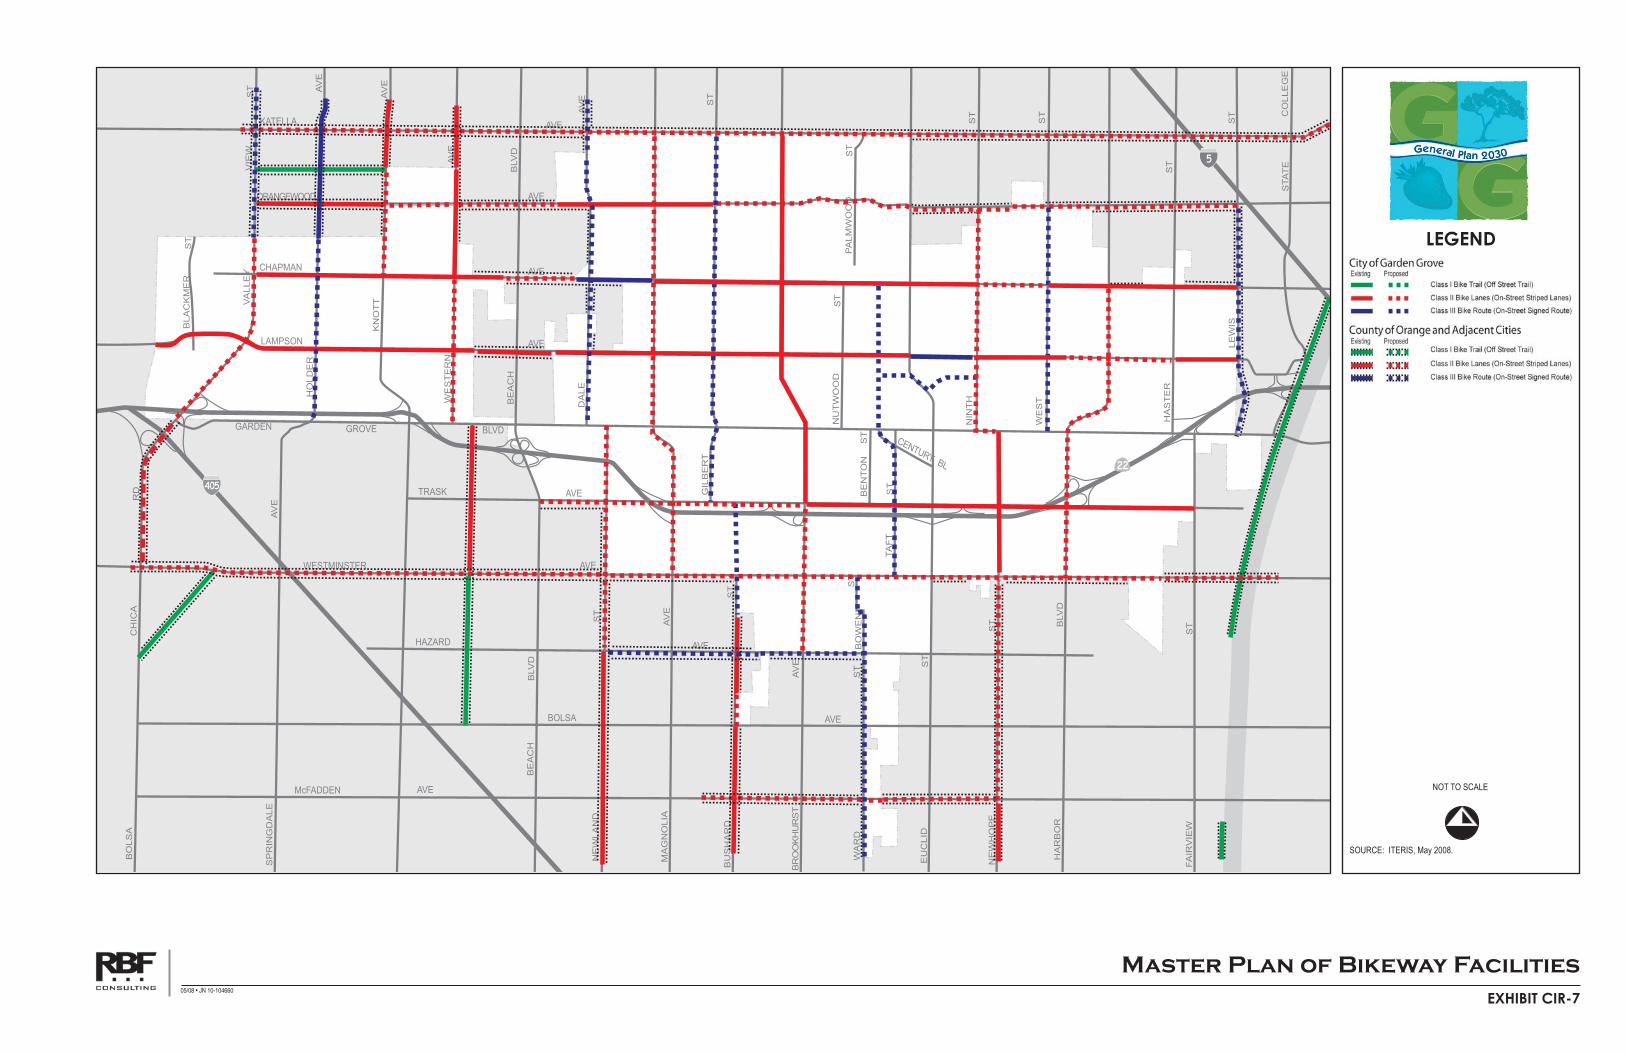
EXHIBIT CIR-7
Master Plan of Bikeway Facilities05/08 • JN 10-104660
KATELLA AVE
ORANGEWOOD AVE
CHAPMAN AVE
LAMPSON AVE
GARDEN GROVE BLVD
TRASK AVE
WESTMINSTER AVE
HAZARD AVE
BOLSA AVE
McFADDEN AVE
BOLSA
CHICA
RD
SPRINGDALE
AVE
HOLDER
AVE
KNOTTVALLEY
VIEW
ST
AVE
WESTERN
AVE
BEACH
BLVD
DALE
AVE
MAGNOLIA
AVE
GILBERT
ST
BROOKHURST
AVE
EUCLID
ST
BEACH
BLVD
NEWHOPE
ST
HARBOR
BLVD
FAIRVIEW
ST
STATE
LEWIS
COLLEGE
ST
HASTER
ST
BUSHARD
ST
NEWLAND
ST
TS
DRA
W
WEST
NINTH
ST
ST
NUTWOOD
ST
PALMWOOD
ST
BENTON
ST
TAFT
ST
CENTURYBL
BOWEN
ST
BLACKMER
ST
SOURCE: ITERIS, May 2008.
LEGEND
NOT TO SCALE