Embed Size (px)
Citation preview

Report No. 93913- MK
FYR Macedonia Public Expenditure Review
Fiscal Policy for Growth
July 2015
Pub
lic D
iscl
osur
e A
utho
rized
Pub
lic D
iscl
osur
e A
utho
rized
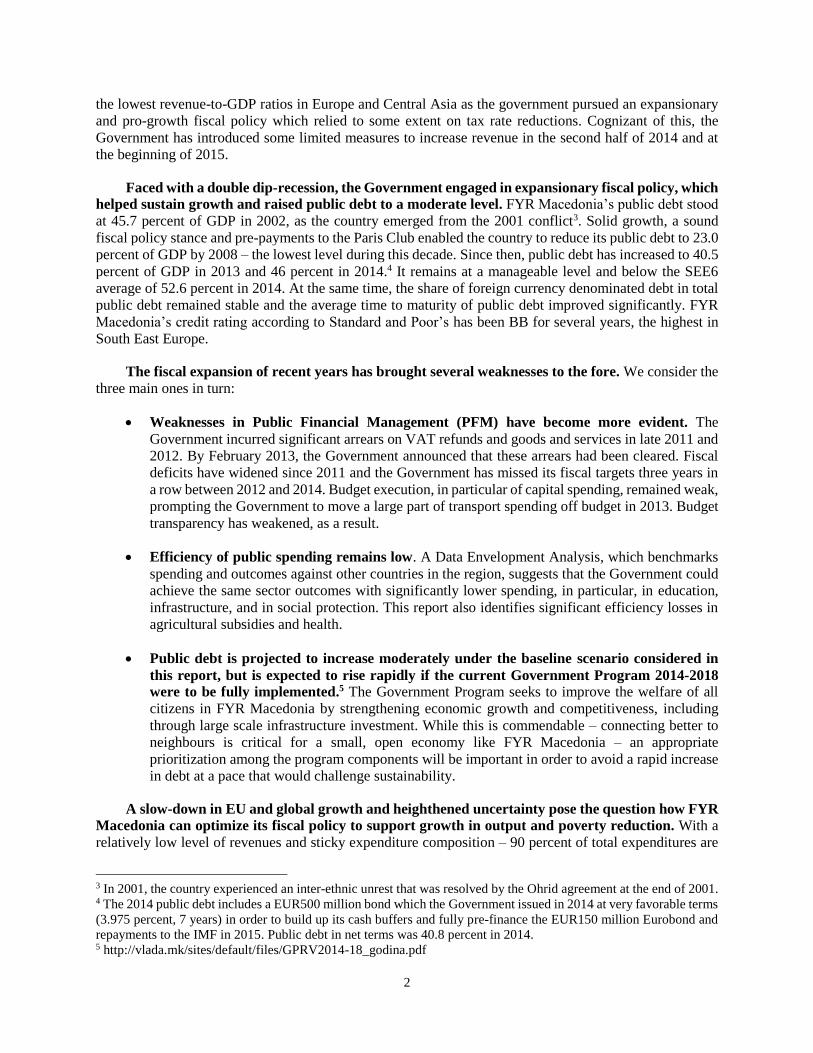
Pub
lic D
iscl
osur
e A
utho
rized
Pub
lic D
iscl
osur
e A
utho
rized

CURRENCY AND EQUIVALENT UNITS
Currency Unit=Macedonia Denar
MKD 1 = 0.018 US$
US$1 = 54 MKD
(As of February 16, 2015)
FISCAL YEAR
January 1 – December 31
WEIGHTS AND MEASURES
Metric System
ACRONYMS AND ABBREVIATIONS
AADT Average Annual Daily Traffic MOH Ministry of Health
ARD Agriculture and Rural Development MOTC Ministry of Transport and
Communication
CA Contracting Authorities MTFS Medium Term Fiscal Strategy
CEE Central and Eastern Europe NATO North Atlantic Treaty Organization
CG Central Government NBRM National Bank of the Republic of
Macedonia
CHU Central Harmonization Unit NCD Non-communicable Diseases
CIT Corporate Income Taxes OECD Organization for Economic
Co-operation and Development
DEA Data Envelopment Analysis PAYG Pay-As-You-Go
DRG Diagnostic Related Groups PEFA Public Expenditure and Financial
Accountability
EBRD European Bank for Reconstruction and
Development
PEP Pre-Accession Economic Program
EC European Commission PER Public Expenditure Review
ECA Europe and Central Asia PESR Public Enterprise for State Roads
EIB European Investment Bank PFM Public Financial Management
ELEM Macedonian Power plants JSC PIFC Public Internal Financial Control
EOs Economic Operators PISA Programme for International Student
Assessment
ERC Energy Regulatory Committee PIT Personal income taxes
ESA European Systems of Accounts PPB Public Procurement Bureau
ESPP Electronic System for Public
Procurement
PPP Purchasing Power Parity
EU European Union PPP Private Public Partnership
EVN Energie-Versorgung Niederösterreich
AG
PRO Public Revenue Office
FAU Financial Affairs Unit PROST Pension Reform Options
Simulations Toolkit
FDI Foreign Direct Investment PSE Public Sector Efficiency
GDP Gross Domestic Product RAMS Road Asset Management

Framework
GFS Government Finance Statistics RONET Road Network Evaluation Tool
GG General Government SAC State Appeals Commission
GOM Government of Macedonia SAO State Audit Office
HIF Health Insurance Fund SDDS Special Data Dissemination
Standard
HTA Health Technology Assessment SEE South East Europe
IBRD International Bank for Reconstruction
and Development
SEETO South East Europe Transport
Observatory
IFI International Financial Institution SILC Survey on Income and Living
Conditions
IMF International Monetary Fund SIOFA Secretariat for Implementation of the
Ohrid Frame Agreement
IPA Instrument for Pre-Accession
Assistance
SME Small and Medium Enterprise
LiTS Life in Transition Survey SOE State Owned Enterprise
LPI Logistics Performance Index SSO State Statistics Office
LPP Law on Public Procurement STEM Science, Technology, Engineering and
Mathematics
MBDP Macedonian Bank for Development
Promotion
TFP Total Factor Productivity
MEPSO Electricity Transmission System
Operator of Macedonia
USD United States Dollar
MICS Middle Income Countries VAT Value Added Tax
MKD Macedonia WEF World Economic Forum
MOF Ministry of Finance WGI World Governance Indicators
Regional Vice President: Laura Tuck
Country Director: Ellen Goldstein
Senior Director: Marcelo Giugale
Practice Manager: Ivailo Izvorski
Task Team Leader: Doerte Doemeland / Bojan Shimbov

CONTENTS
ACKNOWLEDGMENTS ........................................................................................................................................ VI
EXECUTIVE SUMMARY ......................................................................................................................................... 1
CHAPTER 1. COUNTRY CONTEXT .............................................................................................................. 11
A. INTRODUCTION ................................................................................................................................................ 11 B. SOLID GROWTH WITH FEW GAINS IN SHARED PROSPERITY ............................................................................... 12 C. FISCAL STIMULUS AND PUBLIC DEBT .............................................................................................................. 17 D. THE GOVERNMENT’S REFORM AGENDA ........................................................................................................... 19 E. OBJECTIVE AND STRUCTURE OF THIS REPORT ................................................................................................. 22
CHAPTER 2. PUBLIC FINANCIAL MANAGEMENT ................................................................................. 23
A. INTRODUCTION ................................................................................................................................................ 23 B. BUDGET STRUCTURE AND CREDIBILITY ........................................................................................................... 23 C. BUDGET COMPREHENSIVENESS AND TRANSPARENCY ...................................................................................... 26 D. MEDIUM-TERM FISCAL FRAMEWORK .............................................................................................................. 30 E. CAPITAL INVESTMENT MANAGEMENT ............................................................................................................. 32 F. TREASURY AND CASH MANAGEMENT............................................................................................................... 33 G. PUBLIC DEBT ................................................................................................................................................... 34 H. PUBLIC PROCUREMENT .................................................................................................................................... 34 I. PUBLIC INTERNAL FINANCIAL CONTROL ......................................................................................................... 37 J. PUBLIC SECTOR ACCOUNTING ......................................................................................................................... 37 K. EXTERNAL SCRUTINY AND AUDIT ................................................................................................................... 38 L. FINANCIAL MANAGEMENT INFORMATION SYSTEMS ........................................................................................ 39 M. CONCLUSIONS .................................................................................................................................................. 39
CHAPTER 3. COMPOSITION AND EFFICIENCY OF PUBLIC SPENDING .......................................... 41
A. INTRODUCTION ................................................................................................................................................ 41 B. SPENDING BY CLASSIFICATION ........................................................................................................................ 41 C. SPENDING BY GOVERNMENT LEVEL ................................................................................................................ 48 D. EFFICIENCY ...................................................................................................................................................... 51 E. CONCLUSIONS .................................................................................................................................................. 59
CHAPTER 4. FISCAL SUSTAINABILITY ..................................................................................................... 61
A. INTRODUCTION ................................................................................................................................................ 61 B. EVOLUTION AND COMPOSITION OF PUBLIC DEBT ............................................................................................ 61 C. BASELINE SCENARIO AND SHOCKS .................................................................................................................. 65 D. ALTERNATIVE SCENARIOS ............................................................................................................................... 68 E. FISCAL RULES .................................................................................................................................................. 76 F. CONCLUSION ............................................................................................................................................... 79
CHAPTER 5. TRANSPORT .............................................................................................................................. 83
A. INTRODUCTION ................................................................................................................................................ 83 B. THE ROAD NETWORK ...................................................................................................................................... 83 C. PUBLIC MANAGEMENT OF THE ROAD SECTOR ................................................................................................. 86 D. EFFICIENCY OF TRANSPORT SPENDING ............................................................................................................ 87 E. FINANCIAL SUSTAINABILITY............................................................................................................................ 90 F. CONCLUSIONS .................................................................................................................................................. 93
CHAPTER 6. HEALTH ..................................................................................................................................... 94
A. INTRODUCTION ................................................................................................................................................ 94 B. HEALTH OUTCOMES AND SERVICES ................................................................................................................. 94 C. PUBLIC MANAGEMENT OF THE HEALTH SECTOR ............................................................................................. 98

D. EFFICIENCY OF HEALTH SPENDING ................................................................................................................ 102 E. CONCLUSIONS ................................................................................................................................................ 107
CHAPTER 7. PENSIONS................................................................................................................................. 109
A. INTRODUCTION .............................................................................................................................................. 109 B. THE PENSION SYSTEM ................................................................................................................................... 109 C. FISCAL SUSTAINABILITY ................................................................................................................................ 115 D. CONCLUSIONS ................................................................................................................................................ 118
REFERENCES ........................................................................................................................................................ 121
TABLES
Table 1.1: FYR Macedonia – Key Economic Indicators ............................................................................................ 14 Table 1.2: Pillars of the National Reform Program, 2014-2018 .................................................................................. 19 Table 2.1: Transition from the Institutional Appropriations to Consolidated Central Government ............................ 25 Table 2.2: Planned versus actual central government revenues ................................................................................... 26 Table 2.3: Comprehensiveness of information included in budget documentation ..................................................... 28 Table 2.4: Medium-term fiscal deficit targets.............................................................................................................. 31 Table 4.1: Central government financing needs .......................................................................................................... 66 Table 4.3: Level and composition of government revenues in Europe, 2013 ............................................................. 72 Table 5.1: State Roads Classification and Condition ................................................................................................... 84 Table 5.2: Comparison of Annual Road Agency Costs ............................................................................................... 88 Table 6.1: Number of Insured Persons has been declining, but increased slightly in 2013 ......................................... 98 Table 6.2: Allocation of Health Expenditure ............................................................................................................. 100 Table 7.1:Macroeconomic Assumptions for Baseline Simulation ............................................................................. 116
FIGURES
Figure 1.1:GDP growth in regional context ................................................................................................................. 13 Figure 1.2: Growth Incidence Curves in FYR Macedonia, 2003-2008 ....................................................................... 16 Figure 1.3: Fiscal Policy Trends of the Central Government ...................................................................................... 17 Figure 1.4: Fiscal performance and deficit level ......................................................................................................... 18 Figure 1.5: Government Program Expenditure Items .................................................................................................. 21 Figure 2.1: FYR Macedonia’s Budget Structure ......................................................................................................... 24 Figure 2.2: Functional Expenditure Variance .............................................................................................................. 26 Figure 2.3: Fiscal Transparency Indicators .................................................................................................................. 27 Figure 3.1: Government Expenditure .......................................................................................................................... 42 Figure 3.2: Capital Expenditures ................................................................................................................................ 42 Figure 3.3: Subsidies and Quality of Capital Spending ............................................................................................... 45 Figure 3.4: Central Government Expenditure by Functional and Administrative Classification ................................ 47 Figure 3.5: General Government Expenditure Composition ....................................................................................... 48 Figure 3.6: Public Expenditures and PSE Index .......................................................................................................... 53 Figure 3.7: Some Examples of the Efficiency of Education Expenditures .................................................................. 54 Figure 4.1: Public Debt by Categories and across SEE6 countries .............................................................................. 62 Figure 4.2: Public Debt Dynamics ............................................................................................................................... 63 Figure 4.3: Interest Expenditure on Central Government Debt ................................................................................... 63 Figure 4.4: Public Debt Structure ................................................................................................................................ 64 Figure 4.5: Maturity Stucture of Domestic Debt ......................................................................................................... 64 Figure 4.6: Composition of Public Debt under the Baseline Scenario......................................................................... 71 Figure 4.7: Public Sector Debt under Different Shocks ............................................................................................... 68 Figure 4.8: Public Sector Debt under Alternative Scenarios ....................................................................................... 69 Figure 4.9: Government Revenues in Selected European Countries ......................................................................... 710 Figure 4.10:Revenue Realization ................................................................................................................................. 71 Figure 4.11:Labor Tax Wedge and Vat Performance .................................................................................................. 73

Figure 4.12: Tax Productivity .................................................................................................................................... 715 Figure 4.13: Revenue Scenario .................................................................................................................................... 76 Figure 5.1: Road Network ........................................................................................................................................... 84 Figure 5.2: Infrastructure rankings in 2014 ................................................................................................................. 85 Figure 5.3: Maintenance Spending .............................................................................................................................. 87 Figure 5.4: PESR revenue and expenditures in 2013 .................................................................................................. 91 Figure 5.5: Evolution of PESR revenues and expenditures 2005-2018 (in euros)....................................................... 92 Figure 5.6: Total financing of maintenance, 2009-2018 ............................................................................................. 93 Figure 6.1: Life Expectancy at Birth and Infant Mortality per 1,000 Live Births, Selected Countries ....................... 95 Figure 6.2: Satisfaction with Public Services and Incidence of Informal Payments ................................................... 97 Figure 6.3: Total Health Expenditure Composition ..................................................................................................... 98 Figure 6.4: Public health spending .............................................................................................................................. 99 Figure 6.5: Nominal HIF revenues and expenditures .................................................................................................. 99 Figure 6.6: Sources of Revenue and Contributions for the Health Insurance Fund ................................................... 100 Figure6.7: Expenditures for Primary Care and Hospitals .......................................................................................... 101 Figure 6.8: Composition of Spending by all Public Health Institutions (2013) ......................................................... 101 Figure 6.9: Composition of Total Health Spending by Type of Care ........................................................................ 101 Figure 6.10: Average Length of Hospital Stays in Days... ........................................................................................ 103 Figure 6.11: Bed Occupancy Rates by Hospital Types ............................................................................................. 103 Figure 6.12: The average cost per discharge varies significantly among hospitals ................................................... 104 Figure 6.13: Total hospital deficits (USD) compared to % of expenditures on salaries ............................................ 104 Figure 6.14: Total number of prescriptions and total amount paid for medicines in primary health care ................. 106 Figure 7.1: Pension system dependency and replacement rates, 2001-2013 ............................................................. 110 Figure 7.2: Average Pension Benefit Relative to Average Wage 2009 and 2013 for FYR Macedonia .................... 111 Figure 7.3: Pension and Social Insurance Contribution Rates ................................................................................... 112 Figure 7.4: Pension System Financing ...................................................................................................................... 112 Figure 7.5: Current and Projected Pension Spending, 2010 and 2060 ....................................................................... 114 Figure 7.6: Old age, disability and survivors pensions in Macedonia, 1991-2013 .................................................... 114 Figure 7.7: Share people aged 65+ in Total Population, selected countries, 2010 - 2050 ......................................... 115 Figure 7.8: Projected Number of Pension Contributors and Beneficiaries in Macedonia, ........................................ 116 Figure 7.9: Projected Pension Replacement Rates in Macedonia .............................................................................. 117 Figure 7.10: Baseline simulation output 2014-2080 .................................................................................................. 118 Figure 7.11: Projected Implicit Pension Debt ............................................................................................................ 118
BOXES
Box 2.1: Budget Execution Report in Budget Law: Croatia Budget Act 2009.......................................................... 30
Box 4.1: Recent Tax Reforms in the ECA region and the European Union ................................................................ 72 Box 4.2: Numerical Fiscal Rules ................................................................................................................................. 78 Box 7.1: Pension reform measures in Europe and Central Asia during the last two decades ................................... 110
ACKNOWLEDGMENTS
This report was prepared by a World Bank team led by Doerte Doemeland, Lead Economist and Bojan
Shimbov, Economist. The chapters were authored by the following thematic team: Doerte Doemeland and
Bojan Shimbov (country context, expenditure and revenue trends and composition), Marina Bakanova and
Rachel Li Jiang (efficiency of public spending), Bojana Naceva (efficiency of education spending), Andrew
Mackie and Mediha Agar (public financial management), Kashimira Daruwalla and Hunt (procurement),
Moustafa Baher El-Hefnawy, Rodrigo Archondo-Callao and Liljana Sekerinska (transport), Timothy
Johnston (health), Zoran Anusic and Miglena Abels (pensions) and Gaurav Nayyar (fiscal sustainability).
Stephanie Gil and Claudia Vazquez provided significant inputs to the energy chapter, Patrick Eozenou
contributed to the health chapter, and Nikola Kojucharov wrote an early draft of the expenditure chapter.
The World Bank team is sincerely grateful to the Macedonian Government for its close collaboration during
the preparation of this report. The team would like to thank the Deputy Prime Minister for his support and
senior officials from the Ministry of Finance, the Ministry of Transport, the Public Enterprise for State
Roads, Public Enterprise Makedonija Pat, the Ministry of Health, the National Health Insurance Fund, the
PESR and the Social Security Funds for their outstanding collaboration. The team also benefitted
significantly from discussions with the European Commission, the International Monetary Fund, other
international stakeholders and Macedonian civil society and private sector representatives.
Special thanks also go to Ellen Goldstein (Country Director for Southeast Europe), Satu Kahkonen
(Director, GMFDR), Nichola Dyer (Country Program Coordinator, Southeast Europe), Tatiana
Proskuryakova (former Country Manager of FYR Macedonia) and Ivailo Izvorski (Practice Manager,
GMFDR), who provided valuable support and guidance. Chiara Bronchi, Mona Prasad and Marijn
Verhoeven served as peer reviewers of the report. The team is grateful for their rich comments and
feedback. Jasminka Sopova provided support to the team during country visits; and Mismake Galatis for
her support in document processing.

EXECUTIVE SUMMARY
FYR Macedonia is a small, open economy that has experienced solid growth during the last
decade. Landlocked, with a population of 2.1 million, the country’s GDP per capita is USD 5371 in 2014,
placing it among the group of upper middle income countries. Annual real GDP per capita growth in PPP
terms averaged 3.7 percent between 2006 and 2014 - the second highest growth rate among the countries
of South East Europe1 (SEE6) and far above the EU28 average of 1.4 percent. Strong growth enabled FYR
Macedonia to increase its per capita income relative to the EU28 from 30.7 percent in 2006 to 36.6 percent
in 2014. Though it was the first SEE6 country to gain EU candidate country status in 2005, the EU has not
yet launched accession negotiations, unlike in neighbouring countries, partly due to its name dispute with
Greece. Yet, EU accession remains the main anchor of the Macedonian reform agenda.
FYR Macedonia has been able to preserve macroeconomic stability in the presence of adverse
shocks. The exchange rate peg to the Deutsche Mark (subsequently the Euro), introduced in 1995, has
successfully supported price stability, with inflation averaging 2.4 percent a year over the last 10 years.
Macroeconomic policies have been geared towards keeping the external balance manageable, and monetary
policy has responded quickly to any possible threats to the peg. The Government has also implemented key
reforms to improve the business climate, elevating FYR Macedonia to one of the top reformers in the World
Bank’s 2014 Doing Business rankings and the best performer with respect to the ease of doing business
among SEE6 countries. The authorities have combined structural reforms, support of industrial zones, and
fiscal measures – notably tax exemptions for foreign investors – to turn FYR Macedonia into an attractive
FDI destination. Inflows of FDI increased an average of 4.2 percent of GDP per year between 2006 and
2014, yet remained below the SEE6 average of 7.6 percent of GDP. Unlike other SEE6 countries, a
predominant share of FYR Macedonia’s FDI consisted of green-field investments in the tradable sector,
enabling it to boost exports and diversify its export structure.
Unemployment has declined since the 2008 global financial crisis, which seems to have
resulted in a modest decline in poverty. FYR Macedonia has made impressive progress in reducing
unemployment since 2008. According to Labor Force Survey (LFS) data, unemployment dropped from 37
percent in 2004 to 32 percent in 2009 and further to 28 percent in 2014. In fact, FYR Macedonia is the only
SEE6 country where unemployment actually declined during the post-crisis period. Yet, youth
unemployment remains at 53.1 percent in 2014 the second highest in the SEE6 region after Kosovo.
Foreign-owned firms contributed to the decline in overall unemployment: since 2009, these firms created
on average around 16 percent of new jobs. Other sectors that contributed significantly to employment
growth were agriculture, construction and the transport sector as well as the public administration2. Poverty
data in FYR Macedonia is patchy. Some evidence exists that poverty declined slightly after 2010. Although
internationally comparable estimates of poverty are not available for FYR of Macedonia, national estimates
register a decrease in poverty rates, from 27.0 percent in 2010 to 24.2 in 2013, despite a 6 percent increase
in the poverty line, suggesting an improvement in living conditions at the bottom of the distribution.
FYR Macedonia’s size of government compares favorably to most countries at its level of per-
capita income. At about 34.5 percent of GDP between 2006 and 2013 on average, FYR Macedonia’s
government spending was significantly below EU and SEE6 averages. At the same time, general
government revenues declined steeply from 33.8 percent of GDP in 2007 to 27.8 percent in 2014 – one of
1In this report, South East Europe or SEE6 refers to Albania, Kosovo, FYR Macedonia, Montenegro and Serbia.
Data on GDP per capita in PPP terms for Kosovo is not available. 2 There is no publically available data on the number of public employees. This analysis relies on data provided by
the State Statistics Office on employment in public administration and defense, education as well as health and social
works as a proxy for the number of public employees.
2
the lowest revenue-to-GDP ratios in Europe and Central Asia as the government pursued an expansionary
and pro-growth fiscal policy which relied to some extent on tax rate reductions. Cognizant of this, the
Government has introduced some limited measures to increase revenue in the second half of 2014 and at
the beginning of 2015.
Faced with a double dip-recession, the Government engaged in expansionary fiscal policy, which
helped sustain growth and raised public debt to a moderate level. FYR Macedonia’s public debt stood
at 45.7 percent of GDP in 2002, as the country emerged from the 2001 conflict3. Solid growth, a sound
fiscal policy stance and pre-payments to the Paris Club enabled the country to reduce its public debt to 23.0
percent of GDP by 2008 – the lowest level during this decade. Since then, public debt has increased to 40.5
percent of GDP in 2013 and 46 percent in 2014.4 It remains at a manageable level and below the SEE6
average of 52.6 percent in 2014. At the same time, the share of foreign currency denominated debt in total
public debt remained stable and the average time to maturity of public debt improved significantly. FYR
Macedonia’s credit rating according to Standard and Poor’s has been BB for several years, the highest in
South East Europe.
The fiscal expansion of recent years has brought several weaknesses to the fore. We consider the
three main ones in turn:
Weaknesses in Public Financial Management (PFM) have become more evident. The
Government incurred significant arrears on VAT refunds and goods and services in late 2011 and
2012. By February 2013, the Government announced that these arrears had been cleared. Fiscal
deficits have widened since 2011 and the Government has missed its fiscal targets three years in
a row between 2012 and 2014. Budget execution, in particular of capital spending, remained weak,
prompting the Government to move a large part of transport spending off budget in 2013. Budget
transparency has weakened, as a result.
Efficiency of public spending remains low. A Data Envelopment Analysis, which benchmarks
spending and outcomes against other countries in the region, suggests that the Government could
achieve the same sector outcomes with significantly lower spending, in particular, in education,
infrastructure, and in social protection. This report also identifies significant efficiency losses in
agricultural subsidies and health.
Public debt is projected to increase moderately under the baseline scenario considered in
this report, but is expected to rise rapidly if the current Government Program 2014-2018
were to be fully implemented.5 The Government Program seeks to improve the welfare of all
citizens in FYR Macedonia by strengthening economic growth and competitiveness, including
through large scale infrastructure investment. While this is commendable – connecting better to
neighbours is critical for a small, open economy like FYR Macedonia – an appropriate
prioritization among the program components will be important in order to avoid a rapid increase
in debt at a pace that would challenge sustainability.
A slow-down in EU and global growth and heighthened uncertainty pose the question how FYR
Macedonia can optimize its fiscal policy to support growth in output and poverty reduction. With a
relatively low level of revenues and sticky expenditure composition – 90 percent of total expenditures are
3 In 2001, the country experienced an inter-ethnic unrest that was resolved by the Ohrid agreement at the end of 2001. 4 The 2014 public debt includes a EUR500 million bond which the Government issued in 2014 at very favorable terms
(3.975 percent, 7 years) in order to build up its cash buffers and fully pre-finance the EUR150 million Eurobond and
repayments to the IMF in 2015. Public debt in net terms was 40.8 percent in 2014. 5 http://vlada.mk/sites/default/files/GPRV2014-18_godina.pdf

3
for current outlays and more than 25 percent of current spending is pension-related – support to growth is
unlikely to come from further tax cuts or large spending increases, as these would further increase
government debt. Maintaining a manageable debt level is particularly important in the current uncertain
external policy environment.
The report suggests that the Macedonian authorities make sustained efforts to strengthen public
financial management, improve the efficiency of public spending and moderate ambitious plans to
scale up infrastructure investments, with a greater focus on the quality of investment spending. The
Public Expenditure Review (PER) reaches this conclusion by analyzing three related aspects of fiscal
policy, which are discussed in turn.
First, the report presents a PFM assessment, which provides a review of the strengths and
weaknesses of PFM processes in FYR Macedonia. The PFM chapter captures a broad range of
PFM processes rather than drilling down in specific areas.
Second, the PER discusses the efficiency of public spending on the basis of recent fiscal policy
trends. This is the first PER for FYR Macedonia since 2008, and it takes stock of fiscal policy
developments since 2006.
Third, the PER focuses on fiscal sustainability. The Government is planning to significantly ramp
up investment spending because FYR Macedonia lags along key dimensions of infrastructure
which are important for a small, open economy to remain competitive. The PER therefore, assesses
how public debt evolves under a range of investment and other policy scenarios.
These three fiscal policy aspects are then discussed in sector-specific details in the chapters on
transport, health and pensions. Transport investment and pension spending are likely to be key drivers
of public debt over the medium to longer term. The health sector, meanwhile, continues to suffer from
persistent arrears. The health chapter assesses why these arrears occur and how to prevent them.
The report identifies short- and medium-term policy options in some key areas. Policy options
focus on strengthening PFM, managing expenditures and health and transport sector reforms. Government
requested a focus on policy recommendations in these specific areas for this report. In addition, reforms of
fiscal revenues and pensions remain critical and unavoidable elements of future fiscal sustainability.6
Strengthening Public Financial Management
Improvements in PFM would enhance efficiency, transparency and accountability of public
spending. In recent years, the Ministry of Finance has made significant progress in strengthening debt
management, commitment controls and the Treasury system. The public procurement system rests on sound
foundations and the legal framework has been almost fully harmonized with the EU. Internal audit
procedures have been strengthened and the State Audit Office is appropriately funded and produces reports
according to INTOSAI standards.
FYR Macedonia’s published fiscal data is relatively comprehensive, but gaps remain. FYR
Macedonia performed best among the SEE6 countries in 2014 with respect to the World Economic Forum’s
Index on Transparency of Government Policymaking (WEF 2015) that measures the ease for private
businesses to obtain information about changes in government policies and regulations which affect their
activities. It ranks, however, lowest with respect to the Open Budget Survey in 2012, the latest available
6 The Government has implemented some revenue-enhancing measures in the second half of 2014 and 2015, such as
the expansion of the profit tax, a reduction in the VAT registration threshold.

4
data for FYR Macedonia. A detailed analysis of fiscal publications suggests that budget documents cover
key areas, but the annual budget report could be improved by including cost estimates of all proposed new
government initiatives and of changes to existing policies. The medium-term fiscal framework could be
supported through a discussion of policy proposals that underpin the fiscal path. Also, information on
expenditure arrears should be published in budget documents.
Though FYR Macedonia has strengthened commitment controls, evidence indicates that
arrears in the health sector and at the local government level persist. Similary to many SEE6 countries,
FYR Macedonia accumulated arrears in the wake of the global financial crisis. The central government
started accumulating budgetary arrears in late 2011 consisting of VAT refunds and goods and services
payments. It recognized these arrears in September 2012 and settled the announced amount by the end of
February 2013. It took several steps to strengthen commitment controls, including by introducing a
commitment module in the Treasury system that is operational since 2014. Yet, health sector arrears of
about 0.6 percent of GDP, including the Ministry of Health, persist. Arrears also persist at local
governments, e.g. for utilities payments.
Budget execution has been weak and the Government has missed its fiscal targets during the
last three years. Since 2009, realized revenues have been below the budget target by 9.4 percent on
average, largely due to lower VAT and import duties. Government also undershot on the spending side:
expenditures amounted to 92 percent of the budget plan on average between between 2009 and 2014, largely
due to lower capital spending. As almost 80 percent of public spending consists of public wages, social
transfers and subsidies, which are difficult to cut in an ad-hoc manner, the decline in revenues was often
not accompanied by a commensurate drop in expenditures. As a result, fiscal deficits widened over time
and the Government consecutively missed its fiscal targets between 2012 to 2014. In 2012 and 2013, these
overruns were to some extent due to Government clearance of arrears on VAT refunds and to suppliers.
The 2014 fiscal deficit widened to 4.2 percent of GDP which compares with an original planned deficit of
3.5 percent of GDP.
The Government moved a large part of transport investments off budget in 2013 to
strengthen project implementation and protect capital spending from ad-hoc spending cuts. Capital
expenditures averaged 11 percent of total expenditures since 2006 or 4.5 percent of GDP. This is the second
lowest capital expenditure ratio in the SEE6 region and significantly below the SEE6 average of 5.8 percent
of GDP, but it is higher than the average of the EU member states that have acceded since 2004. Execution
of capital spending has been low due to weakness in project implementation. Recognizing this weakness,
the authorities are strengthening the technical capacity at the PESR, which is now responsible for
implementing the majority of roads projects. Consequently, after years of neglect, road infrastructure
investments started growing in 2014.
Improving the Efficiency of Public Spending
Efficiency analysis suggests that FYR Macedonia could achieve the same public sector
outcomes with significantly less resources, and that the efficiency of public spending remains
particularly low with respect to education, infrastructure and social protection. Despite some
improvements in recent years, social assistance spending remains small and fragmented while infrastructure
spending tends to favor new construction over maintenance. The following paragraphs summarize
recommendations to enhance efficiency of public spending with respect to education, social protection,
health, infrastructure and agricultural subsidies.
Education outcomes have deteriorated despite increased spending. In 2013, FYR Macedonia’s
spending on education of 4.1 percent of GDP was the highest in the region, but its education performance

5
indicators were below the regional average. The quality of primary and secondary education has not
improved significantly over the last several years, as measured by international tests. Scores on the Trends
in International Mathematics and Science Study (TIMSS) declined significantly between 1999 and 2011,
and are below other European countries. Enrollment in tertiary education has been increasing rapidly in
recent years, but the efficiency of the higher education system remains low. While critical data on student
learning and graduate employment outcomes do not exist, a 2010 World Bank survey of employers showed
they continue to find it difficult to hire workers with the required skills, particularly for newly created jobs
in modern and dynamic firms. As in most ECA countries, no mechanisms are in place for regular data
collection and analyses of tertiary education outcomes.
The Government could take several steps to improve the quality of education. Providing
training to primary and secondary teachers and increasing the hours of primary teachers in line with global
standards could help to strengthen the quality of primary and secondary education. Tertiary education could
be improved by coordinating the curriculum with the private sector and by introducing capitation financing
for tertiary education institutions. Developing a strategic framework for monitoring student learning
outcomes, particularly, if combined with detailed information on labor market conditions, could provide a
useful basis for policy decisions.
Social assistance spending in FYR Macedonia is low and fragmented. The Government spent only
1.2 percent of GDP on social benefits in 2014, which is considerably below European averages. Social
assistance in FYR Macedonia consists of numerous cash benefit programs, including a targeted last-resort
social financial assistance program (SFA), as well as other benefits such as child allowances, parental and
disability benefits. The SFA – the largest social assistance program - provided assistance to around 34,500
households in 2013 (about 7 percent of all households). The potential overlap of benefits needs to be
reduced, to clarify the relation between categorical benefits and income-based benefits and to reform
legislation so as to reflect more accurately order, contents and regulation of cash benefits. The introduction
of the Cash Benefits Management Information System (CBMIS) in late 2011 has helped to reduce the time
spent processing payments for cash benefits, decreased the burden on employees in the Social Welfare
Centers and created a database that can be used for the analysis of cash benefits for the purposes of
improving policy design. Next steps for further strengthening the performance of the overall safety net
could include the review of coverage, targeting, eligibility, and registry systems of different social
assistance programs. The health spending level is appropriate, but suffers from arrears accumulation and other
inefficiencies. Total health spending in FYR Macedonia amounted to 7.1 percent of GDP in 2013, with
public health spending of about 5.1 percent of GDP (a slight decline from nearly 5.3 percent of GDP in
2006). FYR Macedonia has made important progress in reforming the financing and organization of health
care. It has established the Health Insurance Fund (HIF) as a single payer for health care services, reformed
the organization and financing of primary care, introduced case payments for hospitals, and achieved
savings in spending on pharmaceuticals and medical devices. Health spending in terms of GDP in FYR
Macedonia is now lower than in some other SEE6 countries, such as Serbia, and in the EU on average. Yet,
provided services remained above the HIF contracted amounts in some hospitals, leading to deficits and
arrears of about 0.6 percent of GDP as of end 2014. Moreover, the government provides special subsidies
to hospitals whose expenditures exceed the financing justified by their outputs, which limits resources
available for better-performing hospitals. A combination of increased hospital costs, flat outlays, and
limited progress in politically difficult reforms (particularly hospital restructuring and benefit-package
management) is contributing to hospital deficits, rationing of care, and increased out-of-pocket expenses
by the population.
Addressing the challenges in the health sector will require a comprehensive set of reforms.
Efficiency of health spending could be improved by shifting funding from inefficient hospitals to higher-

6
performing ones. Potential savings from better procurement of pharmaceuticals would most efficiently be
used by shifting toward primary care and prevention. In addition, hospital reforms that help right-sizing and
strengthening the autonomy and accountability of hospitals could reduce inefficiencies in hospital-service
provision. The authorities should continue to seek savings in pharmaceuticals and medical devices, while
aligning benefit packages with available financing.
Maintenance of buildings and infrastructure has been under-provisioned for years, leading
to a large backlog. Between 2009 and 2013, general government spending on goods and services averaged
4.7 percent of GDP, which is below the SEE6 average of 5.8 percent. Goods and services include
maintenance spending and repairs as well as utility services and heating. Low spending on goods and
services has contributed to a deterioration of public assets, such as roads, schools and hospitals. Since 2013,
road maintenance is funded through the PESR and implemented by the publicly-owned Makedonija Pat.
While the Government has received significant external funding for road maintenance for the period 2013-
2015, it lacks reliable estimates of maintenance needs and a strategy for providing appropriate maintenance
spending over the longer term. If unaddressed, this problem will lead to significant additional costs for the
Government and road users. Simulations suggest that for every additional dollar the Government spends on
the maintenance of roads, users would save 3.48 dollars. It is recommended that the Government finalizes
a conclusive assessment of the state of the road network, develop a strategy to finance maintenance
appropriately over the long term, addresses the current maintenance backlog, improve the allocation of
maintenance funding and consider the privatization of road maintenance. Adopting objective, quantitative
and transparent criteria for road investment planning, which would not only encompass new investments
but also maintenance spending, could significantly improve the efficient use of public funds and help FYR
Macedonia reap the economic benefits from these investments. The implementation of a road management
system would enable Government to carefully assess investment needs and make economically sound
decisions on prioritization of investments.
The Government could consider reducing and improving the targeting of agricultural
subsidies. FYR Macedonia is running a generous agricultural subsidies program which accounts for 90
percent of the agricultural budget. Agricultural subsidies per hectare are above the EU average. The
Government further increased the agricultural budget from EUR 130 million in 2013 to EUR 150 million
in 2015. The objective of the agricultural program is to boost competiveness, yet: i) most of the funding
goes to income support, while only a fraction is invested; ii) large farms still receive a disproportionally
high share of the subsidies; iii) in specific subsectors such as tobacco, subsidies now cover a significant
share of the cost of production, which distorts investment incentives; and iv) a relatively small share of
subsidies supports products with high export share. At the same time, the level of public funding for
irrigation development and water infrastructure is negligible. To increase the efficiency of subsidy
spending, it is recommended to: i) reduce the overall level of agricultural subsidies; ii) channel a higher
share of subsidies toward productivity-enhancing public goods; and iii) improve the targeting of income
support subsidies toward needy subsistence farmers.
Maintaining Fiscal Sustainability
How can FYR Macedonia meet its investment needs without jeopardizing fiscal sustainability? As a landlocked economy that relies on exports to sustain long-term growth, connectivity to other markets
is very important. Inadequate road and railway infrastructure constrain the country’s competitiveness.
Investing more in transport infrastructure while securing appropriate medium-to-long-term financing for
maintenance will be important for FYR Macedonia’s growth prospects. To ensure that these additional
investments do not lead to a rapid build-up of public debt, a moderate scaling up of public infrastructure
investment should – in the absence of revenue measures - be complemented with measures to strengthen

7
public financial management and with a fiscal consolidation of the central government. FYR Macedonia
has published a Medium-term Fiscal Framework. Although specific measures are not outlined, if the
medium-term fiscal targets specified in the framework are met, central government debt would stabilize.
The increase in public debt would decelerate in coming years, and public debt would remain comfortably
below the 60-percent threshold over the medium term.
The public debt trajectory will depend on several key policy choices. Public debt is projected to
reach 53.3 percent of GDP by 2019 under the baseline scenario which assumes that the Government
implements the fiscal consolidation path outlined in its Medium-term Fiscal Framework 2014-2017 while
scaling up investments in the road sector. The baseline foresees a steady decline in fiscal deficits from 4.2
percent in 2014 to 2.9 percent by 2017, and restricts investments to only those projects currently included
in the pipeline. Failing to implement this fiscal consolidation path would push the public debt to GDP ratio
up by 5.5 percentage points by 2019. The trajectory of public debt is highly sensitive to the implementation
of investment initiatives proposed in the Government Program 2014-2018. In fact, if all investment projects
outlined in the program were to be implemented – which is an upper bound scenario - the ratio of public
debt to GDP would rise by 8.5 percentage points, pushing it over the 60 percent limit that the Government
has set for itself. Likewise, no policy change with respect to pensions would lead to an increase in public
debt of more than 10 percentage points by 2019.
The Government could take several measures to make expenditure composition more growth-
friendly and efficient. FYR Macedonia’s medium-term fiscal framework does not specify which policies
support the proposed fiscal consolidation path. It foresees, however, some increases in revenues due to
administrative measures. Savings could come from maintaining pension spending as a constant share of
GDP (generating annual savings of up to 1.5 percent of GDP on average) and reducing agricultural subsidies
(annual savings of around 0.2 percent of GDP), transfers to local government (annual savings of 0.2 percent
of GDP) and central government-executed capital spending (0.2 percent). The economic impact of the
reduction in central government capital spending could be mitigated by strengthening public investment
management and prioritizing projects with a high economic and social return. Steps to provide more
equitable access to Early Childhood Education, specifying the use of the supplemental education funds and
improving the quality of elementary and secondary education would improve the efficiency of local
government spending and foster long-term growth. Agricultural subsidies could be better targeted to
subsistence farmers and productivity-enhancing public goods, in particular in irrigation. In addition, the
Government may also wish to consider revenue measures and improved tax administration. A sustained
increase in revenues could help significantly improve the public debt trajectory.
FYR Macedonia is a rapidly ageing society and pension expenditures are likely to increase
significantly. The country has undergone several pension reforms during the last two decades. They were
well-designed and successfully implemented, but are not sufficient to prevent future increases in spending.
In 2014, FYR Macedonia’s pension expenditures were 9.6 percent of GDP, which is close to the spending
in other transition countries. However, pension expenditures are likely to increase significantly in the long
run. The Macedonian pension system has a high PAYG pension-system dependency ratio, high replacement
rates and a pension indexation that is more generous than that of most European countries. The economic
slowdown after the 2009 global financial crisis increased pressures for ad-hoc indexation of pension. In
parallel, the Government cut contribution rates. As a result, the pension deficit in terms of GDP increased
from 2.9 percent in 2007 to 4.5 percent in 2013. Going forward, the pension deficit is likely to increase -
despite recent efforts to increase pension revenues - as FYR Macedonia’s population is projected to age
rapidly. Without further pension reforms, expenditures in the Macedonian pension system could rise to 15
percent of GDP and the overall pension deficit could reach a stunning 10.5 percent of GDP by 2030,
assuming conservative growth. Even assuming sustained higher growth rates, the pension deficit is
projected to climb to 7 percent by 2030. The implicit pension debt is projected to remain above 400 percent
of GDP, which is high by international standards and will pose a burden for future generations. It seems

8
unlikely that the country can ensure fiscal sustainability without tackling further pension reform in line with
global standards and norms.
A careful evaluation of spending priorities and determined implementation of the proposed
fiscal rule would be important to preserve FYR Macedonia’s moderate debt level. In order to avoid
public debt increasing steeply, the Government would need to carefully assess the costs and economic and
social returns of the different policy proposals, appropriately prioritize and sequence the different policies
and support the fiscal path in the Medium-Term Fiscal Strategy through clear proposals. Given the projected
public debt trajectory, the Government’s proposed fiscal rule is well-advised. FYR Macedonia has already
started a procedure for constitutional amendments to establish a binding ceiling on public debt and the fiscal
deficit by 2017. Front-loading these targets to even earlier than 2017– combined with measures to
strengthen PFM – could slow down the increase in public debt while supporting long-term growth.

9
Policy Options
Area Short-term Measures Medium-term Measures
PFM Improve the annual budget presentation to include
information on deficit financing, financial assets, data on
the prior year’s outturn, estimates of the budgetary impact
of major revenue policy changes and/or some major
changes to expenditure programs are presented.
Review and revise the Organic Budget Law
Report accounts payable and expenditure arrears in the
monthly fiscal reports and disclose them in annual
financial statements
Describe any macro and fiscal policy changes, indicative
institutional budget ceilings and explanations for any
changes in macro and fiscal framework targets in the
MTFS.
Use e-Tendering for all procurement activities
Amend the Public Procurement Law
Publish and group the contract amendments with the
original contract awards
Accelerate implementation of the Law on Concessions and
PPPs
Link ESPP with the Treasury system
Strengthen capital investment management
Disaggregate SAO reports to differentiate between audits
of public entities and political parties
Develop strategy to link interfaces and
databases of different elements of the PFM
system and to upgrade the Treasury system
Increase competitive bidding in public
procurement contracts
Improve transparency and accountability in
procurement
Assess as part of the government fiscal risks
and debt sustainability analysis the spending
and borrowing operations of SOEs
Link public capital investment projects with
the MTFS and the annual budgets
documentation
Efficiency of public
spending Assess maintenance needs
Prioritize investment projects with high economic returns
Develop national mandatory rules , covering all elements
of the capital-investment cycle, including repairs,
maintenance and recurrent operational costs
Channel a higher share of agricultural subsidies to public
goods
Improve targeting of subsidies to subsistence farmers
Assess poverty focus of social programs
Provide appropriate level of maintenance
spending
Improve quality of primary and secondary
teachers
Increase hours of primary teachers
Introduce capitation financing for tertiary
education
Strengthen curriculum for tertiary education

10
Area Short-term Measures Medium-term Measures
Provide more equitable funding for Early Childhood
Education
Specify use of supplemental education fund
Develop a strategic framework for monitoring student
learning outcomes
Review coverage, targeting, eligibility, and registry
systems of different social assistance programs
Complete ex-post evaluations of core
government programs
Fiscal Sustainability Complete feasibility studies for all investment projects
Implement a fiscal rule
Clearly define policies in support of medium-term fiscal
targets
Provide clear costing of government initiatives in the
budget
Prioritize investment projects on the basis of
economic and social returns
Health
Develop a plan to reduce health sector arrears
Continue to seek savings in pharmaceuticals and medical
devices
Align benefit packages with available financing
Increase hospital autonomy and accountability, strengthen
training and recruitment for hospital managers
Enhance policy coordination between MOH and HIF
Prioritize primary care and ensure adequate
financing for preventive programs
Improve hospital financing
Improve hospital service provision
Right-sizing hospitals
Strengthen hospital autonomy and
accountability
Transport Complete the road network condition survey
Introduce road asset-management system
Improve traffic data collection
Update road investment program in view of road condition
results and application of road asset management system
Introduce objective and quantitative basis for
strategic road investment planning
Improve provisioning for maintenance
Privatize road maintenance

11
CHAPTER 1. COUNTRY CONTEXT
A. INTRODUCTION
1.1. FYR Macedonia is a small, open economy with solid economic growth. It reached independence
in 1991. Though it was the first among the six countries in South East Europe (SEE6) 7 to gain EU candidate
status in 2005, it has not been able to start negotiations for EU accession, partly because of its name dispute
with Greece. Yet, EU accession is the main anchor of its reform agenda and all major political parties and
over 80 percent of the people support EU membership. Landlocked, with a population of 2.1 million, the
country’s GDP per capita is USD 5371. FYR Macedonia has enjoyed macroeconomic and financial stability
during the last decade. Growth has been solid with an annual real GDP per capita growth in PPP terms of
3.7 percent between 2006 and 2014. This was the second highest growth rate among the countries of South
East Europe and far above the EU28 average of 1.4 percent during this period, enabling FYR Macedonia
to increase its per capita income relative to the EU28 from 30.7 percent in 2006 to 36.6 percent in 2014.
Contrary to other SEE6 countries, unemployment in FYR Macedonia has declined since the 2009, yet gains
in poverty reduction seem to have been moderate.
1.2. Faced with a double dip-recession the Government engaged in expansionary fiscal policy, which
helped accelerate growth but led to an increase in public debt to a moderate level. FYR Macedonia’s
public debt stood at 45.7 percent of GDP in 2002, as the country emerged from the conflict in 20018. An
acceleration of growth and a sound fiscal policy stance enabled the country to reduce its public debt to 33.2
percent of GDP in 2006. In 2007, the Government decided to pre-pay part of the outstanding debt to the
Paris club and London club, further reducing public debt to 23.0 percent of GDP by 2008 – the lowest level
during this decade. Faced with a double dip recession since 2009, the Government implemented a
countercyclical expansionary policy. While this policy has likely mitigated the social and economic impact
of the Eurozone crisis, it contributed to an increase in public debt to 40.5 percent of GDP in 2013. In 2014,
public debt reached 46 percent in gross terms and 40.8 percent in net terms as the Government issued a
EUR 500 million bond in 2014 at very favorable terms (3.975 percent, 7 years) in order to build up its cash
buffers and pre-finance the EUR150 million Eurobond and repayments to the IMF in 2015. Public debt –
even in gross terms - remains below the SEE6 average.
1.3. Fiscal stimulus was largely driven by revenue-reducing measures and public investment. Between 2006 and 2013, general government spending averaged about 34.5 percent of GDP, which is
significantly below the SEE6 and the Europe and Central Asia (ECA)9 average. At the same time, general
government revenues declined steeply from 33.8 percent of GDP in 2007 to 27.8 percent in 2014, one of
the lowest in the ECA region as the government reduced its rates on the corporate income tax and personal
income tax as well as social security contributions. Also, debt financed investments of SOEs increased. As
a consequence, public debt increased, undoing the gains of previous fiscal consolidation but enabling FYR
Macedonia to sustain growth in times of a difficult external environment.
7 South East Europe (SEE6) refers here to Albania, Bosnia & Herzegovina, Kosovo, FYR Macedonia, Montenegro
and Serbia. In an attempt to boost revenues, the Government has re-introduced corporate profit tax and measures to
broaden tax base of VAT and social contributions that are expected to increases revenues by X percent in 2015. 8 In 2001 the country experienced an inter-ethnic unrest that was resolved by the Ohrid agreement of 2001. 9 ECA region includes: Albania, Armenia, Azerbaijan Bosnia and Herzegovina, Bulgaria, Croatia, Czech Republic,
Estonia, Georgia, Hungary, Kazakhstan, Kosovo, Kyrgyz, Latvia, Lithuania, FYR Macedonia, Moldova,
Montenegro, Poland, Romania, Serbia, Slovak Republic, Slovenia, Tajikistan, Turkey, Turkmenistan, Ukraine and
Uzbekistan

12
1.4. The fiscal stimulus exposed several weaknesses in PFM and investment prioritization. The
Government incurred significant arrears on VAT refunds and goods and services in 2011 and 2012. Fiscal
deficits widened and the Government missed its fiscal targets in 2012-2014, largely due to underperforming
revenues. Capital spending was adjusted downward to reduce fiscal deficits. As a result, budget execution,
in particular of capital spending, remained weak. At the same, detailed investment data reveals that the
share of investment in administrative building increased at the expense of investment in infrastructure and
maintenance. In 2013, the Government moved a large part of transport spending off budget in order to
strengthen projected implementation of road projects. It also enabled the Government to better protect
capital spending against ad-hoc spending cuts.
1.5. The Government faces the challenge of sustaining FYR Macedonia’s growth while maintaining
debt at a prudent level. As a landlocked country, FYR Macedonia depends on surface transport. Improving
connectivity to regional markets and strengthening competitiveness is key for an economy that has to rely
on exports to sustain growth. With a population of only 2.1 million and a GDP of US$10.8 billion in 2013
(current US$), FYR Macedonia’s internal market is not large enough to sustain high growth rates over the
longer term and the country needs to rely on exports as a key driver of growth. Since independence, one of
FYR Macedonia’s key challenges has been to reduce distance to markets and to integrate in the EU transport
network. The Government also considers uninterrupted access to deep-sea ports a priority since the trade
embargos of the 1990s. Faced with these challenges, the Government published a program in 201410 which
foresees a significant increase in capital investment by 2018. This represents an important development
opportunity, both in terms of infrastructure and employment, if well planned, managed and executed. If the
Government were to proceed with full implementation of its Government Program, however, public debt
is bound to rise rapidly in the absence of other policy changes.
1.6. The objective of this Public Expenditure Review (PER) is threefold: First, to present an overview
of FYR Macedonia’s Public Financial Management (PFM); second, to assess fiscal policy trends and
efficiency of public spending; and third, to analyze FYR Macedonia’s fiscal space. The PER identifies
policy options in the areas of Public Finance Management, expenditure management, the health sector and
the transport sector. At the request of the Government, it does not explore reform options related to fiscal
revenues or pensions.
B. SOLID GROWTH WITH FEW GAINS IN SHARED PROSPERITY
1.7. FYR Macedonia has a strong track record of macro-economic stability. Landlocked, with a
population of 2.1 million, the country is an upper middle-income country with a GDP per capita is USD
5371 in 2014. Trade plays an important role. With an openness indicator11 of 105.7 percent in 2013, FYR
Macedonia is the most open among the countries of SEE6. It has been able to preserve macroeconomic
stability in the presence of adverse shocks. Its exchange rate peg to the Euro, introduced in 1995, has
successfully supported price stability, with inflation averaging 2.4 percent a year over the last 10 years.
Macroeconomic policies have been geared towards keeping the external balance manageable, and monetary
policy has responded quickly to any possible threats to the peg.
1.8. FYR Macedonia’s real per capita growth has been among the strongest in the region. Between
2006 and 2014, FYR Macedonia grew at 3.7 percent annually in real per capita PPP terms, a growth rate
surpassed only by Albania during this period. This enabled FYR Macedonia to increase its income relative
to the EU28 from 30.7 percent in 2006 to 36.6 percent in 2014. Since, 2009 annual per capita growth in
PPP terms has slowed down to an average of 3.3 percent per year, but has remained significantly above the
EU28 average of 2.4 percent as well as the SEE6 average of 2.3 percent (Figure 1.1). FYR Macedonia’s
10 http://vlada.mk/sites/default/files/GPRV2014-18_godina.pdf 11 The openness indicator is defined as the sum of imports and exports relative to GDP.

13
relatively strong growth performance is the result of FDI financed exports, an increase in public investment
and a pick-up in domestic demand, while avoiding the severe flooding of 2014 affecting neighboring
countries. Real GDP growth reached 3.5 percent in 2014 (Table 1.1), the highest among SEE6 countries.
According to WB economic forecasts, FYR Macedonia is projected to maintain the highest growth in 2015.
Overall, FYR Macedonia’s growth has also been less volatile than in other countries in the region (Figure
1.1b).
Figure 1.1:GDP growth in regional context
a) Real GDP per capita growth in PPP terms b) Volatility of real GDP growth 2009-2014
Source: WDI; World Bank staff calculations.
1.9. The Government’s program focuses on boosting growth by increasing competitiveness and
attracting foreign investment. With a population of only 2.1 million and a GDP of US$11.3 billion in
2014, FYR Macedonia’s internal market is not large enough to sustain high growth rates over the longer
term. The country would therefore need to rely on exports to drive growth. In recent years, the
Government has implemented key reforms to improve the business climate, improving registration and
permitting processes, property registration procedures, investor protections, and tax collection. In 2013,
FYR Macedonia was ranked as one of the top reformers world-wide, jumping from the 92nd position of
the World Bank’s Doing Business ranking in 2006 to 25th in 2013. Combined with tax exemptions, a
strong Directorate for Technological Industrial Zones (DTIZ) and well-targeted advertisements and
roadshows, the country managed to attract significant amounts of FDI. Inflows of FDI averaged 4.2
percent of GDP between 2006 and 2014, which was a significant increase from the past, yet below the
SEE6 average of 7.6 percent of GDP. FDI fell to an average of 2.8 percent of in FYR Macedonia and an
average 6.6 percent in South East Europe between 2009 and 2014. Unlike other SEE6 countries, a large
share of FYR Macedonia’s FDI consists of green-field investments in the tradable sector, enabling it to
boost exports and diversify its export structure. The share of exports attributable to foreign firms
increased from 7 percent in 2009 to 22 percent in 2014 or 17 percent of GDP. Still, backward linkages
between foreign firms and domestic firms are limited and FDI related net exports were only about 2
percent of GDP in 2014.
1.10. Economic growth has been solid, but would need to accelerate for FYR Macedonia to close its
income gap with the new EU member states within the next two decades. Between 2006 and 2014,
FYR Macedonia grew on average at 3.7 percent annually in real per capita PPP terms, enabling the
country to increase its income from 30.7 percent of the EU28’s GDP per capita in PPP terms to 36.6
percent. But between 2009 and 2014, convergence with the EU28 has – similar to other SEE6 countries
and EU member states in the region – slowed down significantly. In fact, between 2009 and 2014
-15
-10
-5
0
5
10
15
20
25
2006 2007 2008 2009 2010 2011 2012 2013 2014
Albania Bosnia and Herzegovina
FYR Macedonia Montenegro
Serbia EU-28
0
1
2
3
4
5
6
Source: Eurostat; World Bank staff calculations.

14
Table 1.1: FYR Macedonia – Key Economic Indicators
2006 2007 2008 2009 2010 2011 2012 2013 2014
est.
Real economy
Nominal GDP (MKD billion) 334.8 372.9 414.9 414.6 437.3 464.2 466.7 499.6 522.5
GDP Per Capita (US$) 3133 3892 4686 4434 4442 4941 4548 4838 4998
Real GDP 5.1 6.5 5.5 -0.4 3.4 2.3 -0.5 2.7 3.5
Contributions to growth (percentage points)
Final consumption 4.1 4.7 8.4 -1.7 1.2 0.4 0.1 -0.5 0.3
Gross capital formation 2.7 3.8 5.7 -2.3 -0.5 3.1 1.9 0.3 3.0
Net exports -1.6 -2.0 -8.6 3.6 2.6 -1.1 -2.4 2.9 0.2
Real imports 12.1 13.8 -4.7 -13.9 23.7 16.1 2.0 -2.7 17.0
Real exports 9.4 15.0 5.1 -12.3 10.4 8.0 8.2 -10.0 14.5
Unemployment rate (percent, end-of-period) 36.0 34.9 33.8 32.2 32.0 31.4 31.0 29.0 28.0
Prices
GDP deflator (2005) 3.3 4.6 5.5 0.3 2.0 3.7 1.0 4.3 1.4
CPI (end-of-period) 2.9 6.1 4.1 -1.6 3 2.8 4.7 1.4 -0.5
CPI (average) 3.2 2.3 8.3 -0.8 1.6 3.9 3.3 2.8 -0.3
Central Government Fiscal accounts
Revenues 31.1 32.1 32.9 31.0 30.2 29.6 29.6 28.1 27.8
Expenditures 31.6 31.5 33.8 33.6 32.6 32.0 33.4 31.9 32.0
Central government balance -0.5 0.6 -0.9 -2.6 -2.4 -2.5 -3.8 -3.9 -4.2
Gross central government debt 30.6 23.5 20.5 23.6 24.1 27.6 33.6 34.1 38.1
Gross public sector debt 1/ 33.2 25.8 23.0 26.2 27.2 32.0 38.3 40.5 48.5
Selected Monetary Accounts
Base Money 25.0 29.3 11.2 6.0 12.2 9.7 4.4 5.3 10.5
Credit to private sector 30.3 39.0 34.1 3.1 7.3 7.7 5.2 6.3 9.8
Balance of Payments
Current account balance -0.4 -6.9 -12.7 -6.8 -2.0 -2.5 -2.9 -1.8 -1.4
Trade balance -18.0 -19.2 -26.2 -23.0 -20.0 -20.6 -22.6 -18.6 -17.6
Exports (BOP basis) 37.8 44.1 43.2 32.8 39.8 47.1 45.4 43.8 47.9
Imports (BOP basis) 57.3 65.8 70.3 56.7 61.9 71.8 72.2 69.1 75.1
Foreign direct investment (FDI) 6.2 8.4 6.1 2 2.2 4.5 1.5 3.3 3.3
Gross international reserves (US$ mn, eop) 1866 2240 2108 2289 2274 2374 2589 2445 2784
in months of imports 6.0 5.1 3.7 5.4 5.0 4.1 4.8 4.4 4.6
External debt 2/ 45.7 46.6 48.8 55.9 57.8 61.2 66.1 64.0 69.8
Exchange rate (MKD/USD, average) 48.8 44.7 41.9 44.1 46.5 44.2 47.9 46.4 46.4
Population and Poverty
Population, Total (millions) 2.09 2.10 2.10 2.10 2.10 2.10 2.11 2.11 2.12
Population Growth (% change, y-o-y) 0.18 0.13 0.10 0.09 0.08 0.08 0.08 0.08 0.08
Poverty ratio (% of population) 27.0 26.8 26.2 24.2
Inequality - Income Gini 42.8 44.2 40.9 38.5 38.8
Life Expectancy 74.2 74.3 74.4 74.6 74.7 74.9 75.0
HDI (Human Development Index) Scores 0.699 0.724 0.728 0.730 0.730 0.732
Memo items:
Nominal GDP (US$ million) 6861 8336 9834 9314 9345 10439 9745 10768 11261
1/ Incudes the debt of municipalities and publick enterprices, but not the debt of the central bank (NBRM)
2/ Excludes central bank repo arrangements
Source: Macedonia State Statistical Office, Ministry of Finance, National Bank of Macedonia, World Bank staff estimates.
Annual percentage change, unless otherwise indicated
Percent of GDP, unless otherwise indicated
Annual percentage change, unless otherwise indicated
Note: GDP number for 2014 is based on World Bank estimates made in December 2014. The State Statistics Office has released preliminary GDP growth for 2014
estimated at 3.8 percent.

15
FYR Macedonia GDP per capita in PPP terms increased only from 35 percent to 36.6 percent. Real GDP
per capita growth would need to accelerate to around 4.5 percent – significantly above the ten-year
average of 3.7 percent – for FYR Macedonia to converge to the living standards of the new EU member
states within the next 20 years.
1.11. FYR Macedonia’s sectorial drivers of growth have changed noticeably over the past 15
years, with trade and commerce declinining and construction taking over as the key driver of
growth. Prior to 2002, more than 80 percent of growth was driven by trade and commerce, industry and
wholesale and retail. Also, public administration contributed significantly to growth. Since 2002, the
annual contribution of trade and commerce plummeted from 40 percent to around 12 percent. Meanwhile,
the contribution of industry has remained fairly constant, averaging around 20 percent since 1997. Since
2009, the construction sector has become the predominant driver of growth, while the contribution of
agriculture has dissipated
1.12. On the supply side, physical capital has contributed relatively little to growth prior to 2008,
but it has gained strength in recent years due to a government-led investment push. Despite a
relatively large and rising capital share of income from 2001-2008 (between 40 and 50 percent), the
contribution of physical capital to growth was quite weak during this period, and GDP growth dynamics
were shaped predominantly by total factor productivity (TFP) and employment growth. Since 2009, the
growth contribution of physical capital has increased as the government started to pursue a more active
and countercyclical investment program, which was concentrated in the energy sector, construction and
administration and defense. At the same time, however, the quality of this public investment seems to
have diminished: the share of investment in adminstrative buildings increased at the expense of
investment in infrastructure and maintenance,12 and investment into sectors with long-term growth
potential such as machinery, agriculture and transport equipment also declined. The contribution of
employment to GDP growth has declined somewhat in the years after the crisis, but contrary to other
SEE6 countries, it has remained positive and significant, supported by FDI.
1.13. Contrary to other SEE6 countries, unemployment in FYR Macedonia has declined since
2009. A significant part of the job creation seems to have occurred in low-productivity sectors and
in the public sector. The country made impressive gains in reducing the unemployment rate from 37
percent in 2004 to 32 percent in 2009 and further to 28 percent in 2014. In fact, FYR Macedonia is the
only SEE6 country where unemployment actually declined in the post-crisis period. Still, at 28 percent
in 2014, its unemployment rate is the second highest among SEE6 countries. It remains significantly
above the rate of some New EU Member states in 2014 such as Croatia (17.2 percent), Bulgaria (11.4
percent) and Romania (6.8 percent). Foreign firms contributed significantly to the increase in
employment. If fact, around 16 percent of new jobs have been created by foreign firms since 2006. Other
sectors with significant contributions to employment growth included agriculture, construction, the
transport sector and the public administration..13 Data provided by the Ombudsman shows that the
number of employees in the public sector14 has increased by around 20000 between 2010 and 2014 when
12 In 2008, 85 percent of all public investment was destined to infrastructure while only 15 percent went to non-
residential and residetial buildings. By 2012, investments in non-residential and residential buildings doubled as a
share of total public investment, reaching 33 percent. 13Since there is no data on the number of public employees provided by the Government, this analysis relies on data
provided by the State Statistics Office on employment in public administration and defense, education as well as
health and social works as a proxy for the number of employees. 14 The public sector in this dataset covers the central government, government agencies, municipalities, SOEs
(established by the government and municipalities), social centers, courts and public prosecutors, penitentiary
facilities, public health providers, publicly owned cultural facilities (like libraries, museums, theaters etc.) , public
kindergartens, primary, secondary and tertiary education facilities. However, it does not include institutions or

16
it stood at 108848 employees. Youth unemployment remains at 53.1 percent in 2014, the second highest
in the SEE6 region (after Kosovo) and significantly above the EU average of 23.6 percent.
Economic growth seems not to have translated into significant poverty reduction in FYR
Macedonia before 2008, but poverty appears to have declined somewhat in recent years. Between
2003 and 2008, consumption-based absolute poverty, based on data from the Household Budget Survey,15
increased from 8 to 9 percent, using a regional poverty line of US$2.5 a day, and from 33 percent to 37
percent, using a regional poverty line of US$5 a day. During the same period, official relative poverty
statistics16 remained largely unchanged at around 30 percent. Inequality, as measured by the Gini
coefficient, increased between 2003 and 2008 in FYR Macedonia from 37 to 40 using consumption
data17. Some evidence exists that poverty declined slightly after 2010. Although internationally
comparable estimates of poverty are not available for FYR of Macedonia, national estimates register a
decrease in poverty rates, from 27.0 percent in 2010 to 24.2 in 2013, despite a 6 percent increase in the
poverty line, suggesting an improvement in living conditions at the bottom of the distribution.
1.14. The welfare of the poorest 40 percent of the population seems not to have improved relative
to the rest of the population if consumption data are used instead. Consumption growth of the bottom
40 percent – the World Bank indicator for the new institutional goal of promoting shared prosperity –
decreased by 1.5 percent annually between 2003 and 2008, as average consumption grew by 1.1 percent
(Figure 1.2a). Growth incidence curves show that those at the top of the income distribution had
significantly higher welfare gains (Figure 1.2b). Although not directly comparable, recent income-based
data for 2010 and 2011 show a slight decline in overall income across population groups that is more
pronounced for the bottom 40 percent.
Figure 1.2: Growth Incidence Curves in FYR Macedonia, 2003-2008* a) Evolution of shared prosperity b) Growth incidence cure
Source: World Bank Staff estimates based on the harmonized ECAPOV dataset. *Latest available data.
companies (a number of large SOEs that are government owned like ELEM, MEPSO, PESR etc.) that are of mixed
ownership and institutions that did not provide data, thus presenting a downward bias to the overall public employees.
Monitoring the evolution of poverty in FYR Macedonia has become challenging in recent years due to concerns over
data quality of the Household Budget Survey, particularly from 2009 onwards. Therefore, the HBS series is used until
2008 until further diagnostics are carried out. 14 Measured at 70 percent of median consumption. 14 Other measures of inequality follow a similar trend. For instance, between 2003 and 2008 the ratio of the 90 th/10th
percentiles increased from 5.7 to 6.4, and the ratio of the 75th/25th increased from 2.4 to 2.7. 15 Monitoring the evolution of poverty in FYR Macedonia has become challenging in recent years due to concerns
over data quality of the Household Budget Survey, particularly from 2009 onwards. Therefore, the HBS series is used
until 2008 until further diagnostics are carried out. 16 Measured at 70 percent of median consumption. 17 Other measures of inequality follow a similar trend. For instance, between 2003 and 2008 the ratio of the 90 th/10th
percentiles increased from 5.7 to 6.4, and the ratio of the 75th/25th increased from 2.4 to 2.7.

17
C. FISCAL STIMULUS AND PUBLIC DEBT
1.15. Fiscal policy over the 2001-2014 period has evolved in three distinct phases. The first one was
characterized by the government’s struggle to find a balance between maintaining fiscal prudence and
addressing economic shocks. During the second phase, the Government provided a fiscal impulse to growth
as the external environment was weak. Infrastructure investments played a central role during the third
phase.
1.16. Between 2001 and 2007, efforts focused on reining in the large fiscal deficit to preserve
medium-term debt sustainability. The demobilization of army and police reservists and unwinding of
conflict-related security expenditures (some 5 percent of GDP) after the end of the 2001 internal conflict,
accomplished some of the necessary fiscal consolidation. Since the temporary revenue measures enacted to
finance this security spending were also abolished (namely the tax on financial transactions), additional
savings in other parts of the budget were also needed. These were achieved primarily through wage and
hiring restraints and an increase in VAT rates. Capital spending was also slashed by around 1 percent of
GDP. As a result, the fiscal balance moved to small surpluses in 2004 and 2005, and the tighter fiscal stance
was maintained into 2006 and 2007, even though the budget fell back into to a small deficit in 2006, largely
due to the partial shift of pension contributions to new private pension funds (as part of the launch of the
funded pillar of the pension system) and emergency fiscal transfers to cover losses in the energy sector.
The size of government was also scaled back closer to pre-2001 levels in the process, with revenues as a
share of GDP declining from 35 percent in 2002 to 32.1 percent in 2007, and expenditures from 40.5 to
31.5 percent (Figure 1.3a).
Figure 1.3: Fiscal Policy Trends of the Central Government a) Fiscal Developments 1997-2014
(in percent GDP)
b) Components of Fiscal Balance
(in percent GDP)
Source: MoF; World Bank staff calcuations Source: MoF; World Bank staff calculations
1.17. As growth strengthened and investment needs remained high, the fiscal policy stance was
eased in 2008. The government increased wages, pensions, and capital spending, and eased corporate and
personal tax burdens. Together, these measures amounted to a structural fiscal easing of around 2.5 percent
of GDP in 2008 (Figure 1.3b), pushing the fiscal balance back into a deficit of 0.9 percent of GDP by year-
end. When the economic recession hit in 2009, the central government curtailed its spending momentum
and resisted providing additional fiscal stimulus. While revenues declined as a result of a decline in
economic activity, expenditures were held broadly constant in terms of GDP, supporting demand. While
this helped contain the economic downturn to only 0.4 percent in 2009, it did have fiscal implications as
-7
-6
-5
-4
-3
-2
-1
0
1
2
3
24
26
28
30
32
34
36
38
40
42
19
97
19
98
19
99
20
00
20
01
20
02
20
03
20
04
20
05
20
06
20
07
20
08
20
09
20
10
20
11
20
12
20
13
20
14
Balance (right axis)
Revenues (left axis)
Expenditures (left axis)
percent of GDP percent of GDP

18
the deficit level widened to 2.7 percent of GDP. To avoid further deterioration in the deficit, the fiscal
stance then turned slightly contractionary in 2010 as expenditures were cut by 1 percent of GDP.
1.18. The recovery from the crisis proved fragile, however, and as growth turned south again in
mid-2011, the government renewed its stimulus efforts. Central government spending expanded by close
to 2 percent of GDP and the fiscal deficit increased to 3.9 percent of GDP in 2012. During this year, the
government also announced that it had accumulated arrears on VAT refunds and payments of goods and
services. It started to clear these arrears in September 2012, and announced at the end of February 2013,
that it had settled all outstanding payment obligations. The government has since taken steps to strengthen
commitment controls.18 Arrears in the health sector, including of the Ministry of Health, however, persist
and have increased to 0.6 percent of GDP as of end December 2014.
1.19. The Government has not met its fiscal targets during the last three years. The Government
maintained a balanced budget and met its fiscal targets between 2009 and 2011. However, budget overruns
in 2012 and 2013 – deficit outturns that were 1.3 and 0.4 percentage points higher than originally budgeted,
respectively – were the largest over the past decade (Figure 1.4). These overruns in 2012 and 2013 were to
some extent due to the fact that the Government cleared arrears on VAT refunds and to suppliers. The 2014
fiscal deficit was 4.2 percent of GDP as revenues underperformed and expenditure increased. The latter
was to some extent due to high spending on social transfers and subsidies in the run-up to the parliamentary
and presidential elections of April 2014. The original fiscal deficit target for 2014 was 3.5 percent of GDP.
Figure 1.4: Fiscal performance and deficit level
Source: National Authorities and World Bank Staff calculations
1.20. Part of the Government’s post-2009 fiscal stimulus was implemented through SOEs, which
borrowed with Government guarantees. As a result, public SOE debt as a share of GDP increased from
2.6 percent in 2009 to 7.7 percent in 2014. In January 2014, the government moved a large part of road
infrastructure projects off-budget by transforming the former Road Fund into the Public Enterprise for State
Roads (PESR), a non-profit entity which can borrow on its own behalf but is backed by sovereign
guarantees. The aim of the government was to improve project implementation in the area of
infrastructure.19. At inception, the PESR carried EUR 82 million in debt (1.1 percent of GDP), but this is
18 According to EC (20140, outstanding arrears from the delayed payment of VAT refunds and obligations for
public contracts still exist. 19The PESR is currently managing an expansion of the high-way network in the length of 132 km, which when
completed will actually expand the highway network by 50 percent.
-5
-4
-3
-2
-1
0
1
24
26
28
30
32
34
36
2006 2007 2008 2009 2010 2011 2012 2013 2014
Budget balance (right axes) Upward budget balance revisions
Revenues (left axes) Expenditures (left axes)
% of GDP % of GDP

19
set to rise rapidly in the near term as the PESR – similar to other SOEs - executes what is a central
government investment agenda. Going forward, it is important that the PESR’s spending and borrowing
operations and that of other SOEs are assessed as part of the government’s fiscal risks and debt
sustainability.
1.21. Driven by sustained primary deficits and SOE-executed public investment, FYR Macedonia’s
public debt has increased but still remains below the SEE6 average. As shown in Chapter 4, public debt
has increased since 2008 largely due to the central government primary deficit and borrowing SOEs. In
fact, public debt as a share of GDP increased from 23 percent in 2008 to 46.0 percent in 2014. By
comparison, public debt in the SEE6 region increased from an average 34.9 percent in 2008 to an estimated
52.6 percent in 2014. As SOEs took over an increase share of public investment, debt of SOEs increased
from 2.5 in 2008 to 7.7 percent in 2014. As of end 2014, the debt of all SOE has been guaranteed by the
central government, with the exception of a loan to MEPSO and the Civil Aviation Agency of 0.2 percent
of GDP.20
D. THE GOVERNMENT’S REFORM AGENDA
1.22. The Government of FYR Macedonia, which has been in power since 2006, outlines a strong
vision of development in its Government Program for 2014-2018. The program seeks to improve the
welfare of all citizens in FYR Macedonia by strengthening economic growth and competitiveness,
supported by improvements in the business climate, infrastructure and human capital. The key pillars of the
National Reform Program are summarized in Table 1.2
Table 1.2: Pillars of the National Reform Program, 2014-2018
Pillar 1. Improving the living standards of the citizens through: new private sector jobs through further
improvement of doing-business conditions for domestic and foreign investors; opening new markets and
increasing trade; supporting SMEs through further reduction of administrative procedures and facilitating
access to credits; supporting tourism development; active labor market policies with special emphasis on
youth; improving the road and utility infrastructure; better health and education services; supporting
companies’ capacity to invest in new technologies, innovation and research; environmental protection.
Pillar 2. Infrastructure development through: construction of new national, regional and local roads
and their rehabilitation; construction and modernization of railway corridors and strengthening transport
capacity; construction of energy capacity, including renewable energy; construction of water supply and
wastewater systems; investment in ICT to increase the quality of public services, thereby improving
digital literacy, access and inclusiveness.
Pillar 3. Protection of the most vulnerable through: employment promotion programs and stimulations
for private sector; better social assistance; better access to health and education services; protection from
energy poverty.
Pillar 4. Development of agricultural production and improving farmers’ quality of life through:
subsidies in agriculture; policies on efficient allocation of agricultural land and privatization of state
agricultural land; better access to financing for primary production and processing of agricultural
products; assistance in promotion of agricultural products; new investments in agro-processing; rural
development.
20 As public debt increased, public debt management strengthened and risks embedded in the debt portfolio declined.
For a discussion of FYR Macedonia debt management, see Chapter 2 and 4.

20
Pillar 5. Improving education through: investment in education infrastructure; investment in science
and connecting universities with private business for developing and commercializing innovation;
improving the quality of educational programs and their relevance for private sector needs; teacher
training.
Pillar 6. Improving the quality of health services: construction of new hospitals and investment in
equipment and training for its use; continued education of health workers; improving service quality.
Pillar 7. Reform in public administration: transparent and efficient work of the Government and public
administration, strengthening the capacities and promotion of human resources management system.
Pillar 8. EU and NATO integration: continuing judiciary and public administration reforms; fulfilling
the European Union political criteria; further economic reforms according to the EU standards on
functioning market economy; further reforms on competitiveness; maintaining full compliance with
Stabilization and Association Agreement.
Source: World Bank (2014). Country Partnership Strategy for the Former Yugoslav Republic of Macedonia for
the Period FY2015-FY2018.
1.23. EU accession is the key anchor of the Government’s reform agenda. FYR Macedonia became
an EU Candidate country in 2005 and since 2009, the European Commission (EC) has been recommending
opening accession negotiations with FYR Macedonia, but the decision continues to be postponed in part
due to the name dispute with Greece. All major political parties and over 80 percent of the people support
the EU membership. The Government of FYR Macedonia is committed to the accession agenda, and the
country has recently confirmed its participation in the South East Europe 2020 Strategy, which sets out
specific goals for achieving integrated, smart, sustainable, inclusive growth. The EC has an active program
of assistance to FYR Macedonia, which includes financing through the Instrument for Pre-Accession
Assistance (IPA2), the largest source of concessional funds in the country.
1.24. Infrastructure development is one of the top priorities of the Government. Better road
infrastructure is vital for overcoming the disadvantages of a small landlocked economy and strengthening
competitiveness. The quality of FYR Macedonia’s roads has been deteriorating relative to its neighbors:
once a regional leader in road quality, it now has the second-lowest road quality rating among the SEE6
countries. The Government has an ambitious program of investments in the sector that includes construction
of both highways and railways. Currently there are three highways under construction, two of which had
been started in 2014 and are expected to be finalized by 2018. The total length of the highways is 132 km
and the value of these projects is around EUR 800 million, financed from multilateral institutions (like EIB
and EBRD) and the Chinese EXIM Bank (EUR 575 million)21. The Government is also involved in projects
for rehabilitation and construction of regional roads, a program with an estimated annual cost of around
EUR 110 million between 2015 and 2017. The railway infrastructure program of the Government is
somewhat less ambitious, but still significant. The Government plans to construct a railway connection to
Bulgaria in three phases. The cost of the first two phases is estimated at around EUR 190 million.22
1.25. Energy investments are also considered important for the Government. The country ranks
among the most energy-intensive economies among the SEE6 countries due to a combination of energy-
intensive local industries (iron and steel, ore extraction and cement), poorly insulated buildings, inefficient
electrical appliances in households and significant distribution losses. Furthermore, the entire supply of oil,
petroleum products and natural gas is imported. Between 2010 and 2014, around 18 percent of imports
21 These loans have predominantly fixed interest rates and maturities ranging from 15 to 20 years with grace periods
from 3 to 5 years.
22 The third phase is still under preparation and is not expected to start before 2019.

21
were on average related to energy. The government’s energy sector strategy is to rehabilitate the current
coal-based production of electricity, but to also increase investment and utilization of hydro-electric power.
Investment in the coal-based electricity production are estimated at around EUR 270 million over the period
2014-2020, while investments in the hydro power production are estimated at around EUR 50 million over
the same period. There are also significant investments in the energy transmission lines that are estimated
at around EUR 110 million over the period 2014-2020. Finally, the Government is committed to increasing
access to gas in the country as part of a broader agenda to improve competitiveness. Initial investments for
construction of the main gas pipeline is around EUR 142 million. The program does not specify how these
investments will be financed. An energy infrastructure review from the World Bank (2013a) concluded that
the most efficient way of closing the energy gap would be to improve energy efficiency. Closing the gap
would require investments of up to EUR 240 million per year over the period 2014-2030 under the least
cost scenarion.
1.26. The Government Program envisions increased spending on social transfers, agriculture
subsidies and education.23 It foresees an increase in social transfers of 5 percent per year during the period
2014-2018. The estimated cost of this measure would be around EUR 13 million of additional expenditure
per year. In an effort to improve the living standards in the rural areas, the Government is also planning to
increase agricultural subsidies. The program proposes agricultural subsidies of EUR 600 million per year,
or around 1.7 percent of GDP per year for the period 2014-2018. It also proposes to rehabilitate schools,
build school gyms, purchase tablet computers for primary school students etc. in support of the education
sector.
Figure 1.5: Government Program Expenditure Items (in millions of Euros)
Source: Government Program April 2014 and World Bank staff calculations.
1.27. The Government has started swiftly to implement key components of its program since the
elections in 2014. In total, the Government program outlines investments of around EUR 4.5 billion or
about 8 percent of GDP each year over the period 2014-2019. The main recipient of the investment program
is transport infrastructure, which accounts for about half of all investments. Energy is the second-largest
investment component, largely consisting of investments in current and new coal mines, rehabilitation of
power plants, construction of new and rehabilitation of current transition lines and gasification of the
country. Agriculture is the third-largest item, with agricultural subsidies being the biggest spending item
(around EUR 150 million per year), followed by investments in irrigation infrastructure. In addition, the
government’s program also envisions increases in public wages, pensions and social benefits for the period
2014-2018, some of which have been already implemented in 2014 and budgeted for 2015. The Program
23 The Government Program is the most up-to-date government document that provides an overview of the
Government’s medium-term policies. The program covers the period 2014 – 2018 but includes investments up to
2020. It is available at http://vlada.mk/sites/default/files/GPRV2014-18_godina.pdf.
0 500 1000 1500 2000 2500
Education
Environmental projects
Social protection
Culture
Decentr. and rural development
Health
Agriculture
Energy
Transport infrastructure

22
states that further increases in public wages, pensions and social benefits will depend on macro-economic
conditions.
E. OBJECTIVE AND STRUCTURE OF THIS REPORT
1.28. The objective of this PER is three-fold: First, to present an overview of FYR Macedonia’s Public
Financial Management (PFM); second, to assess fiscal policy trends and efficiency of public spending; and
third, to analyze FYR Macedonia’s fiscal space. The PER identifies policy options in the areas of Public
Finance Management, expenditure management, the health sector and the transport sector. At the request
of the Government, it does not explore reform options related to fiscal revenues or pensions.
1.29. This PER aims at answering the following questions:
How can the Government improve public financial management?
What are FYR Macedonia’s spending pressures over the medium term and what can be done
to improve the efficiency of spending public spending?
How can FYR Macedonia meet its investment needs without jeopardizing fiscal sustainability?
The PER complements the assessments of PFM, efficiency of spending and fiscal sustainability with an in-
depth discussion of the transport, health and pension sectors. These three sectors pose important challenges
for PFM, efficiency public spending or fiscal sustainability.
1.30. The rest of this report is organized as follows:
Chapter 2 presents a review of FYR Macedonia’s public financial management;
Chapter 3 examines the composition and efficiency of public spending;
Chapter 4 presents a fiscal sustainability analysis which explores FYR Macedonia’s public debt
trajectory under a range of policy scenarios;
Chapter 5 analyzes public spending in the transport sector;
Chapter 6 discusses the financing and organization of health care in FYR Macedonia;
Chapter 7 reviews the sustainability of the pension system.

23
CHAPTER 2. PUBLIC FINANCIAL MANAGEMENT
A. INTRODUCTION
2.1. Improvements in PFM would enhance efficiency, transparency and accountability of public
spending. The 2014 EC Progress Report for FYR Macedonia recognizes that a basic PFM structure and
processes are in place, but emphasizes the importance of strengthening fiscal transparency and the
implementation of PFM systems. In particular, it highlights the importance of better annual budget
planning and execution, in order to avoid cuts in growth-enhancing investment spending, under-
execution of capital expenditure and an accumulation of arrears. It also emphasizes that the procedure
for awarding contracts should become more transparent. Linkages between strategic priorities, the
medium-term budget framework and the annual budget process remain weak. There has been a PEFA
assessment to date, but the Government has started the process for a PEFA in 2015 which is likely to be
completed in the course of this year. SIGMA is also assessing key aspects of FYR Macedonia’s public
financial management. This brief review is selective in nature and is not based on an internationally
recognized methodology, like the PEFA.
2.2. While FYR Macedonia has taken several steps to improve public financial management in
recent years, challenges remain. FYR Macedonia has strengthened commitment control, invested
resources in the development of stronger PFM systems for public debt and procurement and enhanced fiscal
transparency. Still, a number of simple further improvements could be made to the publication of fiscal data
which could improve fiscal transparency as per international norms. As a small land-locked country,
Macedonia struggles to encourage sufficiently competitive bidding in public procurement contracts. Yet,
the Government has made important progress in the development of e-procurement systems. The present
Treasury system – though working smoothly - is nearing the end of its useful life. Due to technical and
technologic trends as well as the need to expand the functions of the systems over team, a need arises for
establishing a new modern integrated information system as part of the strategic goals of the Treasury
Department. In fact, the development and upgrading of all information systems with a view to enhance the
efficiency of operational processes is a strategic goal of the Ministry of Finance (MoF), including by
establishing a new Integrated Taxonomic Information System (ITIS). A part of this renewal process, the
Government should carefully review available options to integrate the rather fragmented present IT
systems. As the Government plans to scale up public investment, strengthening Public Investment
Management should be given particular importance. More in-depth diagnostics, in particular, on cash
management, Public Investment Management and IT systems could be helpful inputs for any PFM reform
program.
2.3. This chapter is structured as follows. The next sections summarize FYR Macedonia’s budget
structure and credibility and provide an overview of budget comprehensiveness and fiscal transparency.
This is followed by discussion of the medium-term fiscal framework, capital investment management,
treasury and cash management, public debt, public procurement, internal financial controls, accounting and
external auditing. The final section concludes.
B. BUDGET STRUCTURE AND CREDIBILITY
2.4. The definition and coverage of the public sector in Macedonia is, in general, in line with the
public sector framework defined by the IMF’s Government Finance Statistics (GFS) Manual 2001. 24
24 The IMF GFS Manual 2001 could be reached at https://www.imf.org/external/pubs/ft/gfs/manual/pdf/all.pdf. The
GFS Manual 2014 pre-publication version is also available on the IMF’s web site.

24
The Law on Budgets – the framework legislation that defines public financial management system in
Macedonia– is the main legislation that defines the scope the central and general government in the country. 25 It regulates the procedures for preparation, adoption, execution and reporting of the Central Government
Budget or Budget of Republic of Macedonia, as well as the budgets of the local government units and the
City of Skopje (Figure 2.1). The Annual Central Government Budget Law that is approved by the
Parliament is the key fiscal document, providing both institutional and consolidated fiscal information.
While the focus of the annual budget is the current budget year, it also provides information on project
commitments that go beyond the current year. A list of projects/programs that generate medium-terms
expenditure commitments (current budget year +2) are reported at the institutional level. While this is part
of the budget, it does not provide automatic budget allocation for the upcoming years.
Figure 2.1: FYR Macedonia’s Budget Structure
Source: World Bank staff.
2.5. Even though the annual central government budget law does not directly cover the
municipalities and state-owned enterprises, those receive transfers from the budget. In the 2014
budget law, the list of earmarked and block grants from the central government budget to municipalities
can be found in an appendix of the budget. This list provides details of the individual municipalities’
earmarked and block grants that constitute around 90 percent of the transfers to municipalities. Primary and
secondary education, social protection (childcare and elderly), culture, and firefighters are the areas for
which municipalities are funded through earmarked and block grants. It should be noted that Public
Enterprise for State Road (PESR) is part of the SOE sector in FYR Macedonia. The PESR implements a
25 Official Gazette of the Republic of Macedonia no. 64/05, 04/08, 103/08, 156/09, 95/10, 180/11 and 171/12.
Public Sector
General Government
Central Government Budget
(Republic of Macedonia Budget)
Core Budget Institutions
(Total of 82 institutions) Funds Budget
Pension and Disablity Insurance Fund
Employment Agency
Health Insurance Fund
Public Hospitals
Municipalities
(total number of 81 including Skopje)
State Owned Enterprises
Budget Law
Medium Term
Fiscal Strategy

25
central government function and receives revenues from the central government budget. Yet it is not
counted as part of the central government agenda. Similarly, toll fees collected by the PESR (making up
roughly 0.5 percent of GDP) are no longer counted towards central government non-tax revenues.
Ambitious borrowing plans of the PESR and an increased share of financing from central government tax
revenues require careful monitoring.
2.6. The Ministry of Finance provides very detailed information on the annual budget and its final
accounts for the central government, but the presentation and format of the data is not easy to follow. It is therefore difficult to understand the fiscal situation in the country without going into details of the data.
Understanding transition from budget appropriations data to central government and general government
consolidation requires additional information and methodology. Table 2.1 presents a simplified
methodology for transitioning from institutional budget appropriations to consolidated central government
figures for the 2013 Budget as an example. The netting out of items that eliminated double counting during
the consolidation is neither available in the budget document nor in the final accounts. Understanding the
summary fiscal stance and the link between the appropriation and consolidated central government data is
thus not straightforward.
Table 2.1: Transition from the Institutional Appropriations to Consolidated Central
Government (in MDR million)
2011 2012 2013
I - Core Budget Institutions 120,222 125961 136,887
II - Health Insurance Fund (HIF) 21,745 22625 22,365
III - Employment Fund (EF) 3,067 3037 3,078
IV - Pension Fund (PF) 44,309 46072 49,742
V - Agency for State Roads 5,729 6,495 -
VI - Total Appropriations (I+II+III+IV+V) 195,072 204,190 212,072
VII- Principal Payments 7,991 5321 15,770
VIII - Total appropriations excluding Principal Payments (VI-VII) 187,081 198,869 196,302
Adjustment Items for Consolidation
IX - Transfers to Funds from the Core Budget 19,870 22,199 25,183
X - Health Insurance contributions for pensioners by PF 4,627 4,855 5,176
XI - Health Insurance contributions for unemployed by EF 192 195 201
XII -Transfers Agency for State Roads 2,135 2,190 -
XIII -- Other netting out 165 131 91
Consolidated Central Government Expenditures (VIII- IX-X-
XI-XII-XIII) 160,092 169,299 165,651
(% of GDP) 34.8 36.9 32.5
Source: Annual Budget Documents and WB staff calculations.
2.7. Actual central budget revenue has underperformed compared to the originally approved
budget in all three years (2011-2013). Revenue underperformance was highest in 2012 when the
difference between the actual and the originally budgeted revenues reached 11 percent (Table 2.2) FYR
Macedonia suffered a mild recession during this year, which contributed to the weak revenue performance.
As discussed in chapter 2, indirect taxes constitute around 50 percent of total central government revenues.

26
Table 2.2: Planned versus actual central government revenues
Year Planned Actual Actual/Planned
in % 2011 144,625 136,093 5.9
2012 152,646 135,025 11.5
2013 144,423 136,797 5.3
Source: MOF/World Bank based on PEFA PMF PI-3 Aggregate revenue out-
turn compared to original approved budget.
2.8. Expenditure under-performance was the highest in 2012, although in none of the three years
did the difference between actual primary expenditure and the originally budgeted primary
expenditure exceed 10 percent. Yet, changes in the overall level of expenditure resulted in significant
reductions in all categories of expenditure, with particularly large reductions in the capital expenditure
outturn in 2011 (24 percent) and 2012 (30 percent). Similarly, subsidies and transfers were cut by around
15 percent during the 2011-2013 period. As it is the case in many countries, the government uses capital
expenditure as a residual means to meet its fiscal target. While it may not be fully consistent with
international best practices, eliminating the fiscal pressures on capital spending on state roads is one of the
motivations behind creating the PESR and taking the road capital expenditures off budget. This is also
likely to explain why the deviation declined significantly in 2013.
2.9. This budget cut altered
the composition based on
functional classifications. The
calculated compositional variance,
based on the PEFA methodology,
reflects relatively higher deviations
both for 2011 and 2012. The amount
of expenditure charged to the
contingency fund is less than 0.1
percent of the original budget
between 2011 and 2013. The
extremely low level of the
contingency fund does not provide
any flexibility to the Government to
respond to any external shocks or
policy changes that may occur year.
C. BUDGET COMPREHENSIVENESS AND TRANSPARENCY
2.10. FYR Macedonia’s performance with respect to fiscal transparency is mixed according to
international rankings. While the scores of the World Economic Forum’s index26 on transparency of
government policy-making have improved since 2011, Macedonia’s score in the index of transparency of
budget and accountability as measured by the Open Budget Survey27 has significantly deteriorated between
2008 and 2012 as the assessed performance with respect to reporting and publication of audit reports, mid-
year budget updates, extra budgetary funds and debt reporting declined and – contrary to other countries –
progress in other areas stalled (Figure 2.3). 26 This index captures the ease of business to access information on changes in policies and regulation that affect
their operations. 27 The Open Budget Survey is an independent, comparative, and regular measure of budget transparency, participation,
and oversight for all countries in the world, developed by the International Budget Partnership.
(http://survey.internationalbudget.org/)
Figure 2.2: Functional Expenditure Variance
(in percent)
Source: MOF/World Bank based on PEFA PMF PI-2 (i) Composition of
expenditure out-turn compared to the original approved budget based on
2011-2013 BOOST. Data for 2014 is not available.
7.4 7.3
4.7
0
2
4
6
8
2011 2012 2013

27
Figure 2.3: Fiscal transparency indicators Open Budget Survey Transparency of government policymaking
Source: Open Budget Survey
Note: Data for FYR Macedonia is only available for
the period 2008-2012. A lower number indicates
worse performance.
Source: World Economic Forum.
Note: A decline indicates that transparency of
government policy making has improved. A lower
number indicates better performance.
2.11. Macedonia’s governance performance is mixed when compared to other SEE6 countries. The
country ranks in the middle of the SEE6 countries, but significantly below the new EU member states with
respect to the World Governance Indicators (WGI). It performs best on Control of Corruption, outpacing
all other SEE6 countries and some new EU member states. Transparency International’s Corruption Index
confirms that Macedonia has the best score (together with Montenegro) among the SEE6 countries and has
managed to improve its rank significantly in recent years. At the same time, Macedonia’s WGI ranking on
voice and accountability deteriorated in recent years and it scores lowest in the region on the political
stability indicator, reflecting weak political dialogue and frequent elections. Other transparency concerns
include a sharply deteriorating Press Freedom Index.
2.12. The annual budget law includes a considerable amount of fiscal information, though
significant gaps remain. The document includes macro and fiscal assumptions, a basic definition of the
fiscal deficit, institutional functions and objectives, basic institutional indicators such as the number of
personnel and operating expenditures per employee. One or two output indicators per institutions are
covered by the annual budget law. After these narrative sections, the Budget provides institutional budget
data on economic classification and functional classification at the three-digit level, and program
classification at the two-digit level. There are 11 programs in the 2014 Budget documents. These programs
are 1) decentralization, 2) measures to reduce poverty, 3) promotion of defense and security, 4)
strengthening the rule of law, 5) economic development, 6) public administration reform, 7) EU integration,
8) information and communication technologies, 9) regional development, 10) improving environment and
11) investment in education. The revenues and budget for the central government institutions include basic
budget, donations, loans and self-financing activities.
2.13. Some significant gaps in the budget documentation are identified. These include (a) a lack of
information on deficit financing, (b) no information on financial assets, (c) lack of comparative data on the
prior year’s outturn, (d) breakdown of the current year’s budget by functional and administrative
classification and (e) No estimates of the budgetary impact of major revenue policy changes and/or some
major changes to expenditure programs are presented. A full analysis is provided in Table 4.4 below.
Addressing these omissions would be quite straightforward and contribute to an improvement in budget
documentation when compared to an internationally recognized benchmark.
0
10
20
30
40
50
60
2008 2010 2012
FYR Macedonia Albania Bosnia and Herzegovina Serbia
0
20
40
60
80
100
120
140
160
2008 2009 2010 2011 2012 2013 2014FYR Macedonia Albania
Bosnia and Herzegovina Montenegro
Serbia

28
Table 2.3: Comprehensiveness of information included in budget documentation
Criteria Y/N Clarification
Macro-economic assumptions,
including estimates of aggregate
growth inflation and exchange
rate.
Yes
Macro-economic assumptions are included in the budget
document. This includes information of projected GDP
growth rate for the budgeted year (with short description on
the production and expenditure side), information for the
inflation rate, employment growth and gross wage growth for
the budgeted year. Information on the exchange rate is not
presented.
Fiscal deficit, defined according
to GFS or other international
recognized standard.
Yes
The fiscal deficit is included in the budget document, both in
nominal values and as percent of GDP.
Deficit financing, describing
anticipated composition.
No Deficit financing is included in the budget document, but only
in narrative form (for example: the deficit level of X % of
GDP will be financed through foreign sources including
acceptable loans from IFIs, loans from commercial banks,
project financing), as well as from domestic sources (T-bills
and T-bonds). There is no numerical presentation of the
anticipated composition. Information on the deficit financing
is presented when there is a revised budget.
Financial assets, including
details at least for the beginning
of the year.
No
There is no information on financial assets in the budget
documentation.
Prior year’s budget outturn,
presented in the same form as
the budget proposal.
No The budget document does not include the budget outturn of
the previous year. The information included in the table
presents previous-year budgeted amounts and budget-
proposal year in the same format.
Current year’s budget – either
revised or outturn, presented in
the same form as the budget
proposal.
Yes Revised budget proposal during the year is presented in the
same format as the original budget proposal. The table in this
document includes the original budget and the revised budget.
Summarized budget data for
both revenue and expenditure
according to the main heads of
the classifications including data
for current and previous year.
No The budget document is comprised of two parts:
a. The Budget of the Republic of Macedonia (including the
three funds) is presented only in an economic classification
and it contains both revenues and expenditures for the
previous year and for the budgeted year. There is no
presentation of the Budget of the Republic of Macedonia
in the other three classifications.
b. The Budget of the Central Government is presented in an
economic classification and it contains both revenues and
expenditures the previous year and for the budgeted year.
The organizational classification of the Budget of the
Central Government does not contain data for revenues
and expenditures for the previous year. The functional
classification of the Budget of the Central Government
contains only expenditures for the budgeted year and it has
no data on revenues and expenditures for the previous
year. The program classification of the Budget of the
Central Government also presents only expenditures for
the budgeted year and has no has no data on revenues and
expenditures for the previous year. The program

29
classification contains forecasts for the budgeted year plus
two years.
Explanation of budget
implications of new policy
initiatives, with estimates of the
budgetary impact of all major
revenue policy changes and/or
some major changes to
expenditure programs.
No The budget document contains only a short narrative
description (1-3 paragraphs) of some major policy initiatives
such as decentralization, poverty reduction, defense and
security, rule of law, economic development, public
administration, EU integration, ICT development,
environment etc. No estimates of the budgetary impact of
major revenue policy changes and/or some major changes to
expenditure programs are presented.
2.14. The quality of published financial information in budget execution reports could be
enhanced. In-year consolidated central government budget execution data is published on a monthly basis
within 30 days of the month’s end. The published budget execution reports provide information based on
the aggregated economic classification using the IMF SDDS; the reports do not provide data according to
administrative or functional classification. In accordance with the Budget Law (Art 52), the Minister of
Finance submits the audited annual budget execution report to the Government by May 31 of the following
year; along with the final accounts of municipalities. According to the Law, after it is approved by the
Government, it should be submitted to the Parliament by June 30; although the 2012 final account was not
submitted until September 2013 and the 2013 one till July 2014. The annual report presents execution data
on a cash basis by functional, economic and administrative classification. No information on the arrears of
revenue, arrears of expenditure, financial assets and public debt are presented either in a balance-sheet form
or as a note to the financial statements. A major weakness of the current law is that the contents of the
annual budget execution report are prescribed by the Minister of Finance rather than mandated within the
Law. An example of the contents of annual budget execution report of a neighboring country (Croatia) is
shown below (see Box 2.1.).
2.15. The availability of public debt data has improved recently. The Macedonian Ministry of
Finance published public debt data for the first time in 2005. Between 2006 and March 2010, it published
public debt information every quarter. This was interrupted in March 2010, when the Ministry of Finance
started to publish information on central government debt and publicly guaranteed debt in two different
documents. As only a small amount of FYR Macedonia’s public debt was without a sovereign guarantee,
one was able to calculate roughly the amount of public debt by summing up these two tables. Public debt
as of end September was published once a year in the context of the EU pre-accession economic program.
This was not in line with international best practice. In October 2014, the Ministry of Finance resumed the
publication of public debt statistics, including of all the external and domestic debt of the central
government, the SOEs and the municipalities, on a quarterly basis. The Ministry also prepares
comprehensive annual reports on public debt management which are discussed in the Cabinet and presented
to Parliament. The Law states that the annual report should also be published on the Ministry of Finance
website. No requirement currently exists to publish public debt data as an integral part of the annual budget
execution report.
2.16. The prevention, management and clearance of expenditure arrears require comprehensive,
timely and reliable information about their size, composition and vintage. Reporting of accounts
payable and identifying those in arrears should be an integral part of the regular monthly fiscal reports and
should be disclosed in the annual financial statements.

30
Box 2.1: Example of Contents of Budget Execution Report in Budget Law: Croatia Budget Act
2009 – Semi Annual and Annual Statement on Budget Execution (Art 118)
Article 108
(1) The semi-annual and the annual statement on budget execution shall include:
1. An overview of the total revenue and receipts and expenditures and expenses
on the level of division of the chart of accounts
2. the special part of the budget according to the organizational and program
classification on the level of division of the chart of accounts
3. the statement on borrowing on domestic and foreign money and capital market
4. the statement on the use of budgetary reserve
5. the statement on the state guarantees issued and expenses on state guarantees
6. the explanation of the realization of revenue and receipts and expenditures and
expenses
7. the explanation of macroeconomic indicators
(2) The semi-annual and annual financial statement on budget execution in addition to the content from items 1 to
7 of the section 1 of this Article shall include:
1. the execution of the financial plans of extra-budgetary users on the level of
division of the chart of accounts
2. the explanation of the realization of revenues and receipts, expenditures and
expenses
3. the general budget deficit
(3) The provisions of section 1 of this Article, excluding item 7 and section 2 of this Article, shall apply in an
appropriate manner to the local and regional self-government units.
(4) The Minister of Finance shall define the content and bodies obliged to prepare semiannual and annual statement
on budget execution.
D. MEDIUM-TERM FISCAL FRAMEWORK
2.17. A Medium-term Fiscal Framework (MTFF) is a tool for governments to extend the horizon
for fiscal policy-making beyond the annual budgetary calendar. Although the approval of the annual
budget law remains the key step in which important decisions on budgetary policy are adopted, most fiscal
measures have budgetary implications that go well beyond the usual yearly budgetary cycle. As a result, a
single-year perspective provides a poor basis for sound fiscal planning. MTFFs usually cover the
preparation, execution, and monitoring of multi-annual budget plans and contain both expenditure and
revenue projections as well as the resultant budget balances.In general, medium term budgetary objectives
included in a MTFF represent a weaker form of commitment than a pure rule incorporating binding targets.
However, they may help ensure fiscal discipline by making more apparent the impact of current policies on
the government balance in the coming years. Likewise, the existence of an MTFF may facilitate monitoring
by providing benchmarks against which budgetary developments can be assessed over time. Overall, a well
designed MTBF should reflect the impact of past budgetary commitments as well as the future cost of new
policy measures. Finally, the strengthening of the MTBFs can efficiently complement the introduction of
other institutional reforms such as the introduction of an expenditure rule or top-down budgeting
2.18. The Government prepared and re-introduced the publication of the medium-term fiscal
strategy (MTFS) in 2013, covering the period from 2014-2016. The Ministry of Finance published an
MTFS every year between 2007 and 2010. This practice was discontinued in 2011 and 2012. The
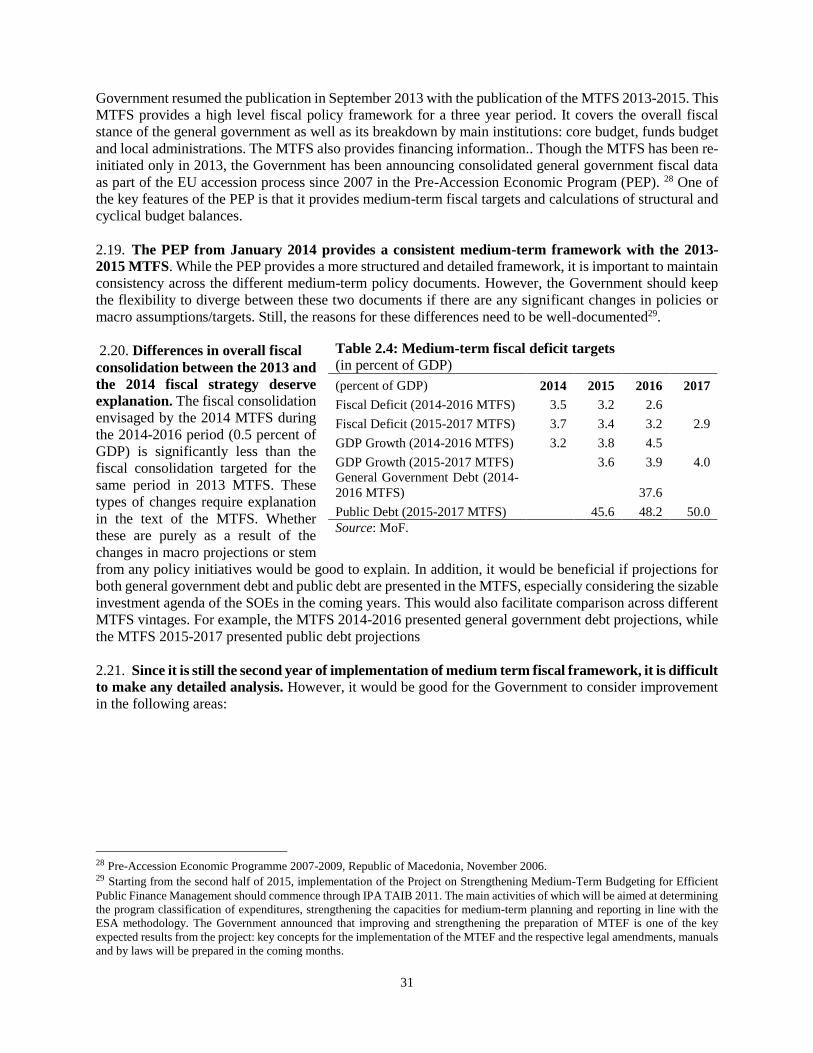
31
Government resumed the publication in September 2013 with the publication of the MTFS 2013-2015. This
MTFS provides a high level fiscal policy framework for a three year period. It covers the overall fiscal
stance of the general government as well as its breakdown by main institutions: core budget, funds budget
and local administrations. The MTFS also provides financing information.. Though the MTFS has been re-
initiated only in 2013, the Government has been announcing consolidated general government fiscal data
as part of the EU accession process since 2007 in the Pre-Accession Economic Program (PEP). 28 One of
the key features of the PEP is that it provides medium-term fiscal targets and calculations of structural and
cyclical budget balances.
2.19. The PEP from January 2014 provides a consistent medium-term framework with the 2013-
2015 MTFS. While the PEP provides a more structured and detailed framework, it is important to maintain
consistency across the different medium-term policy documents. However, the Government should keep
the flexibility to diverge between these two documents if there are any significant changes in policies or
macro assumptions/targets. Still, the reasons for these differences need to be well-documented29.
2.20. Differences in overall fiscal
consolidation between the 2013 and
the 2014 fiscal strategy deserve
explanation. The fiscal consolidation
envisaged by the 2014 MTFS during
the 2014-2016 period (0.5 percent of
GDP) is significantly less than the
fiscal consolidation targeted for the
same period in 2013 MTFS. These
types of changes require explanation
in the text of the MTFS. Whether
these are purely as a result of the
changes in macro projections or stem
from any policy initiatives would be good to explain. In addition, it would be beneficial if projections for
both general government debt and public debt are presented in the MTFS, especially considering the sizable
investment agenda of the SOEs in the coming years. This would also facilitate comparison across different
MTFS vintages. For example, the MTFS 2014-2016 presented general government debt projections, while
the MTFS 2015-2017 presented public debt projections
2.21. Since it is still the second year of implementation of medium term fiscal framework, it is difficult
to make any detailed analysis. However, it would be good for the Government to consider improvement
in the following areas:
28 Pre-Accession Economic Programme 2007-2009, Republic of Macedonia, November 2006. 29 Starting from the second half of 2015, implementation of the Project on Strengthening Medium-Term Budgeting for Efficient
Public Finance Management should commence through IPA TAIB 2011. The main activities of which will be aimed at determining
the program classification of expenditures, strengthening the capacities for medium-term planning and reporting in line with the
ESA methodology. The Government announced that improving and strengthening the preparation of MTEF is one of the key
expected results from the project: key concepts for the implementation of the MTEF and the respective legal amendments, manuals
and by laws will be prepared in the coming months.
Table 2.4: Medium-term fiscal deficit targets
(in percent of GDP)
(percent of GDP) 2014 2015 2016 2017
Fiscal Deficit (2014-2016 MTFS) 3.5 3.2 2.6
Fiscal Deficit (2015-2017 MTFS) 3.7 3.4 3.2 2.9
GDP Growth (2014-2016 MTFS) 3.2 3.8 4.5
GDP Growth (2015-2017 MTFS) 3.6 3.9 4.0
General Government Debt (2014-
2016 MTFS) 37.6
Public Debt (2015-2017 MTFS) 45.6 48.2 50.0
Source: MoF.

32
1. Inclusion of macro and fiscal policy changes that are expected during the medium-term
framework could improve the quality of the MTFS. It is desirable to add relevant costing of
these policy measures.
2. Inclusion of indicative institutional budget ceilings could improve its guidance role to the line
agencies.
3. The timing of the issuance of MTFS needs to be reconsidered in order to be more functional in
the budget preparation process. The last two MTFS were issued in September 2013, late in the
budget preparation process.
4. Including an explanation for any macro and fiscal framework targets compared to the previous
MTFS could improve the credibility of the document.
E. CAPITAL INVESTMENT MANAGEMENT
2.22. Spending on public investments has expanded significantly in recent years, particularly in
the transport sector (see Chapter 5). This highlights a serious weakness in capital investment management
because the full cost of investments, including recurrent costs, is not considered when they are approved.
2.23. Despite closer links between capital investment and integrated planning arrangements, there
are still weaknesses in the way projects are developed and considered in the budget process. Some
foreign grants are still omitted from the budget and a significant number of unplanned projects are
introduced late in the budget process without a comprehensive readiness assessment. Major investment
projects require the approval of the Government taking into account the opinion of the Ministry of Finance
(on financial matters) and the MDA in charge of the project. This requires that the institutions responsible
for the project prepare and submit technical and financial studies of the projects, including a justification
of the investment. However, because the processes for preparing multi-year plans, screening and approving
investment and preparing annual budgets are still not fully integrated, the links are fragile.
2.24. The government could take a variety of actions to make management of capital investment
more efficient and effective. Including a cost-benefit analysis is one obvious way to improve. In addition,
budget users should aim at building their capacity and improving their analysis, prioritization and
monitoring and evaluation. The difficulty of managing public finances during the international financial
crisis may also have limited the extent to which a broad PFM reform agenda could be pursued, given the
limited resources available to the Ministry of Finance. Specifically, fiscal adjustment is typically borne by
reduction capital expenditure–one of the few discretionary items in the budget.
2.25. It is crucial that capital investment decisions be taken as part of the policy framework, which
should be linked into the MTFF and the development of the Annual Budget. Capital investment
projects need to be subject to mandatory national rules for the economic analysis, readiness and
prioritization in the context of sector strategies and budget processes. When major projects are put forward
for consideration outside the normal budget procedures, they should at most be given in-principle support
and then subjected to the same national rules to ensure that they are affordable, of higher priority than other
investments, and are ready to proceed so that they do not tie up funds that could be used more immediately
or more effectively. Final approval of projects should be within the annual budget process, ensuring that
they comply with overarching fiscal policy considerations, such as sector mid-term spending ceilings.
2.26. National mandatory rules should be comprehensive and cover all elements of the capital-
investment cycle, including repairs, maintenance and recurrent operational costs. These elements
would include clear guidance to ensure that design and preparation are completed before calls for proposals
are made or tender procedures are initiated; incorporate monitoring, reporting, and risk-management
arrangements and evaluation of project outcomes on project completion.

33
2.27. The Government should identify ways to build the investment management capacity of the
Ministry of Finance and of line ministries. Recent decline in the quality of public investments raise
concern about the selection criteria applied. Budget users could benefit from an increased capacity to
analyze and prioritize public investment, so that more consideration is given to the socio-economic aspect
of the investment. Ideally, additional resources should be directed to the investment-preparation function
and considered in the allocation of investment funds so that organizations with major public investment
responsibilities, such as the Ministry of Finance’s review function, have staff resources commensurate with
those responsibilities. The need for additional practical guidance and training on analytical techniques
should also be considered.
F. TREASURY AND CASH MANAGEMENT
2.28. The authorities are committed to improving financial management practices in the public
sector and are introducing safeguards to tackle the emergence of future arrears. Poor revenue
performance during the financial crisis combined with a weakening fiscal discipline in the public sector led
to budgetary arrears on VAT refunds and payments on goods and services. By the end of February 2013,
the Government had cleared all outstanding payment obligations and taken steps to address the reoccurrence
of arrears. First, the authorities launched an initiative to identify all existing multi-year liabilities incurred
by budget users. The information provided was used in the preparation of the 2013 budget with the aim of
ensuring that all identified liabilities, including the stock of arrears, were funded within a fiscally prudent
time frame. Second, the Ministry of Finance has implemented amendments to the Manual on Treasury
Operations that specify: (i) procedures for reporting multi-year commitments of budget users (on all
spending items) to the Treasury; (ii) stronger procedures for reporting liabilities on concluded contracts;
(iii) procedures for validation of commitment reports by internal auditors. The revised Manual also
strengthens the incentives for compliance, including refusing the payment of liabilities that are not properly
recorded, and requiring budget users to absorb within their authorized budgets the cost of all multi-year
commitments that they incur. Other financial controls within treasury operations appear to be working
effectively. All budget resources of central government entities and the three extra-budgetary funds
(including own-source revenues) are managed through single treasury accounts. The main Single Treasury
Account is reconciled on a daily basis.
2.29. The changes in the regulations have been complemented with upgrades to the Treasury
Information System, but these are yet to be applied uniformly across Government. From 1 January
2014, budget entities are to submit contracts to treasury offices within 15 days of signing. These are
registered in the treasury system at one of the 17 treasury offices, along with a scanned copy of the contract.
Hard system controls require contracts to be registered prior to making payments against them. These
invoices are then settled by Treasury within forty five days; in accordance with the Law on Financial
Discipline, the invoices should be settled within 60 days of receipt. Treasury sends first-line budget users a
list of outstanding commitments, which they are required to check on a quarterly basis to confirm the
completeness and accuracy of the lists. While the commitment-control system appears to operate for central
government institutions, it is not operating uniformly; extensive arrears have built up in hospitals, as
discussed further in Chapter 5. The current treasury system does not have the ability to record the date of
receipt of the invoice by the budget entity. This means the system does not keep a comprehensive
centralized record of financial liabilities. The Law of Accounting does require budgets and budget users to
maintain records of their financial liabilities and to report these in their annual accounts. In addition, budget
users have to prepare consolidated annual accounts (from the annual accounts of the spending units that
belong to them) and submit them to the Ministry of Finance. To manage and prevent the accumulation of
arrears, a system is needed to have a reporting system which monitors expenditure commitments, invoices
received and verified, accounts payable, invoices and arrears paid. These arrear -monitoring systems should
capture the size, maturity, and composition of the stock of arrears - information which can be used as the
basis for identifying their causes and prioritizing their clearance.

34
2.30. The Treasury has well-established information on the availability of funds for budget users. Based on their budget appropriations, budget entities prepare monthly and quarterly cash projections.
Treasury prepares an internal weekly cash flow (broken down on a daily basis) of revenue and expenditures.
This is informed by a meeting with PRO, Customs and the Health Fund; in addition, procedures are in place
to require budget holders to provide details of major commitments (over 10 million MKD) that are due and
payable. The improved commitment controls outlined above will ensure that Treasury is aware of the size
and timing of commitments so that they can make arrangements for sufficient funds to be available when
needed.
2.31. The current Treasury system has reached its capacity and needs to be upgraded. Improvements to the Treasury Information System within the next few years are expected to include a
complete upgrade of the budget accounting and reporting system, the provision of online connections for
every budget user and improvements to financial control mechanisms. Interfaces with other elements of the
PFM system (for example, procurement) have yet to be addressed and, given the Government’s
commitment to the development of IT systems, a strategy for the integration of the financial management
system would be useful at this time.
G. PUBLIC DEBT
2.32. Debt management and debt reporting have evolved over the past years. In 2005, all debt
management functions were transferred to the Ministry of Finance.30 Debt reporting is currently based on
an Excel database being run in parallel with a newly developed in-house debt management database, which
is expected to be operational on a stand-alone basis in the near future. The new system is comprehensive
and covers all front, middle and back-office functions. Debt is being monitored at the central and local
Government level by institutions, by stock, flow, interest, and currency. It includes all debt (loans and
guarantee) instruments. Currently, NBRM only publishes external debt, while the MOF publishes
consolidated general public debt on its website since October 2014.)31. In addition, the debt management
reports that accompany the budget submissions to Parliament had also been published on the MOF website.
Recently, the MOF included explicit targets for refinancing needs, interest payments and currency risks in
the debt management strategy that accompanies the medium-term fiscal strategy. In an effort to further
strengthen debt management and reduce risks, the authorities could consider to strengthen the strategy by
including information on the debt of SOEs as well as contingent liabilities, particularly to manage currency
risk. In addition, it is suggested that the debt-management strategy takes into consideration the costs and
risks that stream from government financing choices on central bank reserve developments and domestic
liquidity.32
H. PUBLIC PROCUREMENT
2.33. The public procurement system in the FYR Macedonia rests on sound foundations; the legal
framework has been almost fully harmonized with the EU acquis. The public procurement system is
defined by the Strategic Priorities of the Public Procurement Bureau for Further Development of the Public
Procurement System in FYR Macedonia 2014-2018. The Law on Public Procurementi (LPP Official
Gazette No. 136/2007) was adopted on November 6, 2007 and entered into force January 1, 2008. The Law
was amended ten times to bring it more in line with the acquis. The Law and its amendments regulates the
30 Previously, the National Bank was managing and reporting the external debt. 31 The Ministry of Finance interrupted the publication of public debt in one table between March 2010 and October
2014 (see Box 2.2). Public debt as of end-September was published during this period once a year in the Pre-Accession
Economic Program. 32 Management of risks inherent in the public portfolio is discussed in Chapter 4.

35
manner and procedure for awarding public contracts, the competences of the Public Procurement Bureau
(PPB), the establishment and role of the State Appeals Commission upon Public Procurement and the legal
protection in the procedures for awarding public procurement contracts. The institutional arrangements for
public procurement in FYR Macedonia are set out in Box 2.2 below.
2.34. The LPP (with supporting manuals, codes and rule books) follows the logic of the EU
Directives and regulates the procurement process from planning to conclusion of contract, but it does
not supervise contract implementation. The Law applies to awarding public procurement contracts for
goods, works, services, including sector contracts, as well as to concluding framework agreements.
Publication of contract awards, including for contracts for below EUR 5,000, is mandatory. The Law also
contains provisions for remedies and implements innovative purchasing instruments regulated by the
relevant EU Directives on public procurement, such as competitive dialogue, framework agreements,
central purchasing bodies and e-procurement. The LPP defines the public procurement procedures and the
circumstances under which each could be used. These include: open tendering, restricted procedure,
competitive dialogue, negotiated procedure with a prior publication of contract notice, negotiated procedure
without a prior publication of contract notice, simplified competitive procedure for contracts under the
threshold defined in the LPP, open conceptual solution contest, framework agreement and electronic
auctions. The LPP does not apply to contracts for concessions and public-private partnerships.
Implementation of the Law on Concessions and PPP, which was adopted in January 2012, has been delayed.
Box 2.2: Institutional Arrangements for Procurement in Macedonia
The Public Procurement Bureau (PPB) within the Ministry of Finance is responsible for the development,
implementation and coordination of the entire public procurement system in Macedonia. It is the main policy-
making institution and provides training for Contracting Authorities (CAs), Economic Operators (Eos), trainers and
certifications in public procurement. It has a director and 20 full-time staff in three main departments; Legal, E-
Procurement and Public Procurement Council (PPC). The PPC was formed in accordance with the Amendment to
the LPP (the Official Gazette No. 148/2013 and 28/14) within the PPB; it comprises a President and four members
appointed for four years by the Government; members can be re-elected. The PPC reports to and is responsible to
the Government. It PPC represents a control mechanism to assure the validity of the criteria, conditions, standards
and technical documentation in the bidding documents.
The State Appeals Commission (SAC) is an autonomous government body responsible for reviewing and
considering appeals in connection with public procurement procedures. Since 2012, it is also responsible for
reviewing appeals with regard to procedures for the award of concessions and public-private partnerships. It is an
independent body, financed from the state budget, that reports to the Parliament. The SAC has a president and four
members, appointed through a public announcement and serving a 5-year term with the possibility of re-
appointment. The procedure for addressing complaints is defined in the LPP. Complaints are subject to a fee ranging
from EUR 100 to 400, depending on the value of the contract.
The State Audit Office (SAO) monitors compliance of procurement procedures with the LPP and with the
principles of economy, efficiency and transparency in public-funds management.
2.35. The Law, together with all regulations and supporting publications, is available online on the
website of the PBB. According to the Report on the Activities of the Public Procurement Bureau in
Functioning of the Public Procurement System in 2013, available on the website of the PPB, the total value
of concluded public procurement contracts in 2013 was MKD 52.5 billion, a reduction of 7 percent from
2012. The most commonly applied procedure in accordance with the estimated contract value was the open
procedure. 7,109 contracts were concluded following the open procedure, at a total amount of MKD 35.7
billion, which represents about 68 percent of the total value of 2013 public procurement. The second most
commonly used procedure was the negotiated procedure without prior publication of contract notice. Based
on it, 1,452 contracts were concluded for an amount of MKD 6 million, representing about 11 percent of
the total value of 2013 public procurement. The report indicated that the share of concluded contracts based

36
on this procedure increased by about 4 percent compared to the previous year. The reason for that might be
that this procedure was applied for the purpose of contract amendments. The current system does not
provide link between the initial contract and the subsequent amendments; amendments are shown as
separate contracts.
2.36. Contracting Authorities are obliged to use e-auction for almost all award procedures; minor
exceptions are defined in the Law. E-procurement procedures are well advanced in Macedonia. E-
procurement, i.e. the Electronic System for Public Procurement (ESPP), supports the publication of all
procurement notices and enables contracting authorities (CA) and the economic operators (EO) to publish
and access all tender documents, to submit and evaluate bids and to conduct e-auctions. While the e-auction
is mandatory prior to contract award, CAs have the right to choose whether to use electronic or paper-based
tendering process. This is defined in advance in the procurement notice. A Rulebook on the Manner of
Using the Electronic System of Public Procurement was adopted in May 2013, and provides a detailed
description of the procedures for carrying out e-procurement and electronic auctions.
2.37. The Macedonian e-Procurement system, ESPP, appropriately reflects the requirements of
the Law. ESPP is technically stable with a strong technical infrastructure to handle the usage from
all Contract Authorities and Economic Operators. It appropriately addresses all the amendments to the
Public Procurement law. Transparency is provided by the ESPP because all transactional operations are
logged by the system; additionally, all receipts of documentation from CAs to EOs (and vice versa) are
captured by the system and notifications are quickly distributed to EOs through the system. The ESPP has
resulted in significant efficiency savings, especially in the time associated with the tendering process and
clarification /response times.
2.38. According to the Law, e-Reserve Auctions are compulsory; while this works well for
procuring commodities, it is not appropriate for all procurement categories, notably work and
consulting services, which are still procured using paper. Currently, e-Tendering is only used for about
thirty percent of the tenders, in which documents can be lost. To ensure full transparency and accountability
e-Tendering should be used for all procurement activities, though this is not yet mandatory required in the
PPL.
2.39. Contract amendments are published as separate contracts, which are not systematically
linked back to the original contract. This makes it difficult to monitor spending directly associated with
a contract. To improve transparency and accountability, the ESPP should publish and group the contract
amendments with the original contract awards.
2.40. Recent enhancements to the Treasury system may address persistent concerns regarding late
payments made to contracts signed with EOs. At present there is no link between the ESPP and the
treasury system that would allow the Treasury to prepare a more accurate analysis of the government cash
position and debt-financing options. Linking the treasury and procurement systems is also vital to monitor
contract implementation, including timeliness of conclusion of contract and the settlement in line with
contract payment terms.
2.41. The addition of the PPB Council has added additional time and cost in reviewing the technical
requirements of to the procurement process. To be in line with the EU directives and to improve the
efficiency and effectiveness of the procurement process, the Law should eliminate the need for the PPB
council review of Technical Requirements in bidding documents.

37
I. PUBLIC INTERNAL FINANCIAL CONTROL
2.42. The internal audit function is regulated by the Law on Public Internal Financial Control
(PIFC), which broadly follows the requirement of the European Union. The Law is underpinned by
associated manuals and rulebooks that regulate the components of the internal control system: the financial
management and control, the internal audits and their harmonization as well as the standards, methodology,
relations and responsibilities in public internal financial control.
2.43. The Law requires that all first-line budget users (in central government, the funds,
municipalities and the City of Skopje) must have a Financial Affairs Unit (FAU). The internal audit
structure follows a decentralized model; all major budget holders are required to have an internal audits
unit; smaller units are subject to internal audit but may hire external auditors to fulfill the requirements of
the Law. A Central Harmonization Unit (CHU) within Ministry of Finance is responsible for formulating
policies and procedures, monitoring internal audit work and reporting its activities within Government. In
common with the approach of neighboring countries, Macedonia recently enacted a Law on Financial
Inspection. Inspection is an ex-post function that allows the Ministry of Finance to control the compliance
of transactions in budget entities with the Law. A small unit consisting of 10 staffers will be established
under the Law.
2.44. In common with other countries in the region, the development of the PFIC requirements has
been slow. Nevertheless the establishment and staffing of FAUs in both central and local government has
continued. Awareness of managerial accountability remains low in all levels of institutions and
municipalities. Principles of distributed budgets and delegated decision-making, a central plank of the Law,
are slowly being developed; but it will take a considerable amount of time for them to be fully effective.
The CHU is encouraging the development of risk registers in budget institutions, a challenging and
relatively advanced topic even in more developed countries. In practice, treasury controls (discussed above)
will continue to act as an important safeguard in ensuring that spending is in compliance with applicable
laws and regulations.
2.45. The decentralized model of internal audit is also making slow but steady progress. Internal
audit units have been established in all first-level budget institutions staffed by 139 internal auditors. With
the recent support of development partners, forty-five internal auditors have been certified; a second tranche
will commence training later this year through CIPFA classes provided by the Center of Excellence in
Finance in Slovenia. A medium-term goal is to develop a fully sustainable certification program in
Macedonia. While the Law and related manuals comply with international standards, both the quality of
work and management responses to internal audit recommendations still need to be further developed.
According to the CHU’s 2013 report, 56 percent of all internal audit recommendations were enacted; a
steady improvement over previous years. The low percentage of enacted recommendations is explained in
part by the lack of management actions, but also due to a lack of clarity in the articulation of some of the
internal audit recommendations.
J. PUBLIC SECTOR ACCOUNTING
2.46. Significant efforts have been undertaken since 2003 to reform the statutory framework for
corporate-sector accounting and auditing. The Government has carried out reforms consistent with good
international practices and the EU acquis communautaire. Major changes in accounting since 2003 include:
the enactment of a law on accounting services; the adoption of a relatively recent version of IFRS (2009);
the introduction of IFRS for SMEs; improved filing mechanisms for financial statements; and improved
transparency through the availability of data at the Central Registry. Additional reforms in auditing include:
the enactment of a new law on auditing; the establishment of a professional institution for statutory auditors;
the preparation of updated certification curricula; the replacement of outdated auditing standards with newer

38
versions and the establishment of quality-assurance and public-oversight arrangements for the audit
profession.
2.47. Public sector accounting could be strengthened. The Law of Accounting of Budget and Budget
Beneficiaries dates back to 2002, although there have been subsequent amendments in 2005 and 2011. The
Law sets up basic provisions on the maintenance of book-keeping records and also requires budget
beneficiaries to keep records of revenues, expenditures, assets and liabilities. In time, this law will need to
be updated to keep pace with the development of a reliable set of International Public Sector Accounting
Standards (IPSAS) in the past few years. There are elements of the international standards framework that
might be considered a priority (for example, income and expenditure recognition and the treatment of
financial assets and liabilities); however other elements of the standards should be a medium to long-term
priority. As a first step, it would be useful for the Government to do a preliminary gap analysis comparing
national and international standards and developing a strategy for public-sector accounting reforms. The
Government, with the support of the World Bank, in September 2014 began a training program for public-
sector accountants through CIPFA classes provided by the Center of Excellence in Finance in Slovenia.33
The goal is to develop an initial cadre of trained public-sector accountants who can provide the capacity to
develop a fully sustainable certification IPSAS based training program in Macedonia.
K. EXTERNAL SCRUTINY AND AUDIT
2.48. The State Audit Office (SAO) has clear legal authority to audit all public funds and entities
in Macedonia; recent constitutional changes anchor these responsibilities under the Constitution. Its
operational and functional independence is satisfactory, but its modest budget and resultant staffing levels
result in insufficient coverage; as a result, smaller entities are not audited on a regular basis. Recent
proposals to anchor the SAOs role within the Constitution would bring the country into line with INTOSAI
standards.
2.49. Requirements to audit the financial operations and reporting of political parties may affect
the perception of the SAO’s functional independence. A 2010 and 2012 amendment to the Law on
Financing of Political Parties requires the SAO to audit the financial operations and reporting of political
parties. This mandate raises concerns regarding perceived independence and objectivity of the SAO, and
also its ability to direct its resources according to its own operational decisions.
2.50. The SAO conducts its audits in accordance with INTOSAI standards (financial, compliance
and performance audits). The mission did not have time to review SAOs manuals and quality-review
procedures. However, the latest SIGMA report notes that they follow INTOSAI standards and that audit
quality control procedures are becoming standard practice in SAO.
2.51. Management responses to audit recommendations have been slow but are gradually
improving; SAO needs to disaggregate its published statistics to differentiate between audits of public
entities and political parties. The 2013 SAO Annual Report provides a detailed analysis of the audit
findings; the Report is well-presented and provides the lay reader with a well-articulated overview of the
SAO audit work and a high level summary of findings from its work. SAO data shows a relatively poor
response to SAO recommendations; only 60 percent of recommendations were fully or partly implemented
at the time of publishing this Annual Report. However, SAO management was keen to stress that the 2013
33 This is a continuation of a previous training program implemented during 2007-2011 (Capacity Building in Public
Accounting – CBIPA), supported by the World Bank funded Institutional Development Fund (IDF) and a PACT
program implemented during 2012-2013. The Government’s goal is to develop an initial cadre of trained public-
sector accountants who can provide the capacity to develop a sustainable certification IPSAS based training in FYR
Macedonia.

39
report included recommendations for their work in respect of the auditing the financial operations and
reporting of political parties and a large number of recommendations related to this mandate. They argued
that the response rate by management in budget institutions has improved in recent years.
2.52. Improved transparency and accountability could be achieved by developing the capacity of
parliament to examine SAO audit reports. Audit reports are published by the SAO in their original form
and also submitted to Parliament; however the Committee on Budget and Finance only reserves time to
discuss its Annual Report. The Committee drafts conclusions on this report, which are discussed at a plenary
session of parliament. While individual audit reports are submitted to Parliament, they are not dealt with in
a systematic way, although completed audit reports are published on the SAO website34. Macedonia also
ranks poorly on the World Press Freedom Index (2014 – 123 out of 180 countries), which may also reduce
the level of public scrutiny given to SAO reports. With the cooperation of the Dutch Court of Auditors, the
SAO developed a manual to assist parliamentarians in reviewing audit reports. Despite a memorandum of
cooperation between the SAO and parliament, the Budget and Finance Committee is under-staffed and still
does not review individual audit reports.
L. FINANCIAL MANAGEMENT INFORMATION SYSTEMS
2.53. The government has showed itself committed to the steady evolution of its financial
management systems. ESPP, Macedonia’s e-procurement system, is a technically stable infrastructure
designed to be used by all contract authorities and economic operators. MOF also invested considerable
time and effort in developing a comprehensive, new be-spoke public debt system that is currently being
piloted alongside the legacy system. Finally, the existing treasury system was redesigned to incorporate
basic single and multi-year commitment controls. However, the present treasury system dates from 2001
and is nearing the end of it useful life.
2.54. While many of the building blocks of a modern financial management system are already in
place, work is needed to update some systems and integrate business processes. Future systems
development could focus on integrating business processes to provide real-time financial information that
managers could use to formulate budgets, manage resources and administer programs. Planning future
systems strategically is particularly important as these are complex and difficult reforms. A first step in
developing an IFMIS is to develop a strategic plan for the development and integration of the various
fragmented systems.
M. CONCLUSIONS
2.55. Improving public financial management could help FYR Macedonia improve the efficiency
of its spending and better achieve its investment goals. The Ministry of Finance has made progress in
strengthening debt management, commitment controls and the Treasury system, which now has reached its
system capacity. While the current system is running smoothly, establishing a new integrated information
system, would enable the Ministry of Finance to introduce new modules and enhance its PFM capabilities.
2.56. FYR Macedonia has made progress in increasing fiscal transparency, but several fiscal
reports could be improved. An important step towards of improving fiscal transparency was the
publication of monthly public debt statistics and the medium-term debt management strategy on the website
of the Ministry of Finance since October 2014. While the budget documents provide significant
information, the budget presentation, the budget law and the budget execution reports could be
strengthened. The budget law should clearly specify the contents of the different reports, in particular the
34 See http://www.dzr.gov.mk/DesktopDefault.aspx?tabindex=0&tabid=1092

40
annual execution report. The budget documentation could include information pertaining to deficit
financing, financial assets, the prior year’s outturn, a breakdown of the current year’s budget by functional
and administrative classification as well as estimates of the budgetary impact of major policy changes. Most
importantly, the budget documents should include clear costing of the proposed policy initiatives that will
be supported during the budget year. Budget execution reports could provide data based on administrative
and functional classification. The annual report could be strengthened by including information on revenue
and expenditure arrears, financial assets and public debt.
2.57. The Government could include additional key information in its medium-term fiscal strategy. The Government published the first medium-term fiscal strategy in 2013. The next strategy document could
include information on i) macro and fiscal policy changes; ii) costing of major policy changes; iii) indicative
institutional budget ceilings; and iv) an explanation for any changes in macro and fiscal framework targets.
In particular, it is important that the medium-term fiscal strategy contains a clear description of the policies
that support the proposed fiscal consolidation path.
2.58. Strengthening public investment management will be key to improving the efficiency of
public spending. Capital investment projects should be subject to mandatory national rules for economic
analysis and prioritization in the context of sector strategies and budget processes. These rules should be
comprehensive and cover all elements of the capital investment cycle, including repairs, maintenance and
recurrent operational costs. The recent decline in the quality of public investments also raises concerns
about the selection criteria applied. Increasing the use of cost-benefit analysis, strengthening the capacity
of budget users, developing transparent criteria for prioritizing investment projects and creating a clear
framework for monitoring and evaluating projects would increase the quality of investment spending.
2.59. As the Government scales up investment, public procurement could be further strengthened.
The Government could take further steps to increase competitive bidding and improve transparency and
accountability in public procurement by ensuring that e-Tendering is used for all procurement activities.
The Public Procurement Law should clearly specify this. The ESPP should also publish and group the
contract amendments with the original contract awards. The implementation of the Law on Concessions
and PPPs could be accelerated. The Government should also consider linking the ESPP with the Treasury
system.
2.60. The Treasury system is reaching capacity constraints and could be upgraded. It would be
important for the Government to develop a strategy that links interfaces and databases of elements of the
PFM system and upgrades the Treasury system.

41
CHAPTER 3. COMPOSITION AND EFFICIENCY OF PUBLIC SPENDING
A. INTRODUCTION
3.1. FYR Macedonia’s size of government compares favorably to most countries of its income
level, yet there is significant scope for increasing the efficiency of public spending. Between 2006 and
2013, FYR Macedonia’s general government expenditure-to-GDP ratio averaged 34.5 percent, significantly
below the 38.3 percent average of the SEE6 and the ECA average of 38.2 percent. While often smaller
governments tend to be more efficient than larger ones, the scope for improving efficiency of public
spending in FYR Macedonia seems significant. Several countries in the region achieve significantly better
outcomes with the same or less resources, in particular, related to education, infrastructure and income
distribution. Around 60 percent of FYR Macedonia’s expenditures are allocated to wages and social
transfers. Pensions account for more than a quarter of total expenditures and they have been increasing,
though pensioners are less likely to be poor than other Macedonians. Despite recent improvements, the
social assistance program remains small and fragmented. Spending on goods and non-labor services is low
compared to most countries in the region, contributing to a deterioration of public assets. Agricultural
subsidies have increased, but they seem to have had little impact on agricultural investment. Executed
capital expenditures have been relatively low by regional standard. The Government has addressed this by
moving transport spending off budget, yet at the same time there is evidence that the efficiency of public
investment has declined. As in other countries in the region, there is also significant scope for improving
efficiency of spending in education, health and agricultural subsidies.
3.2. The government could take several steps to align spending better with its strategic objectives
and increase expenditure efficiency. The government has already taken first steps towards increasing
capital investment and improving the efficiency of investment in the roads sector. Improving public
investment management further will be important to ensure that the current investment program is
conducive to growth. The government should also carefully assess maintenance needs and consider
investing more in maintenance rather than new construction. Steps to provide a more equitable funding of
Early Childhood Education, specifying the use of the supplemental education funds, improving the quality
of elementary and secondary education and aligning tertiary education better with private sector needs seem
to be key for improving efficiency of spending and fostering long-term growth. Agricultural subsidies could
be targeted better to help increase agricultural investment, in particular in irrigation. Health sector spending
could focus more on primary and preventive care. Finally, a review of the current social assistance programs
would be helpful.
3.3. This chapter is structured as follows. The next sections provide an overview of the composition
of spending by classification and government level. Section C discusses the efficiency of public spending.
The last section summarizes policy options to strengthen the efficiency of public spending
B. SPENDING BY CLASSIFICATION
Expenditures by economic classification
3.4. FYR Macedonia’s size of government is small and a large part is destined to wages and social
transfers. Between 2006 and 2013, FYR Macedonia’s general government expenditure-to-GDP ratio
averaged around 34.5 percent, standing below the average of SEE6 countries (38.3 percent of GDP) and
the ECA region as a whole (38.2 percent of GDP). Over the period 2006-2013, its current expenditure has
remained around 87-90 percent of total expenditures (Figure 3.1a). This is higher than SEE6 average of 83
percent during this period and is around the level of the EU-11 average. Around 60 percent of expenditures

42
are allocated to wages and social transfers. Pensions account for more than a quarter of total expenditures
and have been increasing.
Figure 3.1: Government Expenditure a. General government expenditure in % of GDP b. FYR Macedonia’s central government
expenditures
Source: IMF WEO, Ministry of Finance and World
Bank staff calculations.
Source: MoF; World Bank staff calculations.
3.5. Capital spending has been low. Capital expenditures averaged 11 percent of total expenditures
since 2006 or 4.5 percent of GDP. This is the second lowest capital expenditure ratio in the SEE6 region
and significantly below the SEE6 average of 5.8 percent of GDP, but it is higher than the EU-11 average
of 4.1 percent. Budgeted capital expenditures have been around 14 percent of total expenditure or 4.9
percent of GDP (over the period 2006-2014), but have been constantly under-realized (Figure 3.2b).
Between 2006 and 2008, 11 percent was under-realized, while for 2009-2014, 32 percent of budget capital
spending was not executed.
Figure 3.2: Capital Expenditures a) Current and capital expenditures of SEE6 countries
2006-2013 (% of overall spending)35
b) Capital expenditures - budget vs outcome (% GDP)
Source: Ministry of Finance, World Bank FACE
database and World Bank staff calculations
Source: Ministry of Finance and World Bank staff
calculations
35 The FACE database was discontinued in 2014.
0%
20%
40%
60%
80%
100%
2006 2007 2008 2009 2010 2011 2012 2013 2014
Wages and Allowances Goods and Services Pensions
Unemployment Benefits Social Benefits Health Care
Other Transfers Interest Capital Expenditures
0%
10%
20%
30%
40%
50%
60%
70%
80%
90%
100%
KOS ALB BIH MKD MNE SRB SEE
Current expenditures Capital expenditures0.0
1.0
2.0
3.0
4.0
5.0
6.0
7.0
8.0
2006 2007 2008 2009 2010 2011 2012 2013 2014
originally budgeted capitalexpenditures
realized capital expenditures
percent of GDP

43
3.6. FYR Macedonia’s general government wage bill is below the average in the ECA region and
among the lowest in the SEE6 region. Macedonia’s general government wage bill at around 7.5 percent
GDP in 2013 was below the average of 8.7 percent of GDP for the ECA region and the second lowest in
the region of SEE6, after Albania. There is no publicly available data on the number of employees in the
public sector. Data from the State Statistic Office for Q3 2014 indicate that the number of employees
working in public institutions or companies of mixed ownership declined from 164,000 in 2010 to 155,971,
suggesting that the broader public sector employs 23 percent of employees. The general government wage
bill has remained stable since 200936, as the Government froze wages for the period 2009-2013. The central
government wage bill averaged 5 percent of GDP for the period 2009-2013 (Table 3.1).37 In fact, only
Albania and FYR Macedonia succeeded in limiting public sector salaries between 2008 and 2013 among
the SEE6 countries. (World Bank 2014c). Nevertheless, the government increased public sector wages in
2014 and also budgeted an increase for 2015. In addition, according to the Government’s program public
wage increases are foreseen throughout the period 2016-2018, contingent on macro-economic conditions.
Table 3.1: Central Government Fiscal Accounts
36 This includes transfers to municipalities for wages for kindergarten, primary and secondary teachers. 37 The Government adopted a new legislative framework for civil service and public employment in February 2014,
which is scheduled to be implemented in 2015. It introduces common principles to be respected by all state employees
and by creating a common regulatory framework. The legislative framework streamlines recruitment for both majority
and non-majority communities, putting more emphasis on merit. The new legislative framework will require detailed
data on public sector employees to be made publicly available (European Commission 2014).
Projections
% of GDP 2011 2012 2013 2014 2015 2016 2017 2018
Overall balance -2.5 -3.8 -3.9 -3.7 -3.4 -3.2 -2.9 -2.8
Primary balance -1.7 -2.9 -2.9 -2.8 -2.5 -1.9 -1.5 -1.2
Total Revenues (and grants) 29.6 29.6 28.1 28.1 28.1 28.1 28.1 28.1
Tax revenues 25.6 25.2 24.2 24.8 25.0 24.9 24.9 24.8
Taxes on goods and services 12.4 11.8 11.2 11.6 11.8 11.8 11.8 11.8
Direct Taxes 2.9 2.8 2.9 3.1 3.1 3.1 3.1 3.1
Social insurance contributions 8.6 8.7 8.5 8.3 8.3 8.3 8.2 8.2
Taxes on international trade 0.8 0.9 0.9 0.8 0.8 0.8 0.8 0.8
Other taxes 0.9 0.9 0.8 1.0 1.0 1.0 1.0 1.0
Non-tax revenues 2.8 2.7 2.4 2.2 2.1 2.2 2.2 2.3
Grants 0.2 0.7 0.7 0.6 0.6 0.5 0.5 0.5
Other revenues 0.9 1.1 0.7 0.5 0.5 0.5 0.5 0.5
Expenditures 32.0 33.4 31.9 31.8 31.5 31.3 31.0 30.8
Current expenditures 28.2 29.4 28.6 28.5 28.3 28.7 29.0 29.0
Wages and compensation 5.0 4.9 4.5 4.4 4.3 4.3 4.3 4.3
Goods and services 3.0 3.1 3.0 3.1 3.1 3.1 3.1 3.1
Interest payments 0.7 0.9 0.9 0.9 1.0 1.2 1.4 1.5
Current transfers 19.5 20.5 20.2 20.2 19.9 20.1 20.3 20.2
Pensions 8.5 8.8 9.0 9.2 9.3 9.5 9.6 9.6
Social assistance 4.9 5.0 4.7 4.5 4.4 4.4 4.4 4.3
Other social transfers 1.3 1.5 1.4 1.4 1.4 1.3 1.3 1.3
Other transfers 4.8 5.3 5.1 5.1 4.9 4.9 5.0 4.9
Capital expenditures 3.8 4.0 3.3 3.2 3.2 3.4 3.4 3.5
Capital investments 3.0 3.4 3.3 3.2 3.2 3.4 3.4 3.5
Capital transfers 0.8 0.6 0.0 0.0 0.0 0.0 0.0 0.0
Unidentified expenditure adjustment 1/ 0.0 0.0 0.0 0.0 0.0 -0.9 -1.4 -1.7
Financing 2.5 3.8 3.9 3.7 3.5 3.2 2.9 2.8
External (net) 4.4 0.9 1.1 5.2 -0.3 2.1 2.4 2.3
Domestic (net) -0.4 5.5 2.8 -0.3 -0.4 1.0 0.7 0.7
of which: privatization 0.1 0.0 0.1 0.1 0.0 0.0 0.0 0.0
Deposits -1.6 -2.6 -0.1 -1.2 4.2 0.0 -0.2 -0.3
1/ Cumulative amount of measures.
Note: Central government refers to the core government plus consolidated extra-budgetary funds. It excludes municipalities and
and the newly-formed Public Enterprise for State Roads (PESR).
Source: Ministry of Finance, World Bank staff estimates.

44
3.7. Interest spending is relatively low, but has increased since 2009. Interest expenditures have
almost doubled in nominal terms and increase in terms of GDP from 0.6 percent to 1 percent between 2008
and 2014 as central government debt increased from 23.0 to 38.1 percent of GDP. At the same time, the
implicit interest rate increased slightly from 3.7 percent in 2009 to 3.9 percent in 2014.
3.8. Spending on goods and non-labor services is low compared to most countries in the region.
Between 2009 and 2014general government spending on goods and services was reduced substantially from
5.3 percent of GDP in 2009 to 4.3 percent in 2014. During this period, goods and services spending averaged
4.6 percent of GDP, which is below the SEE6 average of 5.8 percent. Goods and services, include
maintenance spending and repairs as well as utility services and heating. Low spending on goods and
services has contributed to a deterioration of public assets, such as roads, schools and hospitals.
3.9. Social benefits account for most of current expenditures. Social benefits are by far the biggest
spending item, accounting for more than half of current spending. Social benefits include pension and
disability insurance (62 percent of social transfers), transfers to the Health Insurance Fund (28 percent),
social assistance (8 percent) and unemployment benefits (2 percent).
3.10. Pension38 related spending has been increasing steadily over the last years. A generous pension
indexation, cuts in contribution rates and transition costs associated with the introduction of a second pillar
have led to an increase in pension and pension-related spending from 8.8 percent in 2007 to 10.2 percent
of GDP in 2013, before declining to 9.6 percent in 2014 in terms of GDP as a result of FYR Macedonia’s
strong growth performance. Transfers from the central government to the pension fund were 4.5 percent of
estimated GDP in 2014. This included regular transfers as well as transfers to cover the deficit of the pension
fund as well as the transition costs (see Chapter 7 for a discussion of the pension system). Though, pensions
account for almost two-thirds of all social transfers only 14.1 percent of pensioners were poor (according
to 2012 data from the SSO) compared to 31.5 percent among the young and 26.2 percent among the overall
population.
3.11. Transfers to the Health Insurance Fund (HIF) account for around one third of all social
transfers. These transfers have remained relatively stable at around 4.5 percent of GDP since 2006 and
constituted around 78 percent of total health spending in 2013. Public health spending has been pro-cyclical,
with per capita GDP growth in the past decade, but with a lag. While similar to the average for other upper
middle-income countries, health spending is lower than some other Western Balkan countries (e.g., Serbia)
and the EU average. Globally, upper-middle-income countries spend an average of 6.7 percent of GDP on
health, of which 4.3 percent of GDP is public health spending. Nevertheless, total health spending in FYR
Macedonia is likely to be somewhat understated due to arrears in the health sector estimated at around 0.6
percent of GDP at end 2014 (see Chapter 4 for a discussion of the health sector).
3.12. Social assistance spending in FYR Macedonia is low and fragmented. Social assistance
spending declined from 1.2 percent of GDP in 2006 to 1 percent in 2010 and increased to 1.2 percent by
2014. This is considerably below SEE6, ECA and OECD averages. Social assistance programs include a
last-resort social assistance program (SFA), as well as other benefits such as child allowances, parental and
disability benefits. One of the main features of social assistance in FYR Macedonia is a plethora of various
cash benefits program. There exists a need to reduce the potential overlap of benefits, to clarify the relation
between categorical benefits and income-based benefits and to reform legislation so as to reflect more
accurately order, contents and regulation of cash benefits. The authorities have been reforming the social
safety net to enable it to better respond to above mentioned challenges. The recently introduced
Management and Information System has considerably improved the administration of the cash benefits
38 Defined as pension benefits only i.e. without health care benefits for pensioners and transitional costs

45
and reduced leakage to ineligible beneficiaries in the social assistance system. Administration of the cash
benefits through the CBMIS has reduced the time spent for processing payments of the cash benefits,
decreased the burden on employees in the Social Welfare Centers and created an appropriate database for
analysis of the cash benefits for the purposes of better policy making. The number of social assistance
recipients has also declined since the Cash Benefits Management Information System (CBMIS) was
introduced in late-2011, as possibilities for abuse of the system were considerably curtailed, thus
contributing to savings of about EUR 290,000 on a monthly basis. The efficiency of the social safety net
administration has been additionally strengthened by linking the CBMIS with the administrative registries
in the Employment Agency, Cadaster Agency and the Pension Fund. This exchange of information between
these agencies and the Ministry of Labor and Social Protection simplifies the registration procedures and
reduces the administrative costs for benefit claimants. The level of the intentional and unintentional errors
in administration of the cash transfers has also been reduced. Next steps for further strengthening of the
performance of the overall safety net could include the review of coverage, targeting, eligibility, and registry
systems for different social assistance programs. Despite FYR Macedonia’s relatively high unemployment
rate, spending on unemployment benefits is relatively small, declining from 0.6 percent of GDP in 2006 to
0.3 percent in 2014.39
3.13. Subsidies, mostly agricultural, increased in 2013 and 2014. They averaged around 1.8 percent
of GDP between 2008 and 2012 and grew to 2.2 percent in 2013 and 2014. Subsidies expenditures tend to
be very volatile throughout the year and tend to spike prior to elections (Figure 3.3a), raising questions
about the efficiency of subsidy spending, which is discussed below.
Figure 3.3: Subsidies and quality of capital spending a)Subsidies in MKD millions b) Structure of completed public construction works*
Source: Ministry of Finance. Source: State Statistics Office and World Bank Staff
* in % of overall public construction work
expenditures
3.14. Current transfers to local government have been steadily increasing from 0.6 percent of GDP
in 2006 to 3.1 percent in 2014. They include earmarked and block transfers for public order, education,
39 The system will be additionally strengthened by the new system for interconnectivity and data exchange between
the Ministry of Labor and Social Policy and 13 governmental institutions and agencies. These institutions will be
included in the system for data exchange and will avail the needed documents electronically thus increasing the quality
and efficiency of the social assistance administration. The important next steps for further strengthening of the
performance of the overall safety net could include the review of coverage, targeting, eligibility, and registry systems
for different social assistance programs. To address these deficiencies in the system the Ministry of Labor and Social
Protection has recently launched a review of social safety net benefits and services, the findings of which will feed
into development of strategic reform options.
0
1,000
2,000
3,000
4,000
5,000
6,000
Q1 Q3 Q1 Q3 Q1 Q3 Q1 Q3 Q1 Q3
2010 2011 2012 2013 2014
in M
KD
mill
.
Elections June 2011
Elections April 2013
ElectionsApril 2014
0.0
10.0
20.0
30.0
40.0
50.0
60.0
2002 2003 2004 2005 2006 2007 2008 2009 2010 2011 2012 2013 2014
Resconstruction and maintenance
Investment in infrastructure and industry
Investment in residential and non-residential buldings

46
recreation and culture. The biggest increase was in 2008, when the central government transferred the wage
bill for decentralized activities (kindergarten, primary and secondary education, fireman brigades and
culture) to local governments. Transfers to local governments increased from 2.5 percent of GDP in 2008
to 3.3 percent in 2013, before declining slightly to 3.1 percent in 2014. The majority of local government
revenues come from these transfers. Other revenues come from taxes, fees and charges.
3.15. Central government capital expenditures are below the SEE6 average. Capital expenditures
increased in terms of GDP between 2009 and 2012, but have declined since then as a significant part of
capital spending was move off budget in 2013. In the overall expenditure structure they accounted for
around 10-13 percent and have been below the SEE6 average of around 16 percent in the years between
2006 and 2013. Since 2006, capital spending has been constantly under-realized by, on average, 25 percent,
a level that has become more pronounced in the last few years. Under-realization is likely to come from
over-budgeting at the beginning of the year low absorption capacity among budget users and the fact that
capital expenditures were used as a residual to achieve the fiscal target. However, most of the capital
expenditures of budget users are directly related to the performance of non-tax revenues and foreign grants,
their main source of financing, which have also been under-performing. Hence, a significant part of the
under-execution of capital expenditure is in fact neutral to the budget deficit. Capital transfers (most of
which were to the PESR) have been moved out of the budget since 2013 in an attempt to improve execution.
3.16. The quality of capital expenditures appears to have declined significantly in recent years. The
share of investments in administrative buildings increased at the expense of investment in infrastructure
and maintenance. In 2008, 85 percent of all public investment was destined to infrastructure, while only 15
percent went to non-residential and residential buildings (Figure 3.3b). By 2012, investments in non-
residential and residential buildings doubled as a share of total public investment, reaching 33 percent.
Investment into sectors with long-term growth potential such as irrigation and transport equipment declined.
3.17. Payment arrears persist. The central government started accumulating budgetary arrears in late
2011 consisting of VAT refunds and goods and services payments. The central government started to clear
these arrears under an announced schedule of payments in September 2012, and by the end of February
2013, it had settled the previously announced amount and has taken steps to strengthen commitment
controls. Nevertheless, some arrears are still present as evident by the accumulated arrears in the health
sector (including the Ministry of Health) that amount to 0.6 percent of GDP and had been increasing since
2009. The arrears of the Ministry of Health come from the implementation of programs run by the Ministry
and executed by public health providers, which are not fully reimbursed by the Ministry afterwards.
Furthermore, even though there is no consistent publically available data on local governments there is
evidence of arrears buildup for utilities payments (especially in schools as often their accounts would be
blocked due to unpaid obligations), transport services etc.
Expenditures by functional and administrative classification
3.18. Social protection, economic affairs, health and education account for more than 70 percent
of the central government’s spending. Economic affairs40 are the biggest spending item, accounting for
more than 20 percent of overall expenditures (or around 6.1 percent of GDP on average between 2010 and
2013). Social protection is the second-highest item at around 18-20 percent of all expenditures and 5.8
percent of GDP, followed by health and education. Social protection has been the fastest-growing item over
the period 2010-2013, increasing from 5.2 to 6.4 percent of GDP, as the government implemented
40 The main components of the item are: general economic, commercial and labor activities; agriculture, forestry,
hunting and fishing; transport; other economic activities (which account for most of the spending in this category and
are largely comprised of goods and services spending).

47
substantial and ad-hoc increases in pensions and social security benefits. General public services have also
increased by around 1 percentage point of GDP between 2010 and 2013. Defense and spending on public
order41 declined by around 0.8 percentage points of GDP over the period 2010-2013.
Figure 3.4: Central government expenditure by functional and administrative classification a) Functional classification b) Administrative classification
Source: Ministry of Finance and World Bank staff
calculations.
Source: Ministry of Finance and World Bank staff
calculations.
3.19. Health spending declined slightly from 5.3 percent of GDP in 2006 to 5.1 percent of GDP in
2013. While similar to the average for other upper middle income countries, health spending in FYR
Macedonia is lower than some other Western Balkan countries (e.g., Serbia) and is also lower than the EU
average.
3.20. FYR Macedonia’s public spending on education amounts to 4.1 percent of GDP, of which
around 2 percent is related to the central government. This spending is somewhat higher than education
spending in other countries in the region like Serbia, Albania and Kosovo. Yet educational outcomes as
measured by the TIMMS are low.42 The amount of the transfers to primary and secondary schools for
recurrent expenditures is determined by a capitation-based formula. According to the ordinance governing
the distribution of the block grant for elementary and secondary education, the formulas consist of a lump
sum for each municipality, plus a standard amount per pupil, with additional adjustments for low density,
students teaching classes (in primary) and students in vocational training classes (in secondary) as well as
students with special needs. The central government is still responsible for capital investment in the primary
and secondary schools, while maintenance, student transportation and teacher salaries are covered by the
block grants. Tertiary education and pre-school education are still financed through inputs and line-item
budgets, with no linkage to the number of students or the quality of service.
3.21. Three budget users absorb more than half of the central government’s spending. The Pension
Fund, the Health Insurance Fund and the Ministry of Education accounted for more than half of the central
government spending over the period 2011-2013 (Figure 3.9b). The remaining 14 ministries accounted for
an additional 28 percent. The remaining first line budget users account for the rest. This structure has been
broadly maintained for the period 2011-2013.
41 Public order expenses are expenses for the police force and related public security institutions. These are grouped
with defense as per the definition of functional classification and are accounted separately from other services. 42 FYR Macedonia has not participated in a PISA since 2001. A PISA test is planned for 2015.
0%
20%
40%
60%
80%
100%
2010 2011 2012 2013 2014General public services Defense
Public order Economic affairs
Environ. protection Community protect.& dev.
Health Culture, religion&recreat.
Education Social protection
as % of overall spending
0%
20%
40%
60%
80%
100%
2011 2012 2013 2014
Pension Fund Health Insurance Fund
Ministry of education Other Ministries
Other government institutions
as % of overall spending

48
C. SPENDING BY GOVERNMENT LEVEL
General government spending
3.22. In FYR Macedonia, municipalities have relatively broad responsibilities compared to other
SEE6 countries. Municipalities are not only responsible for utilities like water, sanitation, solid-waste
management, local roads and basic social services, but they also assume important roles in primary and
secondary education, including paying teachers’ salaries and wages. Education accounts for the largest
share of local expenditure in FYR Macedonia, with teachers’ salaries and wages alone absorbing around
48.7 percent of local spending on average between 2011 and 2013. The biggest municipality in FYR
Macedonia is Skopje, which accounts for about 25 percent of the population and contributes around 45.6
percent of the country’s GDP.
3.23. General government public expenditures broadly followed the path of central government
expenditures. There has been an increase in general government expenditures in the years preceding the
2009 crises from 35.5 percent of GDP in 2006 to 40.3 percent of GDP in 2008 (Figure 3.5). The rise was
largely driven by increased expenditures in 2008 in capital, goods and services and transfers to local
governments. Since 2009, the average level of general government expenditures has been around 35 percent
of GDP. As expected, around 80 percent of the overall spending is done by the central government, while
local governments account for the remaining 20 percent.
Figure 3.5: General government expenditure composition (in percent)
Source: Ministry of Finance, World Bank FACE database and World Bank staff calculations.
*LG refers to Local Government and CG to Central Government.
3.24. FYR Macedonia’s local government spending has increased since 2006. Local government
expenditures increased from 4.0 percent of GDP in 2006 to 5.1 percent of GDP in 2014, as municipalities
assumed new responsibilities, for example, related to education spending. This is around the regional
average for the SEE6 countries of 5.3 percent, but significantly below the EU-11 average of 10.4 percent.
As local government spending increased, their share in overall general government spending climbed from
11 percent in 2006 to 16 percent in 2013. Education related expenditures, including teacher salaries and
utility expenditures for kindergarten primary and secondary schools, account for half of local government
spending. The remaining half is divided between goods and services, capital spending (mainly local roads
0
5
10
15
20
25
30
35
40
2006 2007 2008 2009 2010 2011 2012 2013 2014
LG Capital Expenditures
LG Interest
LG Transfers
LG Goods and Services
LG Wages
CG Capital Expenditures
CG Interest
CG Transfers
CG Goods and Services
CG Wages

49
and administrative buildings) and transfers. Central government transfers account for more than half of
local government revenues. The remaining half is largely accounted by fees and charges, followed by taxes
and some capital revenues. Transfers from the central government include unconditional grants, earmarked
transfers for operational costs in the areas of education, culture and social, block transfers for wages and
salaries and capital transfers.
3.25. The central government is directly responsible for capital investment in the primary and
secondary schools, while maintenance, student transportation and teacher salaries are covered by
block grants to the municipalities. According to the ordinance governing the distribution of the block
grants for elementary and secondary education, the formulas consist of a lump sum for each municipality,
plus a standard amount per pupil, with additional adjustments for low density, students subject teaching
classes (in primary) and students in vocational training classes (in secondary), and students with special
needs. Although these equitable funding formulas provide supplemental funding for students with greater
needs, there are no stipulations that require that supplemental special-needs funding is spent on special
needs children. A clear policy form the Ministry of Education how these supplemental funds are used could
help create more equitable learning conditions for students with special-education needs.
3.26. Moreover, the funding formula for Early Child Development seems unclear. The UNICEF
Financial study (2013) of Early Child Development (ECD) describes the funding formula as very unclear.
According to the Ministry of Labor and Social Policy (MLSP)’s explanation, it is calculated as a proportion
of the approved state funds for kindergartens divided by the actual number/enrolled number of children in
the public kindergartens at national level. It means that the budget is not determined based on actual needs.
Moreover, the funding formula is considered as a major obstacle for equitable ECD provision. The key
issues related to financing of the ECD include:(i) funding formula and funds allocation are based on
availability of infrastructure;(ii) the high state subsidies (75 % of the price) are going to children from better
off families; and (iii) ECD system is highly inefficient.
Public sector spending and contingent liabilities
3.27. FYR Macedonia’s SOE sector is of moderate size. The state’s ownership of economic assets
through SOEs accounted for around 15 percent of GDP in 2014. The most important SOEs are in the
transport and energy sector. In the transport sector, the two main companies are the Public Enterprise for
State Roads (PESR) and the maintenance company Makedonija Pat. In the energy sector, by far the two
biggest companies are the electricity producing company, ELEM, and the electricity transport company,
MEPSO, formed in 2005 out of the integrated electricity production company ESM. In addition, the state
is active in the financial sector as well through the Macedonian Bank for Development Promotion (MBDP).
The MBDP was established in 1999, but it has become more active since 2009 when a new Law on MBDP
was enacted. The main goal of the Bank is to promote development and exports by financing SMEs. Its
policies are supervised by the Ministry of Finance and in accordance with the banking regulations of the
National Bank of the Republic of Macedonia. MBDP is responsible for its liabilities, but state guarantees
are provided for its financing. Thus far MBDP has contracted four credit lines from the European
Investment Bank in a total amount of EUR 350 million. These credit lines are then extended to companies
in cooperation with local commercial banks, which handle the application and disbursement process.
Thanks to these credit lines, the bank increased its financial assets relatively fast, from EUR 60 million in
2009 to EUR 230 million in 2013.
3.28. The PESR was established through the amendments to the 2012 Law on Public Roads that
gave it the rights, responsibilities, employees, property, assets and archives of the Agency for State
Roads, then funded by the central government budget. The PESR is responsible for planning,
construction, reconstruction, rehabilitation, maintenance, protection of public roads and managing state

50
roads. Transfers from the State Budget (part of the oil tax); income from toll public roads and vehicles
registrations are its main sources of revenues. According to the 2013 Audit Report, around 50 percent of
the enterprise’s total revenues come from state budget transfers. This needs to be monitored carefully, since
European Systems of Accounts (ESA) 2010 includes corporations under the general government
classification if corporations produce non-market outputs and are controlled by the government. The share
of financing is one of the factors for determining the control. The annual program, the five-year program
and the public procurement plan for the PESR is publicly available. The enterprise is subject to the Law on
Public Procurement and an annual independent audit. While there are certain safeguards that limit fiscal
risks from the PESR,43 it would be good to undertake a broader public-sector debt and fiscal risk analysis
of the SOEs. This issue becomes more important given that the public debt stock projection for 2016 has
increased more than ten percentage points, from 37.6 percent to 48.2 percent of GDP, between last year and
this year’s Fiscal Strategy. A more in-depth discussion of the PESR is provided in Chapter 6.
3.29. Even though the functions of the electricity sector were unbundled in 2006, generation and
transmission are still owned almost exclusively by the state. Electricity is the most important energy
source in the FYR Macedonian economy, with a 53 percent share in total household energy consumption.
The state-owned electricity generation company ELEM provides 92.5 percent of the total electricity supply.
The state owns the electricity transmission company MEPSO and also has a 10-percent stake in the
electricity distribution company EVN Macedonia. In addition, the state has indirect influence over the
electricity market since prices at all stages of production are regulated by the national Energy Regulatory
Commission (ERC).
3.30. Regulated prices imply significant subsidization and market distortions. The ERC regulates
prices set by ELEM to the distributors, MEPSO’s transmission fees as well as retail prices set by EVN
Macedonia. A comparison against the regional peers show household electricity prices in FYR Macedonia
are about one-third of the EU15 average and the second-lowest in a group including New EU Member
States and the SEE6 countries. Low prices reflect on the electricity companies balance sheets, in particular
ELEM’s, since the companies have to absorb losses from selling below the market price. Moreover, the
practice creates significant market distortions by artificially raising the demand for electricity.
3.31. Electricity imports have been increasing. In FYR Macedonia, demand for electricity
increased at an average annual rate of 2.6 percent between 2000 and 2012. By contrast, annual
electricity production remained broadly stagnant over the same period. The gap is reflected in electricity
imports, which increased from 5 percent of electricity demand in 2000 to 32 percent in 2012. The increase
in demand came mostly from industrial users, even though household still had the highest share in total
electricity consumption in 2012: 38 percent.
3.32. Subsidizing the electricity sector and its imports imposes substantial contingent liabilities on
the Government. Subsidies were estimated to reach 2 percent of GDP in 2012. Electricity imports are
estimated to add another 1 percent. Distribution losses and payment shortfalls also reflect on the ELEM and
MEPSO’s balance sheets, and they are estimated to reach 0.2 percent of GDP in 2012, leading to a total of
3.3 percent (Table 3.2).
43 For example, financial and investment plans of all SOEs need to be by the Government and all SOEs need to
report quarterly to the Government about the status of implementation of their projects.
51
Table 3.2: Quasi-Fiscal Losses in the Electricity Sector, 2006-12 (in percent of GDP)
2006 2007 2008 2009 2010 2011 2012
4.1 Loss from subsidization 1.9 3.4 3.0 1.6 0.9 1.8 2.0
4.2 Losses from imports 0.6 1.6 1.5 0.5 0.3 0.9 1.0
4.3 Excess distribution losses 0.7 1.0 1.2 0.8 0.6 0.2 0.0
4.4 Payment collection shortfalls 0.5 0.4 0.4 0.5 0.4 0.2 0.2
Total contingent liabilities 3.7 6.4 6.2 3.3 2.1 3.0 3.3
Source: World Bank estimates based on Tieman (2011) and data from Energy Regulatory
Commission and EVN Macedonia.
3.33. In the past, the weak balance sheets in the electricity sector have imposed direct fiscal costs.
In November 2006, the government injected EUR 20 million (0.3 percent of GDP) into MEPSO (at that
time also the wholesale supplier of electricity) to help offset its losses from buying at high prices abroad
during the energy-intensive winter months. A further 0.3 percent of GDP was allocated to MEPSO in 2007
as part of the supplementary government budget, and another 0.2 percent in the 2008. Due to their weak
profitability, ELEM and MEPSO often needed to have their borrowing for capital investment projects
guaranteed by the state in order to keep down interest costs. These guaranteed loans (which reached EUR
216 million, or 2.8 percent of GDP by end-2013) add to the already significant levels of government debt
and their servicing costs are a potential drain on fiscal resources in years when ELEM and MEPSO will
record losses.
3.34. Contingent liabilities have been reduced since 2008 due mostly to a set of policy measures.
These are: (a) ELEM’s wholesale selling price has been increased by a cumulative 72 percent since 2008
although it still remains at below market-clearing levels as of 2013. (b) As of September 2008, the ten
largest industrial users are required to purchase electricity at prevailing market prices. (c) As of October
2012, the EVN Macedonia can import electricity directly instead of ELEM, which removes the
subsidization of ELEM imports. (d) The fiscal burden of “excess” distribution losses has also been reduced,
since the energy law was amended in 2008 to require EVN Macedonia to pay market price to ELEM for
any losses above the pre-agreed technical threshold rate. In 2011, the law was amended further to require
EVN Macedonia to pay market price for all distribution losses. (e) As a result of efforts to crack down on
grid theft, to educate customers on payment options, and to streamline invoice deliveries, EVN Macedonia
has managed to dramatically improve payment collection, from a rate of 75 percent when it took over the
distribution network in 2006 to 92 percent in 2012.
D. EFFICIENCY
Allocative efficiency
3.35. Allocative efficiency refers to the capacity of the government to distribute resources in order
to meet its strategic objectives. This requires strategic planning and an ex-post evaluation of the ongoing
programs. Ideally, the government should prioritize spending that yields the biggest social and economic
return.
3.36. FYR Macedonia’s composition of spending is broadly aligned with the strategic objective of
the government. The Government’s strategic objective is to boost growth by attracting foreign investors,
improving competitiveness though business-climate reforms and infrastructure development while
protecting the poor and improving the quality of life of the farmers. This vision is clearly visible in the
recent budget allocations and is reflected in increased pension spending, agricultural subsidies and lower
taxes. However, the under-execution of capital spending is not in line with this vision. The government has
addressed this by moving a significant part of infrastructure of budget, which – though reducing budget

52
transparency – has helped improve the execution of capital spending. Moreover, while public investment
has contributed to short-term job-creation and growth in 2013 and 2014, the economic and social return of
these investment could have been optimized if the government would have prioritized projects with a high
growth potential and social impact.
3.37. While access to education has improved, there is a strong disconnect between the skills
nurtured by the education system and those needed by the private sector, as companies complain
about the lack of quality and availability of desired skills despite high unemployment. Gains in the
education sector have been noticeable over the last few years as secondary-school enrollment rose and the
physical and learning environment in primary schools improved. However, the overall quality of primary
and secondary education has not improved significantly as measured by international tests. Improved
quality in elementary education can be achieved by sustained investment in teaching aids (as already
planned) and in teacher training. Quality improvements can also be fostered by using an incentive program
similar to the School Improvement Grants. Another item to consider would be increasing the hours of
instruction, particularly in primary education, which are significantly fewer than in other comparator
countries.
3.38. It is not obvious that social transfers are well-targeted to the poor. Despite significant social
transfers, poverty remains high in FYR Macedonia. It stagnated at 27 percent over the period 2010-2012.
The social assistance program is relatively small, around 1.6 percent of GDP.44 Pensions constitute the
biggest share of social spending, accounting for almost two-thirds of all social transfers. Recent data from
the SSO suggest that in 2012, only 14.1 percent of pensioners were poor, compared to 46.5 percent of the
younger population. There are also inequities in access to health care. For example, immunization rates
tend to be lower among children in the poorest quintile and the Roma population. Also, low coverage and
inequity in preschool and early child development education could entrench poverty.
Economic efficiency relative to other countries
3.39. According to the Public Sector Efficiency (PSE) index, FYR Macedonia’s efficiency of public
spending has improved since 2006 but remains relatively low.45 FYR Macedonia’s PSE index improved
from 1.06 in 2006 to 1.13 in 2013. However, Macedonia’s total PSE index in 2006 and 2013 is below the
trend line, suggesting that either better results could be achieved with the same level of spending or the
same results could be achieved with less public resources. Overall, FYR Macedonia ranked 10th out of 16
countries in PSE in 2013. FYR Macedonia’s overall score in the PSE index was 2.5 percent below the 16-
country average, but 0.9 percent above the average of New EU Member States.
44 Including social benefits or around 1 percent of GDP and unemployment benefits of around 0.6 percent of GDP. 45 The Public Sector Efficiency (PSE) index is calculated by comparing public sector performance scores to
government spending, which used to achieve the given performance level. See, Afonso, Antonio, Ludger
Schuknecht, and Vito Tanzi, 2003, “Public Sector Efficiency: An International Comparison” European Central
Bank, Working Paper No. 242.

53
Figure 3.6: Public expenditures and PSE index a) 2006 b) 2013
Source: WB staff calculations. Source: WB staff calculations.
3.40. Public-sector efficiency varies significantly across functions. According to PSE indicators, FYR
Macedonia is least efficient in the areas of education (16th out of 16), income distribution (14th) and
infrastructure (13th). Furthermore, the efficiency of public expenditures in education and infrastructure
seems to have declined between 2006 and 2013. In education, relative performance fell despite increased
outlays. In 2013, FYR Macedonia’s spending on education (4.1 percent of GDP) was the highest in the
region, but all of its performance indicators were below the regional average.46 In infrastructure, an
increased spending resulted into better public infrastructure performance index; yet, other countries spent
fewer resources to achieve the same output. Macedonia performed best on administration and stability (3rd
out of 16 for both).
3.41. A comparison of actual spending with the minimum spending necessary to achieve the same
output suggests that more than 13 percent of public spending in FYR Macedonia could be saved,
which is about average for a Central European economy. The efficiency of an input-output combination
is measured relative to a production possibilities frontier constructed with data envelopment analysis
(DEA), a non-parametric method. Given the focus on efficient spending, the input approach is used. Using
per-capita public expenditures and per-capita GDP (at PPP, in constant US$) as inputs and the equal-weight
PSE index as the output variable, FYR Macedonia’s total spending appears below the efficiency frontier,
with an efficiency score of 0.868. This implies that the same amount of output could be achieved with 13
percent less resources. FYR Macedonia’s performance ranks in the middle when compared against the 16
Central European Economies because other countries such as Croatia and Slovakia have extremely low
efficiency scores (0.488 and 0.392, respectively). The defined efficiency, however, is only an upper bound
of the “true” efficiency, because the countries that perform the best may still have room for improvement.
Between 2006 and 2013 relative efficiency scores for FYR Macedonia improved and the country achieved
a higher ranking in the overall efficiency measured by the PSE index.
Education
3.42. According to the Data Envelopment Analysis (DEA),47 the efficiency of education spending
has remained constant in FYR Macedonia's since 2006. Secondary enrollment stayed around 80 percent
46 See the list of indicators in Table A1 in Annex 1. 47 Measuring the efficiency of public spending requires information inputs (e.g. public spending) and achieved outputs.
Currently, one of the most common techniques used for efficiency analysis is the Data Envelopment Analysis (DEA).
The objective of the DEA is to estimate the maximum possible production given a set of inputs or the minimum
y = -0.0236x + 2.0849R² = 0.3943
0.60
0.80
1.00
1.20
1.40
1.60
1.80
20.0 25.0 30.0 35.0 40.0 45.0 50.0 55.0
PSE
Ind
ex,
regi
on
al a
vera
ge=1
Public expenditures, % GDP
y = -0.0282x + 2.3163R² = 0.5898
0.60
0.80
1.00
1.20
1.40
1.60
1.80
2.00
20.0 30.0 40.0 50.0
PSE
Ind
ex,
regi
on
al a
vera
ge =
1
Public expenditures, % GDP
MKD
MKD

54
as public spending on education remained constant. When measured using quality of education in science,
technology, engineering and mathematics (STEM) as output, FYR Macedonia's spending efficiency fell
slightly. This decline follows a general trend in the group of comparator countries. Those previously ranked
above FYR Macedonia (Romania, Czech Republic and Serbia) saw their efficiency scores tumble to a larger
extent than FYR Macedonia's. A major factor behind these declines is the lower STEM education quality
scores these countries were assigned in the 2014-2015 Global Competitiveness Report. When output is
measured as university graduate employment rates, FYR Macedonia's efficiency score fell significantly,
but it remained close to the frontier compared to its country group. The gap between countries on the frontier
and those in the interior remained large. In terms of primary school teacher-pupil ratio, FYR Macedonia is
at the frontier in 2013 as a result in the decline of students and the hiring of new teachers.
Figure 3.7: Some examples of the efficiency of education expenditures
Source: WB staff calculations.
3.43. The quality of primary and secondary education seems to have declined. Gains in the education
sector have been noticeable over the last few years, especially with regard to increased enrollment at the
level of secondary education and improvements of physical and learning environment in primary schools.
However, the quality of primary and secondary education has not improved significantly over the last
several years, as measured by international tests. The levels of skills and knowledge of Macedonian students
lag behind those of students in comparable countries. For example, on PIRLS 2006, which assesses children
in the fourth year of formal schooling on a range of reading comprehension strategies, fewer children
reached the lowest benchmark in FYR Macedonia (55%) than all neighboring and EU countries which
participated (the next lowest was 83% for Slovenia). On the TIMSS assessment, which test children in
possible cost of a set of outputs. The DEA is based on a non-parametric linear programming methods to fit a linear
hull around the data, under the assumption that the hull accurately approximates the underlying frontier. The
fundamental assumption of the DEA is input-output separability (see, Theil 1980). Where more than one output is
used, this means that inputs are used in ratios unrelated to the output ratios.

55
grade 8 in mathematics and science, Macedonia did significantly worse between 1999 and 2011 as the
average mathematics score fell from 447 to 426, with no other European country scoring less. The
proportion of FYR Macedonian students who achieve the minimum standard (the ‘low international
benchmark’) fell from 70 percent to 61 percent in mathematics and from 73 percent to 53 percent in science.
3.44. The government could take several steps to strengthen the quality of elementary and
secondary education. Improving elementary education can be achieved by sustained investment in
teaching aids (as already planned) and teacher training. Quality improvements could be fostered by using
an incentive program similar to the School Improvement Grants.48 An item to consider would also be
increasing the hours of instruction, particularly in primary education, where they are significantly fewer
than in other comparator countries. Effective implementation of compulsory secondary education, in
addition to complete coverage of the cohorts, must ensure that students get access to good quality four-year
programs, while the three-year programs should either be phased out or substantially revised with
involvement from the private sector in order to make them more relevant to labor market needs.
3.45. Enrollment in the tertiary education has been increasing rapidly in recent years, but its
efficiency remains low. While critical data on student learning and graduate employment outcomes do not
exist, a 2010 World Bank survey of employers showed they continue to find it difficult to find workers with
the skills they require, particularly those needed for newly created jobs in modern and dynamic firms. The
lack of internal and external quality-assurance mechanisms constrains the enhancement of quality and
relevance of higher education. Procedures for monitoring quality are, to a large extent, insufficient and
need to be better aligned with recent European developments. The Board for Higher Education
Accreditation and Evaluation has focused only on the accreditation of institutions and study programs thus
far. The next step should include an external evaluation of higher education institutions, and the linking of
evaluation outcomes with institutional accreditation.
3.46. FYR Macedonia seems to lack a strategic framework for monitoring student learning
outcomes and quality enhancement. The Matura examinations were introduced in 2008 with the aim of
certifying students’ completion of secondary education and facilitating students’ selection to universities.
FYR Macedonia also used to have a very efficient and publicly recognized National Assessment of primary
education, which was recently replaced by a massive, census-type external assessment. The aim of this new
assessment is to evaluate the objectivity of teachers’ grading. The government recently renewed its
commitment to participate in international large-scale assessments such as the TIMSS and PISA, which
would help the Ministry of Education and Science compare the country’s education outcomes with those
of other countries. While this is an important commitment, the World Bank SABER Review of Student
Assessments49 concluded that Macedonia could improve its different types of assessments by, for example,
putting mechanisms in place to monitor the impact of exams on the quality of teaching and learning in the
Matura assessment.
3.47. Information on labor market conditions and tertiary education outcomes is fragmented,
incomplete and are not directly available to the stakeholders. There are no mechanisms in place for
regular data collection and analyses of the tertiary system outcomes, i.e. whether students graduate with the
competencies demanded by the job market and whether they find jobs. There are no surveys to help
forecasting what new skills will be required by the labor market in the long term or that will provide data
on the characteristics of the firms that may have jobs available in the country. Improving the quality and
scope of information on labor market conditions and tertiary education outcomes is one side of the solution,
48 The State Education Inspectorate performed an evaluation of a representative sample of schools after the
implementation of the first School Improvement Grants round and found that 83% of the schools have improved the
quality of teaching and learning. 49 A World Bank initiative to benchmark learning assessment policies and systems in developed and developing
countries around the world

56
but equally important is to make information available to the stakeholders and to use the data effectively in
improving the performance of the education system and labor market outcomes.
Health
3.48. Macedonians are about as healthy as people in other SEE6 countries, but less healthy than
people in the EU, and inequalities in health outcomes persist. Infant mortality was 7 per 1,000 in 2012,
which is close to the SEE6 average, but higher than the EU average of 4.1 per 1,000. Infant mortality,
however, remains was twice the average in some regions and is even higher among the Roma. In 2011, 4.9
percent of all children under age five suffered from chronic malnutrition caused stunting. The rate was
around three times higher among Roma children and in the southwest region. Due to a combination of aging
population and progress in addressing maternal and child health, the most frequent causes of death are now
circulatory disease. Elevated smoking rates, worsening dietary habits, and hypertension constitute the major
risk factors in Macedonia, with long-term implications for productivity and health system costs. Macedonia
also has one of the highest per capita rates of cigarette consumption in the world (nearly 25 cigarettes
smoked per day on average) (World Bank 2013). Yet, primary care and preventive medicine are
underfunded and the excise tax rate for tobacco products is only about 39 percent in Macedonia.50 The
Government is planning to increase in cigarette excise taxes which seems a “double win” – raising
additional revenues and discourage smoking. Macedonia has achieved equitable coverage of basic maternal
and child primary care preventive services (immunization, antenatal care, deliveries). Deliveries in health
facilities are nearly universal, and over 90 percent of children are fully immunized, with slightly lower rates
among the poorest quintile (86 percent). Yet, only 63 percent of Roma children are fully immunized (MICS
2011).
3.49. Health spending suffers from inefficiencies. Health spending in FYR Macedonia is now lower
than in some other SEE6 countries, such as Serbia, and in the EU on average. Yet, there is scope for
efficiency gains. The government provides special subsidies to hospitals whose expenditure exceed the
financing justified by their outputs, which limits resources available for better-performing hospitals. A
combination of increased hospital costs, flat outlays, and limited progress in politically difficult reforms
(particularly hospital restructuring and benefit-package management) is contributing to hospital deficits,
rationing of care, and increased out-of-pocket expenses by the population. In particular, primary and
preventive care seem to be underfunded. Fiscal savings from reducing subsidies to less performing
hospitals, rightsizing hospitals and reduction in pharmaceutical costs, could be used to appropriately fund
primary and preventive care. A detailed discussion of how to improve the efficiency of health spending is
presented in chapter 4.
Public infrastructure and maintenance
3.50. The efficiency of public investment seems to have declined slightly. Looking at the public
infrastructure index when public investment expenditures per capita and GDP per capita PPP are used as
inputs, FYR Macedonia's efficiency score for public infrastructure spending is close to the efficiency
frontier in both 2006 and 2013. However, it fell slightly in 2013 from 1 in 2006 to 0.98 in 2013, though the
fall was not as dramatic as in Bulgaria, Poland, and Czech Republic. Yet, the reduced efficiency score
suggests that the same output could be achieved with 2 percent less total public investment expenditures.
Detailed investment data also shows that the share of investment in administrative buildings increased at
the expense of investment in infrastructure and maintenance in recent years. In 2008, 85 percent of all
public investment was destined to infrastructure, while only 15 percent went to non-residential and
residential buildings. By 2012, investments in non-residential and residential buildings doubled as a share
of total public investment, reaching 33 percent. As the country is targeting higher infrastructure spending
50 See http://www.tobaccoatlas.org/solutions/tobacco_taxes/excise_tax/

57
in the coming years, reversing the decline of efficiency in public investment spending should become a
priority. A detailed discussion of how to improve the efficiency of transport investment is presented in
chapter 5.
3.51. Maintenance of buildings and infrastructure has been under-provisioned for years, leading
to a large backlog. Between 2009 and 2013, general government spending on goods and services averaged
4.7 percent of GDP, which is below the SEE6 average of 5.8 percent and the average of New EU Member
States of 6.3 percent. Goods and services include maintenance spending and repairs as well as utility
services and heating. Low spending on goods and services has contributed to a deterioration of public assets,
such as roads, schools and hospitals. Since 2013, road maintenance is funded through the PESR and
implemented by the publicly-owned Makedonija Pat. While the Government has received significant
external funding for road maintenance for the period 2013-2015, there exist no reliable estimates of
maintenance needs nor is there a strategy for providing appropriate maintenance spending over the longer
term. If unaddressed, this problem will lead to significant additional costs for the Government and road
users. Simulations suggest that for every additional dollar the Government spends on the maintenance of
roads, users would save 3.48 dollars. A detailed assessment how to improve maintenance in the road sector
can be found in chapter 5.
Agriculture subsidies51
3.52. FYR Macedonia’s agriculture sector plays a prominent role in its contribution to GDP, jobs,
foreign trade, and household consumption. Agriculture accounted for 10 percent of Macedonia’s GDP
on average in 2006-2011, 19 percent of the labor force, 15 percent of total exports, 20 percent of
employment and 40 percent of household’s consumption. In fact, agriculture is more important in terms of
GDP and employment in FYR Macedonia than in other ECA countries. Fragmented, poorly equipped and
with obsolete technology, agriculture’s contribution to growth averaged 1.4 percentage points between
2006 and 2014. Around 30 percent of the country’s arable land is not cultivated and only a fifth of the area
with irrigation facilities is actually irrigated.
3.53. FYR Macedonia spent 2.1 percent of GDP on agricultural support programs in 2012. These
programs provide generous recurrent subsidies to farmers; they account for more than 90 percent of the
agricultural budget. The latter is not only large in terms of GDP, but spending per hectare is above the EU-
27 average. Farmers in the EU-11 member states receive EUR 200 per hectare and those in the EU-15
receive about EUR300, with only a few countries paying EUR 400-500 per hectare. The estimated average
payment in FYR Macedonia is EUR 344. If the tobacco output subsidy were to be converted into a per-
hectare payment (assuming an average yield of 7,500 kg per ha), the total payment would reach EUR 382
per hectare. The Government plans to further increase the agricultural budget from EUR 130 million in
2013 to EUR 140 million in 2015. Yet, the strategy alignment of the agricultural support program is weak.
3.54. The first stated objective of the program –to improve the social well-being of farmers – has
been met with some success. Large subsidies are disbursed to small farms, due both to the nature of the
farm structure in FYR Macedonia and by design, as direct transfers are tailored to small farms and have
low eligibility requirements. However, large farms still receive a disproportionally high share of the
subsidies. Out of 56,786 farms that applied for direct crop payments in 2011, 47,910 had less than 3 hectare
of agricultural land (Table 3.3). This group received half of the total crop area direct payment disbursements
– about EUR 16 million out of the total €33 million in disbursements. Yet the total benefit per farm for this
group averaged EUR 290, ranging from EUR 159 for farms up to 0.5 ha to EUR 444 for farms with up to
3 ha. On the other hand, farms with more than 10 ha (2 percent of the total number of farms) received 28
51This section draws on World Bank (2013b) “Analysis of The Agricultural Support Programs in FYR Macedonia”,
mimeo.

58
percent of the total subsidy disbursements, accessing disbursements of EUR 7,708 per farm. Among all
programs, the tobacco subsidy provides the most benefits to small farms, but it locks them into production
activities that may have less potential for future growth.
Table 3.3: Distribution of land-based direct payments in 2011 Size of land
holdings (ha)
No. of farms that
applied for direct
crop payments
% of
farms
Total land
area (ha)
Subsidy
disbursed
(‘000 EUR)
Average subsidy
per farm (EUR)
< 0.51 9,598 16.9 3,332 1,525 159
0.51-1.00 13,584 23.9 10,031 3,607 266
1.01-3.00 24,728 43.5 43,340 10,973 444
3.01-5.00 5,246 9.2 19,778 4,092 780
5.01-8.00 1,868 3.3 11,444 2,086 1,117
8.01-10.00 582 1.0 5,336 1,140 1,958
>10.00 1,180 2.1 67,610 9,095 7,708
TOTAL 56,786 100.0 160,871 32,517
Source: World Bank staff estimates based on ARD-Paying Agency data.
3.55. The program could be improved to better target poverty reduction. The agricultural support
programs provide benefits to about 80,000 households, according to the ARD-Paying Agency, while the
2007 Agricultural Census identified about 193,000 households who identified themselves as farming
households. Only 110,000 rural households are registered in the National Farm Registry and, thus, eligible
for agricultural payments, yet the 80,000 unregistered farm households are most likely to be among the
poorest.
3.56. Subsidies may also not be well designed to meet the target of increasing international
competitiveness for the following reasons: (a) most of the funding goes to income support, while only a
fraction is invested, yet the total share of funding destined for investment increased from 10 percent tin
2009 to 21 percent in 2014; (b) in specific subsectors such as tobacco, subsidies now contribute a significant
share of the cost of production, which distorts investment incentives. A recent analysis carried out by the
Bank’s Agriculture and Rural Development (ARD) team found that actual disbursements under these
programs have been dominated by direct payments, which accounted for about 96 percent of total
disbursements between 2008 and 2011; (c) a relatively small share of subsidies is destined to products with
a high export share (Table 3.4). The Government has started to scale up advisory programs to farmers with
the objective of increasing the investment share of agricultural support programs from 10 to 25 percent over
the next five years.
Table 3.4: Comparison of exports vis-à-vis direct payments in 2011
(in percent) Products Share of exports in total
agri-food exports (%)
Share of direct
payments (%)
Field crops (exc. tobacco) 0.0 12.8
Tobacco 25.5 27.2
Fruits and vegetables 30.4 11.0
Grapes/wine 15.8 15.0
Livestock products 7.4 21.5
Dairy products 2.0 7.6
Source: State Statistical Office and ARD-Paying Agency.
3.57. Despite potentially high benefits, the level of public funding for irrigation development and
water infrastructure is negligible at present. During the socialist era, Macedonia set a target to irrigate

59
120,000 ha of agricultural land, but irrigation peaked at around 80,000 ha in the late 1980s52. That figure
has fallen to 33,000 ha, even though existing reservoirs and irrigation networks could irrigate a total of
162,500 ha. This is only 20 percent of Macedonia’s total area with irrigation potential. Some estimates
suggest that up to half of the currently irrigated areas rely on energy-intensive groundwater extraction,
while the available reservoirs are suitable for much more efficient gravity irrigation.53
3.58. The presence of high import protection decreases the impacts of the scaled-up agricultural
public expenditures. High import tariffs have an adverse effect on the off-season capacity utilization of
the food processing industry and its modernization outcomes, including the number of applications for rural
development funds. The import tariffs for fruits and vegetables in Macedonia are higher than in the EU and
its tariff schedule does not provide for lower off-season tariffs, as is the case in the EU. Fruits and vegetables
produced off-season domestically in greenhouses are better sold on fresh markets than utilized for
processing. High import protection, therefore, dampens the link amongst agricultural support,
competitiveness, and sustainable growth.
3.59. Increasing the efficiency of agriculture spending could have considerable positive spillover
effects on the rest of the economy by boosting overall growth, reducing rural unemployment and
increasing shared prosperity. Policy options include to: i) focus subsidies better on the provision of public
goods, such as irrigation, advisory services and applied agriculture research; ii) improve the targeting of
subsidies to subsistence farmers in close coordination with social welfare programs; iii) improve
agricultural land markets through farm consolidation, privatization of state-owned agriculture land and
better cadaster registration; and iv) reduce off-season tariffs for raw materials for the food processing
industries. The government’s decision in May 2013 to privatize state-owned agricultural land and recent
legislation on farmland consolidation may provide an impetus to the sector’s restructuring and for farm
consolidation.
E. CONCLUSIONS
3.60. FYR Macedonia could achieve the same public sector outcomes with significantly less
resources. Efficiency of public spending remains particularly low with respect to education, infrastructure
and income distribution. Also, maintenance spending seems largely inadequate. Social spending is small
and fragmented. Health sector spending suffers from inefficiencies with respect to health care provision,
with inadequate quality of some health services and underfunded primary and preventive care. Finally,
reducing and better targeting agricultural subsidies would improve the efficiency of public spending.
3.61. The Government could take several steps to improve the quality of education. Providing
training to primary and secondary teachers and increasing the hours of primary teachers could help to
strengthen the quality of primary and secondary education. Tertiary education could be improved by
coordinating the curriculum with the private sector and by introducing capitation financing for tertiary
education. Developing a strategic framework for monitoring student learning outcomes, particularly, if
combined with detailed information on labor market conditions, could provide a useful basis for policy
decisions.
3.62. Strengthening public investment management will be important to ensure that economic
returns on investment are high. The Government should carefully assess maintenance needs and ensure
appropriate funding for maintenance over the medium-term. It should also identify projects with high
economic returns and prioritize them.
52 World Bank. (2011). “Water Security in FYR Macedonia through Strengthening of Water Economies.” World Bank
Report, Washington DC. 53 Data on groundwater use are particularly sparse.

60
3.63. Agriculture subsidies could be reduced and targeted more towards improving investment.
Subsidies are high by regional standards have not been well designed for providing income support,
increasing investment and strengthening competiveness. Reducing the overall level of agricultural subsidies
while channeling a higher share to public goods and improving the targeting of those subsidies that are
intended for income support to subsistence farmers would significantly increase the efficiency of subsidy
spending.
3.64. Public expenditures could also be targeted better towards those in need. Pensions absorb a
very large share of social transfers, though – according to SSO statistics – pensioners are less poor than
other parts of the population. Social assistance is relatively small. An important next step for further
strengthening the performance of the overall safety net could include the review of coverage, targeting,
eligibility, and registry systems of different social assistance programs. The government could also provide
more equitable funding for Early Childhood education, specify the use of supplemental education funds for
children in need and improve the targeting of subsidies to subsistence farmers.

61
CHAPTER 4. FISCAL SUSTAINABILITY
A. INTRODUCTION
4.1. Meeting the country’s investment needs without jeopardizing fiscal sustainabilty and harming
growth is a crucial priority for the government. Public investment in infrastructure is at the core of the
FYR Macedonia’s vision of development. As the country faces the challenge of ensuring adequate energy
supply and improving logistics performance, investments in the energy sector and the development of road
and railway infrastructure are top priorities for the Government. At the same time, spending on pensions is
on the rise due to changing demographics and policy decisions. With the exception of pensions and
agricultural subsidies, there seems limited room for significantly cutting expenditures in the medium term
given the relatively small size of the government. On the revenue side, the Government is committee to
maintaining its current policy of low taxes, considering it to enhance private investment and economic
growth. Given its fiscal constraints and weak capital budget execution, the Government has shifted a large
part of public spending to SOEs, which are de facto implementing the government’s agenda. While this is
likely to increase execution of capital spending, it has reduced budget transparency. This chapter therefore
focuses on the evolution of public and publicly guaranteed (PPG) debt, which includes the large majority
of SOE contracted loans.
4.2. Going forward, a sound prioritization among various policy initiatives will be necessary to
prevent a rapid build-up in public debt.54 Assuming that the Government implements the fiscal
consolidation path outlined in its medium-term fiscal framework 2014 and 2016 and does not contract any
additional external loans for SOEs beyond the current pipeline, public debt is projected to increase to 53.3
percent of GDP by 2019. Failing to implement the central government fiscal consolidation path would push
the public debt-to-GDP ratio to 58.8 percent by 2019. The implementation of several policy initiatives over
the next five years would lead to a rapid build-up of debt, potentially rendering it unsustainable. In fact, if
all investment projects were implemented public debt would raise to 61.7 percent, pushing it over the 60-
percent-of-GDP limit that the Government has proposed to implement as a debt ceiling. Absent a policy
change on pensions, public debt is expected to reach 68.1 percent (assuming that only the current pipeline
of investment projects is implemented). The Government would need to carefully assess the costs and
economic returns of current policy initiatives and appropriately prioritize and sequence them in order to
achieve its development objectives while preventing public debt from becoming unsustainable.
4.3. This chapter is structured as follows: It first describes historical public debt dynamics and structure.
Section C presents the baseline scenario of the public debt sustainability analysis. Section D explores policy
changes related to fiscal consolidation, government investment, pensions and revenues on FYR
Macedonia’s public debt. Section E assesses fiscal rules in the Macedonian context. The final section
concludes.
B. EVOLUTION AND COMPOSITION OF PUBLIC DEBT
4.4. FYR Macedonia’s public debt has increased in recent years, but remains manageable and
significantly below the SEE6 average. In 2007 FYR Macedonia managed to pre-pay part of its debt
towards the Paris and London club leading to a decline in the debt level from 33.2 to 23.0 percent of GDP
between 2006 and 2008. Nevertheless, the debt dynamics since 2008 had changed as a result of increased
borrowing both by the Government and by SOEs and increasing primary deficit level. This led to an increase
of the debt level from 23 percent in 2008 to 40.5 percent. By comparison, public debt in the SEE6 region
increased from an average 29.8 percent in 2008 to 49.3 percent in 2013 as Albania, Bosnia and Herzogevina,
54Public debt refers to PPG debt throughout this chapter.

62
Montenegro and Serbia also experienced a rapid rise in public debt (Figure 4.1b). Though the gap with the
SEE6 average has declined, FYR Macedonia’s public debt-to-GDP ratio as of end 2013 remains below the
SEE6 average and among the lowest debt ratios in the ECA region. In 2014, public debt climbed to 46
percent of GDP as the country issued a EUR500 million Eurobond at favorable terms to pre-finance the
repayment of a EUR150 million Eurobond and repayments to the IMF in 2015. FYR Macedonia’s credit
rating according to Standard and Poor’s rating agency has been BB for several years, the highest in Southe
East Europe
Figure 4.1: Public debt by categories and across SEE6 countries
a) Government levels (in percent of GDP) b) Public debt in the SEE6 countries (in percent of GDP)
Source: MOF; World Bank Staff calculations. Source: World Bank Staff calculations.
4.5. The increase in public debt was largely driven by sustained primary deficits. Between 2009 and
2014, much of the increase was attributable to increases in the primary deficit-to-GDP ratio, which averaged
2.5 percent during this period. Amongst other elements of public policy, the real interest rate made a modest
contribution towards increasing public debt during this period. Real exchange rate depreciation led to an
increase in public debt in 2010. Real GDP growth played a part in stemming the growth in the debt-to-GDP
ratio, with strong contributions between 2006 and 2008 – before the crisis – and more recently in 2013 and
2014 (Figure 4.2a).
Figure 4.2:Public Debt Dynamics a) Contribution to changes in public debt b) Gross versus net central government debt
Source : MoF; World Bank Staff estimates. Source: MOF; World Bank staff estimates.
0
10
20
30
40
50
20
02
20
03
20
04
20
05
20
06
20
07
20
08
20
09
20
10
20
11
20
12
20
13
20
14
Central Government Funds
Municipalities Guaranteed debt
56
21
33
38
43
55
31
23
32 33
58
39
6
27
51
44
62
45
9
38
66
58
72
46
11
46
69 71
A L B B I H K O S M K D M N E S R B
2006 2008 2010 2012 2014
-13.0
-8.0
-3.0
2.0
7.0
2006 2007 2008 2009 2010 2011 2012 2013
Residual
Other debt-creating flows
Exchange rate depreciation
Real GDP growth
Real interest rate
Primary deficit
Change in gross public sectordebt
20
22
24
26
28
30
32
34
36
38
40
2010 2011 2012 2013 2014
Gross CentralGovernmentdebt-to-GDPratio
Net CentralGovernmentdebt-to-GDPratio

63
4.6. Central government debt is the largest component of public debt. FYR Macedonia’s public debt
comprises debt of the central government, of municipalities and of state-owned enterprises (SOEs). Central
government debt accounted for more than 80 percent of total public debt throughout the period between
2008 and 2014. At the same time, the debt of SOEs has more than doubled from 3 percent in 2008 to 8
percent in 2014. As of end 2014, the debt of all SOE has been guaranteed by the central government, with
the exception of a loan to MEPSO and the Civil Aviation Agency of 0.2 percent of GDP.
4.7. As of end 2013, the gross central government debt-to-GDP ratio was about 4 percentage points
higher than the net central government debt-to-GDP ratio. In FYR Macedonia, it is useful to distinguish
the concept of gross net from net debt, as the Government has built up cash reserves over time, from which
it can draw to meet its financing needs, thereby reducing government borrowing. Because of the volatility
that these transitory deposit movements introduce into the gross debt path, it is more instructive to look at
debt net of the government’s cash reserves. The gross debt-to-GDP and net debt-to-GDP ratios coincided
in 2010, diverging thereafter (Figure 4.2b). These ratios diverged further in 2014 as the government issued
a EUR500 million Eurobond which was to a large extent used to pre-finance the roll-over of the 2015
Eurobond.
4.8. Interest spending on central government debt rose modestly as a percentage of GDP as the
country graduated from concessional borrowing and improved its maturity structure. As a share of
GDP, interest expenditures increased from 0.6 percent to 1.0 percent between 2009 and 2014 (Figure 4.3)
a) as FYR Macedonia’s share of concessional borrowing declined; b) it lengthened the maturity of its debt
to reduce roll-over risks and c) public debt increased. Still, this leaves FYR Macedonia’s interest rate
spending still at the same level as in 2006.
Figure 4.3: Interest Expenditure on central government debt (in millions of MKD and in percent)
Source: World Bank staff estimates.
Note: The implicit interest rate is calculated as interest payments divided by debt stock.
4.9. Interest rate risk and the currency risk of Macedonia’s public debt have been well managed.
Having had access to concessional financing until 2001, Macedonia’s public debt portfolio is still
dominated by fixed interest rate debt and relatively low interest costs. Official multilateral sources account
for more than 50 percent of its external public debt. After loosing access to concessional financing, the
government relied heavily on the domestic market to finance its fiscal deficit, capitalizing on high liquidity
in the banking sector to ramp up domestic bond issuance and lengthen the maturity of its bond portfolio. In
recent years, it has also tapped into international financial markets, issuing three Eurobonds in 2005, 2009
and 2014 and contracting two external bank loans from private creditors supported by World Bank
guarantees. As of end 2013, 54.5 percent of FYR Macedonia public debt had fixed interest rates (Figure
0.0
1.0
2.0
3.0
4.0
5.0
6.0
0
1000
2000
3000
4000
5000
6000
2006 2007 2008 2009 2010 2011 2012 2013 2014
Million MKD(lext axis)
% of GDP (rightaxis)
Implicit interestrate, in % (rightaxis)

64
4.4a). In terms of currency composition, the share of euro-denominated debt was 58.2 percent while that of
domestic currency denominated debt was 21.9 percent (Figure 4.4b).
Figure 4.4: Public debt structure a) Interest rate structure b) Currency composition
Source: MoF. Note: Data as of end 2013. Source: MoF. Note: Data as of end 2013.
4.10. FYR Macedonia has been successful in lengthening the maturity of its central government debt.
Between end 2012 and end 2014, the share of 3-month treasury bills declined from 65.2 percent to zero.
The Government did also not issue 6 month bills in 2014. At the same time, the share of 12 month treasury
bills increased from 6.5 percent to 46.6 percent and the share of 5-year government bonds in central
government debt rose from 18.0 percent in 2012 to 30.6 percent in 2014 (Figure 4.5). The Ministry of
Finance also successfully introduced a 10 year bond in 2014. The total average time of maturity of FYR
Macedonia’s public debt reached 4.2 years as of end 2014.55
Figure 4.5: Maturity Structure of Domestic Debt a) End 2012 b) End 2014
Source: MoF. Source: MoF.
4.11. FYR Macedonia amended its Law on Public Debt in November 2014. Under the amendment, debt
contracted by SOEs that is not guaranteed by the state will not be considered public debt. Currently, non-
guaranted SOE debt is small at around 0.2 percent of GDP as there only two SOE loans have been contracted
without a state guarantee. Nevertheless, the governments’ agenda for the coming period foresees an
increased investment activity by SOEs which should be predominantly externally financed and which could
lead to an increase in the amount of non-guaranteed SOE debt. This might pose a challenge to debt
55 Macedonia presents each year its public debt management strategy as an annex to its medium-term fiscal framework
to parliament. An annual public debt report is published on the website of the Ministry of Finance.
54.5
45.5 Fixed
Variable 58.221.9
2.0 17.1
0.8
Euro
MKD
JPY
SDR
USD
3m T-bills65%6m T-bills
6%
12m T-bills7%
2y T-bonds
0%
3y T-bonds4%
5y T-bonds18%
3m T-bills0%
6m T-bills 0%
12m T-bills47%
2y T-bonds12%3y T-bonds
7%
5y T-bonds30%
10y T-bonds4%

65
management in terms of accurately accounting for the risk and would also increase borrowing costs for
SOEs.
C. BASELINE SCENARIO AND SHOCKS
4.12. Under the baseline scenario, economic growth is expected to accelerate in the medium term,
benefiting from the increase in public investments, foreign direct investment (FDI) and sustained
export growth. Under the baseline projection, real GDP growth is expected to reach 3.5 percent in 2015.56
Real imports and exports are projected to grow at 7.8 and 6.8 percent, respectively, in 2015. This surge in
import growth is largely driven by FDI. Externally financed public investment is projected to accelerate,
supporting growth, but leading to a widening of the current account deficit in 2015. The current account
deficit, however, is expected to narrow thereafter with a moderation in the growth trajectory of real imports,
owing to a decline in FDI-related imports. The growth rate of real exports is also expected to increase as
FDI related exports continue to growth and external demand, especially in EU countries, recovers (Annex
Table 4.1).
4.13. The central government fiscal deficit is projected to fall below 3 percent of GDP by 2017, in line
with the Government medium-term fiscal targets. The forecasting of the central government fiscal
accounts was done under the assumption of a deficit level of 3.7 percent of GDP, as outlined in the MTFS
2015-2017. Securing a reduction in the central government deficit from an estimated 3.7 percent of GDP
in 2014 to 2.9 percent in 2017 will require a sizeable consolidation effort. The fiscal deficit in 2014 reached
4.2 percent of GDP. This is a sizable increase over the originally budgeted deficit of 3.5 percent of GDP
and the revised deficit target of 3.7 percent of GDP, making it even more difficult for the Government to
implements its medium-term fiscal path. Our baseline projections assume that on the expenditure side, the
government is committed to containing the public-wage bill, largely by maintaining a tight control on public
employment and on spending on goods and services57. As a result, central government’s spending on wages
and goods and services is expected to remain constant – at about 4.4 and 3.1 percent respectively – over the
medium term. Pension related expenditures are also expected to remain constant. Capital expenditures as a
share of GDP are projected to increase marginally from 3.2 percent in 2014 to 3.5 percent in 2015, while
revenues as a share of GDP, are projected to remain constant with increases in excises and improved
revenue collection (Annex Table 4.2)58. This implies that – based on a fiscal deficit of 3.7 percent in 2014
- the central government will need to find savings of 0.9 percent of GDP in 2016, 1.4 percent in 2017 and
1.7 percent in 2018 to implement the projected consolidation path. Additional fiscal efforts will be required
to clear the health sector arrears.
4.14. Central government financing needs peaked in 2013 and then are projected to decline as the
government implements its fiscal consolidation path. Under the baseline, gross financing needs as a
share of GDP are projected to decline gradually from 14.6 percent in 2013 to 10.6 percent by 2016. High
financing needs in 2013, 2014 and 2015 are driven by payments due on a Eurobond and repayments to the
IMF (Table 4.1). Going forward, the Government is projected to continue its strategy of reducing short-
term domestic debt, while maintaining medium to long-term government securities constant as a share of
GDP. Loans contracted for infrastructure investments have mostly maturities of at least 10 years.
56 Real GDP growth in 2014 is estimated to have reached 3.8 percent according to the latest publication of the State
Statistical Office, which was the highest growth rate among the SEE6 countries. 57 The government has announced increases in public salaries by 4 percent starting from November 2014 onward as
well as a tight control on public employment. Pensions will also increase by 5 percent – about 1.5 percent above the
legal indexation - from March 2014 onward. 58 The Excise Law stipulates an increase in the excise on tobacco and alcoholic products starting from 1 July 2013.
Parliament has also approved a Tax Procedure Law aimed at increasing revenue collection.

66
4.15. The fiscal path of the general government fiscal path closely follows the central government
path. Under the baseline assumption the general government deficit level is projected to fall from 4 percent
of GDP in 2013 to 2.9 percent in 2018. The consolidation is expected to come from the expenditure side,
while revenues are projected to remain broadly constant. Nevertheless, under the baseline assumption the
deficit level of the general government is projected to be 3.1 percent of GDP in 2017, slightly above the
fiscal rule target of 3 percent set for the central government as of 2017 and the Maastricht criteria of a
general government deficit of 3 percent.
Table 4.1: Central government financing needs
(in percent of GDP)
Source: MoF, World Bank staff estimates and projections as of November 2014.
1/ Includes projected disbursements of committed project funds.
2/ Net of cash reserves.
Note: Central government refers to the core government plus consolidated extra-budgetary funds. It excludes
municipalities and the newly-formed PESR.
4.16. The financial deficit of public enterprises is expected to increase over time as they ramp up
investment activity. The financial deficit of the Public Enterprise for State Roads (PESR), which was
barely EUR 2 million in 2012, when the entity was still the Road Fund and integrated into the central
government, is set to rise to over EUR 188 million (around 2 percent of GDP) by 2017 according to the
PESR’s medium-term investment strategy. On this basis, the PESR is expected to comfortably finance its
deficit and also accumulate a considerable cash buffer given it is scheduled around EUR 647 million in
2012 2013 2014 2015 2016 2017 2018 2019
GROSS FINANCING NEEDS 9.4 14.6 14.0 13.8 10.6 9.2 8.7 6.9
Primary Deficit (- is surplus) 2.9 2.9 2.8 2.5 1.9 1.5 1.2 1.0
Interest Payments 0.9 0.9 0.9 1.0 1.2 1.4 1.5 1.7
Debt amortization 5.6 10.8 10.3 10.3 7.4 6.3 5.9 4.2
Domestic 4.8 8.1 8.5 6.7 5.1 4.8 4.3 3.5
External 0.7 2.7 1.8 3.6 2.4 1.5 1.7 0.8
Private creditors 0.2 2.0 0.1 1.7 1.4 0.8 0.9 0.0
Official creditors 0.5 0.7 1.7 1.9 1.0 0.7 0.8 0.8
WBG 0.3 0.3 0.3 0.3 0.3 0.4 0.4 0.4
IMF 0.0 0.0 1.0 1.2 0.3 0.0 0.0 0.0
Other MDBs & bilateral 0.2 0.4 0.4 0.4 0.4 0.4 0.4 0.4
GROSS FINANCING SOURCES 9.4 14.6 14.0 13.8 10.6 9.2 8.7 6.9
Privatization receipts 0.0 0.1 0.1 0.0 0.0 0.0 0.0 0.0
Use of government deposits -2.6 -0.1 -1.2 4.2 0.0 -0.2 -0.3 0.6
Domestic market access 10.3 10.8 8.2 6.3 6.1 5.5 4.9 4.8
External financing 1/ 1.6 3.8 6.9 3.3 4.5 3.9 4.0 1.6
Private creditors 1.4 3.0 5.7 1.7 3.2 2.3 2.4 1.6
Official creditors 0.2 0.8 1.2 1.6 1.3 1.6 1.6 0.0
WBG 0.1 0.5 0.5 0.6 0.0 0.1 0.1 0.0
IMF 0.0 0.0 0.0 0.0 0.0 0.0 0.0 0.0
Other MDBs & bilateral 0.1 0.3 0.7 0.9 1.3 1.5 1.6 0.0
0.0
Memo items:
Government cash balance (end-of-year) 4.2 4.0 5.0 0.6 0.5 0.6 0.8 0.2
Overall fiscal balance -3.8 -3.9 -3.7 -3.5 -3.2 -2.9 -2.8 -2.7
Gross central government debt 33.5 33.9 37.5 35.4 37.1 38.2 39.1 39.0
Net central government debt 2/ 29.4 30.0 32.5 34.8 36.6 37.6 38.3 38.8
Gross total public sector debt 38.5 40.6 48.5 49.2 53.1 53.8 53.8 53.3
Est. Projections
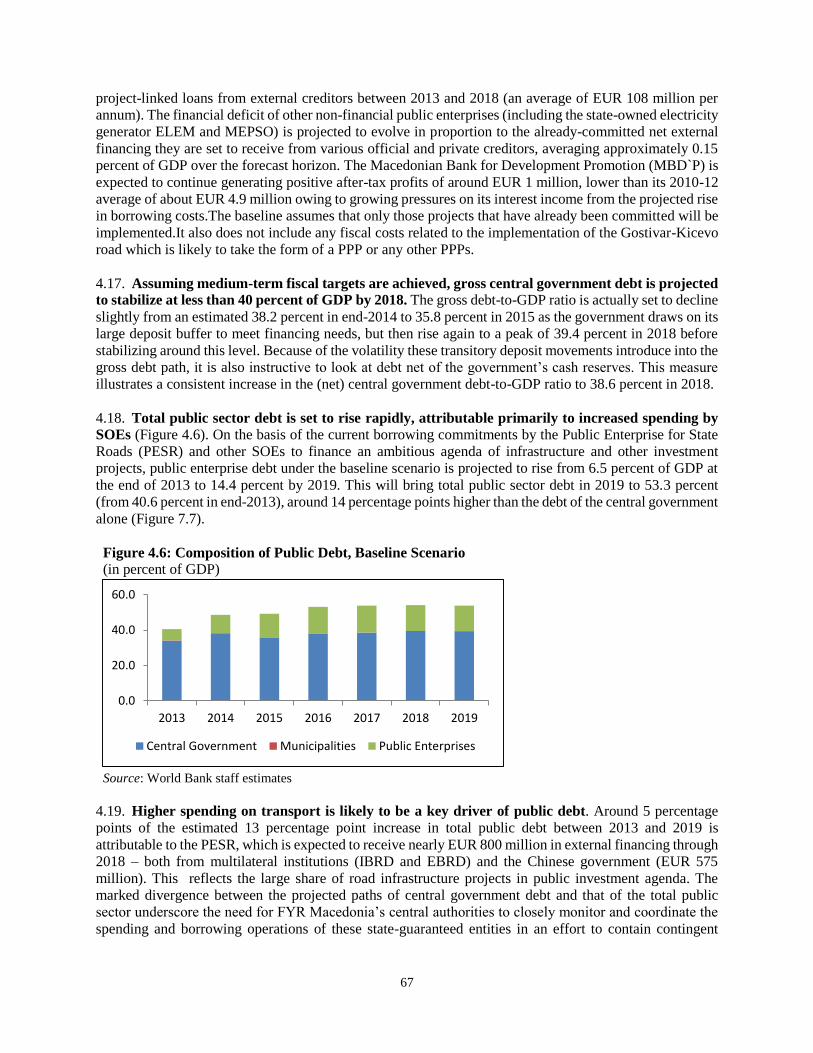
67
project-linked loans from external creditors between 2013 and 2018 (an average of EUR 108 million per
annum). The financial deficit of other non-financial public enterprises (including the state-owned electricity
generator ELEM and MEPSO) is projected to evolve in proportion to the already-committed net external
financing they are set to receive from various official and private creditors, averaging approximately 0.15
percent of GDP over the forecast horizon. The Macedonian Bank for Development Promotion (MBD`P) is
expected to continue generating positive after-tax profits of around EUR 1 million, lower than its 2010-12
average of about EUR 4.9 million owing to growing pressures on its interest income from the projected rise
in borrowing costs.The baseline assumes that only those projects that have already been committed will be
implemented.It also does not include any fiscal costs related to the implementation of the Gostivar-Kicevo
road which is likely to take the form of a PPP or any other PPPs.
4.17. Assuming medium-term fiscal targets are achieved, gross central government debt is projected
to stabilize at less than 40 percent of GDP by 2018. The gross debt-to-GDP ratio is actually set to decline
slightly from an estimated 38.2 percent in end-2014 to 35.8 percent in 2015 as the government draws on its
large deposit buffer to meet financing needs, but then rise again to a peak of 39.4 percent in 2018 before
stabilizing around this level. Because of the volatility these transitory deposit movements introduce into the
gross debt path, it is also instructive to look at debt net of the government’s cash reserves. This measure
illustrates a consistent increase in the (net) central government debt-to-GDP ratio to 38.6 percent in 2018.
4.18. Total public sector debt is set to rise rapidly, attributable primarily to increased spending by
SOEs (Figure 4.6). On the basis of the current borrowing commitments by the Public Enterprise for State
Roads (PESR) and other SOEs to finance an ambitious agenda of infrastructure and other investment
projects, public enterprise debt under the baseline scenario is projected to rise from 6.5 percent of GDP at
the end of 2013 to 14.4 percent by 2019. This will bring total public sector debt in 2019 to 53.3 percent
(from 40.6 percent in end-2013), around 14 percentage points higher than the debt of the central government
alone (Figure 7.7).
Figure 4.6: Composition of Public Debt, Baseline Scenario
(in percent of GDP)
Source: World Bank staff estimates
4.19. Higher spending on transport is likely to be a key driver of public debt. Around 5 percentage
points of the estimated 13 percentage point increase in total public debt between 2013 and 2019 is
attributable to the PESR, which is expected to receive nearly EUR 800 million in external financing through
2018 – both from multilateral institutions (IBRD and EBRD) and the Chinese government (EUR 575
million). This reflects the large share of road infrastructure projects in public investment agenda. The
marked divergence between the projected paths of central government debt and that of the total public
sector underscore the need for FYR Macedonia’s central authorities to closely monitor and coordinate the
spending and borrowing operations of these state-guaranteed entities in an effort to contain contingent
0.0
20.0
40.0
60.0
2013 2014 2015 2016 2017 2018 2019
Central Government Municipalities Public Enterprises

68
liabilities. The debt of municipalities is projected to remain negligible at around 0.1 percent of GDP on the
assumption that these entities continue to run a broadly balanced budget.
4.20. External shocks would un-anchor public sector debt from its baseline path. Even if the fiscal
effort remains on track, weaker GDP growth would adversely impact the debt ratio through two channels:
directly through a lower denominator (nominal GDP), and indirectly through a deterioration of the fiscal
balance as a result of automatic stabilizers. A negative shock that permanently reduces real GDP growth by
1 standard deviation for 2 consecutive years after 2014 would put the debt ratio on an upward trajectory to
58.4 percent of GDP in 2019. A negative shock that increases the real interest rate, however, would un-
anchor debt from its baseline path only marginally (Figure 4.7a). We do not simulate a real exchange rate
shock given that the MKD Denar’s is pegged to the Euro and the peg has not come under any significant
pressure in the past.
D. ALTERNATIVE SCENARIOS
Fiscal Consolidation
4.21. Incomplete or failed fiscal consolidation would worsen public sector debt dynamics
substantially. The sensitivity of the debt path to potential fiscal slippages is simulated through a constant
primary balance scenario wherein the primary balance is kept at the 2014 level (-3.3 percent) throughout
the projection period. It shows that the failure to implement the planned consolidation measures through
2019 would lead to further deterioration of the fiscal deficit and set gross debt on an explosive path to 58.8
percent of GDP by 2019 (Figure 4.7a). A partial implementation of the necessary fiscal consolidation (half
of all required measures) – simulated by a primary balance shock – would still un-anchor debt from its
baseline path, albeit less notably, pushing it to 54.8 percent in 2019 (Figure 4.7b).
Figure 4.7: Public Sector Debt under different shocks (% of GDP)
a) External shocks b) Fiscal shocks
Source: World Bank staff estimates
Government Investment
4.22. If the Government were to implement fully its Government Program 2014-2018, public sector
debt would increase steeply. If the Government implements all investment projects indicated in the
program, primarily through SOEs, the gross public debt-to-GDP ratio is projected to reach 61.7 percent by
2019 (Figure 4.8a). These additional projects would include further investments in transport infrastucture,
energy and agriculture beyond what is included in the current baseline. The Ministry of Finance stressed
48.5
51.3
58.3 58.9 5958.4
49.2
53.154 54.3 54
50.5
54.655.5 55.9 55.5
40
45
50
55
60
2014 2015 2016 2017 2018 2019
Real GDP growth shock
Baseline
Interest rate shock
48.5
49.6
54.3
56.2
57.8 58.8
50.0
54.655.3 55.4
54.8
45.0
50.0
55.0
60.0
2014 2015 2016 2017 2018 2019
Baseline
Constant Primary Balance
Primary Balance Shock
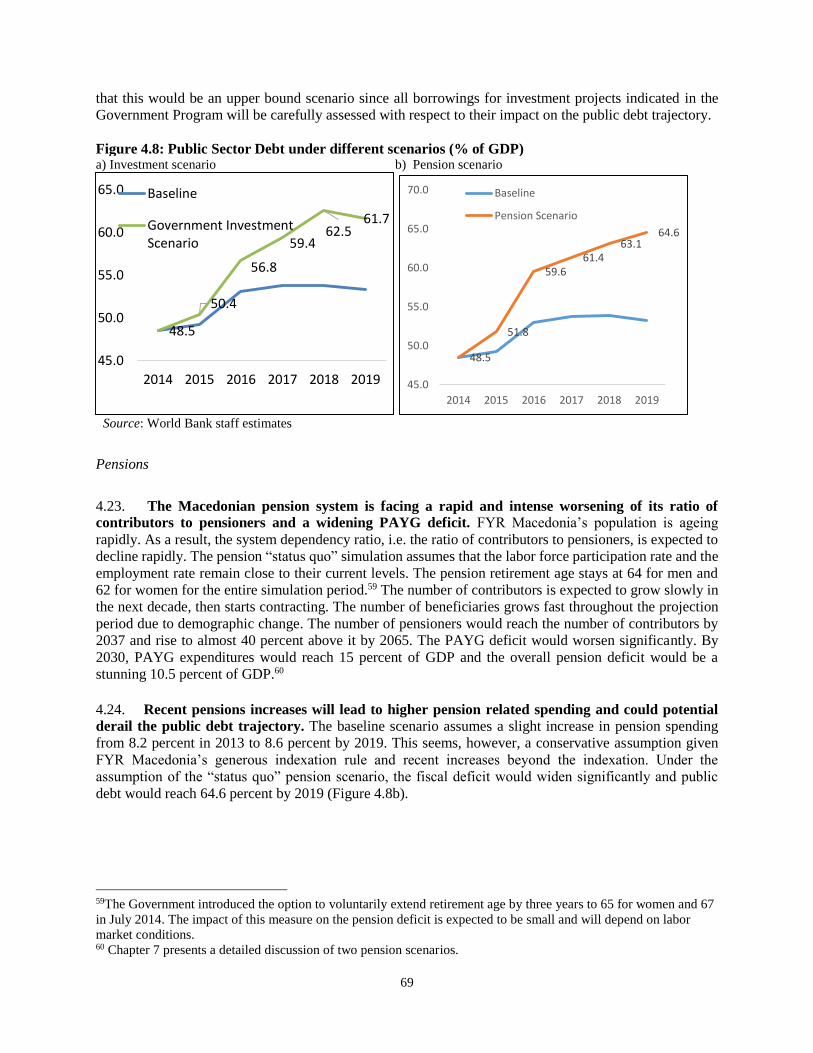
69
that this would be an upper bound scenario since all borrowings for investment projects indicated in the
Government Program will be carefully assessed with respect to their impact on the public debt trajectory.
Figure 4.8: Public Sector Debt under different scenarios (% of GDP) a) Investment scenario b) Pension scenario
Source: World Bank staff estimates
Pensions
4.23. The Macedonian pension system is facing a rapid and intense worsening of its ratio of
contributors to pensioners and a widening PAYG deficit. FYR Macedonia’s population is ageing
rapidly. As a result, the system dependency ratio, i.e. the ratio of contributors to pensioners, is expected to
decline rapidly. The pension “status quo” simulation assumes that the labor force participation rate and the
employment rate remain close to their current levels. The pension retirement age stays at 64 for men and
62 for women for the entire simulation period.59 The number of contributors is expected to grow slowly in
the next decade, then starts contracting. The number of beneficiaries grows fast throughout the projection
period due to demographic change. The number of pensioners would reach the number of contributors by
2037 and rise to almost 40 percent above it by 2065. The PAYG deficit would worsen significantly. By
2030, PAYG expenditures would reach 15 percent of GDP and the overall pension deficit would be a
stunning 10.5 percent of GDP.60 4.24. Recent pensions increases will lead to higher pension related spending and could potential
derail the public debt trajectory. The baseline scenario assumes a slight increase in pension spending
from 8.2 percent in 2013 to 8.6 percent by 2019. This seems, however, a conservative assumption given
FYR Macedonia’s generous indexation rule and recent increases beyond the indexation. Under the
assumption of the “status quo” pension scenario, the fiscal deficit would widen significantly and public
debt would reach 64.6 percent by 2019 (Figure 4.8b).
59The Government introduced the option to voluntarily extend retirement age by three years to 65 for women and 67
in July 2014. The impact of this measure on the pension deficit is expected to be small and will depend on labor
market conditions. 60 Chapter 7 presents a detailed discussion of two pension scenarios.
48.5
50.4
56.8
59.462.5
61.7
45.0
50.0
55.0
60.0
65.0
2014 2015 2016 2017 2018 2019
Baseline
Government InvestmentScenario
48.5
51.8
59.661.4
63.164.6
45.0
50.0
55.0
60.0
65.0
70.0
2014 2015 2016 2017 2018 2019
Baseline
Pension Scenario

70
Revenues
4.25. FYR Macedonia’s public revenues have been on a downward trend over the past decade and
are now among the lowest in Europe in terms of GDP. After peaking in 2003 at 37.4 percent of GDP on
the back of an influx in donor grants (to help with the implementation of the Ohrid peace framework) and
sales of strategic commodity reserves, FYR Macedonia’s total central government revenues have been on
a steady decline, reaching an all-time low of 28.1 percent of GDP in 2013.61 This is well below the EU-15
and EU-11 revenue average of 46.0 and 38.2 percent (Figure 4.9), respectively, and the third lowest among
the SEE6 countries behind Kosovo (27.3 percent) and Albania (24.2 percent).
Figure 4.9: Government revenues in selected European countries, 2014 (in percent of GDP
Source: Ministry of Finance, IMF WEO and Eurostat.
4.26. Revenues had been constantly under realized since 2009 (Figure 4.10). In the period 2006-2008
revenue realization had been above the targeted level, on average by 3.8 percent. Strong performance was
registered across the board, with direct taxes performing particular well. Nevertheless, since 2009 revenues
had been constantly under realized, on average by 9.4 percent. Tax revenues as the main source of revenue,
accounting for around 55 percent of all revenues, had also been constantly under realized since 2009. On
average, tax revenues had been under realized by 7.9 percent in the period 2009-2014, with VAT and import
duties being the biggest underperforming taxes. Revenues from social contributions that account for
additional 30 percent of overall revenues, had also been under realized by 2.8 percent on average since
2009.
61 General government revenues (including municipalities) stood 30.2 percent of GDP in 2013, but publicly available
time series only spans back to 2009, making it difficult to draw consistent historical comparisons.
0 10 20 30 40 50
Kosovo
Albania
FYR Macedonia
Romania
Lithuania
Bulgaria
Latvia
SEE
EU-11
Slovak Republic
Estonia
Poland
Czech Republic
Serbia
Slovenia
Croatia
Montenegro
BiH
EU-15
Source: Ministry of Finance, IMF WEO and Eurostat

71
Figure 4.10: Revenue realization a) Overall revenue realization
(as percent of the origianl budget)
b) Tax revenue realization
(as persent of the origianl budget)
Source: Ministry of Finance and World Bank staff calculations.
4.27. Revenues from income taxes are low. FYR Macedonia’s combined revenue intake from personal
(PIT) and corporate income taxes (CIT) has not exceeded 4.2 percent of GDP since 2003 and has fallen to
2.9 percent by 2013. This is 1.1 percentage points below the SEE6 average, 3.1 percentage points below
the average of New EU Member States and more than 10 percentage points below the EU15 average. These
relatively low revenues from income taxes are due to low tax rates and a narrow tax base. Flat taxes on both
personal and corporate income, which were lowered to 10 percent in 200962, and the elimination of taxation
on reinvested profits further lowered revenue collection. PIT revenues declined from 2.5 percent of GDP
in 2006 to 2.1 percent of GDP in 2008 as the government shifted from a progressive tax regime to a flat tax
and lowered the tax rate. Since 2008, PIT revenues have remained at around 2.0 to 2.1 percent of GDP.
Revenues from CIT declined from 2.1 percent in 2008 to 1.1 percent in 2009 due to the decline in the CIT
rate, a policy pursue by most countries in the region (see Box 4.1 below). The lowering of the CIT rate was
part of a broader package (including other tax deductions and tax holidays) developed by the government
in order to make FYR Macedonia a favored destination for foreign investments and reduce informality and
corruption. Recent surveys, however, have shown that informality has not been significantly reduced and
that investment inflows in the region depend more on the general business environment (physical and social
infrastructure, healthy and skilled labor and government cooperation with the FDIs). Furthermore, a rate
reduction in the host country (e.g., FYR Macedonia) does not benefit the company investing, which to avoid
double taxation usually receives a tax deduction in its home country (usually developed) for taxes paid in
the host country. Albania and Serbia have increased their CIT tax rate to 15 percent in 2014. In fact, only
Bulgaria and Montenegro have a lower CIT rate in the region. The EU average is 21 percent.63
62 The PIT rate was 12 percent and the CIT rate was 15 percent prior to 2009. 63 The Government considered some policy changes to increase revenues from income taxes, none of which were
implemented. In 2010, the Government announced that taxation on interest on deposits will be introduced, but this
was postponed till 2013 before being postponed indefinitely. The Law on Personal Income Tax was amended in 2013,
postponing the previously announced application of taxation on capital gains from the sale of securities until 2016.
0
20
40
60
80
100
120
2006 2007 2008 2009 2010 2011 2012 2013 20140
20
40
60
80
100
120
2006 2007 2008 2009 2010 2011 2012 2013 2014

72
Box 4.1: Recent Tax Reforms in the ECA region and the European Union
As public debt increased in the wake of the 2009 financial crisis, several SEE6 resorted to revenue-increasing
measures. In 2013, Albania increased its CIT rate (from 10 percent to 15 percent), excises tax rates on tobacco
products, alcoholic drinks and coffee, the circulation tax, and the property tax rates paid by businesses (local tax).
As a result, Albania’s revenue to GDP ratio is estimated to have reached 26.0 percent in 2014 up from 23.7 percent
in 2013. Serbia raised its VAT tax rate to 20 percent and its CIT rate to 15 percent in 2012. It also raised its lower
VAT tax rate, which applies to certain types of foods, agricultural inputs and medical equipment, from 8 to 10
percent and introduced a new solidarity tax on public wages and a tax on farmer income in 2014. Montenegro
raised its PIT and VAT rates in 2013. Most SEE6 countries, including FYR Macedonia, also implemented measures
to strengthen tax compliance. These measures included a reduction in the number of payments and documents
required for imports and exports, increased used of electronic systems and e-filing, unifying the tax legislation and
the implementation of a tax compliance risk model
In addition, several EU member states raised tax rates. As part of their fiscal consolidation efforts, several EU
Member States have increased their overall tax burden in recent years. Between 2011 and 2013 correct, some EU
countries increased rates on VAT (Spain, France, Italy, Cyprus and Slovenia), excise duties on fuels (Belgium,
Bulgaria, Estonia, Spain, France, Croatia, Italy, Cyprus, Latvia, Lithuania, Malta, the Netherlands, Romania and
Slovenia) and excise duties on tobacco and alcohol (Belgium, Bulgaria, the Czech Republic, Denmark, Estonia,
Spain, Croatia, Italy, Latvia, Lithuania, Malta, the Netherlands, Austria, Poland, Portugal, Romania, Slovenia,
Finland and the United Kingdom). Almost half of the EU Member States took measures to improve the VAT
efficiency.
In the context of high unemployment, several EU countries took tax measures to incentivize employment
and boost competitiveness. With respect to labor taxation, countries expanded, for example, PIT tax credits or
reduced employer taxes for people ‘on the margins’ of the labor market, such as the long-term unemployed and
low-income earners. Facing concerns about declining competitiveness, many EU countries introduced tax changes
in support of small companies, start-ups and innovation
Table 4.2: Level and composition of government revenues in Europe, 2013
(in percent of GDP)
Source: Ministry of Finance, World Bank FACE database, Eurostat.
Note: *Special Revenues Accounts.

73
4.28. The government’s ambitious FDI policy, while boosting employment and growth, has further
contributed to the decline of the revenue-to-GDP ratio. The government has pursued an effective policy
of attracting FDI, which is largely exempt from taxation. Investors in technological and industrial
development zones are entitled to 10-year exemptions from CIT and up to a 100 percent reduction from
PIT. Furthermore, investors are exempt from payment of VAT and customs duties for goods, raw materials,
equipment and machines. The European Commission Progress Reports have noted that alignment with the
relevant directives (such as the Parent-Subsidiary Directive, the Merger Directive and the Interest and
Royalties Directive) has yet to be addressed and that the Law on special zones for technological and
industrial development needs to be aligned with the EU Code of Conduct for Business Taxation. CIT
revenues, for example, declined further to 0.9 percent by 2013, which is likely due to the fact that foreign
firms, constituting an increasing share of economic activity, are CIT-exempt.64
4.29. The government has also significantly lowered social contributions to reduce the labor tax
wedge. Social contributions averaged roughly 10.5 percent of GDP between 2001 and 2006 (broadly in line
with regional averages at the time), underpinned by contribution rates totaling 32 percent of gross salaries.
However, with FYR Macedonia’s labor tax wedge in 2006 at 40.2 percent of labor costs – broadly in line
with EU averages but above OECD averages (Figure 4.11a) – and social contributions accounting for more
than two-thirds of this wedge, the government began lowering contribution rates in 2009 in an effort to
improve cost competitiveness and boost employment, formal sector activity, and foreign investment. Since
2009, each worker pays social contributions based on the gross wage. By 2013, FYR Macedonia’s labor
tax wedge had fallen to 27 percent of labor costs, which is 8.8 percentage points below the OECD average.
Between 2010 and 2013, the number of formally employed workers increased by 6.4 percent and the
number of contributors to the social security system by 7.7 percent. Despite these improvements, the lower
contribution rates placed additional strains on the financial sustainability of the health and pension systems
(see Chapters 6 and 7).
Figure 4.11: Labor tax wedge and VAT performance a) Labor tax wedge b) VAT performance and economic cycle
Source: OECD, Public Revenue Office and Trpeski and
Tashevska (2012).
Source: Minsitry of Finance and World Bank staff
calcualtions.
64 The Government has also announced financial and health sector zones in 2014. It proposed a constitutional
amendment that would allow to set-up financial sector zones in the country that would benefit from special legal
regulations, with the exception of the criminal law, with a view of attracting international financial firms. The
Government also announced that it would establish health zones aimed at attracting international hospitals. There has
been no assessment of the fiscal implications of these new zones.
20
25
30
35
40
45
2006 2007 2008 2009 2010 2011 2012 2013
OECD
EU
MKD
-6
-4
-2
0
2
4
6
8
10
-6
-4
-2
0
2
4
6
8
10
2000 2001 2002 2003 2004 2005 2006 2007 2008 2009 2010 2011 2012 2013
VAT receipts (right axis)
Domestic demand (absorbstion) gap
Output gap
percent of GDP percent of GDP

74
The Government had recently adopted changes in the legislature which coud lead to increasing
revenues. Under the new Profit Tax Law adopted in July 2014, the anti-crisis measure under which the
profit was subject to taxation only in cases of profit distribution by way of dividends, as of 2015 is
abolished. The Government also broadened the tax base by reducing the VAT registration threshold from
MDK 2 million to MKD 1 million from January 2015 onwards.
4.30. Nearly half of revenues are generated from indirect taxes, which have also been declining as
share of GDP and are relatively low compared to SEE6 and other European countries. Revenues from
indirect taxes as a share of GDP have declined from 13.4 percent in 2006 to 12 percent due to a decline in
revenues from excises and import duties, which compares to a SEE6 average of 16.6 percent and an EU-11
average of 13.6 percent.
4.31. VAT revenues have remained constant in terms of GDP since 2006. VAT was introduced in
FYR Macedonia in 2000 with a standard rate of 18 percent and a reduced rate of 5 percent for certain
items.65 Between 2000 and 2007, VAT receipts rose steadily from 7.4 percent of GDP to 8.8 percent on the
back of rapid growth. This trend was reversed with the onset of the economic crisis in 2008. Economic
activity weakened and VAT revenues slightly declined. Despite a decline in domestic demand, VAT
receipts rose from 8.6 percent in 2010 to 9.1 percent of GDP in 2011 as the Government accumulated
arrears on VAT refunds. By 2012 and 2013, VAT had fallen again to 8.3 and 8.0 percent of GDP,
respectively, weighed down by a slowdown in economic activity in 2012 and clearance of VAT refund
arrears in late 2012 and early 2013 (Figure 4.11b). The Government has reduced the VAT rate for a number
of products since 2008,66 while at the same time broadening the VAT registered payers for micro
companies. In 2014, the Government introduced the Reverse Charge System on VAT aimed at increasing
the compliance among sectors where it is harder to control the VAT flow (such as the construction sector)
and proposed an amendment to reduce the threshold for VAT registered payers.67
4.32. Revenues from excises and customs have declined since 2006, yet the coverage of products
and the rates levied have remained fairly constant throughout this period. In 2013, the government
announced that it will increase the excise tax for alcohol and cigarettes (FYR Macedonia has among the
highest cigarette consumption per capita in the world). Alcohol excises were increased by 12 percent while
cigarette excises will be increased consecutively each year till 2023, applying a progressive increase over
the years in order to align the excise rate with EU standards. Still, some excises remain lower than the
minimum required by the acquis communitaire. Part of the additional revenues collected from these
increases will earmarked for health sector investments and purchases of pharmaceuticals. Customs duties
contracted by around 2 percentage points between 2000 and 2013 as FYR Macedonia brought its customs
regime in line with EU norms. Between 2006 (the country’s first year as an EU candidate country) and
2013, the simple average Most Favored Nation applied rate for non-agricultural goods has fallen from 7.4
percent to 5.8 percent.
65 Initially, the lower 5 percent VAT rate applied to food, water supply, publications, books and newspapers, and
certain agricultural inputs. In 2007, as part of the tax reform, the range of products subject to this lower rate was
broadened to include computers, medicines, and public transport. There is also a small group of zero-rated goods and
services such as exported goods, international air transport, and sale of goods to the free economic zones. 66 The VAT preferential rate of 5 percent was expanded for a number of products such as animal food, baby
products and school supplies (in 2014), import of personal computers, PC components, software and thermal solar
systems (in 2012), medical equipment and other devices for personal (in 2011), supply of water for irrigation
purposes (in 2010) and public cleaning services and waste treatment (in 2008). 67 The amendment to the Law on Value Added Tax states that all entities with turnover above EUR 16,000 will become
VAT registered payers (as opposed to the current threshold of EUR 32,000). Currently, there are around 190,000 of
these micro entities out of which only 34,000 are VAT registered payers.

75
4.33. Non-tax and capital revenues have been trending downwards since 2008. Most of the decline
has stemmed from a contraction in non-tax receipts collected through the special revenue accounts (SRA)68,
with the remainder resulting from lower profits of the National Bank of Macedonia, and a lower
contribution (as a percent of GDP) from the annual dividend received from the government’s stake in the a
telecom company, which was privatized in 2001. Furthermore, as of 2013, road fees and vehicle registration
fees collected by the Road Fund (roughly 0.5 percent of GDP) will no longer count towards central
government non-tax revenues since the Road Fund has been transformed into the Public Enterprise for State
Roads.
4.34. FYR Macedonia’s tax productivity is below regional standards. 69 The tax productivity of value
added tax (VAT), corporate income tax (CIT) and personal income tax (PIT), which account for more than
70 percent of tax revenues in FYR Macedonia, indicates that the country is among the lowest performers
in the region and well below the regional average level. In terms of VAT (which accounts for more than ½
of tax revenues), FYR Macedonia’s productivity is the second lowest (just above Albania) and is well below
the level of Serbia and Montenegro, who have either equal or smaller VAT rates. A broadening of the tax
base, a better compliance rate and better VAT administrative performance are areas on which countries
with low VAT productivity should focus.70
Figure 4.12: Tax productivity
Source: National authorities and World Bank staff calculations.
68 Special revenue accounts are accounts managed by the Ministries and other budget users who collect revenues
based on their activities and services provided. 69 Tax productivity is equal to the tax as a percent of the tax base (GDP or consumption) divided by the standard tax
rate. In an ideal world, productivity will be 100 if the entire base is taxed, there are no exemptions and there is no
leakage of revenue from tax evasion. 70 OECD, 2012, “Consumption Tax Trends 2012 VAT/GST and Excise Rates, Trends and Administration Issue”,
p.104
0.0
0.1
0.2
0.3
0.4
0.5
0.6
0.7
0.8
0.9
1.0
ALB BiH KOS MKD MNE SRB AVG
VAT productivity
0.00
0.05
0.10
0.15
0.20
0.25
0.30
0.35
0.40
0.45
0.50
ALB KOS MKD MNE SRB
PIT productivity

76
4.35. There seems significant scope for
improving FYR Macedonia’s revenue collection,
which could bring about a notable reduction in
the public debt ratio. In the baseline, the non-
interest revenue to GDP ratio is assumed to be
constant throughout the projection period at 28
percent. If this ratio is increased by 2 percent every
year between 2015 and 2019 relative to its 2014
level, public debt is projected to experience a
consistent decline over time falling to 45.1 percent of
GDP by 2019 (Figure 4.13). If FYR Macedonia’s
revenue-to-GDP ratio were to reach the SEE6
average in 2015 and stay constant thereafter at 34.6
percent, public debt would fall to 26.4 percent of
GDP by 2019.
E. FISCAL RULES
4.36. The government has announced that they would pursue a constitutional amendments to
bestablish a binding 60 percent ceiling on public debt as a share of GDP and 3 percent of GDP fiscal
deficit as of 2017. Even though the current level of public debt is below the constitutional limit of 60
percent of GDP, public debt is projected to increase steeply if policies remain unchanged. In addition,
external shocks, such as lower than projected growth and increase in interests could derail the fiscal
consolidation path. The alternative scenarios presented in the previous section show that the public sector
debt-to-GDP ratio itself can exceed 60 percent of GDP and beyond by 2019 owing to, among other things,
increased pension expenditures and a wider implementation of the ambitious public investment agenda.
This implies that the public debt-to-GDP ratio may breach the prescribed ceiling.
4.37. What is the optimal level of public debt is ultimately a question of judgment, yet there is wide-
spread empirical confirms that high public debt depresses economic activity and significantly
increases the probability of a costly default. History abounds with public debt crises. Many of today’s
high-income countries went through debt defaults or rescheduling during their emerging market stage of
development, some as long ago as the 13th century (Reinhart and Rogoff 2010). Contrary to widespread
perceptions, the probability of a debt crisis seems to be determined by total public debt rather than by
external debt alone. History also shows that the economic and social costs of these crises can be high in
that countries in debt distress face higher financing costs and lower GDP and trade. A common estimate
puts default “costs” at 2 percent of GDP growth (Sturzenegger 2002). There is no agreement on what level
of public debt is optimal because of uncertainty surrounding the costs of taxation. It can be argued that zero
debt may be desirable if taxes are distortionary. Moreover, a given debt ratio could be sustainable in one
country but unsustainable in another. There exists empirical evidence that the higher a country’s debt level,
the lower the quality of its policies and institutions; and the higher the probability of shocks, the more likely
it will fall into debt distress (Kray and Nehru, 2004). While the risk of debt distress clearly tends to rise
with debt, what exact level is acceptable and compatible with fiscal sustainability is to some extent a matter
of judgment. Still, empirical analysis of emerging markets has shown that countries can enter debt crisis
even when debt is surprisingly low: in 55 percent of debt defaults of middle-income countries, public debt
was below the Maastricht benchmark of 60 percent of GDP, and in 35 percent it was less than 40 percent
(IMF 2013).
4.38. High public debt carries the risk that adverse shocks will push up borrowing costs. Global
economic factors, such as commodity prices and country interest rates, have been found to play a major
47.5 49.7 48.7 47.245.1
48.5
45.543.0
38.1
32.1
26.4
15.0
25.0
35.0
45.0
55.0
65.0
2014 2015 2016 2017 2018 2019
Baseline
Revenue Scenario
Alternative Revenue Scenario
Figure 4.13: Revenue Scenario
Source: Word Bank staff simulations.

77
role in precipitating sovereign debt crises (Reinhart and Rogoff 2008). Risks that could rapidly lead to a
buildup of debt, depending on the structure of the debt portfolio, are exchange rate and interest shocks,
rollover risks, and unforeseen drops in revenues and GDP. Interest rates are currently at historically low
levels and are bound to rise over the medium term.
4.39. Fiscal rules provide constraints on fiscal policy. Ideally, they should be clearly defined,
transparent, simple, flexible, enforceable, consistent, and supported by sound policies (Kopts and
Symansky, 1998). Some fiscal rules emphasize procedures, mandated processes and institutional
requirements; others set forth permanent numerical targets with regard to summary indicators of fiscal
performance such as government borrowing, spending, debt or a combination of these.
4.40. Procedural rules aim to enhance transparency, accountability, and prudent fiscal
management by defining the main features of the budget process. They typically require governments
to commit upfront to a fiscal policy strategy – usually for a multi-year period – which includes (a) principles
for fiscal policymaking; (b) numerical objectives for one or more fiscal indicators, often for the length of a
newly elected parliament; (c) arrangements for monitoring and reporting fiscal outcomes (against the
targets) and strategy changes. New Zealand pioneered this approach. Australia, Canada and the United
Kingdom are other countries that place great emphasis on procedural rules.
4.41. Numerical fiscal rule are intended to impose permanent, legally binding constraints on one
or more fiscal aggregates (see Box 4.2). There are examples abound. In the European Union, twin ceilings
for deficit and debt ratios are applied. The United States implemented an expenditure cap mechanism
(Budget Enforcement Act) from 1991 to 2002. Canada resorted to both legislated spending caps (Federal
Spending Control Act, 1991–96) and unlegislated policy rules.
4.42. A numerical rule can address time inconsistency problems by sending a powerful signal of
commitment, but may create problems of its own. Some rules, such as debt ceilings or deficit rules can
be pro-cyclical, especially in bad times. These rules can also lead to ad hoc reductions in capital spending,
which is easier to cut than current spending but may have higher economic and social returns. This is
particularly relevant in FYR Macedonia where capital expenditures have been constantly under-realized
due to being the key budget adjustment variable. Unfortunately, numerical rules that overcome this
limitation tend to be complex as well as more difficult to communicate, monitor and implement. In some
countries, the application of numerical rules has also led to creative accounting practices aimed at
circumventing the rules, including reclassification of expenditures, accumulation of arrears, and the use of
public entities off-budget to perform government operations. Many of these issues have been prevalent in
FYR Macedonia. Any introduction of a numerical fiscal rule should therefore be accompanied by
improvements in PFM practices and fiscal transparency. At the same, the government is strong budget
controls and a there is a strong link between budget and execution, which would facility that implementation
of the fiscal rule in FYR Macedonia.
4.43. Another potential disadvantage of numerical rules is that if they have to consider cyclical
fluctuations, they soon become very complex, thereby undermining their transparency. Cyclical
adjustments of fiscal balance rules, for example, require calculation of output gaps or trend nominal growth
rates, which can be difficult to calibrate. This can undermine credibility unless there is at least one
independent institution that can provide credible economic statistics. FYR Macedonia is among with the
most stable growth in the region, so there may be less of a need to adjust for cyclical fluctuations.
4.44. Establishing a fiscal rule in FYR Macedonia would be in line with what is happening
throughout the European Union. As part of the 2011 Enhanced Stability and Growth Pact, EU member
states are advised to translate EU fiscal rules into national legislation that has “a sufficiently strong binding
and durable nature.” Also, the Fiscal Compact that the European Council signed in March 2012 introduces

78
several elements for national fiscal rules that member states are expected to adopt by 2014. For example,
the compact requires countries to adopt legally binding rules that limit the annual structural deficit to
maximum of 0.5 percent for countries with debt above 60 percent of GDP. The rules include a commitment
to continuously reduce the public-debt-to GDP ratio to 60 percent at an annual pace of no less than 1/20th
the distance between the observed level and the target. To ensure effective implementation of the fiscal
rules, the European Commission set out recommendations to make MTBFs more binding, prepare budgets
in a more top-down sequence, report more often and comprehensively on fiscal developments and risks,
and give independent counsels a larger role.
Box 4.2: Numerical Fiscal Rules
A fiscal rule can target one or more variables, such as the budget balance, the public debt ratio or expenditures
and revenues. Each target serves different purposes and has unique own advantages and drawbacks.
a) The objective of budget balance rules is fiscal sustainability. The budget balance is determined by variables
that are largely under the control of the government, except for interest payments. They can provide clear
operational guidance. Budget balance rules can be specified as overall balance, structural or cyclically adjusted
balance, and balance “over the cycle.” While the first type of rule does not have economic stabilization features,
the other three explicitly account for economic shocks. However, estimating the adjustment, typically through the
output gap, makes the rule more difficult to communicate and monitor. A balance “over the cycle rule” has the
added disadvantage that remedial measures may be put off to the end of the cycle. A “golden rule,” which targets
the overall balance net of capital expenditure, is less linked to debt.
b) Debt ceilings also serve the objective of fiscal sustainability. They are easy to communicate and the most
effective in terms of ensuring convergence to a debt target. It can, however, require ad hoc fiscal adjustments,
which mostly take place at the expense of capital expenditures. The public debt ratio can also be significantly
affected by variables outside the control of the government, such as the exchange rate, interest rates, or the
realization of contingent liabilities.
c) Expenditure rules, such as ceilings on primary or current spending, expenditure growth, or percent of GDP, can
help limit the budget deficit but they cannot ensure fiscal sustainability unless combined with a balance, debt, or
revenue rule. They can, however, provide operational guidance for the required fiscal consolidation when they are
accompanied by debt or budget balance rules. Similarly, revenue rules, which are used rarely, mostly serve other
purposes, such as improving revenue collection or limiting tax increases.
Given the trade-offs, many countries combine two or more fiscal rules. Using a combination can help address the
gaps of each target. For example, a debt ceiling in combination with an expenditure rule would provide not only a
link to debt sustainability but also short- to medium-term operational guidance and allow for some counter
cyclicality. A combination of a debt and cyclically adjusted budget balance rule could do the same. Lithuania and
Poland, for example, complemented their debt rules over time with expenditure or budget balance rules.
Countries choose different numerical rules depending on their stage of development. In low-income countries,
debt rules are predominant. In advanced countries, cyclically adjusted budget balance rules dominate; even for
emerging market economies, this type of numerical target is difficult because it requires calibration of the output
gap, which is particularly challenging for countries going through structural transformation. As a result, emerging
economies with cyclically adjusted budget balance rules tend to use thresholds of actual economic activity rather
than an outputgap
4.45. Neighboring countries in the region have also legislated elements of both procedural rules
and numerical targets. Serbia and Bosnia-Herzegovina introduced a public debt ceiling at 45 percent and
60 percent of GDP respectively. In Montenegro, the authorities are developing a fiscal rule that would cap
public debt at 60 percent of GDP and limit annual fiscal deficits to 3 percent of GDP. The same holds true
in Kosovo where elements of the fiscal framework include a law that limits the public debt-to-GDP ratio at
40 percent and a fiscal rule aimed at limiting overall budgetary deficits to 2 percent of GDP.

79
4.46. Given the need for containing public debt, the Government could consider front-loading the
fiscal rule. Under the proposed amendemnt the ceilings would only apply in 2017. While the public debt
ceiling is unlikely to be breached by then, the fiscal deficit ceiling, while less ambitious than the fiscal
consolidation path presented in the MTFF, could provide a binding constraint for fiscal deficits and would
help to slow down the public debt increase.
4.47. The government should carefully assess the design of the fiscal rule. The implementation of
the fiscal rules should be strongly linked to enacment of sound PFM measures and procedures, including
fiscal trasnparency as the main vehicle to asses compliance to the rules. Implementing the fiscal rule would
imply a significant fiscal conolidation form the current defict level of 4.2 percent of GDP to the targeted
one of 2.9 percent in 2017. This would signifcantly limit the fiscal space and the government will need to
strengthen the efficiency and effectiveness of its public spending if it wants to achieve its priorities and
maximize the returns from its ambitious public investment program. In addition, the links between the
medium-term budgetary framework and the annual budget process would have to be significantly
strengthened as this has proven to be a shortcomming in the past years putting preasure to debt management.
Comtment controles and cash management would also have to reinforced as the recent build-up of payment
arrears has revealed important loopholes in this area. Finally, the government would have to carefully asses
the fiscal rules as debt ceilings or deficit rules can be pro-cyclical (especially in low gorwth scenarios) and
can lead to a reduction in capital spending, which in the case of FYR Macedonia might be even more
pronounced considering the constrained expenditure structure and the tendency to cut capital spending as
the main budget adjustment variable that has consistently been under-realized, thus constraining the
country’s potential growth.The Macedonian Ministry is currently in the proces of elaboratig operational
aspects of the fiscal rule in special legal regulations.
F. CONCLUSION
4.48. FYR Macedonia’s public debt-to-GDP ratio is projected to rise rapidly in the absence of
policy change. Under a conservative baseline scenario, public debt is projected to increase to 53.3 percent
of GDP by 2019. Failing to implement the central government fiscal consolidation path would push the
public debt-to-GDP ratio to 58.8 percent by 2019. The implementation of several proposed policy initiatives
over the next five years would lead to a rapid build-up of debt and it would clearly render the public debt
unsustainable. The Government would need to carefully assess the costs and economic returns of the
different policy proposals to appropriately prioritize and sequence the different policies in order to achieve
its development objectives while preventing public debt from becoming unsustainable.
4.49. Incomplete or failed fiscal consolidation would worsen debt dynamics substantially. The
Government has failed to meet its original fiscal targets during the last three years.The 2014 Medium-term
Fiscal Strategy foresees a steep decline in fiscal deficits from 4.2 percent in 2014 to 2.9 percent by 2017.
This could be achieved by faintaining pension spending constant as a share of GDP (around 0.3 percent of
GDP by 2019), reducing agricultural subsidies (around 0.2 percent of GDP), transfers to local government
(0.2 percent of GDP) and central government executed capital spending (0.2 percent). Failure to implement
the planned consolidation measures through 2019 would lead to further deterioration of public sector debt
to 58.8 percent instead of 53.3 percent by 2019. Strengthening the medium-term fiscal framework and
identifying clear policy measures in support of the fiscal targets would be important to slow down the
increase in public debt.
4.50. Amongst the alternative scenarios, no change in pension policies and the full implementation
of the current Government program appear to place public sector debt on a very steep path. Relative
to the baseline projection of 53.3 percent in 2019, the public sector debt-to-GDP ratio can reach 61.7 percent
if the Government were to fully implement its electoral program and spiral up even further to 68.1 percent

80
if pension policies remain unchanged. On the other hand, improvements in revenue ratios would lead to a
significant decline in public debt over the medium-term. In this context, it would be important for the
government to assess the fiscal costs of the current tax exemptions.
4.51. Frontloading the implementation of the fiscal rule could slow down the increase in public
debt. The Government has proposed a fiscal rule which would be implemented in 2017. The chosen
numerical targets seems broadly appropriate for FYR Macedonia’s country-specific circumstances. The
Government could consider implementing the fiscal rule from 2015 onward to anchor its fiscal policy. The
implementation of the numerical rule should be accompanied with measures to strengthen PFM, including
fiscal transparency, commitment control and medium-term budgeting.

81
ANNEX 4
Annex Table 4.1: Selected Macroeconomic Indicators
2012 2013 2014 2015 2016 2017 2018
est.
Real economy Annual percentage change, unless otherwise indicated
Nominal GDP (MKD billion) 466.7 499.6 516.6 540.5 572.3 607.1 644.0
GDP Per Capita (US$) 4548 4838 4998 5173 5370 5584 5808
Real GDP -0.5 2.7 3.3 3.5 3.8 4 4
Contributions to growth (percentage points):
Final consumption 0.1 -0.5 2.1 3.8 2.3 3.1 1.4
Gross capital formation 1.9 0.3 1.3 1.9 1.7 0.4 1.3
Net exports -2.4 2.9 3.3 -1.3 0.0 0.0 0.7
Real imports 2.0 -2.7 8.2 6.8 7.0 7.0 7.4
Real exports 8.2 -10.0 9.0 7.2 8.3 8.4 7.3
Unemployment rate (percent, end-of-period) 31.0 29.0 ─ ─ ─ ─ ─
Prices
GDP deflator (2005) -16.1 1.1 0.1 1.2 3.2 5.3 7.4
CPI (end-of-period) 4.7 1.4 0.1 1.1 2.0 2.0 2.0
CPI (average) 3.3 2.8 0.1 1.1 2.0 2.0 2.0
Central Government Fiscal accounts Percent of GDP, unless otherwise indicated
Revenues 29.6 28.1 28.1 28.1 28.1 28.1 28.1
Expenditures 33.4 31.9 31.8 31.5 31.3 31.0 30.8
Central government balance -3.8 -3.9 -3.7 -3.4 -3.2 -2.9 -2.8
Gross central government debt 33.3 34.0 38.3 35.8 37.3 38.4 39.3
Gross public sector debt 1/ 38.3 40.5 48.5 49.2 53.1 53.9 54.3
Selected Monetary Accounts
Base Money 4.4 5.3 5.5 5.7 6.1 6.4 6.8
Credit to private sector 5.2 6.3 7.2 7.5 8.0 8.5 9.0
Balance of Payments Annual percentage change, unless otherwise indicated
Current account balance -2.9 -1.8 -1.8 -2.3 -3.0 -2.8 -2.8
Trade balance -22.6 -18.6 -16.7 -15.9 -15.9 -15.7 -14.5
Exports (BOP basis) 45.4 43.8 48.7 50.4 51.7 52.6 54.4
Imports (BOP basis) 66.8 69.1 65.3 66.4 67.5 68.3 68.9
Foreign direct investment (FDI) 1.5 3.3 3.5 3.8 4.0 4.0 4.0
Gross international reserves (US$ mn, eop) 2589 2445 3136 3058 3130 3248 3406
in months of imports 4.8 4.4 4.7 4.3 4.1 4.0 4.0
External debt 2/ 66.1 64.0 71.3 70.4 71.0 70.8 70.8
Exchange rate (MKD/USD, average) 47.9 46.4 ─ ─ ─ ─ ─
Population and Poverty
Population, Total (millions) 2.11 2.11 2.12 2.13 2.13 2.13 2.13
Population Growth (% change, y-o-y) 0.08 0.08 0.08 0.08 0.08 0.08 0.08
Poverty ratio (% of population) 26.2
Inequality - Income Gini 38.5 38.8
Life Expectancy 75.0
HDI (Human Development Index) Scores 0.730 0.732
Memo items:
Nominal GDP (US$ million) 9745 10768 ─ ─ ─ ─ ─
1/ Incudes the debt of municipalities and publick enterprices, but not the debt of the central bank (NBRM)
2/ Excludes central bank repo arrangements
Source: Macedonia State Statistical Office, Ministry of Finance, National Bank of Macedonia, World Bank staff estimates.
projections

82
Annex Table 4.2: General Government Fiscal Accounts
% of GDP 2010 2011 2012 2013 2014 2015 2016 2017 2018
est.
Revenues 32.4 31.7 32.1 30.2 30.2 30.1 30.1 30.0 29.9
Taxes and Contributions 27.1 27.0 26.6 25.6 26.2 26.3 26.2 26.1 26.0
Non-tax revenues 4.1 3.1 3.0 2.6 2.4 2.3 2.3 2.4 2.4
Capital Revenues 0.6 1.1 1.6 1.1 0.8 0.8 0.8 0.7 0.7
Grants 0.4 0.3 0.7 0.9 0.7 0.7 0.7 0.7 0.7
Revenue from repayment of loans 0.1 0.2 0.1 0.1 0.1 0.1 0.1 0.1 0.1
Primary Expenditures 34.1 33.5 35.0 33.3 32.9 32.6 32.1 31.4 31.1
Current expenditures 29.6 28.7 29.8 28.9 29.0 28.6 28.1 27.7 27.5
Wages 7.9 7.7 7.7 7.2 7.1 7.0 6.8 6.7 6.6
Goods and services 4.8 4.3 4.7 4.4 4.5 4.5 4.4 4.2 4.2
Transfers 17.0 16.6 17.4 17.3 17.5 17.2 17.0 16.8 16.7
Capital expenditures 4.5 4.8 5.2 4.4 4.3 4.2 4.3 4.1 4.0
Primary Balance -1.7 -1.8 -3.0 -3.1 -2.7 -2.4 -2.0 -1.4 -1.1
Interest payments 0.7 0.7 0.9 0.9 0.9 1.0 1.2 1.4 1.6
Domestic 0.2 0.2 0.3 0.4 0.5 0.3 0.5 0.5 0.6
External 0.5 0.5 0.6 0.5 0.4 0.6 0.8 0.9 1.0
Overall balance -2.4 -2.6 -3.9 -4.0 -3.6 -3.4 -3.2 -2.8 -2.7
Financing 2.4 2.6 3.9 4.0 3.9 3.7 3.5 3.1 2.9
Inflows 6.9 8.4 9.5 14.8 14.2 14.0 11.0 9.4 8.9
Domestic 4.4 4.8 10.4 10.9 8.3 6.3 6.1 5.5 5.1
External 1.6 5.1 1.7 4.0 7.1 3.4 4.8 4.0 4.0
Deposits 0.9 -1.5 -2.6 0.0 -1.2 4.2 0.0 -0.2 -0.3
Outflows 4.5 5.8 5.6 10.8 10.3 10.3 7.5 6.3 6.0
Domestic 3.9 5.2 4.8 8.1 8.6 6.7 5.1 4.8 4.3
External 0.6 0.7 0.7 2.7 1.8 3.6 2.4 1.5 1.7
projections
Note: general government includes the budgets of the core government, consolidated extra-budgetary funds (pension fund, health
fund, unemployment agency and the road fund (till 2013) and municipalities.
83
CHAPTER 5. TRANSPORT
A. INTRODUCTION
5.1. Good connectivity with the rest of the world is key for a small, open economy like FYR
Macedonia, which needs to rely on exports to sustain long-term growth. The transport sector therefore
plays an important role for FYR Macedonia’s economic development. Since independence, one of FYR
Macedonia’s key challenges has been to reduce the economic distance to markets and to further develop
the South East Europe Transport Observatory (SEETO) Comprehensive Network71 and integrate it in the
European Union’s transport network. Uninterrupted access to deep-sea ports is also considered a priority
since the trade embargos of the ‘90s. In addition to providing international connectivity and enhancing
regional integration with the EU, the road network is critical for providing access and connectivity inside
the country. Public expenditure on transport infrastructure (including both capital and maintenance) has
averaged 1 percent of GDP between 2005 and 2013. The Government has announced in its Government
Program 2014-2018 to increase public spending in the road sector to around 2 percent of GDP over the next
four-year period. This represents an important development opportunity for the country, both in terms of
infrastructure and of employment, if efficiently managed and executed.
5.2. Improving road investment planning and the efficiency of maintenance spending will be key
for Macedonians to reap the full benefits of its scaled-up investment program. Accurate and detailed
information about the current condition of the road network and the timely implementation of a road-asset
management framework (RAMS) will be key for improving investment planning and the allocation of funds
for maintenance and new investment. Strengthening prioritization of investments, moving to multi-year
road investment targets and introducing performance-based contracts for maintenance is likely to improve
the efficiency of public spending.
5.3. This chapter is organized as follows. First, it provides a summary of the road network and its
quality, benchmarking it against regional comparators. Next, it describes the institutional and planning
framework of the road sector. Then, it analyzes expenditures and revenues of the two key public enterprises
in the roads sector before discussing the efficiency of transport spending. The final section discusses policy
options.
B. THE ROAD NETWORK
5.4. Road transport continues to be the predominant transport mode for both passenger and
freight transport in FYR Macedonia. According to the SSO, road transport carried 98 percent of
passengers and 93 percent of exported and internally transported goods in 2013. Road transport is also the
key mode for inter-urban passenger travel, as the rail network, which has a total length of 699 km, serves
mostly the large urban areas along transport corridors. Consequently, the road network constitutes the
primary transport mode for internal mobility and trade.
5.5. Demand for road infrastructure is likely to increase. Roads in the country are classified in two
main categories: state roads72 and local roads. State roads consist of (1) national roads, including
motorways, that primarily connect Macedonia to neighboring countries and the largest regional centers;
71 This includes Corridor X, which connects Austria to Turkey, and Corridor VIII, which connects Albania to the
Black Sea ports in Bulgaria. 72State roads consist of: (1) national roads including motorways which connect to neighboring countries and the
largest regional centers; and (2) regional roads which connecting municipalities and secure critical in-country
connectivity.

84
and (2) regional roads, which connect municipalities and provide critical in-country connectivity (Table
5.1). Local roads serve municipal traffic. Traffic73 on the road network varies: the largest volume of traffic
is on national roads near the bigger economic areas of Skopje, Tetovo, Kumanovo, Strumica, and Bitola.
On most of these sections, the Average Annual Daily Traffic (AADT) reaches 7,000-10,000 vehicles. The
daily average on most other state roads is significantly lower. In fact, 22 percent of national roads and 90
percent of regional roads carry less than 3,000 vehicles per day, while 62 percent of the state roads carry
only between 1,000 and 3,000 vehicles per day. In the period between 2007 and 2013, vehicle ownership
grew by 65 percent from 248,774 vehicles to 411,637 and passenger/kilometers traveled increased by 36
percent. Vehicle ownership and use is expected to increase further as FYR Macedonia continues to grow
and unemployment declines.
Table 5.1: State Roads Classification and Condition
State Road Network Length
(km)
Paved
(km)
Paved
(%)
Good or Fair
Condition (%)
National Roads and Motorways 1,112 945 85% 91%
Regional Roads
R1 Regional Roads
R2 Regional Roads
3,721
2,041
1,680
3,021
1,889
1,131
81%
93%
67%
75%
82%
68%
Total State Road Network 4,833 3,966 82% 79% Source: PESR, 2013.
5.6. The density of the road network is relatively high. FYR Macedonia’s road network density,
defined as amount of kilometers of road per capita and per square kilometer, is relatively high. FYR
Macedonia’s road length per square kilometer amounted to 54.4, which is significantly above the ECA
average of 28.4 and only exceeded by Kosovo in the SEE6 region (Figure 5.1). The percentage of paved
roads amounts to 58 percent in FYR Macedonia, which is relatively low compared to the SEE6 average of
61 percent. Yet, gravel roads are justified in case of low traffic. And indeed, traffic seems to be low on
most of these gravel roads in FYR Macedonia.
Figure 5.1: Road Network a) Road density (km per 100 sq.km of land area) b) Paved roads in percent total road km
Source: WDI 2010.
5.7. A conclusive assessment of the condition of the road network is currently not available. The
Public Enterprise for State Roads (PESR) estimated in 2014 that slightly less than 80 percent of the
Macedonian state road network was in good or fair (i.e. sustainable) condition. An alternative preliminary
73 Data on network characteristics is provided by PESR.
0
20
40
60
80
100
120
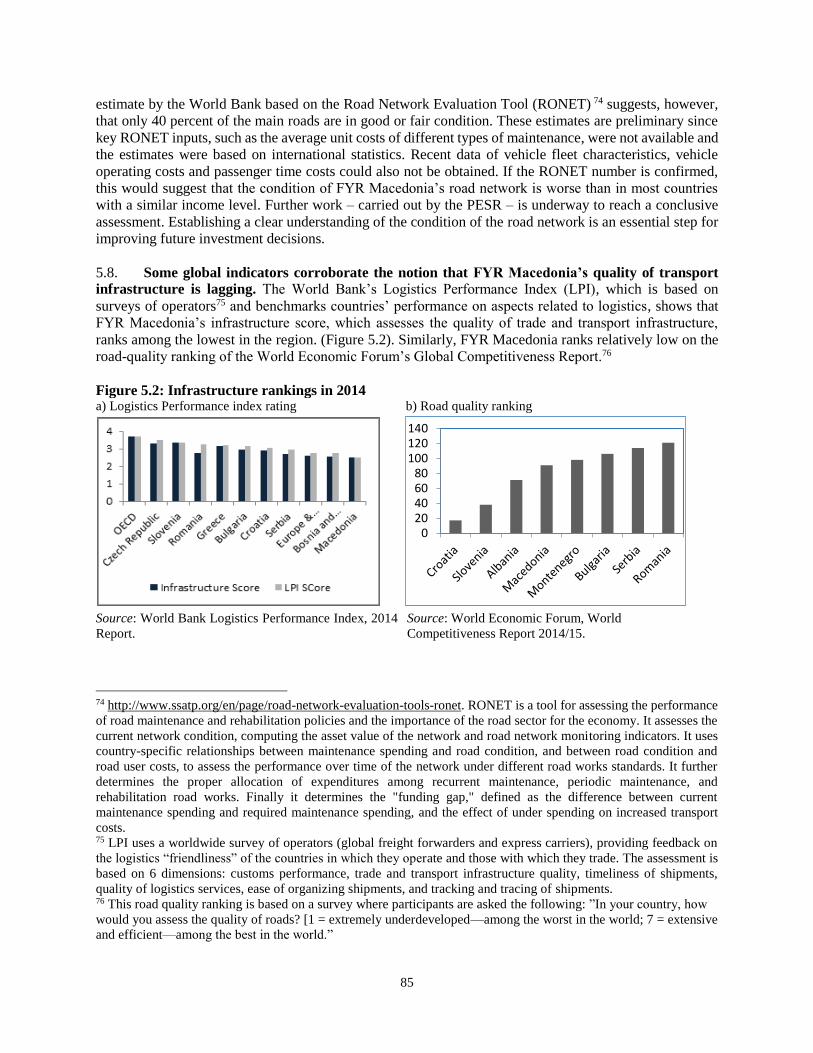
85
estimate by the World Bank based on the Road Network Evaluation Tool (RONET) 74 suggests, however,
that only 40 percent of the main roads are in good or fair condition. These estimates are preliminary since
key RONET inputs, such as the average unit costs of different types of maintenance, were not available and
the estimates were based on international statistics. Recent data of vehicle fleet characteristics, vehicle
operating costs and passenger time costs could also not be obtained. If the RONET number is confirmed,
this would suggest that the condition of FYR Macedonia’s road network is worse than in most countries
with a similar income level. Further work – carried out by the PESR – is underway to reach a conclusive
assessment. Establishing a clear understanding of the condition of the road network is an essential step for
improving future investment decisions.
5.8. Some global indicators corroborate the notion that FYR Macedonia’s quality of transport
infrastructure is lagging. The World Bank’s Logistics Performance Index (LPI), which is based on
surveys of operators75 and benchmarks countries’ performance on aspects related to logistics, shows that
FYR Macedonia’s infrastructure score, which assesses the quality of trade and transport infrastructure,
ranks among the lowest in the region. (Figure 5.2). Similarly, FYR Macedonia ranks relatively low on the
road-quality ranking of the World Economic Forum’s Global Competitiveness Report.76
Figure 5.2: Infrastructure rankings in 2014 a) Logistics Performance index rating b) Road quality ranking
Source: World Bank Logistics Performance Index, 2014
Report.
Source: World Economic Forum, World
Competitiveness Report 2014/15.
74 http://www.ssatp.org/en/page/road-network-evaluation-tools-ronet. RONET is a tool for assessing the performance
of road maintenance and rehabilitation policies and the importance of the road sector for the economy. It assesses the
current network condition, computing the asset value of the network and road network monitoring indicators. It uses
country-specific relationships between maintenance spending and road condition, and between road condition and
road user costs, to assess the performance over time of the network under different road works standards. It further
determines the proper allocation of expenditures among recurrent maintenance, periodic maintenance, and
rehabilitation road works. Finally it determines the "funding gap," defined as the difference between current
maintenance spending and required maintenance spending, and the effect of under spending on increased transport
costs. 75 LPI uses a worldwide survey of operators (global freight forwarders and express carriers), providing feedback on
the logistics “friendliness” of the countries in which they operate and those with which they trade. The assessment is
based on 6 dimensions: customs performance, trade and transport infrastructure quality, timeliness of shipments,
quality of logistics services, ease of organizing shipments, and tracking and tracing of shipments. 76 This road quality ranking is based on a survey where participants are asked the following: ”In your country, how
would you assess the quality of roads? [1 = extremely underdeveloped—among the worst in the world; 7 = extensive
and efficient—among the best in the world.”
020406080
100120140

86
C. PUBLIC MANAGEMENT OF THE ROAD SECTOR
5.9. There are three main institutions in the road sector:
i. The Ministry of Transport and Communication (MOTC) is responsible for: i) developing
and executing FYR Macedonia’s transport policy; ii) setting technical regulations77 and
standards for roads, road traffic and vehicles; iii) prescribing activities required for
reconstruction and construction projects of state roads; and iv) supervising the implementation
of transport legislation.
ii. The Public Enterprise for State Roads (PESR) is mandated to plan, construct, rehabilitate,
manage and protect state roads and is responsible for the preparation of road development
programs and financing plans. The PESR was established in December 2012, through a Law
Amending the Law on Public Roads.78 PESR was assigned over the rights, employees and
assets of the former Agency for State Roads with wider managerial and financial independence
stemming from its status as a public enterprise. The Government appoints PESR’s Management
Board, which elects its Director. The PESR and Makedonija Pat are 100-percent owned by the
Government of FYR Macedonia. The PESR presently has 320 employees, of which 260 are
dedicated to toll-collection processes. Fifteen of the remaining 60 employees are civil engineers
managing the road network. In 2013, the toll collection branch of Makedonija Pat was merged
with PESR, leaving Makedonija Pat to focus only on maintenance.
iii. Makedonija Pat is the public enterprise responsible for the maintenance of the national and
regional road network, signalization installation and maintenance and traffic counting. It
currently employs about 900 workers, of whom 30 are engineers. It is responsible for the
maintenance of 4,000 km of paved roads.
5.10. The PESR is responsible for implementing the policy directives from the Ministry of
Transport and Communications (MOTCs). The Ministry of Transport and Communications (MOTC) is
in charge of developing and implementing transport strategies and policies. The National Transport
Strategy 2007-201779 represents the strategic framework for policy decisions and investments in the sector
and it guides the programs of the enterprises entrusted to manage the transport networks without going into
details of the road investment program. This Strategy is updated biennially. The PESR develops the Five-
Year Strategic Program (PESR Strategic Program), which details the road sector investment program,
taking into consideration the country’s National Transport Strategy 2007-2017. The PESE Strategic
Program is adopted by PESR’s Management Board and subject to Government endorsement. The latest
PESR Strategic Program80 covers the period 2013-2017. In addition to the investment program implemented
within this strategic framework, the Ministry of Transport finances selected road projects through the
central government budget on an ad-hoc basis. While relatively small (around MKD 18 million in 2012),
ad-hoc investment decisions in infrastructure that are initiated outside a strategic framework tend to yield
lower economic returns and would best be avoided.
77 Law on Public Roads, Article 25. 78 The provisions for these enterprises are in the Law on Public Roads (available on http://roads.org.mk/368) and Law
on Public Enterprises (available on http://roads.org.mk/369) 79 The National Transport Strategy is published on the website of the Ministry of Transport and Communications and
available at http://mtc.gov.mk/new_site/en/storija.asp?id=1782 80 The Five Year Strategic Program 2013-2017 is available on PESR’s website: http://roads.org.mk/374/five-year-
program .

87
5.11. The road-sector development plans are primarily guided by national set priorities rather than
a clear evaluation of infrastructure needs. In the absence of a road asset management system that would
provide a holistic view of the current network condition, the PESR develops the program primarily on the
basis of nationally set priorities, as outlined in the Government program and the National Transport Strategy
and taking into account some recommendations from PESR’s network supervision engineers based only on
visual inspections of the network. Since 2013, the PESR has been working on introducing a road asset-
management system entailing the collection of detailed road-condition data, but it has not yet completed
this process. The PESR is also investing in the provision of equipment for pavement measurement to enable
regular monitoring of the condition of the state road network.
D. EFFICIENCY OF TRANSPORT SPENDING
5.12. Maintenance spending has been on a declining trend, but increase significantly in 2013 due
to IFI financing. The budget allocated to Makedonija Pat, which executes the State roads annual
maintenance program as PESR’s direct contractor, was about EUR 13 million or EUR 3,305 per km for
routine and winter maintenance in 2014, which is relatively low by regional standards. PESR’s Strategic
Program suggests that this low budget allocation will remain the same until 2017. A review of the annual
maintenance programs in the past 5 years shows a continuously decreasing annual maintenance budget.
One particularly notable decrease refers to the budget for bridge maintenance which has been set at a
minimum annual amount of EUR 16,000. A reasonable level of bridge maintenance seems questionable
with such limited funds. However, total annual maintenance and rehabilitation expenditures (implemented
by the PESR and Makedonija Pat) has been increasing from about 20 million EUR to the order of 28 million
EUR in 2009 toward 42 million EUR in 2013 due to an IPA grant financed rehabilitation of Corridor X and
the expansion of the rehabilitation program implemented by PESR since 2008.81 At 10,365 EUR/km total
maintenance spending is relative high by regional standards and can address some of the maintenance
backlog. This relatively high maintenance spending, however, is IFI funded and only temporary. A
systematic approach to maintenance would require that adequate budget resources are secured permanently.
Figure 5.3: Maintenance Spending a) Expenditure on Maintenance (EUR/km) b) Makedonija Pat's Annual Maintenance Budget
2009-2014 (thousands of EUR)
Source: Figure 6.4a. Comparative data provided from Transport Expenditure Review in Albania, November 2013.
Figure 4.6b. Data provided by Makedonija Pat as presented in Annual Programs.
81 The later substantially improved the state of the regional road network because it included rehabilitation combined
with widening and upgrading thereby raising the standard of those roads above the initial standard. These sections
required larger and more expensive treatments as a result of the historic maintenance deferrals, and they bear lessons
as to the economics of deferring maintenance. In order to safeguard the restored conditions on these sections,
sufficient maintenance will be needed.
0 5000 10000
Romania (2011)
Serbia(2012)
BiH (2011)
Kosovo (2011)
Macedonia (2014)
Albania (2012)
9,303
9,039
7,797
3,742
3,305
2,914
0
5,000
10,000
15,000
20,000
2009 2010 2011 2012 2013 2014periodic maintenancewinter maintenanceroutine maintenancebridge maintenanceother activities

88
5.13. Yet, maintenance needs are projected to remain high as maintenance spending is projected
to decline. Scenarios based on RONET suggest that significantly higher maintenance expenditures will be
necessary to improve the asset value of the Macedonian road network. Significantly higher maintenance
expenditures come out as necessary under different scenarios analyses in order to improve the asset value.
Table 5.2 presents a comparison of annual rehabilitation, periodic maintenance and routine maintenance
costs in years 1 to 5 and in years 6 to 20, in US$ million per km, for the different budget scenarios. Under
the Optimal82 (unconstrained budget) Scenario, US$332 million per year is needed in years 1-5, of which
71 percent is dedicated to rehabilitation works. This will eliminate the rehabilitation backlog and in years
6 to 20 the requirements for rehabilitation and maintenance works decreases to US$154 million per year.
The do minimum scenario requires US$220 million per year in years 1-5 and US$127 million per year in
years 6-20 (Table 5.2).
Table 5.2: Comparison of Annual Road Agency Costs
Annual Costs in Years 1 to 5 (MUS$/year)
Periodic Routine
Budget Rehabilitation Maintenance Maintenance Total
Scenarios (M US$/year) (M US$/year) (M US$/year) (M US$/year)
Optimal 236 73 24 332
Constraint 1 236 16 24 275
Constraint 2 236 1 24 260
Constraint 3 235 0 24 258
Do Minimum 196 0 24 220
Annual Costs in Years 6 to 20 (MUS$/year)
Periodic Routine
Budget Rehabilitation Maintenance Maintenance Total
Scenarios (M US$/year) (M US$/year) (M US$/year) (M US$/year)
Optimal 1 129 24 154
Constraint 1 59 61 24 144
Constraint 2 123 11 24 157
Constraint 3 92 0 24 115
Do Minimum 104 0 24 127
5.14. Higher maintenance spending would likely to lead to significant road user savings. Comparing
different budget scenarios83 in terms of present value, at 10 percent discount rate, of road agency costs, road
user costs and total transport costs (sum of road agency plus road user costs), in US$ million, over a 20 year
evaluation period shows that for every dollar the road agency incrementally spends on maintenance, road
users save 3.48 dollars (Table 5.3). This is consistent with transport studies which show that economic costs
of poor road maintenance are borne primarily by road users. When a road is allowed to deteriorate from
82 RONET estimated the rehabilitation, periodic maintenance and recurrent maintenance needs of the network under
an unconstrained budget scenario (Optimal Scenario) that maximized the present value of total transport cost (sum of
road agency costs plus road user costs) of the network at a 10 percent discount rate. RONET also evaluated the
consequences of budget constraints by evaluating three budget constraint scenarios in addition to the do minimum
scenario that represent doing only rehabilitation when the roads reach very poor condition. 83 The budget scenarios being evaluated are the following: (a) Optimal - Scenario that maximizes total transport costs
over the evaluation period; (b) Budget Constraint 1 - Scenario with 21% reduction on road agency costs compared to
the optimal budget scenario; (c) Budget Constraint 2 - Scenario with 27% reduction on road agency costs compared
to the optimal budget scenario; (d) Budget Constraint 3 - Scenario with 36% reduction on road agency costs compared
to the optimal budget scenario; (e) Do Minimum – Scenario that executes over the evaluation period only routine
maintenance and rehabilitation when a road is in very poor condition.

89
good to poor condition, each dollar saved on road maintenance increases VOCs by between $2 and $3. Far
from saving money, cutting back on road maintenance increases the cost of road transport and raises the
net cost to the economy as a whole. Furthermore, when traffic levels rise, as they have been in most
countries, the proportion of total road transport costs attributable to vehicle operation will also increase
sharply, while those attributable to road expenditures will decline. Poor road maintenance also raises the
long−term costs of maintaining the road network. Maintaining a paved road for 15 years costs about
$60,000 per km. If the road is allowed to deteriorate over the 15−year period, it will cost about $200,000
per km to rehabilitate it. In other words, rehabilitating paved roads every 10 to 20 years is more than three
times as expensive, in cash terms, as maintaining them on a regular basis, and 35 percent more expensive
in terms of net present value discounted at 12 percent per year (Heggie and Vickers 1998).
Table 5.3: Comparison of Budget Scenarios
Present Value of Costs at 10% Increase Decrease Benefit
Road Road Total Net Agency User Cost
Budget Agency Users Transport Benefits* Costs* Costs* Ratio
Scenarios (M US$) (M US$) (M US$) (M US$) (M US$) (M US$) (#)
Optimal 2,363 26,736 29,099 2,224 895 3,119 3.48
Constraint 1 1,857 27,759 29,617 1,707 390 2,096 5.38
Constraint 2 1,732 28,761 30,493 830 264 1,094 4.14
Constraint 3 1,507 29,560 31,066 257 39 296 7.65
Do Minimum 1,468 29,855 31,323 0
* Comparison with Do Minimum Scenario
5.15. Allocation of maintenance funds seems currently inefficient. Annual maintenance contracts are
established between Makedonija Pat and PESR based on the maintenance program developed by PESR.
While the program does take into consideration the advice of PESR’s supervision engineers, it would appear
that the budget for maintenance is determined as the residual after subtracting from PESR’s income the
estimated cost of construction, upgrading and rehabilitation to be carried out by PESR and other large
expenditures such as loan repayments. Moreover the program is not consulted with Makedonija Pat before
adoption and therefore does not benefit from input provided by Makedonija Pat’s teams deployed across
the network. The quality of maintenance implemented by Makedonija Pat is not satisfactory, a result of
limited budgets available to Makedonija Pat and limited staff capacity and generally timeworn equipment.
Moreover, Makedonija Pat appears to be overstaffed. Over the last years, more than a third of Makedonija
Pat’s revenues or 40 percent of operating costs was allocated to staff expenses. The high labor intensity is
also explained by a low level of mechanization of its maintenance practices and the poor condition of its
equipment. Typically, winter maintenance accounts for 40 to 50 percent of the annual budget; while the
routine maintenance absorbs between 30 and 40 percent and periodic maintenance (including bridges)
attains about 5 percent (equal to an invariable MKD 170,000,000 - about EUR 2.8 million). In most cases,
higher winter maintenance costs are covered through reallocations from periodic maintenance, which
includes important maintenance tasks, such as resurfacing, maintenance of bridges and signalling.
5.16. In order to maintain the current asset value, maintenance should receive more priority
funding in annual budgeting programs rather than new construction. The current spending level for
maintenance is below the necessary amount to assure sufficient network condition.84 As significant financial
amounts are spent on upgrading and extending the road infrastructure, the future maintenance financing
will grow even more to provide for the extended network. Even more, a large part of the network to be
extended is planned to include new motorway and expressway sections, so it is important to consider the
medium term maintenance needs for this road category. In the effort to provide sufficient funds for the
84 Though PESR and Makedonija PAT spent more than EUR10,000 in 2013, maintenance spending is likely to fall
below EUR3,000 once IFI funding is exhausted.

90
network upgrade, the further reduction of maintenance budgets will actually increase the long-term costs
of maintaining a road infrastructure. The box below presents briefly the costs of insufficient road
maintenance that have been established through detailed analysis of network management experiences
across developing countries.
5.17. Lack of reliable data makes it difficult to plan efficiently and reduces transparency. In the
absence of reliable data and formal techniques of economic appraisal, project identification and
prioritization is likely to remain weak. Improved data collection and monitoring should help strengthen the
PESR Strategic Program updates and increase the economic impact of program.
5.18. Privatization of road maintenance could improve the efficiency of maintenance spending.
Gradually phasing out the direct contract arrangement for maintenance that currently exists through
Makedonija Pat and moving to commercially performance maintenance is likely to improve the efficiency
and quality of maintenance spending. Visual inspections suggest that the current contract arrangements
between PESR and Makedonija Pat are not providing good quality of works. This is a result of many factors,
including obsolete equipment for maintenance, limited staff capacity and insufficient funds. The National
Transport Strategy already identifies the “privatization of the road maintenance market” as one of its
objectives85 because this is correctly assessed to be of impact to the asset improvement, competitiveness
and functioning market economy”.
5.19. As the road investments are expected to be scaled up, a rapid implementation of the road
asset management framework will be important to strengthen investment and maintenance planning.
This will require strategic staffing, improvements in efficiency and sufficient budgetary resources for the
PESR. In particular, the PESR may require additional staff with competence in engineering, asset
management and network data collection. It would need to secure stable funding for the network data
collection, information systems necessary to compute the data and also for the PESR teams which will be
involved on a regular basis to carry out the data collection and operate the RAMS. Initial efforts to overcome
this restraint are being carried out with assistance from the Bank under two ongoing investment projects,
in the aim to institutionalize these practices. Historically, Makedonija Pat has carried out the responsibility
for traffic data collection and condition measurements, so additional analysis of the staff capacity existing
in Makedonija Pat could be done to assess the usefulness of targeted staff transfers. Country experiences
have confirmed appropriate staff and budget resources to be key success factors for the implementation and
proper use of RAMSs.
E. FINANCIAL SUSTAINABILITY
5.20. The PESR receives income from a variety of sources: i) an annual transfer from the central
government budget related to the fuel excise tax, which amounted to MKD1.9 billion (0.4 percent of GDP)
in 2013 or 34 percent of total revenues;86 ii) highway utilization tolls of MKD1.4 billion (0.3 percent of
GDP) in 2013 or 32 percent of total revenue; iii) vehicle registration fees (20 percent of total revenues in
2013); and iv) other income (Figure 5.3ba. PESR’s total revenues in 2013 were around EUR 78million. In
addition, the PESR has the right to contract loans with the approval of the Ministry of Finance. The total
amount of PESR loans amounted to MKD9.9 billion (2.0 percent of GDP) as of end 2013. All loans were
guaranteed by the state.
85 NTS 2007-2017, section 10. Objective 8, page 42.
86 The Law on Public Roads sets both a minimum transfer percentage and transfer frequency from the
Ministry of Finance to PESR.

91
Figure 5.4: PESR revenue and expenditures in 2013 a) Revenues b) Expenditures
Source: PESR.
5.21. PESR’s income is used primarily for the construction and rehabilitation of state roads, but
operating costs are high. Around 40 percent of expenses in 2013 were used for road construction and
maintenance. The latter includes payments to Makedonija Pat for annual routine and winter maintenance.
At the same time, the PESR’s operating expenses are high, constituting more than 30 percent of total
expenses once salaries are included (Figure 5.3b). Part of these relatively high costs stem from the
absorption of staff from Makedonija Pat for the toll collection system. It would thus be important to review
in detail the staffing needs and human resource capacities of Makedonija Pat and the PESR to reduce
operating costs and ensure that the right staff mix is available, in particular, for the implementation of the
investment and maintenance program, strategic planning and traffic management.
5.22. PESR revenues are expected to increase. First, revenues from toll collection are expected to
increase due to further improvements in toll collection and the planned extension of tolled network sections.
Toll revenues increased by 40 percent between August 2013 and August 2014 as the toll collection
responsibility was moved from Makedonija Pat to PESR and the toll revenue administration strengthened.
Yet, there is still scope for further efficiency gains. Moreover, tolls were increased by 30 percent in August
2014 and will likely continue to rise. Second, revenues from vehicle-registration fees rose due to three
factors: first, a 30-percent increase in the fees themselves in August 2014; second, improvements in the
management of the fee-transfer system between the vehicle-registration centers and the PESR and third, a
growing number of vehicles. Recent PESR projections for SEE6 show an increase in PESR revenues from
EUR70 million in 2014 to EUR101 million by 2018. (Figure 5.4a) The recent decrease of international oil
prices – if sustained –will negatively impact the excise tax revenues that PESR receives. As this represents
the biggest part of the core revenues, timely mitigation measures would need to be identified to ensure the
stable revenue situation in PESR and to avoid a deterioration in the condition of the road network.

92
Figure 5.5: Evolution of PESR revenues and expenditures 2005-2018 (in euros)
a) Revenues b) Expenditures
Source: PESR; 2015-2018 figures are estimates from the PESR Five-Year Strategic Program.
5.23. Budget projections utilized in the Five-Year Strategic Program 2013-2017 show a major
reliance on IFI financing in the upcoming period. IFI financing has been gradually growing during the
last decade and in most years represented between one fifth and one third of PESR’s annual budget (between
14 and 30 million EUR annually). Beginning in 2014, this financing has significantly increased and is
planned by PESR to account for over 65 percent of the annual budget. Specifically, annual IFI financing of
PESR’s program in 2014 is already 138 million EUR, planned to grow to 196 million in 2016 and slightly
decrease by 2018 to 159 million EUR annually. This is predominantly financing from the Chinese Exim
Bank provided to PESR for the construction of two new motorways.
5.24. After years of relatively low investment, road infrastructure investments are expected to grow
significantly from 2014 onwards. From 2015, the planned expenditure represents more than 2.2 percent
of GDP which is more than twice the historical ten year average. For the PESR, this means annual
expenditures of around 221 million in 2016, 266 million in 2017 and 232 in 2018, which is three times the
size of its earlier investment programs. This scaling up is largely due to new construction (Figure 5.4b).
This is comparable to the level of the new EU member states, which in the period of EU accession reached
investment levels87 in inland transport infrastructure of 2 percent of GDP. However, the success of this
program will be to a significant degree determinant by the quality of the investment and maintenance
planning.
5.25. Though maintenance needs are likely to increase, maintenance spending is projected to
decline. As the Government continues to expand the road network and traffic increases, maintenance needs
are likely to increase. If not properly maintained, these newly built/upgraded sections will deteriorate and
not only result in a reduced network performance but also in higher financing needs for the more expensive
reconstruction and rehabilitation. At the same time, the maintenance budget is projected to decline (Figure
5.5). Reducing the maintenance backlog and ensuring that future maintenance needs are met, which would
require around 5,000-7,000US$ per kilometer, will require that sufficient resources are channeled to
maintenance and that maintenance is implemented efficiently.
87 International Transport Forum, July 2011. http://www.internationaltransportforum.org/statistics/StatBrief/2011-
07.pdf

93
Figure 5.6: Total financing of maintenance, 2009-2018 (in euros)
Source: PESR data.
F. CONCLUSIONS
5.26. As the Government scales up investment in road infrastructure, it will become increasingly
important to strengthen road investment planning and complete the timely introduction of the
RAMS. Better planning would enable the Authorities to make informed choices among capital investment
versus maintenance spending, geographic areas, and poverty and economic impacts and increase the
efficiency of public spending. The implementation of a RAMS would enable the Government to obtain
objective and quantitative information, which is need for sound road investment planning, and base
investment decisions on a holistic life-cycle analysis of construction costs, maintenance and road users’
costs. The PESR should therefore complete timely implementation of the RAMS, ensure that sufficient in-
house capacity exists to operate and update it regularly. The Management Board of PESR should play a
strong guiding role in the evidence-based investment planning in PESR and should therefore have the
necessary technical expertise.
5.27. The Government should ensure that funding for maintenance is sufficient, address the
current maintenance backlog and improve the efficiency of maintenance spending. Simulations
suggest that for every additional dollar the Government spends on maintenance, road users would save 3.48
dollars. A key input for assessing current maintenance needs is to obtain conclusive information of the
condition of the road network will be key for proper road network management. The PESR should therefore
complete the road network condition survey and improve the traffic data collection. Road condition and
traffic surveys should become PESR’s integral practices, conducted regularly and used to generate the road
investment program based on an economic analysis to a road network, based on modeling life-cycle costs
(such as HDM4). Moreover, the efficiency of maintenance spending could be improved by moving to
commercially performed maintenance. Introducing medium-term performance-based contracts for
maintenance would help to ensure better quality and regular maintenance, preventing premature network
deterioration and extending the life-span of the network. In addition,
5.28. More transparency around road infrastructure investments would improve the efficiency of
public spending. Though the PESR already provides significant public information on its website,
transparency around public spending could be improved. Better information on the condition of the road
network condition, which could be published in annual reports, would not only improve the planning
process but also provide more transparent information about the performance of PESR and the use of public
funds.
0
10,000,000
20,000,000
30,000,000
40,000,000
50,000,000
2009 2010 2011 2012 2013 2014 2015 2016 2017 2018
Maintenance financed by PESR (EUR)
Maintenance by Makedonija Pat (EURO)

94
CHAPTER 6. HEALTH
A. INTRODUCTION
6.1. Macedonia has made important progress in reforming the financing and organization of
health care, but challenges remain. A combination of increased hospital costs, flat outlays, and limited
progress in politically difficult reforms (particularly hospital restructuring and benefit package
management) is contributing to hospital deficits, rationing of care, and increased out-of-pocket expenditures
by the population. The level of health spending in Macedonia is similar to the average for other upper-
middle income countries, but in recent years it has declined as percentage of GDP and as a percentage of
total budget outlays - even as the quantity and unit cost of hospital services have increased. Health
Insurance Fund (HIF) revenues remain heavily dependent on payroll contributions from the minority of the
population in formal employment. Macedonia has undertaken reforms in establishing the HIF as a single
payer for health care services, in reforming the organization and financing of primary care, in introducing
case payments for hospitals and has achieved significant savings on pharmaceuticals and medical devices.
HIF has also made significant progress in strengthening the treasury function and has established a high
level of transparency in reporting health expenditure information through its publication of annual reports
and audits. But despite earlier efforts to clear HIF arrears and put in place treasury controls, hospital arrear
payments are steadily accumulating and are currently equal to 0.6 percent of GDP. There is evidence of
increased rationing of health care and increased out-of-pocket health spending.
6.2. Several policy reforms would be required to address these challenges. Inefficiencies with
respect to the provision of health care could be improved through legislative and regulatory changes that
give hospital managers increased autonomy and accountability. Updating the DRG costing and phasing out
subsidies to inefficient hospitals could improve the quality of the services provided. Improvements in the
procurement of pharmaceutical and medical devices could generate savings that could be channeled towards
the underfunded - primary and preventive care sector, which would help to decelerate the increase of non-
communicable diseases.
6.3. This chapter is structured as follows: The next section provides an overview of the Macedonia
health sector and the health status of the Macedonian population. Section 3 assesses trends in public health
expenditures and revenues. Sector 4 analyses the efficiency of health sector spending. The final section
presents policy options.
B. HEALTH OUTCOMES AND SERVICES
6.4. Macedonians are about as healthy as people in other SEE6 countries, but not as health as
people in the EU member countries, and inequalities persist. By 2012, general life expectancy at birth
reached 74.8 years (77 years for women, and 72.7 years for men). That’s comparable to neighboring
countries like Serbia (75 years), but below the EU average of more than 80 years. The infant mortality rate
decreased from about 13 per 1,000 in 2003 to 7 in 2012, which has helped close the gap with most other
SEE6 countries, but it’s still higher than the EU average of 4.1 per 1,000 (Figure 5.1). Infant mortality was
twice as high as this average in some regions, however, and among the Roma, it was even higher- 14 deaths
per thousand births (MICS 2011). In 2011, 4.9 percent of all children under age five suffered from chronic
malnutrition (stunting). The rate was three times higher among Roma children (16.5 percent stunted) and
nearly as high for children in the southwest region (13.3 percent stunted). It was twice as high on average
for children in the poorest quintile (7.2 percent stunted) (MICS 2011).
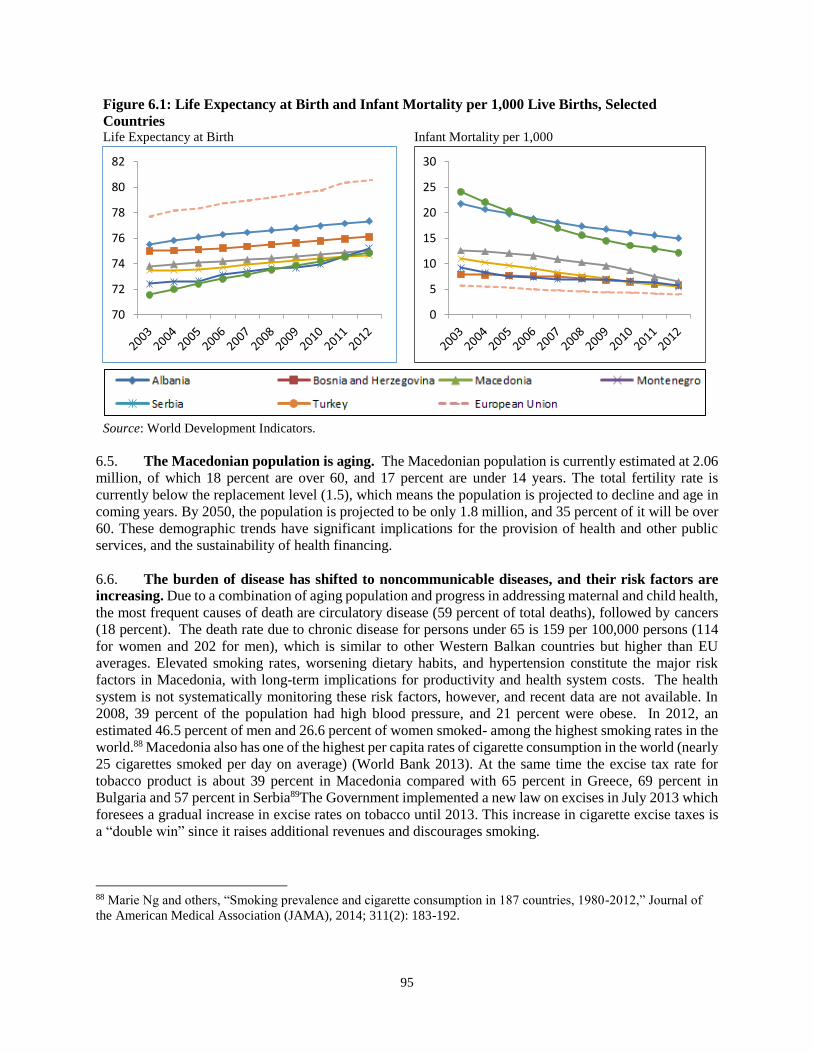
95
Figure 6.1: Life Expectancy at Birth and Infant Mortality per 1,000 Live Births, Selected
Countries Life Expectancy at Birth Infant Mortality per 1,000
Source: World Development Indicators.
6.5. The Macedonian population is aging. The Macedonian population is currently estimated at 2.06
million, of which 18 percent are over 60, and 17 percent are under 14 years. The total fertility rate is
currently below the replacement level (1.5), which means the population is projected to decline and age in
coming years. By 2050, the population is projected to be only 1.8 million, and 35 percent of it will be over
60. These demographic trends have significant implications for the provision of health and other public
services, and the sustainability of health financing.
6.6. The burden of disease has shifted to noncommunicable diseases, and their risk factors are
increasing. Due to a combination of aging population and progress in addressing maternal and child health,
the most frequent causes of death are circulatory disease (59 percent of total deaths), followed by cancers
(18 percent). The death rate due to chronic disease for persons under 65 is 159 per 100,000 persons (114
for women and 202 for men), which is similar to other Western Balkan countries but higher than EU
averages. Elevated smoking rates, worsening dietary habits, and hypertension constitute the major risk
factors in Macedonia, with long-term implications for productivity and health system costs. The health
system is not systematically monitoring these risk factors, however, and recent data are not available. In
2008, 39 percent of the population had high blood pressure, and 21 percent were obese. In 2012, an
estimated 46.5 percent of men and 26.6 percent of women smoked- among the highest smoking rates in the
world.88 Macedonia also has one of the highest per capita rates of cigarette consumption in the world (nearly
25 cigarettes smoked per day on average) (World Bank 2013). At the same time the excise tax rate for
tobacco product is about 39 percent in Macedonia compared with 65 percent in Greece, 69 percent in
Bulgaria and 57 percent in Serbia89The Government implemented a new law on excises in July 2013 which
foresees a gradual increase in excise rates on tobacco until 2013. This increase in cigarette excise taxes is
a “double win” since it raises additional revenues and discourages smoking.
88 Marie Ng and others, “Smoking prevalence and cigarette consumption in 187 countries, 1980-2012,” Journal of
the American Medical Association (JAMA), 2014; 311(2): 183-192.
70
72
74
76
78
80
82
0
5
10
15
20
25
30

96
6.7. Macedonia has reasonably good coverage of basic health services, although with some
inequities in outcomes and access. Macedonia has achieved equitable coverage of basic maternal and
child primary care preventative services (immunization, antenatal care, deliveries). Deliveries in health
facilities are nearly universal, and over 90 percent of children are fully immunized, with slightly lower rates
among the poorest quintile (86 percent). Only 63 percent of Roma children are fully immunized, however
(MICS 2011). Macedonians average five primary care visits per year, but with significant variation among
regions - for example, less than three visits per year on average in Gostivar and Tetovo (IPH 2013).
According to the Institute of Statistics, in 2011, 89 percent of population had access to primary health
services, a decline of 3.6 percent compared to the previous year. Primary care doctors see on average 16.5
patients per day, with lower workloads in Skopje and much higher ones in a few regions (e.g., 64 per day
in Kreva Palanka), suggesting shortages (IPH 2013). Although general practice doctors receive incentives
to increase screening and prevention for chronic diseases, in 2013 only 13 percent of insured persons (aged
25-65) received preventive activities for cardiovascular diseases, and only 13 percent of the target
population was screened for colon cancer (HIF 2014).
6.8. Macedonia inherited a health system with good geographic and financial access, but with
decentralized and fragmented service provision and financing. Under the former Yugoslavia, the health
system in Macedonia was publicly owned and highly decentralized to municipalities, with each
municipality providing a range of primary care and hospital services. Health services were financed on the
basis of inputs, with limited flexibility or autonomy for facility managers to improve service efficiency or
quality. This resulted high levels of coverage, but contributed to inefficiencies and shortcomings in service
provision and coordination – including excessive bed capacity and overstaffing of hospitals.
6.9. Following independence, Macedonia introduced reforms in health financing and primary
care. The Health Insurance Fund (HIF) was established in 2000, to serve as the main financer and purchaser
of health services, with the Ministry of Health in charge of policy formulation, system operation, and
stewardship. Services were initially reimbursed on a fee basis, contributing to overprovision and cost
escalation. In 2004 the HIF began paying hospitals based on modified global budgets accompanied by
contracts for service provision. In 2006, HIF initiated a program to shift toward a case payment system
based on Diagnostic Related Groups (DRGs). The government also initiated major reforms in primary
care: in 2005 most general-practice doctors in health centers were converted to private practitioners paid
on a capitation basis (per enrolled patient), adjusted for the risk profile of the patients. Currently 30 percent
of the capitation amount depends on several performance indicators, including preventive healthcare
activities for adults and growth monitoring for children. HIF also shifted financing for most outpatient
drugs to reimbursement through private pharmacies, and introduced selective contracting with private
specialists and private hospitals for certain specialist and inpatient services not adequately available in the
public sector.
6.10. The availability of doctors and other health sector inputs is comparable to similar countries,
but with inefficiencies in the staff mix and disparities among regions. The health system in Macedonia
currently includes 130 public health institutions, including hospitals and health centers, with a significant
private sector encompassing private hospitals, private doctors, and private pharmacies. The Health
Insurance Fund directly contracts with over 3000 private providers, including general practice doctors,
specialists, hospitals, pharmacies, and providers of orthopedic devices. The health sector currently employs
nearly 28,000 staff, including 5,755 doctors (two-thirds are specialists), 1,652 dentists, 888 pharmacists,
12,800 nurses, and 4,894 non-medical staff (IPH 2013). This translates to 2.8 doctors per thousand people
(compared to the OECD average of 3.2 doctors per 1000). The doctor-to-nurse ratio of 2.2 is also lower
than the OECD average of just under three nurses per doctors, suggesting that doctors are undertaking tasks
that are carried out by nurses elsewhere. The proportion of non-medical staff (17 percent) is high by
European standards, indicating continued overstaffing in this category. Macedonia averages 4.4 hospital
beds per 1000 people, with a range of two beds in Skopje to more than 8 beds in other four regions (IPH

97
2013). While the average number of beds is lower than the OECD average of 5 per 1000, more-efficient
high-income countries have reduced hospital beds to 3 per thousand. These include Denmark, the UK,
Spain and the US, while the figure is even lower in Canada, New Zealand, and Sweden (OECD 2013).
Figure 6.2: Satisfaction with Public Services and Incidence of Informal Payments
Selected Countries, 2010
Source: World Bank-EBRD Life in Transition Survey II.
6.11. Macedonians are generally not satisfied with the quality of public health services and consider
the health sector to be the priority area for public investment. The second round of the 2010 EBRD-
World Bank Life in Transition Survey (LiTS) asked households to identify their top priorities for
government investment. The health sector was ranked first by 30 percent of respondents, closely followed
by education (28 percent) and assisting the poor (25 percent). Only about 45 percent of Macedonians
reported being satisfied with health services, however, ranking Macedonia and Albania as the lowest on
that question among countries in the sub-region (EBRD 2010) (Figure 6.2). A recent study on patient
satisfaction in hospitals found that patients were overall more satisfied with the care provided in tertiary
facilities compared to secondary hospitals, notably with respect to waiting time, hygiene, toilets, and
adequacies of drugs and medical supplies90 (Stefanovska and Petkovska 2014). Limited evidence is
available on the clinical quality of care, but studies from the past decade suggest that it highly variable
(World Bank 2013). In addition, about 10 percent of Macedonians reported that unofficial payments are
prevalent – lower than most other Western Balkan countries, but much higher than the EU. Over 40 percent
of Macedonians reported making unofficial payments for health services, higher than any other public
services, with over 20 percent stating that they ‘usually or ‘always’ make such payments (EBRD 2010).
Unofficial payments are a consequence of shortcomings in sector governance and rationing of care, which
creates incentives for patients to pay for quicker or better-quality services. It means that poorer patients are
less likely to get the treatment they need, and contributes to inefficient allocation of resources.
90 For example, in comparing public Secondary Healthcare Outpatient Facilities and Tertiary Healthcare Outpatient
Facilities, patients were more dissatisfied with secondary than tertiary facilities with respect to waiting timing (43 %
vs. 23%), hygiene of department (47% vs. 26%) and toilets (75% vs. 50%). Nearly half of patients at secondary
hospitals were also highly dissatisfied with availability of drugs supplies and medical equipment (46%) (Stefanovska
and Petkovska 2014). While some of these differences may be due to resource constraints at secondary facilities,
maintaining cleanliness and hygiene of the outpatient department and toilets is not costly, and thus indicates inadequate
attention to service quality by secondary hospital managers.
0
20
40
60
80
100
Albania Macedonia BiH Serbia Montenegro Turkey Western
Europe
% of respondents satisfied with quality and efficiency of public service delivery
% of respondents that report unofficial payments are usually or always needed

98
Table 6.1: Number of Insured Persons has been declining, but increased slightly in 2013
2007 2008 2009 2010 2011 2012 2013
Active workers 445,653 468,860 487,922 482,929 488,869 481,077 486,116
Active farmers 17,297 14,799 14,613 14,869 18,154 18,381 19,077
Pensioners 329,611 284,425 278,863 283,303 291,170 268,006 283,658
Unemployed* 263,672 253,280 256,416 253,249 21,927 21,214 17,159
MoH Program** 5,628 14,458 216,965 223,470 238,739
Others 24,098 21,296 18,586 17,321 17,464 14,962 13,916
Insured persons 1,080,331 1,042,660 1,053,068 1,066,129 1,054,549 1,027,110 1,058,665
Family members 879,053 853,352 840,766 836,816 780,980 717,127 725,951
Total # of Insured 1,959,384 1,896,012 1,893,834 1,902,945 1,835,529 1,744,237 1,784,616
*the decline in 2011 is due to the changes in the Law on social contributions which implemented a limit under which a
person can have health insurance provided by the state. ** Persons insured through the MoF program.
Source: HIF Annual Reports, 2010 and 2013.
6.12. About 85 percent of Macedonians are covered by social health insurance, with lower coverage
among the unemployed and self-employed. According to HIF, 1.78 million persons are covered by social
health insurance, including just over a million insured persons and about 725,000 family members (Table
6.1). The national health insurance law requires that all employees in formal sector jobs pay a mandatory
7.5 percent payroll tax contribution. Active farmers make a smaller payment, and pensioners are financed
through a contribution based on their monthly pension. The government finances health insurance for the
unemployed, for identified poor, and for children not otherwise covered. Out-of-pocket heath expenditures
declined between 2002 and 2008, but have increased since then (Figure 6.3). Recent household data were
not available to assess the impact of out-of-pocket spending on households.
Figure 6.3: Total Health Expenditure Composition
Source: World Development Indicators.
C. PUBLIC MANAGEMENT OF THE HEALTH SECTOR
6.13. Total health spending is about average for middle-income countries, but lower than other
SEE6 countries and EU members states. Public spending has been declining as a percentage of GDP
and as a percentage of the government budget. Total health spending in Macedonia represented 7.1 of
GDP in 2013, with public health spending about 5.1 percent of GDP, a decline from 5.3 percent of GDP in
2006. Health spending has also declined as a percentage of the government budget, from 15 percent of
outlays in 2006 to about 13.5 percent in 2013 (Figure 6.4). Public health spending has been pro-cyclical
0
20
40
60
80
in p
erce
nt
Out-of-pocket health expenditure (% of total expenditure on health)
Health expenditure, public (% of total health expenditure)

99
with per capita GDP growing in the past decade, but with a lag. While similar to the average for other upper
middle income countries, health spending in FYR Macedonia is lower than some other Western Balkan
countries (e.g., Serbia) and is also lower than the EU average. Globally, upper middle income countries
spend an average of 6.7 percent of GDP on health, of which 4.3 percent of GDP is public health spending.
Private spending declined from 41 percent of total health expenditure in 2003 to 31 percent in 2008, but
subsequently increased to about a third of health spending in 2013 (World Development Indicators 2013).
Earlier increases in insurance coverage and public spending helped reduced private out-of-pocket spending,
but the population may be increasingly paying directly for care in the private sector despite the relatively
high insurance coverage.
Figure 6.4: Public health spending as % of
budget outlays
Figure 6.5: Nominal HIF revenues and
expenditures (MKD millions)
Source: HIF Annual Reports.
6.14. Health sector revenues are heavily dependent on payroll contributions from the minority of
the population in formal employment. Contributions to health insurance represent 89 percent of total
revenues for the health sector. Formal sector employees provided 84 percent of all contributions revenues,
even though these workers represent only 27 percent of the total insured population. This means that a small
percentage of the population finances most health-sector costs and that health revenues are sensitive to
employment and economic downturns – as seen by a decline in revenues following the 2009 economic
crisis. The Ministry of Social Welfare financed 7 percent of total HIF revenues through transfers for
maternity benefits, which are managed by HIF on their behalf. Budget transfers from the MOH to cover the
unemployed were only 1 percent of total HIF revenue, which has declined in recent years with declines in
the registered unemployed (Figure 6.6).
13
13
14
14
15
15
16
2006 2007 2008 2009 2010 2011 2012 2013
% total budget expenditures
0
5,000
10,000
15,000
20,000
25,000
2006 2007 2008 2009 2010 2011 2012 2013Total RevenuesTotal Health expenditureTotal expenditures of PHP

100
Figure 6.6: Sources of Revenue and Contributions for the Health Insurance Fund a) Sources of Contributions for HIF b) Sources of Total Revenues for HIF
Source: Health Insurance Fund Annual Report, 2013.
6.15. Spending on hospitals, prescription drugs,
and maternity leave have been increasing, while
outlays for primary care have stagnated. Total health
expenditures were 21.9 billion MKD in 2013. Of this,
about 88 percent was for health services, of which just
under two-thirds was for services provided by public-
health institutions (57 percent of total spending), and
one third through private providers (28 percent of total
health spending), including private general
practitioners, private pharmacies, specialist services,
and private hospitals (Table 6.2). Total expenditures on
pharmaceuticals – including outpatient prescriptions
and hospitals drugs – has increased from 26 percent of
HIF budget in 2009 to 28.9 percent in 2013. Within
public health institutions, allocations for clinical
hospitals and general hospitals have increased, while
allocations for primary care have been flat – with a 6-
percent decline in outlays for general-practice doctors
in 2013 compared to 2012 (Figure 6.7). For example, to
address the backlog on cardiac surgeries, HIF has
established specific fee-for-service contracts with
public hospitals that totaled MKD 972 million in 2013,
and HIF spent an addition MKD 710 million for cardiac
surgery contracts with private hospitals. As such, at
least 7.6 percent of all health service spending is for
cardiac surgery. The government has made progress in
reducing spending on sick leave through tighter
regulation and oversight (from a peak of MKD 866 million in 2011 to MKD 454 million in 2013). Outlays
for maternity leave have been increasing rapidly (from MKD 1.4 billion in 2011 to MKD 1.7 billion in
2013), mostly due to more women receiving the benefit.
Table 6.2: Allocation of Health Expenditure
2013
in MKD
thousand
in
percent
HIF administration 481,521 2.2%
Sick and maternity leave 2,171,936 9.9%
Health services
Treatment abroad 191,140 0.9%
Orthopedic devices 462,287 2.1%
Refunds 50,995 0.2%
MANU 16,559 0.1%
Public health institutions 12,458,000 56.8%
Private health institutions 6,084,872 27.8%
General Practice Doctors 2,485,106 11.3%
Pharmacies 2,061,049 9.4%
Specialists 565,595 2.6%
Dialysis 77,392 0.4%
In-vitro Fertilization (IVF) 59,496 0.3%
Cardio surgery 710,490 3.2%
Eye surgery 55,745 0.3%
Spas (medical rehabilitation) 70,000 0.3%
Total health services 19,263,853 87.9%
Total health expenditure 21,917,309 100.0%

101
Figure 6.7: Expenditures for primary care and hospitals
Source: HIF annual reports and data
Figure 6.8: Composition of spending by all
public health institutions (2013)
Figure 6.9: Composition of total health
spending by type of care
Source: HIF Annual Reports.
6.16. Despite earlier efforts to clear arrears, hospital debt and liabilities are growing and currently
equal 0.6 percent of GDP. In 2008, the government agreed to absorb outstanding arrears accumulated in
the health sector, particularly hospitals, while putting in place measures intended to control future arrears.
Deficits have nonetheless accumulated rapidly since then. As of October 2014, total arrears for public health
facilities had reached MKD 3.1 billion (over US$80 million, or 0.6 percent of GDP), with three hospitals
having arrears above or near US$5 million (University Center for Traumatology, City General Hospital
September 8, and General Hospital-Bat), and a total of 14 hospitals with arrears of US$ 1 million or more
(of which eight are general hospitals and the remainder are university or clinical hospitals) (HIF 2014).
6.17. Delayed payments to health facilities for MOH-sponsored public health programs, and
provisions of services by some hospitals in excess of HIF contracted amounts, have contributed to
hospital deficits. HIF provides most financing to hospitals and health centers for inpatient and outpatient
services, and stipulates in annual contracts the agreed quantity of services and budget to be provided. But
the State Auditor Office found that many hospitals were providing services in excess of the contracted
-
2,000
4,000
6,000
8,000
10,000
12,000
14,000
16,000
2009 2010 2011 2012 2013
Centers of Public Health andInstitutes
University Clinics
Special Hospitals
General and clinical hospitals
Health homes and healthstations
General Practitioners

102
amount, and as such had no basis to bill HIF for the additional costs.91 In addition, the MOH also contracts
directly with hospitals and health homes for provision of certain priority preventive and public health
services (for example, child vaccinations or cervical cancer screening). The 2013 report on Financial
Controls of Public Healthcare Institutions by the State Audit Authority visited a sample of 48 health care
institutions, of which 44 had outstanding debts of US$12 million. As of December 31, 2012, all but three
of the institutions had unpaid receivables from the MOH for public health programs, for a total amount of
US$12 million (or about one-third the value of outstanding debt). These unpaid receivables were distributed
among various types of institutions, with the largest unpaid amounts owed to clinical and specialty
hospitals. In addition, eleven of the institutions sampled had invoiced MOH for amounts exceeding their
2012 allocated budget for a total of US$2.5 million (7 percent of total deficits). Over 90 percent of this
excess invoicing to MOH was from just three institutions: University Clinic for Cardiology/Skopje, the
University Clinic for Radiology/Skopje, and the University Clinic for Child Diseases/Skopje).
D. EFFICIENCY OF HEALTH SPENDING
6.18. The introduction of case payments (DRGs) for hospital inpatient services have brought some
efficiency gains, but have not led to the rationalization of hospital service delivery. In 2006, the HIF
initiated reforms to begin paying hospitals based on outputs, using a case-payment system for acute care
services adapted from the Australian Diagnostic Related Groups (DRGs). The reforms have brought about
some efficiency improvement, including a gradual but steady decline in the average length of stay (ALOS)
for patients at public hospitals from 6.3 days in 2009 to 5.5 days in 2013 (Figure 6.10). ALOS is now
comparable to many EU countries (OECD 2013). Payment reforms have not brought about improvements
in other key efficiency indicators, however, including bed occupancy rates (BORs). Bed Occupancy rates
are just over 50 percent for General Hospitals, and only a quarter of beds are occupied at health homes,
(Figure 5.11), compared to a norm in most OECD countries of 70 to 80 percent (OECD 2013). Hospital
admissions also rose by 6.2 percent from 2012 to 2013 (to 223,400 cases), and the total number of hospital
days increased by 2.8 percent (HIF 2014). Increased admissions were offset by decreased ALOS, resulting
in no change in bed-occupancy rates. In addition, the average cost of hospital services per in-patient
discharge varied dramatically among categories of hospitals, but also among similar hospitals (e.g., general
hospitals) (Figure 6.11). While this partly reflects differing case complexities among hospitals, it also
indicates significant variations in the efficiency of hospital services.
91 “In line with Article 68 of the Law on Healthcare, the Health Insurance Fund of Macedonia as a procurer of
healthcare services has signed contracts with the public healthcare institutions for regulating matters regarding
invoicing for services rendered and the manner of payment for these services. It was found that the audited public
healthcare institutions have delivered services exceeding the agreed amount. Unsettled claims are not recognized by
the Health Insurance Fund, which does not record these as a liability to the institutions, but in certain cases the Fund
takes it into account when forming the budget ceiling for next year.” State Audit Office 2013.

103
Figure 6.10: Average length of hospitals stays in
days
Figure 6.11: Bed occupancy rates by types of
hospitals
Source: HIF Annual Reports and HIF data.
6.19. Financing for hospitals is only partly based on outputs and performance, with continued
financing based on inputs and historical budget. Hospital financing is subject to annual negotiations
between HIF and the public health institutions, which are informed by cost estimates based on DRGs, but
continue to be significantly influenced by historical budget, existing staff costs, etc. As such, there is no
standard fixed percentage of hospital budgets that are financed by DRGs.
6.20. Expenditure trends and recent policy decisions by government have contributed to a bias
toward high-cost tertiary care at the expense of primary care. Upward adjustments have been made for
some high-cost services, but the average DRG “base case” payment for hospitals and capitation payment
for general practice doctors has not been increased in recent years, despite rising costs and significant
investments by MOH in new equipment and procedures. In recent years, the HIF introduced output-based
payments for high-cost treatments (e.g., cardiac surgery); created a 20-percent payment bonus for university
and pediatric hospitals, and introduced several new DRG case for more complex treatments. There is also
evidence of “DRG creep”, with average-case complexity (and cost) for hospitals increasing in recent year
– including a 9-percent increase in average DRG case weight from 2012 to 2013 (HIF 2014), which tends
to benefit tertiary hospitals. HIF publishes detailed annual DRG reports, which provide useful comparative
data on hospital outputs and efficiency, but has not updated the unit costing for DRGs based on current
hospital expenditures. This should typically be done every few years. MOH is responsible for capital
expenditure decisions, including for new (and sometimes expensive) equipment. This creates the risk of
disconnects between recurrent costs and reimbursements from HIF.
6.21. The government provides special subsidies to hospitals whose expenditure exceed the
financing justified by their outputs, which limits resources available for better-performing hospitals.
The gradual shift toward performance-based payments through DRGs has exposed less-efficient hospitals
to a financing gap due to excessive staffing, beds, etc. relative to the services provided. Since 2011, the
government has required that HIF provide supplementary funding to 52 public health facilities that have
low outputs relative to their costs. The list is published annually in the official Gazette. The total number
of facilities receiving this subsidy has declined, however, from 57 in 2009. While provision of such ‘top
up’ payment could be considered an acceptable ‘transitional’ measure to allow hospitals to adjust to new
payment incentives, it has squeezed the resources available for better performing hospitals and for primary
care.

104
6.22. Hospital managers do not have sufficient autonomy to respond to new payment incentives.
Hospital payment reforms (such as DRGs) need to be complemented by increased autonomy of hospital
managers for staffing and resource allocation decisions - to give managers flexibility to respond to
incentives for efficiency and quality - in exchange for increased accountability for results. But currently
hospital managers have limited managerial autonomy. Labor regulations and collective bargaining
agreements have limited the ability of managers to make decisions regarding hiring, staff incentives or
discipline, or even internal reallocations of staff among departments. Public-sector managers express
concern regarding an uneven playing field as they increasingly compete with the private sector for public
funding and patients. The MOH and HIF have introduced some measures to enhance monitoring and
accountability for hospitals, however. The MOH has introduced a Balanced Score Card system to assess
hospital performance based on the following criteria: finances, patients, clinical focus, development, and
training. MOH recently announced the top five performing hospitals based on the Balanced Score Card
criteria. These are important steps, but further reforms are needed to increase hospital autonomy and
accountability.
Figure 6.12: The average cost per discharge
varies significantly among hospitals
Figure 6.13: Total hospital deficits (USD)
compared to % of expenditures on salaries
Total cost per discharge vs. total
discharges/year
Source: HIF Annual Reports and HIF data, 2013.
Note: The cost per discharge is calculated by dividing the total hospital costs by the total discharges and therefore
does not account for difference in ambulatory-care costs and volume
6.23. Hospitals are adapting to the existing financing gap by rationing services and/or
accumulating deficits. Hospitals accumulating the highest deficits seem to be those who are unwilling or
unable to turn away patients – most notably the national trauma hospital or large general hospitals - even
though the unit cost or volume of services exceeds that in their defined budget from HIF (Figure 5.12).
Hospitals providing high-cost specialty services (which tend to have strong political support) are also
accumulating significant deficits (e.g., cardiology, pediatric specialty hospital). Because of special
subsidies provided to inefficient hospitals, there is no clear correlation between the size of deficits and
typical efficiency measures – for example, the percentage of expenditures spent on salaries (Figure 6.13).
Despite strengthened financial and expenditure controls, the government faces a significant moral hazard
problem: hospitals managers appear to assume that their arrears will eventually be absorbed by the
government.

105
6.24. Further supply-side reforms are needed to rationalize hospital network, and increase the
efficiency of service provision. Key reforms introduced by other EU member states include increasing the
number of surgeries performed on an outpatient basis, integrating care and networking among hospitals,
and rationalizing the number of acute care beds, including converting some to long-term or social care for
the elderly. Many countries in ECA have produced Hospital Master Plans to rationalize their hospital
networks, but implementation has been mixed because of political challenges of downsizing hospitals.
These challenges could be mitigated in FYR Macedonia, however, since there is no significant oversupply
of hospitals or bed compared to some other ECA countries (particularly those formerly under the Soviet
Semashko System). As such, the focus could be on “rightsizing” and refocusing service provision of
hospitals and health homes, not closing facilities.
6.25. The government has achieved over EUR 30 million in savings through price reductions of
pharmaceuticals and medical devices and has reduced co-payments for prescription drugs. In 2013,
the HIF spent over a third (36 percent) of total healthcare spending on pharmaceuticals and medical devices
(a total of MKD 7 billion, or US$140 million). Of this, HIF provided MKD 2 billion in direct
reimbursements to private pharmacies for outpatient drugs, and MKD 460 million for providers of
orthopedic devices (Figure 5.14). In addition, public health facilities spent a total of MKD 4.5 billion of
their budget on drugs and medical devices. The HIF and MOH have taken a number of steps to generate
savings from these expenditures. First, in 2008, the government mandated that all prescriptions written
based on International Nonproprietary Name (INN) – e.g., generics – and pharmacists are required to offer
the lower priced generic drugs. Second, beginning in 2011, MOH and HIF revised their methodology for
drug reference prices and began to update and publish prices on an annual basis (for both generic off-patent
and originator drugs).92 By 2013, this resulted in average prices reductions exceeding 30 percent and
generated over EUR 30 million in savings. The government regulates margins on wholesale and retail
prices; mandates that prescriptions. Second, the MOH has initiated pooled procurement and tendering for
pharmaceutical and medical devices purchased by hospitals, which generated further savings. Third, MOH
began parallel importing of drugs that are available at lower cost in nearby countries (notably Turkey).
These price reductions allowed HIF to reduce or eliminate co-payments for many prescription drugs (of
391 generic drugs on the primary list, 76 percent are currently without copay, compared with only 20
percent in 2009). Over 400 brand-name medicines are available without co-pay and most brands require
just MKD 100 in co-pay. The savings generated by these price reductions have been shared between HIF
and the insured persons: the 2013 price reductions generated MKD 88 million in savings for HIF, and 31
million savings for the insured (HIF 2014).
6.26. Pharmaceutical spending continues to increase as percentage of total HIF expenditure,
however. As noted earlier, spending on pharmaceuticals has continued to rise in total and as a percent of
percentage of HIF spending – from MKD 5 million in 2009 (26 percent of HIF budget) to MKD 6.3 billion
in 2013 (28.9 percent of HIF budget). This is high compared to most EU and OECD countries – OECD
countries spent on average 17 percent of health expenditures on pharmaceuticals (OECD 2013). Following
the price reductions, total spending on drugs and medical supplies for hospitals initially fell by over 5
percent from 2011 to 2012, but then it increased in 2013 to just below the 2011 level. In addition, most EU
countries typically spend 5 – 10 percent of the health budget on hospital medicines, but in Macedonia, two-
third of pharmaceutical spending and nearly 20 percent of total HIF spending is devoted to hospital drugs.
Pharmaceutical spending remained high and continued to increase, despite significant progress on key
reforms, because total pharmaceutical spending is a combination of unit prices, volume, and the type of
drugs being purchased.
92 Current prices of all generic medicines, patented originator drugs, and parallel imported drugs are published
annually on the MOH Bureau of Medicines website: https://lekovi.zdravstvo.gov.mk. Reference countries for drug
prices include Bulgaria, Croatia, Serbia, and Slovenia.

106
6.27. Savings on costs of outpatient drugs have been undercut by increased volume of
prescriptions. The HIF finances outpatient medicines through private pharmacies, and further seeks to
control costs by setting monthly quotas for each pharmacy. In 2013, 84 percent of funds allocated for
prescription medicines were used, with most pharmacies realizing 80-90 percent of their quotas (HIF 2014).
There are reports of pharmacies running out of their quotas, forcing patients to purchase medicines for full
prices, but no studies or comprehensive data were available. Total consumption of and spending on
outpatient prescription drugs has continued to increase, however, with a 73 percent increase from 2008 to
2013 in the total number of prescriptions (to nearly 18 million), and a 61-percent rise in total spending on
prescription drugs. Nearly half of prescriptions are for cardiovascular medications, of which consumption
increased from just over 6 million prescriptions in 2010 to nearly 8 million in 2013.As such, while
Macedonia has adopted a number of good international practices with respect to outpatient prescription
drug pricing and dispensing practices, the cost savings from unit price reductions have been increases in
the volume of prescriptions (Figure 6.14).93 The average number of prescriptions in 2014 was almost 10
per capita, compared to averages of 4 to 7 perceptions per capita in most EU countries.
6.28. Hospital drug expenditures remain high due to continued use of decentralized procurement,
inadequate volume controls, and increased use of high-cost medicines. Despite significant savings from
pooled procurement for some drugs and medical equipment, hospitals continue to carry out decentralized
procurement for medicines and medical devices. Unlike for prescription drugs, the prices paid by hospitals
are not published, and it’s likely there are significant price variations and potentials for further savings.
Hospitals also do not appear to have strong systems in place to control the volume of drug consumption. In
addition, hospitals are consuming more high-cost, patented medicines.
Figure 6.14: Total number of prescriptions and total amount paid for
medicines in primary health care
Source: Health Insurance Fund of Macedonia
6.29. Further progress is needed in monitoring patient coverage, prescription and dispensing
practices for outpatient medicines, and competitive procurement for hospital medicines. A more
detailed analysis of pharmaceutical expenditures and dispensing practices would be necessary to assess
whether Macedonia is over- or under-consuming these and other medicines. For example, achieving high
coverage and compliance with low-cost hypertensive medicines for patients with high blood pressure can
93 For example, for the top five most dispensed drugs by price and volume (Atorvastatin, Amoxicillin + Clavulonic
acid, Pentoxifylline, Enalapril, and Metformin), average unit price decreased by 7.8 percent from 2011 to 2014, but
total expenditures on these drugs increased by 12.5 percent – illustrating that volume increases are annulling savings
from price cuts.

107
lead to long-term savings in reduced stroke and cardiovascular disease. Evidence suggests, however, that
there is a need for closer monitoring of private physician prescription practices within the overall
performance monitoring systems. Similarly, given the continued high level of expenditures by hospitals for
drugs and medical supplies, the HIF and MOH could put in place strong monitoring and increased
incentives for more efficient use of these inputs.
6.30. The insurance benefit package is generous relative to available resources, and there is a need
for evidence-based decision-making on the benefit package and reimbursement of new medicines.
Many in the Macedonia population have been exposed to European health care, which creates pressures for
a generous and expanding health-insurance benefit package, even though per-capita health expenditures
represent only a third of higher-income countries. New, high-cost procedures and medicines are regularly
added to the benefit package for health insurance, but without a system to assess the cost-effectiveness of
these new treatments, or to assess the budgetary implications. High-income countries such as the United
Kingdom have established systems for Health Technology Assessment (HTA) to inform decision-making
on new benefits and medicines, which could be adapted for upper middle income countries such as
Macedonia.
6.31. HIF has made significant progress in strengthening the treasury function, in improving the
auditing of health institutions, and in establishing a high level of transparency in reporting health
expenditure information. The HIF has made significant progress in strengthening its capacity as a strategic
purchaser, in monitoring expenditure, and in publicly disclosing of information on spending. In response
to the earlier problems with hospital payment arrears, the HIF established a treasury function in 2011, along
with an electronic payment and invoicing system in 2011 (State Audit Office 2013). The HIF and
government also conduct annual audits of a sample of health care institutions, and publishes the reports.
The reports have shown steady progress in terms of reducing billing errors and improving accounting
practices by public and private health-care providers. The HIF publishes an Annual Report that provides
detail on health financing and trends, as well as an annual report on DRGs, with detailed data on hospital
costs and efficiency comparisons. This represents ‘good practice’ in health financing transparency,
regionally and within Macedonia. In addition, the Institute of Public Health publishes annual health
statistics on health system inputs, outputs, and disease profiles. As noted above, however, information on
quality of services and key intermediate indicators of service provision (e.g., percentage of hypertensive
patients under treatment) is not easily available. Further linking information on financing with that on
service provision and quality, and using this information for decision-making, will be a key next step.
E. CONCLUSIONS
6.32. FYR Macedonia’s health care system is facing increasing hospital deficits, arrears, rationing
of care and out-of pocket expenditures for patients. Addressing these challenges would require a
comprehensive set of reforms. But these reforms are unlikely to lead to a decline in health spending as a
share of GDP, which is broadly appropriate for the country’s economy level. Yet, they could raise the
efficiency of health spending by shifting funding from inefficient hospitals to higher-performing ones.
Potential savings from better procurement from pharmaceuticals would most efficiently be used by
increasing primary care spending.
6.33. Hospital reforms that help right-sizing and strengthening the autonomy and accountability
of hospitals could reduce inefficiencies in hospital-service provision. Despite reforms in hospital
payments by the HIF continued inefficiencies in hospital service provision are undercutting the quality and
equity of health services. Responsibility for service provision lies with the MOH. Key reform could include
legislative and regulatory changes to give hospital managers increased autonomy over resource allocations
and personnel and increased accountability to respond to incentives for improved quality and efficiency;

108
introducing innovations in service provision, including increased use of day surgeries; rationalizing hospital
services and beds, using acute-care beds for long-term care, and improving the integration of tertiary care.
This may not require closing hospitals or health homes, but may require rationalizing and focusing their
roles and services.
6.34. Hospital financing should focus more on paying for services and quality. Reforms in service
provision will allow the HIF to further shift financing of hospital towards outputs (through DRGs, linked
to global budget), with adjustments for service quality. DRG costing should be updated, and subsidies for
inefficient hospitals should be phased out, linked to ‘right-sizing’ reforms. Any clearance of hospital arrears
should be linked to further reforms in hospital service provision and financing – otherwise the arrears will
accumulate.
6.35. Continue to seek savings in pharmaceuticals and medical devices, while aligning benefit
packages with available financing. The MOH and HIF should continue to reduce unit costs of off-patent
generic medicines through reference prices and competitive procurement, while introducing innovative
contracting approaches for high-cost patented medicines. Moreover, the MOH and HIF should increasingly
rely on evidence of cost-effectiveness to prioritize inclusion of new high-cost treatments, procedures, or
new patented medicines on the reimbursement list, through Health Technology Assessments or similar
mechanisms. Because it takes time to develop HTA capacity, modified HTA using assessment undertaken
in higher income countries (e.g., UK or Germany) are a good transition strategy.
6.36. Prioritizing primary care and ensuring adequate financing for preventive programs would
significantly improve the efficiency of health care spending. The increased burden of non-communicable
diseases requires strong primary and preventive care to avoid significant cost escalation as the population
ages. These programs are current underfunded, and should be prioritized for adequate financing – including
reviewing capitation payments and performance bonuses to GPs, as well as ensuring adequate funding for
MOH public health and preventive programs (delayed payments for which are currently contributing to
health facility deficits).
6.37. Policy coordination between MOH and HIF should be enhanced. While Macedonia has been
successful in establishing MOH as the main purchaser of health services, enhanced coordination between
HIF and MOH would help advanced a number of key reforms, including hospital reforms; decisions
regarding the insurance benefit package and inclusion of new drugs on the HIF reimbursement list; closer
coordination on monitoring of pharmaceutical expenditures, prescription and dispensing practices; and
increased integrated monitoring of health financing, service provision, and service quality.

109
CHAPTER 7. PENSIONS
A. INTRODUCTION
7.1. Overall spending on pensions and pension-related benefits in Macedonia reached 9.6 percent
of GDP in 2014, which is broadly in line with other transition countries. The pension fund receives
regular transfers from the central government budget. These transfers are negotiated during the budget
preparation process each year and are planned according to the revenue expectations and estimated
expenses of the fund. In 2014, transfers from the central government to the pension fund were 4.4 percent
of estimated GDP, which included regular transfers as well as transfers to cover the deficit of the pension
fund and transitional costs transfers. The pension fund ran a deficit of 0.05 percent of estimated GDP, but
excluding the transfers from the central government for the deficit financing, the deficit reached 2.9 percent
of GDP.
7.2. Elderly people in FYR Macedonia are less likely to be poor than younger Macedonians.
Poverty among persons (65 and older) has been increasing over the period 2010-2012, but it is still the
lowest of all age groups. Despite the continued pension increases over the past years, the At-risk-of-poverty
rate among older persons increased from 18.5 percent in 2010 to 22.3 percent in 2012. Nevertheless, elderly
persons are the least likely group to face poverty, as the poverty level is significantly below the overall
average of 26.2 percent, or the average of 31.5 percent for youth (age 0-17 years) in 2012.
7.3. FYR Macedonia is a rapidly ageing society and pension expenditures are expected to increase
significantly. Despite reform measures so far, some of which were very successful, such as eliminating
general early retirement and age-limiting general disability, the Macedonian pension system involving
PAYG formula, indexation and retirement age will not be able to cope with the rapid aging process; it will
generate a sizable deficit instead, even if current favorable macroeconomics prevail. The pension deficit is
projected to climb to 10.5 percent of GDP under a conservative baseline scenario and to 7 percent by 2030
under an optimistic scenario.
7.4. This chapter is structured as follows: The next sections provide an overview over the pension
system and recent parametric changes. This is followed by an assessment of the fiscal and social
sustainability of the system. The final section concludes. This chapter is intended to be purely descriptive
and to provide a key input to chapter 4 on fiscal sustainability. Contrary to the other PER chapters, it does
not discuss any policy reform options.
B. THE PENSION SYSTEM
7.5. The Macedonian pension system has undergone several changes over the last two decades
and now rests on three pillars: i) a pay-as-you-go (PAYG) pillar; ii) a private, mandatory pillar which is
based on individual accounts; and iii) a voluntary pillar which includes a private general and an occupational
pension fund. Parametric reforms to the PAYG pillar have been introduced in several rounds, aiming to
improve the fiscal sustainability of the system and reflect demographic changes, as the old-age dependency
ratio, that is the share of elderly people (65 years or older) in the population, increased from 8.2 percent in
1991 to 11.8 percent by 2014. Between 1993 and 1997, the Government slowed down pension increases by
indexing them below wage growth and raised the retirement age from 60 to 63 years for men and from 55
to 60 for women, widened the calculation period, and limited early retirement options to hazardous
occupations. In 2005, the retirement age was further increased to 64 for men and 62 for women, accrual
rates were reduced, and Swiss indexation (50% wages and 50% CPI) was introduced, which further slowed
down increases in overall pension expenditures. In 2006, a mandatory defined contribution component was
added to the system with the introduction of the second pension pillar, which became mandatory for new

110
labor market entrants. Others could choose to opt in. The reform targeted mainly younger employees and
encouraged older workers who had only a short time to accumulate pension savings to remain in the PAYG
pillar. By 2014, the second pillar served 67 percent of insured individuals and managed individual pension
assets of EUR 530 million, around 6 percent of GDP. The voluntary third pillar was launched in April
2009. Parametric changes in 2012 reduced the accrual rate for post-2013 service years of the PAYG-only
system participants from 1.8-2.6 percent, depending on gender, to 1.6-1.8 percent. It also tightened the
criteria for disability pensions. Basic parameters of the reformed Macedonian pension system, currently in
place, are shown in Table Annex 7.1.94
Box 7.1: Pension reform measures in Europe and Central Asia during the last two decades
European countries are aging rapidly and have been facing rapidly growing financing requirements for
pensions, health and long-term care. The objectives of the pension reforms that were launched in almost all
European countries were to improve the system's short-term social and fiscal sustainability and maintain it in the
long run. Transition economies have been more active in pension reforms than the developed ”high income
generous spenders”. In addition to ”growing old before growing rich”, these countries had to cope with generous
inherited social insurance systems, economic restructuring, and other challenges of transition countries that affect
the financing of the pension system.
Parametric reforms in transition countries have focused largely on curtailing costs. Among the CEE countries,
reforms have led to a gradual increase in the retirement age of men (Albania, Montenegro) and women (Albania,
Bulgaria, Serbia, Romania), cuts of the annual accrual rate, and changes of pension benefit indexation, bringing
pension increases closer in line with inflation rather than wages. Although Macedonian pension reforms have been
well designed and successfully implemented, its mandatory retirement age of 64 for men is currently the lowest
and 62 for women the second-lowest in the region, its accrual rate for PAYG only participants of 1.6 is the highest
in the region, and its indexation pattern with wage valorization and Swiss indexation the most generous in the
region (together with Republika Srpska).
Figure 7.1: Pension system dependency and replacement rates, 2001-2013 a) Dependency ratio b) Replacement rates
Source: Annual report PIOM.
94 The Government also amended the Pension and Disability Law by: i) reducing the accrual rate for post-2013 service
years of the PAYG-only system participants from 1.8 percent to 1.6 percent, ii) tightening criteria for disability
pensions, and iii) firming the indexation rule.

111
7.6. The average replacement rate, i.e. the percentage of a worker’s pre-retirement income that
is paid out upon retirement as pension, has declined since 2001 but remains high compared to other
ECA countries. FYR Macedonia’s average replacement rate, including disability pensions, declined
moderately from about 60 percent
prior to 2005 reforms to 50
percent in 2009 before increasing
to 55 percent in 2013. The old-age
pension replacement rate
declined from 71 percent in 2001
to 62 percent in 2013. The
replacement rate in 2013 was the
most generous among transition
economies, and even higher than
in several high-income EU
member states, such as Germany,
Sweden, Ireland, Austria,
Norway and Finland. Only
France, Greece, Malta, Spain,
Luxembourg, Italy, Portugal and
Turkey had a higher replacement
rate (Figure 7.2).
7.7. Pension indexation in Macedonia has been more generous than in most other European
countries. Best international practice suggests that pensions should be indexed to wages, which keeps the
initial replacement rate constant, or to prices, which maintains the real purchasing power of the pension
benefit during the remaining lifetime. Most EU countries use a combination of wage and price indexation.
Switzerland indexes pensions half to wages and half to prices, which is the so-called Swiss formula. Among
the six South East European countries, the Swiss formula is used by the Republika Srpska and Macedonia.
Indexing pensions with a combination of wage and inflation rates transfers some of the economic growth
or fall to pensioners. If real wages growth, real pensions grow, independent of pensioners’ activity. But if
real wages fall, real pensions fall as well. Price indexation partly insulates real pensions from economic
swings.
7.8. The economic slow-down after the 2008 global financial crisis has increased pressures for ad-
hoc indexation of pensions in Macedonia. Despite a firm indexation rule, the Government decided to
implement supplementary ad-hoc indexation of pensions in 2008, 2013 and 2014 in the annual budget laws.
Supplementary ad-hoc indexations lead to persistent increase in pension expenditures and deficits. In 2008,
pensions were increased by 21.7 percent, which was than 12 percentage points above the regular
indexation.95 As a consequence, real pensions rose more than 13 percent in 2008 and the replacement rate
jumped by more than 5 percentage points. Strong real GDP growth and a widening of the contribution base
dampened the impact on the pension deficit in 2008. However, when Macedonia entered a recession in
2009, the current pension deficit increased from 1.9 percent of GDP in 2008 to 2.5 percent in 2009. The
Government then announced a supplementary ad-hoc pension indexation for 2013, 2014, and 2015 of 5
percent, 7.5 percent and 10 percent, respectively. In 2013, the pension benefits were raised by an average
of 5- percentage points above regular indexation.96 In 2014, the ad-hoc indexation plans were reduced to a
95 Average nominal net wage in 2008 increased 10.4 percent, and the CPI 8.2 percent, with required pension indexation
(so called „Swiss“) midpoint standing at 9.3 percent. 96 Regular indexation stood at 2 percent. Supplementary 5 percent indxation was done by distributing a flat amount of
MKD 550 to all beneficiaries, which on the average amounted at 5 percent increase. Effectively, overall pension
increase ranged between 3 percent for high pension beneficiaries and 10 percent for low pensions.
Figure 7.2: Average Pension Benefit Relative to Average Wage
2009 and 2013 for FYR Macedonia
Source: The Inverting Pyramid: Pension Systems Facing Demographic
Challenges in Europe and Central Asia, World Bank, 2014.
0%
10%
20%
30%
40%
50%
60%
70%
80%
90%
Cyp
rus
Fran
ce
Gre
ece
Mal
ta
Spai
n
Luxe
mb
ou
rg
Ital
y
Swe
de
n
Ire
lan
d
Ge
rma
ny
Au
stri
a
No
rwa
y
Fin
lan
d
Po
rtu
gal
Ge
org
ia
Arm
en
ia
Mo
ldo
va
Cro
atia
Alb
ania
Lith
uan
ia
Ru
ssia
Hu
nga
ry
Bu
lga
ria
Slo
vaki
a
Esto
nia
Latv
ia
Po
lan
d
Be
laru
s
Ro
man
ia
Cze
ch R
ep
ub
lic
Mo
nte
ne
gro
Serb
ia
BH
Fe
de
rati
on
Mac
ed
on
ia 2
00
9
Re
pu
blik
a Sr
psk
a
Mac
ed
on
ia 2
01
3
Kaz
akh
stan
Aze
rbai
jan
Taji
kist
an
Kyr
gyzs
tan
Turk
ey
High IncomeGenerous Spenders
High IncomeModerate Spenders
Lower Spending Transition Countries High SpendingTransitionCountries
Youngcountries

112
5-percent indexation cap. This plan was implemented through flat amounts of MKD 600 (USD 11) per
beneficiary, which led to an effective indexation of 2 percent for higher pensions to 9 percent for lower
pensions. A 5 percent-capped indexation pattern is envisaged according to the 2015 budget law, which
allows for both regular and ad-hoc residual indexation.
7.9. In parallel, the Government cut contribution rates in the past. The Government reduced
contribution rates several times in order to cut labor costs and improve labor competitiveness. In 2009, the
PAYG pension contribution rate was lowered from 21.2 percent to 19 percent and in 2010 to 18 percent.
This led to a decline in contribution revenues by 1.15 percent of GDP 97 and contributed to a widening of
the overall PAYG deficit, which reached 3.7 percent of GDP in 2011.98 As a result of the reduction in
contribution rates, FYR Macedonia has one of the lowest pension contribution rates in ECA, with only
Kosovo and Kazakhstan using lower rates (Figure 7.3). The Government implemented a measure allowing
for an increase in the retirement for up to three years for all workers on a voluntary basis that age may bring
some improvements.
Figure 7.3: Pension and Social Insurance Contribution Rates Selected European and Central Asian Economies, 2011 (2013 for Macedonia)
Source: World Bank Pension Database.
7.10. The pension deficit has widened since 2007 as a result of these changes. In fact, in terms of
GDP it increased from 2.9 percent in 2007 to 4.5 percent in 2013. During this period, pension revenues
declined from 5.9 percent to 5.7 percent as a share of GDP, while pension expenditures increased from 8.8
percent to 10.2 percent of GDP. This increase was largely driven by growth in pension benefits: transition
costs related to the introduction of the second pillar contributed only 0.3 percent of GDP to this increase.
The slow trend of stabilizing pension expenditures through pension reform prior to 2007 was interrupted
by sudden hikes due to ad-hoc pension indexations (Figure 7.4). As a consequence, current pension
expenditures have returned to their early-2000s levels, albeit with higher deficits due to the reduced
contribution rate and the introduction of the second pillar.
Figure 7.4: Pension System Financing
97 See Pension Fund’s 2010 Actuarial Report. (http://www.piom.com.mk/informacii/statistika/40.html) 98 The second-pillar contribution rate was also cut from 6.7 percent to the current 6 percent between 2009 and 2010.
0
5
10
15
20
25
30
35
40
45
50
Can
ada
Ire
lan
dU
nit
ed
Sta
tes
Ice
lan
dU
nit
ed
Kin
gdo
mN
orw
ay
Jap
an
Swit
zerl
and
Fin
lan
dLu
xem
bo
urg
Gre
ece
Swe
de
nP
ort
uga
lSp
ain
Be
lgiu
mG
erm
an
yN
eth
erl
an
ds
Fran
ceA
ust
ria
Ital
yK
oso
voK
azak
hst
anM
ace
do
nia
Turk
ey
Bu
lga
ria
Turk
me
nis
tan
Alb
ania
Aze
rbai
jan
Esto
nia
Ge
org
iaR
uss
ian
Fed
era
tio
nK
yrgy
z R
epu
blic
Arm
en
iaP
ola
nd
Be
laru
sM
old
ova
Lith
uan
iaR
om
ania
Latv
iaM
on
ten
egr
oH
un
gary
Slo
vak
Re
pu
blic
Serb
iaC
zech
Re
pu
blic
Uzb
eki
stan
Cro
atia
Slo
ven
iaU
krai
ne
Pension Other SI

113
Source: PIOM, Annual Report 2014.
GDP revised data according to ESA 2010, source: Statistical Yearbook of Macedonia, 2013.
*includes second-pillar contributions
** pension expenditures minus PAYG-only contribution revenues (excluding second--pillar contributions)
7.11. As of 2014, FYR Macedonia’s pension spending is relatively close to the average of other
Central and South East European countries. In 2013, Macedonia’s pension spending was 10.2 percent
which is close to the average of developed European countries of 10.7 percent but above the average of 9.2
percent of the Central and South East European economies. In 2014, Macedonia’s pension expenditures
declined to 9.6 percent due to FYR Macedonia’s strong GDP growth, bringing the spending ratio closer
that of other transition countries. In the long run, pension expenditures are likely to increase.99
99 The projections take into account that the share of pensioners whose pensions have been fully paid from the first
pillar will decline over time, whereas the share of pensioners who will receive part of their pensions from the second
pillar will increase.
0
2
4
6
8
10
12
0
1
2
3
4
5
2001 2002 2003 2004 2005 2006 2007 2008 2009 2010 2011 2012 2013
PAYG deficit (left axis) Other pension deficit (left axis)
Pension expenditures (right axis) Pension revenues (right axis)

114
Figure 7.5: Current and Projected Pension Spending, 2010 and 2060, in Selected European
and Central Asian Economies (in percent of GDP)
Source: The Inverting Pyramid: Pension Systems Facing Demographic Challenges in Europe and Central
Asia, World Bank, 2014.
7.12. Macedonia has tightened its criteria for early-retirement pensions and disability. General
early retirement, which is common in other countries in the region and in the EU, was abolished in 2005.
The potential pressure of this bold move on disability retirement was prevented by tightening the criteria
for disability eligibility as well. Since 2005 only individuals who are at least 45 years old, at least 50 percent
incapacitated and who have paid contributions of 1/3 of the service period since they were 20 year old (or
26 for individuals with tertiary education) are eligible for a general disability pension (Table Annex 7.1).
As a result of these reforms the number of disability pension beneficiaries declined. Until 2002, the share
of disability-pension beneficiaries in the total pensioners was around 21 percent. By 2013, it had declined
to below 15 percent. The only remaining early-retirement option is the extended-service period for
hazardous occupations, which awards 14 to 18 months for each 12 months worked, depending on hazard
levels, and reduces their effective retirement age accordingly. However, while occupations with “18 for 12
months” earn 50% more service period, the supplementary contribution rate they pay remains at only 5
percent - well below its actuarial balance.
Figure 7.6: Old age, disability and survivors pensions in Macedonia, 1991-2013
Source: PIOM, Annual Report for 2013.
0.0%
2.0%
4.0%
6.0%
8.0%
10.0%
12.0%
14.0%
16.0%
18.0%
20.0%It
aly
Fran
ce
Gre
ece
Spai
n
Mal
ta
Bel
gium
Slov
enia
Cypr
us
Luxe
mbo
urg
Den
mar
k
Port
ugal
Swed
en
Uni
ted
Kin
gdom
Aus
tria
Ger
man
y
Finl
and
Net
herl
ands
Irel
and
Nor
way
Croa
tia
Latv
ia
Arm
enia
Pola
nd
Esto
nia
Rus
sia
Alb
ania
Bul
gari
a
Czec
h R
epub
lic
Hun
gary
Lith
uani
a
Rom
ania
Slov
akia
Serb
ia
BH
Fed
erat
ion
Mac
edon
ia
Bel
aru
s
Rep
ublik
a Sr
psk
a
Kaz
akh
stan
Aze
rbai
jan
Kyr
gyz
Turk
ey
High Income GenerousSpenders
High Income Moderate Spenders Lower Spending Transition Countries High SpendingTransitionCountries
Youngcountries
2010
2060
0
20000
40000
60000
80000
100000
120000
140000
160000
180000
1991 1993 1995 1997 1999 2001 2003 2005 2007 2009 2011 2013
Old age pensions Disability pensions Survivors pensions

115
C. FISCAL SUSTAINABILITY
7.13. To assess the outlook of the Macedonian pension system, a status-quo simulation was
prepared. The status quo (or baseline) simulation shows the long-term social and fiscal performance of the
system in the absence of any reform. It assumes that current pension system rules and parameters will
remain in place. The simulation relies on the World Bank PROST (Pension Reform Options Simulations
Toolkit) which has been adjusted to fit Macedonian pension system parameters.100 PROST incorporates the
most recent Macedonian demographic and economic data up to 2013, and includes projected economic and
demographic trends and macroeconomic assumptions for the simulation period that ends in 2080.
7.14. Though still among the ECA countries with a relatively young population, FYR Macedonia’s
share of elderly is projected to increase rapidly. With life expectancy at birth at 72.7 years for men and
77 years for women, and a share of people over 65 in the total population of 12 percent, Macedonia stands
slightly below demographically old countries in the region. According to UN demographic forecasts101, its
current fertility rate of 1.51 is expected to gradually improve to 1.95 by 2080. Our baseline projection
assumes that the ratio of contributors of any given age to the general population at any given age remains
constant over the simulation horizon.102 Assuming there is no change in net migration, and aging accelerates
at demographic assumptions according to UN population projections, the share of people aged 65+ in the
population would increase from 12 percent in 2010 to 26 percent in 2050. This would place Macedonia
among the ECA countries with a relatively high share of elderly people in 2050. (Figure 7.7)
Figure 7.7: Share people aged 65+ in Total Population, selected countries, 2010 - 2050 (in percent)
Source: The Inverting Pyramid: Pension Systems Facing Demographic Challenges in Europe and Central Asia,
World Bank, 2014.
100 PROST is a standard World Bank tool used to analyze pension system features in more than 100 countries. 101 Medium variant of UN population projections. 102 To illustrate, in 2013 there were 526,909 individuals paying contributions into the public PAYG pension system.
For example, at age 45, the number of contributors as a share of population stood at 53 percent for men and 43 percent
for women.
0%
5%
10%
15%
20%
25%
30%
35%
40%
Luxe
mb
our
gFr
ance
Bel
giu
mCy
pru
sM
alta
Slo
ven
iaG
reec
eSw
itze
rlan
dSp
ain
Ital
yIc
elan
dIr
elan
dU
nite
d K
ingd
om
No
rway
Den
mar
kSw
eden
Finl
and
Net
herl
and
sA
ustr
iaG
erm
any
Port
ugal
Arm
enia
Ru
ssia
n Fe
der
atio
nR
epub
lic o
f M
old
ova
Bel
aru
sLi
thu
ania
Esto
nia
Alb
ania
Hun
gary
Latv
iaG
eorg
iaSl
ova
kia
Pola
ndCz
ech
Rep
ub
licCr
oat
iaR
om
ania
Bul
gari
aM
ont
eneg
roU
krai
neSe
rbia
Mac
edon
iaB
osn
ia &
Her
zego
vin
aTa
jikis
tan
Kyr
gyzs
tan
Turk
men
ista
nK
azak
hst
anU
zbek
ista
nA
zerb
aija
nTu
rkey
high income high spenders high income moderate spenders lower spending transition high spendingtransitioncountries
young countries
2010 2050
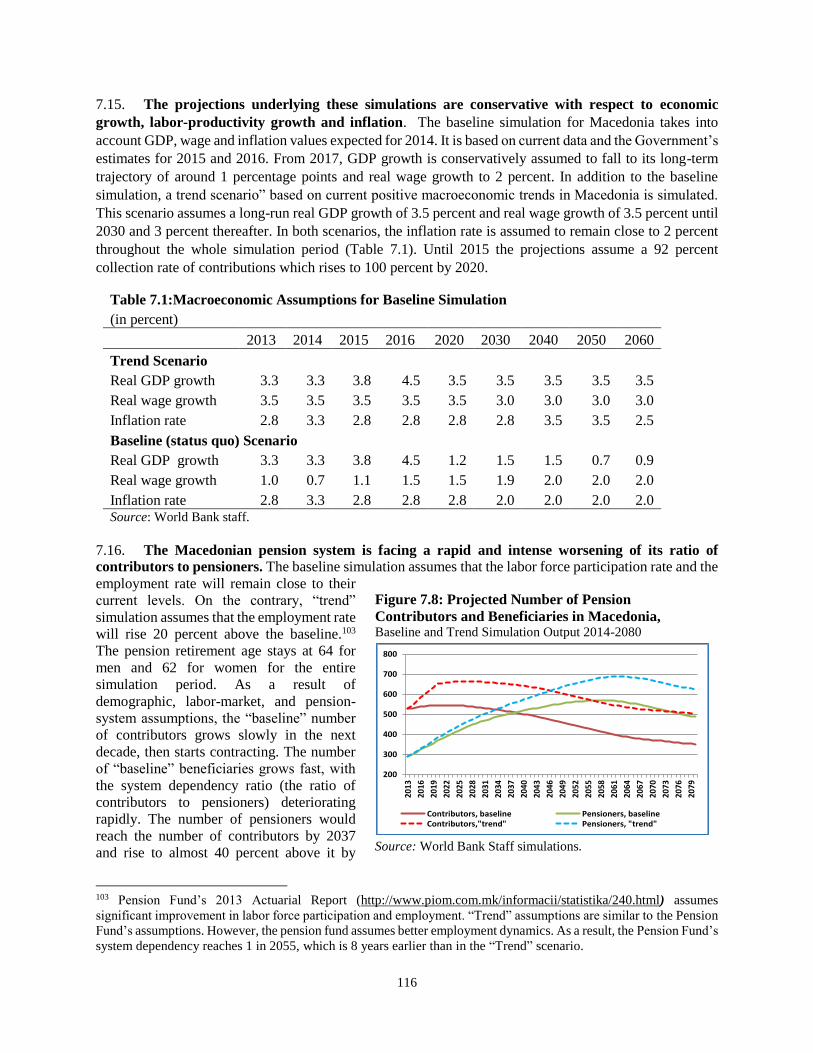
116
7.15. The projections underlying these simulations are conservative with respect to economic
growth, labor-productivity growth and inflation. The baseline simulation for Macedonia takes into
account GDP, wage and inflation values expected for 2014. It is based on current data and the Government’s
estimates for 2015 and 2016. From 2017, GDP growth is conservatively assumed to fall to its long-term
trajectory of around 1 percentage points and real wage growth to 2 percent. In addition to the baseline
simulation, a trend scenario” based on current positive macroeconomic trends in Macedonia is simulated.
This scenario assumes a long-run real GDP growth of 3.5 percent and real wage growth of 3.5 percent until
2030 and 3 percent thereafter. In both scenarios, the inflation rate is assumed to remain close to 2 percent
throughout the whole simulation period (Table 7.1). Until 2015 the projections assume a 92 percent
collection rate of contributions which rises to 100 percent by 2020.
Table 7.1:Macroeconomic Assumptions for Baseline Simulation
(in percent)
2013 2014 2015 2016 2020 2030 2040 2050 2060
Trend Scenario
Real GDP growth 3.3 3.3 3.8 4.5 3.5 3.5 3.5 3.5 3.5
Real wage growth 3.5 3.5 3.5 3.5 3.5 3.0 3.0 3.0 3.0
Inflation rate 2.8 3.3 2.8 2.8 2.8 2.8 3.5 3.5 2.5
Baseline (status quo) Scenario
Real GDP growth 3.3 3.3 3.8 4.5 1.2 1.5 1.5 0.7 0.9
Real wage growth 1.0 0.7 1.1 1.5 1.5 1.9 2.0 2.0 2.0
Inflation rate 2.8 3.3 2.8 2.8 2.8 2.0 2.0 2.0 2.0 Source: World Bank staff.
7.16. The Macedonian pension system is facing a rapid and intense worsening of its ratio of
contributors to pensioners. The baseline simulation assumes that the labor force participation rate and the
employment rate will remain close to their
current levels. On the contrary, “trend”
simulation assumes that the employment rate
will rise 20 percent above the baseline.103
The pension retirement age stays at 64 for
men and 62 for women for the entire
simulation period. As a result of
demographic, labor-market, and pension-
system assumptions, the “baseline” number
of contributors grows slowly in the next
decade, then starts contracting. The number
of “baseline” beneficiaries grows fast, with
the system dependency ratio (the ratio of
contributors to pensioners) deteriorating
rapidly. The number of pensioners would
reach the number of contributors by 2037
and rise to almost 40 percent above it by
103 Pension Fund’s 2013 Actuarial Report (http://www.piom.com.mk/informacii/statistika/240.html) assumes
significant improvement in labor force participation and employment. “Trend” assumptions are similar to the Pension
Fund’s assumptions. However, the pension fund assumes better employment dynamics. As a result, the Pension Fund’s
system dependency reaches 1 in 2055, which is 8 years earlier than in the “Trend” scenario.
Figure 7.8: Projected Number of Pension
Contributors and Beneficiaries in Macedonia, Baseline and Trend Simulation Output 2014-2080
Source: World Bank Staff simulations.
200
300
400
500
600
700
800
2013
2016
2019
2022
2025
2028
2031
2034
2037
2040
2043
2046
2049
2052
2055
2058
2061
2064
2067
2070
2073
2076
2079
Contributors, baseline Pensioners, baselineContributors,"trend" Pensioners, "trend"
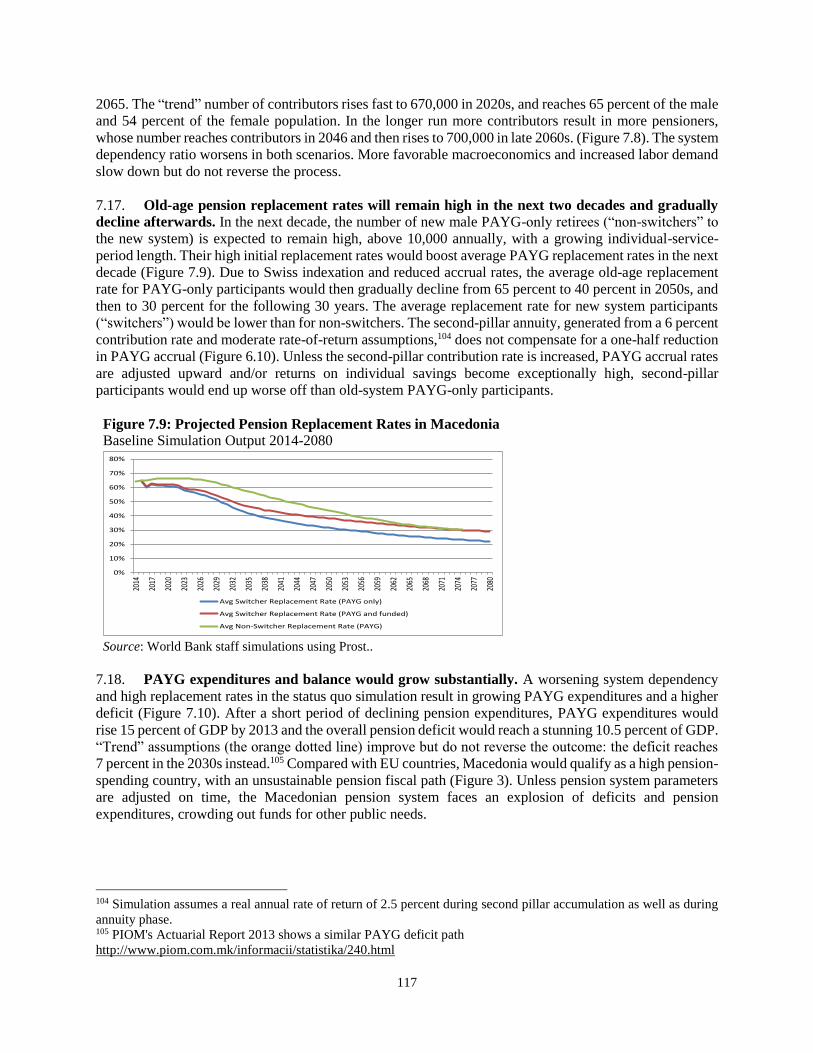
117
2065. The “trend” number of contributors rises fast to 670,000 in 2020s, and reaches 65 percent of the male
and 54 percent of the female population. In the longer run more contributors result in more pensioners,
whose number reaches contributors in 2046 and then rises to 700,000 in late 2060s. (Figure 7.8). The system
dependency ratio worsens in both scenarios. More favorable macroeconomics and increased labor demand
slow down but do not reverse the process.
7.17. Old-age pension replacement rates will remain high in the next two decades and gradually
decline afterwards. In the next decade, the number of new male PAYG-only retirees (“non-switchers” to
the new system) is expected to remain high, above 10,000 annually, with a growing individual-service-
period length. Their high initial replacement rates would boost average PAYG replacement rates in the next
decade (Figure 7.9). Due to Swiss indexation and reduced accrual rates, the average old-age replacement
rate for PAYG-only participants would then gradually decline from 65 percent to 40 percent in 2050s, and
then to 30 percent for the following 30 years. The average replacement rate for new system participants
(“switchers”) would be lower than for non-switchers. The second-pillar annuity, generated from a 6 percent
contribution rate and moderate rate-of-return assumptions,104 does not compensate for a one-half reduction
in PAYG accrual (Figure 6.10). Unless the second-pillar contribution rate is increased, PAYG accrual rates
are adjusted upward and/or returns on individual savings become exceptionally high, second-pillar
participants would end up worse off than old-system PAYG-only participants.
Figure 7.9: Projected Pension Replacement Rates in Macedonia
Baseline Simulation Output 2014-2080
Source: World Bank staff simulations using Prost..
7.18. PAYG expenditures and balance would grow substantially. A worsening system dependency
and high replacement rates in the status quo simulation result in growing PAYG expenditures and a higher
deficit (Figure 7.10). After a short period of declining pension expenditures, PAYG expenditures would
rise 15 percent of GDP by 2013 and the overall pension deficit would reach a stunning 10.5 percent of GDP.
“Trend” assumptions (the orange dotted line) improve but do not reverse the outcome: the deficit reaches
7 percent in the 2030s instead.105 Compared with EU countries, Macedonia would qualify as a high pension-
spending country, with an unsustainable pension fiscal path (Figure 3). Unless pension system parameters
are adjusted on time, the Macedonian pension system faces an explosion of deficits and pension
expenditures, crowding out funds for other public needs.
104 Simulation assumes a real annual rate of return of 2.5 percent during second pillar accumulation as well as during
annuity phase. 105 PIOM's Actuarial Report 2013 shows a similar PAYG deficit path
http://www.piom.com.mk/informacii/statistika/240.html
0%
10%
20%
30%
40%
50%
60%
70%
80%
2014
2017
2020
2023
2026
2029
2032
2035
2038
2041
2044
2047
2050
2053
2056
2059
2062
2065
2068
2071
2074
2077
2080
Avg Switcher Replacement Rate (PAYG only)
Avg Switcher Replacement Rate (PAYG and funded)
Avg Non-Switcher Replacement Rate (PAYG)

118
Figure 7.10: Baseline simulation output 2014-2080
Source: World Bank staff simulations using PROST.
7.19. Similarly, the Macedonian implicit
pension debt would remain above 40
percent of GDP in the next two decades and
then gradually decline. Implicit pension debt
(the present value of future pension
obligations to all current generations)106
stands at a high 400 percent of GDP,
suggesting that the Macedonian pension
system imposes a heavy fiscal burden on
current and future generations (Figure
7.11).107 Pension reform measures, especially
the reduced accrual rates for switchers to the
new system imposed in 2012, reduce the
implicit debt liabilities in the long run, but the
system would nevertheless remain relatively
generous, regardless of economic and labor-market assumptions. Most currently-working individuals will
be eligible for the PAYG benefit with accrual rates that, while somewhat reduced, are still high compared
to other countries. Halved accrual rates of switching cohorts still generate PAYG liabilities above two
GDPs. A reduction of this implicit debt could be achieved through reforms that extend the service period,
narrow early retirement options and reduce the generosity of the system.
D. CONCLUSIONS
7.20. Despite sound parametric changes during the last two decades, FYR Macedonia’s pension
spending remains slightly above that of other Central and South East European economies. FYR
Macedonia’s pension spending in terms of GDP was 9.6 percent in 2014, which is slightly above the average
of 9.2 percent of comparable Central and South East European countries. Although the Macedonian pension
reforms have been well designed and successfully implemented, its retirement for men is currently the
106 Implicit pension debt is a measure of pension system costs to society. It reflects a long-term nature of pension
liabilities, and is intended to facilitate the comparison between the reform options. A definition, measurement, and
estimates of implicit pension debt are given in Holzmann, Palacios, and Zviniene (2004). 107 Discount rate of 5 percent is used in all simulations.
(15.0%)
(10.0%)
(5.0%)
5.0%
10.0%
15.0%
20.0%2
01
4
20
17
20
20
20
23
20
26
20
29
20
32
20
35
20
38
20
41
20
44
20
47
20
50
20
53
20
56
20
59
20
62
20
65
20
68
20
71
20
74
20
77
20
80
PAYG Balance Baseline PAYG expenditures/GDP
PAYG revenues/GDP PAYG balance trend
Figure 7.11: Projected Implicit Pension Debt
Baseline and Trend Simulation Outputs 2014-2080
Source: World Bank staff simulations using PROST.
50.0%
100.0%
150.0%
200.0%
250.0%
300.0%
350.0%
400.0%
450.0%
500.0%20
13
2016
2019
2022
2025
2028
2031
2034
2037
2040
2043
2046
2049
2052
2055
2058
2061
2064
2067
2070
2073
2076
2079
Implicit PAYG Debt Baseline Implicit PAYG Debt Trend

119
earliest and for women the second lowest among CEE countries. Its accrual rate of 1.6 is the highest and
its indexation pattern of wage valorization and Swiss indexation is the most generous among CEE countries.
7.21. The Macedonian pension system is fiscally unsustainable over the medium term. Macedonia
implemented sound reform measures in recent years, some of which were very successful, such as the
elimination of the general early retirement and the introduction of an age-limit on general disability
conditions. Yet, despite these reforms the Macedonian pension system is unlikely to be able to cope with a
rapidly aging population. In the absence of further reforms, it is likely to generate a sizable deficit, even if
current favorable macroeconomics prevail and despite the recent implementation of a voluntary increase in
the retirement age. Under a conservative baseline scenario, the pension deficit would reach 10.5 percent of
GDP by 2030. Even under sustained high growth rates, it would climb to 7 percent by 2030. The implicit
pension debt is projected to remain above 400 percent of GDP, which is high by international standards and
will impose a heavy burden on future generations. The second-pillar contribution is too small to yield the
annuity that would compensate for the reduced PAYG benefit of multi-pillar participants. The PAYG
deficits in the short and medium term would deplete public funds and prolong the increase in the second-
pillar contribution rate. As a consequence, overly generous PAYG-only pensions now may lead to socially
unsustainable multi-pillar pensions in the future.

120
Annex Table 7.1. Pension Parameters in FYR Macedonia
Table 1: Pension Parameters in Macedonia
Retirement
Age 2014
64 M/ 62 F with 15 years of contributions; Voluntary old age retirement age 67 M/65 F
Accrual
rate Service Period for:
Until 2001 2001 - 2012 2013 -
Non II-pillar members
with less than 15 years
of service
2.33% - men
2.60% - women
1.8% - men
2.05% – women
1.6% - men
1.8% - women
Non II-pillar members
with more than 15 years
of service
Declining (art 228)
2.3% - 2.0% - men
2.6% - 2.1% - women
Declining (art 228)
2.3% - 2.0% - men
2.6% - 2.1% - women
1.61% - men
1.61% - women
II-pillar members that
opted in the system
2.33% - men
2.60% - women
From 2003
0.75% - men
0.86% - women
0.75% - men
0.86% - women
II-pillar member that
mandatorily joined the
system
- From 2003
0.75% - men
0.86% - women
0.75% - men
0.86% - women
Pensionable
base
Career earnings, revalued with historical average wage growth
Minimum
pension
35%-41% of 2002 average wage indexed same as regular pensions.
Indexation
post-
retirement
Swiss formula: 50% average gross wage growth plus 50% CPI.
Eligibility
for
disability
pension
Professional incapacity: at least 50% reduced work capacity, minimum age of 45, and 1/3 of
contribution period above age of 20 (26 for tertiary education);
General incapacity: 100% incapacity, minimum 20 years of age, (26 for tertiary education), and
at least of 1/3 of contribution period above age of 20 (26 for tertiary education); for injury at
work, regardless of service period.
Level of
Disability
Pension
80% of the old age pension for full incapacity in case of work injury and professional disease;
declining to 72% by 2040;
Professional incapacity: 38% M/ 44% F is the replacement rate upon attainment of age; pension
supplements 10-20% for 80-100% incapacity;
Eligibility
for
survivor’s
pension
Age 50 in case of widow;
Age 55 in case of widower;
Children aged 15 or under and until age 26 if students or lifetime if incapacitated
Level of
survivor’s
pension
70% of contributor’s entitlement if 1 person; 80% to be divided by 2; 90% to be divided by 3;
and 100% to be divided if 4 or more
Second
pillar
participatio
n
New entrants since 2006 mandatory, voluntary opt-in for others
Pension
contributio
n rate
Total: 18%;
PAYG: 12%;
Second Pillar: 6%.
Source: Ministry of Labor and Social Policy. * Since 2003. **Workers who were injured at work or suffer a
professional illness are eligible regardless of service period. They receive 80 percent of the old-age pension for full
incapacity which declines to 72 percent by 2040.

121
REFERENCES
Afonso, Antonio, Ludger Schuknecht, and Vito Tanzi. 2003, “Public Sector Efficiency: An International
Comparison” European Central Bank, Working Paper No. 242.
Center for Research and Policy Making. (No date). “Rationalization of Health Care Services in Macedonia:
Case Studies: Skopje, Tetovo, Sveti Nikole, Negotino,” Skopje. www.crpm.org.mk.
European Commission. 2014. The Former Yugoslav Republic of Macedonia Progress Report. October
2014. Brussels. Belgium.
European Bank for Reconstruction and Development (EBRD) and the World Bank. 2010. “Life in
Transition: After the Crisis.” London.
European Observatory on Health Systems and Policies. 2006. “Health Systems in Transitions, HiT
Summary: The Former Yugoslav Republic of Macedonia.” Copenhagen. www.euro.who.int/observatory.
Health Insurance Fund (HIF) of Macedonia. 2014a. “Annual Report 2013.” Skopje.
Health Insurance Fund (HIF) of Macedonia. 2014b. “DRG Annual Report 2013.” Skopje.
Health Insurance Fund (HIF) of Macedonia. 2014. “Monthly report on the assets of the Fund and the Budget
of Public Health Institutions, period January 1, 2014 to August 31, 2014.” Skopje.
Heggie, Ian and Piers Vickers. 1998. World Bank Technical Paper No. 409.
Holzmann, Palacios, and Zviniene (2004). “Implicit Pension Debt: Issues, Measurement and Scope in
International Perspective.” World Bank Pension Primer. Washington, DC: World Bank.
Institute of Public Health (IPH). 2013. “Annual Health Statistics 2012.” Skopje.
Organization for Economic Cooperation and Development (OECD). 2013. “Health at a Glance 2013:
OECD Indicators.” Paris.
Republic of Macedonia. 2011. “Multiple Indicator Cluster Survey (MICS) 2011: Monitoring the situation
of children and women.” Ministry of Health, Ministry of Education and Science, and Ministry of Labor and
Social Policy. Skopje.
State Audit Office.2013. “Annual Report 2013.” Skopje.
Stefanovska, Vesna, and Miodraga Petkovska, “Patient Satisfaction in Outpatient Healthcare Services at
Secondary Level vs. Tertiary Level,” Srp Arh Celok Lek, 2014, Sep-Oct; 142(9-10):579-585. Skopje.
Theil, Henri. 1980. “The Entropy of the Maximum Entropy Distribution”, Economics Letters, vol. 5, Issue
2, pp. 145-148.
Trpeski P., Tashevska B., “Labour tax wedge in the Republic of Macedonia – Trends and international
comparison”, Annales Universitatis Apulensis Series Oeconomica, 14(2), 2012
United Nations (UN). 2013. World Population Prospects. New York.

122
World Bank. 2014a. “Country Partnership Strategy for the Former Yugoslav Republic of Macedonia for
the Period FY2015-FY2018.” Washington, DC.
World Bank. 2014b. “Shared Prosperity: Paving the Way in Europe and Central Asia.” Washington, DC.
World Bank. 2014c. “South East Europe – Regular Economic Report: Brittle Recovery”, No. 6, May 2014,
Washington, DC.
World Bank. 2013a. “FYR Macedonia: Infrastructure Review – Energy sector.” Washington, DC.
World Bank. 2013b. “Getting Better: Improving Health System Outcomes in Europe and Central Asia.”
Washington, D.C.
World Bank, 2013c. “Project Performance Assessment Report: Former Yugoslav Republic of Macedonia,
Health Sector Management Project,” Independent Evaluation Group, Report No. 78210. Washington, DC.
World Bank. 2013d. “Analysis of The Agricultural Support Programs in FYR Macedonia”, mimeo.
World Bank. 2011. “Water Security in FYR Macedonia through Strengthening of Water Economies.”
World Bank Report, Washington DC.
World Bank. 2008. “FYR Macedonia. Public Expenditure Review”. Report No. 42155-MK. February
2008. Washington, DC.
World Economic Forum. 2015. “Global Competitiveness Report 2014-15”, Geneva.