Embed Size (px)
Citation preview
Strategic PlanAn Overall Approach to Achieving the Vision of the City of Gaithersburg
Fiscal Year 2022www.gaithersburgmd.gov
Strategic Plan Table of Contents
Strategic Plan Components ………………………………………………………………… i
Mission & Vision …..……………………………………………………………………………. ii
Guiding Principles ………………………………………………………………………………. iii
FY 2022 Strategic Directions
City Administration …………………………………………………………………………….. 1
Communication …………………………………………………………………………….……13
Community Services …………………………………………………………………………. 31
Economic Development ……………………………………………………………………. 44
Environment…………………………………………………………………………….…….... 59
Housing…………………………………………………………………………………………….. 67
Infrastructure and Facilities ………………………………………………………………. 81
Parks, Recreation and Culture …………………………………………………………… 86
Planning and Development ……………………………………………………………..…96
Police ……………………………………………………………………………………..………. 106
Transportation ………………………………………………………………………….…….. 117
Subject Index ..…………………………………………………………………………….….. 127
Appendix…………………………………………………………………………………………. 128
Strategic Plan Components
‐ i ‐
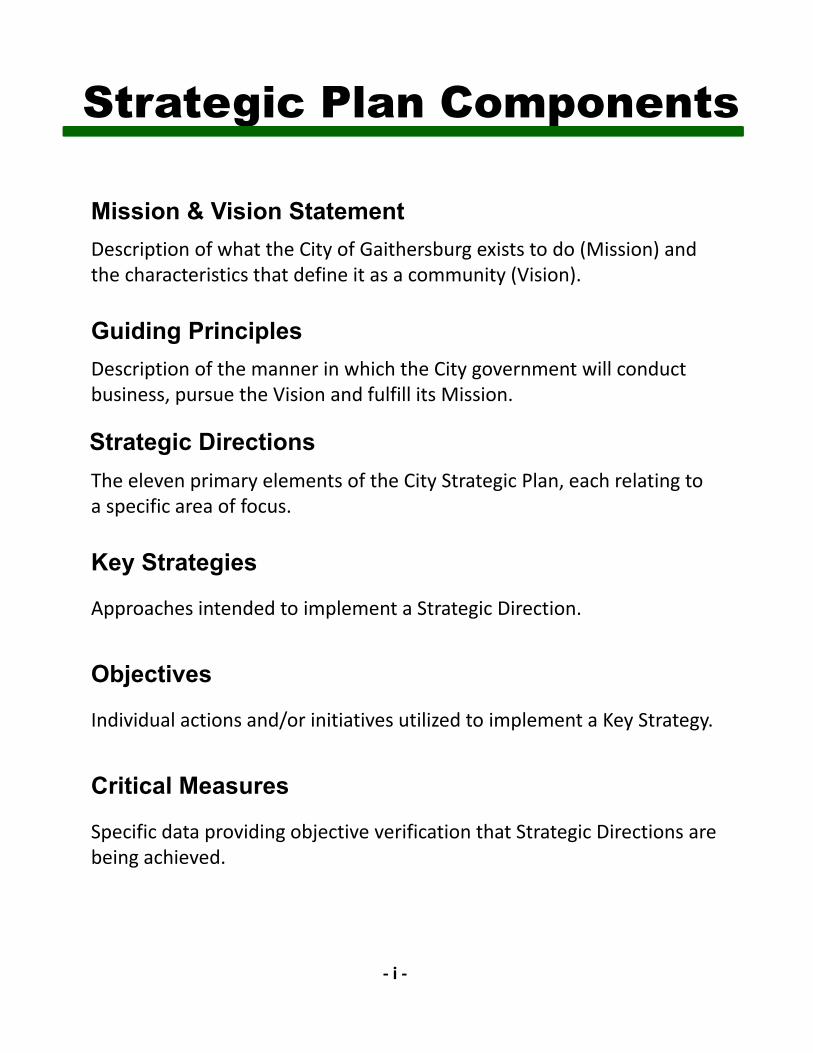
Mission & Vision Statement
Description of what the City of Gaithersburg exists to do (Mission) and the characteristics that define it as a community (Vision).
Guiding Principles
Key Strategies
Objectives
Critical Measures
Description of the manner in which the City government will conduct business, pursue the Vision and fulfill its Mission.
Approaches intended to implement a Strategic Direction.
Individual actions and/or initiatives utilized to implement a Key Strategy.
Specific data providing objective verification that Strategic Directions are being achieved.
The eleven primary elements of the City Strategic Plan, each relating to a specific area of focus.
Strategic Directions
Mission & Vision
‐ ii ‐
Mission: The Gaithersburg City government exists to provide quality, cost effective, priority community services for its citizens. We are a City that serves as a catalyst for the involvement of residents, businesses and organizations to ensure that Gaithersburg is a great place to live, work, learn, and play.
Lives by the Six Pillars of CHARACTER COUNTS!® (trustworthiness, respect, responsibility, fairness, caring, and citizenship)
Has retained the best qualities of a small town and respects its heritage, while embracing the opportunities that new technologies, programs and concepts in urban design provide
Has involved and supportive citizens and businesses reflecting the diversity of the community
Has a fiscally conservative, proactive government
Has safe, livable neighborhoods with a variety of housing types and styles served by diverse transportation options
Has excellent learning opportunities that meet the needs of the community
Has attractive and beautifully maintained parks and public places
Has citizens and institutions that value cultural diversity and inclusion and seeks ways to promote involvement from all cultural groups
Has many leisure time activities that meet the needs of the community
Has citizens with a strong sense of community and individual responsibility
Has a natural environment that is protected, respected and enhanced
Has strong partnerships to meet the needs of the community
Has a community that encourages individual health and wellness
Has a commitment to sustainable practices that promote social equity, environmental health and economic prosperity
Vision: Gaithersburg will be a City that:
Guiding Principles
‐ iii ‐
Customer FocusWe actively pursue the identification of citizen needs through citizen involvement to provide effective service to our community with efficiency, accountability and a caring attitude.
Open Communication
Creativity
Fiscal Responsibility
Cooperation
Commitment to Excellence
Continuous Improvement
We promote honest, open communication and easy access to information.
We strive to improve the quality and efficiency of City services through creative approaches and new, innovative and cost effective technologies.
We provide quality services, of the best value, to effectively meet the needs of our community while maintaining a pay‐as‐you‐go philosophy.
We promote a spirit of fairness, trustworthiness, respect, and teamwork among our elected officials, City employees, residential and business communities, neighboring jurisdictions, and other governmental agencies.
We strive to achieve excellence in all we do.
We advocate good citizenship and support the freedom to actively pursue suggestions, ideas and creative approaches, leading to continuous improvement in everything we do.
Key Strategies
Potential Strategy Conflicts‐
Gaithersburg Strategic Plan – FY 2022
City AdministrationProvide the highest levels of resident, visitor and business
services through the continual enhancement of administrative and support functions
• Maintain employee compensation program balancing internal equity and external competitiveness with financial sustainability
• Develop efficient, transparent processes/systems to provide financial information and foster sustainability
• Provide engaged, professional, diverse, and enthusiastic staff to serve City needs
• Ensure City policies and processes reflect City’s values, mission and vision
• Invest in/maintain technology to gain efficiencies, improve operational effectiveness, increase productivity, and assist in information dissemination
• Ensure maintenance of key City services while acknowledging changes in demographics, population growth and/or economic conditions
• Ensure effective and efficient communication among employees, citizens and stakeholders
• Maintain intergovernmental and lobbying activities to enhance City resources and residents’ quality of life
1
Objectives
• Offer wellness incentive programs that will encourage employees to lead a healthy and active lifestyle while helping the City reduce health care costs
• Facilitate the retirement transition process for employees
• Provide programs and processes aimed at maintaining a healthy, active workforce
• Maintain salary structures that are externally competitive, internally equitable and sustainable
• Provide training for departmental hiring managers on recruitment and selection best practices to build and maintain a talented and diverse workforce
• Provide an employee benefits strategy based on shared City and employee financial responsibilities, cost predictability, and appropriate plan design
• Maintain balanced personnel policies that reflect evolving expectations of the workforce
Maintain employee compensation program balancing internal equity and external competitiveness with financial sustainability
• Safeguard and maximize the use of resources through risk management, prudent investments, and best financial management practices
• Review and improve financial processes and procedures to remain current with changing needs and technology
• Provide timely, relevant financial information to decision makers and the public
• Ensure financial sustainability through long range financial planning and encouraging long term decision making
• Ensure budget document and financial statements continue to meet Government Finance Officers Associations (GFOA’s) Distinguished Budget Presentation Award and Excellence in Financial Reporting Award criteria
Develop efficient, transparent processes/systems to provide financial information and foster sustainability
2
Objectives
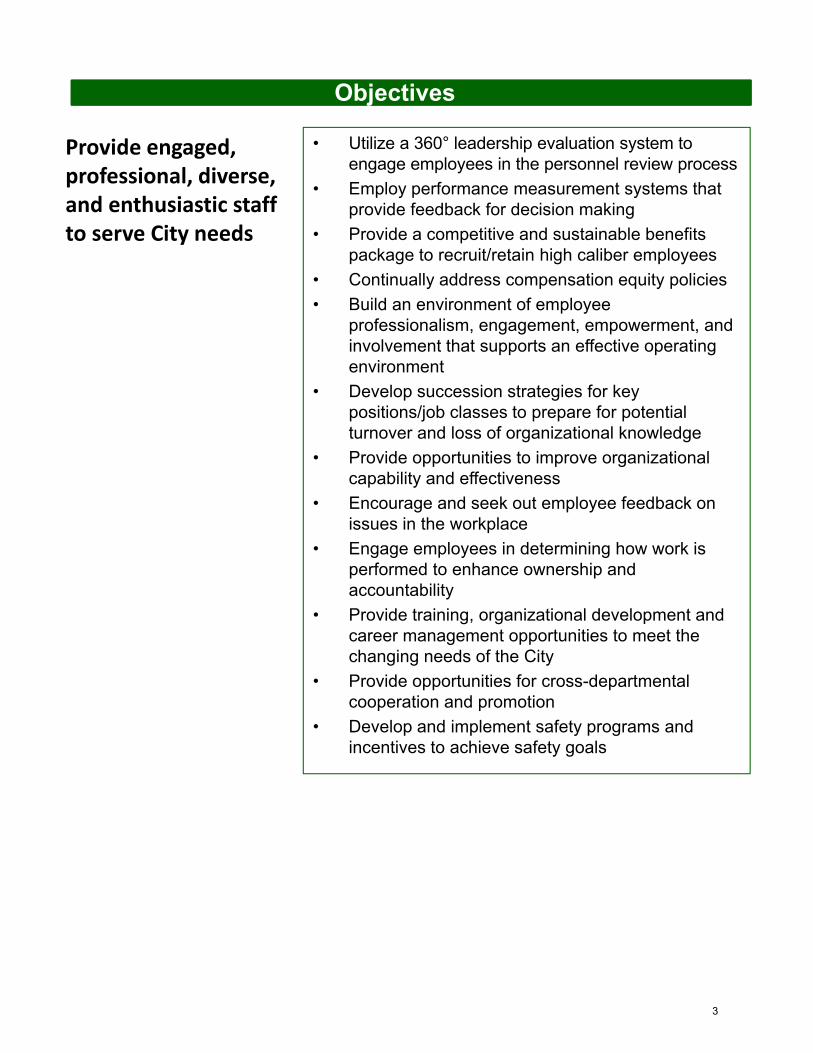
• Utilize a 360° leadership evaluation system to engage employees in the personnel review process
• Employ performance measurement systems that provide feedback for decision making
• Provide a competitive and sustainable benefits package to recruit/retain high caliber employees
• Continually address compensation equity policies
• Build an environment of employee professionalism, engagement, empowerment, and involvement that supports an effective operating environment
• Develop succession strategies for key positions/job classes to prepare for potential turnover and loss of organizational knowledge
• Provide opportunities to improve organizational capability and effectiveness
• Encourage and seek out employee feedback on issues in the workplace
• Engage employees in determining how work is performed to enhance ownership and accountability
• Provide training, organizational development and career management opportunities to meet the changing needs of the City
• Provide opportunities for cross-departmental cooperation and promotion
• Develop and implement safety programs and incentives to achieve safety goals
Provide engaged, professional, diverse, and enthusiastic staff to serve City needs
3
Objectives
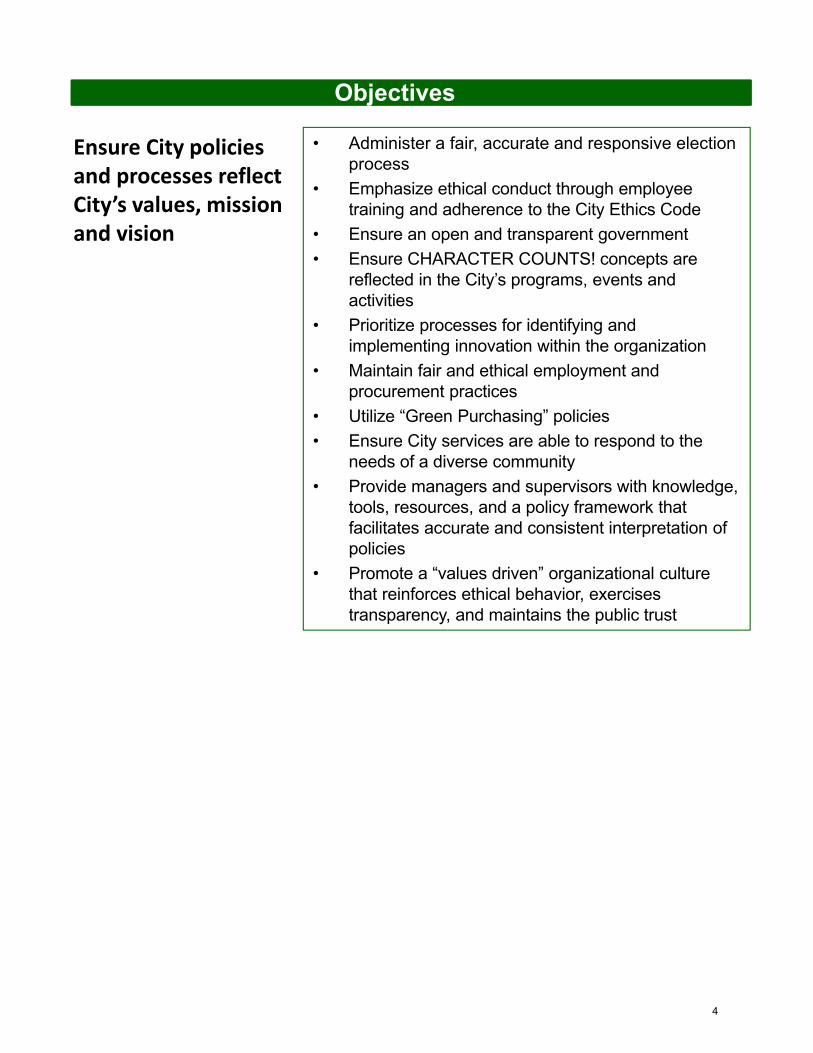
• Administer a fair, accurate and responsive election process
• Emphasize ethical conduct through employee training and adherence to the City Ethics Code
• Ensure an open and transparent government
• Ensure CHARACTER COUNTS! concepts are reflected in the City’s programs, events and activities
• Prioritize processes for identifying and implementing innovation within the organization
• Maintain fair and ethical employment and procurement practices
• Utilize “Green Purchasing” policies
• Ensure City services are able to respond to the needs of a diverse community
• Provide managers and supervisors with knowledge, tools, resources, and a policy framework that facilitates accurate and consistent interpretation of policies
• Promote a “values driven” organizational culture that reinforces ethical behavior, exercises transparency, and maintains the public trust
Ensure City policies and processes reflect City’s values, mission and vision
4
Objectives
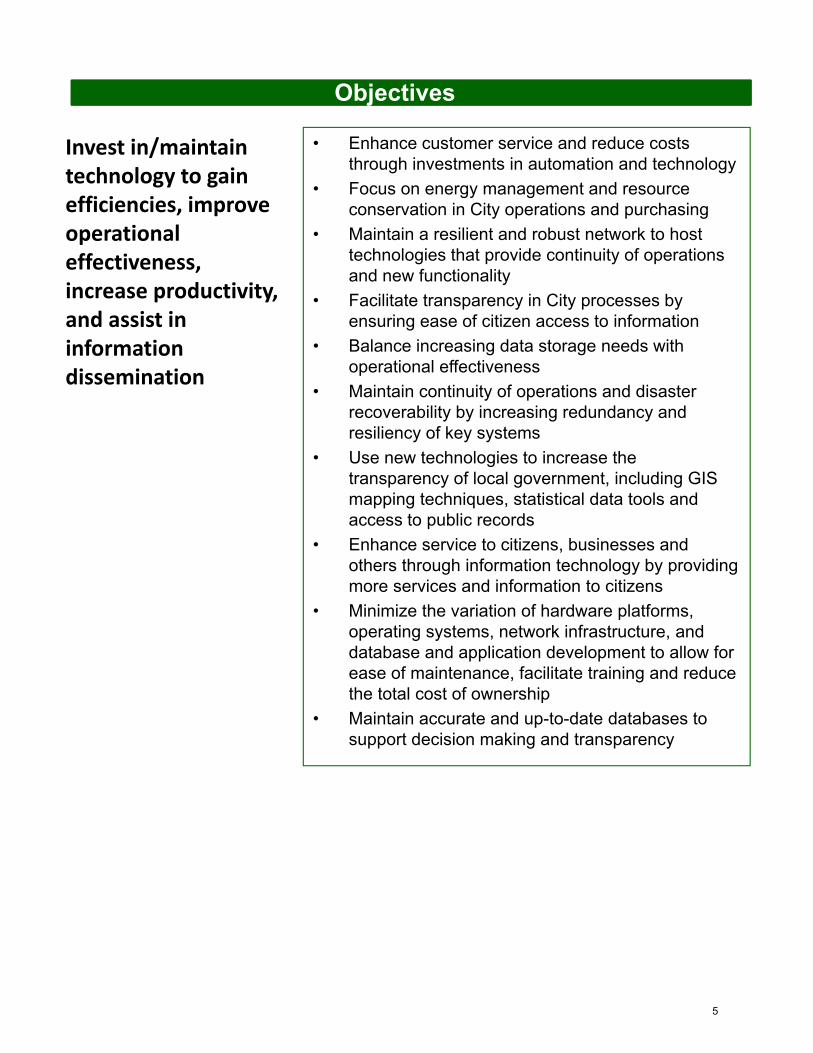
Invest in/maintaintechnology to gain efficiencies, improve operational effectiveness, increase productivity, and assist in information dissemination
• Enhance customer service and reduce costs through investments in automation and technology
• Focus on energy management and resource conservation in City operations and purchasing
• Maintain a resilient and robust network to host technologies that provide continuity of operations and new functionality
• Facilitate transparency in City processes by ensuring ease of citizen access to information
• Balance increasing data storage needs with operational effectiveness
• Maintain continuity of operations and disaster recoverability by increasing redundancy and resiliency of key systems
• Use new technologies to increase the transparency of local government, including GIS mapping techniques, statistical data tools and access to public records
• Enhance service to citizens, businesses and others through information technology by providing more services and information to citizens
• Minimize the variation of hardware platforms, operating systems, network infrastructure, and database and application development to allow for ease of maintenance, facilitate training and reduce the total cost of ownership
• Maintain accurate and up-to-date databases to support decision making and transparency
5
Objectives
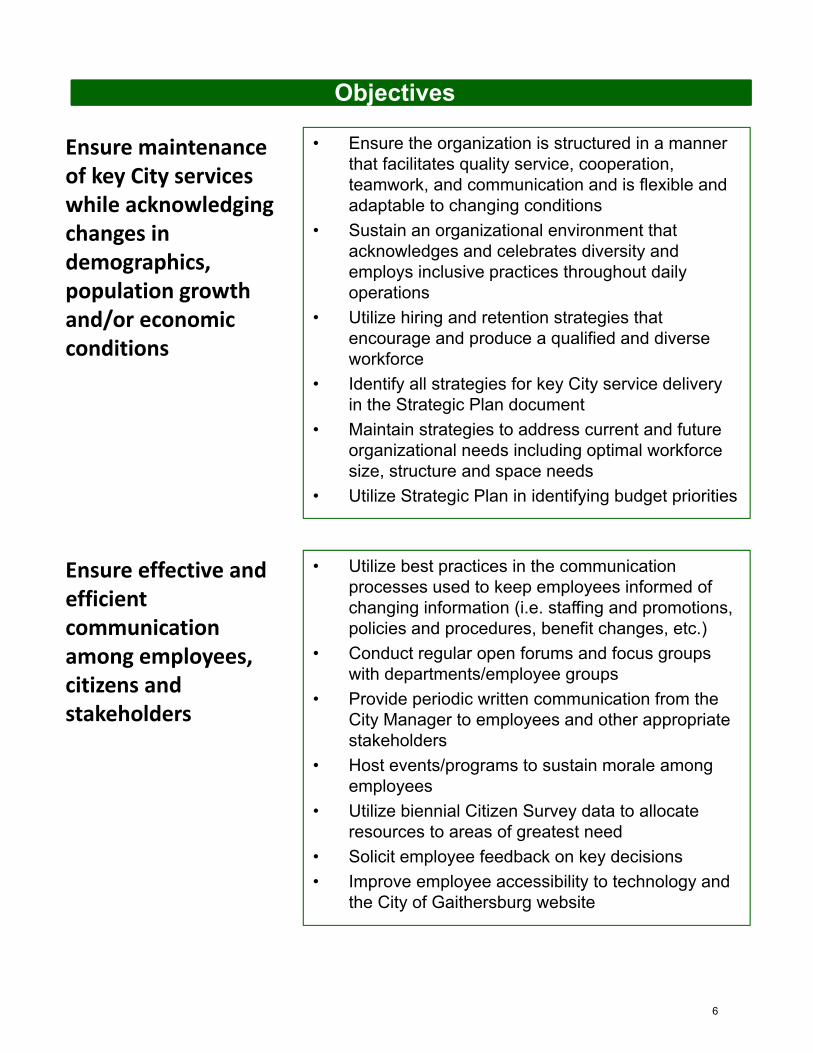
• Ensure the organization is structured in a manner that facilitates quality service, cooperation, teamwork, and communication and is flexible and adaptable to changing conditions
• Sustain an organizational environment that acknowledges and celebrates diversity and employs inclusive practices throughout daily operations
• Utilize hiring and retention strategies that encourage and produce a qualified and diverse workforce
• Identify all strategies for key City service delivery in the Strategic Plan document
• Maintain strategies to address current and future organizational needs including optimal workforce size, structure and space needs
• Utilize Strategic Plan in identifying budget priorities
Ensure maintenance of key City services while acknowledging changes in demographics, population growth and/or economic conditions
• Utilize best practices in the communication processes used to keep employees informed of changing information (i.e. staffing and promotions, policies and procedures, benefit changes, etc.)
• Conduct regular open forums and focus groups with departments/employee groups
• Provide periodic written communication from the City Manager to employees and other appropriate stakeholders
• Host events/programs to sustain morale among employees
• Utilize biennial Citizen Survey data to allocate resources to areas of greatest need
• Solicit employee feedback on key decisions
• Improve employee accessibility to technology and the City of Gaithersburg website
Ensure effective and efficient communication among employees, citizens and stakeholders
6
Objectives
• Maintain close working relationships with representatives of all levels of government and continually seek funding and grant opportunities for City priorities
• Evaluate services and programs that are duplicated by other levels of government/private sector and work to eliminate/reduce redundancies
• Forge partnerships with peer local governments and associated advocacy groups to maintain a leadership role on broad policy issues
• Ensure accurate assessment of real property within the City to provide for timely, equitable collection of taxes
• Work with local municipalities and Montgomery County on issues associated with tax duplication
Maintain intergovernmental and lobbying activities to enhance City resources and residents’ quality of life
7
Action Items
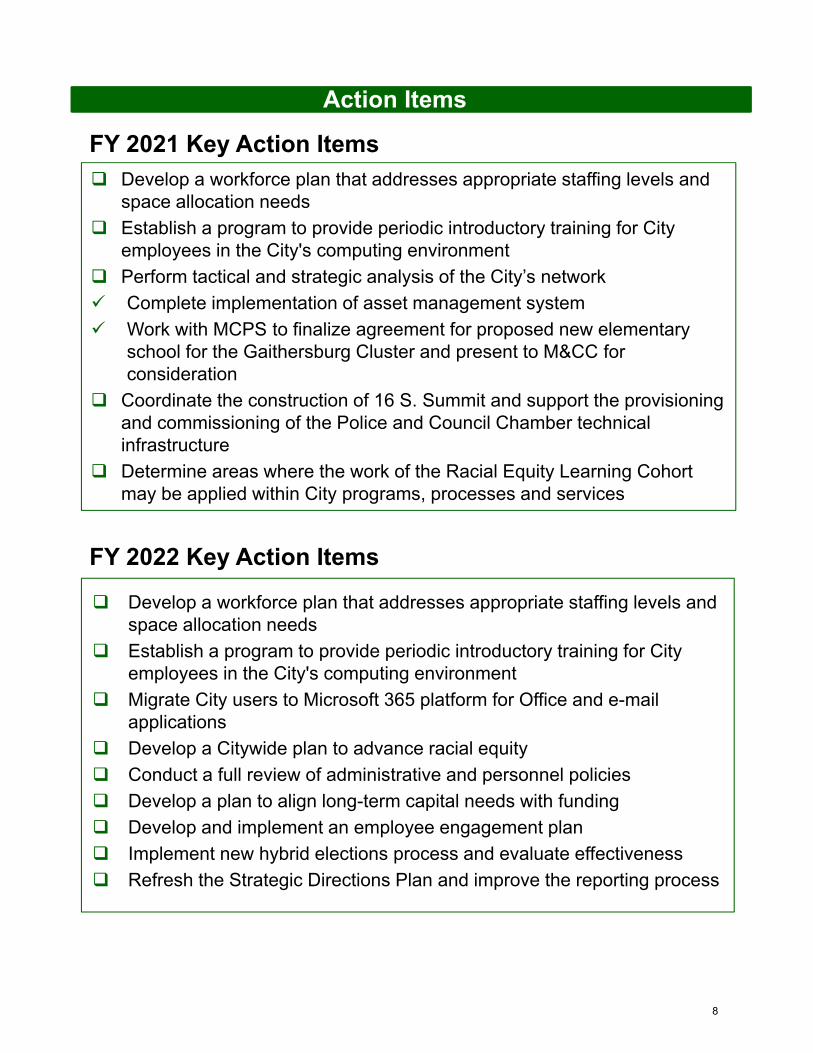
FY 2021 Key Action Items
Develop a workforce plan that addresses appropriate staffing levels and space allocation needs
Establish a program to provide periodic introductory training for City employees in the City's computing environment
Perform tactical and strategic analysis of the City’s network
Complete implementation of asset management system
Work with MCPS to finalize agreement for proposed new elementary school for the Gaithersburg Cluster and present to M&CC for consideration
Coordinate the construction of 16 S. Summit and support the provisioning and commissioning of the Police and Council Chamber technical infrastructure
Determine areas where the work of the Racial Equity Learning Cohort may be applied within City programs, processes and services
FY 2022 Key Action Items
Develop a workforce plan that addresses appropriate staffing levels and space allocation needs
Establish a program to provide periodic introductory training for City employees in the City's computing environment
Migrate City users to Microsoft 365 platform for Office and e-mail applications
Develop a Citywide plan to advance racial equity
Conduct a full review of administrative and personnel policies
Develop a plan to align long-term capital needs with funding
Develop and implement an employee engagement plan
Implement new hybrid elections process and evaluate effectiveness
Refresh the Strategic Directions Plan and improve the reporting process
8
Critical Measures
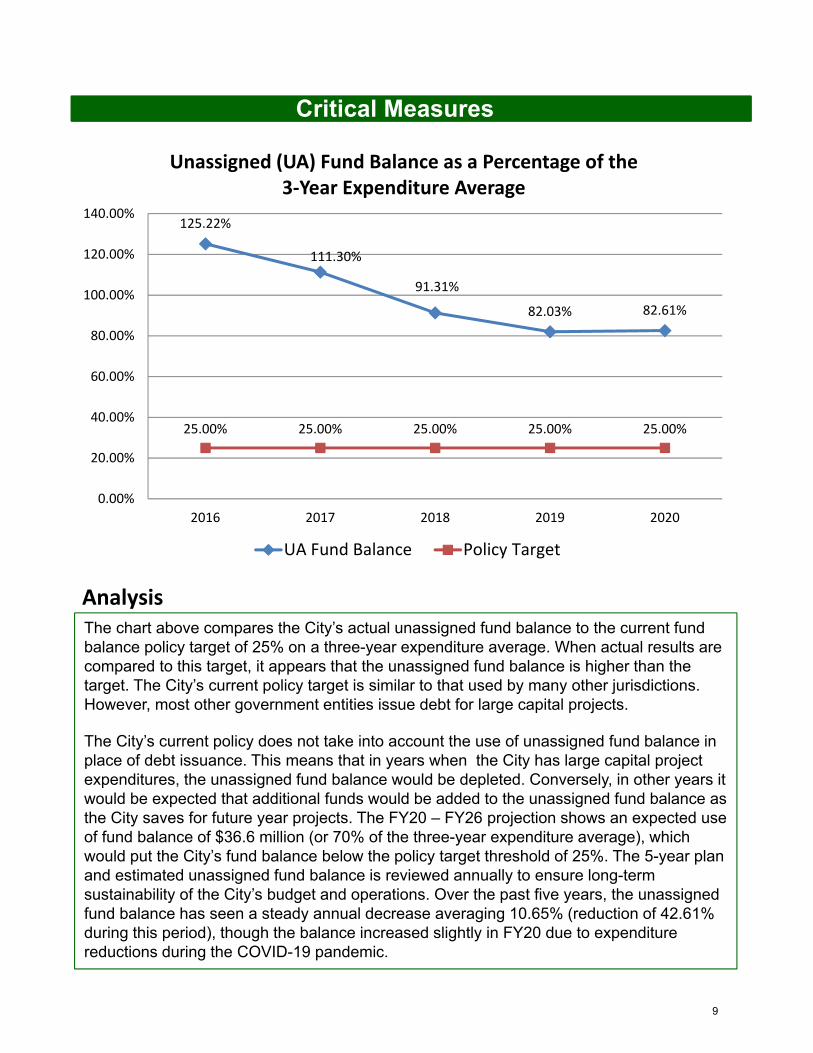
The chart above compares the City’s actual unassigned fund balance to the current fund balance policy target of 25% on a three-year expenditure average. When actual results are compared to this target, it appears that the unassigned fund balance is higher than the target. The City’s current policy target is similar to that used by many other jurisdictions. However, most other government entities issue debt for large capital projects.
The City’s current policy does not take into account the use of unassigned fund balance in place of debt issuance. This means that in years when the City has large capital project expenditures, the unassigned fund balance would be depleted. Conversely, in other years it would be expected that additional funds would be added to the unassigned fund balance as the City saves for future year projects. The FY20 – FY26 projection shows an expected use of fund balance of $36.6 million (or 70% of the three-year expenditure average), which would put the City’s fund balance below the policy target threshold of 25%. The 5-year plan and estimated unassigned fund balance is reviewed annually to ensure long-term sustainability of the City’s budget and operations. Over the past five years, the unassigned fund balance has seen a steady annual decrease averaging 10.65% (reduction of 42.61% during this period), though the balance increased slightly in FY20 due to expenditure reductions during the COVID-19 pandemic.
Analysis
125.22%
111.30%
91.31%
82.03% 82.61%
25.00% 25.00% 25.00% 25.00% 25.00%
0.00%
20.00%
40.00%
60.00%
80.00%
100.00%
120.00%
140.00%
2016 2017 2018 2019 2020
Unassigned (UA) Fund Balance as a Percentage of the 3‐Year Expenditure Average
UA Fund Balance Policy Target
9
Critical Measures
Analysis
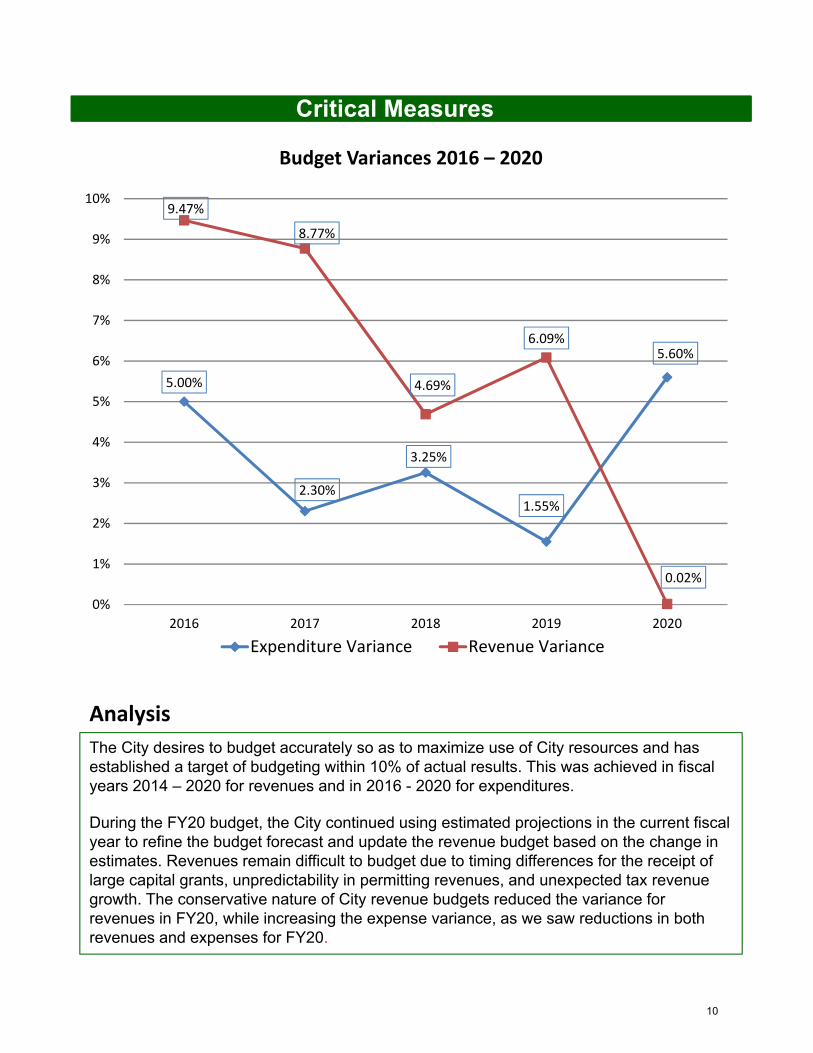
The City desires to budget accurately so as to maximize use of City resources and has established a target of budgeting within 10% of actual results. This was achieved in fiscal years 2014 – 2020 for revenues and in 2016 - 2020 for expenditures.
During the FY20 budget, the City continued using estimated projections in the current fiscal year to refine the budget forecast and update the revenue budget based on the change in estimates. Revenues remain difficult to budget due to timing differences for the receipt of large capital grants, unpredictability in permitting revenues, and unexpected tax revenue growth. The conservative nature of City revenue budgets reduced the variance for revenues in FY20, while increasing the expense variance, as we saw reductions in both revenues and expenses for FY20.
5.00%
2.30%
3.25%
1.55%
5.60%
9.47%
8.77%
4.69%
6.09%
0.02%
0%
1%
2%
3%
4%
5%
6%
7%
8%
9%
10%
2016 2017 2018 2019 2020
Budget Variances 2016 – 2020
Expenditure Variance Revenue Variance
10
Critical Measures
Analysis
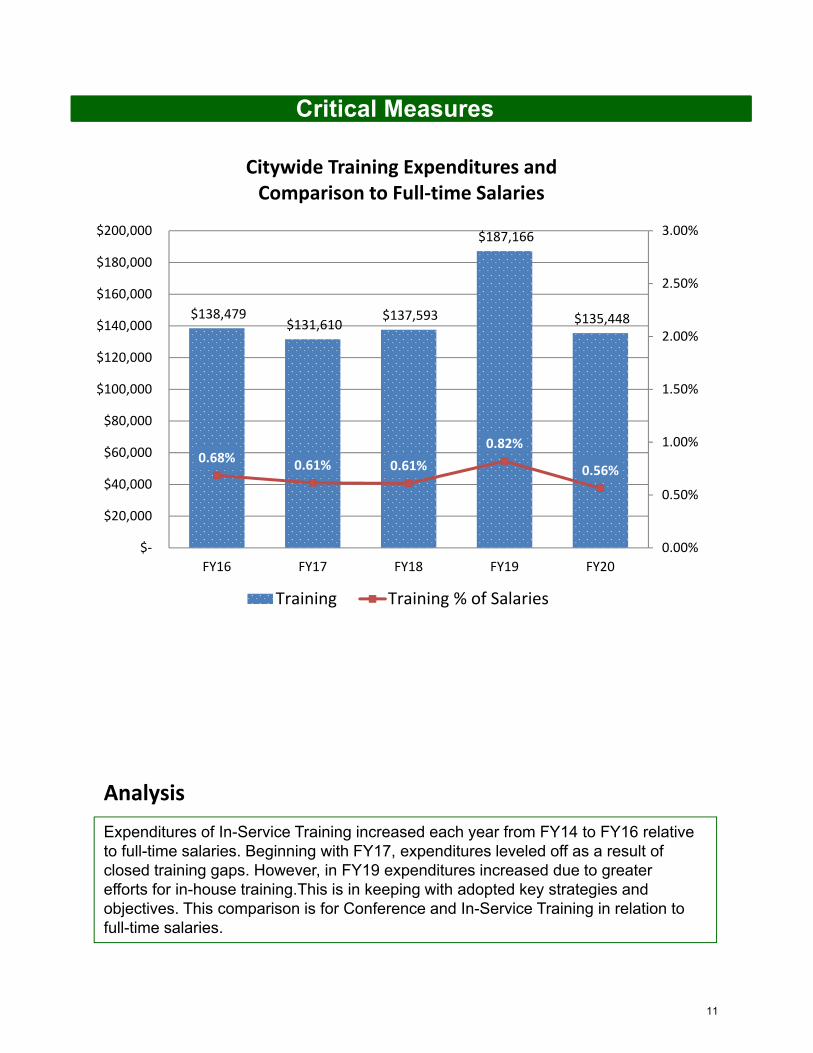
Expenditures of In-Service Training increased each year from FY14 to FY16 relative to full-time salaries. Beginning with FY17, expenditures leveled off as a result of closed training gaps. However, in FY19 expenditures increased due to greater efforts for in-house training.This is in keeping with adopted key strategies and objectives. This comparison is for Conference and In-Service Training in relation to full-time salaries.
$138,479 $131,610
$137,593
$187,166
$135,448
0.68%0.61% 0.61%
0.82%
0.56%
0.00%
0.50%
1.00%
1.50%
2.00%
2.50%
3.00%
$‐
$20,000
$40,000
$60,000
$80,000
$100,000
$120,000
$140,000
$160,000
$180,000
$200,000
FY16 FY17 FY18 FY19 FY20
Citywide Training Expenditures and Comparison to Full‐time Salaries
Training Training % of Salaries
11
Critical Measures
Citizen Survey Responses – “Excellent” or “Good”
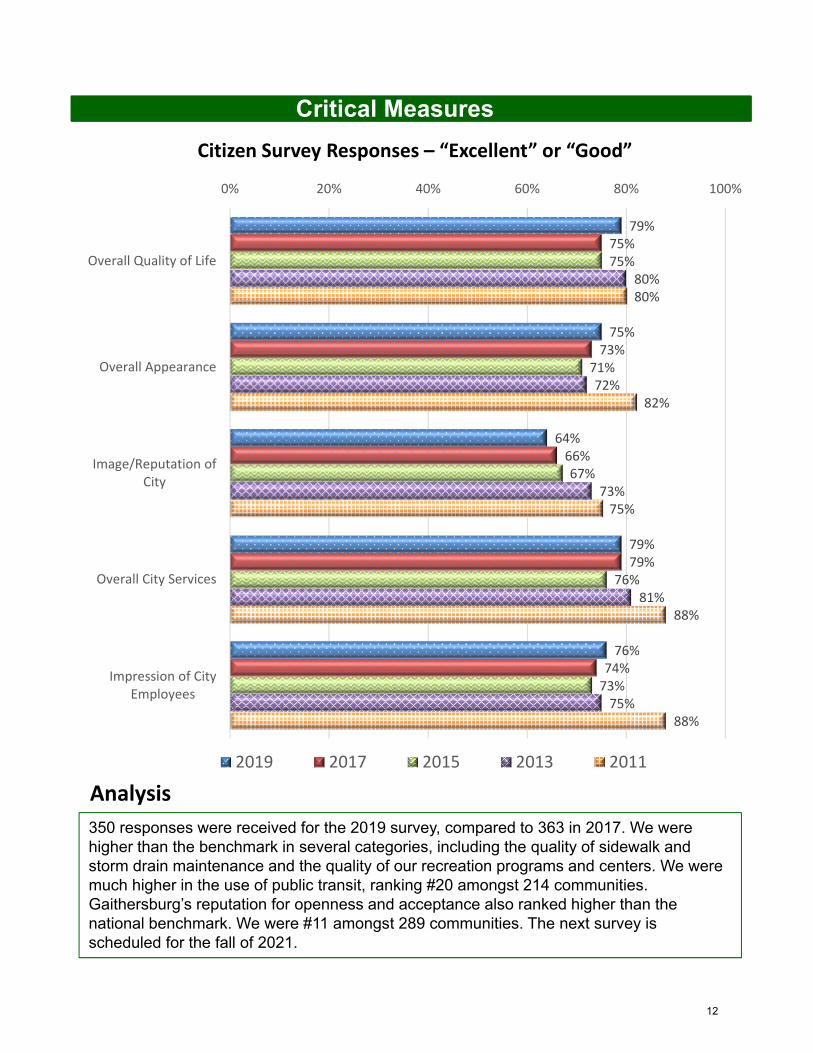
350 responses were received for the 2019 survey, compared to 363 in 2017. We were higher than the benchmark in several categories, including the quality of sidewalk and storm drain maintenance and the quality of our recreation programs and centers. We were much higher in the use of public transit, ranking #20 amongst 214 communities. Gaithersburg’s reputation for openness and acceptance also ranked higher than the national benchmark. We were #11 amongst 289 communities. The next survey is scheduled for the fall of 2021.
Analysis
79%
75%
64%
79%
76%
75%
73%
66%
79%
74%
75%
71%
67%
76%
73%
80%
72%
73%
81%
75%
80%
82%
75%
88%
88%
0% 20% 40% 60% 80% 100%
Overall Quality of Life
Overall Appearance
Image/Reputation ofCity
Overall City Services
Impression of CityEmployees
2019 2017 2015 2013 2011
12
Key Strategies
Potential Strategy Conflicts‐
Gaithersburg Strategic Plan – FY 2022
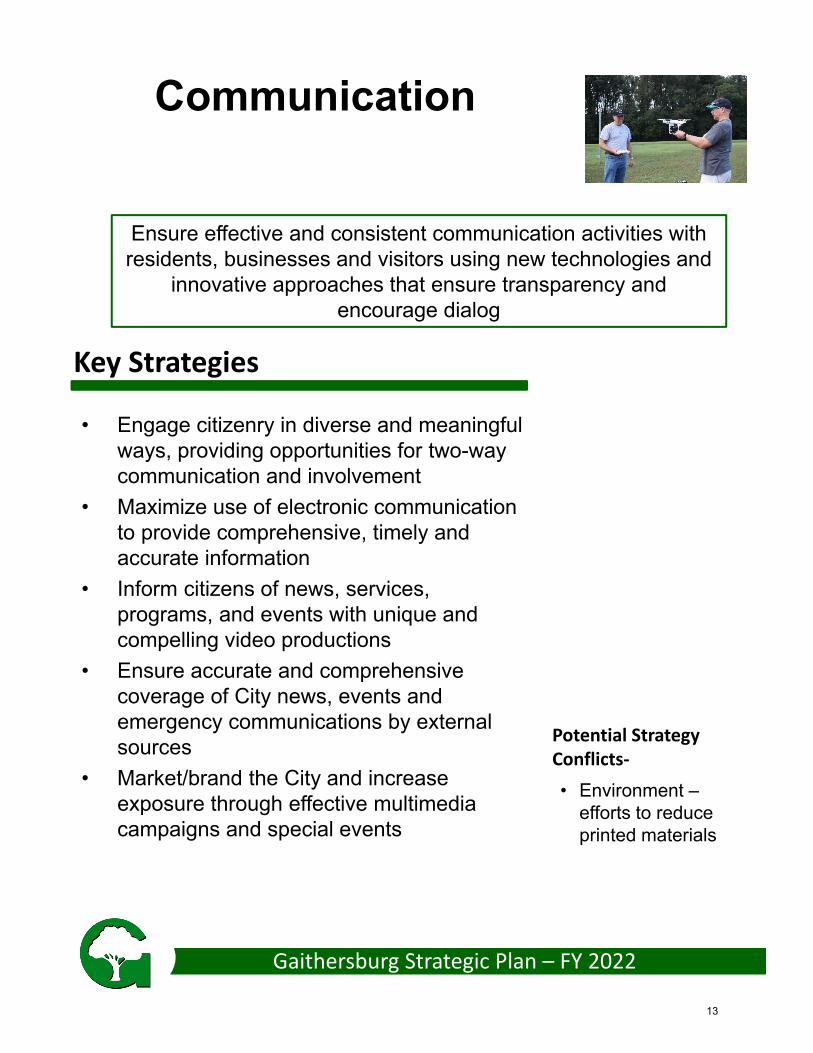
Communication
Ensure effective and consistent communication activities with residents, businesses and visitors using new technologies and
innovative approaches that ensure transparency and encourage dialog
• Engage citizenry in diverse and meaningful ways, providing opportunities for two-way communication and involvement
• Maximize use of electronic communication to provide comprehensive, timely and accurate information
• Inform citizens of news, services, programs, and events with unique and compelling video productions
• Ensure accurate and comprehensive coverage of City news, events and emergency communications by external sources
• Market/brand the City and increase exposure through effective multimedia campaigns and special events
• Environment –efforts to reduce printed materials
13
Objectives
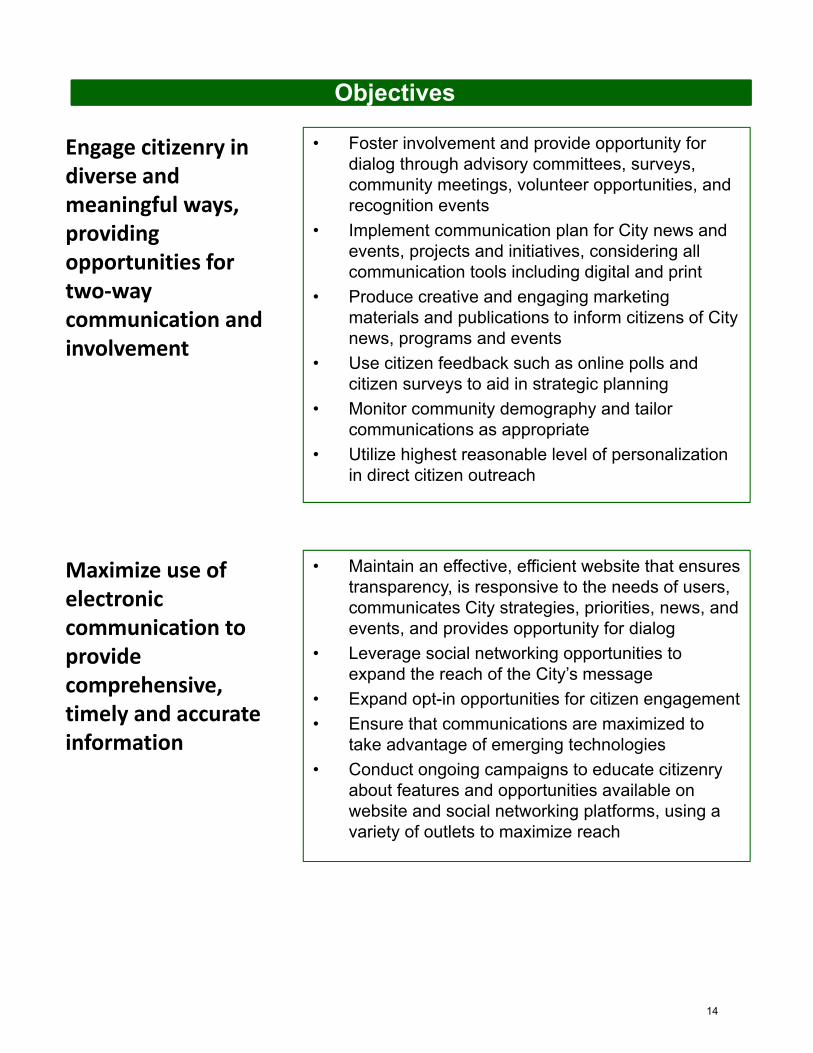
Engage citizenry in diverse and meaningful ways, providing opportunities for two‐way communication and involvement
• Foster involvement and provide opportunity for dialog through advisory committees, surveys, community meetings, volunteer opportunities, and recognition events
• Implement communication plan for City news and events, projects and initiatives, considering all communication tools including digital and print
• Produce creative and engaging marketing materials and publications to inform citizens of City news, programs and events
• Use citizen feedback such as online polls and citizen surveys to aid in strategic planning
• Monitor community demography and tailor communications as appropriate
• Utilize highest reasonable level of personalization in direct citizen outreach
• Maintain an effective, efficient website that ensures transparency, is responsive to the needs of users, communicates City strategies, priorities, news, and events, and provides opportunity for dialog
• Leverage social networking opportunities to expand the reach of the City’s message
• Expand opt-in opportunities for citizen engagement
• Ensure that communications are maximized to take advantage of emerging technologies
• Conduct ongoing campaigns to educate citizenry about features and opportunities available on website and social networking platforms, using a variety of outlets to maximize reach
Maximize use of electronic communication to provide comprehensive, timely and accurate information
14
Objectives
Inform citizens of news, services, programs, and events with unique and compelling video productions
• Ensure transparency through the live broadcast of select public meetings
• Produce and promote programs in a variety of formats and across multiple platforms (with an emphasis on social media) that benefit the City both strategically and economically
• Monitor industry and leverage opportunities for broader programming exposure, including improving viewing opportunities for GTV by taking advantage of online scheduling features
• Maximize use of drone within established guidelines to provide images for marketing, planning, mapping, and other operational purposes
• Maintain collaborative relationships with other Public/Education/Government (PEG) entities and service providers
• Foster working relationships with local media and community-based groups
• Communicate the City’s message to a broad audience, leveraging existing physical and digital communities such as HOAs, Neighborhood Watch Groups, ListServs, and “Citizen Ambassadors”
• Maximize the use and effectiveness of emergency notification systems
• Maintain involvement and maximize opportunities for regionwide communication through participation in the Metropolitan Washington Council of Governments public information groups and other professional associations
Ensure accurate and comprehensive coverage of City news, events and emergency communications by external sources
15
Objectives
Market/brand the City and increase exposure through effective multimedia campaigns and special events
• Develop multimedia messaging strategy to position Gaithersburg as a desirable place in which to live and do business. Ensure messaging is consistent and non-contradictory across City departments
• Leverage involvement with professional and trade associations and explore opportunities for cooperative advertising and promotion
• Consider all special events as messaging opportunities, taking advantage of captive audiences to communicate the City’s strategies and priorities as appropriate
• Generate awareness and maximize attendance for events and programs with marketing initiatives that cross departmental boundaries and focus on collaborative promotions
16
Action Items
FY 2021 Key Action Items
Conduct campaign to increase resident engagement by highlighting City employees and volunteers through social media and newsletter features
Expand style guide to include branding guidelines and basic design templates. Develop process for and conduct periodic audits and hold trainings to ensure consistent and appropriate use of City logos and other marketing elements across multiple platforms
Establish guidelines and develop a standardized process for incorporating messaging on a growing inventory of internal and external digital signs
With input from Facebook about its algorithms and by reviewing best practices from other government agencies, refine video content for maximum engagement on social media
Explore the idea of a “Chairpersons’ Luncheon” with Advisory Committee chairs to share ideas and cross-collaborate on key City initiatives
Explore the idea of a “Chairpersons’ Luncheon” with Advisory Committee chairs to share ideas and cross-collaborate on key City initiatives
Support a cross-departmental initiative to highlight the City’s diversity. Support efforts to increase engagement in hard to reach communities and explore and implement efforts to increase accessibility to digital content.
Conduct and report results of 2021 Biennial Citizen Survey
Develop and implement communication campaign for 2021 municipal elections
Inform stakeholders of updates to significant City projects by developing a consistent process for status communication
Integrate communication strategy into new Cable Channel playback system, ensuring consistency with brand identity and leveraging resources for a growing inventory of digital signage
Implement comprehensive public outreach for Capital Improvement Projects
FY 2022 Key Action Items
17
Critical Measures
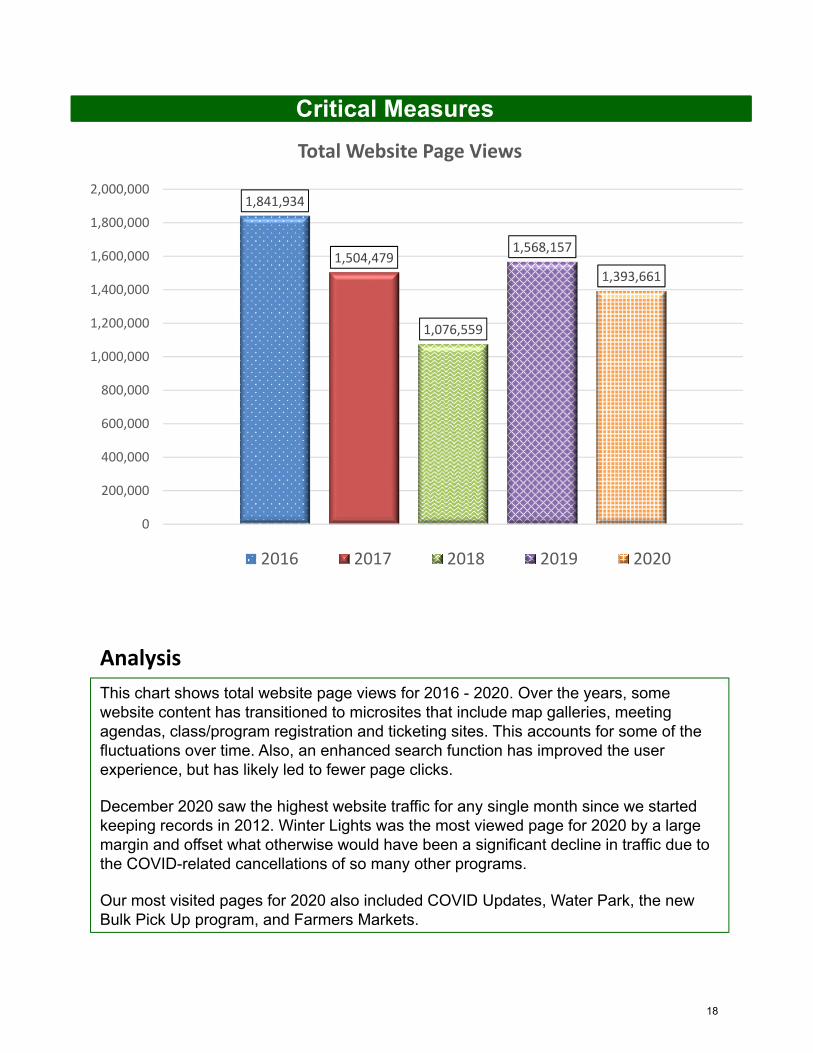
This chart shows total website page views for 2016 - 2020. Over the years, some website content has transitioned to microsites that include map galleries, meeting agendas, class/program registration and ticketing sites. This accounts for some of the fluctuations over time. Also, an enhanced search function has improved the user experience, but has likely led to fewer page clicks.
December 2020 saw the highest website traffic for any single month since we started keeping records in 2012. Winter Lights was the most viewed page for 2020 by a large margin and offset what otherwise would have been a significant decline in traffic due to the COVID-related cancellations of so many other programs.
Our most visited pages for 2020 also included COVID Updates, Water Park, the new Bulk Pick Up program, and Farmers Markets.
Analysis
1,841,934
1,504,479
1,076,559
1,568,157
1,393,661
0
200,000
400,000
600,000
800,000
1,000,000
1,200,000
1,400,000
1,600,000
1,800,000
2,000,000
Total Website Page Views
2016 2017 2018 2019 2020
18
Critical Measures
Analysis
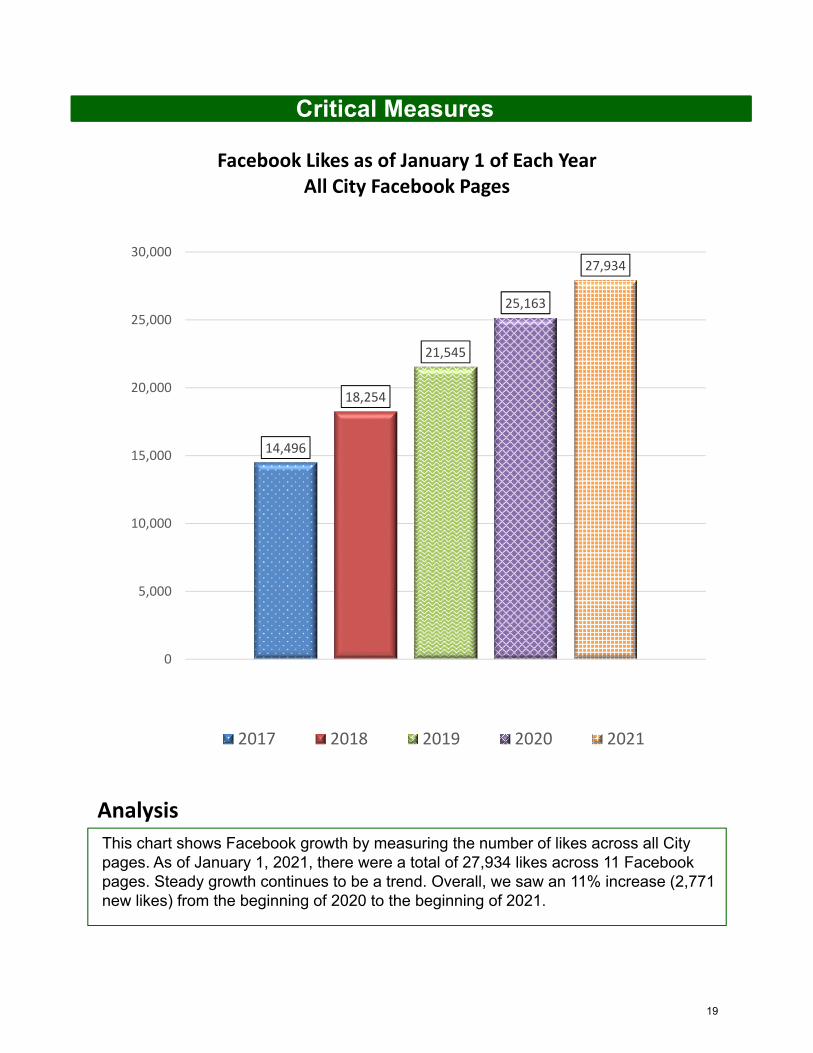
This chart shows Facebook growth by measuring the number of likes across all City pages. As of January 1, 2021, there were a total of 27,934 likes across 11 Facebook pages. Steady growth continues to be a trend. Overall, we saw an 11% increase (2,771 new likes) from the beginning of 2020 to the beginning of 2021.
14,496
18,254
21,545
25,163
27,934
0
5,000
10,000
15,000
20,000
25,000
30,000
Facebook Likes as of January 1 of Each YearAll City Facebook Pages
2017 2018 2019 2020 2021
19
Critical Measures
Analysis
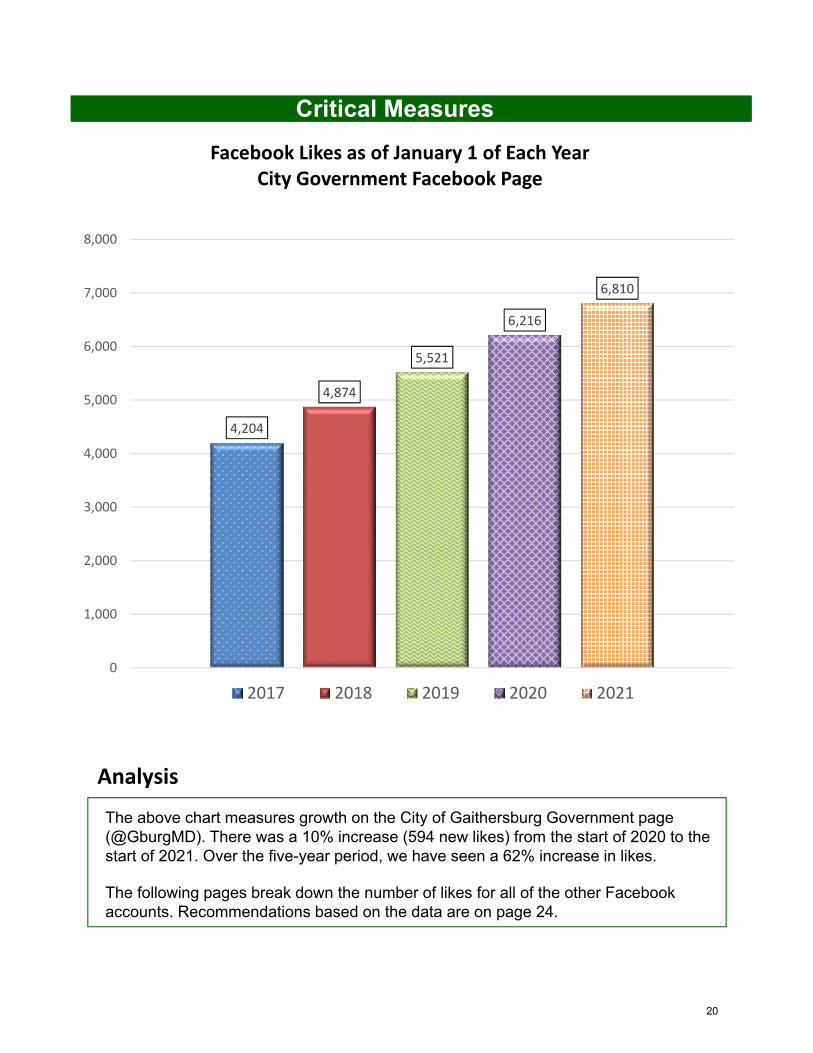
The above chart measures growth on the City of Gaithersburg Government page (@GburgMD). There was a 10% increase (594 new likes) from the start of 2020 to the start of 2021. Over the five-year period, we have seen a 62% increase in likes.
The following pages break down the number of likes for all of the other Facebook accounts. Recommendations based on the data are on page 24.
4,204
4,874
5,521
6,216
6,810
0
1,000
2,000
3,000
4,000
5,000
6,000
7,000
8,000
Facebook Likes as of January 1 of Each YearCity Government Facebook Page
2017 2018 2019 2020 2021
20
Critical Measures
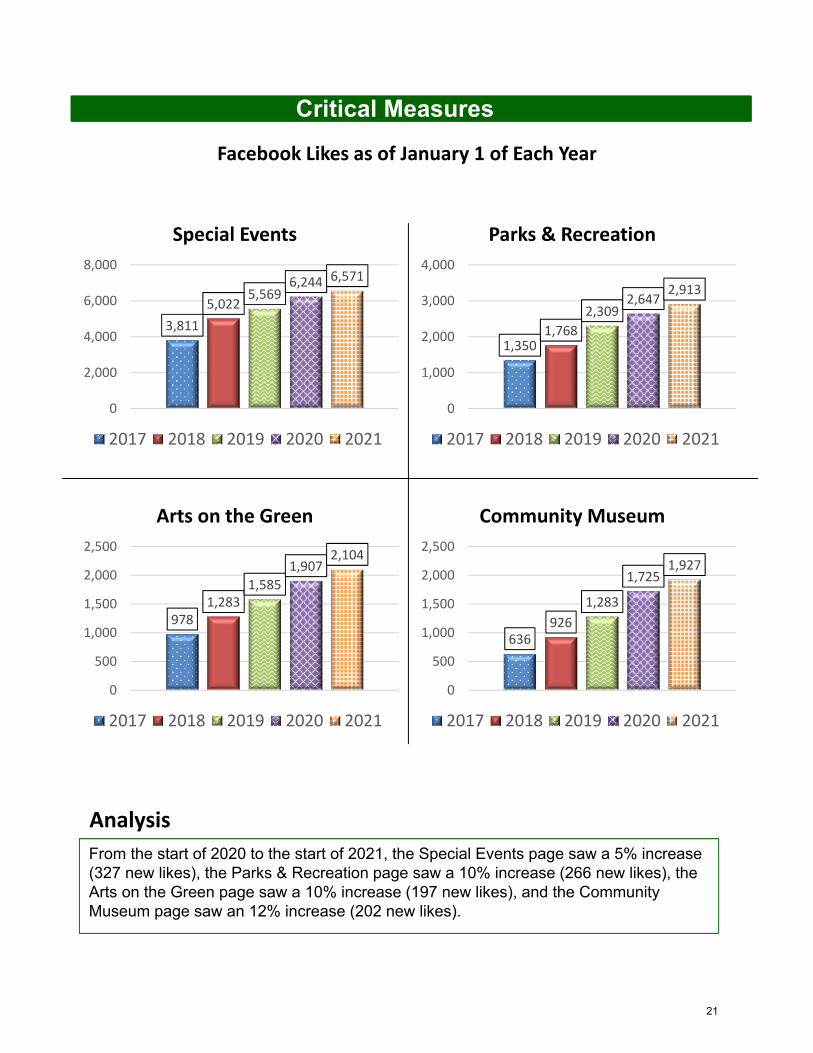
From the start of 2020 to the start of 2021, the Special Events page saw a 5% increase (327 new likes), the Parks & Recreation page saw a 10% increase (266 new likes), the Arts on the Green page saw a 10% increase (197 new likes), and the Community Museum page saw an 12% increase (202 new likes).
Analysis
Facebook Likes as of January 1 of Each Year
3,811
5,0225,569
6,244 6,571
0
2,000
4,000
6,000
8,000
Special Events
2017 2018 2019 2020 2021
1,3501,768
2,3092,647
2,913
0
1,000
2,000
3,000
4,000
Parks & Recreation
2017 2018 2019 2020 2021
9781,283
1,585
1,9072,104
0
500
1,000
1,500
2,000
2,500
Arts on the Green
2017 2018 2019 2020 2021
636926
1,283
1,7251,927
0
500
1,000
1,500
2,000
2,500
Community Museum
2017 2018 2019 2020 2021
21
Critical Measures
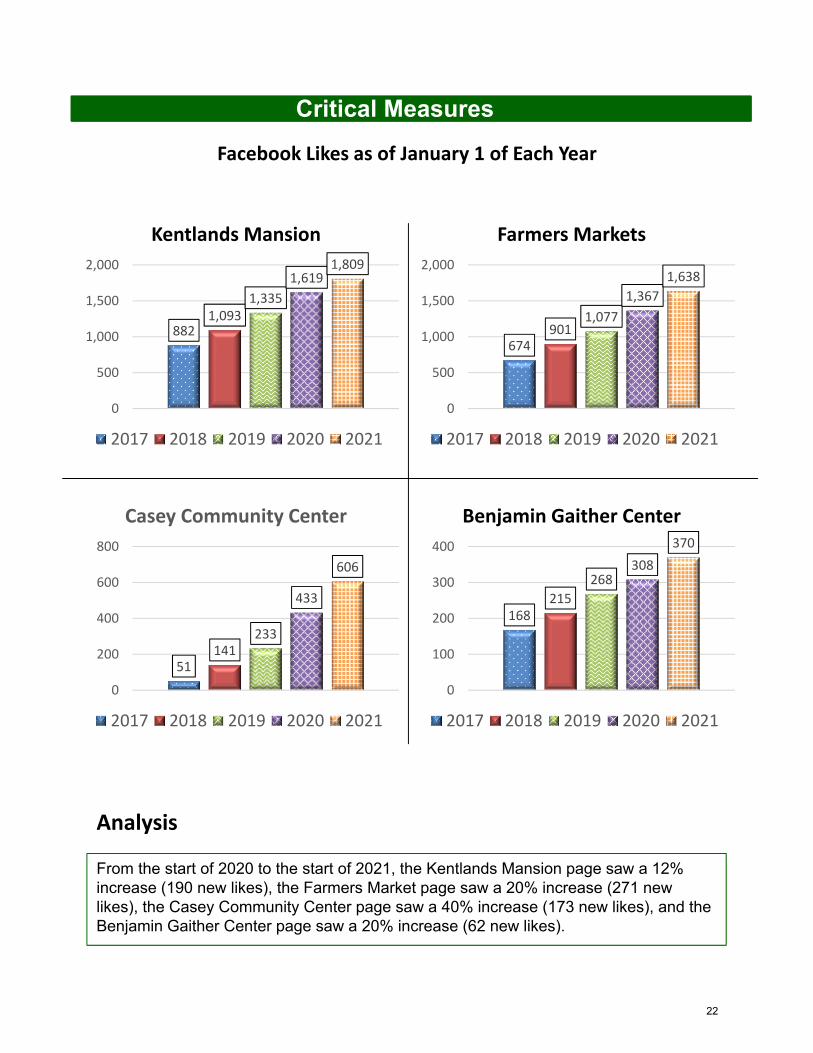
From the start of 2020 to the start of 2021, the Kentlands Mansion page saw a 12% increase (190 new likes), the Farmers Market page saw a 20% increase (271 new likes), the Casey Community Center page saw a 40% increase (173 new likes), and the Benjamin Gaither Center page saw a 20% increase (62 new likes).
Analysis
Facebook Likes as of January 1 of Each Year
8821,093
1,335
1,6191,809
0
500
1,000
1,500
2,000
Kentlands Mansion
2017 2018 2019 2020 2021
674901
1,077
1,367
1,638
0
500
1,000
1,500
2,000
Farmers Markets
2017 2018 2019 2020 2021
51141
233
433
606
0
200
400
600
800
Casey Community Center
2017 2018 2019 2020 2021
168215
268308
370
0
100
200
300
400
Benjamin Gaither Center
2017 2018 2019 2020 2021
22
Critical Measures
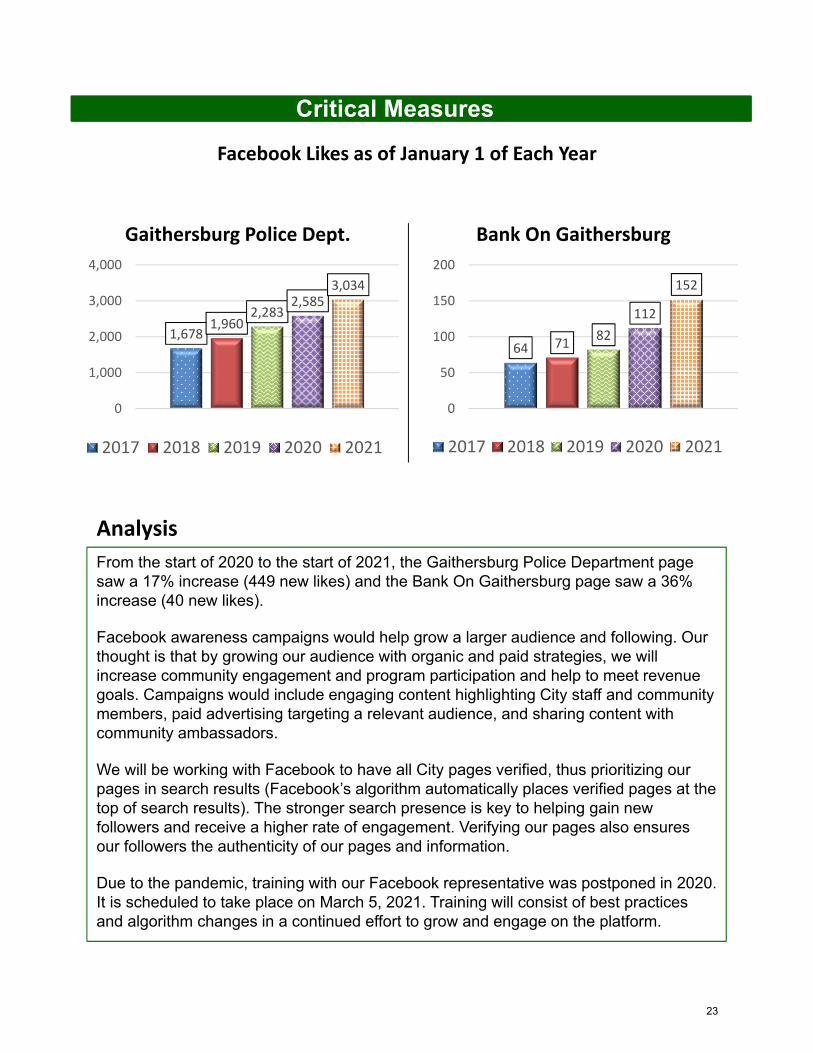
From the start of 2020 to the start of 2021, the Gaithersburg Police Department page saw a 17% increase (449 new likes) and the Bank On Gaithersburg page saw a 36% increase (40 new likes).
Facebook awareness campaigns would help grow a larger audience and following. Our thought is that by growing our audience with organic and paid strategies, we will increase community engagement and program participation and help to meet revenue goals. Campaigns would include engaging content highlighting City staff and community members, paid advertising targeting a relevant audience, and sharing content with community ambassadors.
We will be working with Facebook to have all City pages verified, thus prioritizing our pages in search results (Facebook’s algorithm automatically places verified pages at the top of search results). The stronger search presence is key to helping gain new followers and receive a higher rate of engagement. Verifying our pages also ensures our followers the authenticity of our pages and information.
Due to the pandemic, training with our Facebook representative was postponed in 2020. It is scheduled to take place on March 5, 2021. Training will consist of best practices and algorithm changes in a continued effort to grow and engage on the platform.
Analysis
Facebook Likes as of January 1 of Each Year
1,6781,960
2,2832,585
3,034
0
1,000
2,000
3,000
4,000
Gaithersburg Police Dept.
2017 2018 2019 2020 2021
64 7182
112
152
0
50
100
150
200
Bank On Gaithersburg
2017 2018 2019 2020 2021
23
Critical Measures
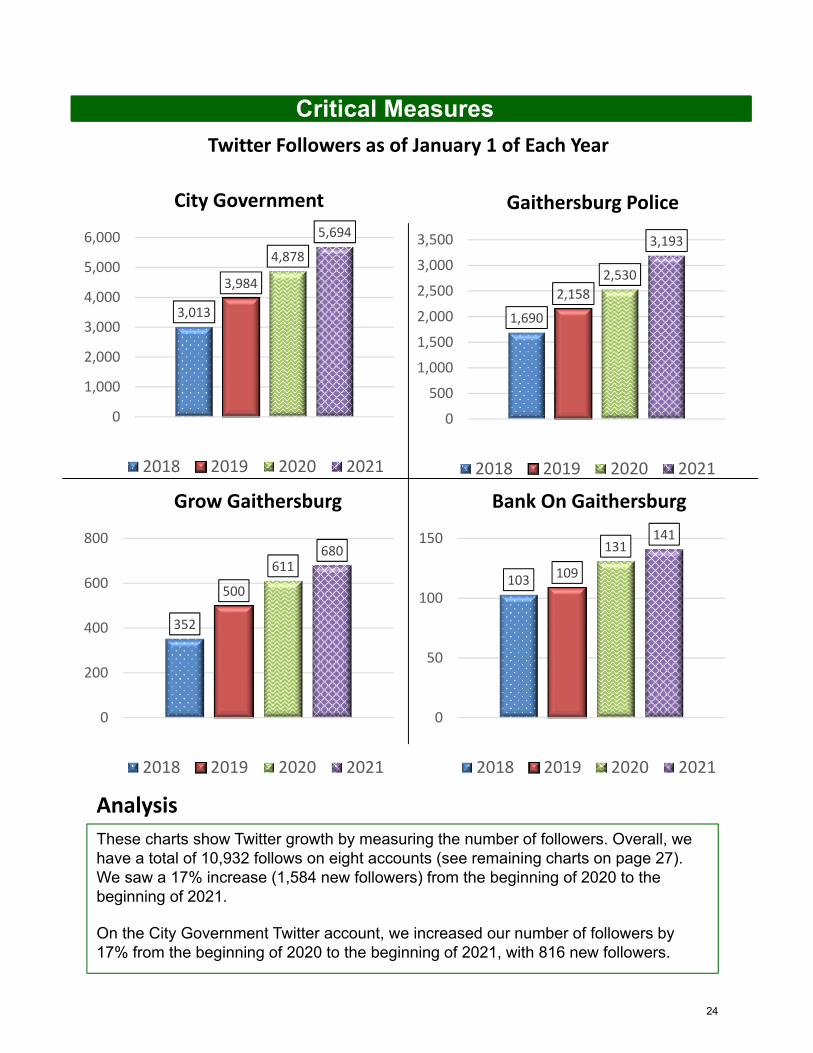
These charts show Twitter growth by measuring the number of followers. Overall, we have a total of 10,932 follows on eight accounts (see remaining charts on page 27). We saw a 17% increase (1,584 new followers) from the beginning of 2020 to the beginning of 2021.
On the City Government Twitter account, we increased our number of followers by 17% from the beginning of 2020 to the beginning of 2021, with 816 new followers.
Analysis
Twitter Followers as of January 1 of Each Year
3,013
3,984
4,878
5,694
0
1,000
2,000
3,000
4,000
5,000
6,000
City Government
2018 2019 2020 2021
1,690
2,158
2,530
3,193
0
500
1,000
1,500
2,000
2,500
3,000
3,500
Gaithersburg Police
2018 2019 2020 2021
352
500
611680
0
200
400
600
800
Grow Gaithersburg
2018 2019 2020 2021
103 109
131141
0
50
100
150
Bank On Gaithersburg
2018 2019 2020 2021
24
Critical Measures
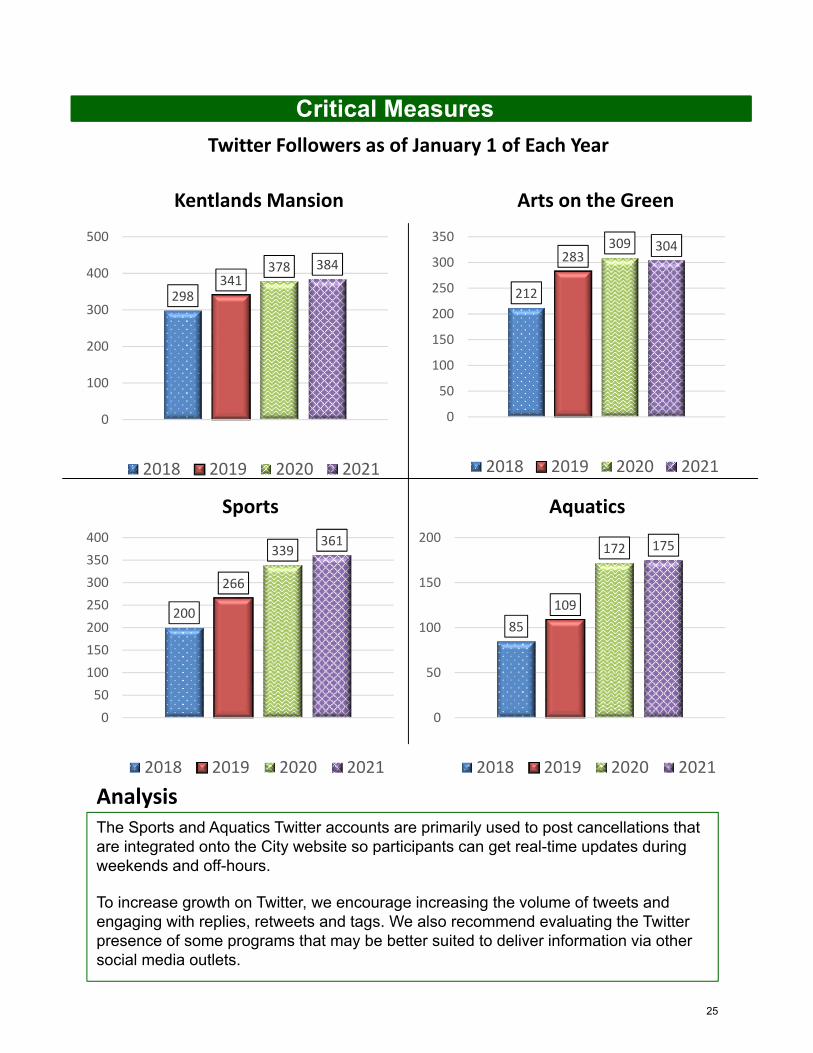
The Sports and Aquatics Twitter accounts are primarily used to post cancellations that are integrated onto the City website so participants can get real-time updates during weekends and off-hours.
To increase growth on Twitter, we encourage increasing the volume of tweets and engaging with replies, retweets and tags. We also recommend evaluating the Twitter presence of some programs that may be better suited to deliver information via other social media outlets.
Analysis
Twitter Followers as of January 1 of Each Year
298341
378 384
0
100
200
300
400
500
Kentlands Mansion
2018 2019 2020 2021
212
283309 304
0
50
100
150
200
250
300
350
Arts on the Green
2018 2019 2020 2021
200
266
339361
0
50
100
150
200
250
300
350
400
Sports
2018 2019 2020 2021
85
109
172 175
0
50
100
150
200
Aquatics
2018 2019 2020 2021
25
Critical Measures
(Actual Engagement Numbers)
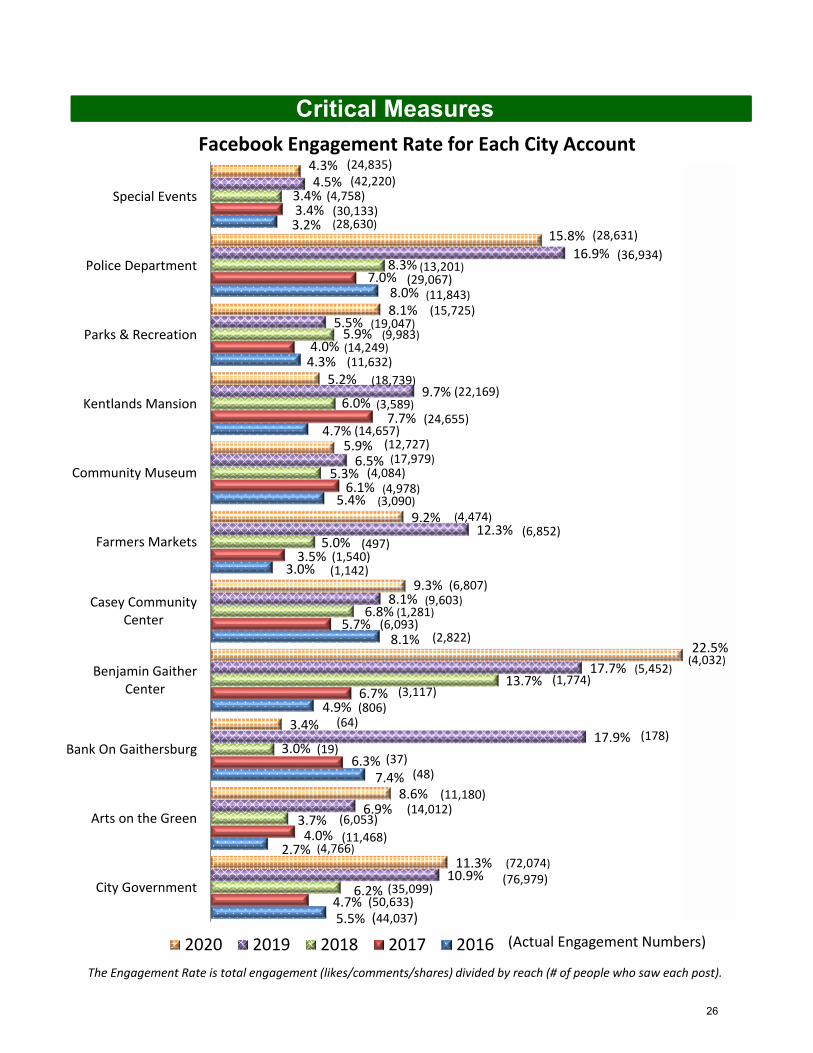
The Engagement Rate is total engagement (likes/comments/shares) divided by reach (# of people who saw each post).
5.5%
2.7%
7.4%
4.9%
8.1%
3.0%
5.4%
4.7%
4.3%
8.0%
3.2%
4.7%
4.0%
6.3%
6.7%
5.7%
3.5%
6.1%
7.7%
4.0%
7.0%
3.4%
6.2%
3.7%
3.0%
13.7%
6.8%
5.0%
5.3%
6.0%
5.9%
8.3%
3.4%
10.9%
6.9%
17.9%
17.7%
8.1%
12.3%
6.5%
9.7%
5.5%
16.9%
4.5%
11.3%
8.6%
3.4%
22.5%
9.3%
9.2%
5.9%
5.2%
8.1%
15.8%
4.3%
City Government
Arts on the Green
Bank On Gaithersburg
Benjamin GaitherCenter
Casey CommunityCenter
Farmers Markets
Community Museum
Kentlands Mansion
Parks & Recreation
Police Department
Special Events
2020 2019 2018 2017 2016
Facebook Engagement Rate for Each City Account
(4,758)
(13,201)
(11,843)
(3,589)
(497)
(1,281)
(178)
(30,133)(28,630)
(29,067)
(9,983)(14,249)(11,632)
(24,655)(14,657)
(4,978)(3,090)
(1,540)(1,142)
(6,093)(2,822)
(3,117)(806)
(37)(48)
(11,468)(4,766)
(50,633)(44,037)
(4,084)
(1,774)
(19)
(6,053)
(35,099)
(64)
(28,631)
(42,220)
(17,979)
(6,807)(9,603)
(24,835)
(72,074)
(5,452)
(18,739)
(76,979)
(12,727)
(36,934)
(22,169)
(6,852)
(11,180)
(15,725)
(14,012)
(4,032)
(4,474)
(19,047)
26
Critical Measures
2.0%
0.2%
2.1%
1.5%
1.8%
1.6%
3.0%
2.4%
0.6%
2.4%
1.8%
2.3%
2.1%
2.6%
1.4%
2.35%
0.92%
1.59%
1.96%
2.69%
2.69%
2.14%
1.23%
0.80%
1.29%
1.00%
2.55%
0.53%
1.53%
1.20%
0.80%
2.01%
1.72%
2.12%
1.86%
0.99%
1.93%
4.30%
0.83%
City Government
Aquatics
Arts on the Green
Bank On Gaithersburg
Economic Development
Kentlands Mansion
Police Department
Sports
2020 2019 2018 2017 2016
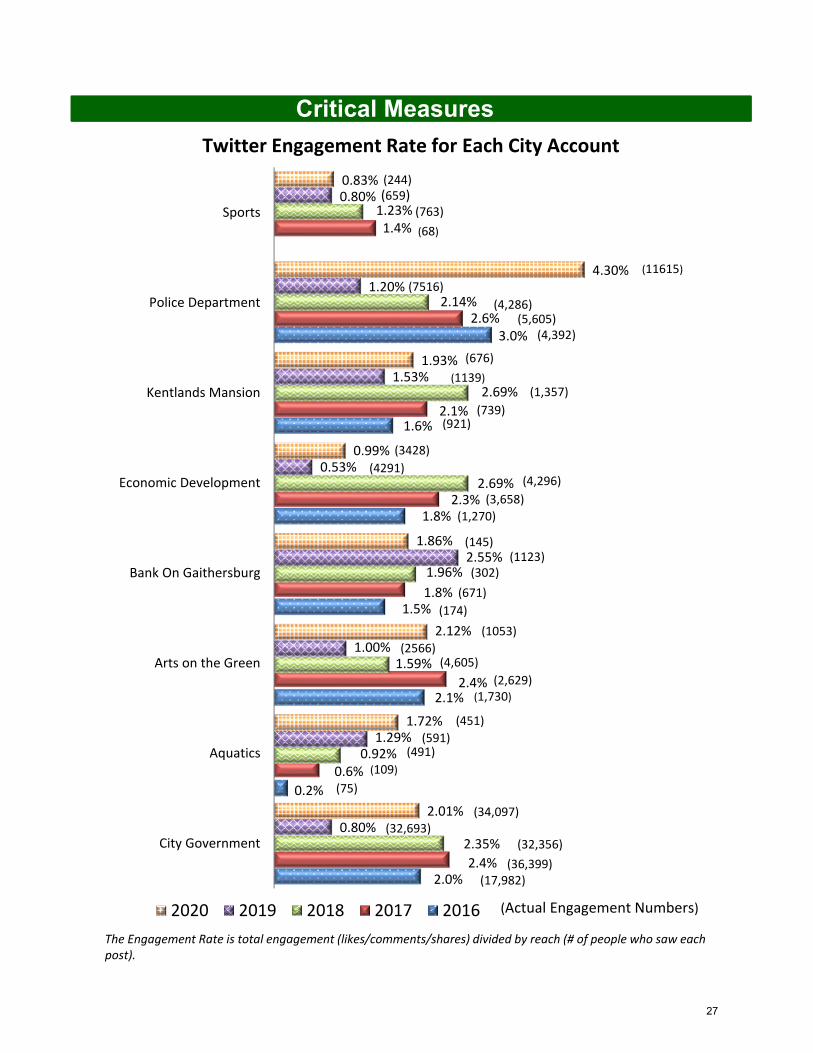
Twitter Engagement Rate for Each City Account
(68)
(5,605)
(Actual Engagement Numbers)
(34,097)
(4,392)
(739)(921)
(3,658)
(1,270)
(671)
(174)
(2,629)
(109)
(1,730)
(75)
(36,399)(17,982)
The Engagement Rate is total engagement (likes/comments/shares) divided by reach (# of people who saw each post).
(32,356)
(491)
(4,605)
(302)
(4,296)
(1,357)
(4,286)
(763)
(1123)(145)
(659)(244)
(11615)
(7516)
(676)
(1139)
(4291)
(3428)
(2566)
(1053)
(32,693)
(451)
(591)
27
Critical Measures
Analysis
The charts on pages 28 and 29 show both engagements and engagement rates for Facebook and Twitter.
The City Government Facebook page had a total of 72,074 engagements. Campaigns related to COVID-19 led the way, while event cancellations also saw high engagement. The most engaging post was the Winter Lights Festival ticketing alert (4.7k engagements and clicks, 26.8k reach). Other notable engagements & clicks: Discovery Park Ribbon Cutting photos and Facebook Live (1.8k and 724 respectively); Frank Willard Environmental Award (759), West Riding & Solitaire Court thank you photos to mail carriers and recycling crews (685).
In addition to lower engagement on some accounts likely related to fewer in-person events, 2020 also saw community outreach challenges because of the Facebook algorithm reach during the 2020 presidential election cycle. In an attempt to prevent the spread of disinformation, Facebook took stricter measures in what content was deemed political in nature, greatly affecting any paid campaigns and making it difficult for government posts to reach follower newsfeeds.
The City Government Twitter account had a total of 34,097 engagements. The most engaging tweets included the Discovery Park ribbon cutting announcement (1,600), Watkins Mill Interchange (524), Stay at Home Mug Challenge (355), and Winter Lights event alert (319).
Our Twitter audience tends to favor breaking news information on City projects while our Facebook audience favors posts highlighting community members, event alerts and City updates.
Video metrics help guide us on what types of programming work best on Facebook in reach and engagement.
Despite pausing some of our regular video programming due to the in-person nature of filming, we had a total of 56,585 minutes of video viewed on Facebook, a 19% increase over the previous year (47,414 minutes). With many programs going virtual, we posted a total of 347 videos (some animated) on our pages.
The top three Facebook videos by total minutes viewed include The Virtual Magic Show (4,839 min.), Ghosts of Gaithersburg (2,480 min.), and the I Do Crew wedding planners (1,803 min.). One-minute views more accurately capture watched content (Facebook considers just three seconds to be a single “view”). Among our top one-minute videos were the Lakeforest Master Plan (196 one-minute views), Hey Jerry Pinbusters (189 one-minute views), and the Discovery Park Ribbon Cutting Facebook Live (148 one-minute views).
28
Critical Measures
Analysis
For video engagement (reactions, comments and shares only) the top three included The Virtual Magic Show (229), the Mayor’s Statement of Support (179), and a Water Park Announcement with Kegan Kim (181 engagements).
Our City Government Instagram account (not reflected in the charts) garnered 11,414 engagements on 186 posts. Most engaging: Scenic train photography (193), Watkins Mill Road Interchange (172), and City mascots at Winter Lights (164). Examples of other topics that ranked high are community chalk drawings, an Animal Control act of kindness, and a local restaurant donation to the GPD.
On our Instagram account, landmarks and community photos with people do better than images with graphics and call-to-action posts. Crowd-sourced images are engaging and allow our followers to help tell the Gaithersburg story. We use Instagram Stories for call-to-action and informational campaigns that can be told in multiple parts and link to our website. There will be charts in next year’s metrics to measure Instagram growth and engagement.
The City launched its official presence on Nextdoor in November, with 14,573 members. It’s a valuable tool for us to reach our City residents where they already are.
Our first few weeks resulted in 6,737 views on nine posts. There were a total of 2,311 e-mail opens, with total impressions of 9,484. In December, we received a total of 19,334 impressions. Topics with the most impressions were the Winter Lights sold out notice (2.2k), Casey Cooking Classes (1.1k) and City Lobbies Closed (1.1k). Of note, the Nextdoor impressions metric is updated daily for one week after a post is created. After one week, the number of impressions freezes.
All social media platforms are vital in communicating and engaging with our community, especially in the digital and pandemic world where print and in-person outreach is more limited than ever. It is important to strategize what types of content engages best and where best to share and engage with our audience. We consistently see our most engagement with photo and video posts.
Data review and analysis has helped us assist other staff in strategizing best approaches to advertise recreation programs, elicit community feedback on City projects, produce video and virtual events that connect with our residents, and ensure that community service initiatives and public and education and outreach are impactful. As users continue to access City information using multiple channels of communication that work in conjunction with each other, we will continue to engage users on multiple platforms (as well as research and discover new ones) to fully engage and reach residents and the greater community.
29
Critical Measures
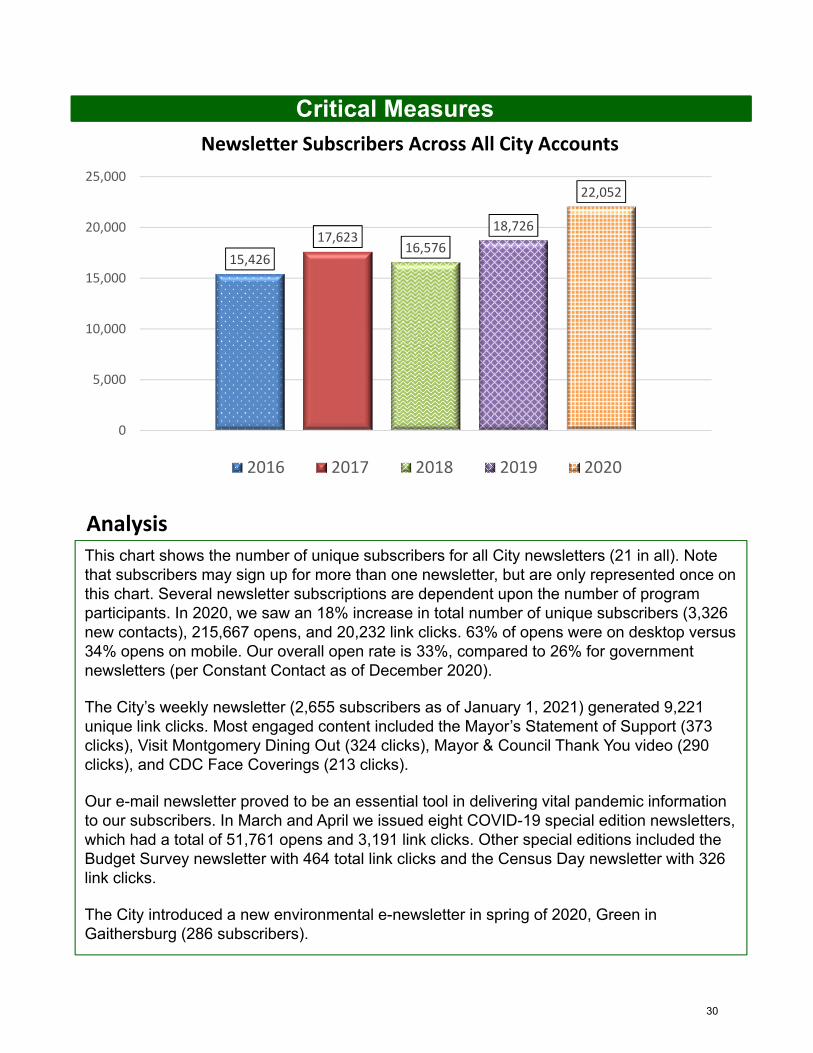
This chart shows the number of unique subscribers for all City newsletters (21 in all). Note that subscribers may sign up for more than one newsletter, but are only represented once on this chart. Several newsletter subscriptions are dependent upon the number of program participants. In 2020, we saw an 18% increase in total number of unique subscribers (3,326 new contacts), 215,667 opens, and 20,232 link clicks. 63% of opens were on desktop versus 34% opens on mobile. Our overall open rate is 33%, compared to 26% for government newsletters (per Constant Contact as of December 2020).
The City’s weekly newsletter (2,655 subscribers as of January 1, 2021) generated 9,221 unique link clicks. Most engaged content included the Mayor’s Statement of Support (373 clicks), Visit Montgomery Dining Out (324 clicks), Mayor & Council Thank You video (290 clicks), and CDC Face Coverings (213 clicks).
Our e-mail newsletter proved to be an essential tool in delivering vital pandemic information to our subscribers. In March and April we issued eight COVID-19 special edition newsletters, which had a total of 51,761 opens and 3,191 link clicks. Other special editions included the Budget Survey newsletter with 464 total link clicks and the Census Day newsletter with 326 link clicks.
The City introduced a new environmental e-newsletter in spring of 2020, Green in Gaithersburg (286 subscribers).
Analysis
Newsletter Subscribers Across All City Accounts
15,426
17,62316,576
18,726
22,052
0
5,000
10,000
15,000
20,000
25,000
2016 2017 2018 2019 2020
30
Key Strategies
Potential Strategy Conflicts‐
Gaithersburg Strategic Plan – FY 2022
CommunityServices
Strengthen the community by addressing the human service, safety and educational needs of all City residents through
collaborative efforts with schools, businesses, organizations, and nonprofits
• Collaborate with partners to ensure comprehensive, integrated, quality service delivery and community education
• Promote economic self-sufficiency through financial, vocational education and workforce development initiatives
• Provide access to safety net services
• Provide homeless services through advocacy, education, outreach, shelter, and prevention
• Maximize access to physical and mental health services for the un- and underinsured
• Provide youth with educational enrichment support and opportunities for positive social development
• Promote and support the ethnic and cultural diversity reflected in the City’s population
• Support homeless City residents with substance use disorders, mental illness, and economic challenges by providing outreach services and operating and pursuing funding for Wells/ Robertson and DeSellum Houses
31
Objectives
Collaborate with partners to ensure comprehensive, integrated, quality service delivery and community education
• Coordinate a collaborative, community-supported program to serve residents during the holiday season
• Collaborate on the delivery of services and provide information on City programs and initiatives by participating in and/or facilitating local, regional and interdepartmental coalitions, meetings and dialogues
• Coordinate and promote events and initiatives that provide opportunities for nonprofits and schools to increase their capacities in the areas of partnerships and volunteerism
• Conduct regular assessments of community needs to identify emerging trends
• Engage in collaborative initiatives that promote economic self-sufficiency and financial empowerment
• Encourage the unbanked and underbanked to use mainstream financial institutions through Bank On Gaithersburg and the programs of the Gaithersburg Financial Wellness Coalition
• Administer and monitor a nonprofit contract program that uses a strategic, results-based approach to support vocational and financial empowerment education
• Encourage resident participation in ESOL, GED, tutoring, civics, and citizenship programs
• Enhance community education and awareness through the development of and participation in outreach events and programs
Promote economic self‐sufficiency through financial wellness, vocational education and workforce development initiatives
32
Objectives
Provide access to safety net services
• Provide case coordination and management services for City residents to ensure complete, appropriate and quality access to community resources, food, social services, and affordable housing programs
• Help to prevent eviction and address emergency needs by providing oversight of nonprofit Housing Counseling and Housing Preservation contracts and federally-funded emergency assistance funds
• Administer and monitor nonprofit contracts for housing stabilization and access assistance for prescription drugs, transportation and food and nutrition
• Assist in eviction prevention and the promotion of safe, healthy living through the City’s Hoarding Task Force with the Neighborhood Services Division
• Assist in the reduction of child hunger by participating in a school lunch subsidy program
• Provide community education, training and resources to combat substance abuse and the opioid epidemic
Provide homeless services through advocacy, education, outreach, shelter, and prevention
• Administer and monitor the Homeless Services nonprofit contracts and ensure outcomes are met
• Monitor the homeless population, address local and regional needs, and raise awareness by collaborating and partnering with other agencies and organizations and participating in local and regional initiatives, committees and events
• Provide supervised service coordination for City residents who participate in permanent supportive housing programs
• Utilize the Homeless Information System to link homeless individuals and families to supportive services and track outcomes
33
Objectives
Maximize access to physical and mental health services for the un‐ and underinsured
• Administer and monitor the Health and Mental Health Assistance nonprofit contracts for uninsured and underinsured residents
• Provide interim case coordination services and collaborate to provide community educational events for City residents facing complicated and multifaceted mental and physical health challenges to ensure access to complete and appropriate community services
• Provide access to prescription drug discounts through the promotion and administration of the National League of Cities Prescription Drug program
• Coordinate trainings in critical mental health subject areas for City staff and area nonprofit providers
Provide youth with educational enrichment support and opportunities for positive social development
• Administer and monitor the School Based Nonprofit Youth Grants and School Grants to ensure service integration and collaboration with nonprofits serving Gaithersburg schools
• Foster educational success and encourage increased parental involvement through collaboration-building and support of related school and nonprofit initiatives
• Conduct outreach, public awareness and collaborative initiatives that promote involvement, engage the entire community and recognize students for educational and personal achievement through the Junior Mayor and GREAT programs, the “If I Were Mayor” contest, the Mayor’s Book Club, and CHARACTER COUNTS! initiatives and programming
34
Objectives
Promote and support the ethnic and cultural diversity reflected in the City’s population
• Explore opportunities to further raise diversity awareness amongst City staff, committee members, volunteers and other stakeholders
• Incorporate diversity elements into civic events
• Strive to ensure that the City’s advisory committees reflect the diversity of the community
• Work with the Public Information Office to provide inclusive communication
Support homeless City residents with substance use disorders, mental illness and economic challenges by providing outreach services and operating and pursuing funding for Wells/Robertson and DeSellum Houses
• Empower residents to break the cycle of addiction and homelessness and attain permanent or permanent-supportive housing through the programs and services of the Wells/Robertson House (transitional program) and DeSellum House (extended supportive housing program for Wells graduates)
• Utilize the ROSC (Recovery Oriented Systems of Care) model to partner with community and service providers for addiction prevention, advocacy and collaboration for homeless people in recovery from substance use disorder
• Utilize a Wellness Recovery Action Plan model and use recovery coaches to engage residents of Wells/Robertson and DeSellum Houses in a total well-being program
• Improve graduation and success rates for Wells/Robertson House and DeSellum program participants
• Maximize existing grants and explore additional funding opportunities from the Friends of Wells Robertson House, Inc., the State of Maryland, Montgomery County, and other sources
35
Action Items
Complete a two-year work plan for Bank On Gaithersburg
Develop multi year outcome reports for City grant programs, including GIS mapping
Prepare a report summarizing historic resident success data for the Wells/Robertson program
Prepare a report summarizing the history and statistics of the Gaithersburg Hoarding Task Force
Develop and conduct an outreach plan to enhance Community Advisory and Educational Enrichment Committee membership, allowing them to more closely match community demographics
Explore the establishment of a Gaithersburg area Coalition of Addiction Prevention and Treatment organizations to address substance use
FY 2021 Key Action Items
FY 2022 Key Action Items Explore the establishment of a Gaithersburg area Coalition of Addiction
Prevention and Treatment organizations to address substance use
Enhance street outreach engagement and linkage to services among the homeless Latino population by incorporating capabilities for bilingual communication
Refine the nonprofit grant program to include requirements for the direct implementation of equitable, collaborative neighborhood-based outreach programming, focusing on student/parent, school and community engagement
36
Critical Measures
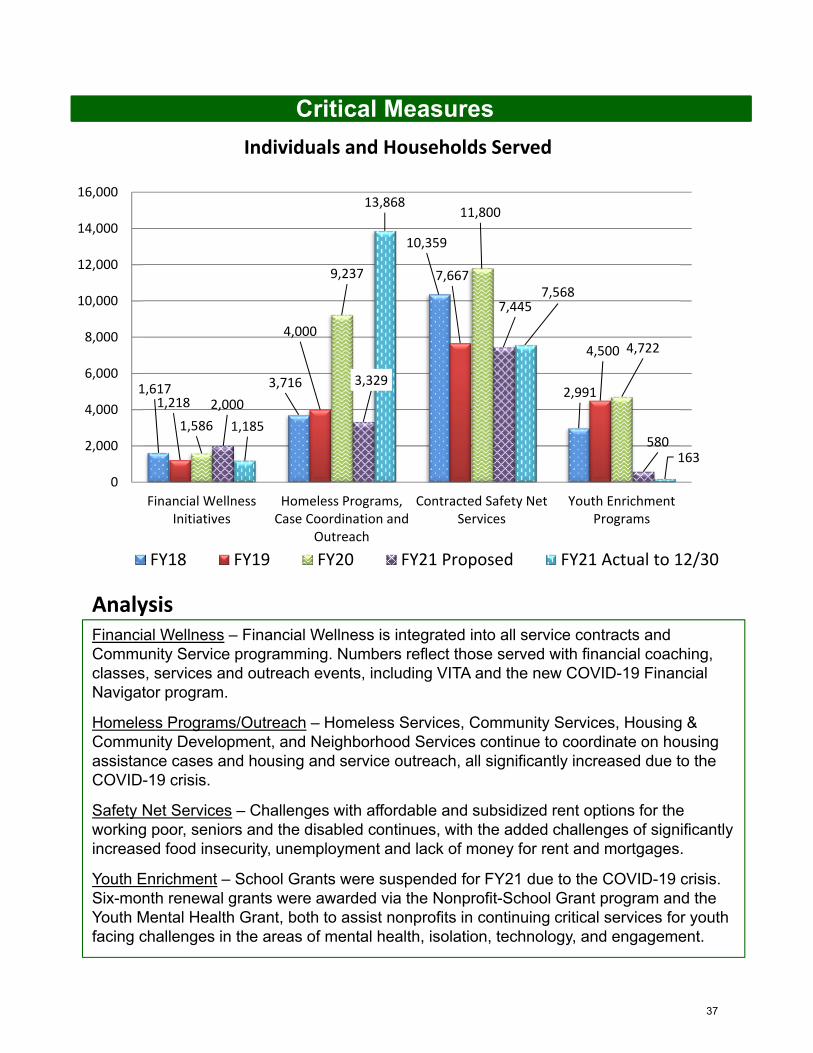
Financial Wellness – Financial Wellness is integrated into all service contracts and Community Service programming. Numbers reflect those served with financial coaching, classes, services and outreach events, including VITA and the new COVID-19 Financial Navigator program.
Homeless Programs/Outreach – Homeless Services, Community Services, Housing & Community Development, and Neighborhood Services continue to coordinate on housing assistance cases and housing and service outreach, all significantly increased due to the COVID-19 crisis.
Safety Net Services – Challenges with affordable and subsidized rent options for the working poor, seniors and the disabled continues, with the added challenges of significantly increased food insecurity, unemployment and lack of money for rent and mortgages.
Youth Enrichment – School Grants were suspended for FY21 due to the COVID-19 crisis. Six-month renewal grants were awarded via the Nonprofit-School Grant program and the Youth Mental Health Grant, both to assist nonprofits in continuing critical services for youth facing challenges in the areas of mental health, isolation, technology, and engagement.
Analysis
Individuals and Households Served
1,617 3,716
10,359
2,9911,218
4,000
7,667
4,500
1,586
9,237
11,800
4,722
2,000
3,329
7,445
5801,185
13,868
7,568
163
0
2,000
4,000
6,000
8,000
10,000
12,000
14,000
16,000
Financial WellnessInitiatives
Homeless Programs,Case Coordination and
Outreach
Contracted Safety NetServices
Youth EnrichmentPrograms
FY18 FY19 FY20 FY21 Proposed FY21 Actual to 12/30
37
Critical MeasuresPoverty and Income Demographics
American Community Survey (ACS) 2015 – 2019 Income
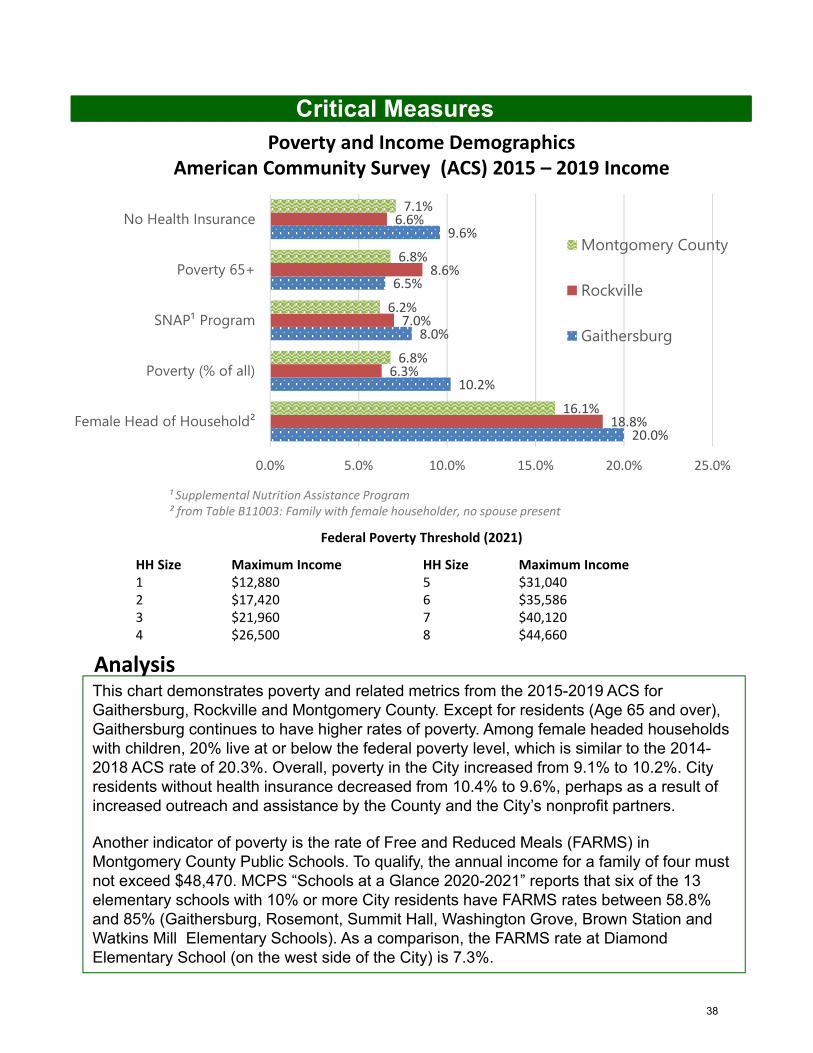
This chart demonstrates poverty and related metrics from the 2015-2019 ACS for Gaithersburg, Rockville and Montgomery County. Except for residents (Age 65 and over), Gaithersburg continues to have higher rates of poverty. Among female headed households with children, 20% live at or below the federal poverty level, which is similar to the 2014-2018 ACS rate of 20.3%. Overall, poverty in the City increased from 9.1% to 10.2%. City residents without health insurance decreased from 10.4% to 9.6%, perhaps as a result of increased outreach and assistance by the County and the City’s nonprofit partners.
Another indicator of poverty is the rate of Free and Reduced Meals (FARMS) in Montgomery County Public Schools. To qualify, the annual income for a family of four must not exceed $48,470. MCPS “Schools at a Glance 2020-2021” reports that six of the 13 elementary schools with 10% or more City residents have FARMS rates between 58.8% and 85% (Gaithersburg, Rosemont, Summit Hall, Washington Grove, Brown Station and Watkins Mill Elementary Schools). As a comparison, the FARMS rate at Diamond Elementary School (on the west side of the City) is 7.3%.
Analysis
Federal Poverty Threshold (2021)
HH Size Maximum Income HH Size Maximum Income1 $12,880 5 $31,0402 $17,420 6 $35,5863 $21,960 7 $40,1204 $26,500 8 $44,660
¹ Supplemental Nutrition Assistance Program² from Table B11003: Family with female householder, no spouse present
20.0%
10.2%
8.0%
6.5%
9.6%
18.8%
6.3%
7.0%
8.6%
6.6%
16.1%
6.8%
6.2%
6.8%
7.1%
0.0% 5.0% 10.0% 15.0% 20.0% 25.0%
Female Head of Household²
Poverty (% of all)
SNAP¹ Program
Poverty 65+
No Health InsuranceMontgomery County
Rockville
Gaithersburg
38
Critical Measures
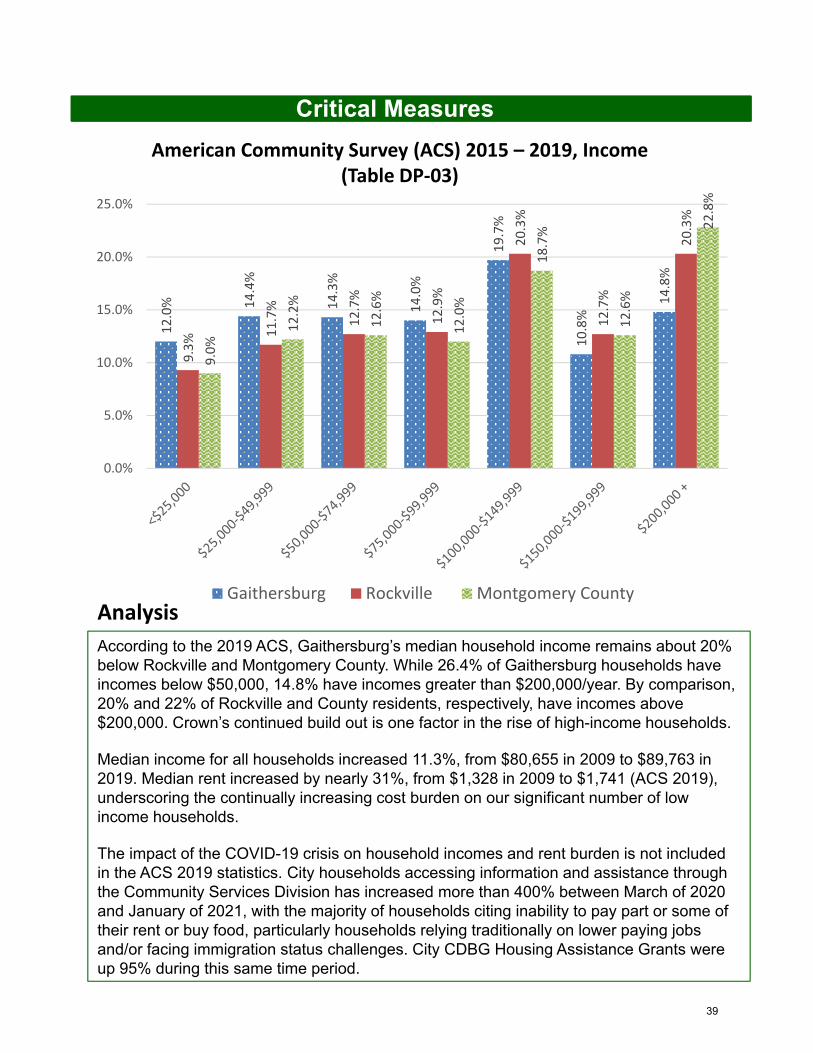
According to the 2019 ACS, Gaithersburg’s median household income remains about 20% below Rockville and Montgomery County. While 26.4% of Gaithersburg households have incomes below $50,000, 14.8% have incomes greater than $200,000/year. By comparison, 20% and 22% of Rockville and County residents, respectively, have incomes above $200,000. Crown’s continued build out is one factor in the rise of high-income households.
Median income for all households increased 11.3%, from $80,655 in 2009 to $89,763 in 2019. Median rent increased by nearly 31%, from $1,328 in 2009 to $1,741 (ACS 2019), underscoring the continually increasing cost burden on our significant number of low income households.
The impact of the COVID-19 crisis on household incomes and rent burden is not included in the ACS 2019 statistics. City households accessing information and assistance through the Community Services Division has increased more than 400% between March of 2020 and January of 2021, with the majority of households citing inability to pay part or some of their rent or buy food, particularly households relying traditionally on lower paying jobs and/or facing immigration status challenges. City CDBG Housing Assistance Grants were up 95% during this same time period.
Analysis
American Community Survey (ACS) 2015 – 2019, Income(Table DP‐03)
12.0% 14.4%
14.3%
14.0%
19.7%
10.8%
14.8%
9.3% 11.7%
12.7%
12.9%
20.3%
12.7%
20.3%
9.0%
12.2%
12.6%
12.0%
18.7%
12.6%
22.8%
0.0%
5.0%
10.0%
15.0%
20.0%
25.0%
Gaithersburg Rockville Montgomery County
39
Critical Measures
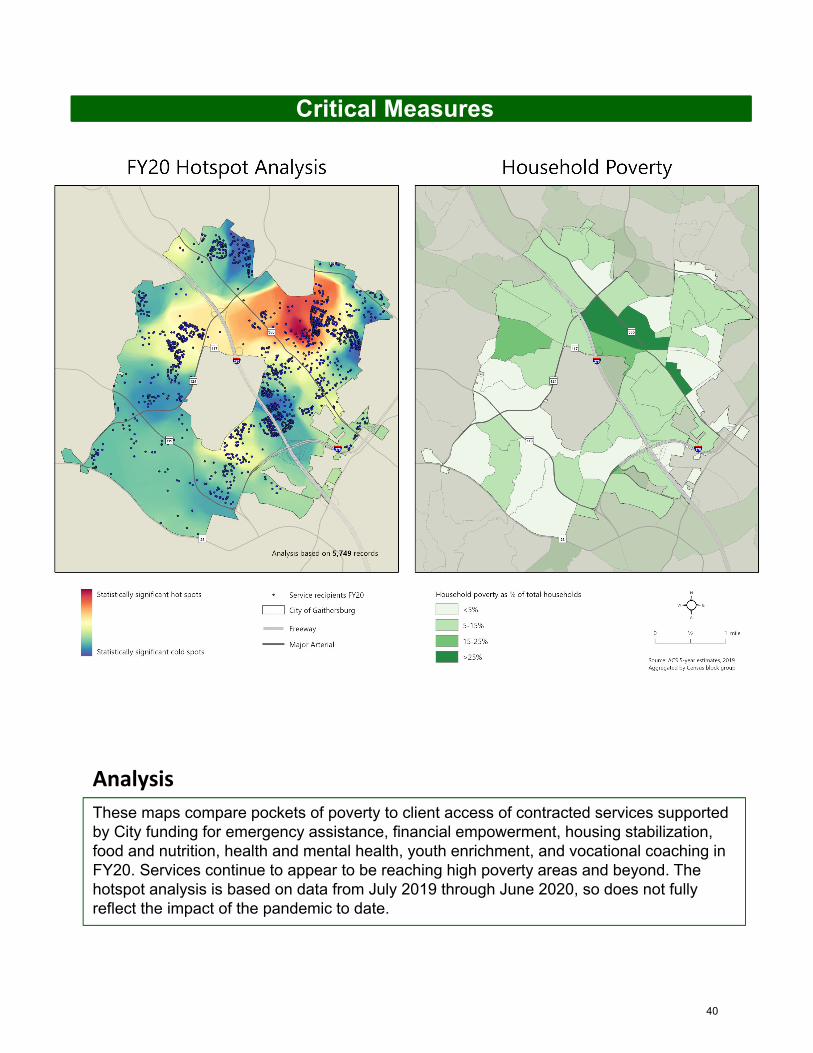
These maps compare pockets of poverty to client access of contracted services supported by City funding for emergency assistance, financial empowerment, housing stabilization, food and nutrition, health and mental health, youth enrichment, and vocational coaching in FY20. Services continue to appear to be reaching high poverty areas and beyond. The hotspot analysis is based on data from July 2019 through June 2020, so does not fully reflect the impact of the pandemic to date.
Analysis
40
Critical Measures
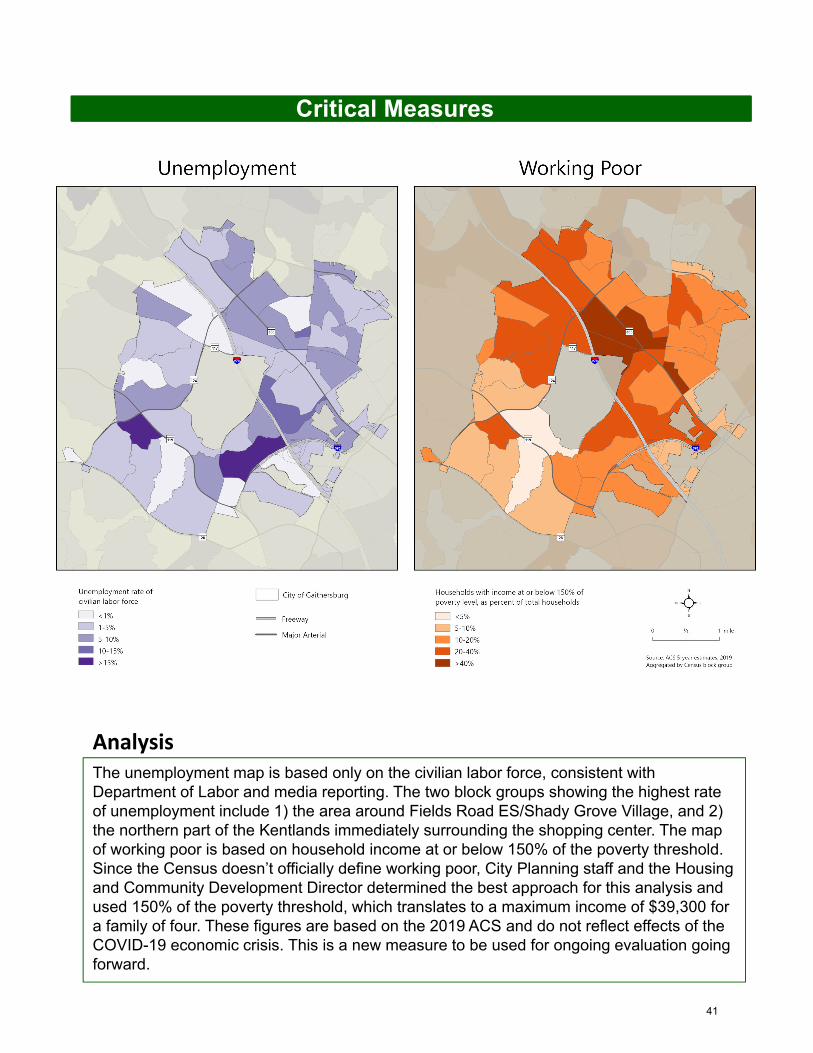
The unemployment map is based only on the civilian labor force, consistent with Department of Labor and media reporting. The two block groups showing the highest rate of unemployment include 1) the area around Fields Road ES/Shady Grove Village, and 2) the northern part of the Kentlands immediately surrounding the shopping center. The map of working poor is based on household income at or below 150% of the poverty threshold. Since the Census doesn’t officially define working poor, City Planning staff and the Housing and Community Development Director determined the best approach for this analysis and used 150% of the poverty threshold, which translates to a maximum income of $39,300 for a family of four. These figures are based on the 2019 ACS and do not reflect effects of the COVID-19 economic crisis. This is a new measure to be used for ongoing evaluation going forward.
Analysis
41
Critical Measures
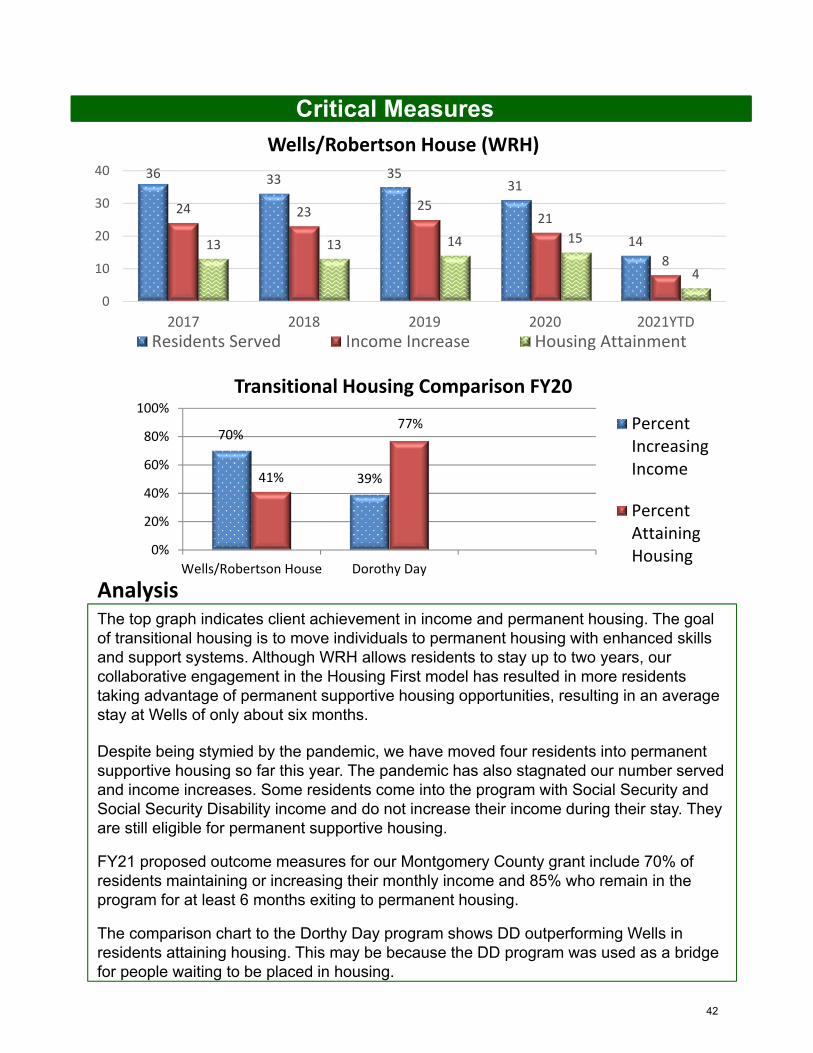
The top graph indicates client achievement in income and permanent housing. The goal of transitional housing is to move individuals to permanent housing with enhanced skills and support systems. Although WRH allows residents to stay up to two years, our collaborative engagement in the Housing First model has resulted in more residents taking advantage of permanent supportive housing opportunities, resulting in an average stay at Wells of only about six months.
Despite being stymied by the pandemic, we have moved four residents into permanent supportive housing so far this year. The pandemic has also stagnated our number served and income increases. Some residents come into the program with Social Security and Social Security Disability income and do not increase their income during their stay. They are still eligible for permanent supportive housing.
FY21 proposed outcome measures for our Montgomery County grant include 70% of residents maintaining or increasing their monthly income and 85% who remain in the program for at least 6 months exiting to permanent housing.
The comparison chart to the Dorthy Day program shows DD outperforming Wells in residents attaining housing. This may be because the DD program was used as a bridge for people waiting to be placed in housing.
Analysis
Transitional Housing Comparison FY20
Wells/Robertson House (WRH)
70%
39%41%
77%
0%
20%
40%
60%
80%
100%
Wells/Robertson House Dorothy Day
PercentIncreasingIncome
PercentAttainingHousing
36 33 3531
14
24 23 2521
813 13 14 15
4
0
10
20
30
40
2017 2018 2019 2020 2021YTD
Residents Served Income Increase Housing Attainment
42
43
Key Strategies
Potential Strategy Conflicts‐
Gaithersburg Strategic Plan – FY 2022
Economic DevelopmentActively pursue economic and business development
strategies to support a growing and sustainable economic base, ensuring the financial resources needed to improve the
quality of life, fund services and provide a diversity of job opportunities for City residents
• Market the City as a desirable business location, leveraging our unique assets, proximity to the federal marketplace, state and federal incentive areas, and our strength as an internationally-recognized center of biotechnology
• Position Gaithersburg favorably for local investment via business expansion and/or real estate development by maintaining an attractive business environment
• Support implementation of the Gaithersburg Master Plan and Frederick Avenue Corridor and Vicinity Capacity Study
• Stimulate revitalization of Olde Towne, the Route 355 Corridor and the Lakeforest Mall site
• Provide support and guidance for established small businesses as well as aspiring entrepreneurs across industry sectors
• Affordable Housing
• Historic Preservation
• Transportation
• Non-commercial Development
44
Objectives
Market the City as a desirable business location, leveraging our unique assets, proximity to the federal marketplace, state and federal incentive areas, and our strength as an internationally‐recognized center of biotechnology
• Use the Economic Development website and social media to highlight successes, identify City and other state/county/federal incentives and initiatives, provide an online resource for baseline information on the local economy, and provide an effective point of contact to business and development prospects
• Conduct business outreach and ombudsman initiatives to build stronger relationships with businesses
• Participate in Maryland Department of Commerce, Technology Council of Maryland, Montgomery County Economic Development Corporation, International Council of Shopping Centers, Chamber of Commerce events and initiatives, and other target industry initiatives
• Continue to establish a distinct Economic Development brand and message distinguishing the City’s pro-business programs and processes relative to neighboring communities
• Emphasize exposure in local and national business media and at trade shows/events of targeted industries
• Increase awareness of the City as a center of life sciences business activity within the Biotech Capital Region
• Maintain and strengthen ongoing relationships with local commercial real estate owners, professionals and developers via roundtables/focus groups, speaking engagements, individual meetings, and other targeted events
• Use e-newsletter and other digital media outlets to establish frequent communication with business community
• Cultivate opportunities for regional cooperation in business attraction and retention efforts among economic development counterparts in the greater Washington area
45
Objectives
Position Gaithersburg favorably for local investment via business expansion and/or real estate development by maintaining an attractive business environment
• Administer and promote the benefits of the City’s Enterprise Zone as it relates to incentivizing new development and business relocation
• Work with site and/or industry specific local business groups on cooperative efforts
• Use Economic Development program funding, in addition to county and/or state business support programs, to incentivize and leverage extraordinary opportunities that present major job relocation, retention and/or development prospects
• Utilize the Economic & Business Development and Olde Towne Advisory Committees to act as ombudsmen for their respective business communities
• Seek new funding sources for Economic Development efforts
• Direct Economic Development Toolbox funding to businesses that exhibit growth potential, provide stable, well-paying jobs and help to diversify the City’s economy
• Track office space vacancy rates, commercial real property assessments and other indicators of economic trends
• Support business assistance programs at the state and county levels as appropriate
• Focus on retaining existing businesses and attracting new businesses from desired industries and diversifying the local economy
• Work proactively with commercial property owners/ representatives who may be interested in converting obsolete office/flex space into lab and other marketable uses, or repurposing/redeveloping vacant and/or obsolete retail space
• Pursue discussions with appropriate regional partners to support technology transfer and entrepreneurial activity, spurred by the proximity of Federal facilities
46
Objectives
Support implementation of the Gaithersburg Master Plan and Frederick Avenue Corridor and Vicinity Capacity Study
• Support large-scale assemblages and infill development to accelerate implementation of the City Master Plan and the Frederick Avenue Corridor and Vicinity Capacity Study
• Facilitate anticipated sales and future redevelopment of Lakeforest Mall properties
• Facilitate strategic acquisition of sites within larger, potential redevelopment assemblages to leverage partnerships with the development community
• Explore the use of alternative funding methods to enhance infrastructure throughout the City
• Promote rezoning of parcels that exhibit strong development and redevelopment potential in accordance with the Master Plan
• Consider and explore implementation strategies for recommendations in the Frederick Avenue Corridor and Vicinity Capacity Study
• Facilitate appropriate private and public investment in existing and new affordable housing
47
Objectives
• Promote Olde Towne as a distinct commercial hub with a unique identity by adding/upgrading public areas and cultural amenities
• Support cost-effective allocation of limited public resources to promote change
• Retain existing and attract new employers
• Enhance market driven opportunities for new businesses and private investment in real estate
• Facilitate development of City-owned parcels to assist in bringing new residents and marketable commercial/office space
• Explore partnership opportunities to expand cultural events and public art in Olde Towne
• Market the Toolbox program and the program’s expanded support for Olde Towne and the Route 355 Corridor
• Identify opportunities and support reinvestment in existing multifamily properties within Olde Towne and the Route 355 Corridor
• Ensure that applicable zoning codes are written to support new investment and development
• Seek opportunities for increased public parking facilities in Olde Towne, whether through agreements with existing property owners or acquisition
• Monitor and protect existing legislative and regulatory advantages that support new investment in real property
Stimulate revitalization of Olde Towne, the Route 355 Corridor and the Lakeforest Mall site
48
Objectives
• Establish better connections and stronger lines of communication with the City’s existing small business community
• Raise awareness of City’s Toolbox program as well as grant, loan and other business support programs available through nonprofit and other governmental agencies
• Facilitate connections between the small business community and people/agencies positioned to assist with their needs
• Aid business owners and entrepreneurs with grant/loan applications and other technical support, either directly or through partner agencies and organizations
• Strengthen our partnerships with the Maryland Women’s Business Center, SBA, and other regional business support organizations
• Disseminate information about potential procurement opportunities through outreach, networking events and other mediums
Provide support and guidance for established small businesses as well as aspiring entrepreneurs across industry sectors
49
Action Items
Support repositioning and/or redevelopment of Lakeforest Mall property
Develop list of potential uses for South Frederick Avenue property assemblage area
Review areas within the City’s Maximum Expansion Limits (MEL) to determine which parcels may have near-term potential for growth in housing, population and jobs
Educate stakeholders/promote benefits of new Opportunity Zone program as it relates to new investment within City’s designated census tracts
Initiate a process for sale and redevelopment of the South Frederick Avenue property assemblage area (303 - 311 S. Frederick Avenue)
Review commercial properties with delinquent taxes and below-market assessed values and work towards payment and reassessment
Create new data visualization products, such as interactive maps, story maps, static images, and other presentation formats for use in community engagement
Participate in the Greater Washington Board of Trade’s Council of Economic Development Officials committee in examination of potential regional coordinated marketing
Analyze the hotel room inventory and forecast room supply, demand and projected hotel tax revenue
Transfer ownership of the Fishman site, pending completion of development approvals
FY 2021 Key Action Items
50
Action Items
FY 2022 Key Action Items
Support repositioning and/or redevelopment of Lakeforest Mall site by working with current property owners and identifying potential developers
Initiate a process for sale and redevelopment or determine other uses for the South Frederick Avenue property assemblage area (303 - 311 S. Frederick Avenue)
Work with Planning staff to undertake a comprehensive review of the CD and MXD Zones
Transfer ownership of the Fishman site, pending completion of development approvals
Respond to the extraordinary economic conditions brought on by the COVID pandemic
Generate a database of City small businesses to the best practical extent
Review Toolbox program to determine if changes should be made to support local businesses
Perform real estate market analysis and feasibility to forecast post-COVID demand and estimate fiscal impacts on City revenue
51
Critical Measures
Analysis
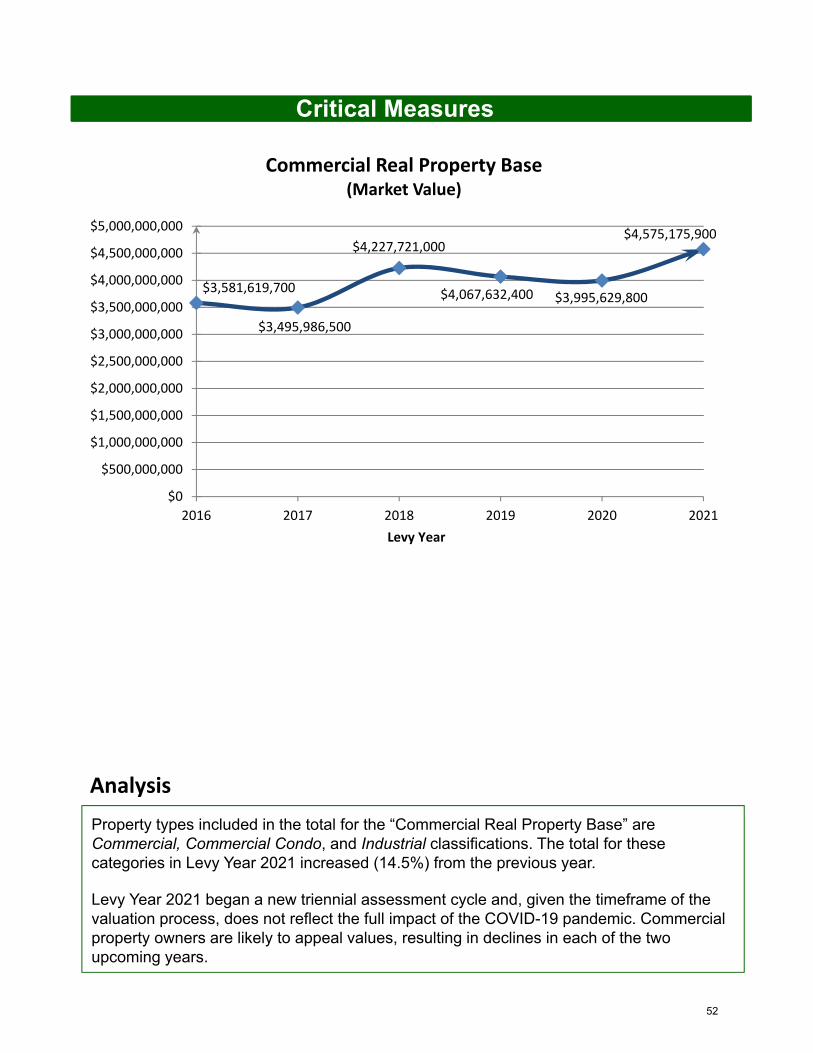
Property types included in the total for the “Commercial Real Property Base” are Commercial, Commercial Condo, and Industrial classifications. The total for these categories in Levy Year 2021 increased (14.5%) from the previous year.
Levy Year 2021 began a new triennial assessment cycle and, given the timeframe of the valuation process, does not reflect the full impact of the COVID-19 pandemic. Commercial property owners are likely to appeal values, resulting in declines in each of the two upcoming years.
$3,581,619,700
$3,495,986,500
$4,227,721,000
$4,067,632,400 $3,995,629,800
$4,575,175,900
$0
$500,000,000
$1,000,000,000
$1,500,000,000
$2,000,000,000
$2,500,000,000
$3,000,000,000
$3,500,000,000
$4,000,000,000
$4,500,000,000
$5,000,000,000
2016 2017 2018 2019 2020 2021
Levy Year
Commercial Real Property Base(Market Value)
52
Critical Measures
4.5%
3.6%
2.8%
2.7%
3.1%
7.9%
8.9%
6.2%
6.1%
5.4%
5.7%
5.6%
7.8%
8.9%
15.5%
11.0%
9.9%
11.2%
9.9%
3.2%
2.2%
3.6%
1.8%
1.7%
11.6%
13.2%
0.0% 5.0% 10.0% 15.0% 20.0%
2015
2016
2017
2018
2019
2020
2021*
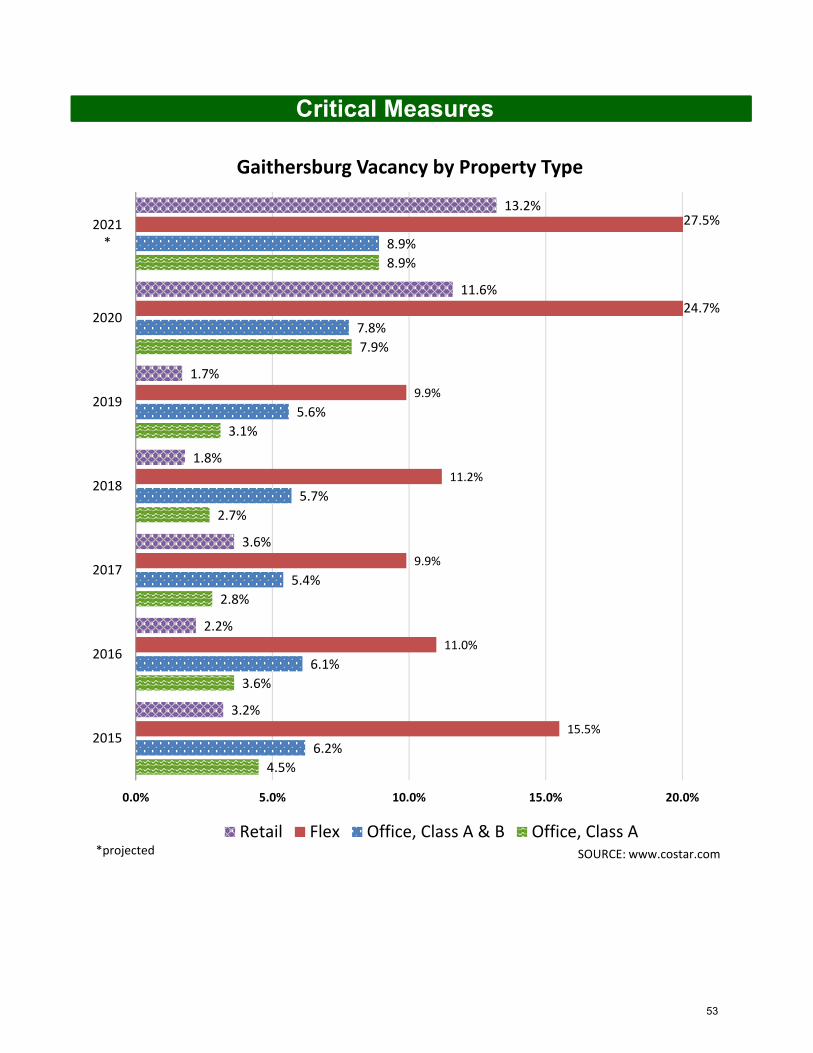
Gaithersburg Vacancy by Property Type
Retail Flex Office, Class A & B Office, Class ASOURCE: www.costar.com*projected
27.5%
24.7%
53
Critical Measures
Analysis
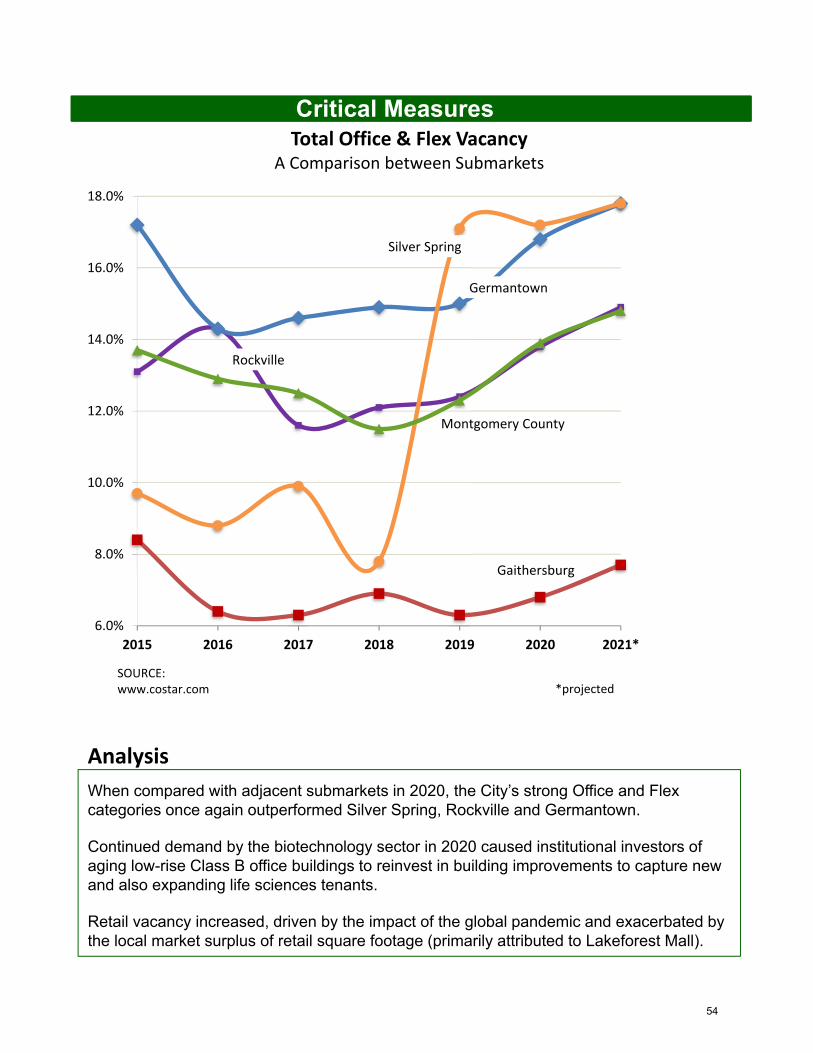
When compared with adjacent submarkets in 2020, the City’s strong Office and Flex categories once again outperformed Silver Spring, Rockville and Germantown.
Continued demand by the biotechnology sector in 2020 caused institutional investors of aging low-rise Class B office buildings to reinvest in building improvements to capture new and also expanding life sciences tenants.
Retail vacancy increased, driven by the impact of the global pandemic and exacerbated by the local market surplus of retail square footage (primarily attributed to Lakeforest Mall).
Gaithersburg
Rockville
Germantown
Silver Spring
Montgomery County
6.0%
8.0%
10.0%
12.0%
14.0%
16.0%
18.0%
2015 2016 2017 2018 2019 2020 2021*
Total Office & Flex Vacancy A Comparison between Submarkets
SOURCE: www.costar.com *projected
54
Critical Measures
Analysis
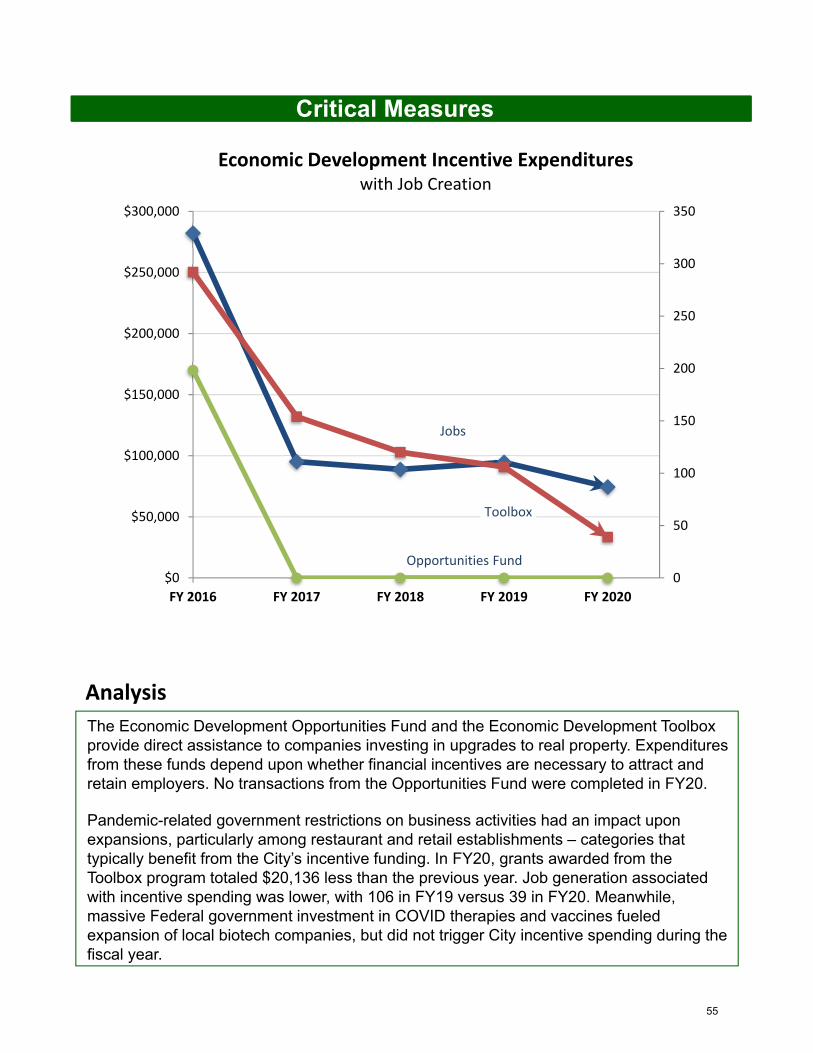
The Economic Development Opportunities Fund and the Economic Development Toolbox provide direct assistance to companies investing in upgrades to real property. Expenditures from these funds depend upon whether financial incentives are necessary to attract and retain employers. No transactions from the Opportunities Fund were completed in FY20.
Pandemic-related government restrictions on business activities had an impact upon expansions, particularly among restaurant and retail establishments – categories that typically benefit from the City’s incentive funding. In FY20, grants awarded from the Toolbox program totaled $20,136 less than the previous year. Job generation associated with incentive spending was lower, with 106 in FY19 versus 39 in FY20. Meanwhile, massive Federal government investment in COVID therapies and vaccines fueled expansion of local biotech companies, but did not trigger City incentive spending during the fiscal year.
Toolbox
Opportunities Fund
Jobs
0
50
100
150
200
250
300
350
$0
$50,000
$100,000
$150,000
$200,000
$250,000
$300,000
FY 2016 FY 2017 FY 2018 FY 2019 FY 2020
Economic Development Incentive Expenditureswith Job Creation
55
Critical Measures
Analysis
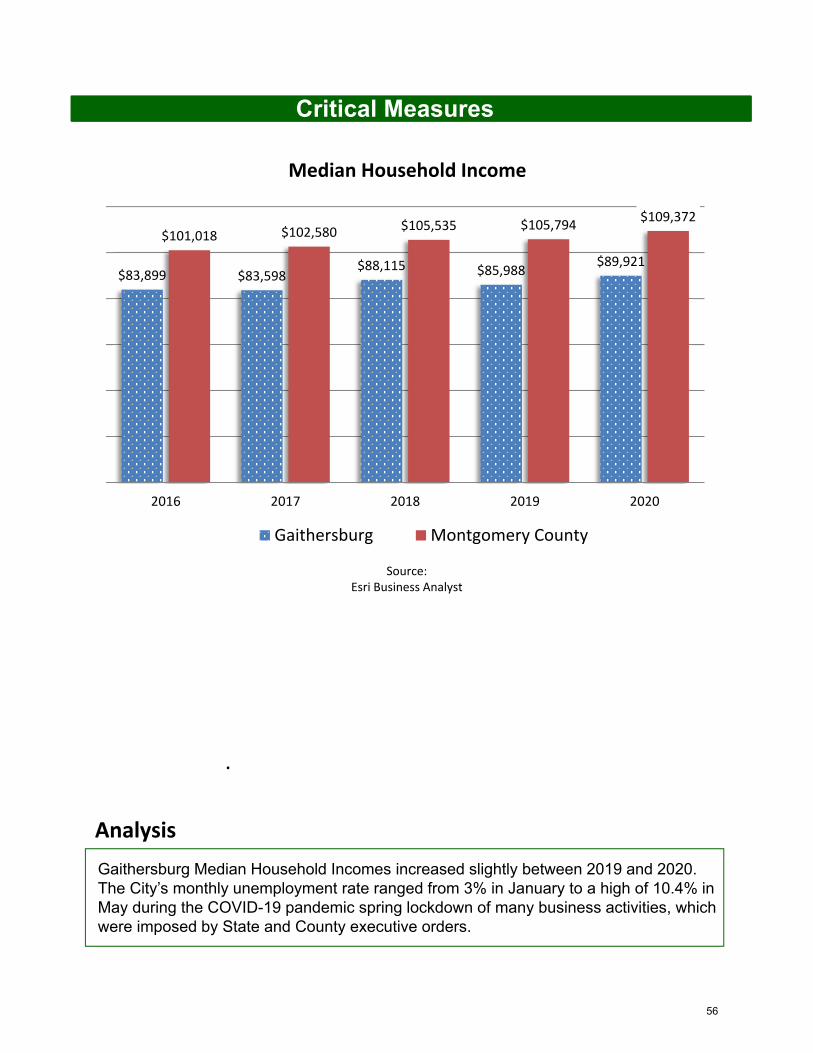
Gaithersburg Median Household Incomes increased slightly between 2019 and 2020. The City’s monthly unemployment rate ranged from 3% in January to a high of 10.4% in May during the COVID-19 pandemic spring lockdown of many business activities, which were imposed by State and County executive orders.
.
$83,899 $83,598$88,115 $85,988
$89,921
$101,018 $102,580 $105,535 $105,794$109,372
2016 2017 2018 2019 2020
Median Household Income
Gaithersburg Montgomery County
Source:Esri Business Analyst
56
Critical Measures
Analysis
The percentage of residents with Bachelor’s Degrees or higher increased slightly in the City and Montgomery County.
52.5%
59.0%
30.5%
53.5%
59.2%
31.0%
54.6%
59.7%
31.8%
52.8%
59.4%
32.5%
54.0%
61.1%
33.1%
Gaithersburg Montgomery County US
Educational AttainmentPercent with Bachelor's Degree or Higher (25 and older)
2016 2017 2018 2019 2020
SOURCE:Esri Business Analyst
57
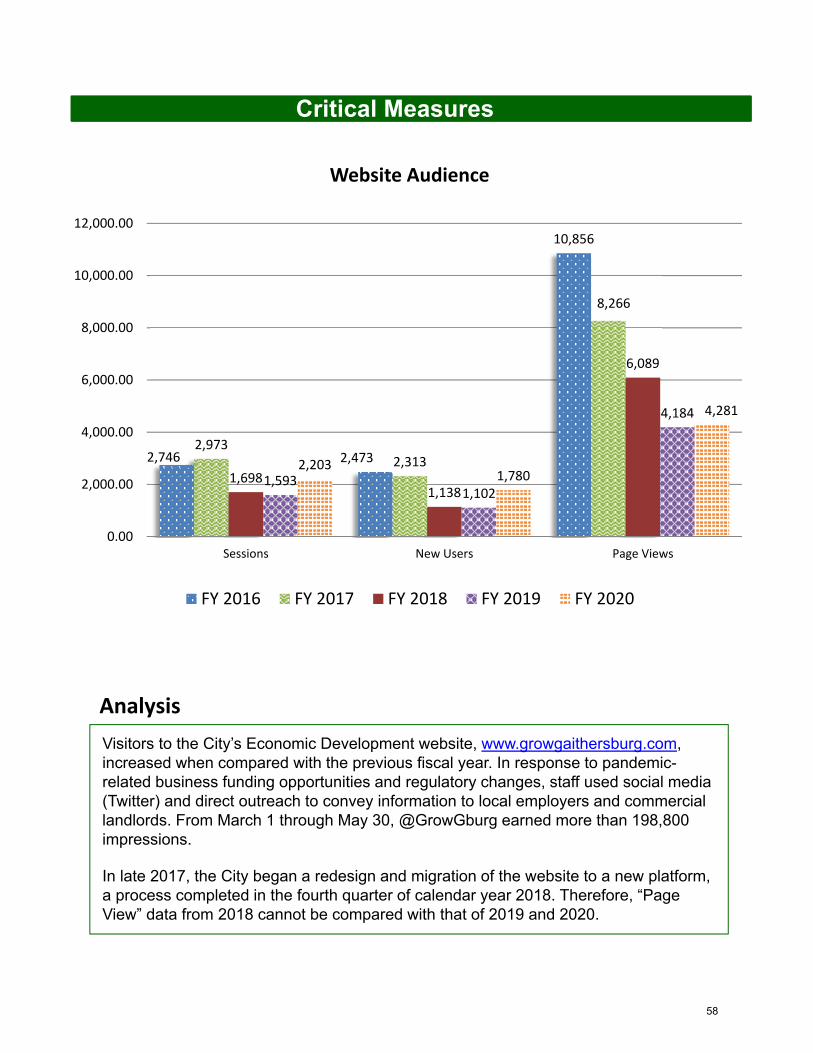
Critical Measures
Analysis
Visitors to the City’s Economic Development website, www.growgaithersburg.com, increased when compared with the previous fiscal year. In response to pandemic-related business funding opportunities and regulatory changes, staff used social media (Twitter) and direct outreach to convey information to local employers and commercial landlords. From March 1 through May 30, @GrowGburg earned more than 198,800 impressions.
In late 2017, the City began a redesign and migration of the website to a new platform, a process completed in the fourth quarter of calendar year 2018. Therefore, “Page View” data from 2018 cannot be compared with that of 2019 and 2020.
2,746 2,473
10,856
2,9732,313
8,266
1,6981,138
6,089
1,5931,102
4,184
2,2031,780
4,281
0.00
2,000.00
4,000.00
6,000.00
8,000.00
10,000.00
12,000.00
Sessions New Users Page Views
Website Audience
FY 2016 FY 2017 FY 2018 FY 2019 FY 2020
58
Key Strategies
Potential Strategy Conflicts‐
Gaithersburg Strategic Plan – FY 2022
Environment
Meet the needs of the City in a manner that accurately reflects the community’s desire for environmental health and economic
prosperity without compromising the ability of future generations to meet these same needs
• Maintain a leadership role in supporting initiatives that promote local and regional livable and sustainable communities
• Ensure the City is implementing long-term strategies that embrace the interconnectivity of economics, equity, and the environment
• Preserve, enhance, and maintain an interconnected network of natural resources, open spaces, and environmental infrastructure
• Maintain a Stormwater Management programthat strives to balance the goals of the City’s Watershed Implementation Plan (WIP) with existing infrastructure maintenance and has a fair and equitable fee structure
• Support efforts to increase public participation in recycling, pollution prevention and other sustainability initiatives
• Transportation
59
Objectives
Maintain a leadership role in supporting initiatives that promote local and regional livable and sustainable communities
• Utilize City, state and federal grant programs to assist homeowners associations and residents in enhancing their communities via environmental initiatives
• Remain an active participant with Metropolitan Washington Council of Government’s (MWCOG’s) Region Forward initiative and implementation programs, and continue to partner with state, county and other local governments to address regional environmental concerns
• Continue to implement elements of the Green Team Action Plan
• Involve Environmental Affairs Committee in regional sustainability initiatives and promoting environmental education
• Implement strategies contained in the Environmental & Sustainability Master Plan that are focused on both the urban and natural environment
• Coordinate with Montgomery County Public Schools relative to environmental education requirements for local students
Ensure the City is implementing long‐term strategies that embrace the interconnectivity of economics, equity and the environment
• Maintain a healthy, diverse urban forest to provide optimal environmental, social and economic benefits
• Strive to improve local and regional air quality, resource efficiency, and transportation alternatives
• Encourage energy conservation and pursue the use of alternative and renewable energy sources
• Continue to consider equity in both the development of policies and programs and access to resources and amenities
• Maintain and enhance the City’s Geographic Information System to provide mapping and statistical data as tools for reporting and evaluating environmental and economic impacts
• Promote public and private energy efficiency audits and improvements
60
Objectives
Preserve, enhance and maintain an interconnected network of natural resources, open spaces and environmental infrastructure
• Promote environmental initiatives that exceed minimum standards in the areas of green building, recycling and energy resources and efficiency
• Protect and improve water resources by implementing watershed management plans that incorporate healthy stream protection, an improved and maintained stormwater management system, and implementation of stream restoration projects
• Engage citizens in the City’s volunteer planting, stream monitoring, and clean-up programs to increase community involvement in environmental protection
• Encourage resource stewardship through outreach and education programs at schools and in the community
• Explore opportunities to expand the Urban Forest
Maintain a Stormwater Management program that strives to balance the goals of the City’s Watershed Implementation Plan (WIP) with existing infrastructure maintenance and has a fair and equitable fee structure
• Work with Maryland Department of the Environment and Montgomery County in supporting the Chesapeake Bay Watershed Implementation Plan (WIP) and ensuring that it is reasonable and affordable
• Maintain a rate fee model that is based on impervious coverage and assessed to all property types
• Sustain focus on stormwater facility inspections and provide adequate funding for stormwater infrastructure maintenance and replacement
• Continue Green Street retrofits on existing streets
• Analyze and implement watershed management plans by prioritizing opportunities for stream restoration, stormwater management (SWM) facility retrofits, and new SWM facilities to reduce nitrogen and phosphorous in order to meet EPA Chesapeake Bay TMDL targets
• Implement new programs and measures identified in the watershed management plans
• Provide transparency and education on the use of the Stormwater Program Fee
61
Objectives
Support efforts to increase public participation in recycling, pollution prevention and other sustainability initiatives
• Encourage participation in the curbside recycling program
• Promote recycling program for multifamily dwellings and for businesses
• Promote the use of safe and environmentally-friendly practices in our Fleet Maintenance program
• Foster summer Parks, Recreation, & Culture programs that promote environmental awareness and sensitivity
• Encourage safe pesticide usage practices, reduction in synthetic pesticide usage, and grass recycling source reduction by City residents
• Encourage pollution prevention Citywide by implementing measures to address illicit discharges, illegal dumping, and the introduction of pollutants into the ecosystem
62
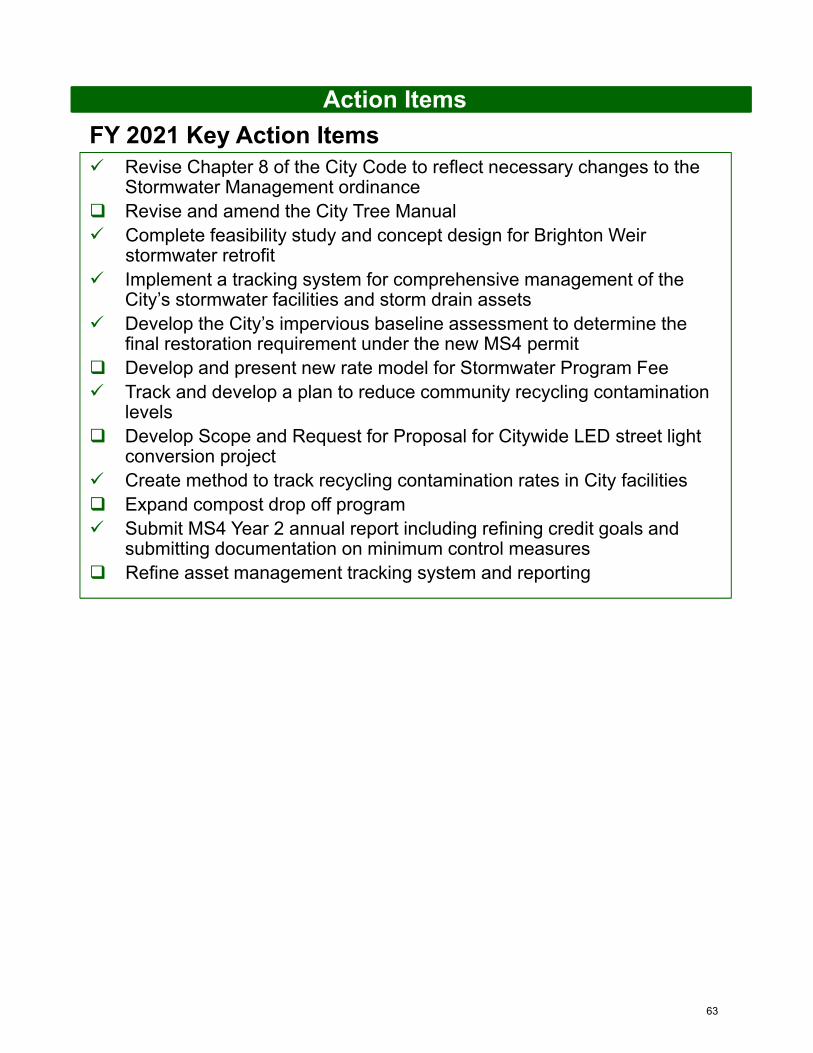
Action Items
Revise Chapter 8 of the City Code to reflect necessary changes to the Stormwater Management ordinance
Revise and amend the City Tree Manual Complete feasibility study and concept design for Brighton Weir
stormwater retrofit Implement a tracking system for comprehensive management of the
City’s stormwater facilities and storm drain assets Develop the City’s impervious baseline assessment to determine the
final restoration requirement under the new MS4 permit Develop and present new rate model for Stormwater Program Fee Track and develop a plan to reduce community recycling contamination
levels Develop Scope and Request for Proposal for Citywide LED street light
conversion project Create method to track recycling contamination rates in City facilities Expand compost drop off program Submit MS4 Year 2 annual report including refining credit goals and
submitting documentation on minimum control measures Refine asset management tracking system and reporting
FY 2021 Key Action Items
63
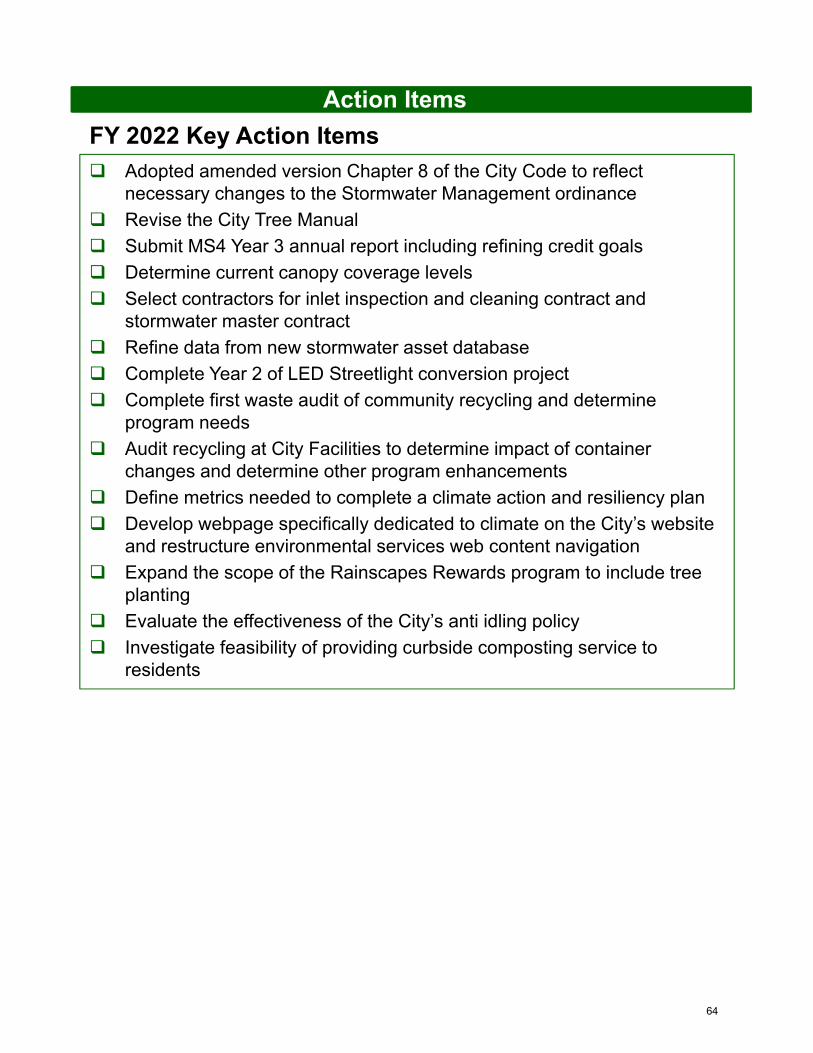
Action Items
FY 2022 Key Action Items
Adopted amended version Chapter 8 of the City Code to reflect necessary changes to the Stormwater Management ordinance
Revise the City Tree Manual
Submit MS4 Year 3 annual report including refining credit goals
Determine current canopy coverage levels
Select contractors for inlet inspection and cleaning contract and stormwater master contract
Refine data from new stormwater asset database
Complete Year 2 of LED Streetlight conversion project
Complete first waste audit of community recycling and determine program needs
Audit recycling at City Facilities to determine impact of container changes and determine other program enhancements
Define metrics needed to complete a climate action and resiliency plan
Develop webpage specifically dedicated to climate on the City’s website and restructure environmental services web content navigation
Expand the scope of the Rainscapes Rewards program to include tree planting
Evaluate the effectiveness of the City’s anti idling policy
Investigate feasibility of providing curbside composting service to residents
64
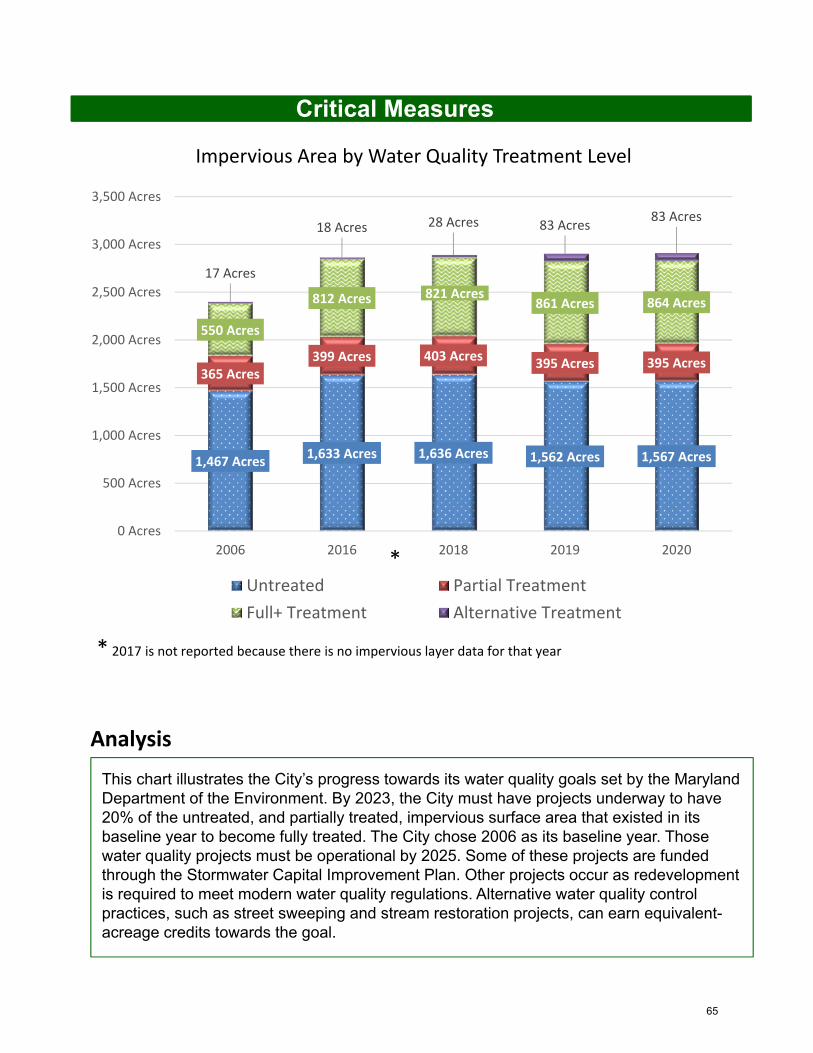
Critical Measures
Analysis
1,467 Acres1,633 Acres 1,636 Acres 1,562 Acres 1,567 Acres
365 Acres399 Acres 403 Acres
395 Acres 395 Acres
550 Acres
812 Acres 821 Acres861 Acres 864 Acres
17 Acres
18 Acres 28 Acres 83 Acres83 Acres
0 Acres
500 Acres
1,000 Acres
1,500 Acres
2,000 Acres
2,500 Acres
3,000 Acres
3,500 Acres
2006 2016 2018 2019 2020
Impervious Area by Water Quality Treatment Level
Untreated Partial Treatment
Full+ Treatment Alternative Treatment
*
* 2017 is not reported because there is no impervious layer data for that year
This chart illustrates the City’s progress towards its water quality goals set by the Maryland Department of the Environment. By 2023, the City must have projects underway to have 20% of the untreated, and partially treated, impervious surface area that existed in its baseline year to become fully treated. The City chose 2006 as its baseline year. Those water quality projects must be operational by 2025. Some of these projects are funded through the Stormwater Capital Improvement Plan. Other projects occur as redevelopment is required to meet modern water quality regulations. Alternative water quality control practices, such as street sweeping and stream restoration projects, can earn equivalent-acreage credits towards the goal.
65
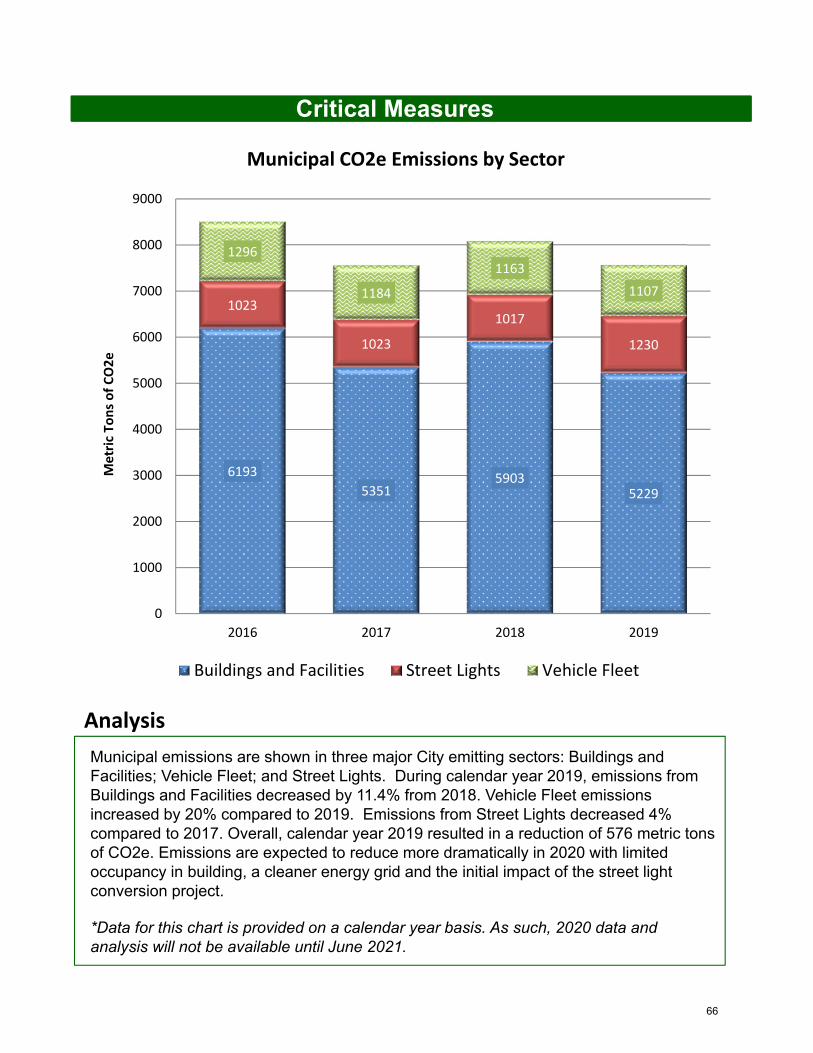
Critical Measures
Analysis
6193
53515903
5229
1023
1023
1017
1230
1296
1184
1163
1107
0
1000
2000
3000
4000
5000
6000
7000
8000
9000
2016 2017 2018 2019
Metric Tons of CO2e
Municipal CO2e Emissions by Sector
Buildings and Facilities Street Lights Vehicle Fleet
Municipal emissions are shown in three major City emitting sectors: Buildings and Facilities; Vehicle Fleet; and Street Lights. During calendar year 2019, emissions from Buildings and Facilities decreased by 11.4% from 2018. Vehicle Fleet emissions increased by 20% compared to 2019. Emissions from Street Lights decreased 4% compared to 2017. Overall, calendar year 2019 resulted in a reduction of 576 metric tons of CO2e. Emissions are expected to reduce more dramatically in 2020 with limited occupancy in building, a cleaner energy grid and the initial impact of the street light conversion project.
*Data for this chart is provided on a calendar year basis. As such, 2020 data and analysis will not be available until June 2021.
66
Key Strategies
Potential Strategy Conflicts‐
Gaithersburg Strategic Plan – FY 2022
Housing
Maintain comprehensive housing policies and programs that provide fair, affordable options in homeownership and rental
opportunities
• Utilize Housing Initiative Fund (HIF) to make strategic investments in priority projects that support increased affordable housing
• Encourage and support homeownership in the City
• Identify and address barriers to fair housing and educate housing consumers and providers
• Support initiatives that improve the rental housing stock in the City
• Meet the current and future housing needs for a wide range of populations
• Economic Development
67
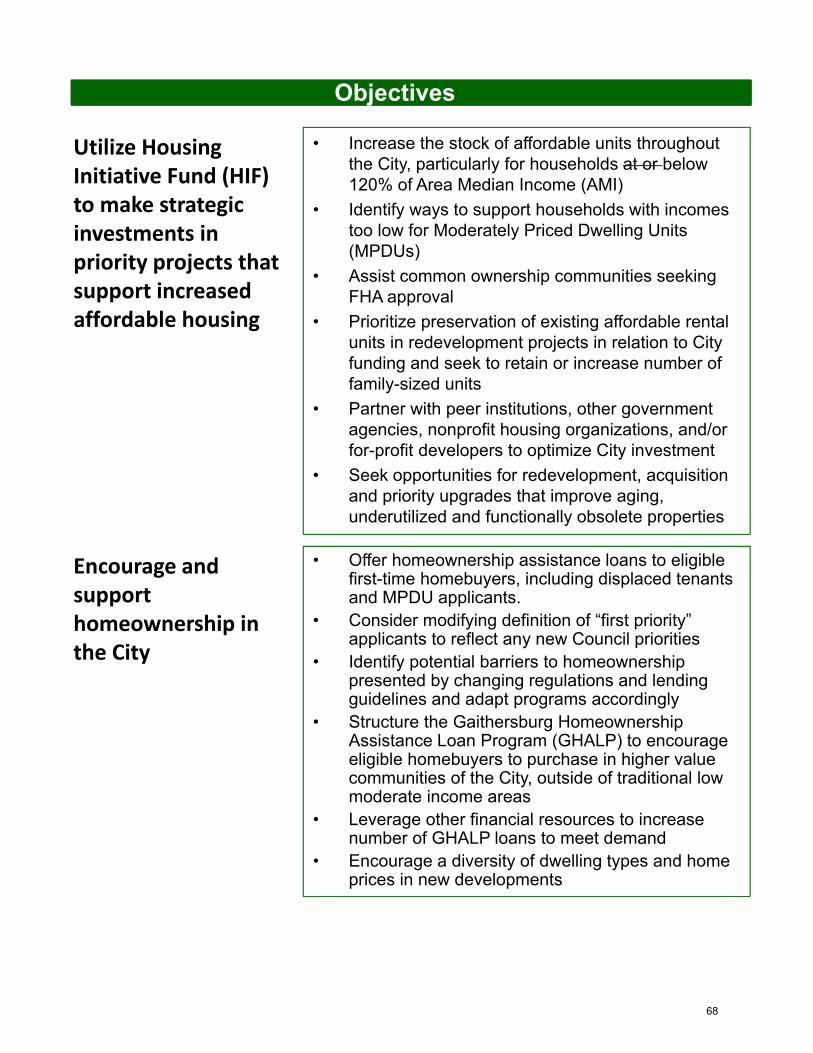
Objectives
Encourage and support homeownership in the City
• Increase the stock of affordable units throughout the City, particularly for households at or below 120% of Area Median Income (AMI)
• Identify ways to support households with incomes too low for Moderately Priced Dwelling Units (MPDUs)
• Assist common ownership communities seeking FHA approval
• Prioritize preservation of existing affordable rental units in redevelopment projects in relation to City funding and seek to retain or increase number of family-sized units
• Partner with peer institutions, other government agencies, nonprofit housing organizations, and/or for-profit developers to optimize City investment
• Seek opportunities for redevelopment, acquisition and priority upgrades that improve aging, underutilized and functionally obsolete properties
• Offer homeownership assistance loans to eligible first-time homebuyers, including displaced tenants and MPDU applicants.
• Consider modifying definition of “first priority” applicants to reflect any new Council priorities
• Identify potential barriers to homeownership presented by changing regulations and lending guidelines and adapt programs accordingly
• Structure the Gaithersburg Homeownership Assistance Loan Program (GHALP) to encourage eligible homebuyers to purchase in higher value communities of the City, outside of traditional low moderate income areas
• Leverage other financial resources to increase number of GHALP loans to meet demand
• Encourage a diversity of dwelling types and home prices in new developments
Utilize Housing Initiative Fund (HIF) to make strategic investments in priority projects that support increased affordable housing
68
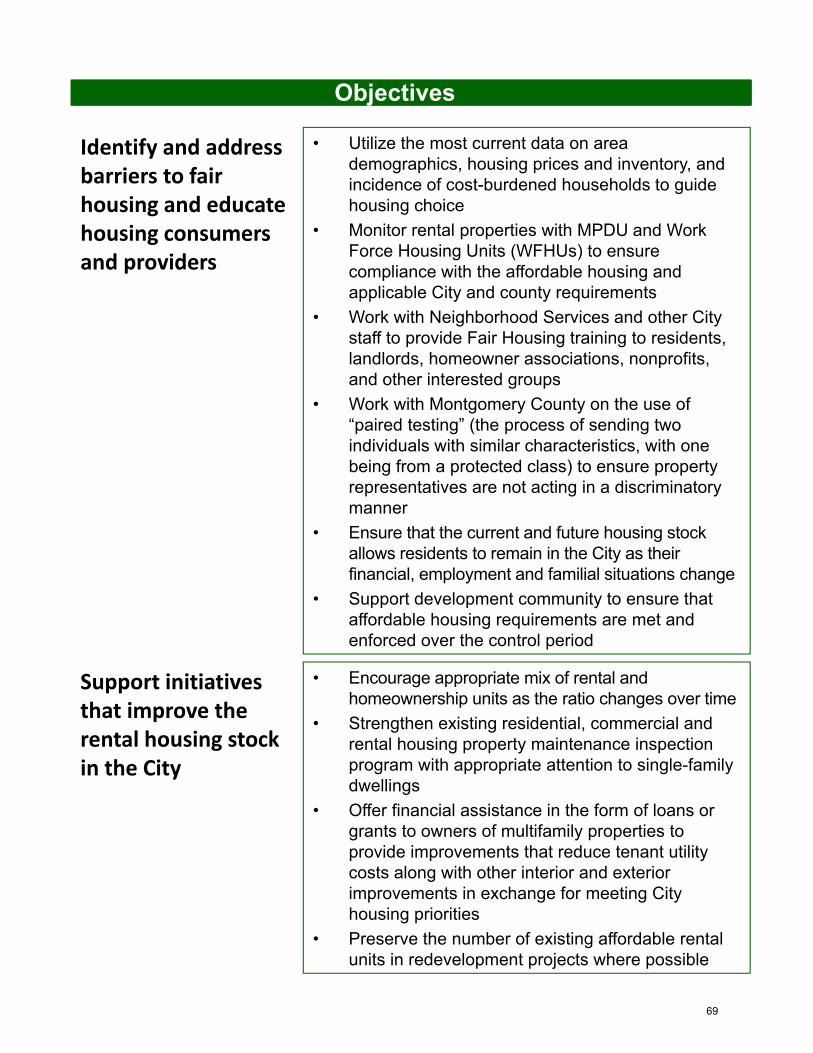
Objectives
Identify and address barriers to fair housing and educate housing consumers and providers
• Utilize the most current data on area demographics, housing prices and inventory, and incidence of cost-burdened households to guide housing choice
• Monitor rental properties with MPDU and Work Force Housing Units (WFHUs) to ensure compliance with the affordable housing and applicable City and county requirements
• Work with Neighborhood Services and other City staff to provide Fair Housing training to residents, landlords, homeowner associations, nonprofits, and other interested groups
• Work with Montgomery County on the use of “paired testing” (the process of sending two individuals with similar characteristics, with one being from a protected class) to ensure property representatives are not acting in a discriminatory manner
• Ensure that the current and future housing stock allows residents to remain in the City as their financial, employment and familial situations change
• Support development community to ensure that affordable housing requirements are met and enforced over the control period
• Encourage appropriate mix of rental and homeownership units as the ratio changes over time
• Strengthen existing residential, commercial and rental housing property maintenance inspection program with appropriate attention to single-family dwellings
• Offer financial assistance in the form of loans or grants to owners of multifamily properties to provide improvements that reduce tenant utility costs along with other interior and exterior improvements in exchange for meeting City housing priorities
• Preserve the number of existing affordable rental units in redevelopment projects where possible
Support initiatives that improve the rental housing stock in the City
69
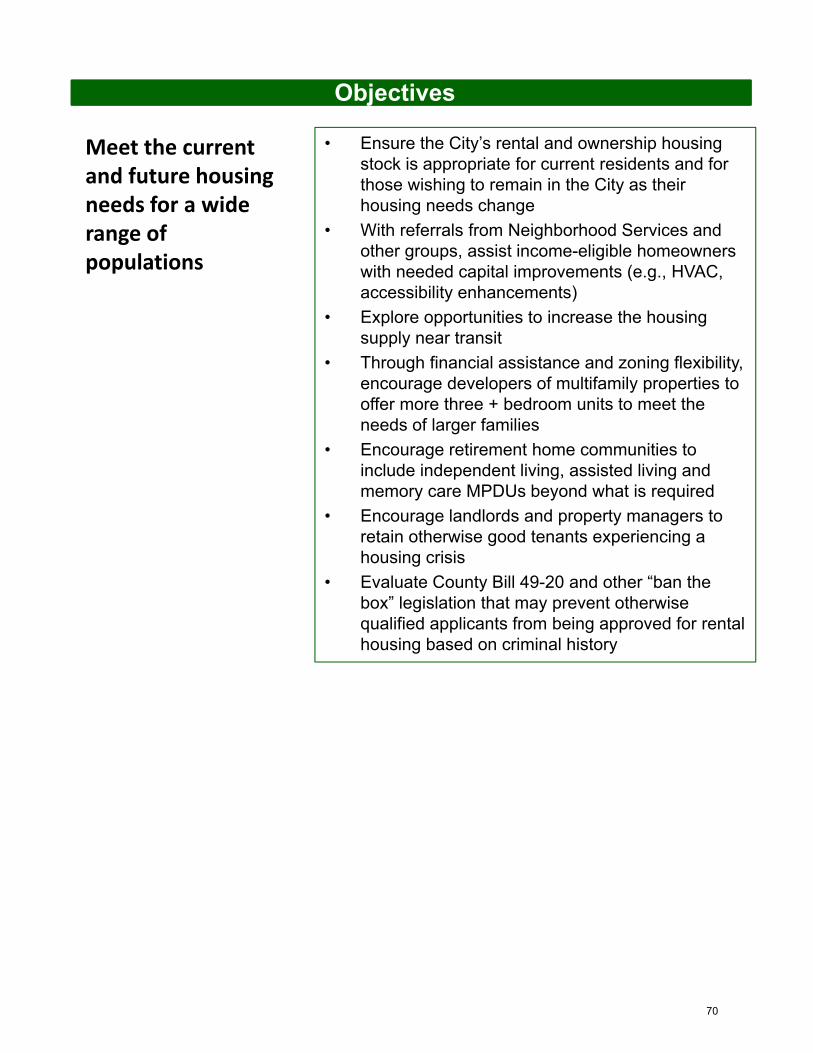
Objectives
Meet the current and future housing needs for a wide range of populations
• Ensure the City’s rental and ownership housing stock is appropriate for current residents and for those wishing to remain in the City as their housing needs change
• With referrals from Neighborhood Services and other groups, assist income-eligible homeowners with needed capital improvements (e.g., HVAC, accessibility enhancements)
• Explore opportunities to increase the housing supply near transit
• Through financial assistance and zoning flexibility, encourage developers of multifamily properties to offer more three + bedroom units to meet the needs of larger families
• Encourage retirement home communities to include independent living, assisted living and memory care MPDUs beyond what is required
• Encourage landlords and property managers to retain otherwise good tenants experiencing a housing crisis
• Evaluate County Bill 49-20 and other “ban the box” legislation that may prevent otherwise qualified applicants from being approved for rental housing based on criminal history
70
Action Items
FY 2021 Key Action Items
Coordinate with the Council of Governments, Montgomery County, the Housing Opportunities Commission and other regional partners on the new Assessment of Fair Housing, required by HUD for entitlement grantees
Partner with a multifamily rental property seeking to make appropriate upgrades to its units utilizing the City HIF loan funds
Conduct survey of owners of naturally occurring affordable housing developments to inquire about plans for the property (e.g., short or long term plans to hold or sell)
Develop program to offer financial incentives to developers of market-rate projects to incorporate higher than the 15 percent minimum
Determine potential infill sites for affordable housing in conjunction with Economic Development
Work with Neighborhood Services and Community Services to reduce the number of households receiving “writs of eviction” and the subsequent loss of their housing
71
Action Items
FY 2022 Key Action Items
Coordinate with the Council of Governments, Montgomery County, the Housing Opportunities Commission and other regional partners on the new Assessment of Fair Housing, required by HUD for entitlement grantees
Partner with a multifamily rental property seeking to make appropriate upgrades to its units utilizing the City HIF loan funds
Conduct survey of owners of naturally occurring affordable housing developments to inquire about plans for the property (e.g., short or long term plans to hold or sell)
Develop program to offer financial incentives to developers of market-rate projects to incorporate higher than the 15 percent minimum
Determine potential infill sites for affordable housing in conjunction with Economic Development
Work with Neighborhood Services and Community Services to reduce the number of households receiving “writs of eviction” and the subsequent loss of their housing
With Long-Range Planning staff, complete draft Housing Element, an amendment to the City’s Master Plan
Conduct second biennial housing survey of residential tenants and homebuyers to assess potential fair housing violations and to track short and long-term consequences of COVID in rental and ownership housing
If adopted by the County Council, in coordination with Neighborhood Services, bring similar legislation to the Mayor and Council that would prohibit landlords, lenders and other housing providers from requiring applicants to disclose certain criminal records and arrests without conviction by amending Chapter 13 of the City Code
72
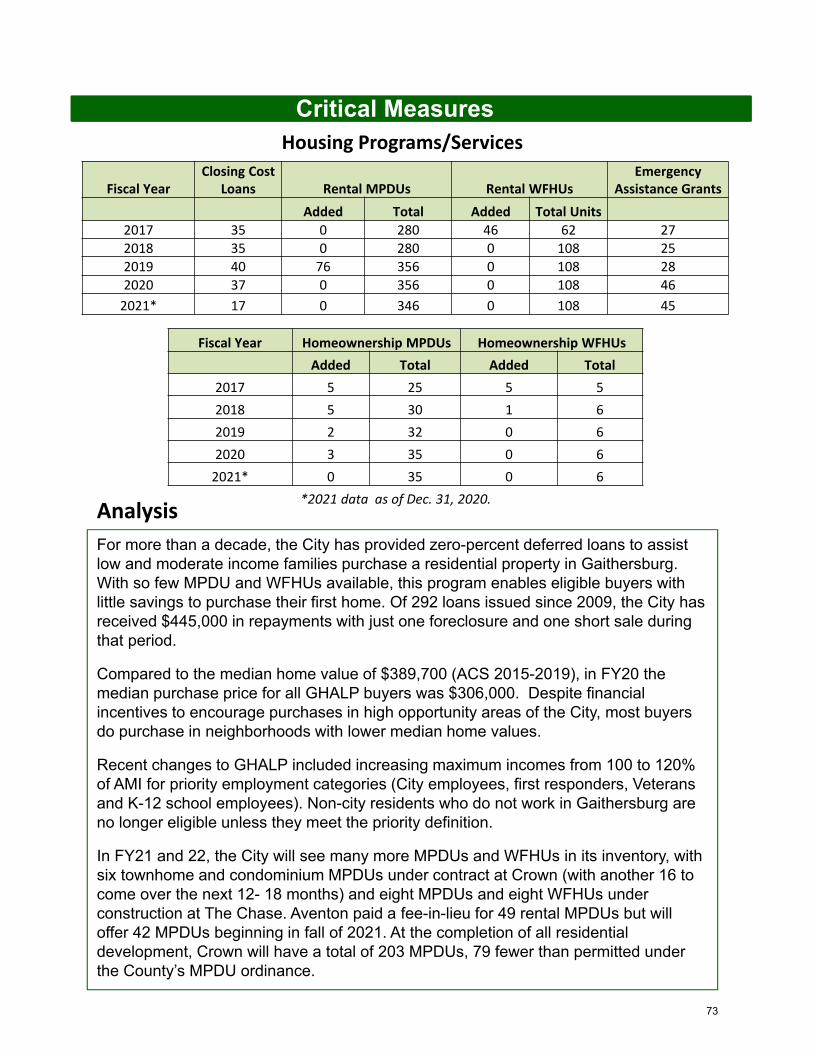
Critical Measures
For more than a decade, the City has provided zero-percent deferred loans to assist low and moderate income families purchase a residential property in Gaithersburg. With so few MPDU and WFHUs available, this program enables eligible buyers with little savings to purchase their first home. Of 292 loans issued since 2009, the City has received $445,000 in repayments with just one foreclosure and one short sale during that period.
Compared to the median home value of $389,700 (ACS 2015-2019), in FY20 the median purchase price for all GHALP buyers was $306,000. Despite financial incentives to encourage purchases in high opportunity areas of the City, most buyers do purchase in neighborhoods with lower median home values.
Recent changes to GHALP included increasing maximum incomes from 100 to 120% of AMI for priority employment categories (City employees, first responders, Veterans and K-12 school employees). Non-city residents who do not work in Gaithersburg are no longer eligible unless they meet the priority definition.
In FY21 and 22, the City will see many more MPDUs and WFHUs in its inventory, with six townhome and condominium MPDUs under contract at Crown (with another 16 to come over the next 12- 18 months) and eight MPDUs and eight WFHUs under construction at The Chase. Aventon paid a fee-in-lieu for 49 rental MPDUs but will offer 42 MPDUs beginning in fall of 2021. At the completion of all residential development, Crown will have a total of 203 MPDUs, 79 fewer than permitted under the County’s MPDU ordinance.
Housing Programs/Services
*2021 data as of Dec. 31, 2020.
Fiscal YearClosing Cost
Loans Rental MPDUs Rental WFHUsEmergency
Assistance Grants
Added Total Added Total Units
2017 35 0 280 46 62 27
2018 35 0 280 0 108 25
2019 40 76 356 0 108 28
2020 37 0 356 0 108 46
2021* 17 0 346 0 108 45
Fiscal Year Homeownership MPDUs Homeownership WFHUs
Added Total Added Total
2017 5 25 5 5
2018 5 30 1 6
2019 2 32 0 6
2020 3 35 0 6
2021* 0 35 0 6
Analysis
73
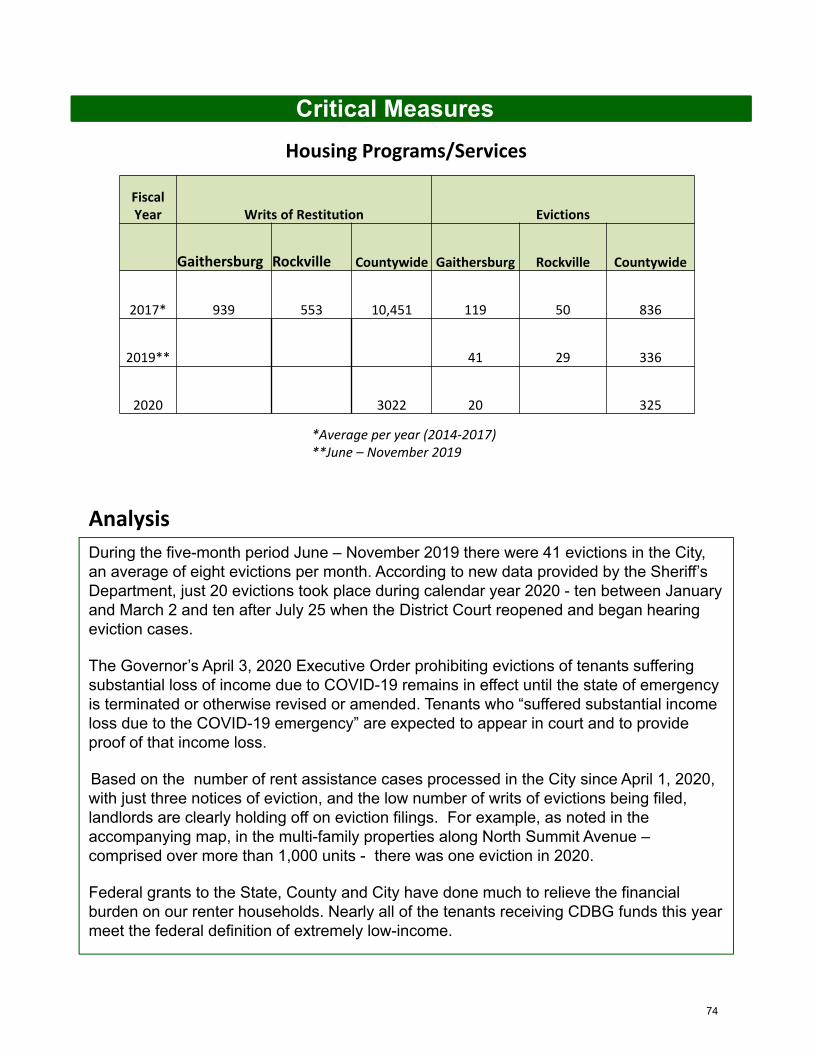
Critical Measures
During the five-month period June – November 2019 there were 41 evictions in the City, an average of eight evictions per month. According to new data provided by the Sheriff’s Department, just 20 evictions took place during calendar year 2020 - ten between January and March 2 and ten after July 25 when the District Court reopened and began hearing eviction cases.
The Governor’s April 3, 2020 Executive Order prohibiting evictions of tenants suffering substantial loss of income due to COVID-19 remains in effect until the state of emergency is terminated or otherwise revised or amended. Tenants who “suffered substantial income loss due to the COVID-19 emergency” are expected to appear in court and to provide proof of that income loss.
Based on the number of rent assistance cases processed in the City since April 1, 2020, with just three notices of eviction, and the low number of writs of evictions being filed, landlords are clearly holding off on eviction filings. For example, as noted in the accompanying map, in the multi-family properties along North Summit Avenue –comprised over more than 1,000 units - there was one eviction in 2020.
Federal grants to the State, County and City have done much to relieve the financial burden on our renter households. Nearly all of the tenants receiving CDBG funds this year meet the federal definition of extremely low-income.
Housing Programs/Services
*Average per year (2014‐2017)**June – November 2019
Analysis
Fiscal Year Writs of Restitution Evictions
Gaithersburg Rockville Countywide Gaithersburg Rockville Countywide
2017* 939 553 10,451 119 50 836
2019** 41 29 336
2020 3022 20 325
74
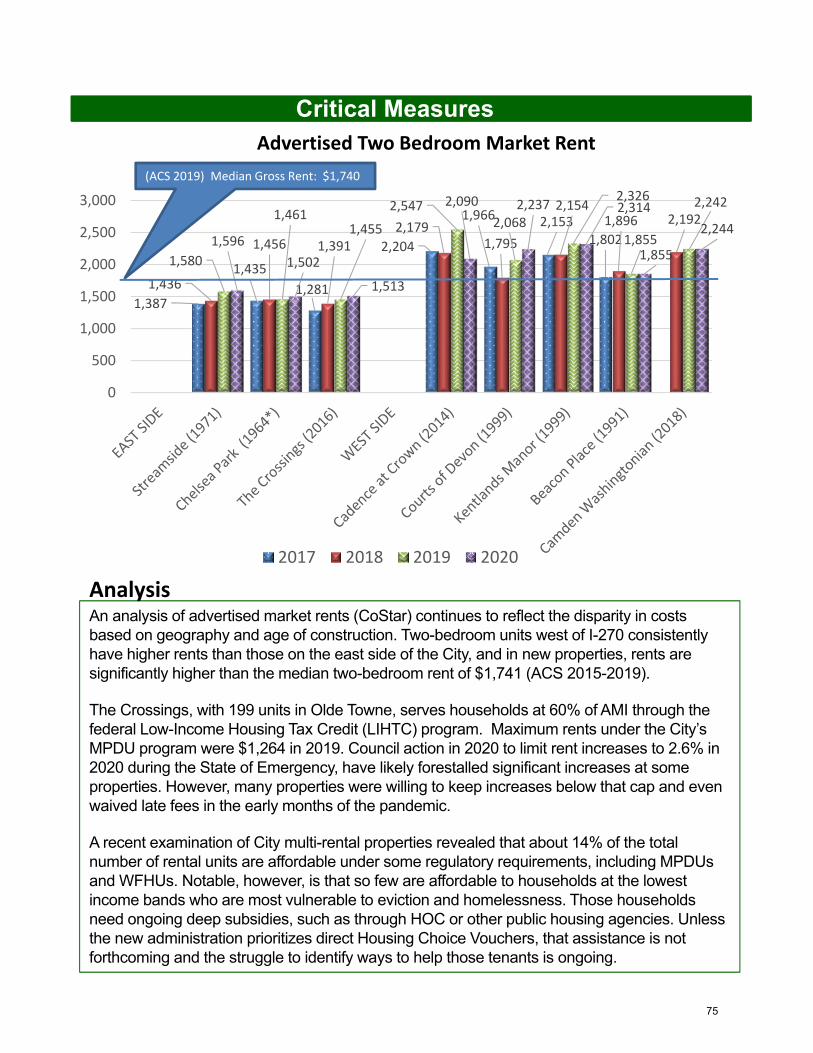
Critical Measures
An analysis of advertised market rents (CoStar) continues to reflect the disparity in costs based on geography and age of construction. Two-bedroom units west of I-270 consistently have higher rents than those on the east side of the City, and in new properties, rents are significantly higher than the median two-bedroom rent of $1,741 (ACS 2015-2019).
The Crossings, with 199 units in Olde Towne, serves households at 60% of AMI through the federal Low-Income Housing Tax Credit (LIHTC) program. Maximum rents under the City’s MPDU program were $1,264 in 2019. Council action in 2020 to limit rent increases to 2.6% in 2020 during the State of Emergency, have likely forestalled significant increases at some properties. However, many properties were willing to keep increases below that cap and even waived late fees in the early months of the pandemic.
A recent examination of City multi-rental properties revealed that about 14% of the total number of rental units are affordable under some regulatory requirements, including MPDUs and WFHUs. Notable, however, is that so few are affordable to households at the lowest income bands who are most vulnerable to eviction and homelessness. Those households need ongoing deep subsidies, such as through HOC or other public housing agencies. Unless the new administration prioritizes direct Housing Choice Vouchers, that assistance is not forthcoming and the struggle to identify ways to help those tenants is ongoing.
Advertised Two Bedroom Market Rent
Analysis
1,387
1,435
1,281
2,204
1,966 2,1531,802
1,436
1,456 1,391
2,1791,795
2,1541,896 2,192
1,580
1,4611,455
2,5472,068
2,326
1,855
2,242
1,596
1,502
1,513
2,090 2,237 2,314
1,855
2,244
0
500
1,000
1,500
2,000
2,500
3,000
2017 2018 2019 2020
(ACS 2019) Median Gross Rent: $1,740
75
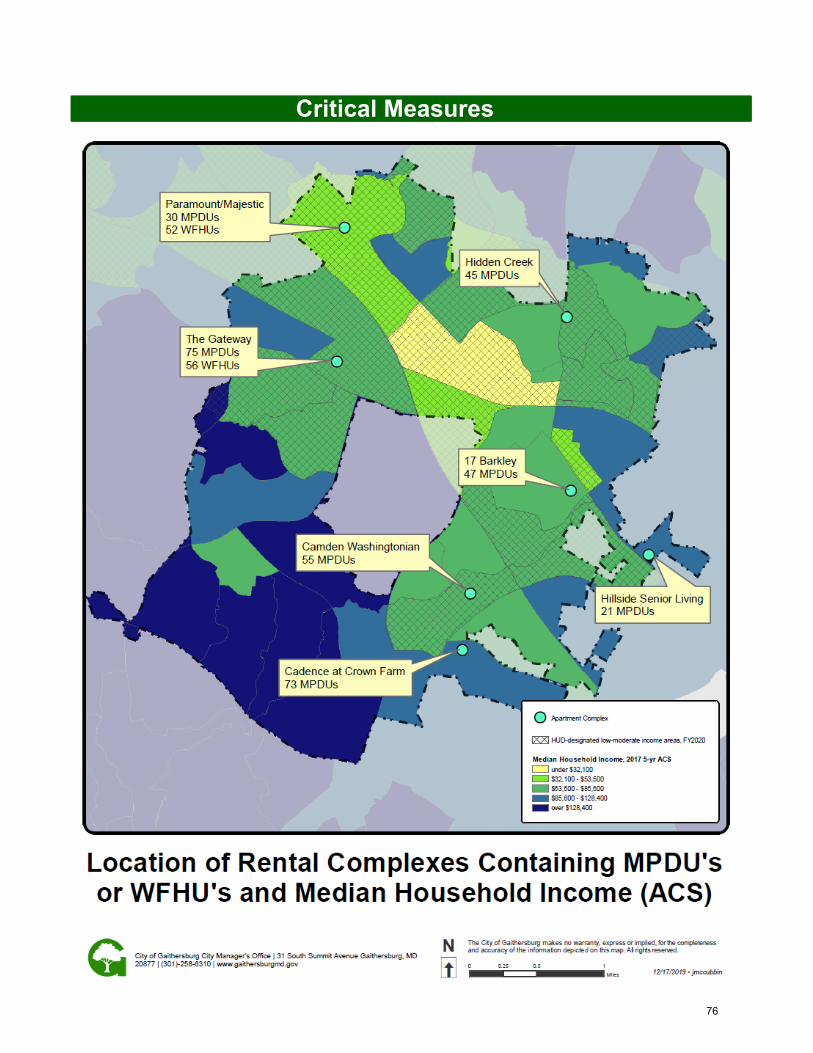
Critical Measures
76
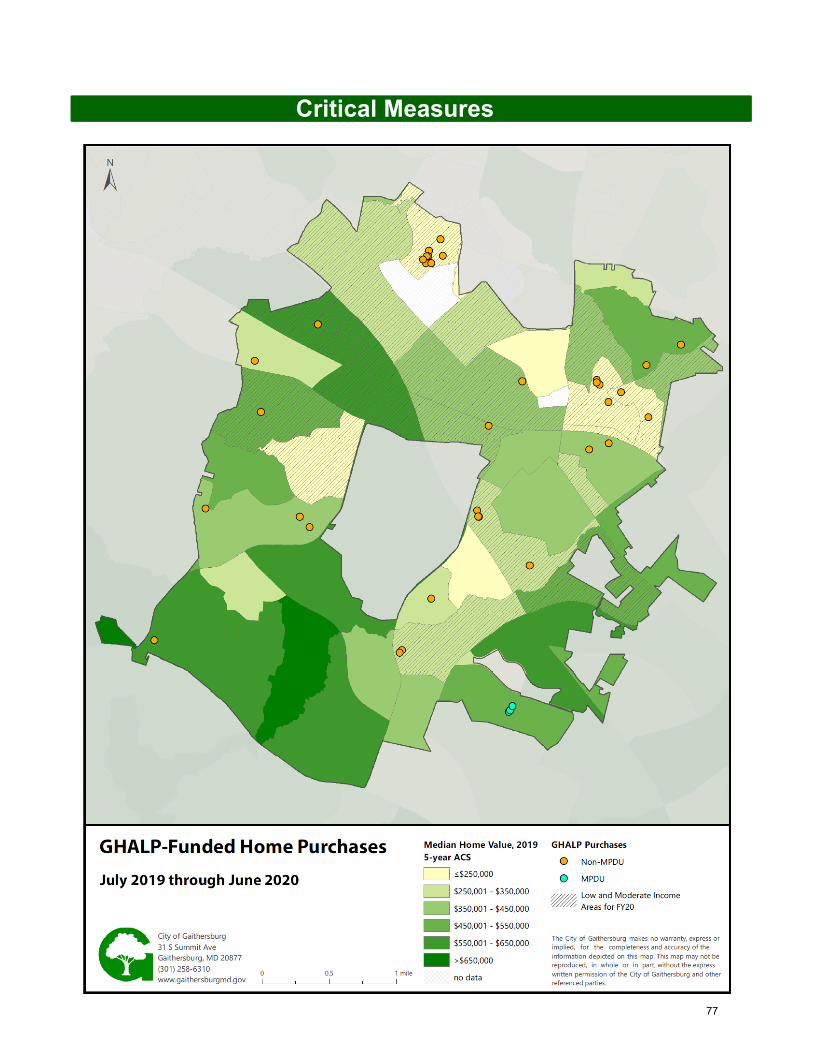
Critical Measures
77
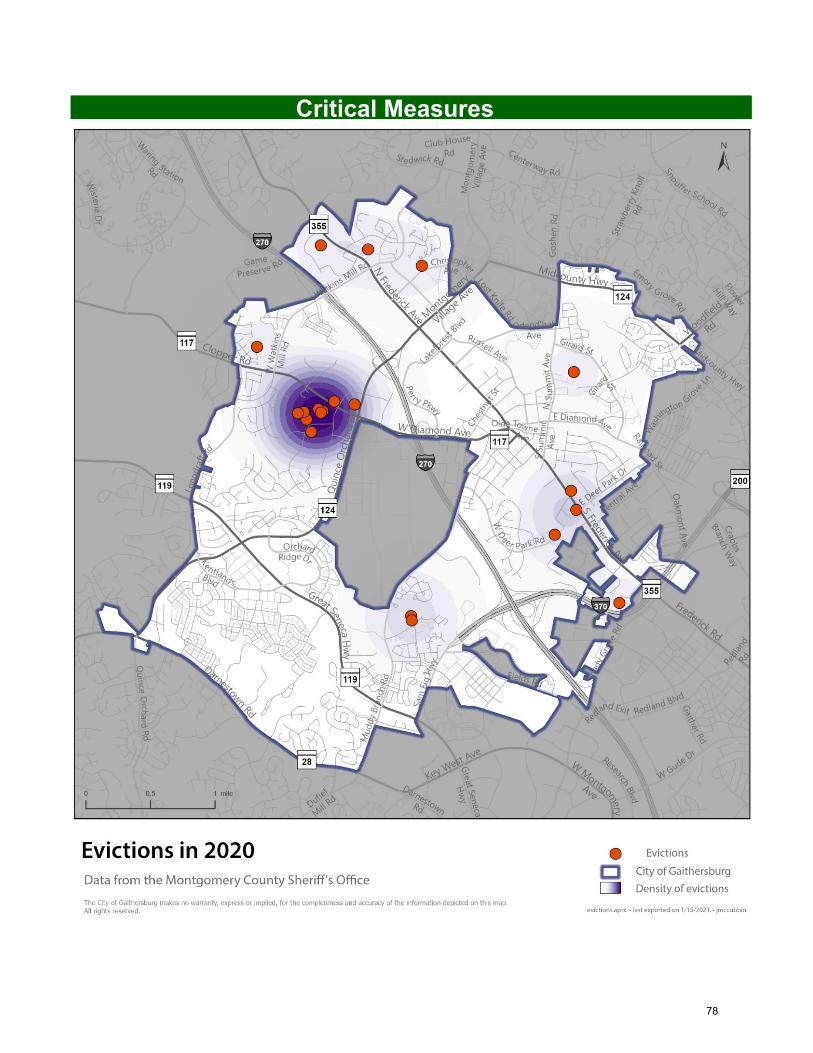
Critical Measures
78
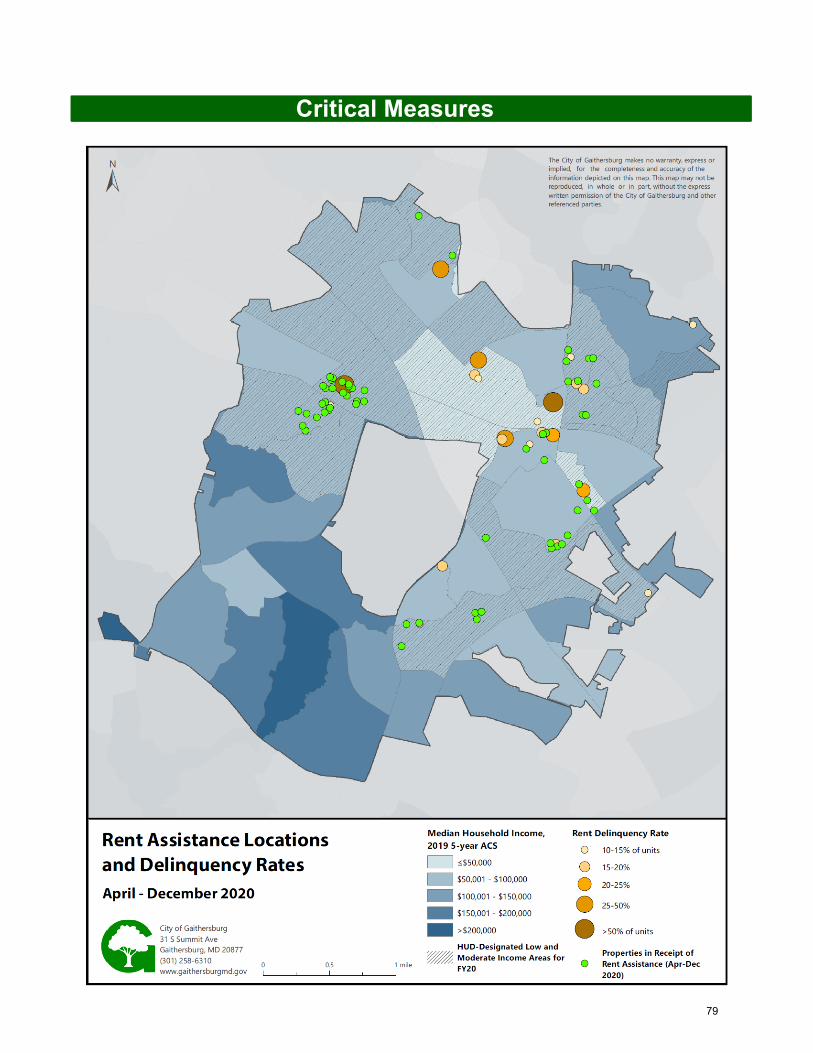
Critical Measures
79
Critical Measures
Quick and focused action on the part of governments has prevented most evictions and residential mortgage foreclosures. The Governor’s Order on halting COVID-related evictions for non-payment; local and federal legislative action to address the immediate housing crisis, including forbearance on residential mortgages; and increased funding from all levels of government have kept thousands of City residents safely housed – at least until the immediate crisis has passed.
In Gaithersburg, housing affordability has long been a challenge to large segments of our population. Based on the most recent ACS data (2015-2019), cost-burdened households (i.e., paying more than 30% of income to housing) make up nearly half of our tenants; 26.7% pay more than 50% of their incomes to housing; and 9.5% of our residents live at or below the federal poverty level. This and more in a City where the median rent for a two-bedroom apartment is $1,740/month.
Moreover, Gaithersburg’s large percentage of minority households have suffered employment losses far exceeding White and Asian residents. During the nine months (April – December 2020) in which the City prioritized assistance to households with COVID-related income losses, CDBG funds assisted 60 families and single adults with incomes below 50% of AMI. More than 90% of the households receiving that assistance reported as Black or African American, White Hispanic, or multiple races.
Last year, our greatest housing concerns were two-fold: insufficient funds to assist every eligible resident and disproportionate numbers of City residents receiving writs of restitution (eviction notices). The CARES Act lifted the statutory cap on financial assistance and courts are not processing evictions related to COVID (a moratorium scheduled to end once the State of Emergency has been lifted).
Multi-family delinquencies, while high at many properties, have remained below 15% overall (as of November 2020). Many of the smaller properties appear to be weathering the crisis better than others. Financial assistance from the City and County coupled with other governmental assistance to landlords and property owners has been critical to the stability of both residents and property owners.
Another probable consequence of COVID is the low number of GHALP loans issued since April 2020. Whereas, prior years saw up to 60 loans in a 12-month period, since April, the City has issued just 23 loans, with most going to households with incomes above the HUD maximums. Due to record low interest rates, there has been a surge in mortgage refinancing (with the City’s willingness to resubordinate its GHALP loans).
Positive news for City revenues is the fairly significant increase in high-income households. In 2019, the percentage of households with incomes of $200,000 or higher rose to 14.8% of all households, up from 11.1% in 2014. According to Planning staff, that increase can largely be attributed to new residential growth at Crown and Parklands, as well as increasing numbers of higher-income households in Lakelands and Parklands.
Analysis
80
Key Strategies
Potential Strategy Conflicts‐
Gaithersburg Strategic Plan – FY 2022
Infrastructureand Facilities
Maintain and improve the City’s existing infrastructure, public facilities and capital assets in a sustainable, cost-effective
manner, and invest in new facilities and real property in support of the City’s strategic goals
• Plan and execute projects to preserve, maintain, improve, and grow City infrastructure to continue to provide necessary City programs and services
• Construct new City buildings in an environmentally sustainable manner and meet 2018 International Green Construction Code (IgCC) with City Amendments
81
Objectives
Plan and execute projects to preserve, maintain, improve, and grow City infrastructure to continue to provide necessary City programs and services
• Frequently assess and evaluate existing City building assets for functionality, code compliance, energy efficiency, deferred maintenance, space management, and compliance with the Americans with Disabilities Act (ADA)
• Provide adequate funding for maintenance, improvements and enhancements to the City’s infrastructure
• Increase emphasis on managing operating costs by evaluating cost-effective solutions and green technologies to increase building efficiency
• Fund and support capital projects that are in progress and continue to plan for future capital improvement projects
• Manage projects to provide space and services efficiently and effectively
• Support the preservation of City-owned historic resources and designated sites
• Maintain a Planned Life-Cycle Asset Replacement program for major equipment and building component replacement through the development of individual building maintenance plans
• Foster community interaction by offering unique, non-duplicative amenities and facilities in locations that draw residents throughout the City
• Ensure that all buildings, system improvements and capital projects meet or surpass environmental and regulatory requirements and incorporate sustainable practices as embodied in the International Green Construction Code (IgCC) with City Amendments or equivalent benchmarks where appropriate
• Optimize site potential to minimize non-renewable energy consumption
• Use environmentally preferable products• Protect and conserve water• Enhance indoor environmental quality• Optimize operational and maintenance practices
that result in reduction of our “carbon footprint”
Construct new City buildings in an environmentally sustainable manner and meet 2018 International Green Construction Code (IgCC) with City Amendments
82
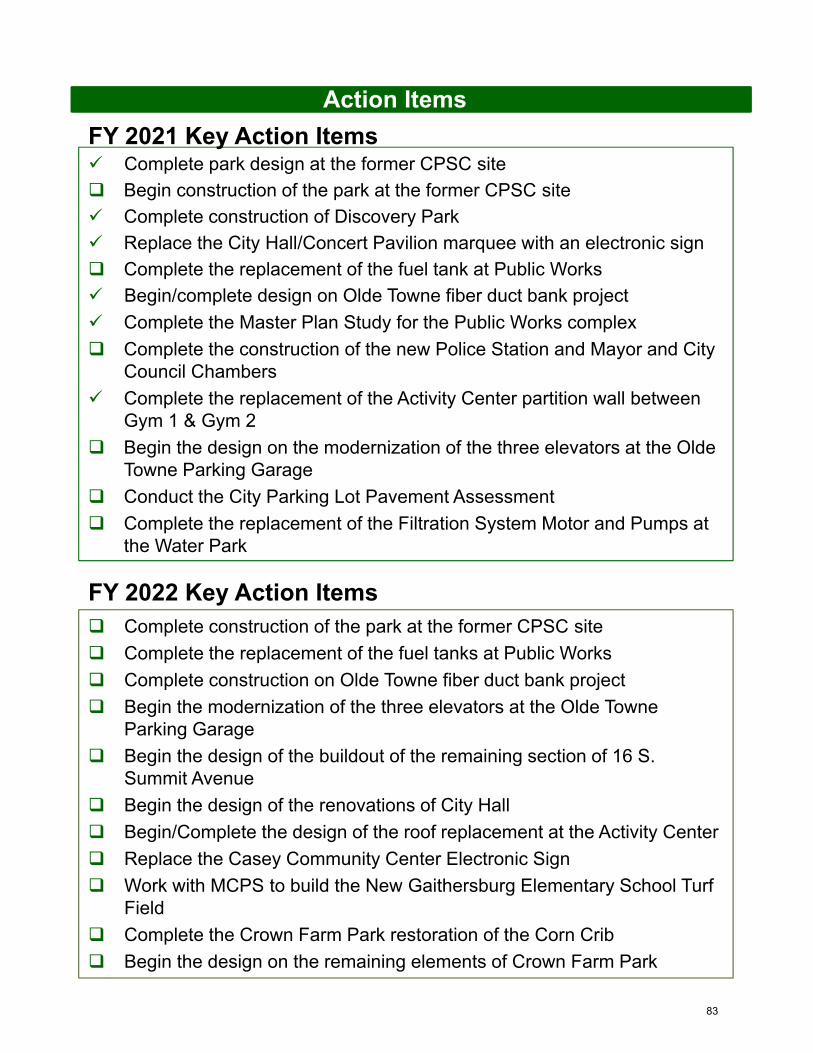
Action Items
Complete park design at the former CPSC site
Begin construction of the park at the former CPSC site
Complete construction of Discovery Park
Replace the City Hall/Concert Pavilion marquee with an electronic sign
Complete the replacement of the fuel tank at Public Works
Begin/complete design on Olde Towne fiber duct bank project
Complete the Master Plan Study for the Public Works complex
Complete the construction of the new Police Station and Mayor and City Council Chambers
Complete the replacement of the Activity Center partition wall between Gym 1 & Gym 2
Begin the design on the modernization of the three elevators at the Olde Towne Parking Garage
Conduct the City Parking Lot Pavement Assessment
Complete the replacement of the Filtration System Motor and Pumps at the Water Park
FY 2021 Key Action Items
Complete construction of the park at the former CPSC site
Complete the replacement of the fuel tanks at Public Works
Complete construction on Olde Towne fiber duct bank project
Begin the modernization of the three elevators at the Olde Towne Parking Garage
Begin the design of the buildout of the remaining section of 16 S. Summit Avenue
Begin the design of the renovations of City Hall
Begin/Complete the design of the roof replacement at the Activity Center
Replace the Casey Community Center Electronic Sign
Work with MCPS to build the New Gaithersburg Elementary School Turf Field
Complete the Crown Farm Park restoration of the Corn Crib
Begin the design on the remaining elements of Crown Farm Park
FY 2022 Key Action Items
83
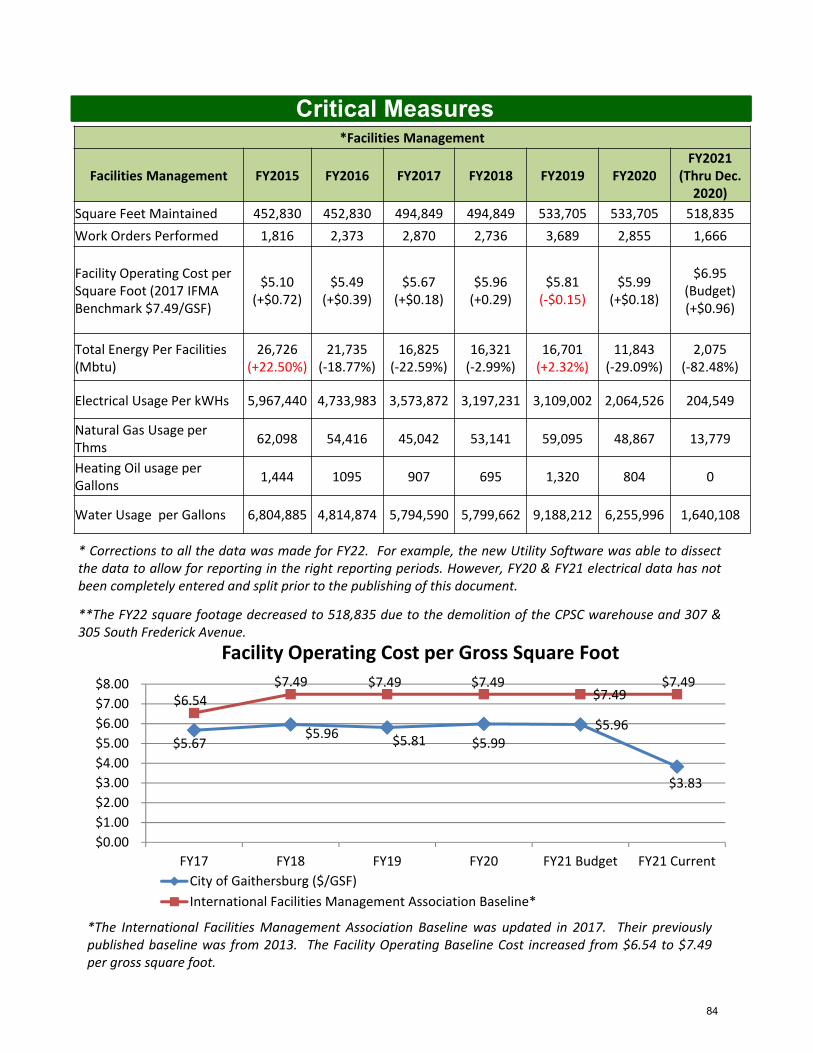
Critical Measures
Facility Operating Cost per Gross Square Foot
*Facilities Management
Facilities Management FY2015 FY2016 FY2017 FY2018 FY2019 FY2020FY2021
(Thru Dec. 2020)
Square Feet Maintained 452,830 452,830 494,849 494,849 533,705 533,705 518,835
Work Orders Performed 1,816 2,373 2,870 2,736 3,689 2,855 1,666
Facility Operating Cost per Square Foot (2017 IFMA Benchmark $7.49/GSF)
$5.10(+$0.72)
$5.49(+$0.39)
$5.67(+$0.18)
$5.96(+0.29)
$5.81(‐$0.15)
$5.99(+$0.18)
$6.95(Budget)(+$0.96)
Total Energy Per Facilities (Mbtu)
26,726(+22.50%)
21,735(‐18.77%)
16,825(‐22.59%)
16,321(‐2.99%)
16,701(+2.32%)
11,843(‐29.09%)
2,075(‐82.48%)
Electrical Usage Per kWHs 5,967,440 4,733,983 3,573,872 3,197,231 3,109,002 2,064,526 204,549
Natural Gas Usage perThms
62,098 54,416 45,042 53,141 59,095 48,867 13,779
Heating Oil usage per Gallons
1,444 1095 907 695 1,320 804 0
Water Usage per Gallons 6,804,885 4,814,874 5,794,590 5,799,662 9,188,212 6,255,996 1,640,108
$5.67 $5.96
$5.81 $5.99 $5.96
$3.83
$6.54
$7.49 $7.49 $7.49 $7.49
$7.49
$0.00
$1.00
$2.00
$3.00
$4.00
$5.00
$6.00
$7.00
$8.00
FY17 FY18 FY19 FY20 FY21 Budget FY21 Current
City of Gaithersburg ($/GSF)
International Facilities Management Association Baseline*
* Corrections to all the data was made for FY22. For example, the new Utility Software was able to dissectthe data to allow for reporting in the right reporting periods. However, FY20 & FY21 electrical data has notbeen completely entered and split prior to the publishing of this document.
**The FY22 square footage decreased to 518,835 due to the demolition of the CPSC warehouse and 307 &305 South Frederick Avenue.
*The International Facilities Management Association Baseline was updated in 2017. Their previouslypublished baseline was from 2013. The Facility Operating Baseline Cost increased from $6.54 to $7.49per gross square foot.
84
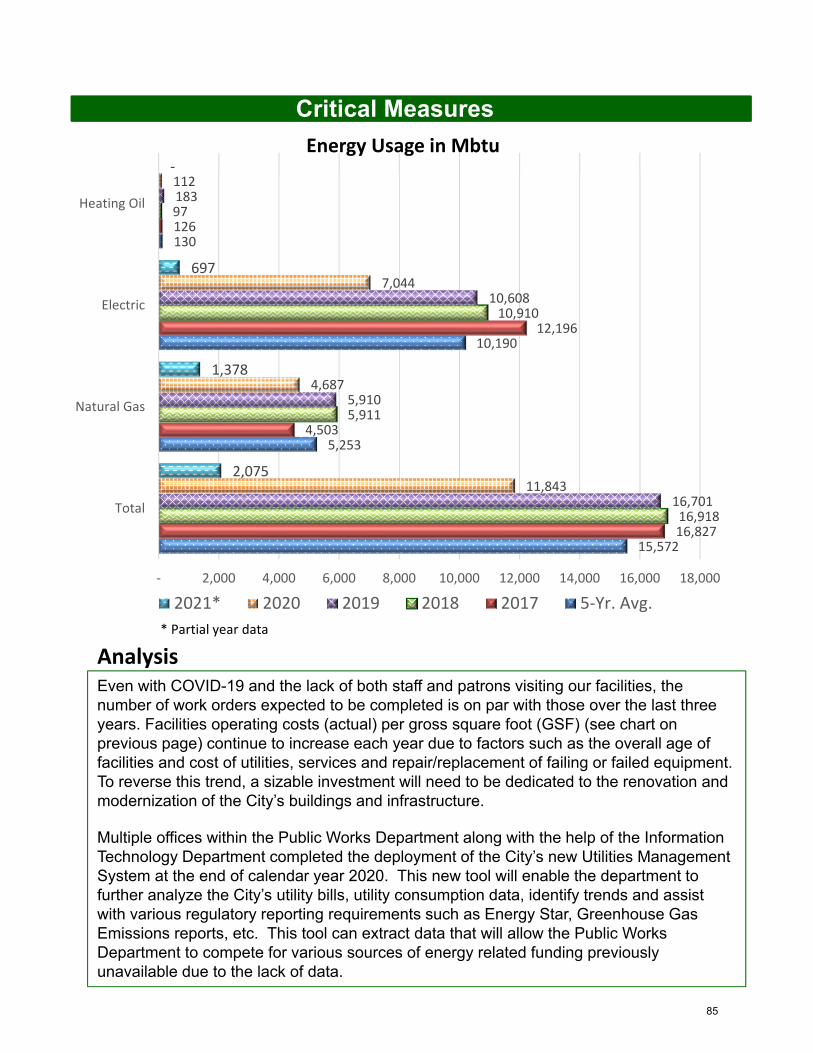
Critical Measures
AnalysisEven with COVID-19 and the lack of both staff and patrons visiting our facilities, the number of work orders expected to be completed is on par with those over the last three years. Facilities operating costs (actual) per gross square foot (GSF) (see chart on previous page) continue to increase each year due to factors such as the overall age of facilities and cost of utilities, services and repair/replacement of failing or failed equipment. To reverse this trend, a sizable investment will need to be dedicated to the renovation and modernization of the City’s buildings and infrastructure.
Multiple offices within the Public Works Department along with the help of the Information Technology Department completed the deployment of the City’s new Utilities Management System at the end of calendar year 2020. This new tool will enable the department to further analyze the City’s utility bills, utility consumption data, identify trends and assist with various regulatory reporting requirements such as Energy Star, Greenhouse Gas Emissions reports, etc. This tool can extract data that will allow the Public Works Department to compete for various sources of energy related funding previously unavailable due to the lack of data.
Energy Usage in Mbtu
15,572
5,253
10,190
130
16,827
4,503
12,196
126
16,918
5,911
10,910
97
16,701
5,910
10,608
183
11,843
4,687
7,044
112
2,075
1,378
697
‐
‐ 2,000 4,000 6,000 8,000 10,000 12,000 14,000 16,000 18,000
Total
Natural Gas
Electric
Heating Oil
2021* 2020 2019 2018 2017 5‐Yr. Avg.
* Partial year data
85
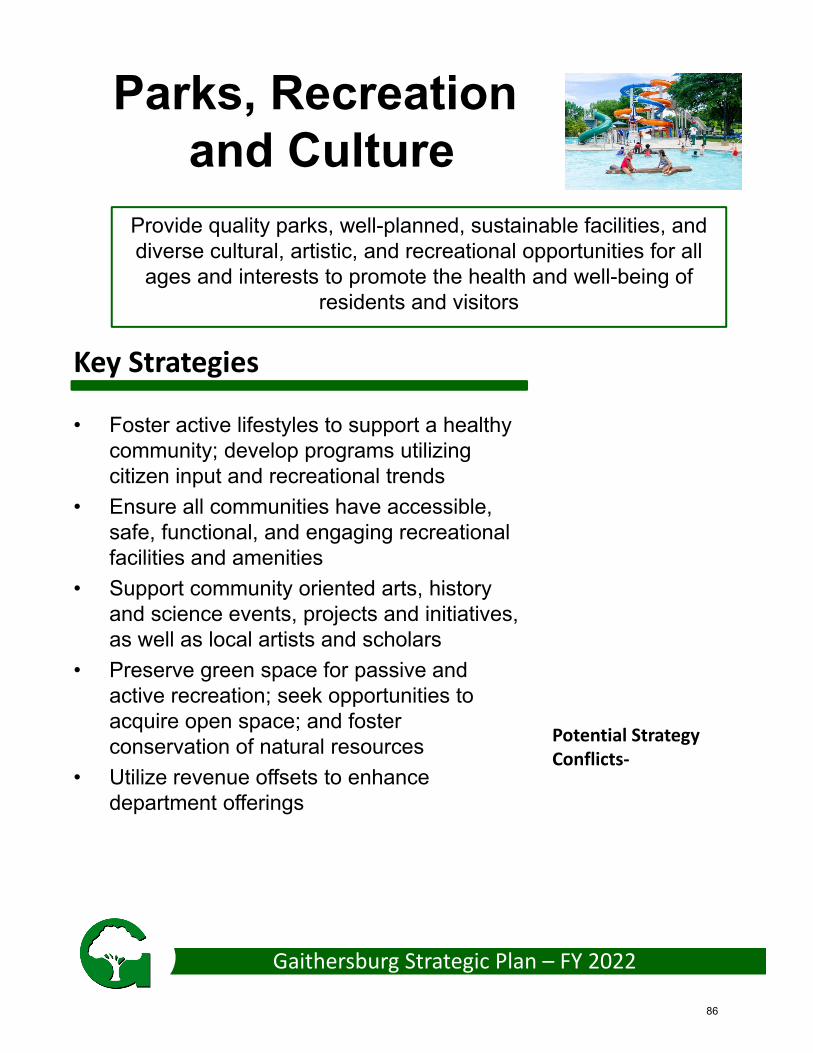
Key Strategies
Potential Strategy Conflicts‐
Gaithersburg Strategic Plan – FY 2022
Parks, Recreationand Culture
Provide quality parks, well-planned, sustainable facilities, and diverse cultural, artistic, and recreational opportunities for all ages and interests to promote the health and well-being of
residents and visitors
• Foster active lifestyles to support a healthy community; develop programs utilizing citizen input and recreational trends
• Ensure all communities have accessible, safe, functional, and engaging recreational facilities and amenities
• Support community oriented arts, history and science events, projects and initiatives, as well as local artists and scholars
• Preserve green space for passive and active recreation; seek opportunities to acquire open space; and foster conservation of natural resources
• Utilize revenue offsets to enhance department offerings
86
Objectives
Foster active lifestyles to support a healthy community; develop programs utilizing citizen input and recreational trends
• Provide in-person and virtual recreation and fitness classes, health and wellness programs, preventive screenings, sports, special events and arts programs, and other resources that promote a healthy lifestyle
• Provide quality out-of-school activities for City youth that promote enriching experiences
• Utilize various survey platforms as a means of measuring recreational trends and ensuring programs are relevant to the audience
• Utilize national standards to evaluate City recreation amenities relative to the Parks, Recreation and Open Space Plan
• Utilize Science, Technology, Engineering, Arts, and Math (STEAM) educational tools and outdoor educational offerings in youth activities at all age levels
• Provide resources to older adults who would benefit from programs and services that help them to stay healthy, engaged in their community, feel valued, and age in place
• Utilize standing committees, ad hoc committees, and focus groups for specific projects, programs and initiatives
• Provide excellent resources through personnel, equipment and supplies, fields, and facilities; promote good sportsmanship and teamwork while improving the physical and psychological well-being of participants
87
Objectives
• Continually evaluate recreational amenities, including virtual program options, relative to needs within existing communities
• Balance existing fields, parks, and amenities to meet current demand
• Meet and confer with City Planning and Code Administration staff to ensure optimal utilization of recreation space provided within new developments
• Work to ensure that shared-use trails, bike lanes and bike infrastructure are considered in the planning of road and infrastructure projects
• Work with federal, state and county government agencies as well as the private sector to fund new recreational facilities
• Ensure resident proximity to parks with a goal of less than .25 miles
• Coordinate with local agencies and organizations to publicize and encourage participation in free or reduced-fee programs
• Collaborate with Montgomery County Public Schools (MCPS) to continue the joint operation of the Gaithersburg Aquatic Center
• Identify under represented groups and promote participation, engagement and connectivity
• Reduce barriers for accessing information, recreational facilities and amenities
• Provide financial assistance for eligible City residents
Ensure all communities have accessible, safe, functional, and engaging recreational facilities and amenities
88
Objectives
Support community oriented arts, history and science events, projects and initiatives, as well as local artists and scholars
• Utilize the Art in Public Places program and a robust community engagement process to support a sense of place and pride for Gaithersburg
• Showcase community arts and heritage groups and artists in City arts programs and special events
• Implement the goals and objectives of the Cultural Arts Chapter of the Parks, Recreation and Culture (PRC) Element of the City’s Master Plan
• Partner with local, regional and national organizations to build strong science and history programs for schools and residents
• Utilize the City’s cultural assets and events to enhance Gaithersburg’s brand to residents, visitorsand new businesses
• Use multifaceted marketing strategies to increase awareness of the City’s cultural offerings
Preserve green space for passive and active recreation; seek opportunities to acquire open space; and foster conservation of natural resources
• Work with state and federal agencies to acquire surplus property
• Seek opportunities to acquire additional properties through purchases, partnerships and monetary contributions
• Cultivate an appreciation of the natural environment and the outdoors through recreational and camp offerings
• Provide technical assistance for community garden initiatives
• Engage patrons in good conservation and environmental stewardship practices
• Integrate nature-based activities and educational opportunities into City programs and events
• Integrate environmentally sustainable initiatives such as composting at large signature regional events
89
Objectives
Utilize revenue offsets to enhance department offerings
• Utilize the Gaithersburg Parks, Arts and Recreation Corporation (G-PARC) to support City parks, arts and recreation initiatives through fundraising, volunteer development, partnerships, and awareness campaign programs
• Develop new revenue streams and market-relevant fees for virtual programs while ensuring program quality is high
• Create a fee schedule that reflects local and national trends and appropriate market pricing for participation in programs and services
• Develop vested, working volunteers to support and promote large events, facilities and programs
• Develop active partners and in-kind support sponsors to share resources and to provide services and enhancements to City programs and events
• Leverage partnerships with foundations, agencies, and for-profit and nonprofit organizations to provide resources for the benefit of the community’s recreational needs
90
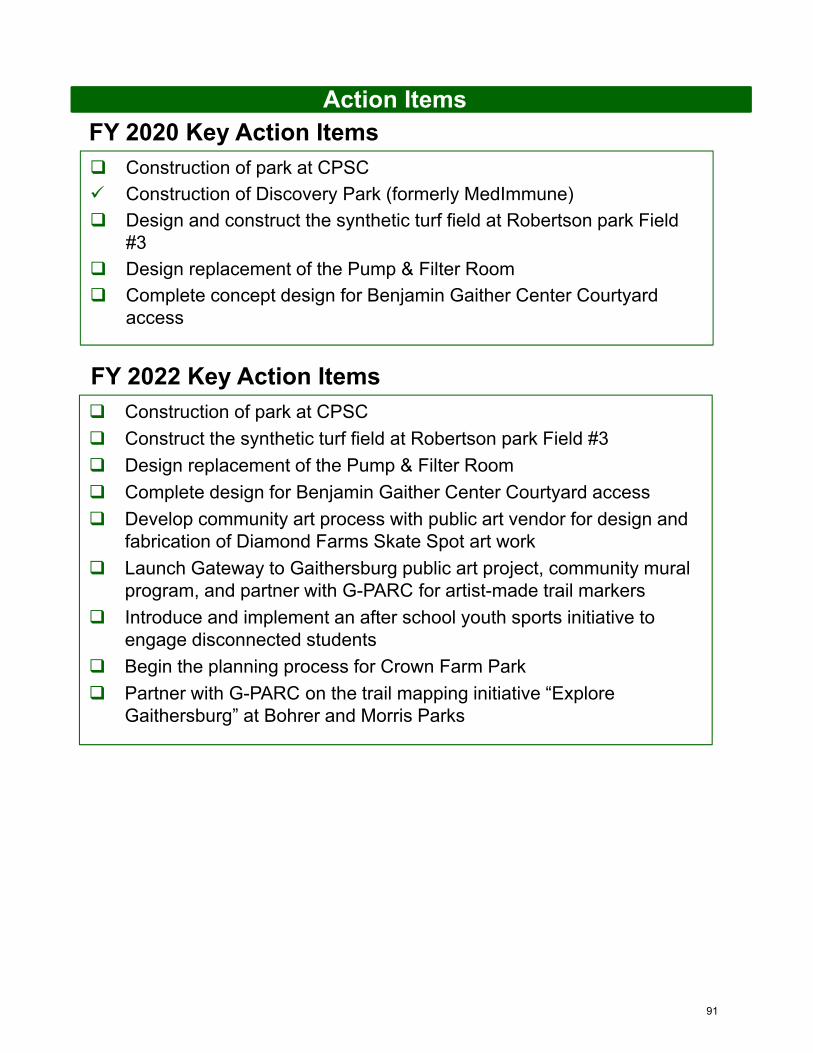
Action Items
Construction of park at CPSC
Construction of Discovery Park (formerly MedImmune)
Design and construct the synthetic turf field at Robertson park Field #3
Design replacement of the Pump & Filter Room
Complete concept design for Benjamin Gaither Center Courtyard access
FY 2020 Key Action Items
Construction of park at CPSC
Construct the synthetic turf field at Robertson park Field #3
Design replacement of the Pump & Filter Room
Complete design for Benjamin Gaither Center Courtyard access
Develop community art process with public art vendor for design and fabrication of Diamond Farms Skate Spot art work
Launch Gateway to Gaithersburg public art project, community mural program, and partner with G-PARC for artist-made trail markers
Introduce and implement an after school youth sports initiative to engage disconnected students
Begin the planning process for Crown Farm Park
Partner with G-PARC on the trail mapping initiative “Explore Gaithersburg” at Bohrer and Morris Parks
FY 2022 Key Action Items
91
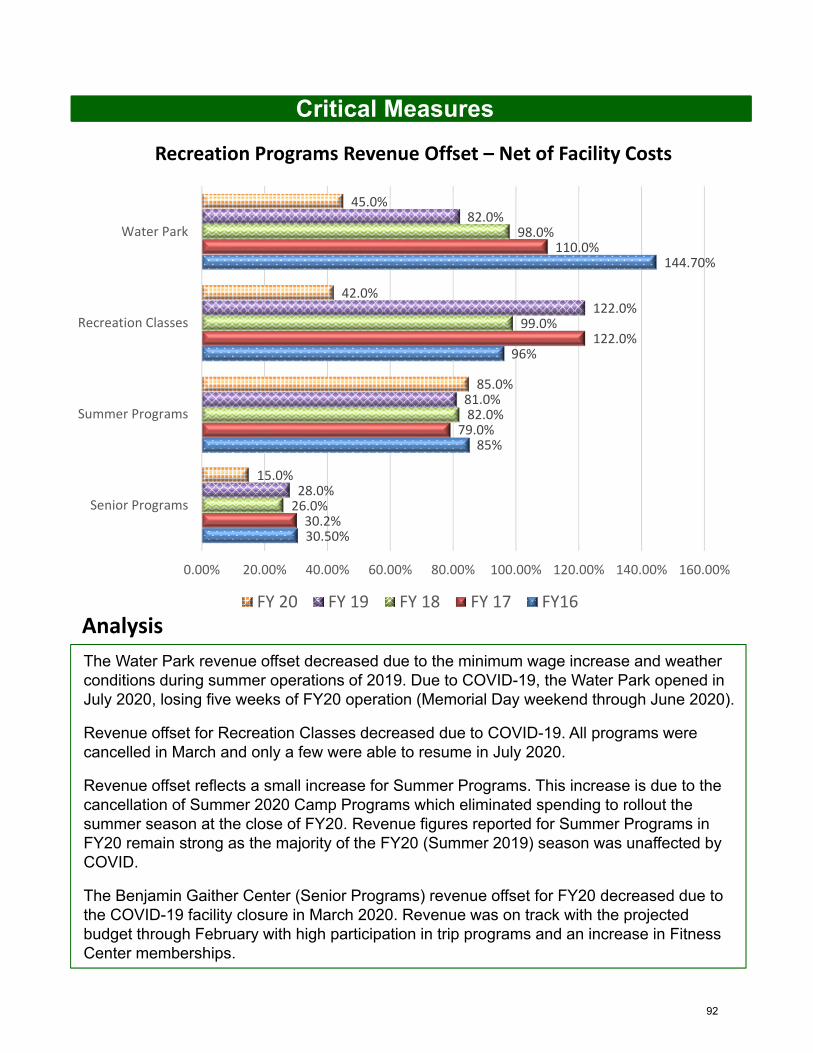
Critical Measures
Analysis
The Water Park revenue offset decreased due to the minimum wage increase and weather conditions during summer operations of 2019. Due to COVID-19, the Water Park opened in July 2020, losing five weeks of FY20 operation (Memorial Day weekend through June 2020).
Revenue offset for Recreation Classes decreased due to COVID-19. All programs were cancelled in March and only a few were able to resume in July 2020.
Revenue offset reflects a small increase for Summer Programs. This increase is due to the cancellation of Summer 2020 Camp Programs which eliminated spending to rollout the summer season at the close of FY20. Revenue figures reported for Summer Programs in FY20 remain strong as the majority of the FY20 (Summer 2019) season was unaffected by COVID.
The Benjamin Gaither Center (Senior Programs) revenue offset for FY20 decreased due to the COVID-19 facility closure in March 2020. Revenue was on track with the projected budget through February with high participation in trip programs and an increase in Fitness Center memberships.
Recreation Programs Revenue Offset – Net of Facility Costs
30.50%
85%
96%
144.70%
30.2%
79.0%
122.0%
110.0%
26.0%
82.0%
99.0%
98.0%
28.0%
81.0%
122.0%
82.0%
15.0%
85.0%
42.0%
45.0%
0.00% 20.00% 40.00% 60.00% 80.00% 100.00% 120.00% 140.00% 160.00%
Senior Programs
Summer Programs
Recreation Classes
Water Park
FY 20 FY 19 FY 18 FY 17 FY16
92
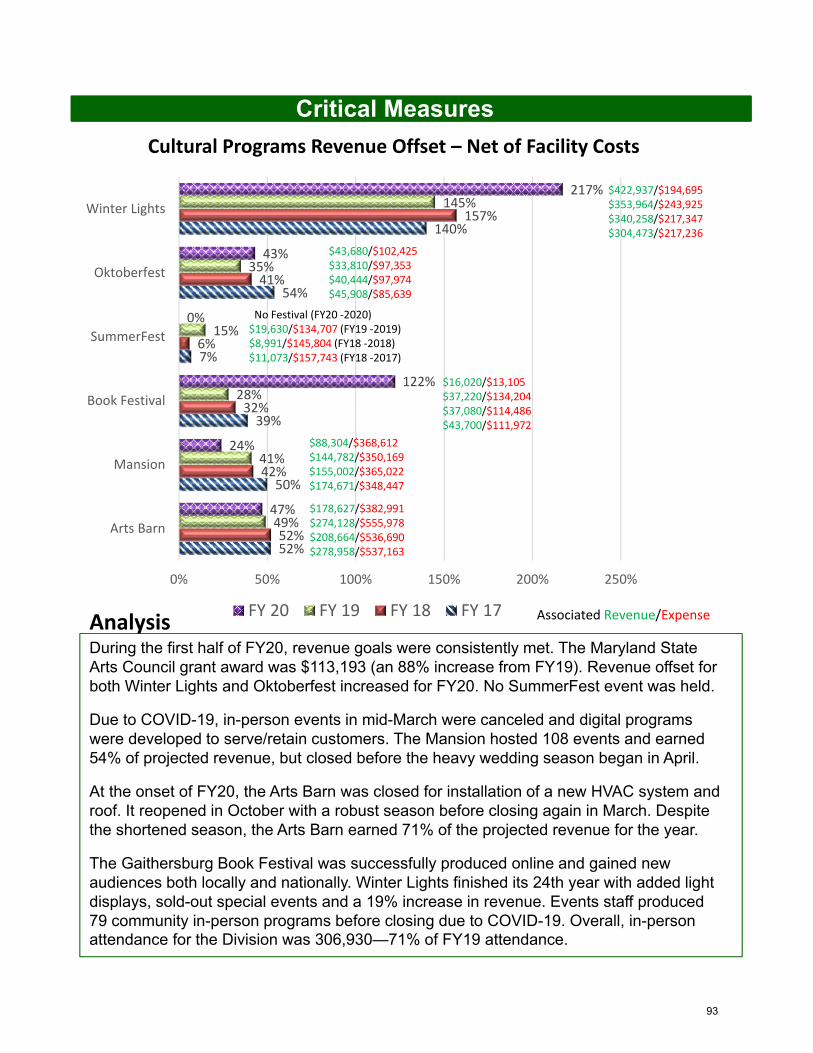
Critical Measures
Cultural Programs Revenue Offset – Net of Facility Costs
Analysis
52%
50%
39%
7%
54%
140%
52%
42%
32%
6%
41%
157%
49%
41%
28%
15%
35%
145%
47%
24%
122%
0%
43%
217%
0% 50% 100% 150% 200% 250%
Arts Barn
Mansion
Book Festival
SummerFest
Oktoberfest
Winter Lights
FY 20 FY 19 FY 18 FY 17
$178,627/$382,991$274,128/$555,978$208,664/$536,690$278,958/$537,163
$422,937/$194,695$353,964/$243,925$340,258/$217,347$304,473/$217,236
$43,680/$102,425$33,810/$97,353$40,444/$97,974$45,908/$85,639
No Festival (FY20 ‐2020)$19,630/$134,707 (FY19 ‐2019)$8,991/$145,804 (FY18 ‐2018)$11,073/$157,743 (FY18 ‐2017)
$16,020/$13,105$37,220/$134,204$37,080/$114,486$43,700/$111,972
$88,304/$368,612$144,782/$350,169$155,002/$365,022$174,671/$348,447
Associated Revenue/Expense
During the first half of FY20, revenue goals were consistently met. The Maryland State Arts Council grant award was $113,193 (an 88% increase from FY19). Revenue offset for both Winter Lights and Oktoberfest increased for FY20. No SummerFest event was held.
Due to COVID-19, in-person events in mid-March were canceled and digital programs were developed to serve/retain customers. The Mansion hosted 108 events and earned 54% of projected revenue, but closed before the heavy wedding season began in April.
At the onset of FY20, the Arts Barn was closed for installation of a new HVAC system and roof. It reopened in October with a robust season before closing again in March. Despite the shortened season, the Arts Barn earned 71% of the projected revenue for the year.
The Gaithersburg Book Festival was successfully produced online and gained new audiences both locally and nationally. Winter Lights finished its 24th year with added light displays, sold-out special events and a 19% increase in revenue. Events staff produced 79 community in-person programs before closing due to COVID-19. Overall, in-person attendance for the Division was 306,930—71% of FY19 attendance.
93
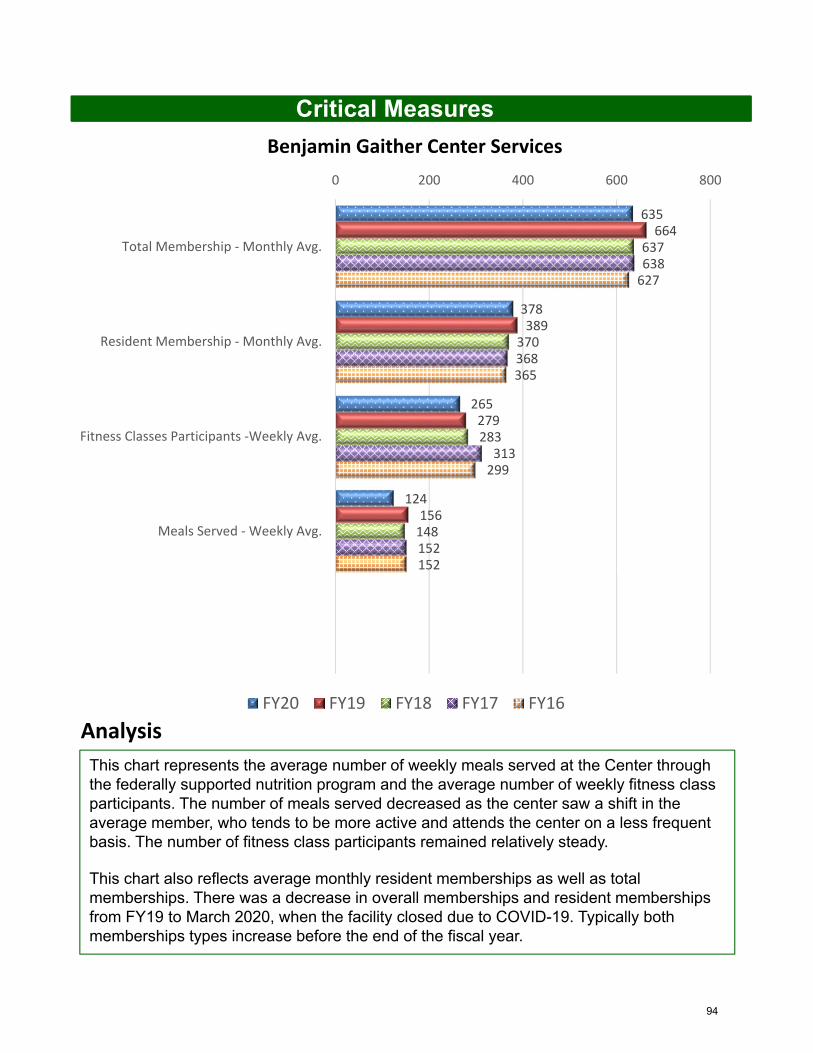
Critical Measures
Benjamin Gaither Center Services
Analysis
This chart represents the average number of weekly meals served at the Center through the federally supported nutrition program and the average number of weekly fitness class participants. The number of meals served decreased as the center saw a shift in the average member, who tends to be more active and attends the center on a less frequent basis. The number of fitness class participants remained relatively steady.
This chart also reflects average monthly resident memberships as well as total memberships. There was a decrease in overall memberships and resident memberships from FY19 to March 2020, when the facility closed due to COVID-19. Typically both memberships types increase before the end of the fiscal year.
635
378
265
124
664
389
279
156
637
370
283
148
638
368
313
152
627
365
299
152
0 200 400 600 800
Total Membership ‐ Monthly Avg.
Resident Membership ‐ Monthly Avg.
Fitness Classes Participants ‐Weekly Avg.
Meals Served ‐ Weekly Avg.
FY20 FY19 FY18 FY17 FY16
94
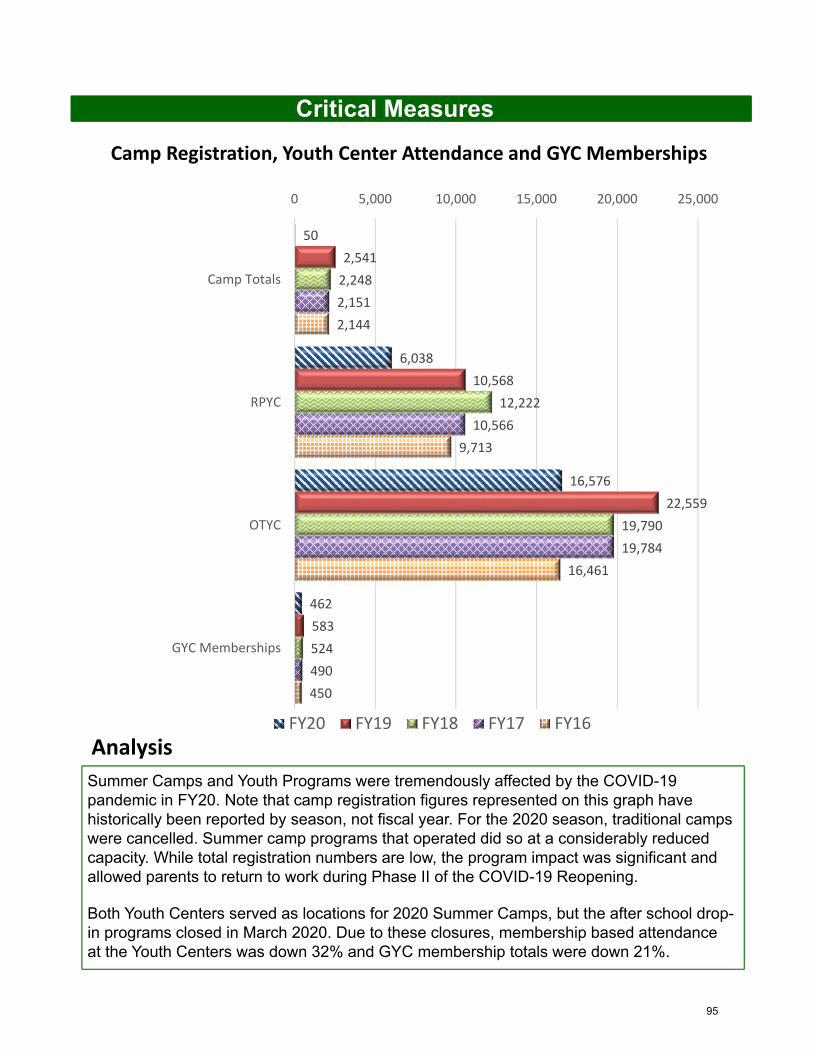
Critical Measures
Camp Registration, Youth Center Attendance and GYC Memberships
Analysis
Summer Camps and Youth Programs were tremendously affected by the COVID-19 pandemic in FY20. Note that camp registration figures represented on this graph have historically been reported by season, not fiscal year. For the 2020 season, traditional camps were cancelled. Summer camp programs that operated did so at a considerably reduced capacity. While total registration numbers are low, the program impact was significant and allowed parents to return to work during Phase II of the COVID-19 Reopening.
Both Youth Centers served as locations for 2020 Summer Camps, but the after school drop-in programs closed in March 2020. Due to these closures, membership based attendance at the Youth Centers was down 32% and GYC membership totals were down 21%.
50
6,038
16,576
462
2,541
10,568
22,559
583
2,248
12,222
19,790
524
2,151
10,566
19,784
490
2,144
9,713
16,461
450
0 5,000 10,000 15,000 20,000 25,000
Camp Totals
RPYC
OTYC
GYC Memberships
FY20 FY19 FY18 FY17 FY16
95
Key Strategies
Potential Strategy Conflicts‐
Gaithersburg Strategic Plan – FY 2022
Planning and Development
Ensure all planning and development is built and maintained in a high quality manner that utilizes sustainable principles to maintain the high quality of life enjoyed by residents and
businesses, while balancing environmental, transportation, economic, social, and civic needs
• Foster a high level of community and stakeholder involvement in planning and development
• Encourage high quality, aesthetically appealing development that adheres to City objectives for sustainable growth
• Ensure all aspects of development are completed with best practices management, code enforcement, the highest level of public safety, and high quality standards for public and private infrastructure and well-maintained neighborhoods
• Carefully weigh impacts of development and annexations on public infrastructure and the environment with the City’s economic development, sustainable growth, and quality of life objectives
• Promote housing stability and inclusiveness and maintain neighborhood vitality through quality infrastructure, community involvement, public safety, and neighborhood services
• Economic Development
• Housing
• Environment
• Transportation
96
Objectives
Foster a high level of community and stakeholder involvement in planning and development
• Utilize software, technology and web applications to enhance public use and information
• Foster dialogue with outside agencies to facilitate information exchange
• Ensure timely response to community and stakeholder issues in Planning & Code Administration and Department of Public Works –Engineering and Landscaping & Forestry Divisions
• Maintain communication with HOAs during construction projects and relative to code compliance issues
• Ensure that City Master Plans and other planning documents accurately reflect land use and municipal planning best practices and applicable state and federal requirements
• Continue implementation of approved design guidelines for MXD zoned developments and Olde Towne
• Ensure that constructed development emulates the vision and plans for the development as approved by the Planning Commission
• Identify properties that present opportunities for adding value to the City and aggressively pursue annexations
• Attract quality development by ensuring maintenance of existing neighborhoods
• Provide amenities in new neighborhoods and strive to add additional neighborhood amenities within established neighborhoods
Encourage high quality, aesthetically appealing development that adheres to City objectives for sustainable growth
97
ObjectivesEnsure all aspects of development are completed with best practices management, code enforcement, the highest level of public safety, and high quality standards for public and private infrastructure and well‐maintained neighborhoods
• Evaluate innovations and current trends in planning and development to update City codes and regulations in order to ensure safety
• Promote best management practices through training and education of staff, appointed and elected officials
• Minimize disruption to existing neighborhoods by phasing construction as needed
• Conduct thorough and timely reviews of Development Plans, License Applications, Construction Permits, and Inspections
• Provide safety program involving fire inspections of targeted high-hazard occupancies
• Ensure that the City’s planning and economic priorities are reflected in a balanced review of school and traffic facilities
• Designate Gaithersburg Enterprise Zone, Frederick Avenue Corridor and Lakeforest Mall as priority areas for redevelopment
• Ensure compatible development patterns that are phased and constructed in a manner that creates the least amount of disruption as part of the entitlements process
• Maintain and enhance the City’s Geographic Information System and its layers in conjunction with the Information Technology Department to provide mapping and statistical data as tools for reporting and evaluating existing and proposed development
• Continually review and revise Planning & Development Ordinances and Codes to ensure best management practices
• Work with partner agencies and jurisdictions concerning adequate public facilities; analyze results and recommend potential changes
Carefully weigh impacts of development and annexations on public infrastructure and the environment with the City’s economic development, sustainable growth and quality of life objectives
98
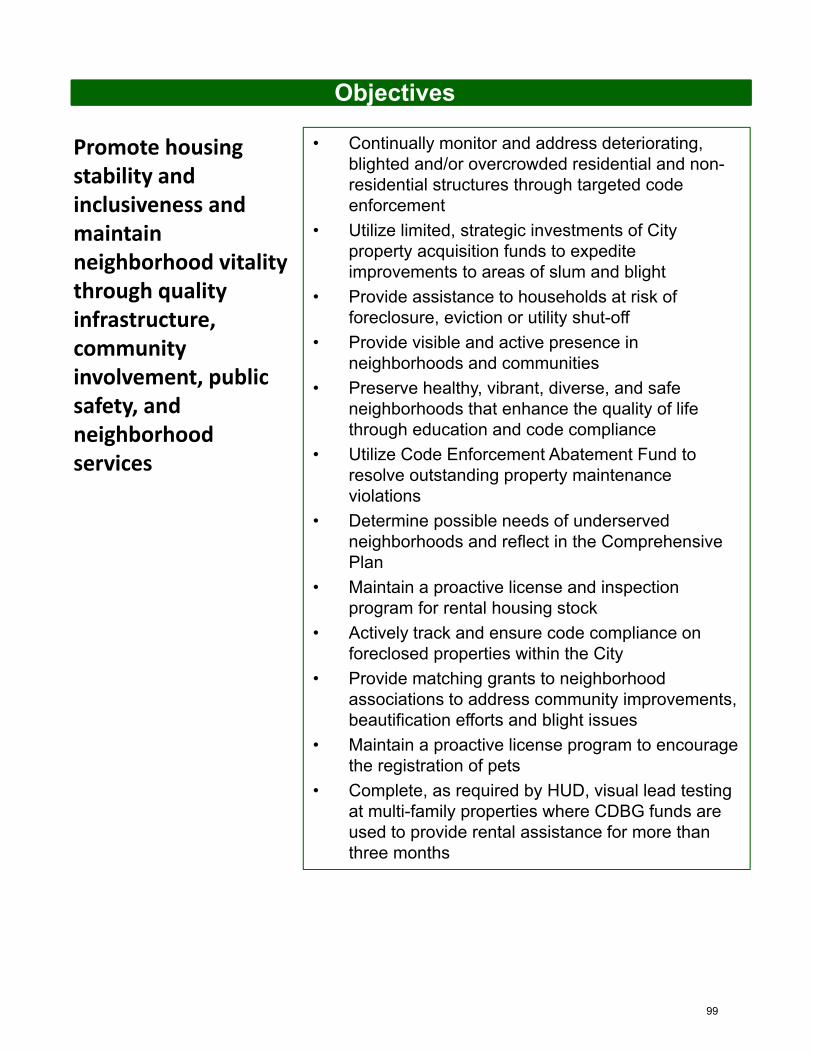
Objectives
Promote housing stability and inclusiveness and maintain neighborhood vitality through quality infrastructure, community involvement, public safety, and neighborhood services
• Continually monitor and address deteriorating, blighted and/or overcrowded residential and non-residential structures through targeted code enforcement
• Utilize limited, strategic investments of City property acquisition funds to expedite improvements to areas of slum and blight
• Provide assistance to households at risk of foreclosure, eviction or utility shut-off
• Provide visible and active presence in neighborhoods and communities
• Preserve healthy, vibrant, diverse, and safe neighborhoods that enhance the quality of life through education and code compliance
• Utilize Code Enforcement Abatement Fund to resolve outstanding property maintenance violations
• Determine possible needs of underserved neighborhoods and reflect in the Comprehensive Plan
• Maintain a proactive license and inspection program for rental housing stock
• Actively track and ensure code compliance on foreclosed properties within the City
• Provide matching grants to neighborhood associations to address community improvements, beautification efforts and blight issues
• Maintain a proactive license program to encourage the registration of pets
• Complete, as required by HUD, visual lead testing at multi-family properties where CDBG funds are used to provide rental assistance for more than three months
99
Action Items
FY 2021 Key Action Items
Present 2015 IPMC Property Maintenance Code (Chapter 17AA of the City Code) for adoption
Update and present Tree Manual for adoption
Transition from Energov’s (City’s permitting software) Citizen’s Access Port (CAP) to Customer Self-Service (CSS) account
Finalize and present Parking Permit Program ordinance (Chapter 14) for adoption
Review current historic designation of City park at Crown and explore uses
Facilitate next steps in the Lakeforest Mall redevelopment
Present 2015 IPMC Property Maintenance Code (Chapter 17AA of the City Code) for adoption
Update and present Tree Manual for adoption
Transition from Energov’s (City’s permitting software) Citizen’s Access Port (CAP) to Customer Self-Service (CSS) account
Evaluate Chapter 13 - Landlord-Tenant Relations and present amendments for adoption
Present 2021 ICC codes and City Amendments (Chapters 5, 7 and 11) for adoption
Complete draft Housing Element: an amendment to the City’s Master Plan
Adopt Lakeforest Mall Master Plan
FY 2022 Key Action Items
100
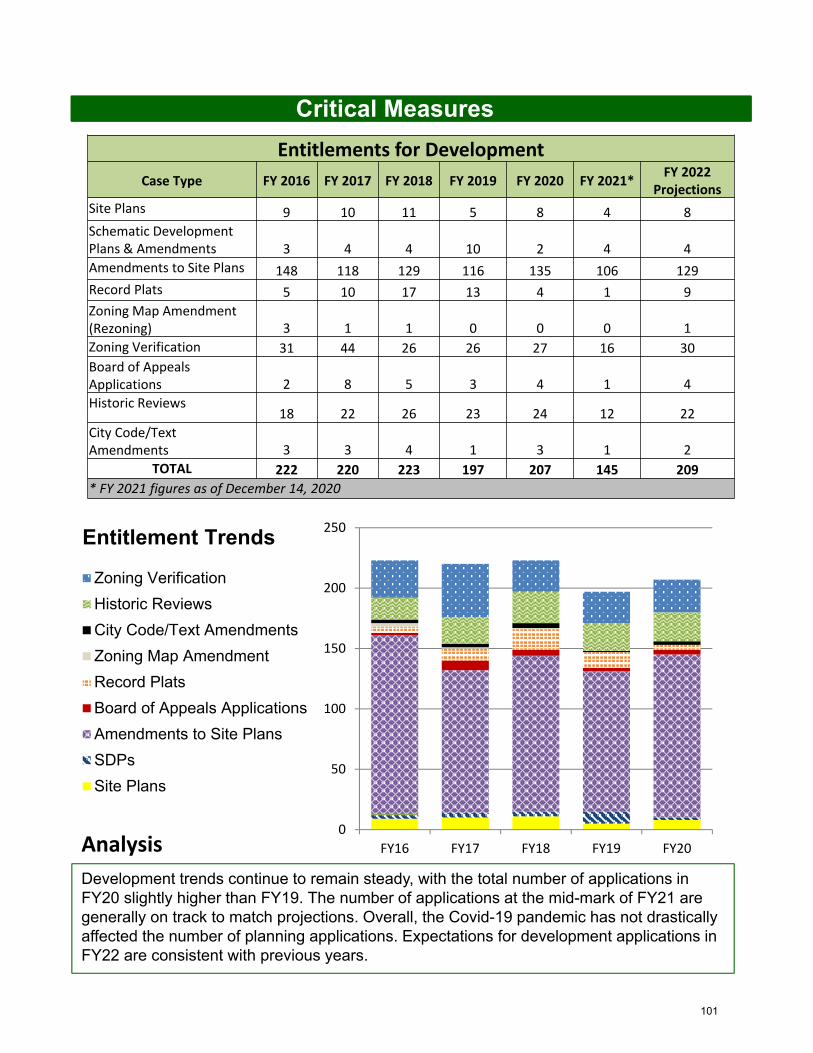
Critical Measures
Development trends continue to remain steady, with the total number of applications in FY20 slightly higher than FY19. The number of applications at the mid-mark of FY21 are generally on track to match projections. Overall, the Covid-19 pandemic has not drastically affected the number of planning applications. Expectations for development applications in FY22 are consistent with previous years.
Analysis
Entitlements for Development
Case Type FY 2016 FY 2017 FY 2018 FY 2019 FY 2020 FY 2021*FY 2022
Projections
Site Plans 9 10 11 5 8 4 8
Schematic Development Plans & Amendments 3 4 4 10 2 4 4
Amendments to Site Plans 148 118 129 116 135 106 129
Record Plats 5 10 17 13 4 1 9
Zoning Map Amendment (Rezoning) 3 1 1 0 0 0 1
Zoning Verification 31 44 26 26 27 16 30
Board of Appeals Applications 2 8 5 3 4 1 4
Historic Reviews18 22 26 23 24 12 22
City Code/Text Amendments 3 3 4 1 3 1 2
TOTAL 222 220 223 197 207 145 209
* FY 2021 figures as of December 14, 2020
0
50
100
150
200
250
FY16 FY17 FY18 FY19 FY20
Zoning Verification
Historic Reviews
City Code/Text Amendments
Zoning Map Amendment
Record Plats
Board of Appeals Applications
Amendments to Site Plans
SDPs
Site Plans
Entitlement Trends
101
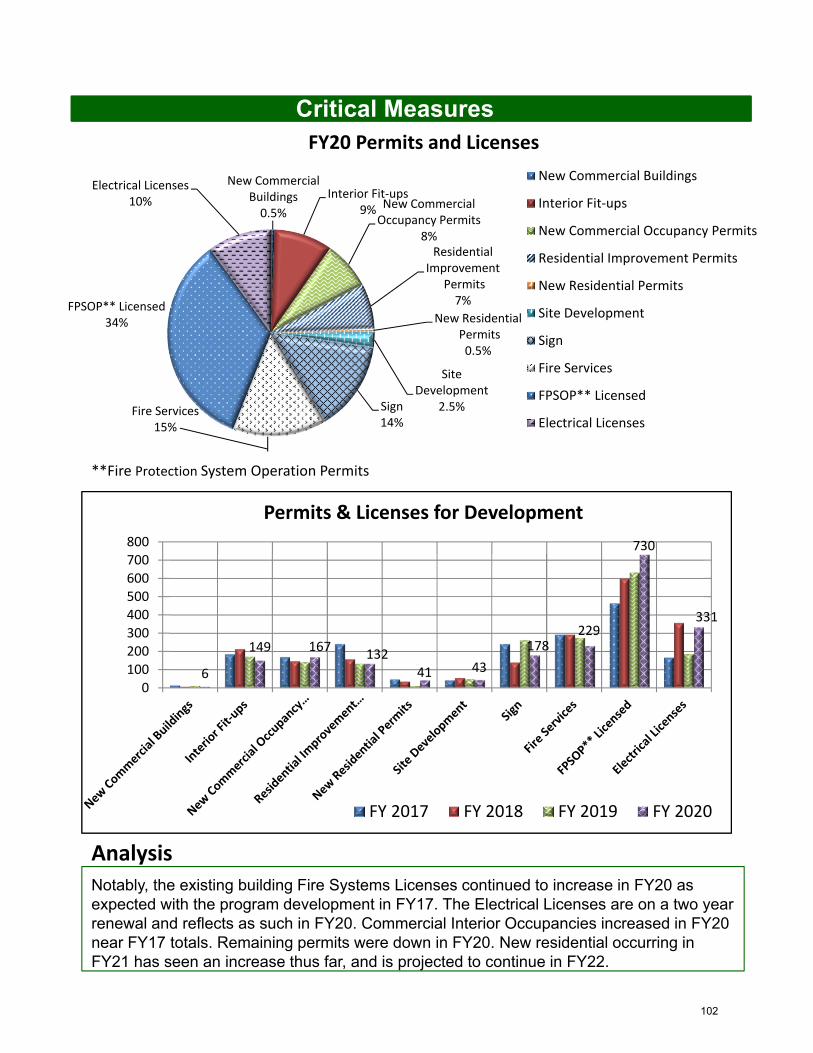
Critical Measures
Analysis
**Fire Protection System Operation Permits
FY FYFYFY20 Permits and Licenses
New CommercialBuildings0.5%
Interior Fit‐ups9% New Commercial
Occupancy Permits8%Residential
ImprovementPermits7%
New ResidentialPermits0.5%
Site Development
2.5%Sign14%
Fire Services15%
FPSOP** Licensed34%
Electrical Licenses10%
New Commercial Buildings
Interior Fit‐ups
New Commercial Occupancy Permits
Residential Improvement Permits
New Residential Permits
Site Development
Sign
Fire Services
FPSOP** Licensed
Electrical Licenses
6
149 167132
41 43
178229
730
331
0
100
200300
400
500600
700800
Permits & Licenses for Development
FY 2017 FY 2018 FY 2019 FY 2020
Notably, the existing building Fire Systems Licenses continued to increase in FY20 as expected with the program development in FY17. The Electrical Licenses are on a two year renewal and reflects as such in FY20. Commercial Interior Occupancies increased in FY20 near FY17 totals. Remaining permits were down in FY20. New residential occurring in FY21 has seen an increase thus far, and is projected to continue in FY22.
102
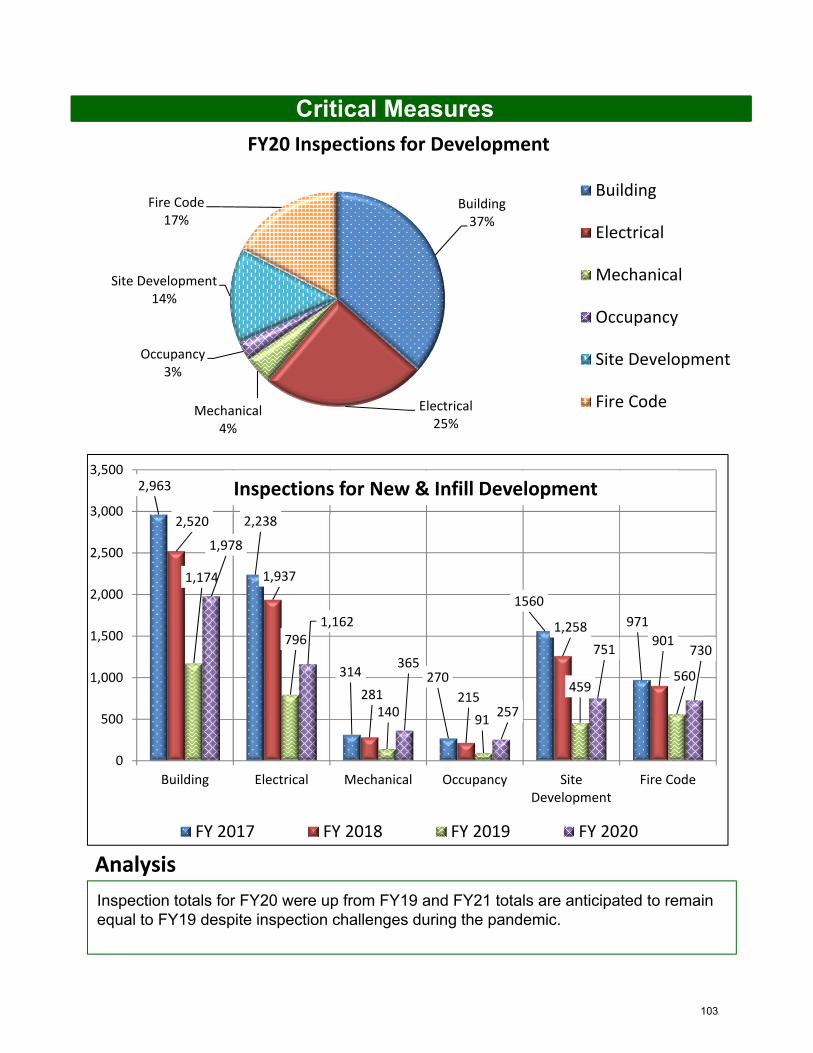
Critical Measures
Analysis
2,963
2,238
314 270
1560
971
2,520
1,937
281 215
1,258901
1,174
796
14091
459560
1,978
1,162
365
257
751 730
0
500
1,000
1,500
2,000
2,500
3,000
3,500
Building Electrical Mechanical Occupancy SiteDevelopment
Fire Code
FY 2017 FY 2018 FY 2019 FY 2020
Inspections for New & Infill Development
Building37%
Electrical25%
Mechanical4%
Occupancy3%
Site Development14%
Fire Code17%
FY20 Inspections for Development
Building
Electrical
Mechanical
Occupancy
Site Development
Fire Code
Inspection totals for FY20 were up from FY19 and FY21 totals are anticipated to remain equal to FY19 despite inspection challenges during the pandemic.
103
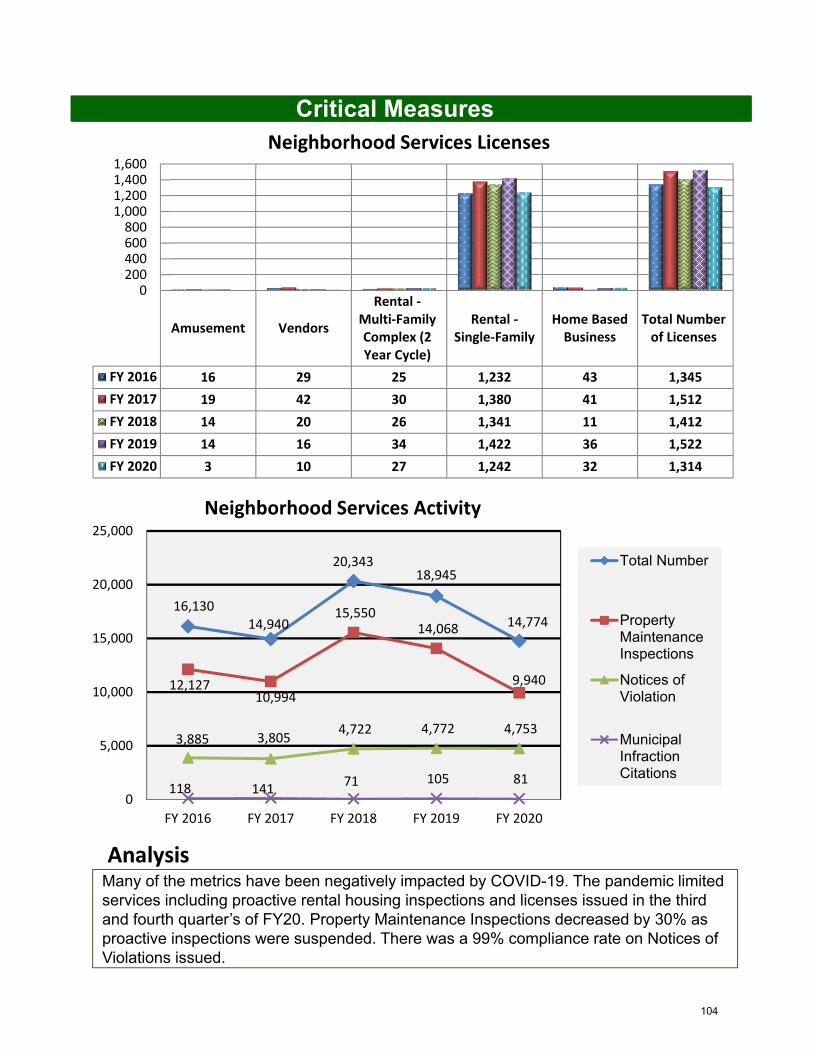
Critical Measures
Many of the metrics have been negatively impacted by COVID-19. The pandemic limited services including proactive rental housing inspections and licenses issued in the third and fourth quarter’s of FY20. Property Maintenance Inspections decreased by 30% as proactive inspections were suspended. There was a 99% compliance rate on Notices of Violations issued.
Amusement Vendors
Rental ‐Multi‐FamilyComplex (2Year Cycle)
Rental ‐Single‐Family
Home BasedBusiness
Total Numberof Licenses
FY 2016 16 29 25 1,232 43 1,345
FY 2017 19 42 30 1,380 41 1,512
FY 2018 14 20 26 1,341 11 1,412
FY 2019 14 16 34 1,422 36 1,522
FY 2020 3 10 27 1,242 32 1,314
0200400600800
1,0001,2001,4001,600
Neighborhood Services Licenses
16,13014,940
20,34318,945
14,774
12,127 10,994
15,550 14,068
9,940
3,885 3,805 4,722 4,772 4,753
118 141 71 105 81
0
5,000
10,000
15,000
20,000
25,000
FY 2016 FY 2017 FY 2018 FY 2019 FY 2020
Neighborhood Services Activity
Total Number
PropertyMaintenanceInspections
Notices ofViolation
MunicipalInfractionCitations
104
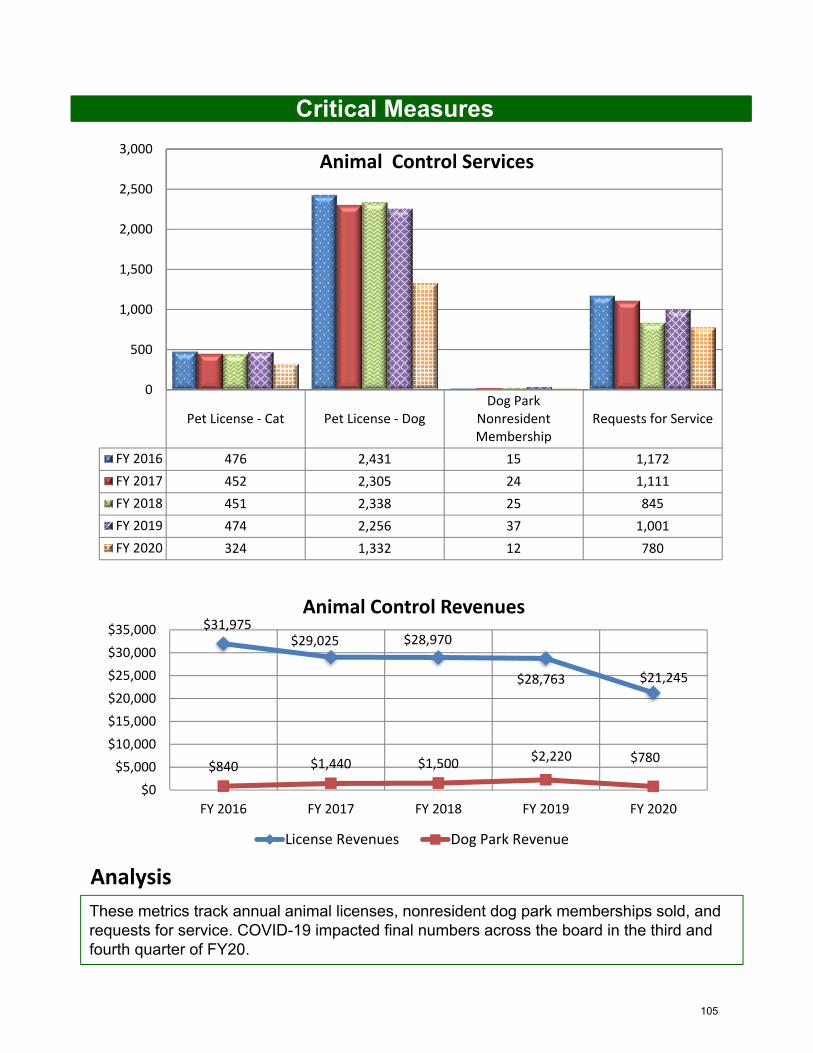
Critical Measures
These metrics track annual animal licenses, nonresident dog park memberships sold, and requests for service. COVID-19 impacted final numbers across the board in the third and fourth quarter of FY20.
Analysis
Pet License ‐ Cat Pet License ‐ DogDog Park
NonresidentMembership
Requests for Service
FY 2016 476 2,431 15 1,172
FY 2017 452 2,305 24 1,111
FY 2018 451 2,338 25 845
FY 2019 474 2,256 37 1,001
FY 2020 324 1,332 12 780
0
500
1,000
1,500
2,000
2,500
3,000Animal Control Services
$31,975$29,025 $28,970
$28,763 $21,245
$840 $1,440 $1,500$2,220 $780
$0
$5,000
$10,000
$15,000
$20,000
$25,000
$30,000
$35,000
FY 2016 FY 2017 FY 2018 FY 2019 FY 2020
Animal Control Revenues
License Revenues Dog Park Revenue
105
Key Strategies
Potential Strategy Conflicts‐
Gaithersburg Strategic Plan – FY 2022
Police Department
Safeguard the lives of those within the City, enforce the laws and ordinances of the State of Maryland and the City of
Gaithersburg, protect property, maintain the safe and orderly flow of traffic, and assist in securing, for all persons, equal
protection of the law
• Deliver comprehensive police services that prevent and reduce crime and sustain the quality of life in the City
• Enhance the establishment of highly skilled and diverse professionals capable of providing comprehensive and effective police services
• Work in partnership with communities, government agencies and allied organizations to augment the Department’s resources and improve delivery of comprehensive police services
• Employ new and advanced technologies to improve the delivery of quality police service
• Continually build community trust in the Police Department
106
Objectives
Deliver comprehensive police services that prevent and reduce crime and sustain the quality of life in the City
• Work with communities to reduce crime, maintain order, solve community problems, and respond to incidents that affect the quality of life
• Utilize the Data Driven Approach to Crime and Traffic Safety (DDACTS)
• Employ operational tactics resulting from careful analysis of the link between illegal drugs, including their distribution patterns and crime
• Acknowledge that the incidence of traffic accidents results in more deaths, injuries and property loss than criminal incidents. Dedicate appropriate Department resources toward the reduction of speeding and impaired driving. Encourage pedestrian safety and the proper usage of occupant protection
• Coordinate with Montgomery County Police 6th
District personnel to maximize services, visibility and effectiveness of our personnel
• Keep the public informed of the Department’s activities through outreach activities, social media and accessible statistics
107
Objectives
Enhance the establishment of highly skilled and diverse professionals capable of providing comprehensive and effective police services
• Focus on the development of professional staff and ensure that their accomplishments are recognized both internally and externally
• Enhance recruiting efforts by utilizing social media sites and job fairs to select suitable candidates for vacant positions. Our goal is to attract, select and retain the best qualified person(s) regardless of race, color, sex, national origin, or religion
• Continue professional development of internal leadership, enhancement of management and decision making skills, and improved communication in the face of the increasing complexity of the law enforcement profession
• Utilize performance evaluation and tracking systems that provide employees with timely feedback and career guidance
• Continually evaluate specialized units and personnel to adapt to changing demands
• Provide a mentoring program to all newly promoted supervisors
• Provide every officer with a variety of scenario-based training that covers a diverse range of incidents and training objectives, such as use of force, de-escalation techniques and mental health training
• Expand recruitment and retention initiatives to secure adequate pool of candidates and officers
108
Objectives
Work in partnership with communities, government agencies and allied organizations to augment the Department’s resources and improve delivery of comprehensive police services
• Ensure that the Continuity of Operation Plan (COOP) is up to date and its components are readily accessible
• Ensure the highest level of preparedness by providing opportunities for disaster response exercises and National Incident Management System/Incident Command System (NIMS/ICS) training
• Maintain strong partnerships with schools in the City
• Enhance relationships with non-English speaking communities and citizens
• Maintain support for Neighborhood Watch programs throughout the City
• Recognize community members for their contributions to the safety and well-being of the community
• Emphasize cooperative, proactive media relations as a means of advancing the goals of the Department
• Work with Montgomery County and the Alert Gaithersburg notification system vendor to ensure timely and accurate information is provided to internal and external customers
• Work with the Gaithersburg Police Foundation (GPF) in funding programs and activities that promote public safety and community partnership
• Work with other local governments and public utilities to coordinate responses to disasters and emergencies
109
Objectives
Employ new and advanced technologies to improve the delivery of quality police services
• Employ the Data Driven Approaches to Crime and Traffic Safety (DDACTS) model in the deployment of resources
• Utilize automated technology tools such as license plate readers, surveillance cameras, cell phone data extraction analysis, and speed cameras to supplement police personnel resources
• Utilize biometric field resources to aid investigators and patrol personnel in the rapid and accurate identification of offenders
• Use technology tools to measure and report crime statistics to accurately portray crime in individual neighborhoods
• Ensure control and accountability of property/evidence, Department equipment and fleet resources through the utilization of modern tracking and inventory systems
• Use body worn cameras to promote transparency and accountability
• Foster and adopt procedural justice as a guiding principle for internal and external policies and practices
• Maintain an organizational culture of transparency and accountability
• Provide a diverse workforce that covers a broad range of cultures and life experiences to improve understanding and effectiveness in dealing with all communities
Continually build community trust in the Police Department
110
Action Items
Identify highly motivated candidates between the ages of 18 and 20 years old who are interested in a future career as a Gaithersburg Police Officer for the position of Police Cadet
Implement Fair and Impartial Policing training to officers and develop a written policy that is consistent with the training received and community expectations
Demonstrate compliance with all applicable standards in order to obtain re-accreditation for the department by the Commission on Accreditation for Law Enforcement Agencies (CALEA)
Implement Focused Enforcement Area initiatives focused on specific geographical areas within the City to strengthen the working relationships between the department, citizens and businesses in those areas
Evaluate current operations and make any necessary adjustments to facilitate the move to the new police station at 16 South Summit Avenue
FY 2021 Key Action Items
Implement Fair and Impartial Policing training to officers and develop a written policy that is consistent with the training received and community expectations
Ensure department training objectives and policies are updated to coincide with police reform legislation and Maryland Police and Correctional Training Commission Standards
Include de-escalation training that contains decision-making exercises into all use of force training venues for firearms, Taser, and defensive tactics
Ensure open communications with community organizers and the public through quarterly meetings (at a minimum) for the purpose of preserving strong relationships of mutual trust between the department and the communities we serve
Recruit and hire four police officers to enable the department to remain at authorized staffing levels
FY 2022 Key Action Items
111
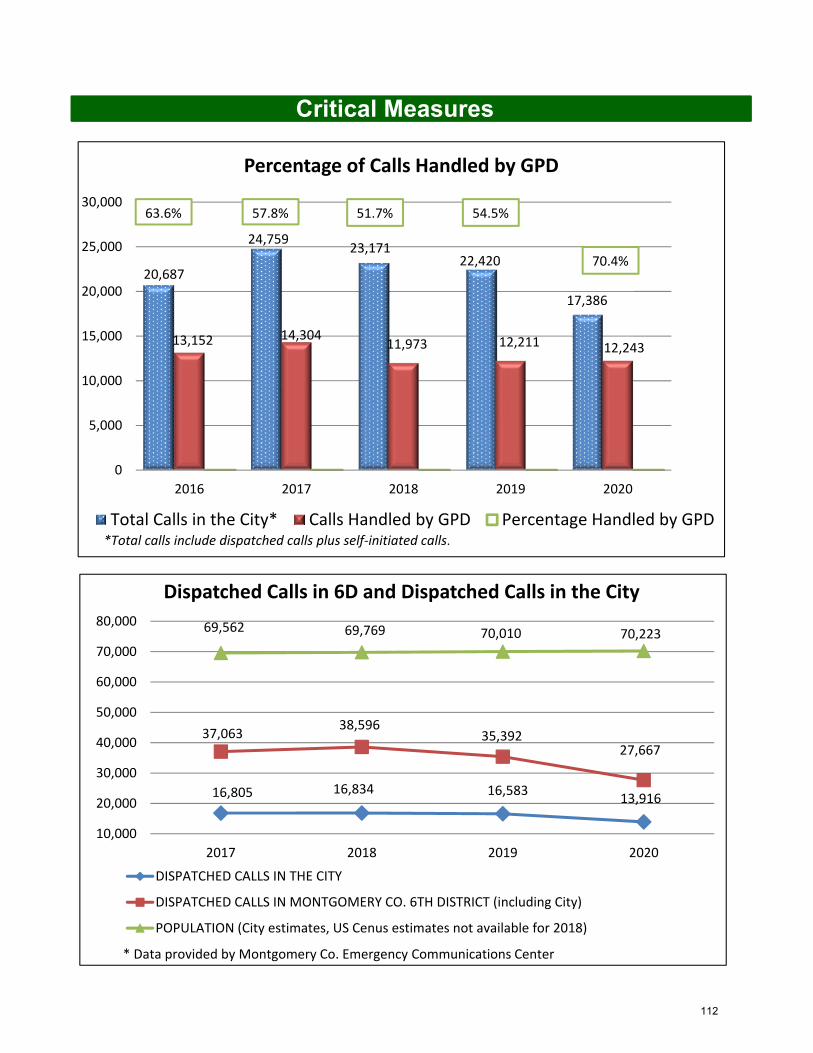
Critical Measures
20,687
24,75923,171
22,420
17,386
13,152 14,30411,973 12,211 12,243
0
5,000
10,000
15,000
20,000
25,000
30,000
2016 2017 2018 2019 2020
Percentage of Calls Handled by GPD
Total Calls in the City* Calls Handled by GPD Percentage Handled by GPD
63.6% 57.8% 51.7%
70.4%
*Total calls include dispatched calls plus self‐initiated calls.
16,805 16,834 16,58313,916
37,06338,596
35,39227,667
69,562 69,769 70,010 70,223
10,000
20,000
30,000
40,000
50,000
60,000
70,000
80,000
2017 2018 2019 2020
Dispatched Calls in 6D and Dispatched Calls in the City
DISPATCHED CALLS IN THE CITY
DISPATCHED CALLS IN MONTGOMERY CO. 6TH DISTRICT (including City)
POPULATION (City estimates, US Cenus estimates not available for 2018)
* Data provided by Montgomery Co. Emergency Communications Center
54.5%
112
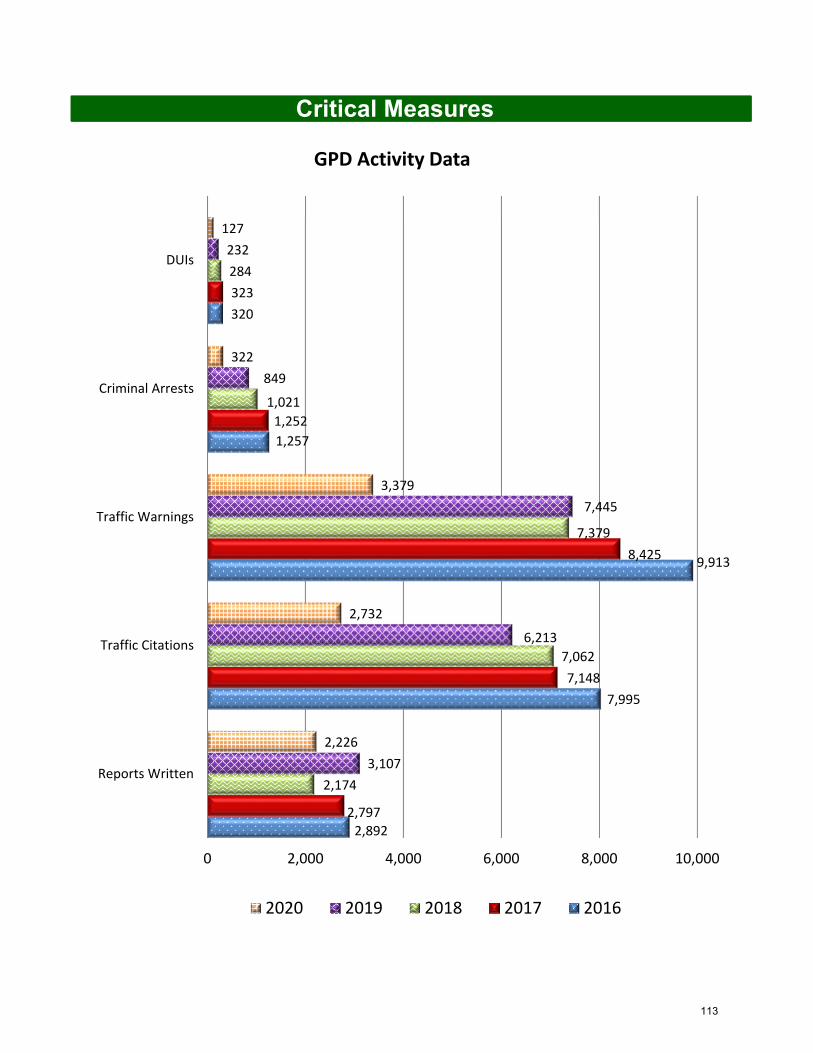
Critical Measures
2,892
7,995
9,913
1,257
320
2,797
7,148
8,425
1,252
323
2,174
7,062
7,379
1,021
284
3,107
6,213
7,445
849
232
2,226
2,732
3,379
322
127
0 2,000 4,000 6,000 8,000 10,000
Reports Written
Traffic Citations
Traffic Warnings
Criminal Arrests
DUIs
GPD Activity Data
2020 2019 2018 2017 2016
113
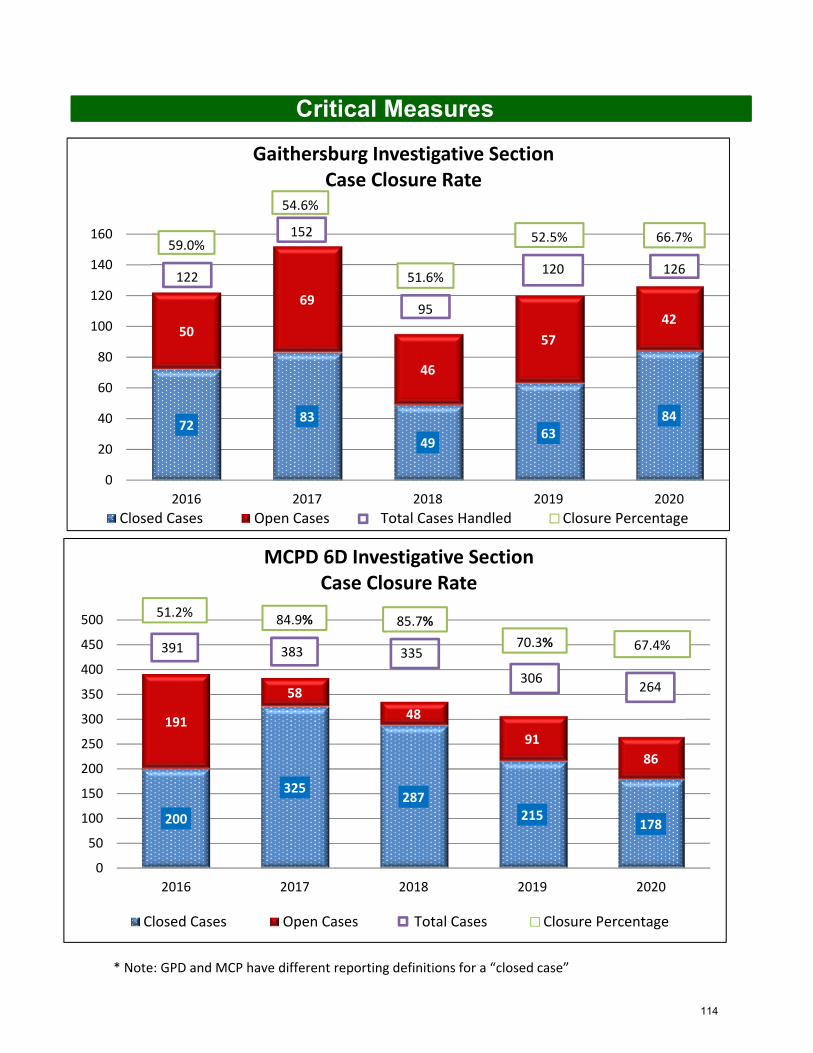
Critical Measures
7283
4963
84
50
69
46
57
42
0
20
40
60
80
100
120
140
160
2016 2017 2018 2019 2020
Gaithersburg Investigative SectionCase Closure Rate
Closed Cases Open Cases Total Cases Handled Closure Percentage
51.6%
54.6%
52.5%152
95
120 126
66.7%59.0%
122
200
325287
215178
191
58
48
91
86
0
50
100
150
200
250
300
350
400
450
500
2016 2017 2018 2019 2020
MCPD 6D Investigative SectionCase Closure Rate
Closed Cases Open Cases Total Cases Closure Percentage
84.9% 85.7%
306
70.3% 67.4%335
264
51.2%
383
* Note: GPD and MCP have different reporting definitions for a “closed case”
391
114
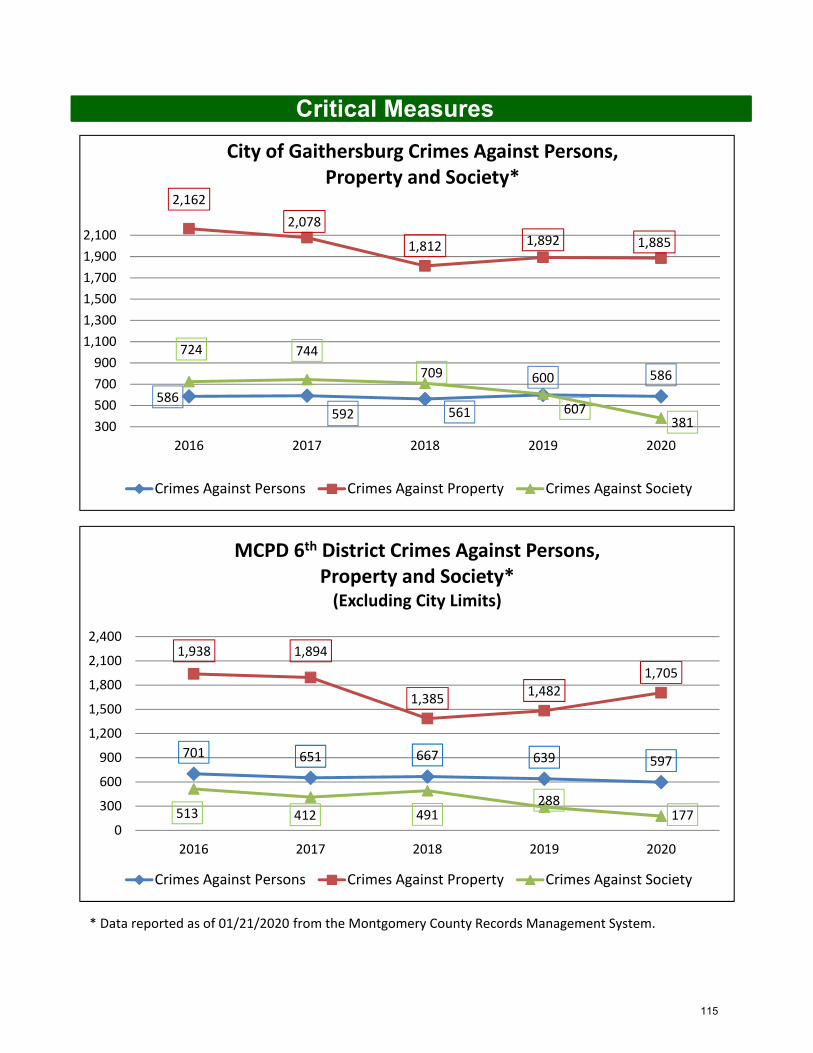
Critical Measures
586592 561
600 586
2,162
2,078
1,812 1,892 1,885
724 744
709
607381300
500
700
900
1,100
1,300
1,500
1,700
1,900
2,100
2016 2017 2018 2019 2020
City of Gaithersburg Crimes Against Persons, Property and Society*
Crimes Against Persons Crimes Against Property Crimes Against Society
701 651 667 639 597
1,938 1,894
1,3851,482
1,705
513 412 491288
1770
300
600
900
1,200
1,500
1,800
2,100
2,400
2016 2017 2018 2019 2020
MCPD 6th District Crimes Against Persons, Property and Society* (Excluding City Limits)
Crimes Against Persons Crimes Against Property Crimes Against Society
* Data reported as of 01/21/2020 from the Montgomery County Records Management System.
115
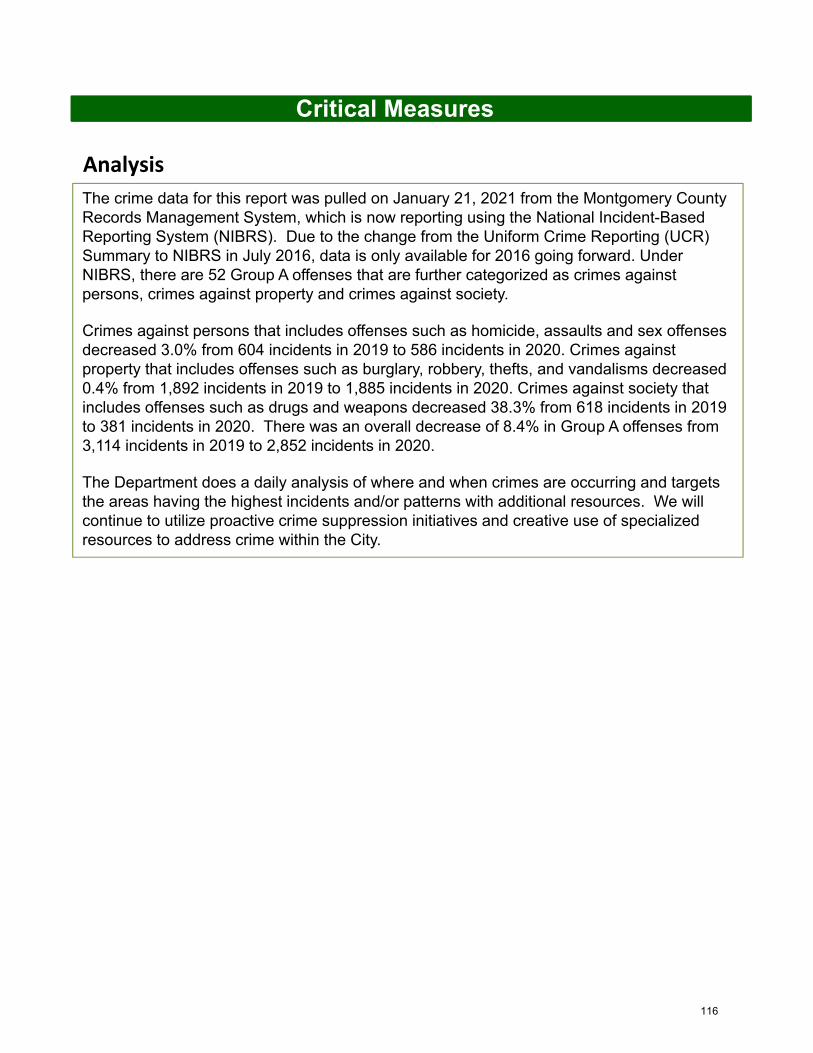
Critical Measures
Analysis
The crime data for this report was pulled on January 21, 2021 from the Montgomery County Records Management System, which is now reporting using the National Incident-Based Reporting System (NIBRS). Due to the change from the Uniform Crime Reporting (UCR) Summary to NIBRS in July 2016, data is only available for 2016 going forward. Under NIBRS, there are 52 Group A offenses that are further categorized as crimes against persons, crimes against property and crimes against society.
Crimes against persons that includes offenses such as homicide, assaults and sex offenses decreased 3.0% from 604 incidents in 2019 to 586 incidents in 2020. Crimes against property that includes offenses such as burglary, robbery, thefts, and vandalisms decreased 0.4% from 1,892 incidents in 2019 to 1,885 incidents in 2020. Crimes against society that includes offenses such as drugs and weapons decreased 38.3% from 618 incidents in 2019 to 381 incidents in 2020. There was an overall decrease of 8.4% in Group A offenses from 3,114 incidents in 2019 to 2,852 incidents in 2020.
The Department does a daily analysis of where and when crimes are occurring and targets the areas having the highest incidents and/or patterns with additional resources. We will continue to utilize proactive crime suppression initiatives and creative use of specialized resources to address crime within the City.
116
Key Strategies
Potential Strategy Conflicts‐
Gaithersburg Strategic Plan – FY 2022
Transportation
Implement equitable transportation planning and management strategies that provide a safe and convenient multimodal
transportation system
• Preserve and maintain local transportation infrastructure to enhance safety and contain capital costs
• Reduce automobile dependence by facilitating multimodal transportation options
• Take a leading role in advancing transportation goals both in Gaithersburg and regionally
• Ensure safety on neighborhood roads through the use of appropriate engineering, enforcement, education, and evaluation practices
• Ensure attractiveness and viability of streetscape and associated amenities
• Economic Development
• Sustainability
117
Objectives
Preserve and maintain local transportation infrastructure to enhance safety and contain capital costs
• Conduct regular inspections of streets and sidewalks to develop a current transportation infrastructure condition assessment
• Prioritize routine and preventive maintenance as well as rehabilitation efforts to minimize major reconstruction projects
• Improve lighting in older neighborhoods through the use of infill lighting; ensure light outages are repaired in a timely manner
• Maintain all traffic control devices at a level consistent with industry standards
• Ensure roadway elements are in compliance with current ADA guidelines
• Ensure improvements distributed throughout the City
• Facilitate citizen involvement in reporting and monitoring City maintenance efforts
• Continually update snow and ice removal processes relating to efficiency and effectiveness
• Encourage increased transit ridership by the expansion of the shelter and bench installation program
• Work with Montgomery County to maintain or improve current Ride-On service levels in the City
• Work with Maryland Department of Transportation to support increased MARC rail service
• Support alternate modes of transportation through the provision of convenience equipment such as bicycle racks and electric vehicle charging stations
• Integrate bicycle and pedestrian design elements into road design and traffic calming measures
• Encourage state and county officials to fund transit, sidewalks, bikeways, and traffic improvements to decrease congestion
• Work with Montgomery County to optimize the timing at signalized intersections
• Determine viability of car and/or bicycle sharing programs as an additional transportation option
Reduce automobile dependence by facilitating multimodal transportation options
118
Objectives
Take a leading role in advancing transportation goals both in Gaithersburg and regionally
• Coordinate with other agencies on regional transportation issues within or affecting the City
• Advocate for transportation improvements at the local, state and federal level that accommodate all users and provide accessible and inclusive facilities
• Coordinate with other agencies regarding local traffic issues affecting the City
• Work with CSX and MARC to improve safety in and around railroad crossings in the City
• Work with Transportation Committee members to advise the Mayor & City Council on important transportation issues within or affecting the City
• Support Bus Rapid Transit initiatives that have the potential to reduce vehicular traffic on major arteries such as MD 355
• Remain an active participant on Metropolitan Washington Council of Government’s (MWCOG’s) Transportation Planning Board, Region Forward initiative, Cooperative Forecast, and implementation programs
• Use engineering, education and enforcement initiatives to ensure vehicular, bicycle and pedestrian safety in City neighborhoods
• Implement traffic calming measures in existing communities where appropriate and consider in new developments through the review process
• Utilize speed and traffic studies to assist in determining where speed enforcement would be effective
• Aggressively enforce parking ordinances and traffic laws to address hazardous situations and community concerns
• Work closely with the Police Department to emphasize traffic safety and enforcement in residential neighborhoods
• Effectively balance the public’s right to park on City streets with neighborhood impacts
Ensure safety on neighborhood roads through the use of appropriate engineering, enforcement, education, and evaluation practices
119
Objectives
Ensure attractiveness and viability of streetscape and associated amenities
• Enhance the attractiveness of the City through landscaping of City facilities, street medians and rights-of-way
• Ensure health and safety of City trees
• Provide ongoing landscape maintenance to ensure the health and aesthetic appearance of City-maintained properties
• Provide pedestrian amenities such as benches and shelters at bus stops on City streets
• Provide attractive public rights-of-way through regular mowing and litter pickup
• Ensure amenities are distributed throughout the City
120
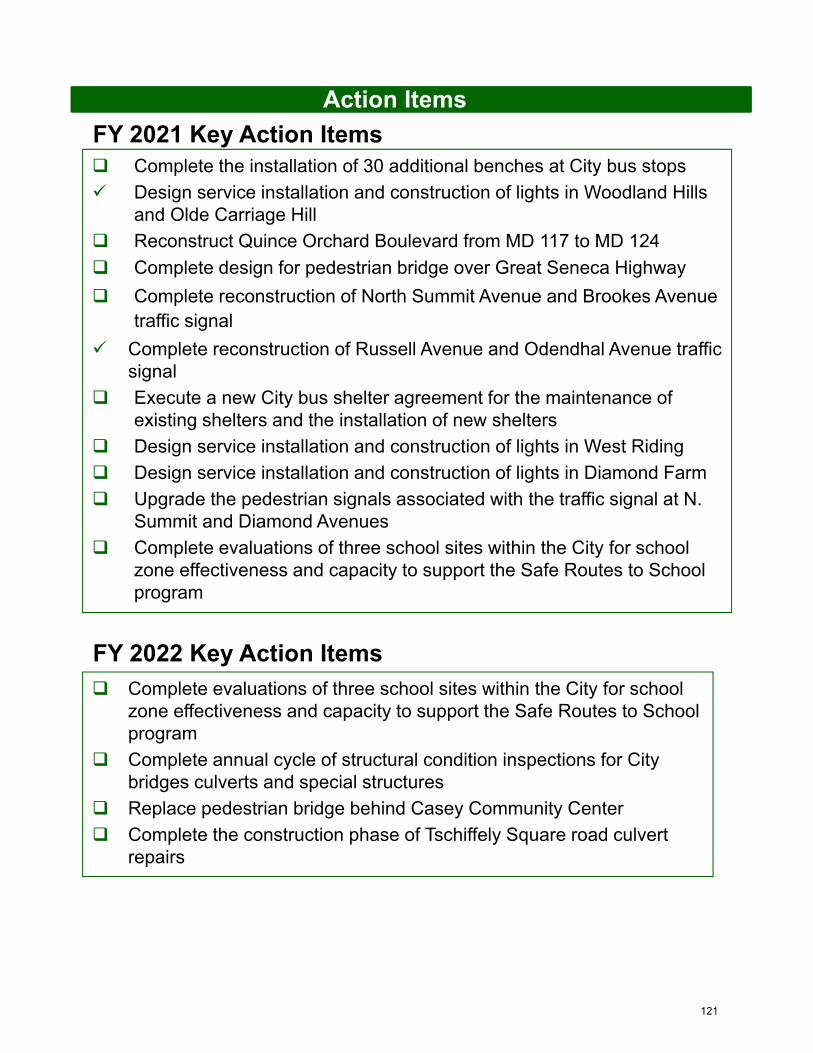
Action Items
Complete the installation of 30 additional benches at City bus stops
Design service installation and construction of lights in Woodland Hills and Olde Carriage Hill
Reconstruct Quince Orchard Boulevard from MD 117 to MD 124
Complete design for pedestrian bridge over Great Seneca Highway
Complete reconstruction of North Summit Avenue and Brookes Avenue traffic signal
Complete reconstruction of Russell Avenue and Odendhal Avenue traffic signal
Execute a new City bus shelter agreement for the maintenance of existing shelters and the installation of new shelters
Design service installation and construction of lights in West Riding
Design service installation and construction of lights in Diamond Farm
Upgrade the pedestrian signals associated with the traffic signal at N. Summit and Diamond Avenues
Complete evaluations of three school sites within the City for school zone effectiveness and capacity to support the Safe Routes to School program
FY 2021 Key Action Items
FY 2022 Key Action Items
Complete evaluations of three school sites within the City for school zone effectiveness and capacity to support the Safe Routes to School program
Complete annual cycle of structural condition inspections for City bridges culverts and special structures
Replace pedestrian bridge behind Casey Community Center
Complete the construction phase of Tschiffely Square road culvert repairs
121
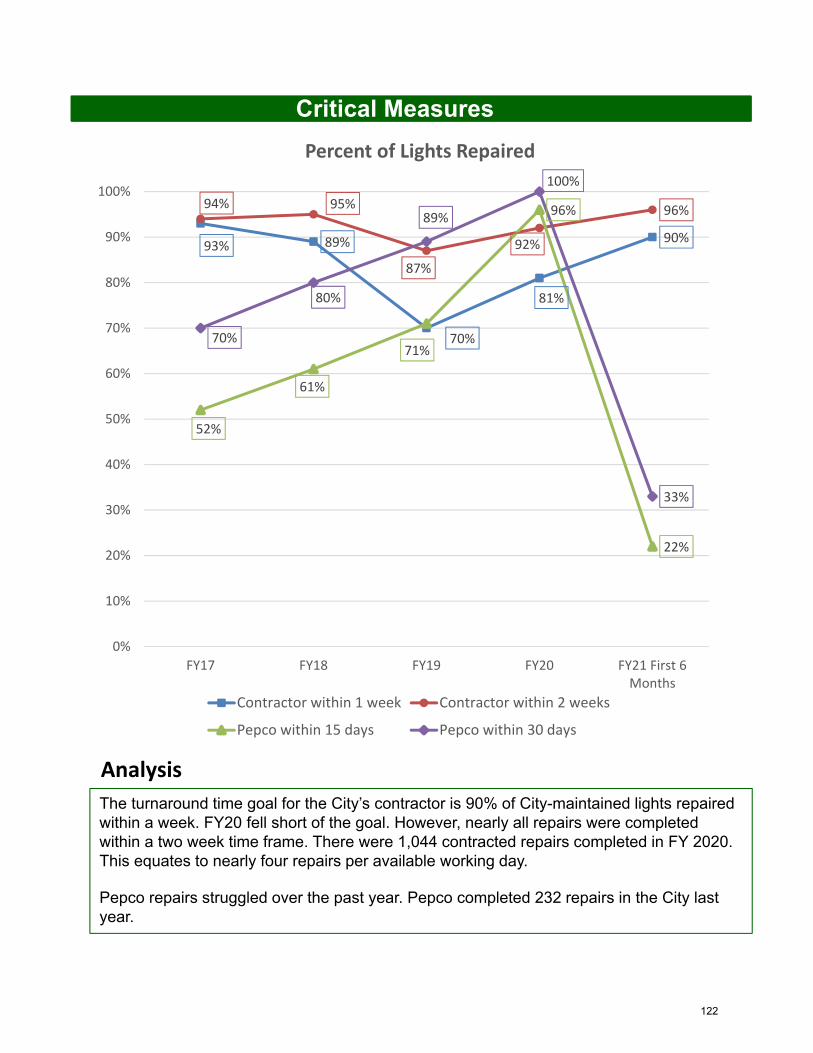
Critical Measures
The turnaround time goal for the City’s contractor is 90% of City-maintained lights repaired within a week. FY20 fell short of the goal. However, nearly all repairs were completed within a two week time frame. There were 1,044 contracted repairs completed in FY 2020. This equates to nearly four repairs per available working day.
Pepco repairs struggled over the past year. Pepco completed 232 repairs in the City last year.
93% 89%
70%
81%
90%
94% 95%
87%
92%
96%
52%
61%
71%
96%
22%
70%
80%
89%
100%
33%
0%
10%
20%
30%
40%
50%
60%
70%
80%
90%
100%
FY17 FY18 FY19 FY20 FY21 First 6Months
Percent of Lights Repaired
Contractor within 1 week Contractor within 2 weeks
Pepco within 15 days Pepco within 30 days
Analysis
122
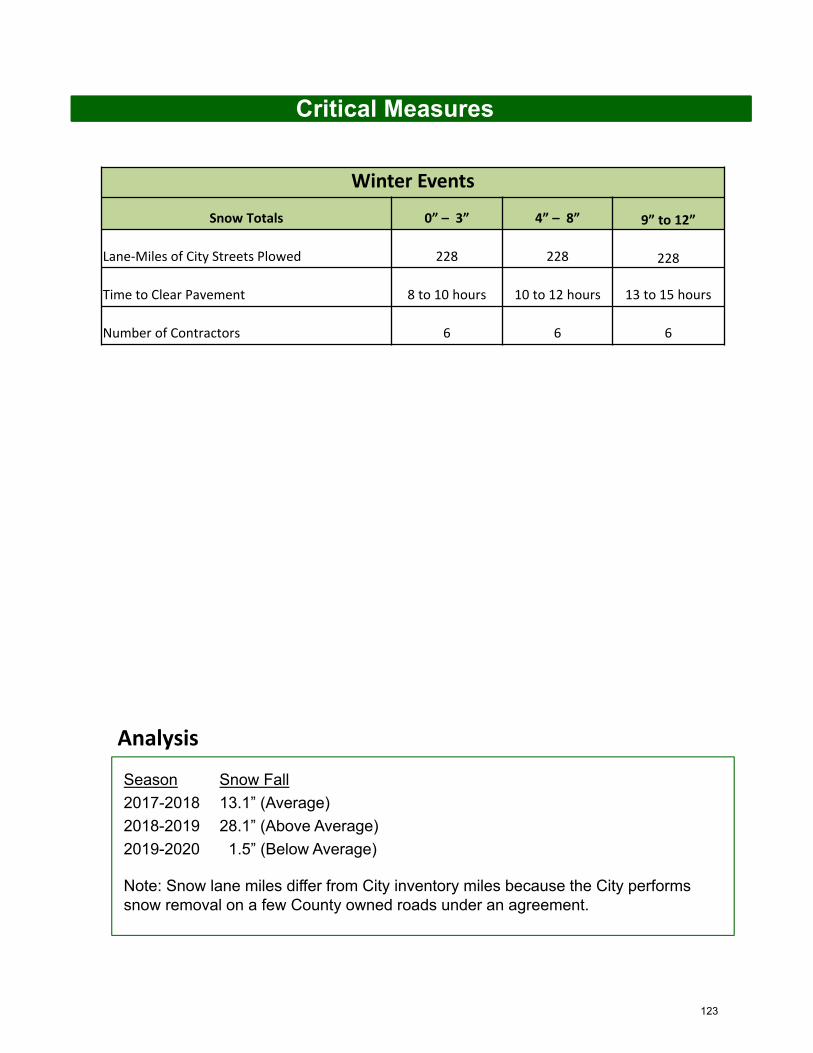
Critical Measures
Analysis
Winter Events
Snow Totals 0” – 3” 4” – 8” 9” to 12”
Lane‐Miles of City Streets Plowed 228 228 228
Time to Clear Pavement 8 to 10 hours 10 to 12 hours 13 to 15 hours
Number of Contractors 6 6 6
Season Snow Fall
2017-2018 13.1” (Average)
2018-2019 28.1” (Above Average)
2019-2020 1.5” (Below Average)
Note: Snow lane miles differ from City inventory miles because the City performs snow removal on a few County owned roads under an agreement.
123
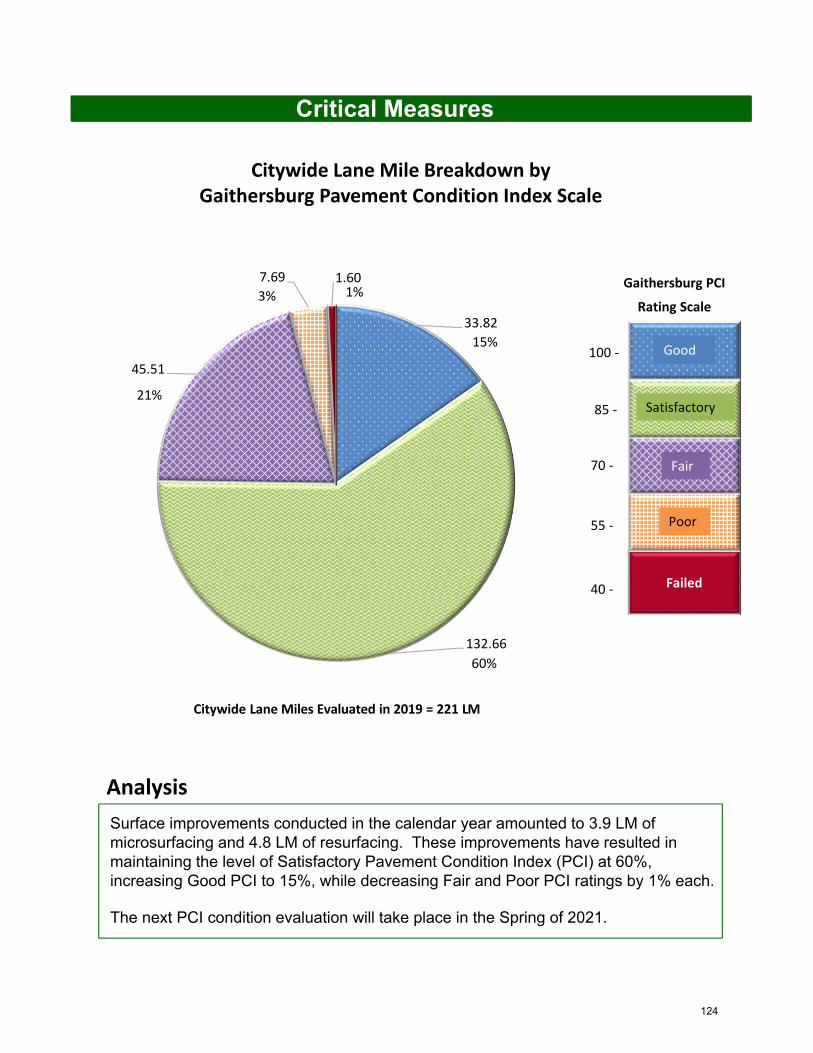
Critical Measures
Analysis
Citywide Lane Mile Breakdown byGaithersburg Pavement Condition Index Scale
Citywide Lane Miles Evaluated in 2019 = 221 LM
Failed
100 ‐
85 ‐
70 ‐
55 ‐
40 ‐
Gaithersburg PCI
Rating Scale
Good
Satisfactory
Fair
Poor
33.82
132.66
45.51
7.69 1.601%3%
21%
15%
60%
Surface improvements conducted in the calendar year amounted to 3.9 LM of microsurfacing and 4.8 LM of resurfacing. These improvements have resulted in maintaining the level of Satisfactory Pavement Condition Index (PCI) at 60%, increasing Good PCI to 15%, while decreasing Fair and Poor PCI ratings by 1% each.
The next PCI condition evaluation will take place in the Spring of 2021.
124
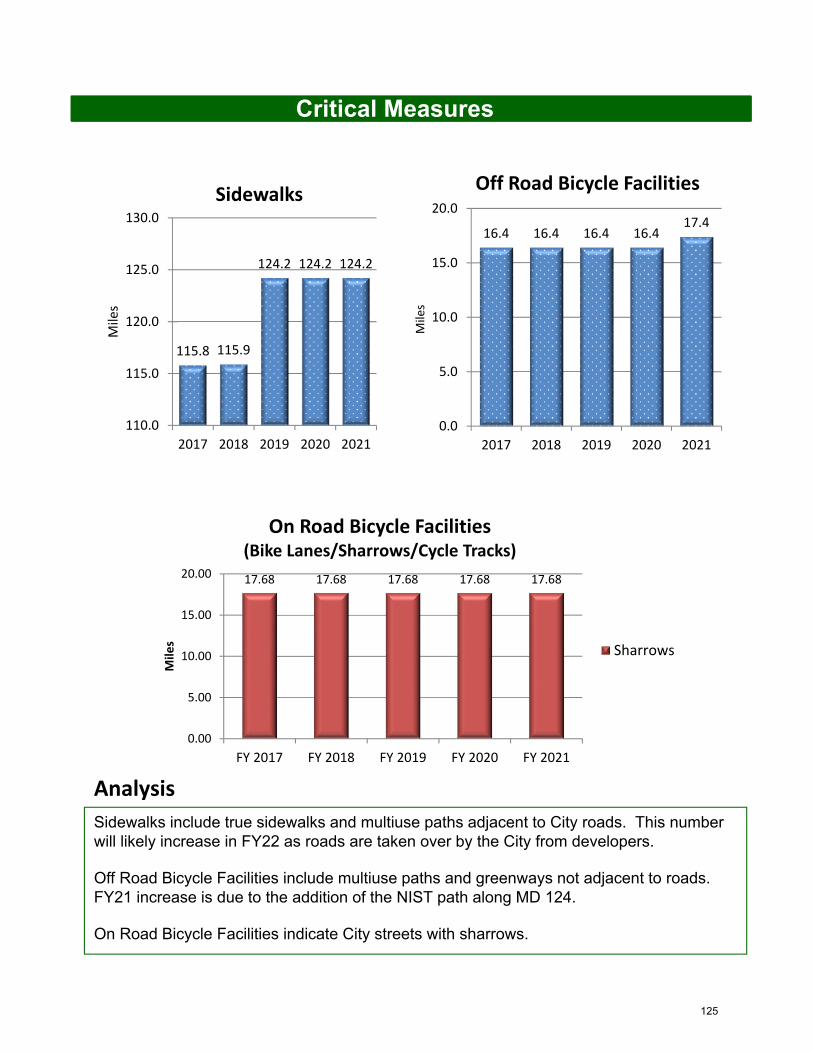
Critical Measures
Sidewalks include true sidewalks and multiuse paths adjacent to City roads. This number will likely increase in FY22 as roads are taken over by the City from developers.
Off Road Bicycle Facilities include multiuse paths and greenways not adjacent to roads. FY21 increase is due to the addition of the NIST path along MD 124.
On Road Bicycle Facilities indicate City streets with sharrows.
Analysis
16.4 16.4 16.4 16.417.4
0.0
5.0
10.0
15.0
20.0
2017 2018 2019 2020 2021
Miles
Off Road Bicycle Facilities
115.8 115.9
124.2 124.2 124.2
110.0
115.0
120.0
125.0
130.0
2017 2018 2019 2020 2021
Miles
Sidewalks
17.68 17.68 17.68 17.68 17.68
0.00
5.00
10.00
15.00
20.00
FY 2017 FY 2018 FY 2019 FY 2020 FY 2021
Miles
On Road Bicycle Facilities(Bike Lanes/Sharrows/Cycle Tracks)
Sharrows
125
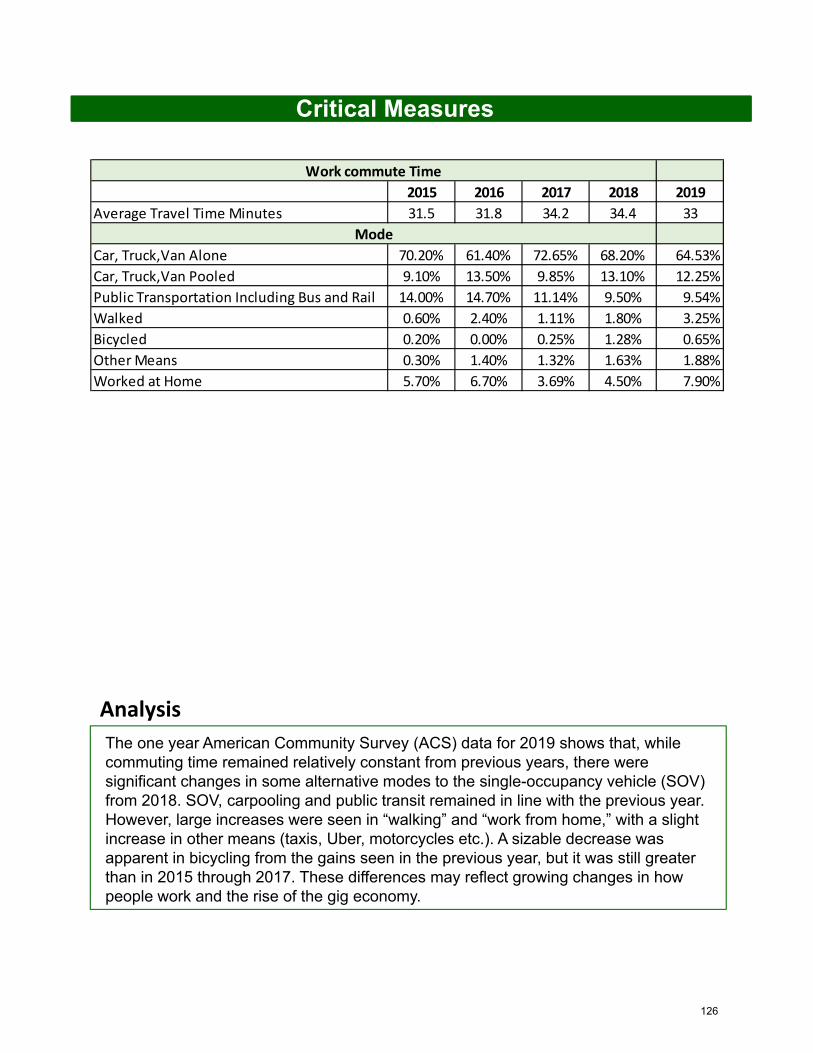
Critical Measures
Analysis
The one year American Community Survey (ACS) data for 2019 shows that, while commuting time remained relatively constant from previous years, there were significant changes in some alternative modes to the single-occupancy vehicle (SOV) from 2018. SOV, carpooling and public transit remained in line with the previous year. However, large increases were seen in “walking” and “work from home,” with a slight increase in other means (taxis, Uber, motorcycles etc.). A sizable decrease was apparent in bicycling from the gains seen in the previous year, but it was still greater than in 2015 through 2017. These differences may reflect growing changes in how people work and the rise of the gig economy.
2015 2016 2017 2018 2019
Average Travel Time Minutes 31.5 31.8 34.2 34.4 33
Car, Truck,Van Alone 70.20% 61.40% 72.65% 68.20% 64.53%
Car, Truck,Van Pooled 9.10% 13.50% 9.85% 13.10% 12.25%
Public Transportation Including Bus and Rail 14.00% 14.70% 11.14% 9.50% 9.54%
Walked 0.60% 2.40% 1.11% 1.80% 3.25%
Bicycled 0.20% 0.00% 0.25% 1.28% 0.65%
Other Means 0.30% 1.40% 1.32% 1.63% 1.88%
Worked at Home 5.70% 6.70% 3.69% 4.50% 7.90%
Work commute Time
Mode
126
Subject Index
Affordable Housing 33, 47, 67‐69, 71, 72
Banking and Financial Education/Wellness 23, 24, 32, 36, 37
City Values, Mission, Vision 1, 4
Communication 1, 6, 13‐30, 35, 36, 45, 49, 97, 108, 111
Community Services 31‐43, 71, 72
Cultural Arts 89
Cultural Diversity 6, 17, 31, 35
Economic Development 44‐58, 71, 72, 96, 98
Environment/Sustainability 59‐66, 81, 82, 89, 96, 98
Gaithersburg Master Plan 44, 47, 60, 72, 83, 89, 97, 100
Hoarding 33, 36
Homeless Outreach/Advocacy 31, 33. 35‐37, 75
Housing/Housing Counseling 33, 35, 37, 39, 40, 47, 50, 67‐80, 96, 99, 100
Infrastructure 47, 59, 61, 81‐85, 88, 96, 98, 99, 117, 118
Intergovernmental Lobbying 1, 7
Int’l Green Construction Code (IgCC) 81, 82
Natural Resources/Open Spaces 59, 61, 86, 87, 89
Physical and Mental Health Services 31, 34, 37, 40, 87, 108
Planning and Development 96‐105
Police 8, 23, 24, 83, 106‐116, 119
Recreational Programs/Facilities 86‐95
Safety Net Services 31, 33, 37
Technology 1, 2, 5, 6, 37, 45, 46, 85, 87, 97, 98, 110
Transportation 33, 60, 96, 117‐126
Water Quality Protection/Stormwater 59, 61, 63‐65
Watersheds 59, 61
Youth Education/Enrichment/Involvement 31, 34, 37, 40, 87, 91, 95,
PageObjective/Strategy
127
AppendixIn addition to the Critical Measures shown in this document, the City tracks a multitude of performance measures as part of the budget process. Listed below are the categories and highlights of the types of performance measures tracked. Should you wish to obtain a detailed list of performance measures please contact the City Manager’s Office.
City Manager’s Office• Public information requests• Ordinances, resolutions, deeds, easements,
agreements, leases, covenants, contracts, and MOUs prepared /reviewed
• Municipal infractions prosecuted• Administrative proceedings/appeals
Human Resources• Workers compensation claims• New hires/terminations
Finance and Administration• Payroll checks/e‐vouchers issued• Cash/accounting procedure audits• Invoices paid• Conference and travel budget
Information Technology• In‐house/commercial applications supported• GIS web mapping applications
Communication/Community and Public Relations• Website metrics• Press releases• Marketing/facility video spots• Facebook/Twitter followers & posts• Media subscribers• Meetings aired• Alert Gaithersburg subscribers
Community Services• Counseling & mentoring• School enrichment grants• Workforce development services• Attendance at community educational events• Bank on Gaithersburg accounts & workshops• Volunteer Income Tax Assistance (VITA)• Emergency assistance• Homeless support programs• Wells/Robertson, DeSellum House• Foreclosure prevention
Economic Development• Toolbox & Economic Opportunities Fund• Office vacancy trend• Median household income
Environment/Planning and Code Administration• Impervious areas /stormwater management
facilities/outfalls • Stream monitoring /clean up events• Stormwater management Illicit discharge
reports/investigations
Housing/Finance and Administration• Closing cost loans issued• Community Development Block Grants projects• MPDU/WFHU rentals/sales• Loans repaid
Infrastructure and Facilities/Public Works• Winter salt use• Asphalt use• Vehicle & equipment repairs• Repair/preventative maintenance• Landscaping/yard waste/Green Street facilities
Parks, Recreation and Culture• Facilities/rental/use• Program/class attendance• Special events
Planning and Development• Permits/licenses/passports processed• Animal Control calls for service/bite reports• Municipal infractions/violations• Inspections
Police• Criminal arrests• Citations issued• Investigation closure rates• Crimes against persons, property and society
Transportation• Light outages/repairs • New infill lighting• Sidewalk/pavement maintenance• Snow plowing clearing rates• Pavement Condition Index (PCI) for streets,
sidewalks and paths
128