Embed Size (px)
Citation preview
FY2014 First HalfBusiness Result
InnovationInnovation beginsbegins inin aa vacuumvacuum【Code No:6728】
Page Page 11Copyright ©2015,ULVAC,Inc.All rights reservedFY14IRMTG20150216E
(Year Ending June 30, 2015)
ULVAC, Inc.ULVAC, Inc.16th Feb.,2015
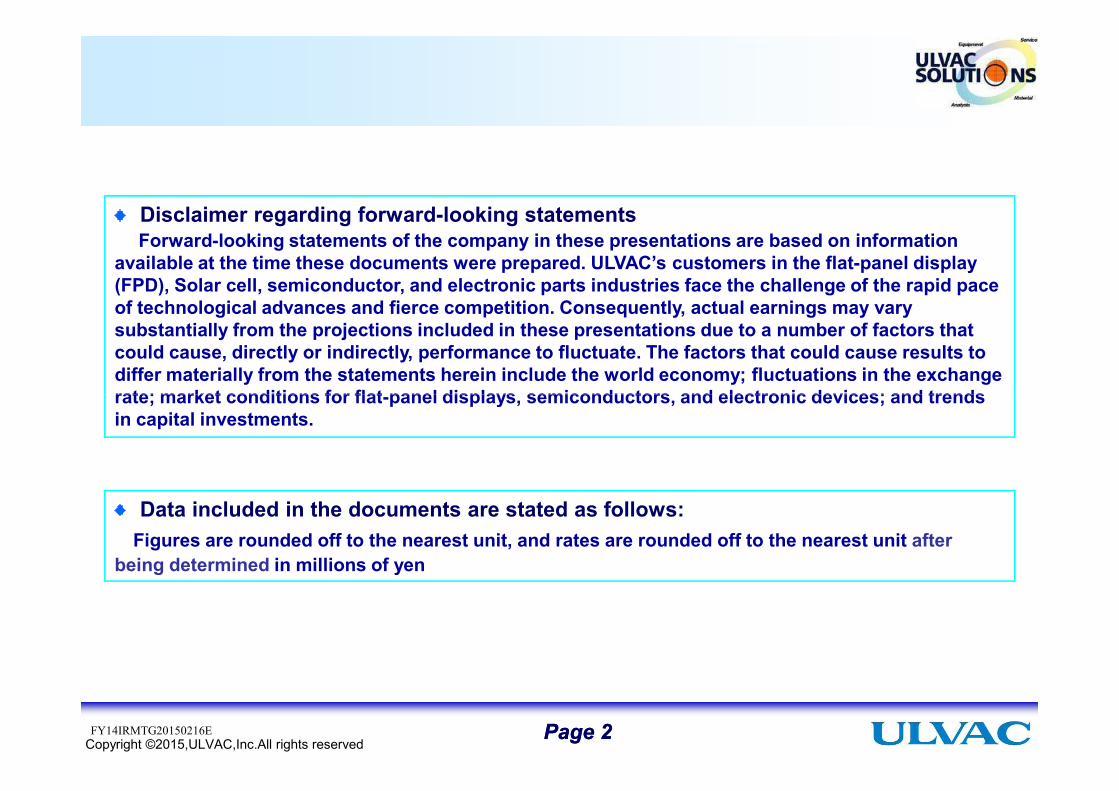
Disclaimer regarding forward-looking statementsForward-looking statements of the company in these presentations are based on information
available at the time these documents were prepared. ULVAC’s customers in the flat-panel display (FPD), Solar cell, semiconductor, and electronic parts industries face the challenge of the rapid pace of technological advances and fierce competition. Consequently, actual earnings may vary substantially from the projections included in these presentations due to a number of factors that could cause, directly or indirectly, performance to fluctuate. The factors that could cause results to differ materially from the statements herein include the world economy; fluctuations in the exchange rate; market conditions for flat-panel displays, semiconductors, and electronic devices; and trends
Page Page 22Copyright ©2015,ULVAC,Inc.All rights reserved
rate; market conditions for flat-panel displays, semiconductors, and electronic devices; and trends in capital investments.
Data included in the documents are stated as follows:Figures are rounded off to the nearest unit, and rates are rounded off to the nearest unit after
being determined in millions of yen
FY14IRMTG20150216E
Agenda
Summary for the Fiscal Year 2014Summary for the Fiscal Year 2014 Ending June Ending June 2015(12015(1stst Half)Half)
Prospects for the Fiscal Year 2014 Ending June Prospects for the Fiscal Year 2014 Ending June
Page Page 33Copyright ©2015,ULVAC,Inc.All rights reserved
Prospects for the Fiscal Year 2014 Ending June Prospects for the Fiscal Year 2014 Ending June 20152015
Hisaharu Obinata , President and CEOFY14IRMTG20150216E
1H 2H Full Year Plan* ResultH-o-H
(Changes)vs. Plan
(Changes)
Booking 82.1 87.7 169.8 80.0 79.1 -3.7% -1.1% 170.0
June 2015Full Year
Plan *
June '14 June 2015 1H
Business Results for the 2nd Q of FY2014 (1st H)
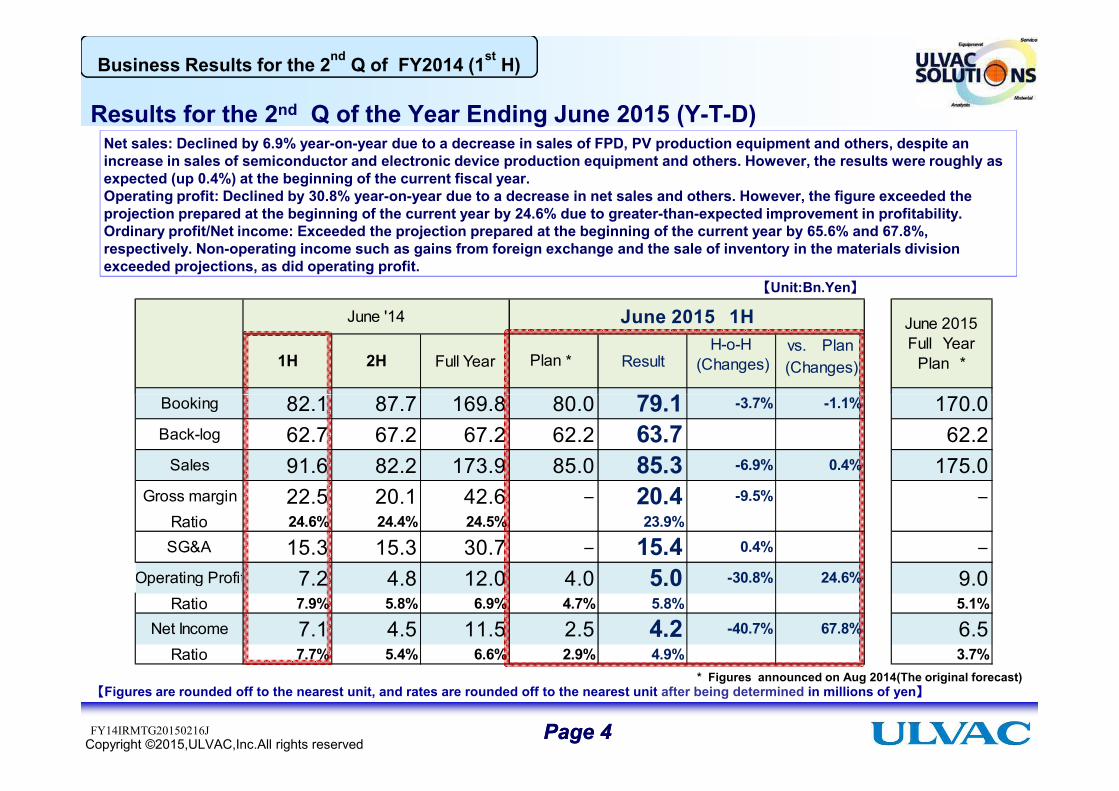
Results for the 2nd Q of the Year Ending June 2015 (Y-T-D)Net sales: Declined by 6.9% year-on-year due to a decrease in sales of FPD, PV production equipment and others, despite an increase in sales of semiconductor and electronic device production equipment and others. However, the results were roughly as expected (up 0.4%) at the beginning of the current fiscal year.Operating profit: Declined by 30.8% year-on-year due to a decrease in net sales and others. However, the figure exceeded the projection prepared at the beginning of the current year by 24.6% due to greater-than-expected improvement in profitability.Ordinary profit/Net income: Exceeded the projection prepared at the beginning of the current year by 65.6% and 67.8%, respectively. Non-operating income such as gains from foreign exchange and the sale of inventory in the materials division exceeded projections, as did operating profit.
【Unit:Bn.Yen】
Page Page 44Copyright ©2015,ULVAC,Inc.All rights reserved
Booking 82.1 87.7 169.8 80.0 79.1 -3.7% -1.1% 170.0Back-log 62.7 67.2 67.2 62.2 63.7 62.2
Sales 91.6 82.2 173.9 85.0 85.3 -6.9% 0.4% 175.0Gross margin 22.5 20.1 42.6 - 20.4 -9.5% -
Ratio 24.6% 24.4% 24.5% 23.9%SG&A 15.3 15.3 30.7 - 15.4 0.4% -
Operating Profit 7.2 4.8 12.0 4.0 5.0 -30.8% 24.6% 9.0Ratio 7.9% 5.8% 6.9% 4.7% 5.8% 5.1%
Net Income 7.1 4.5 11.5 2.5 4.2 -40.7% 67.8% 6.5Ratio 7.7% 5.4% 6.6% 2.9% 4.9% 3.7%
FY14IRMTG20150216J
【Figures are rounded off to the nearest unit, and rates are rounded off to the nearest unit after being determined in millions of yen】* Figures announced on Aug 2014(The original forecast)
115.7
81.2 73.6
89.7 91.6 82.2 85.0 85.3
15
20
25
30
100
150
Business Results for the 2nd Q of FY2014 (1st H)
Results for the 2nd Q of the Year Ending June 2015 (Y-T-D)
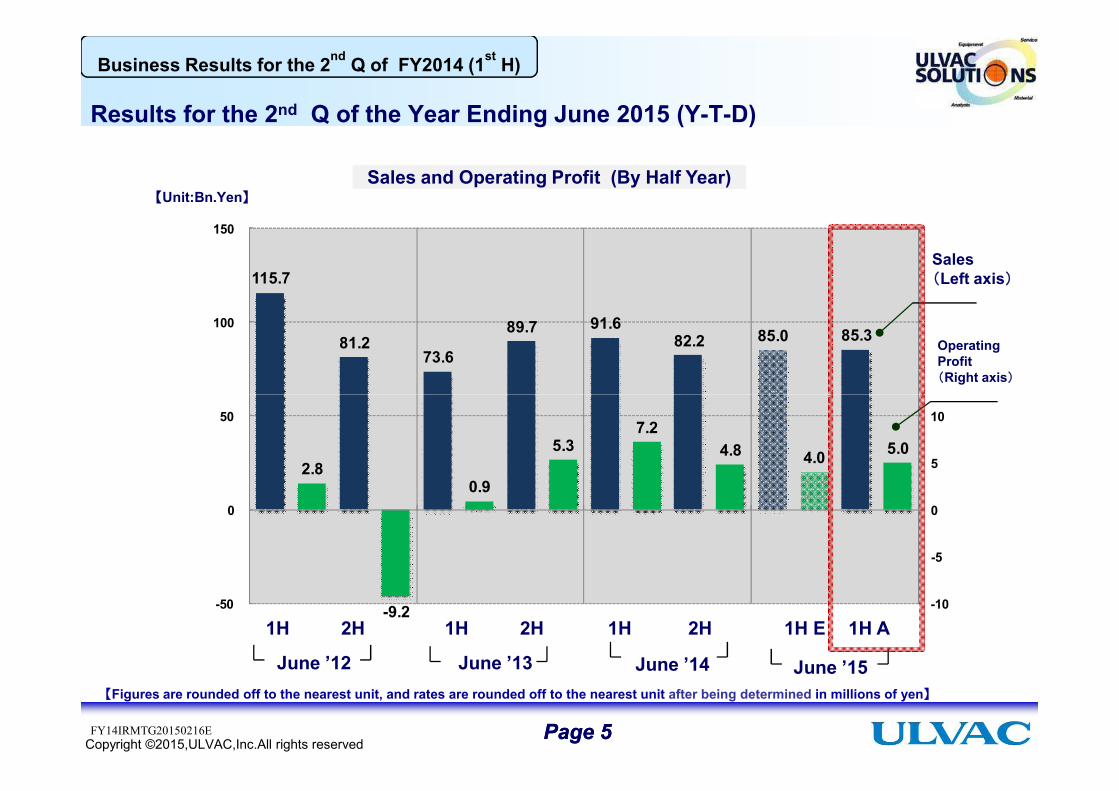
Sales and Operating Profit (By Half Year)【Unit:Bn.Yen】
Sales (Left axis)
Operating Profit(Right axis)
Page Page 55Copyright ©2015,ULVAC,Inc.All rights reserved
2.8
-9.2
0.9
5.3 7.2
4.8 4.0 5.0
-10
-5
0
5
10
-50
0
50
1H 2H 1H 2H 1H 2H 1H E 1H A
June ’13June ’12 June ’14 June ’15【Figures are rounded off to the nearest unit, and rates are rounded off to the nearest unit after being determined in millions of yen】
FY14IRMTG20150216E
1H 2H 1H
(Jul-Dec) (Jan-Jun) (Jul-Dec)
63.6 73.4 62.7 -10.7
June 2014 June 2015
H-on-H
Vacuum Equipment Business
Segment
100
7.1 12.7
7.2
9.3
Business Results for the 2nd Q of FY2014 (1st H)
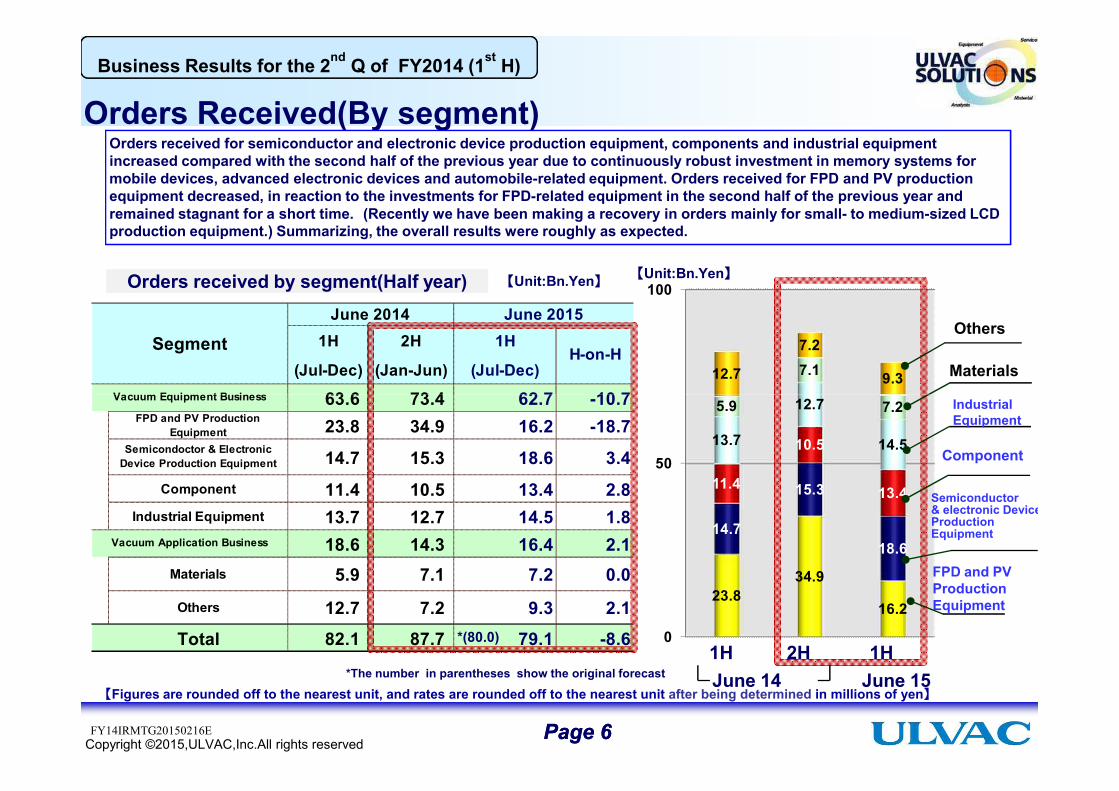
Orders Received(By segment)Orders received for semiconductor and electronic device production equipment, components and industrial equipment increased compared with the second half of the previous year due to continuously robust investment in memory systems for mobile devices, advanced electronic devices and automobile-related equipment. Orders received for FPD and PV production equipment decreased, in reaction to the investments for FPD-related equipment in the second half of the previous year and remained stagnant for a short time. (Recently we have been making a recovery in orders mainly for small- to medium-sized LCD production equipment.) Summarizing, the overall results were roughly as expected.
【Unit:Bn.Yen】Orders received by segment(Half year) 【Unit:Bn.Yen】
Others
Materials
Page Page 66Copyright ©2015,ULVAC,Inc.All rights reserved
63.6 73.4 62.7 -10.7FPD and PV Production
Equipment 23.8 34.9 16.2 -18.7Semicondoctor & Electronic
Device Production Equipment 14.7 15.3 18.6 3.4Component 11.4 10.5 13.4 2.8
Industrial Equipment 13.7 12.7 14.5 1.818.6 14.3 16.4 2.1
Materials 5.9 7.1 7.2 0.0
Others 12.7 7.2 9.3 2.1
Total 82.1 87.7 79.1 -8.6
Vacuum Application Business
Vacuum Equipment Business
0
50
23.8 34.9
16.2
14.7
15.3
18.6
11.4
10.5
13.4
13.7
12.7
14.5
5.9 7.2
1H 2H 1H
【Figures are rounded off to the nearest unit, and rates are rounded off to the nearest unit after being determined in millions of yen】June 14 June 15
IndustrialEquipment
Component
Semiconductor & electronic DeviceProductionEquipment
FPD and PVProduction Equipment
FY14IRMTG20150216E
*(80.0)
*The number in parentheses show the original forecast
1H 2H 1H
(Jul-Dec) (Jan-Jun) (Jul-Dec)
73.2 66.6 69.1 2.5
June 2015
H-on-HSegmentJune 2014
Vacuum Equipment Business
100
6.7 7.5 7.5
11.8
8.1 8.7
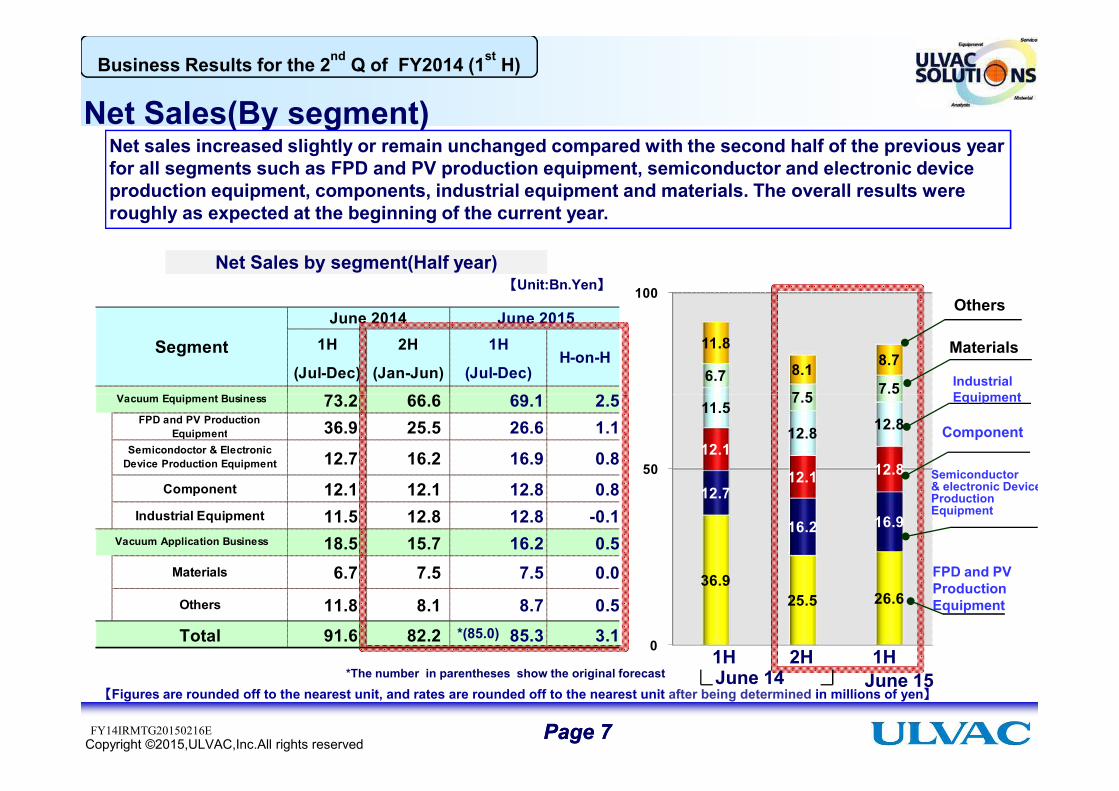
Net Sales(By segment)
【Unit:Bn.Yen】Net Sales by segment(Half year)
Net sales increased slightly or remain unchanged compared with the second half of the previous year for all segments such as FPD and PV production equipment, semiconductor and electronic device production equipment, components, industrial equipment and materials. The overall results were roughly as expected at the beginning of the current year.
Business Results for the 2nd Q of FY2014 (1st H)
Others
Materials
IndustrialEquipment
Page Page 77Copyright ©2015,ULVAC,Inc.All rights reserved
73.2 66.6 69.1 2.5FPD and PV Production
Equipment 36.9 25.5 26.6 1.1Semicondoctor & Electronic
Device Production Equipment 12.7 16.2 16.9 0.8Component 12.1 12.1 12.8 0.8
Industrial Equipment 11.5 12.8 12.8 -0.118.5 15.7 16.2 0.5
Materials 6.7 7.5 7.5 0.0
Others 11.8 8.1 8.7 0.5
Total 91.6 82.2 85.3 3.1
Vacuum Equipment Business
Vacuum Application Business
0
50
36.9 25.5 26.6
12.7
16.2 16.9
12.1
12.1 12.8
11.5 12.8 12.8
7.5 7.5
【Figures are rounded off to the nearest unit, and rates are rounded off to the nearest unit after being determined in millions of yen】
Equipment
Component
Semiconductor & electronic DeviceProductionEquipment
FPD and PVProduction Equipment
1H 2H 1HJune 14 June 15
FY14IRMTG20150216E
*(85.0)
*The number in parentheses show the original forecast
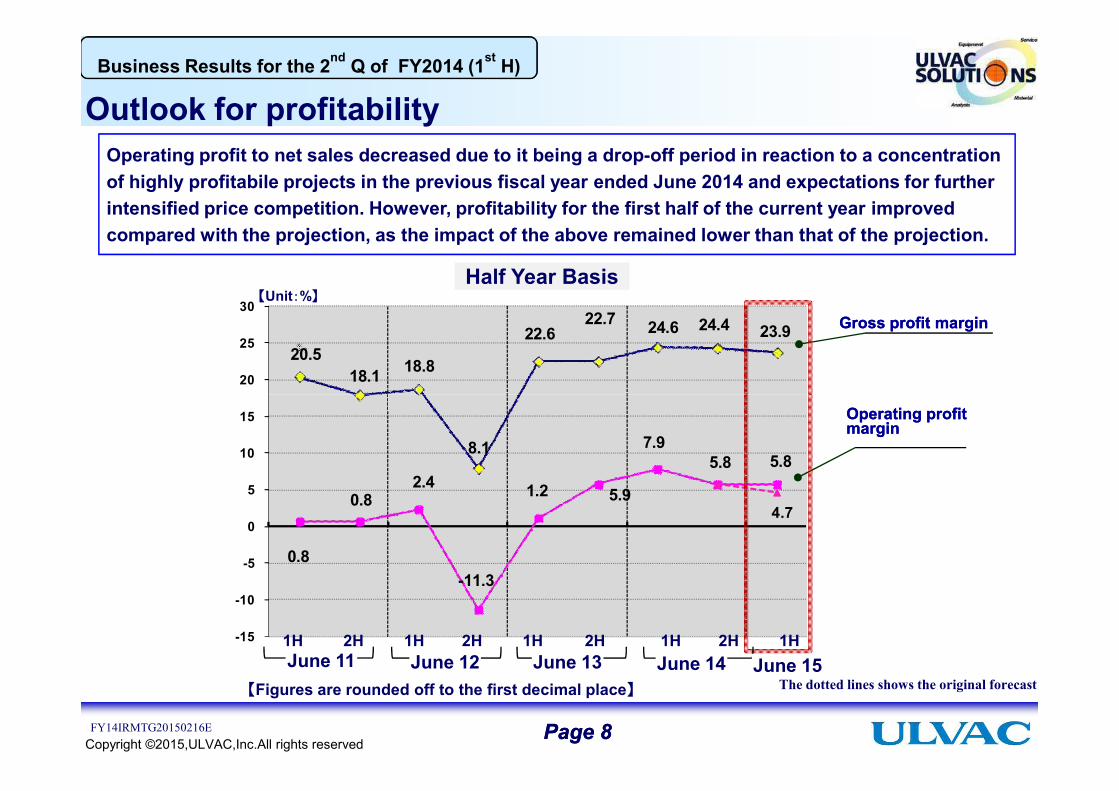
Outlook for profitabilityBusiness Results for the 2nd Q of FY2014 (1st H)
Operating profit to net sales decreased due to it being a drop-off period in reaction to a concentration of highly profitabile projects in the previous fiscal year ended June 2014 and expectations for further intensified price competition. However, profitability for the first half of the current year improved compared with the projection, as the impact of the above remained lower than that of the projection.
20.5 18.1 18.8
22.6 22.7 24.6 24.4 23.9
20
25
30 【Unit:%】
Half Year Basis
Gross profit marginGross profit margin
Page Page 88Copyright ©2015,ULVAC,Inc.All rights reserved
The dotted lines shows the original forecast【Figures are rounded off to the first decimal place】
8.1
0.8
0.8 2.4
-11.3
1.2 5.9
7.9 5.8 5.8
4.7
-15
-10
-5
0
5
10
15 Operating profit Operating profit marginmargin
1H 2H 1H 2H 1H 2H 1H 2H 1HJune 11 June 12 June 13 June 14 June 15
FY14IRMTG20150216E
65
28 45
58 57 200
300
Cash on hand and in banksNotes and accounts receivable,trade
31 29 29 31
200
300
Note and accounts payable,trade
Liability with
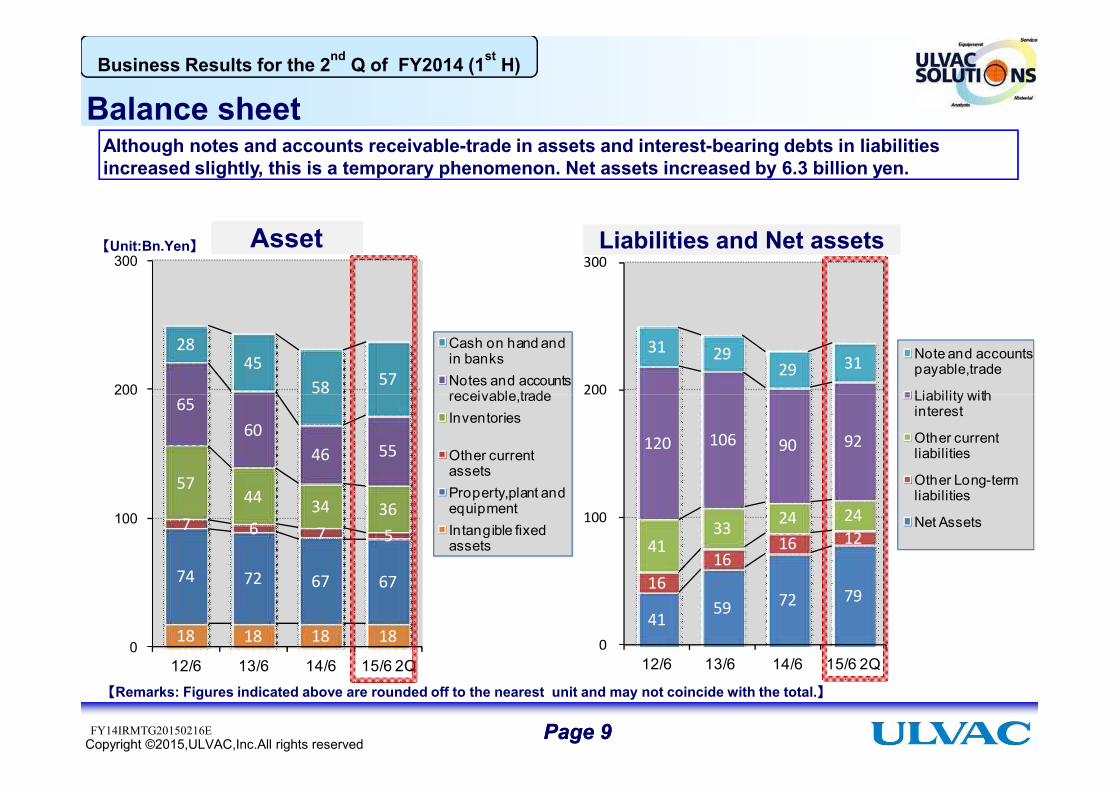
Business Results for the 2nd Q of FY2014 (1st H)
Balance sheetAlthough notes and accounts receivable-trade in assets and interest-bearing debts in liabilities increased slightly, this is a temporary phenomenon. Net assets increased by 6.3 billion yen.
【Unit:Bn.Yen】 Liabilities and Net assetsAsset
Page Page 99Copyright ©2015,ULVAC,Inc.All rights reserved
18 18 18 18
74 72 67 67
7 6 7 5
57 44 34 36
65 60
46 55
58
0
100
200
12/6 13/6 14/6 15/6 2Q
receivable,tradeInventories
Other current assetsProperty,plant and equipmentIntangible fixed assets
41 59 72 79
16 16
16 12 41 33 24 24
120 106 90 92
0
100
200
12/6 13/6 14/6 15/6 2Q
Liability with interest
Other current liabilities
Other Long-term liabilities
Net Assets
【Remarks: Figures indicated above are rounded off to the nearest unit and may not coincide with the total.】
FY14IRMTG20150216E
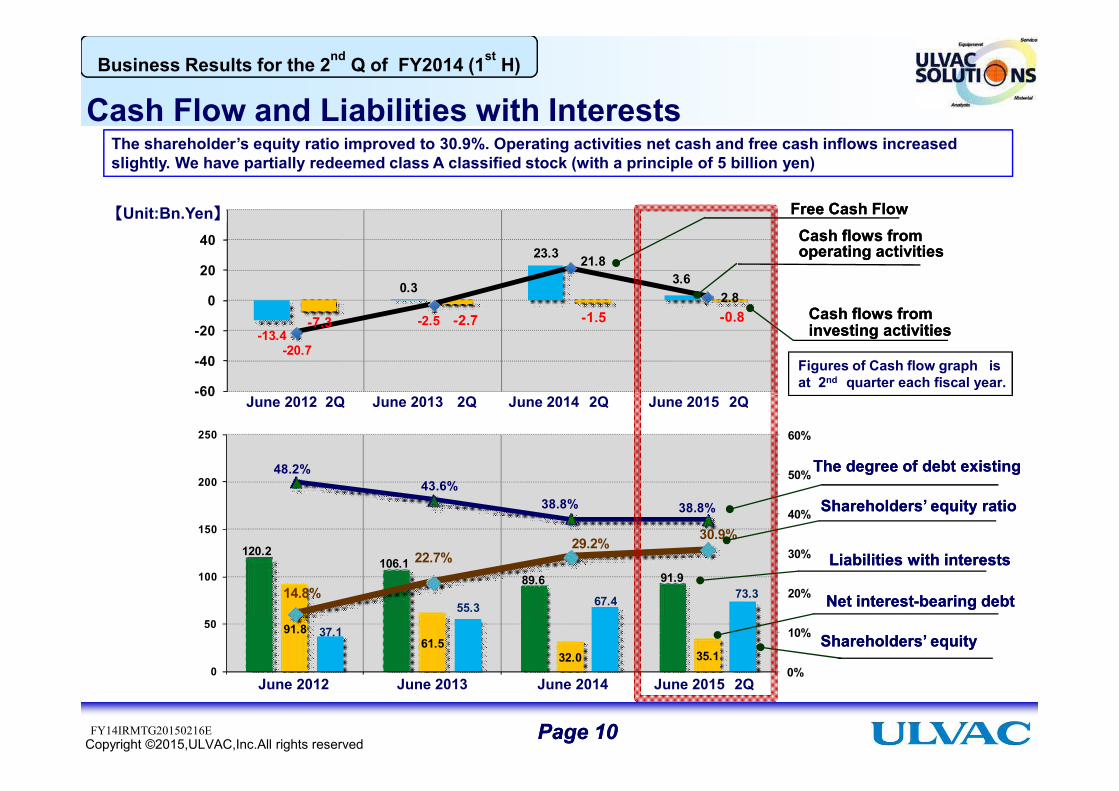
-13.4
0.3
23.3
3.6
-7.3 -2.7 -1.5 -0.8
-20.7
-2.5
21.8
2.8
-60
-40
-20
0
20
40
60
Business Results for the 2nd Q of FY2014 (1st H)
Cash Flow and Liabilities with InterestsThe shareholder’s equity ratio improved to 30.9%. Operating activities net cash and free cash inflows increased slightly. We have partially redeemed class A classified stock (with a principle of 5 billion yen)
June 2012 2Q June 2013 2Q June 2014 2Q June 2015 2Q
【Unit:Bn.Yen】
Figures of Cash flow graph is at 2nd quarter each fiscal year.
Free Cash FlowFree Cash FlowCash flows from Cash flows from operating activitiesoperating activities
Cash flows from Cash flows from investing activitiesinvesting activities
Page Page 1010Copyright ©2015,ULVAC,Inc.All rights reserved
120.2 106.1
89.6 91.9
91.8 61.5
32.0 35.1
37.1
55.3 67.4 73.3
48.2%43.6%
38.8% 38.8%
14.8%
22.7%29.2% 30.9%
0%
10%
20%
30%
40%
50%
60%
0
50
100
150
200
250
-60June 2012 2Q June 2013 2Q June 2014 2Q June 2015 2Q
Liabilities Liabilities with interestswith interests
Shareholders’ equityShareholders’ equity
The degree of debt existingThe degree of debt existing
Shareholders’ equity ratio Shareholders’ equity ratio
Net interestNet interest--bearing debtbearing debt
FY14IRMTG20150216E
June 2012 June 2013 June 2014 June 2015 2Q
1H Result Plan
79.1 170.0
June 2015June 2014
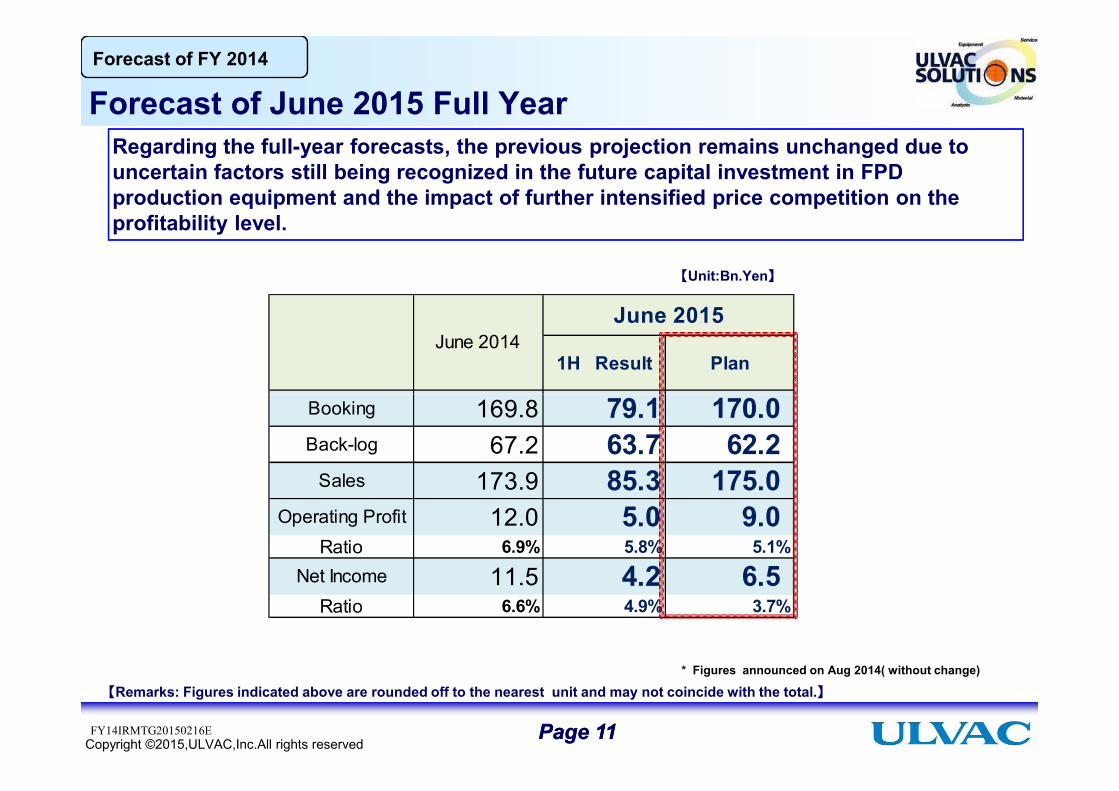
Forecast of FY 2014
Forecast of June 2015 Full YearRegarding the full-year forecasts, the previous projection remains unchanged due to uncertain factors still being recognized in the future capital investment in FPD production equipment and the impact of further intensified price competition on the profitability level.
【Unit:Bn.Yen】
Page Page 1111Copyright ©2015,ULVAC,Inc.All rights reserved
Booking 169.8 79.1 170.0Back-log 67.2 63.7 62.2
Sales 173.9 85.3 175.0Operating Profit 12.0 5.0 9.0
Ratio 6.9% 5.8% 5.1%Net Income 11.5 4.2 6.5
Ratio 6.6% 4.9% 3.7%
【Remarks: Figures indicated above are rounded off to the nearest unit and may not coincide with the total.】* Figures announced on Aug 2014( without change)
FY14IRMTG20150216E
Innovation beginsin a vacuum
Page Page 1212Copyright ©2015,ULVAC,Inc.All rights reservedFY14IRMTG20150216E