Embed Size (px)
Citation preview
FY2010 2nd Quarter Business Results(FY2010 ending March 31, 2010)
Hisashi Ietsugu, President and CEONovember 6, 2009
Contents
FY2010 2Q Financial HighlightsChapter 1
Chapter 2 FY2010 Consolidated Earnings Forecast
Forward-looking StatementsThis material contains forward-looking statements about Sysmex Corporation and its group companies (the Sysmex Group). These forward-looking statements are based on the current judgments and assumptions of the Sysmex Group in light of the information currently available to it. Uncertainties inherent in such judgments and assumptions, the future course of our business operations, and changes in operating environment both in Japan and overseas may cause our actual results, performance, achievements, or financial position to be materially different from any future results, performance, achievements, or financial position either expressed or implied within these forward-looking statements.
(FY2010 ending March 31, 2010)

Chapter 1
FY2010 2Q Financial Highlights
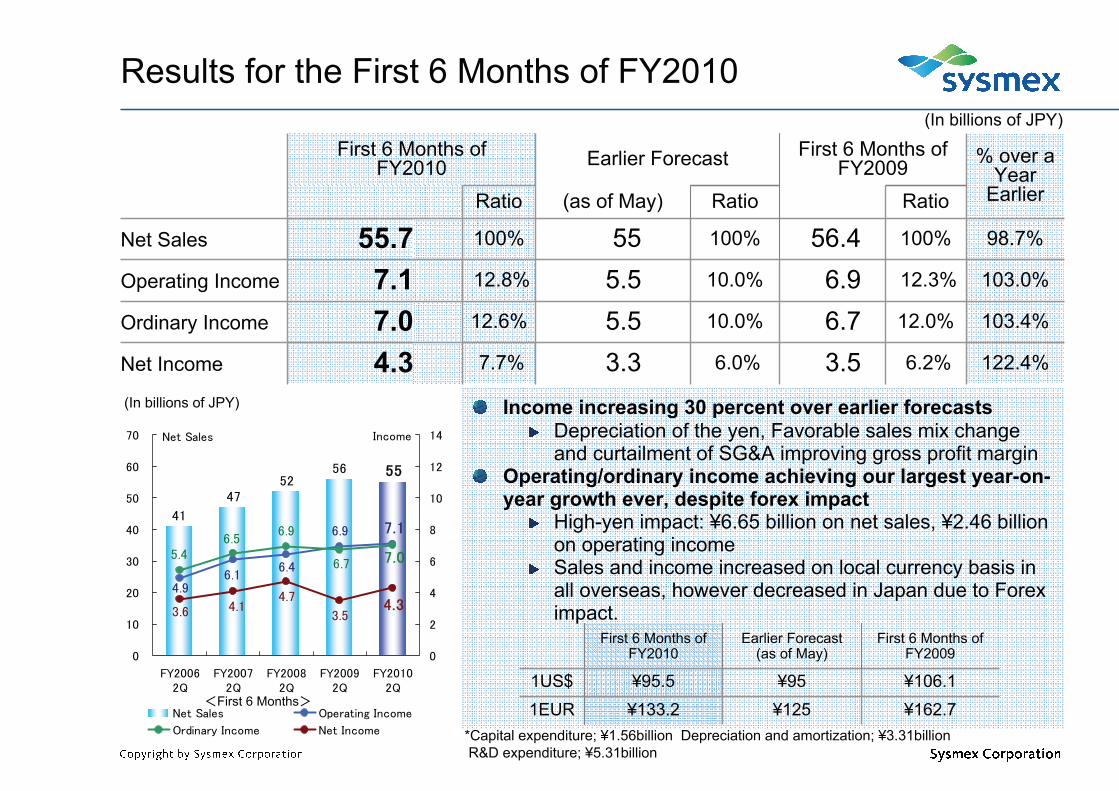
Results for the First 6 Months of FY2010
(as of May)
3.35.55.555
Earlier Forecast
Ratio
6.0%
10.0%
10.0%
100%
RatioRatio
6.2%
12.0%
12.3%
100%
7.7%
12.6%
12.8%
100%
% over a Year
Earlier
3.56.76.9
56.4
First 6 Months of FY2009
103.4%7.0Ordinary Income
122.4%4.3Net Income
103.0%7.1Operating Income
98.7%55.7Net Sales
First 6 Months of FY2010
55
47
5652
41
6.16.4
4.9
6.9 7.1
5.46.5
6.9
6.7 7.0
4.7
3.54.33.6 4.1
0
10
20
30
40
50
60
70
FY20062Q
FY20072Q
FY20082Q
FY20092Q
FY20102Q
Net Sales
0
2
4
6
8
10
12
14Income
Net Sales Operating Income
Ordinary Income Net Income
(In billions of JPY)
(In billions of JPY)
<First 6 Months>
Income increasing 30 percent over earlier forecastsDepreciation of the yen, Favorable sales mix change and curtailment of SG&A improving gross profit margin
Operating/ordinary income achieving our largest year-on-year growth ever, despite forex impact
High-yen impact: ¥6.65 billion on net sales, ¥2.46 billion on operating incomeSales and income increased on local currency basis in all overseas, however decreased in Japan due to Foreximpact.
*Capital expenditure; ¥1.56billion Depreciation and amortization; ¥3.31billion R&D expenditure; ¥5.31billion
¥125¥95
Earlier Forecast(as of May)
¥133.2¥95.5
First 6 Months of FY2010
¥162.7¥106.1
First 6 Months of FY2009
1EUR1US$

55.756.4
0.550.67
2.76
1.480.42
- 6.65
FY2009
Breakdown of Net Sales and Operating Income
7.136.92
3.74
0.58- 1.64
- 2.46
FY2009 FY2010
Gross margin onincreased sales
Down 0.21 billion
Net Sales Operating Income
Down 0.75 billion
<First 6 Months of FY2010>
* FX impact excluded from each regional sales below
Japan
EuropeChina AP FX impact
Americas FX impact
(In billions of JPY)
FY2010 <First 6 Months of FY2010>
SG&A increase
Gross margin increased as a result of an improvement in cost ratio -Depreciation of Technopark
¥0.23 billion-Direct sales and support in
Benelux¥0.72 billion

Breakdown of Balance Sheet
118.5 118.3
- 3.87
4.070.74
- 0.42
0.80
- 1.46
2009.3 2009.9
Cash
Tangible fixed assets
Intangible fixed assets
Down 0.14 billion
Assets
118.5 118.3
- 2.39
- 0.67
2.98
- 0.06
2009.3 2009.9
Down 0.14 billion
Liabilities/Equity
Down1.08
Up0.93
Up2.92
Down3.06
Notes/ Accounts Receivable-trade
Others
Others
Noncurrent
assetsC
urrent assets
EquityLiabilities
Current liabilities
Noncurrentliabilities
Retained earnings Others
(In billions of JPY)

5.67
-0.90 -0.31
8.18
3.77 4.23
10.64
-3.64
4.10
-5.12
-7.61
-2.50
-15
-10
-5
0
5
10
15
Operating CF Investing CF Financing CFFY2008 FY2009 FY2010
Increase/decreasein “cash and
deposits”
Consolidated Cash Flow
※Increase/decrease in “cash and cash deposits” include translation differences of cash and cash deposits.
First 6 months First 6 months First 6 months
(In billions of JPY)

Topics
New Products
Affiliates and Offices
Line-up of reagents for HISCL-2000i in the immunochemistry segment enrichedReagents for hepatitis B and cancer tumor launched (total of 15 items)
Hematology analyzer XT-4000i launched in Japan, Europe, and APTo be launched in the Americas and China from 3Q onward
Direct sales and support in Benelux started (in April)By new subsidiaries in Belgium and the Netherlands
OthersKids Park, a company nursery, opened Production of simplified influenza test kits increased in response to greater demands in the wake of the new influenza pandemicProgress made in the introduction of rapid breast cancer lymph-node metastasis detection systems in Japan and Europe
Preparations underway for market launch in the US and other regions
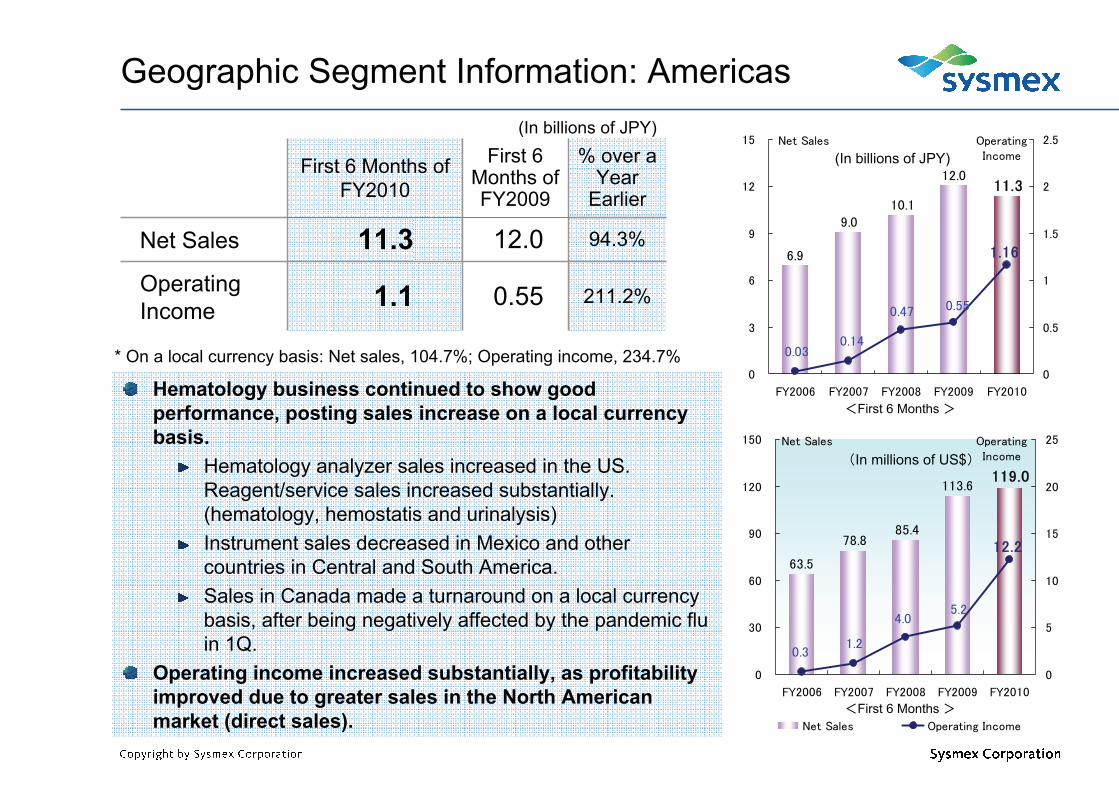
Geographic Segment Information: Americas
11.3
9.0
12.0
10.1
6.9
0.14
0.47
0.03
0.55
1.16
0
3
6
9
12
15
FY2006 FY2007 FY2008 FY2009 FY2010
Net Sales
0
0.5
1
1.5
2
2.5OperatingIncome
<First 6 Months >
119.0
78.8
113.6
85.4
63.5
1.2
4.0
0.3
5.2
12.2
0
30
60
90
120
150
FY2006 FY2007 FY2008 FY2009 FY2010
Net Sales
0
5
10
15
20
25OperatingIncome
Net Sales Operating Income
<First 6 Months >
(In millions of US$)
(In billions of JPY)% over a Year
Earlier
0.55
12.0
First 6 Months of FY2009
211.2%1.1Operating Income
94.3%11.3Net Sales
First 6 Months of FY2010
Hematology business continued to show good performance, posting sales increase on a local currency basis.
Hematology analyzer sales increased in the US. Reagent/service sales increased substantially.(hematology, hemostatis and urinalysis)Instrument sales decreased in Mexico and other countries in Central and South America.Sales in Canada made a turnaround on a local currency basis, after being negatively affected by the pandemic flu in 1Q.
Operating income increased substantially, as profitability improved due to greater sales in the North American market (direct sales).
* On a local currency basis: Net sales, 104.7%; Operating income, 234.7%
(In billions of JPY)
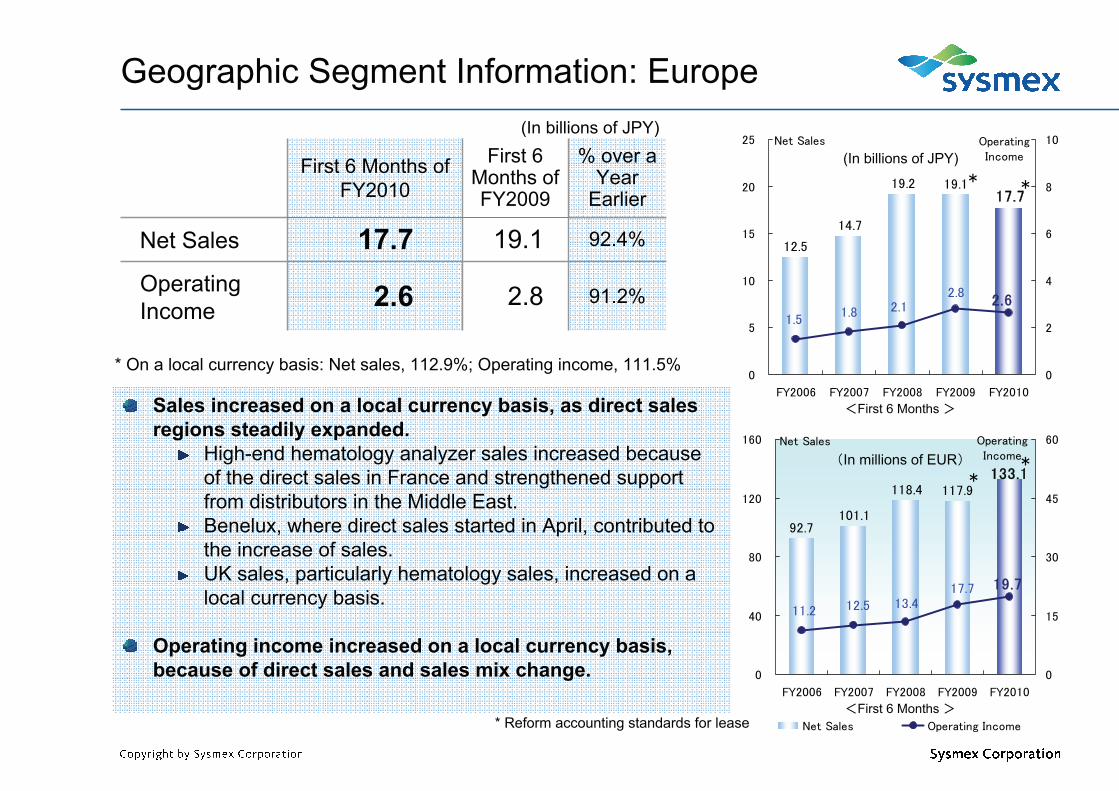
Geographic Segment Information: Europe
17.7
14.7
19.119.2
12.5
1.8 2.11.5
2.82.6
0
5
10
15
20
25
FY2006 FY2007 FY2008 FY2009 FY2010
Net Sales
0
2
4
6
8
10OperatingIncome
133.1
101.1
117.9118.4
92.7
12.5 13.411.2
17.7 19.7
0
40
80
120
160
FY2006 FY2007 FY2008 FY2009 FY2010
Net Sales
0
15
30
45
60OperatingIncome
Net Sales Operating Income
<First 6 Months >
<First 6 Months >
(In billions of JPY)
(In millions of EUR)
% over a Year
Earlier
2.8
19.1
First 6 Months of FY2009
91.2%2.6Operating Income
92.4%17.7Net Sales
First 6 Months of FY2010
(In billions of JPY)
Sales increased on a local currency basis, as direct sales regions steadily expanded.
High-end hematology analyzer sales increased because of the direct sales in France and strengthened support from distributors in the Middle East.Benelux, where direct sales started in April, contributed to the increase of sales.UK sales, particularly hematology sales, increased on a local currency basis.
Operating income increased on a local currency basis, because of direct sales and sales mix change.
* On a local currency basis: Net sales, 112.9%; Operating income, 111.5%
* Reform accounting standards for lease
* *
**
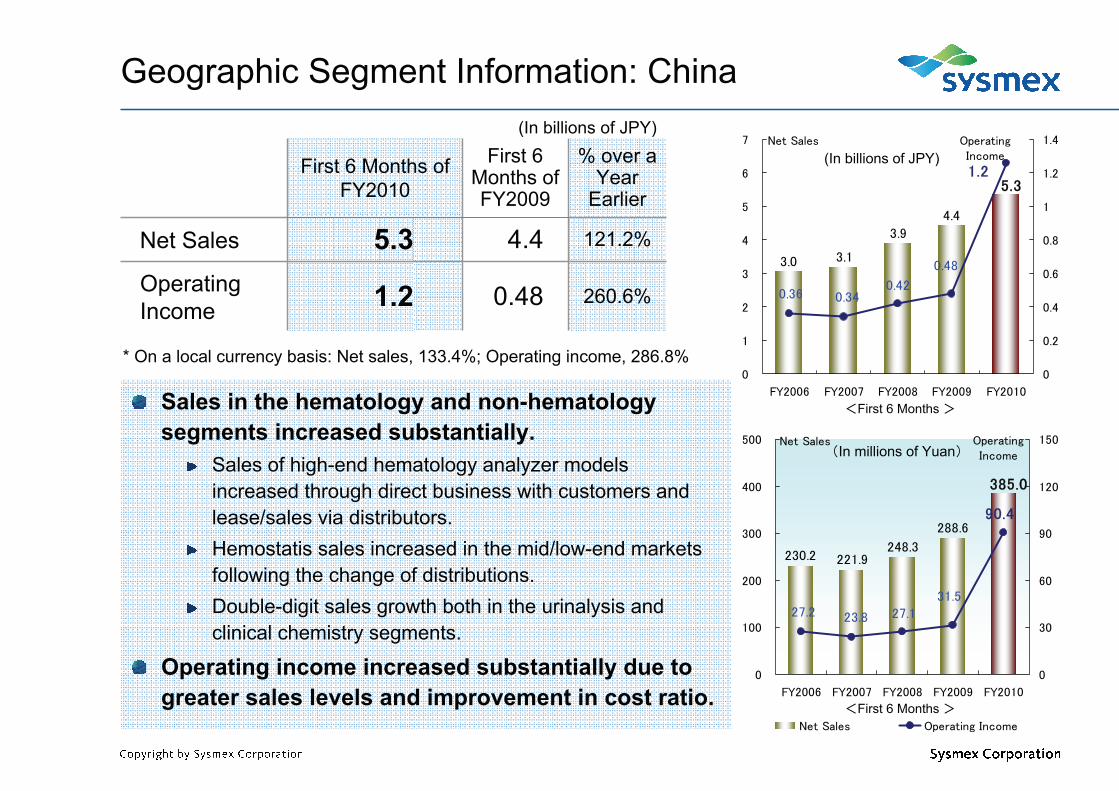
Geographic Segment Information: China
3.0
3.9
4.4
3.1
5.31.2
0.48
0.360.42
0.34
0
1
2
3
4
5
6
7
FY2006 FY2007 FY2008 FY2009 FY2010
Net Sales
0
0.2
0.4
0.6
0.8
1
1.2
1.4OperatingIncome
230.2248.3
288.6
221.9
385.0
90.4
31.527.2 27.123.8
0
100
200
300
400
500
FY2006 FY2007 FY2008 FY2009 FY2010
Net Sales
0
30
60
90
120
150OperatingIncome
Net Sales Operating Income
<First 6 Months >
<First 6 Months >
(In billions of JPY)
(In millions of Yuan)
% over a Year
Earlier
0.48
4.4
First 6 Months of FY2009
260.6%1.2Operating Income
121.2%5.3Net Sales
First 6 Months of FY2010
Sales in the hematology and non-hematology segments increased substantially.
Sales of high-end hematology analyzer models increased through direct business with customers and lease/sales via distributors.Hemostatis sales increased in the mid/low-end markets following the change of distributions.Double-digit sales growth both in the urinalysis and clinical chemistry segments.
Operating income increased substantially due to greater sales levels and improvement in cost ratio.
* On a local currency basis: Net sales, 133.4%; Operating income, 286.8%
(In billions of JPY)

Geographic Segment Information: AP
2.7
1.9
2.8
2.4
1.7
0.260.32
0.200.32
0.53
0
1
2
3
4
FY2006 FY2007 FY2008 FY2009 FY2010
Net Sales
0
0.4
0.8
1.2
1.6OperatingIncome
41.8
27.0
37.2
31.1
26.2
3.6 4.13.1
4.3
8.1
0
15
30
45
60
FY2006 FY2007 FY2008 FY2009 FY2010
Net Sales
0
4
8
12
16OperatingIncome
Net Sales Operating Income
<First 6 Months >
<First 6 Months >
(In billions of JPY)
(In millions of SG$)
% over a Year Earlier
0.32
2.8
First 6 Months of FY2009
162.5%0.53Operating Income
95.9%2.7Net Sales
First 6 Months of FY2010
(In billions of JPY)
Sales increased on a local currency basis in hematology and other fields.
Sales of high-end hematology analyzer models increased in Southeast Asia because of the solutions offered.Sales decreased in Oceania due to the large number of tenders in previous year.
Operating income resumed growth due to Sales increasing and SG&A reduction.
* On a local currency basis: Net sales, 112.3%; Operating income, 190.3%

Intra-area Transfer : Exports to Group AffiliatesSales to Customers: Korea, Taiwan and Mongolia Sales to Customers: Japan Operating Income
Geographic Segment Information: Japan
0.65
10.6
17.716.6
17.1
16.4
17.6
0.870.850.740.68
13.7
16.7
13.711.8
2.8
1.5
3.83.5
3.2
0
10
20
30
40
FY2006 FY2007 FY2008 FY2009 FY2010
0
2
4
6
8
10
12Net Sales Operating Income
32.2
※
34.6
30.930.3
<First 6 Months >
27.9
<Including Korea, Taiwan, and Mongolia, etc.>
(In billions of JPY)(In billions of JPY)
Intraーarea Transfer
Sales to Customers Korea, Taiwan, and
Mongolia, etc.
Japan 103.2%17.117.6
102.0%0.850.87
82.1%16.713.7
% over a Year Earlier
3.8
34.6
First 6 Months of FY2009
39.9%1.5Operating Income
93.0%32.2Net Sales
First 6 Months of FY2010
Japanese marketInstrument sales decreased in severe market.Sales of simplified test kits increased substantially because of the spread of pandemic flu.
Intra-area transfer: Sales to overseas affiliates decreased due to the forex situation.Operating income decreased, partly due to the forex situation.
Still better than the original estimation, partly due to tighter control of SG&A.

Chapter 2
FY2010 Consolidated Earnings Forecast
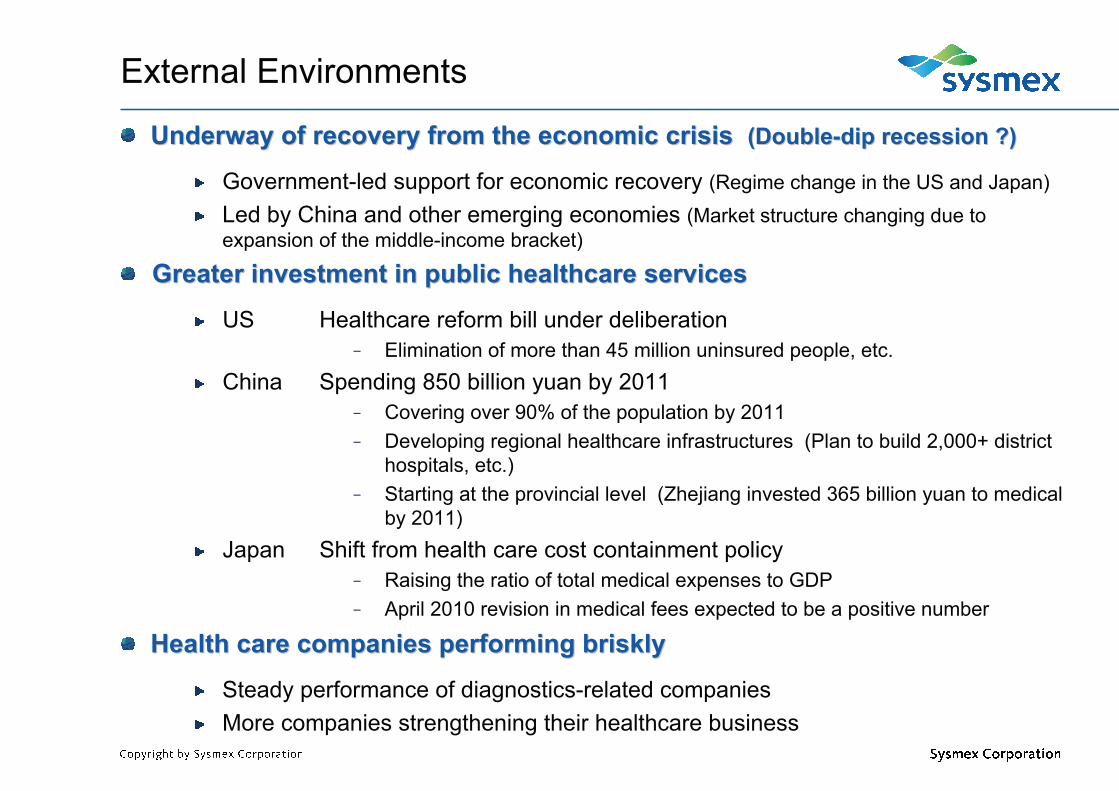
External Environments
Greater investment in public healthcare servicesGreater investment in public healthcare services
US Healthcare reform bill under deliberation– Elimination of more than 45 million uninsured people, etc.
China Spending 850 billion yuan by 2011– Covering over 90% of the population by 2011– Developing regional healthcare infrastructures (Plan to build 2,000+ district
hospitals, etc.)– Starting at the provincial level (Zhejiang invested 365 billion yuan to medical
by 2011)Japan Shift from health care cost containment policy
– Raising the ratio of total medical expenses to GDP– April 2010 revision in medical fees expected to be a positive number
Health care companies performing brisklyHealth care companies performing briskly
Steady performance of diagnostics-related companiesMore companies strengthening their healthcare business
Underway of recovery from the economic crisis Underway of recovery from the economic crisis (Double(Double--dip recession ?)dip recession ?)
Government-led support for economic recovery (Regime change in the US and Japan)Led by China and other emerging economies (Market structure changing due to expansion of the middle-income bracket)
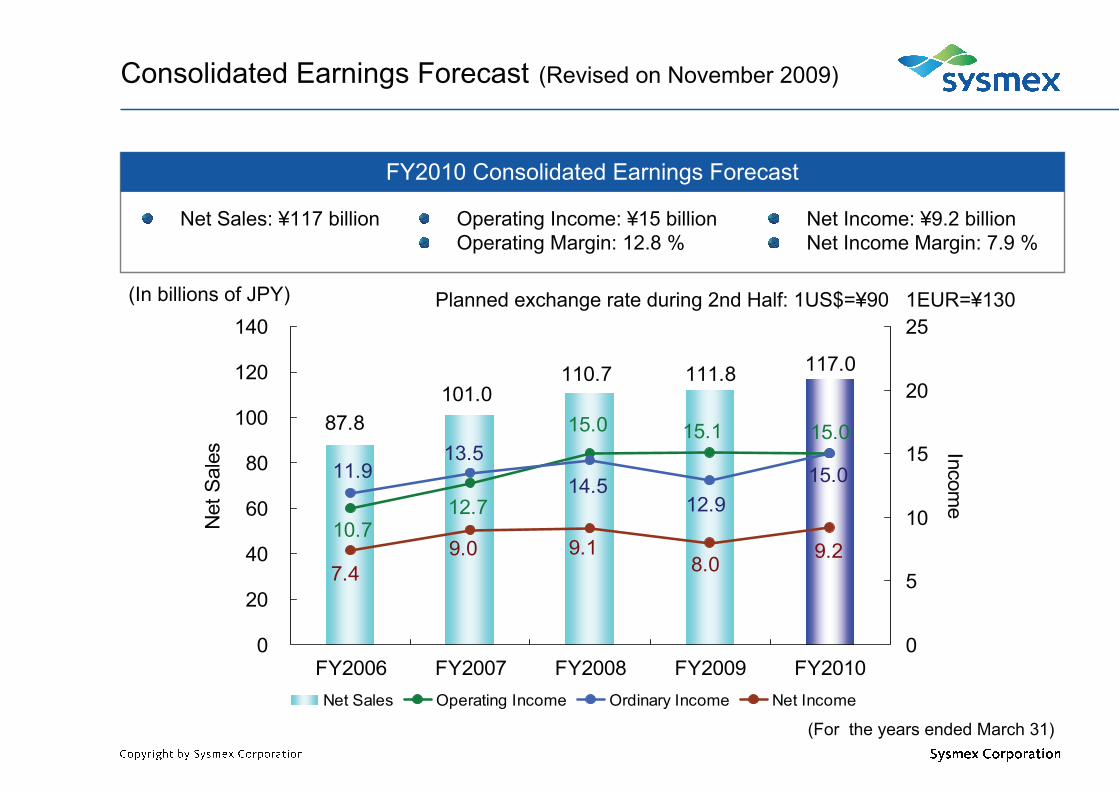
Consolidated Earnings Forecast (Revised on November 2009)
FY2010 Consolidated Earnings Forecast
101.0111.8110.7
87.8
117.0
12.7
15.0
10.7
15.1 15.0
11.913.5
14.512.9
15.0
9.19.07.4
9.28.0
0
20
40
60
80
100
120
140
FY2006 FY2007 FY2008 FY2009 FY2010
Net
Sal
es
0
5
10
15
20
25
Income
Net Sales Operating Income Ordinary Income Net Income
(In billions of JPY)
Net Sales: ¥117 billion Operating Income: ¥15 billionOperating Margin: 12.8 %
Net Income: ¥9.2 billionNet Income Margin: 7.9 %
Planned exchange rate during 2nd Half: 1US$=¥90 1EUR=¥130
(For the years ended March 31)

1EUR
1US$
¥125(2nd Half)¥130
¥95(2nd Half)¥90Planned
Exchange Rate
as of MayRevised on November
¥8.1 billion
¥13 billion
¥13 billion
¥116 billion
FY2010
% over Earlier
113.6%
115.4%
115.4%
100.9%
¥15 billionOrdinary Income
¥9.2 billionNet Income
¥15 billionOperating Income
¥117 billionNet Sales
FY2010
Consolidated Earnings Forecast (Revised on November 2009)

Financial Targets- Sales and Operating Income by Geographical Region (Revised on November 2009)
5.6
4.0
5.35.0
3.7
0.33
0.54
0.36
0.64
0.95
0
2
4
6
8
FY2006 FY2007 FY2008 FY2009 FY2010
Net Sales
0
0.5
1
1.5
2OperatingIncome
Net Sales Operating Income
12.0
6.8
10.1
8.1
6.4
0.78 0.820.61
1.30
2.30
0
3
6
9
12
15
FY2006 FY2007 FY2008 FY2009 FY2010
Net Sales
0
0.6
1.2
1.8
2.4
3OperatingIncome
Net Sales Operating Income
15.6
20.8
23.3
19.1
24.3
2.80
1.78
0.21
0.99
0.59
0
6
12
18
24
30
FY2006 FY2007 FY2008 FY2009 FY2010
Net Sales
0
1
2
3
4
5OperatingIncome
Net Sales Operating Income
36.2
31.5
35.3
39.1
25.3
3.54.6
3.0
5.1 5.3
0
10
20
30
40
50
FY2006 FY2007 FY2008 FY2009 FY2010
Net Sales
0
4
8
12
16
20OperatingIncome
Net Sales Operating Income
22.6
37.8
35.4 35.835.9 37.0
1.3 1.81.71.51.5
30.031.5
29.325.5
6.4
3.24.6
7.87.4
0
20
40
60
80
FY2006 FY2007 FY2008 FY2009 FY2010
0
5
10
15
20Net Sales Operating Income
Japan<Including Korea, Taiwan,
and Mongolia, etc.>
68.869.066.864.9
Americas Europe
China AP
59.3
Intra-area Transfer : Exports to Group Affiliates
Sales to Customers: Korea, Taiwan and Mongolia
Sales to Customers: Japan Operating Income
※
(In billions of JPY)
(For the years ended March 31)
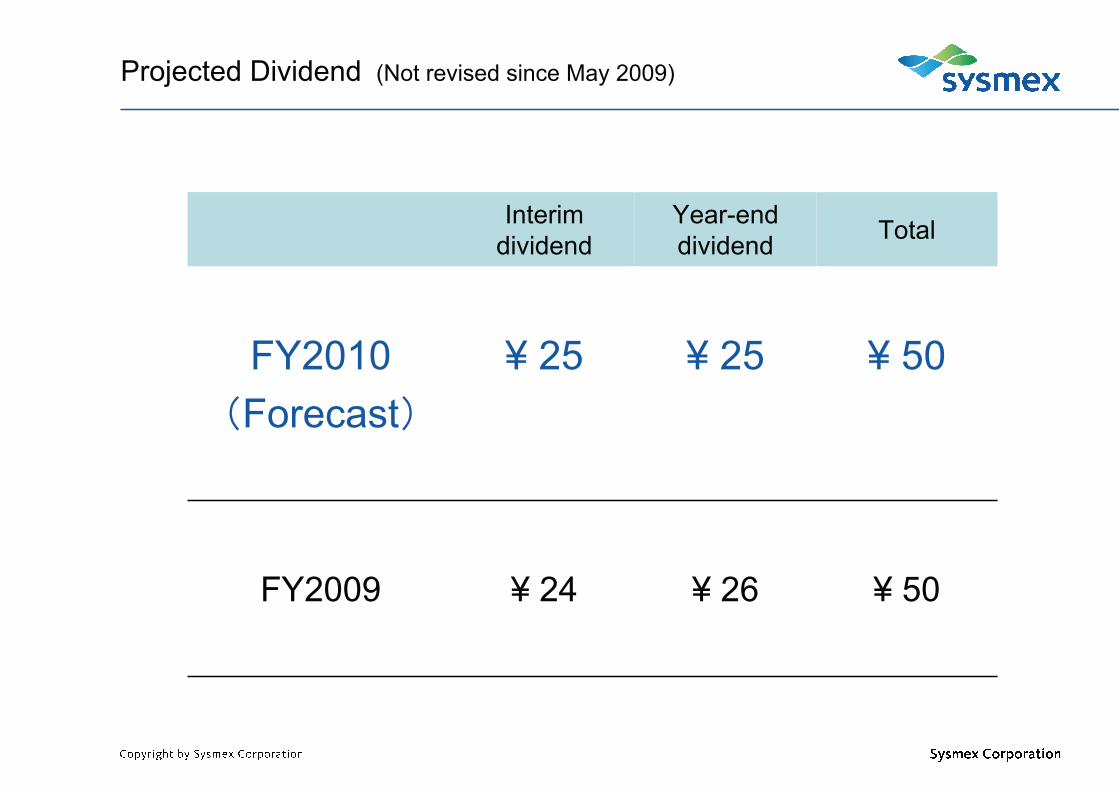
Projected Dividend (Not revised since May 2009)
¥ 50
¥ 50
Total
¥ 26¥ 24FY2009
¥ 25¥ 25FY2010(Forecast)
Year-end dividend
Interim dividend

<Contact>IR & Corporate Communication Div.Phone: +81-78-265-0500Email: [email protected]: