Embed Size (px)
Citation preview

Assessing the Economic and Budgetary Impact of Medicaid
Expansion in Colorado: FY 2015-16 through FY 2034-35

AcknowledgmentsThe Colorado Health Foundation would like to thank the members of the research team for their work on this study.
About the Authors: Charles Brown is the director of the Colorado Futures Center at Colorado State University (CSU). He previously headed up the Colorado Economic Futures Panel and the Center for Colorado’s Economic Future at the University of Denver (DU), where he authored a landmark study showing that growth in required state spending for education, health care and prisons would crowd out funding for higher education, courts and all other state programs by 2024. Prior to joining DU, he spent 29 years in state government, including 17 years as executive director of Legislative Council. He also served as an assistant commissioner of education for the Colorado Department of Education and currently serves as the vice chair of the Colorado State Board of Equalization.
Steven B. Fisher, Ph.D., is an independent economic analyst specializing in economic research and long-term forecasting. Steven provided the long-term economic and demographic forecast for the DRCOG Metrovision 2040 process. He completed a similar project for the North Front Range Metropolitan Planning Organization. He provided the economic and demographic analysis for the City of Arvada Comprehensive Plan update. Steven is a member of economics team of the Colorado Futures Center at CSU. He has a bachelor’s degree from Duke University and a doctorate in economics from the University of Nebraska. From 1983 to 1991, he was director of budget for the City of Boulder. In 1989, he was president of the Denver Association of Business Economists. He currently is based in Louisville, Colorado.
Phyllis Resnick, Ph.D., is the lead economist at the Colorado Futures Center at CSU. In addition to her role at the Center, she also maintains a consulting practice focused on economic and revenue forecasting, revenue and fiscal sustainability studies for state and local governments and economic impact studies. Her current and past clients include the Governor’s Office of State Planning and Budgeting, the region’s metropolitan planning organizations, many of Colorado’s municipal governments and the State of Hawaii. She has led and authored a number of studies exploring state and local tax policy, fiscal sustainability and tax burdens within Colorado; has spoken nationally on the impact of Colorado’s Taxpayer’s Bill of Rights (TABOR) Amendment; and the role of the initiative process in formulating fiscal policy in Colorado. Since 2013, Dr. Resnick has been advising the governments of Rwanda, Tunisia, Angola and Jordan on fiscal and budget issues including open budgets and budget transparency, fiscal decentralization and revenue forecasting. Dr. Resnick completed her master’s and doctoral degrees at the University of Colorado in Boulder and Denver, respectively, and her research explored the effect of tax and expenditure limitations on tax reform efforts in the states.
About the Colorado Health Foundation The Colorado Health Foundation works to make Colorado the healthiest state in the nation by ensuring that all Colorado kids are fit and healthy and that all Coloradans achieve stable, affordable and adequate health coverage to improve their health with support from a network of primary health care and community services. To advance our mission, the Foundation engages the community through grantmaking, public policy and advocacy, private sector engagement, strategic communications, evaluation for learning and assessment and by operating primary care residency training programs. For more information, please visit www.ColoradoHealth.org.
About the Colorado Futures Center The Colorado Futures Center at Colorado State University informs Colorado citizens about economic, fiscal and public policy issues affecting Colorado’s long-term economic health and quality of life by providing unbiased, nonpartisan, objective and highly credible research and analysis. For more information, please visit www.coloradofutures.colostate.edu.
2

Table of Contents
Acknowledgments ............................................................................................................................................2
Executive Summary ...........................................................................................................................................4
The Bottom Line ...........................................................................................................................................4
Methodological Considerations ......................................................................................................................7
I. Introduction ...................................................................................................................................................9
Enrollment Estimates ...................................................................................................................................10
Cost per Enrollee Estimates ..........................................................................................................................12
Funding Responsibility: Federal vs. State ........................................................................................................13
II. Assessing the Economic Impacts of Medicaid Expansion ....................................................................................15
Methodology ............................................................................................................................................15
Findings ...................................................................................................................................................18
III. Assessing the Budgetary Impacts of Medicaid Expansion ...................................................................................21
IV. Current Issues in Medicaid Expansion ............................................................................................................24
Bump Payments and the Economic Impact of Medicaid Expansion ......................................................................24
Possible Implications of Repealing Medicaid Expansion ....................................................................................26
V. Conclusion ................................................................................................................................................31

Published June 20164
Executive Summary
The Bottom Line In 2013, the Colorado General Assembly passed, and Gov. Hickenlooper signed, Senate Bill (SB) 13-200 authorizing the expansion of Medicaid under the 2010 Affordable Care Act (ACA). Colorado is currently one of 32 states (including Washington D.C.) to implement Medicaid expansion after this ACA provision was ruled optional by the U.S. Supreme Court in its 2012 decision in National Federation of Independent Business v. Sebelius. This expansion allowed low-income Coloradans at or below 138 percent of the federal poverty level (FPL) to enroll in Medicaid regardless of their age or parental status.
The Colorado Health Foundation engaged the Colorado Futures Center at CSU to conduct an independent analysis of the full economic and state budgetary impacts of Medicaid eligibility expansion. This research updates a 2013 analysis of the projected impact of Medicaid expansion. The 2013 study was completed before Colorado opted to expand Medicaid. With the passage of SB 13-200, many of the unknowns in the previous analysis are now known including the rate at which Coloradans would enroll in Medicaid and the source of funding for the state match. Now, with two years of experience in Colorado, this updated study looks at actual results of the expansion and forecasts the economic and budgetary impacts out to fiscal year (FY) 2034-35.
According to Colorado’s Medicaid agency, the Department of Health Care Policy and Financing (HCPF), Medicaid expansion will cover 398,9411 additional Coloradans in FY 2017-18, the last FY for which HCPF provides caseload forecasts. Total FY 2017-18 spending on these additional beneficiaries is forecast to be just more than $1.75 billion, 94.5 percent of which will be paid for with federal dollars. As specified under the ACA, the federal government will cover the entire cost of expansion for states expanding Medicaid for the years 2014 through 2016, after which the federal share will gradually reduce until 2020 when the federal government will contribute 90 percent of the total cost of coverage, thus capping the state’s responsibility at 10 percent. SB 13-200 dedicated the Hospital Provider Fee (HPF), a fee paid only by hospitals and separate from the general revenues which fund much of state government, as the source of funding for the state’s responsibility. Collectively, these decisions have had two major fiscal and economic effects in Colorado:
• Medicaid expansion, largely funded by the federal government, is already having and will continue to have a significant positive impact on the state’s economy.
• The combination of federal funding for expansion, the decision to use the HPF as the source of revenue for the state’s share of expansion costs, increased tax revenue due to the larger post-expansion economy and modest savings in other state programs has and will allow Colorado to support this expansion at no cost to the state’s General Fund.
A provision of the ACA required that states increase Medicaid reimbursement rates to the Medicare payment level. This provision, called the “Medicaid parity” or “bump” payments, applied only to calendar years (CYs) 2013 and 2014. For those two years, the federal government paid the full amount of the increase, but thereafter, Congress did not extend the federal support for these payments. After the expiration of the federal bump payments,16 states – including Colorado – opted to continue the program using state funds. However, in Colorado, the extension was approved only through FY 2015-16. If bump payments are not reauthorized beyond the current fiscal year, the economic benefits of Medicaid expansion will be reduced.
Finally, much rhetoric and debate in elective politics at the national level, throughout the states and in Colorado has focused on the repeal of the ACA, including the repeal of Medicaid expansion. While a range of replacement options have been debated and the actions that states would take throughout the country in the wake of such a repeal are speculative, an outright repeal of expansion with no offsetting replacement would have significant economic consequences.
1Some of these participants had received coverage after Colorado expanded Medicaid with House Bill (HB) 09-1293. The language of HB 09-1293 covered parents and adults without dependent children up to 100 percent FPL; however, due to limited funds, adults without dependent children originally were covered only up to 10 percent FPL with enrollment capped at 10,000. Since all HB 09-1293 participants were enrolled after the ACA took effect, they are all considered expansion populations under the ACA, are thus eligible for the enhanced federal match rate and are considered Medicaid expansion populations for the purpose of this analysis.

5
The bottom line key findings from this updated research are shown below.
0%
0.2%
0.4%
0.6%
0.8%
1%
1.2%
1.4%
1.6%
$-
$1,000
$2,000
$3,000
$4,000
$5,000
$6,000
$7,000
$8,000
$9,000
2015–16
2016–17
2017–18
2018–19
2019–20
2020–21
2021–22
2022–23
2023–24
2024–25
2025–26
2026–27
2027–28
2028–29
2029–30
2030–31
2031–32
2032–33
2033–34
2034–35
Increa
se in
Stat
e GDP
(in $
Millio
ns, n
omina
l)
Economic Impact (in $Millions, left axis)
Perce
nt Inc
rease
Impact of Medicaid Expansion as a Share of Total State GDP (right axis)
–
10,000
20,000
30,000
40,000
50,000
2015–16
2016–17
2017–18
2018–19
2019–20
2020–21
2021–22
2022–23
2023–24
2024–25
2025–26
2026–27
2027–28
2028–29
2029–30
2030–31
2031–32
2032–33
2033–34
2034–35
Cumu
lative
Incre
ase i
n Num
ber o
f Job
s
–
$200
$400
$600
$800
$1,000
2015–16
2016–17
2017–18
2018–19
2019–20
2020–21
2021–22
2022–23
2023–24
2024–25
2025–26
2026–27
2027–28
2028–29
2029–30
2030–31
2031–32
2032–33
2033–34
2034–35
Nomi
nal D
ollars
$1,200
–
$50
$100
$150
$200
$250
2015–16
2016–17
2017–18
2018–19
2019–20
2020–21
2021–22
2022–23
2023–24
2024–25
2025–26
2026–27
2027–28
2028–29
2029–30
2030–31
2031–32
2032–33
2033–34
2034–35
Millio
ns of
Nom
inal D
ollars
$300
Total and Percent Increase in Economic Output (State GDP) as a Result of Medicaid Expansion
FINDING 1: Currently, Colorado’s economy, as measured by state gross domestic product (GDP), is $3.82 billion (1.14 percent) larger as a result of Medicaid expansion. By FY 2034-35, the economy will be $8.53 billion (1.38 percent) larger. Because of the increased economic activity created by spending on Medicaid, the economy will be larger in each year up to FY 2034-35 as well.
0%
0.2%
0.4%
0.6%
0.8%
1%
1.2%
1.4%
1.6%
$-
$1,000
$2,000
$3,000
$4,000
$5,000
$6,000
$7,000
$8,000
$9,000
2015–16
2016–17
2017–18
2018–19
2019–20
2020–21
2021–22
2022–23
2023–24
2024–25
2025–26
2026–27
2027–28
2028–29
2029–30
2030–31
2031–32
2032–33
2033–34
2034–35
Increa
se in
Stat
e GDP
(in $
Millio
ns, n
omina
l)
Economic Impact (in $Millions, left axis)
Perce
nt Inc
rease
Impact of Medicaid Expansion as a Share of Total State GDP (right axis)
–
10,000
20,000
30,000
40,000
50,000
2015–16
2016–17
2017–18
2018–19
2019–20
2020–21
2021–22
2022–23
2023–24
2024–25
2025–26
2026–27
2027–28
2028–29
2029–30
2030–31
2031–32
2032–33
2033–34
2034–35
Cumu
lative
Incre
ase i
n Num
ber o
f Job
s
–
$200
$400
$600
$800
$1,000
2015–16
2016–17
2017–18
2018–19
2019–20
2020–21
2021–22
2022–23
2023–24
2024–25
2025–26
2026–27
2027–28
2028–29
2029–30
2030–31
2031–32
2032–33
2033–34
2034–35
Nomi
nal D
ollars
$1,200
–
$50
$100
$150
$200
$250
2015–16
2016–17
2017–18
2018–19
2019–20
2020–21
2021–22
2022–23
2023–24
2024–25
2025–26
2026–27
2027–28
2028–29
2029–30
2030–31
2031–32
2032–33
2033–34
2034–35
Millio
ns of
Nom
inal D
ollars
$300
Cumulative Increase in Employment as a Result of Medicaid Expansion
FINDING 2: Currently, Colorado’s economy supports 31,074 additional jobs due to Medicaid expansion. By FY 2034-35, that number will grow to 43,018, resulting in total employment that is 1.35 percent larger than it would be without Medicaid expansion.
Published June 20166
0%
0.2%
0.4%
0.6%
0.8%
1%
1.2%
1.4%
1.6%
$-
$1,000
$2,000
$3,000
$4,000
$5,000
$6,000
$7,000
$8,000
$9,000
2015–16
2016–17
2017–18
2018–19
2019–20
2020–21
2021–22
2022–23
2023–24
2024–25
2025–26
2026–27
2027–28
2028–29
2029–30
2030–31
2031–32
2032–33
2033–34
2034–35
Increa
se in
Stat
e GDP
(in $
Millio
ns, n
omina
l)
Economic Impact (in $Millions, left axis)
Perce
nt Inc
rease
Impact of Medicaid Expansion as a Share of Total State GDP (right axis)
–
10,000
20,000
30,000
40,000
50,000
2015–16
2016–17
2017–18
2018–19
2019–20
2020–21
2021–22
2022–23
2023–24
2024–25
2025–26
2026–27
2027–28
2028–29
2029–30
2030–31
2031–32
2032–33
2033–34
2034–35
Cumu
lative
Incre
ase i
n Num
ber o
f Job
s
–
$200
$400
$600
$800
$1,000
2015–16
2016–17
2017–18
2018–19
2019–20
2020–21
2021–22
2022–23
2023–24
2024–25
2025–26
2026–27
2027–28
2028–29
2029–30
2030–31
2031–32
2032–33
2033–34
2034–35
Nomi
nal D
ollars
$1,200
–
$50
$100
$150
$200
$250
2015–16
2016–17
2017–18
2018–19
2019–20
2020–21
2021–22
2022–23
2023–24
2024–25
2025–26
2026–27
2027–28
2028–29
2029–30
2030–31
2031–32
2032–33
2033–34
2034–35
Millio
ns of
Nom
inal D
ollars
$300
Increase in Average Annual Household Earnings as a Result of Medicaid Expansion
FINDING 3: Average household earnings in Colorado are currently $643 higher due to the stimulative effect of the Medicaid expansion. By FY 2034-35, Coloradans’ annual average household earnings will be $1,033 higher.
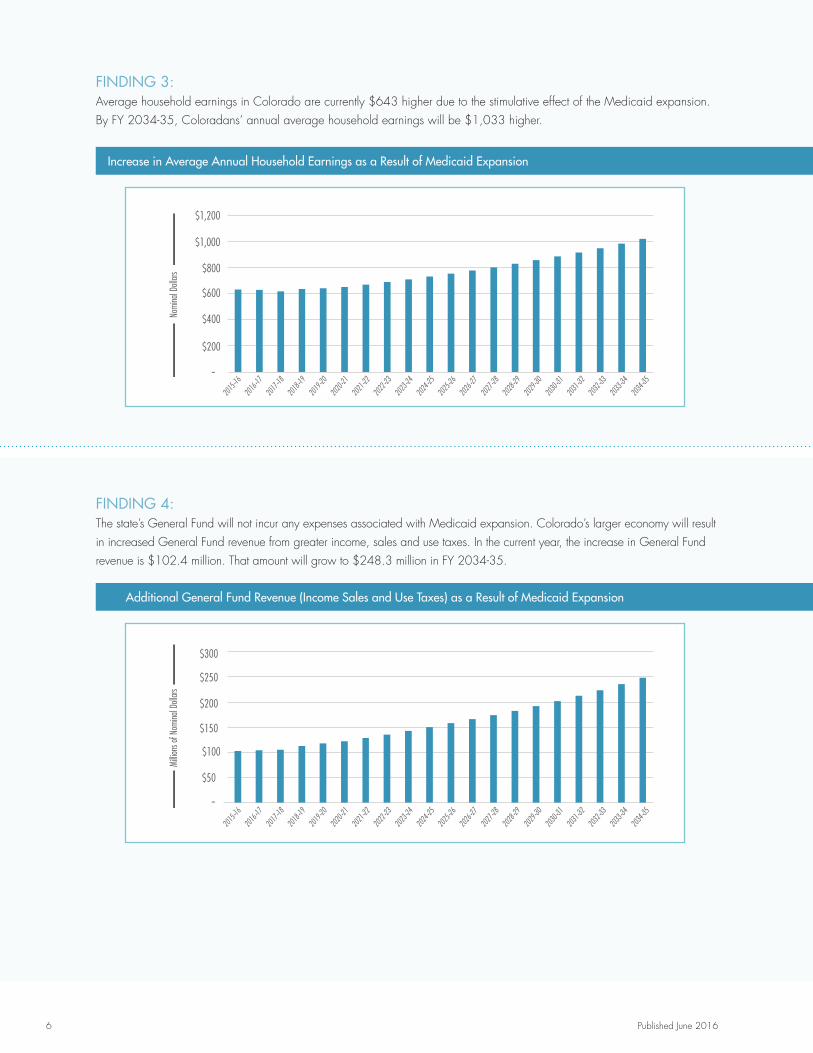
Additional General Fund Revenue (Income Sales and Use Taxes) as a Result of Medicaid Expansion
FINDING 4: The state’s General Fund will not incur any expenses associated with Medicaid expansion. Colorado’s larger economy will result in increased General Fund revenue from greater income, sales and use taxes. In the current year, the increase in General Fund revenue is $102.4 million. That amount will grow to $248.3 million in FY 2034-35.
0%
0.2%
0.4%
0.6%
0.8%
1%
1.2%
1.4%
1.6%
$-
$1,000
$2,000
$3,000
$4,000
$5,000
$6,000
$7,000
$8,000
$9,000
2015–16
2016–17
2017–18
2018–19
2019–20
2020–21
2021–22
2022–23
2023–24
2024–25
2025–26
2026–27
2027–28
2028–29
2029–30
2030–31
2031–32
2032–33
2033–34
2034–35
Increa
se in
Stat
e GDP
(in $
Millio
ns, n
omina
l)
Economic Impact (in $Millions, left axis)
Perce
nt Inc
rease
Impact of Medicaid Expansion as a Share of Total State GDP (right axis)
–
10,000
20,000
30,000
40,000
50,000
2015–16
2016–17
2017–18
2018–19
2019–20
2020–21
2021–22
2022–23
2023–24
2024–25
2025–26
2026–27
2027–28
2028–29
2029–30
2030–31
2031–32
2032–33
2033–34
2034–35
Cumu
lative
Incre
ase i
n Num
ber o
f Job
s
–
$200
$400
$600
$800
$1,000
2015–16
2016–17
2017–18
2018–19
2019–20
2020–21
2021–22
2022–23
2023–24
2024–25
2025–26
2026–27
2027–28
2028–29
2029–30
2030–31
2031–32
2032–33
2033–34
2034–35
Nomi
nal D
ollars
$1,200
–
$50
$100
$150
$200
$250
2015–16
2016–17
2017–18
2018–19
2019–20
2020–21
2021–22
2022–23
2023–24
2024–25
2025–26
2026–27
2027–28
2028–29
2029–30
2030–31
2031–32
2032–33
2033–34
2034–35
Millio
ns of
Nom
inal D
ollars
$300

7
FINDING 5: Elimination of Medicaid parity or bump payments, providing expansion population reimbursements for Medicaid services at the same reimbursement rates for Medicare services, would slightly reduce the positive economic benefits of Colorado’s Medicaid expansion. While the economic consequences of eliminating bump payments for expansion populations were estimated for this Medicaid expansion study, eliminating bump payments would have substantially greater economic impacts as they apply to all non-expansion populations as well. Medicaid expansion populations account for only 29 percent of all Medicaid recipients.
FINDING 6: The repeal of Colorado’s Medicaid expansion would have four major consequences:
• The economic stimulus reported would be reversed, resulting in a lower state GDP, lower household incomes and fewer jobs.
• Health care access for low-income Coloradans would be reduced.
• The budgets of low-income households would be reduced.
• Levels of uncompensated care by health care providers would be increased and their costs would rise due to the use of emergency departments for non-emergency primary care and increased hospitalizations for illnesses that could have been treated in an outpatient setting.
Methodological Considerations Economic Impacts This update to the 2013 study uses actual data from the first two years of expansion in order to determine how much larger the state’s economy is and will be in the future as a result of the 2013 decision to expand Medicaid. The magnitude of the increased economic activity was estimated by the application of multiplier analysis, using a multiplier model built with Colorado-specific Regional Input-Output Modeling System (RIMS II) multipliers from the U.S. Bureau of Economic Analysis. Multiplier studies fully quantify all of the re-spending effects from an infusion of dollars into the economy. For example, an additional dollar of Medicaid spending creates more hospital revenue. Hospitals, in turn, order more medical supplies, creating more revenue at hospital supply companies. Hospital supply companies then hire more workers, creating more household income that perhaps is spent at restaurants, and as a result, the restaurant workers have more income. This process continues, creating a multiplicative effect on economic activity in the state. For this study, the RIMS II multipliers were applied to three broad measures of the Colorado economy: total state output as measured by state GDP, household earnings and employment.

Published June 20168
Budgetary Impacts Despite the fact that SB 13-200 specified that the state cost of Medicaid expansion be paid from the HPF instead of the state General Fund, the ACA in general and other underlying provisions of the Medicaid program have resulted in General Fund impacts. The ACA’s individual mandate required most Americans to have health coverage and in the months leading up to ACA implementation, significant statewide outreach and enrollment (O&E) efforts were undertaken to inform and enroll Coloradans into coverage. As a result of these O&E efforts, many Coloradans who were eligible but not enrolled (EBNE) subsequently enrolled into Medicaid coverage. Since most of these EBNE populations were qualified for coverage before Medicaid expansion, they were not considered “expansion populations” under the ACA’s Medicaid expansion. For that reason, they were not eligible for full federal funding for the first three years. Instead, they contributed to caseload increases for the pre-expansion Medicaid program, the majority of which is funded at 50 percent federal and 50 percent state General Fund support.
For purposes of delineating both the economic and budgetary impacts of Medicaid expansion in Colorado, the EBNE populations were not considered expansion populations in this analysis because it is very likely they would have enrolled regardless of the decision to expand Medicaid under SB 13-200. This determination was made for the following reasons:
• Colorado is a state which created its own marketplace under the ACA. The marketplace and its community partners conducted an extensive outreach effort to enroll Coloradans into coverage and it was through this outreach effort that many of the EBNE populations were enrolled into Medicaid. The outreach efforts would have occurred even if Medicaid had not been expanded. Thus, the EBNE effect is one of the ACA overall and not specific to Medicaid expansion.
• The individual mandate in the ACA informed many Coloradans of the need to have health care. Upon inquiry in response to the individual mandate, they found they were Medicaid eligible and enrolled.
• States that did not expand Medicaid also saw large increases in Medicaid enrollment. This suggests that the EBNE effect is of the ACA overall and not specific to Medicaid expansion.
For these reasons, the General Fund impact from the EBNE enrollment was attributed to other parts of the ACA rather than to Colorado’s decision to expand Medicaid.

9
I. IntroductionThe ACA was signed into law on March 23, 2010. The legislation was challenged on grounds of constitutionality in the case of National Federation of Independent Business v. Sebelius, ultimately decided by the U.S. Supreme Court on June 28, 2012. The Supreme Court ruling upheld the constitutionality of most provisions of the ACA. The one part of the ACA the Supreme Court ruled unconstitutional was the sanction that states expand their Medicaid programs in accordance with the ACA’s provisions or lose all federal funding for their existing Medicaid programs. The ruling effectively made Medicaid eligibility expansion to 138 percent of FPL optional for states.
Late in 2012, the Colorado Health Foundation sponsored a study to analyze of the full economic and state budgetary impacts to Colorado regarding the state’s decision to either fully expand Medicaid eligibility in accordance with ACA or maintain its current Medicaid eligibility. An advisory group made up of health policy, business and economic experts provided guidance and input to the analysis. That study was published in the winter of 2013.
At the time of the 2012 analysis, there were many unknowns surrounding the decision of whether or not to expand Medicaid and its impact on the economy. Chief among the unknowns was:
• The source of state revenue which would be used for the state share of Medicaid costs should Colorado choose to expand.
• The rate at which newly eligible Coloradans would enroll in Medicaid coverage and the per caseload cost of covering those newly eligible populations.
• The decisions of Coloradans who were EBNE in Medicaid coverage and whether the EBNE populations would enroll regardless of the state’s decision regarding Medicaid expansion.
During the 2013 legislative session, the Colorado General Assembly passed, and Gov. Hickenlooper signed, SB 13-200 expanding Medicaid to all Coloradans earning up to 138 percent of FPL. As a result of SB 13-200, on Jan. 1, 2014, all Coloradans earning up to 138 percent FPL became eligible for Medicaid and for the first time Medicaid was universally available to all parents, caretakers and adults without dependent children who fell under the 138 percent FPL threshold. In FY 2014-15, the first full FY of implementation of Medicaid expansion, just over 312,000 Coloradans in the parent, caretaker and adults without dependent children cohorts were enrolled in Medicaid. Covering these expansion populations had a total cost of just over $1.3 billion.
Many of the questions that loomed over the 2012 analysis have now been answered. Colorado was one of 32 states (including Washington D.C.) to expand Medicaid, and the bill that authorized the expansion also designated the HPF as the source of funding for the state’s responsibility to pay its share of the costs for the expansion populations. Actual data for two full CYs (and almost two full FYs) of expansion now exist. Given Colorado’s extensive O&E activities, enrollment rates for the remaining EBNE populations can be more accurately estimated. This actual data serves as the basis of this update to the economic and budgetary analysis of the Medicaid expansion decision.
This update to the 2013 study answers the question of how much larger the state’s economy is and will be in the future as a result of the 2013 decision to expand Medicaid. To answer this question, the forecast horizon was extended to FY 2034-35. Consistent with the previous analysis, the magnitude of the increased economic activity was assessed with a multiplier model built with Colorado-specific RIMS II multipliers from the U.S. Bureau of Economic Analysis.
Published June 201610
The updated analysis quantifies the impact of Medicaid expansion in Colorado on both the economy and the state government’s budget, with special focus on the state General Fund. The economic impact looks specifically at how Medicaid expansion affects state GDP, employment and earnings. In addition, two policy issues not germane to the original study were considered: the extent to which eliminating the Medicaid parity or bump payments, originally authorized under Section 1202 of the ACA, would affect the economic impact of expansion; and a qualitative look at the societal and household impacts of a repeal of Medicaid expansion legislation.
The economic impact analysis is uniquely sensitive to the total spending on expansion. Total spending is a function of the total enrollment of expansion populations and the cost per enrollee. The impact analysis is further sensitive to the source (federal or state) of the spending. The following sections detail the enrollment forecast, cost per enrollee and the split between state and federal funding.
Enrollment Estimates
The state Medicaid agency, HCPF, maintains and regularly updates Medicaid cohort forecasts. At the time of this analysis, the HCPF forecasts had a horizon of FY 2017-18 with actual data through FY 2013-14. For this analysis, the HCPF forecast through FY 2017-18 was used as the jumping off point for the forecast through FY 2034-35.
Similar to the HCPF approach to forecasting caseloads, a series of methodological approaches were explored in establishing a long-term forecast. Given that the populations of interest to this study are expansion caseloads, there is only a minimum of historical data. Nonetheless, forecasts based on trend; the relationship to the growth rates forecast by the Colorado State Demography Office for the reference populations for each of the cohorts; and historical and short-term HCPF projected rates of growth for the relevant cohorts were examined. From that process, baseline forecasts were established. One population (adults without dependent children) forecast better with a model that relates the Medicaid populations to the underlying reference population and the other (parents/caretakers) fit better with a trend growth rate for the actual Medicaid population.
These baseline forecast assumptions were then evaluated against the previous long-term Medicaid forecasts both in the 2012 Medicaid expansion study and in the more recent 2013 study of the long-term fiscal sustainability of Colorado State Government.2 In addition, the forecast assumptions were reviewed by other Medicaid experts in the state. Both approaches reinforced the forecast approach utilized.
Forecast approaches for the two expansion cohorts and the rationale for each are as follows:
Adults without Dependent Children – Throughout the HCPF forecast, the adults without dependent children cohort grows as a share of its reference population of adults 19-65 years old. However, over the years of the HCPF forecast, that share’s rate of increase is slowing and appears to be settling at just short of 8.75 percent of the underlying population. Starting at 7.06 percent of the reference population in FY 2014-15, it grows to 8.67 percent by FY 2017-18. Since the share of the reference population was beginning to settle, this cohort is forecast to continue to settle and ultimately grow at a rate that is consistent with 8.75 percent of the underlying reference population enrolled in Medicaid. This forecast results in the actual growth rate of Medicaid enrollees in this cohort slowing from 2.24 percent at the end of the HCPF forecast to a rate of 1.17 percent annually by FY 2034-35.
2Colorado Futures Center at CSU, “Financing Colorado’s Future – A Fresh Look at the Funding of State Government.” 2013. Available at www.coloradofutures.colostate.edu/. Accessed April 26, 2016.

11
Parents and Caretakers – Unlike for adults without dependent children, the HCPF forecast for the parents and caretakers cohort continued to grow, without slowing, as a share of its reference population of adults 18-59 years old. Holding this cohort constant at the FY 2017-18 share of the underlying population would drop its cohort enrollee growth rate from a current rate of between 4 percent and 5 percent to a rate just over 1 percent in the long-term forecast. Given the HCPF projections of a cohort enrollee growth rate between 4 percent and 5 percent for all years, a rapid decline in the rate of enrollee growth to just over 1 percent was implausible. Instead, trend analysis suggests that the growth rate in this cohort will slow slightly and then remain constant as the expansion matures. The forecast phases the growth rate for this cohort down to 4 percent per year which is then held constant at that rate throughout the forecast horizon. This does, however, result in an increase in the share of the reference population enrolled in Medicaid from a short-term level of just under 3 percent to approximately 4.4 percent in FY 2034-35.
Table 1 and Chart 1 display the trajectory of enrollment growth in the two expansion cohorts throughout the forecast period. It is important to note that these are trend forecasts that do not attempt to project the effect of any future economic downturns on enrollment growth.
TABLE 1: Medicaid Enrollment of Expansion Populations, Actual and Forecast
Enrollment Category
FY 2013-14 Actual (half year of
implementation)
FY 2014-15 HCPF Forecast
FY 2015-16 HCPF Forecast
FY 2016-17 HCPF Forecast
FY 2017-18 HCPF Forecast
FY 2034-35 Study Forecast
Parents and Caretakers
47,082 71,609 82,897 86,948 91,000 177,259
Adults without Dependent
Children 87,243 240,758 293,091 303,341 307,941 383,402
Total 134,325 312,367 375,988 390,289 398,941 560,661
CHART 1: Enrollment of Expansion Populations, Actual and Forecast
0
50,000
100,000
150,000
200,000
250,000
300,000
350,000
400,000
450,000
2015–16
2016–17
2017–18
2018–19
2019–20
2020–21
2021–22
2022–23
2023–24
2024–25
2025–26
2026–27
2027–28
2028–29
2029–30
2030–31
2031–32
2032–33
2033–34
2034–35
2013–14
(half
year actual)
Adults without Dependent Children Parents and Caretakers

Published June 201612
Cost per Enrollee Estimates
As with enrollment, HCPF produces regular forecasts of cost per enrollee for both medical services premiums and mental health, the two major components of cost for Medicaid enrollees. Consistent with the enrollment forecasts, the HCPF cost per caseload forecasts currently extends to FY 2017-18. Also consistent with the enrollment forecast approach, the HCPF forecasts through FY 2017-18 are used as the jumping off point for cost per caseload forecasts for the years after the HCPF forecast and through to the forecast horizon of FY 2034-35.
The standard method for forecasting the growth in health care costs in publicly funded health programs comes from the Congressional Budget Office (CBO). The CBO method applies an excess cost growth factor to the level of underlying inflation in the local economy where the health care is consumed. Consistent with both the CBO approach and the approach used in the 2012 study, the CBO excess cost growth factor3 for Medicaid was added to the Colorado Futures Center forecast of local inflation as measured by the Denver-Boulder-Greeley Consumer Price Index. This approach has led to an average rate of health care inflation of 3.22 percent over the forecast period, far lower than the 5.5 percent average health care inflation projected in the 2012 study. The lower level of projected health care inflation results from a dampening of both overall inflationary expectations in the general economy and a CBO reduction in the level of excess cost growth. The reduction in CBO’s forecast for excess cost growth is a result of the expectation of future policy changes designed to drive efficiencies in health care delivery for Medicaid enrollees.
CHART 2: Projected Medicaid Inflation
TABLE 2: Average Cost per New Enrollee, Medical Service Premiums and Mental Health, Actual and Forecast
Enrollment Category FY 2013-14 Actual (half year of implementation) FY 2014-15 HCPF FY 2034-35 Study Forecast
MEDICAL SERVICES PREMIUMS
Parents and Caretakers $2,399.40 $2,486.74 $4,113.06
Adults without Dependent Children
$3,765.62 $3,884.89 $7,017.87
MENTAL HEALTH
Parents and Caretakers $215.56 $239.27 $463.63
Adults without Dependent Children
$1,061.53 $692.43 $1,363.72
0.00%
1.00%
1.50%
2.00%
2.50%
3.00%
3.50%
4.00%
2015–16
2016–17
2017–18
2018–19
2019–20
2020–21
2021–22
2022–23
2023–24
2024–25
2025–26
2026–27
2027–28
2028–29
2029–30
2030–31
2031–32
2032–33
2033–34
2034–35
0.50%
2014–15
3 The CBO excess cost factor used in this study is available from the Congressional Budget Office. “The Long-Term Outlook for Major Federal Health Care Programs.” 2015. Available at http://www.cbo.gov/sites/default/files/114th-congress-2015-2016/reports/50250/50250-breakout-Chapter2-2.pdf. Accessed April 26, 2016.

13
Funding Responsibility: Federal vs. State
Combining the forecasts for enrollees in the expansion populations and cost per enrollee produces a forecast for the total direct cost4 of expansion. That forecast is reflected in Chart 3. It is important to note that HB 09-1293 expanded Medicaid coverage in Colorado to parents and caretakers of eligible children between 60 and 100 percent of FPL and to adults without dependent children up to 100 percent of FPL, although funding limitations had led to a capped enrollment of 10,000 individuals up to 10 percent of FPL for the latter group. Even though these populations were authorized for Medicaid coverage in 2009, both cohorts are considered expansion populations under the ACA and are included in the enrollee forecasts above and the total direct cost of coverage displayed below.
CHART 3: Direct Cost of Expansion, All Populations
The ACA authorizes an enhanced federal match rate for expansion populations. In Colorado’s case, the enhanced rate applies also to the parents, caretakers and adults without dependent children who received coverage under HB 09-1293 in 2009. Under the ACA, the federal government pays 100 percent of the direct cost of expansion for the first three CYs (2014-16). After 2016, the federal share declines slowly until 2020 and the federal share is fixed at 90 percent thereafter. Table 3 shows the federal and state shares for expansion populations. Since Colorado budgets on a July 1 FY, the CY match rates are converted to FYs by averaging the appropriate years.
4There are administrative costs to expansion as well. Those costs are included in the economic impact analysis but not reflected here.
$-
$500
$1,000
$1,500
$2,000
$2,500
$3,000
$3,500
$4,000
$4,500
2015–16
2016–17
2017–18
2018–19
2019–20
2020–21
2021–22
2022–23
2023–24
2024–25
2025–26
2026–27
2027–28
2028–29
2029–30
2030–31
2031–32
2032–33
2033–34
2034–35
2013–14
(half
year actual)
in $M
illion
s

Published June 201614
TABLE 3: Federal Match Rate for Expansion Populations
CY CY Federal Enhanced Match FY FY Federal Enhanced Match
2014 100% 2014-15 100%
2015 100% 2015-16 100%
2016 100% 2016-17 97.5%
2017 95% 2017-18 94.5%
2018 94% 2018-19 93.5%
2019 93% 2019-20 91.5%
2020 & Beyond 90% 2020-21 & Beyond 90%
Chart 4 shows the year by year funding split for the direct costs of covering the expansion populations in the Medicaid program. Colorado’s Medicaid expansion law (SB 13-200), specifies that the source of funding for the state share is the HPF and not the General Fund.
CHART 4: Funding Split for Expansion Populations
This funding split is important for both the analysis of the economic and budgetary impacts of Medicaid expansion. As will be described in the next section on the economic impact analysis, federal expenditures have a larger economic impact than state expenditures. So, the structure of the ACA Medicaid expansion, with its enhanced federal match rates, creates a larger economic impact than the base Medicaid program which for Colorado carries a 50 percent federal match for most enrollees. The decision embodied by SB 13-200 to use the HPF as the source of funding for the state share forms the basis of the finding that the expansion was accomplished with no General Fund impact. This finding will be discussed in Section III on budgetary impacts of Medicaid expansion.
$-
$500
$1,000
$1,500
$2,000
$2,500
$3,000
$3,500
$4,000
2015–16
2016–17
2017–18
2018–19
2019–20
2020–21
2021–22
2022–23
2023–24
2024–25
2025–26
2026–27
2027–28
2028–29
2029–30
2030–31
2031–32
2032–33
2033–34
2034–35
2013–14
(half
year actual)
in $M
illion
s
Federal Expenditures State Expenditures

15
II. Assessing the Economic Impacts of Medicaid Expansion
Economic impacts occur when a policy change results in a change in patterns and/or levels of spending within an economy. In the case of Medicaid expansion, both levels and patterns of spending will change with a decision for full expansion. Levels will change largely because of the large infusion of federal dollars to support expansion populations and spending patterns will change, particularly for hospitals as they must finance the state cost of expansion by supporting the HPF in their budgets.
Methodology
Multiplier analysis quantifies the direct, indirect and induced effects of an infusion or redirection of additional dollars into a state or regional economy. In the case of Medicaid expansion, the initial infusion is spent by health care providers and a direct spending effect is created. The impact on economic activity does not end, however, with the direct payment to health care providers. Instead, the increased demand for medical services also creates a demand for health supplies and other allied health care spending. This secondary health care spending is referred to as the indirect effect. In the case of direct and indirect health care spending, much of the spending is made within the state and local economy, resulting in higher employment levels and household incomes for those in the health care and allied health care sectors. When health care-related workers spend additional income on household-related purchases, they create an induced effect by creating demand for items such as restaurant meals, consumer goods and personal services. As a result, workers in those induced sectors have additional income and employment opportunities, and the cycle continues. This process is referred to as the multiplier effect and the full quantification of that effect measures the economic impact of a policy decision such as Medicaid expansion. Figure A depicts this effect. In the case of Medicaid expansion in Colorado, much of the direct injection of spending into the economy is the result of federal funds flowing into the state.
FIGURE A: Multiplier Effect
As will be described later, this study also models an offsetting contractionary effect to account for the reduction in hospital spending elsewhere in their budgets in order to support payment of the HPF.
There are several different tools that combine the direct, indirect and induced effects to quantify the overall impact of public and private investments. This analysis utilizes the RIMS II created by the U.S. Bureau of Economic Analysis. This methodology has been widely used for approximately 40 years to assess economic impacts at the regional, state and local levels of government throughout the U.S.
New Increased State Economic
Activity
Plus Induced Effect: More
Jobs and Incomes Result in Increases in All Other Purchases such as those for Household Goods
and Services
Plus Indirect Effect: Additional
Spending in Allied Health Care Sectors
such as Medical Suppliers
Direct Effect: Direct Health Care Sectors
Expand
Injection of $ to Expand Medicaid

Published June 201616
RIMS II In order to gauge the economic impact of the Medicaid expansion decision, it is necessary to account for both the spending impacts that expand the state economy, predominately the large infusion of federal dollars to support expansion, as well as those that contract it. In this analysis, the factor causing offsetting or contractionary economic impacts is the drag to the economy5 from the financing of the state share of the costs for expansion populations with the HPF.6 To better account for all the changes in spending patterns, the net economic impact is measured by the expansionary effect less the contractionary effect.
This economic analysis evaluated the effect of the spending on the Medicaid expansion populations only. In the wake of ACA implementation, a share of the EBNE population subsequently enrolled into Medicaid. This analysis does not attribute the EBNE enrollment Medicaid expansion but to the ACA overall for the following reasons:
• Colorado is a state which created its own marketplace under the ACA. The marketplace and its community partners conducted an extensive outreach effort to enroll Coloradans into coverage due to the coverage mandate provision of the ACA. It was through this outreach effort that many of the EBNE populations were enrolled into Medicaid. The outreach efforts would have occurred even if Medicaid had not been expanded. Thus, the EBNE effect is one of the ACA overall and not specific to the Medicaid expansion.
• The individual mandate in the ACA informed many Coloradans of the need to have health care. Upon inquiry in response to the individual mandate, they found they were Medicaid eligible under pre-expansion criteria and enrolled.
• States which did not expand Medicaid also saw large increases in Medicaid enrollment. This confirms that the EBNE effect is attributable to the ACA overall and not specifically to Medicaid expansion.
Although the spending associated with take-up of coverage by the EBNE populations has positive economic effects,7 those effects occur regardless of the expansion decision, so the economic impact attributed to Medicaid expansion is restricted only to spending on expansion populations.
The RIMS II Multipliers in More Detail The RIMS II dataset includes two different classes of multipliers, “direct effect” multipliers and “final demand” multipliers. The available data drives the selection of the appropriate class. In the case of Medicaid expansion, the data represent the change in final demand for health care services associated with serving the expansion populations with Medicaid. These data come largely from the analysis of the budgetary impacts of Medicaid expansion combining the estimated increased enrollment in the program and the per-enrollee cost, essentially an estimate of the dollar value of the final demand for medical services resulting from a decision to expand Medicaid. Therefore, for this analysis, final demand multipliers are used.
For each class there are also two types of multipliers: Type I and Type II. Type II multipliers are more commonly utilized because:
These multipliers not only account for the direct and indirect impacts based on how goods and services are supplied within the region, but they also account for the induced impacts based on changes in the spending of earnings by labor within the region.8
5 The 2012 study also included the reduction in federal disproportionate share funding as a contractionary effect. However, to date, that reduction has not occurred. Given that the reduction has not occurred that contractionary effect was removed from the model.
6 In this study, the contractionary effect of taxes supporting the federal spending are not accounted for because Coloradans are responsible for the same levels of federal taxes regardless of the state’s decision on Medicaid expansion. 7The enrollment of the EBNE populations has General Fund budgetary effects that are discussed in the section on budgetary impacts of expansion.8Department of Commerce Bureau of Economic Analysis, “Regional Multipliers: A User Handbook for the Regional Input-Output Modeling System (RIMS II).” 1997.
17
9 The administrative component of the blended multipliers is from the RIMS II final demand multipliers for administrative and support services. Their values are as follows: • Output – 2.2117 • Employment - 25.0136 • Earnings – 0.8157
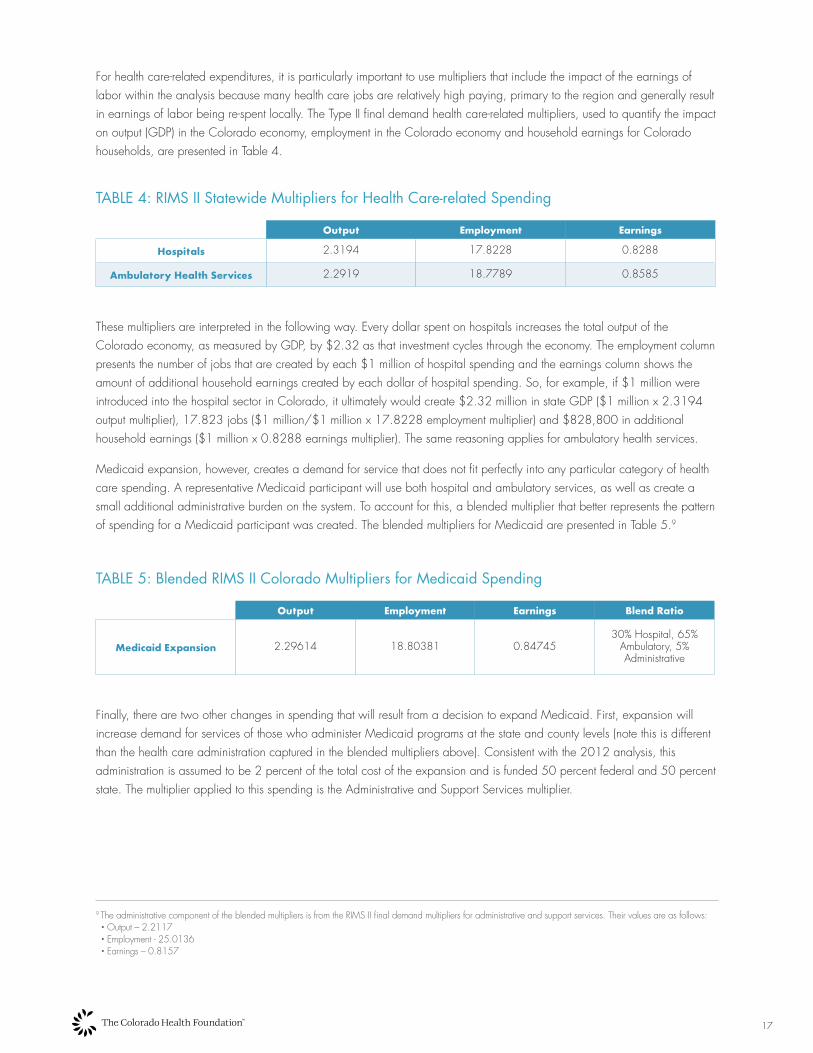
For health care-related expenditures, it is particularly important to use multipliers that include the impact of the earnings of labor within the analysis because many health care jobs are relatively high paying, primary to the region and generally result in earnings of labor being re-spent locally. The Type II final demand health care-related multipliers, used to quantify the impact on output (GDP) in the Colorado economy, employment in the Colorado economy and household earnings for Colorado households, are presented in Table 4.
TABLE 4: RIMS II Statewide Multipliers for Health Care-related Spending
Output Employment Earnings
Hospitals 2.3194 17.8228 0.8288
Ambulatory Health Services 2.2919 18.7789 0.8585
These multipliers are interpreted in the following way. Every dollar spent on hospitals increases the total output of the Colorado economy, as measured by GDP, by $2.32 as that investment cycles through the economy. The employment column presents the number of jobs that are created by each $1 million of hospital spending and the earnings column shows the amount of additional household earnings created by each dollar of hospital spending. So, for example, if $1 million were introduced into the hospital sector in Colorado, it ultimately would create $2.32 million in state GDP ($1 million x 2.3194 output multiplier), 17.823 jobs ($1 million/$1 million x 17.8228 employment multiplier) and $828,800 in additional household earnings ($1 million x 0.8288 earnings multiplier). The same reasoning applies for ambulatory health services.
Medicaid expansion, however, creates a demand for service that does not fit perfectly into any particular category of health care spending. A representative Medicaid participant will use both hospital and ambulatory services, as well as create a small additional administrative burden on the system. To account for this, a blended multiplier that better represents the pattern of spending for a Medicaid participant was created. The blended multipliers for Medicaid are presented in Table 5.9
TABLE 5: Blended RIMS II Colorado Multipliers for Medicaid Spending
Output Employment Earnings Blend Ratio
Medicaid Expansion 2.29614 18.80381 0.8474530% Hospital, 65%
Ambulatory, 5% Administrative
Finally, there are two other changes in spending that will result from a decision to expand Medicaid. First, expansion will increase demand for services of those who administer Medicaid programs at the state and county levels (note this is different than the health care administration captured in the blended multipliers above). Consistent with the 2012 analysis, this administration is assumed to be 2 percent of the total cost of the expansion and is funded 50 percent federal and 50 percent state. The multiplier applied to this spending is the Administrative and Support Services multiplier.

Published June 201618
Second, as noted elsewhere in this report, Medicaid expansion is not free. In FY 2017-18, the state, using the HPF, begins to bear a share of the cost of expansion. Hospitals will bear the burden of that fee by reducing hospital spending elsewhere. In the model, the economic drain created by this need to finance the state share by hospitals is characterized as a reduction in spending on other hospital spending and is analyzed with the hospital multiplier.
Findings
By far the largest change associated with a decision to expand Medicaid is the increase in direct health care spending for newly eligible Medicaid enrollees. As the budgetary analysis shows, the majority of this spending will be of federal funds that will come to Colorado to support expansion. In the later years of the study, the federal funds will be matched by the state at a rate of 90 percent federal, 10 percent state for expansion populations. In addition, expansion populations covered by HB 09-1293, and previously paid for 50 percent with federal dollars and 50 percent with state HPF funds, will transition to the enhanced federal match that ultimately results in a 90 percent/10 percent federal/state split. This direct health care spending, whether federally or state funded, has an expansionary effect on the economy.
Second, increased Medicaid enrollment will drive additional program administration. The increased federal and state spending for Medicaid administration, although very small relative to the direct health care spending, will serve to expand the economy.
These factors, taken together, unambiguously serve to expand the Colorado economy. However, the analysis recognizes that there are offsetting impacts that result from the decision around Medicaid expansion that also contract the economy. In order to fully quantify the net economic impact, the expansionary spending is offset with changes that are contractionary, specifically the reduction in hospital spending that will be required in order to finance the HPF.
RIMS II multipliers were used to assess the economic impacts of Medicaid expansion on state GDP, employment and household earnings. In addition, a larger state economy resulting from the infusion of federal dollars supporting Medicaid expansion are estimated to yield additional state General Fund tax revenue assuming existing tax rates. The General Fund revenue increase estimate is, however, not directly a multiplier analysis.
In all cases, the assessment of the larger economy is related only to the expenditures on the expansion populations and the future years are stated in non-inflation adjusted or nominal dollars. The economic impact reported is relative to the baseline long-term trend forecast for GDP, employment and household earnings in Colorado. Forecasting the business cycle is not attempted. Under these assumptions, the overall conclusion is as follows:
Relative to a baseline of no expansion, the decision to expand Medicaid yielded and will continue to yield a larger Colorado economy, more jobs and an increase in average household income for all years of the study period.
The following sections delineate this overall finding in more detail.
Impact of Medicaid Expansion: State GDP will be 1.38 Percent Larger in FY 2034-35
Colorado’s economy will be larger as a result of a decision to expand Medicaid. Currently, the economy is $3.82 billion larger than it would have been without expansion. By FY 2034-35, the economy will be $8.53 billion or 1.38 percent larger than it would have been had Colorado opted out of Medicaid expansion. Chart 5 shows the net economic impact of expanding Medicaid.

19
CHART 5: Economic Impact of Expansion on State GDP
Medicaid expansion supports more than just larger state output. The larger economy will also have higher levels of employment and that increased employment will result in higher average household wages.
Impact of Medicaid Expansion: Colorado will have 43,018 Additional Jobs in FY 2034-35
As a result of Medicaid expansion, the Colorado economy will add jobs in each year of the study period. However, the largest impact occurred in the first 18 months of Medicaid expansion. Currently, 31,074 jobs have been added due to Medicaid expansion. Although the distribution of these jobs across employment sectors is not part of this analysis, the majority of the jobs are likely to occur in the direct health care and allied health care (for example medical supply) sectors. It is important to note that health care-related jobs are less affected by economic cycles and thus, the jobs created as a result of Medicaid expansion are likely ones that will persist, even if the economy goes into recession.
The Bureau of Labor Statistics reports that, on a non-seasonally adjusted basis, Colorado added 163,70010 jobs during the period from Jan. 1, 2014 through June 30, 2015, the first 18 months of Medicaid expansion. The economic impact analysis shows that the current year estimate of 31,074 jobs added by Medicaid expansion represents about 19 percent of that job growth. Chart 6 shows the cumulative employment effect from Medicaid expansion.
CHART 6: Cumulative Employment Gains Resulting from Medicaid Expansion
10 Seasonally adjusted, the number is 113,700.
0%
0.2%
0.4%
0.6%
0.8%
1%
1.2%
1.4%
1.6%
$-
$1,000
$2,000
$3,000
$4,000
$5,000
$6,000
$7,000
$8,000
$9,000
2015–16
2016–17
2017–18
2018–19
2019–20
2020–21
2021–22
2022–23
2023–24
2024–25
2025–26
2026–27
2027–28
2028–29
2029–30
2030–31
2031–32
2032–33
2033–34
2034–35
Increa
se in
Stat
e GDP
(in $
Millio
ns, n
omina
l)
Economic Impact (in $Millions, left axis)
Perce
nt Inc
rease
Impact of Medicaid Expansion as a Share of Total State GDP (right axis)
–
10,000
20,000
30,000
40,000
50,000
2015–16
2016–17
2017–18
2018–19
2019–20
2020–21
2021–22
2022–23
2023–24
2024–25
2025–26
2026–27
2027–28
2028–29
2029–30
2030–31
2031–32
2032–33
2033–34
2034–35
Cumu
lative
Incre
ase i
n Num
ber o
f Job
s
–
$200
$400
$600
$800
$1,000
2015–16
2016–17
2017–18
2018–19
2019–20
2020–21
2021–22
2022–23
2023–24
2024–25
2025–26
2026–27
2027–28
2028–29
2029–30
2030–31
2031–32
2032–33
2033–34
2034–35
Nomi
nal D
ollars
$1,200
–
$50
$100
$150
$200
$250
2015–16
2016–17
2017–18
2018–19
2019–20
2020–21
2021–22
2022–23
2023–24
2024–25
2025–26
2026–27
2027–28
2028–29
2029–30
2030–31
2031–32
2032–33
2033–34
2034–35
Millio
ns of
Nom
inal D
ollars
$300
Published June 201620
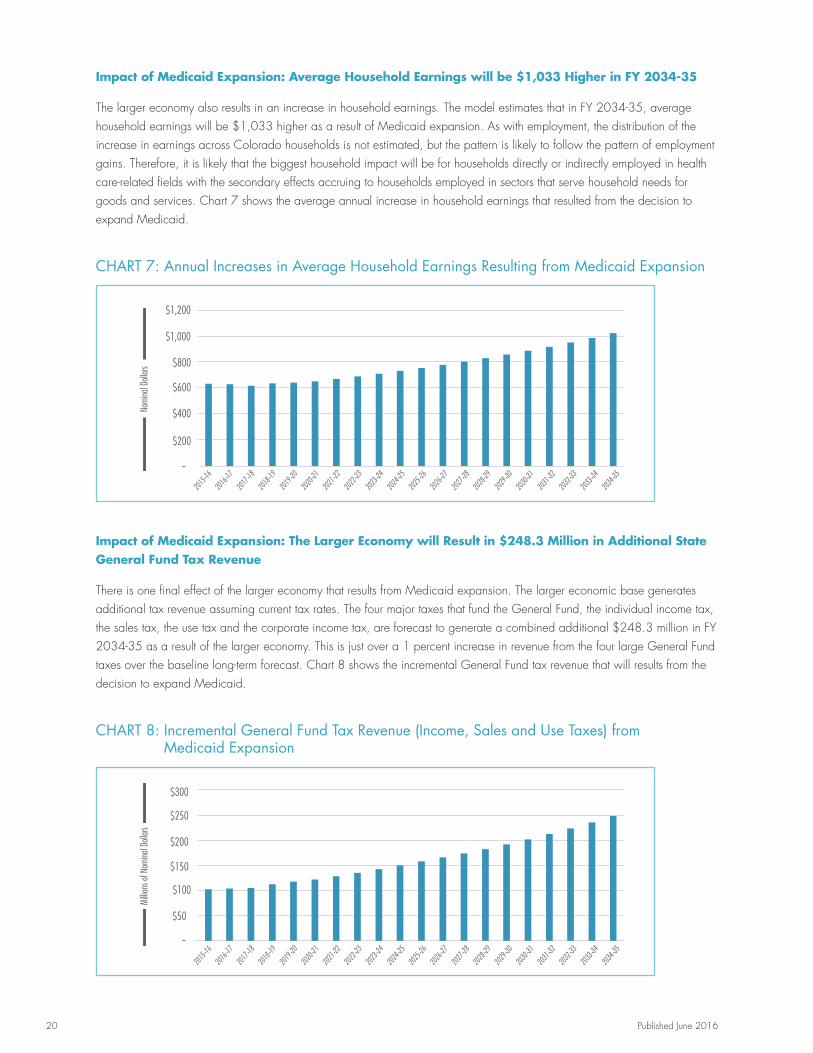
Impact of Medicaid Expansion: Average Household Earnings will be $1,033 Higher in FY 2034-35
The larger economy also results in an increase in household earnings. The model estimates that in FY 2034-35, average household earnings will be $1,033 higher as a result of Medicaid expansion. As with employment, the distribution of the increase in earnings across Colorado households is not estimated, but the pattern is likely to follow the pattern of employment gains. Therefore, it is likely that the biggest household impact will be for households directly or indirectly employed in health care-related fields with the secondary effects accruing to households employed in sectors that serve household needs for goods and services. Chart 7 shows the average annual increase in household earnings that resulted from the decision to expand Medicaid.
CHART 7: Annual Increases in Average Household Earnings Resulting from Medicaid Expansion
Impact of Medicaid Expansion: The Larger Economy will Result in $248.3 Million in Additional State General Fund Tax Revenue
There is one final effect of the larger economy that results from Medicaid expansion. The larger economic base generates additional tax revenue assuming current tax rates. The four major taxes that fund the General Fund, the individual income tax, the sales tax, the use tax and the corporate income tax, are forecast to generate a combined additional $248.3 million in FY 2034-35 as a result of the larger economy. This is just over a 1 percent increase in revenue from the four large General Fund taxes over the baseline long-term forecast. Chart 8 shows the incremental General Fund tax revenue that will results from the decision to expand Medicaid.
CHART 8: Incremental General Fund Tax Revenue (Income, Sales and Use Taxes) from Medicaid Expansion
0%
0.2%
0.4%
0.6%
0.8%
1%
1.2%
1.4%
1.6%
$-
$1,000
$2,000
$3,000
$4,000
$5,000
$6,000
$7,000
$8,000
$9,000
2015–16
2016–17
2017–18
2018–19
2019–20
2020–21
2021–22
2022–23
2023–24
2024–25
2025–26
2026–27
2027–28
2028–29
2029–30
2030–31
2031–32
2032–33
2033–34
2034–35
Increa
se in
Stat
e GDP
(in $
Millio
ns, n
omina
l)
Economic Impact (in $Millions, left axis)
Perce
nt Inc
rease
Impact of Medicaid Expansion as a Share of Total State GDP (right axis)
–
10,000
20,000
30,000
40,000
50,000
2015–16
2016–17
2017–18
2018–19
2019–20
2020–21
2021–22
2022–23
2023–24
2024–25
2025–26
2026–27
2027–28
2028–29
2029–30
2030–31
2031–32
2032–33
2033–34
2034–35
Cumu
lative
Incre
ase i
n Num
ber o
f Job
s
–
$200
$400
$600
$800
$1,000
2015–16
2016–17
2017–18
2018–19
2019–20
2020–21
2021–22
2022–23
2023–24
2024–25
2025–26
2026–27
2027–28
2028–29
2029–30
2030–31
2031–32
2032–33
2033–34
2034–35
Nomi
nal D
ollars
$1,200
–
$50
$100
$150
$200
$250
2015–16
2016–17
2017–18
2018–19
2019–20
2020–21
2021–22
2022–23
2023–24
2024–25
2025–26
2026–27
2027–28
2028–29
2029–30
2030–31
2031–32
2032–33
2033–34
2034–35
Millio
ns of
Nom
inal D
ollars
$300

21
III. Assessing the Budgetary Impacts of Medicaid Expansion
Before Medicaid expansion was authorized in Colorado, there were many outstanding questions regarding the potential budgetary impact of expansion. Chief among those was:
• What will be the impact of new enrollment of the EBNE population?
• What funding source will pay for the state share of enrollment costs of the newly eligible populations?
• Will Colorado expand Medicaid and take advantage of the higher federal match rate for currently covered expansion (HB 09-1293) populations?
• What will be the extent of the cost savings in other programs that serve the population that will become Medicaid eligible under expansion?
Now, with the decision to expand and two years of experience with Medicaid expansion, those questions largely have been answered.
New Enrollment of EBNE Populations In this analysis, the costs associated with the enrollment of EBNE populations are assumed to occur regardless of the state’s Medicaid expansion decision. As reported in Section II on RIMS multipliers, the evidence strongly supports the conclusion that Colorado would have had these costs regardless of the decision regarding Medicaid expansion. Since the state share of costs associated with new enrollment of currently eligible children and parents is predominantly funded by the General Fund, there was a budgetary impact from the ACA overall rather than from the specific decision to expand Medicaid.
It is important to note one exception in the EBNE population. The additional enrollment of parents and caretakers from 60 to 100 percent FPL, now considered an expansion population, is funded by HPF and also is eligible for the higher federal match because Colorado expanded Medicaid eligibility. For this previously EBNE but now expansion population, there is no General Fund impact.
Funding Source and Federal Match for Medicaid Costs for Newly Eligible Populations SB 13-200 designated the HPF as the funding source for the state share of expansion. With the decision to expand, Colorado was able to refinance the costs for the Medicaid enrollees who gained coverage with the passage of HB 09-1293 (parents/caretakers 60 to 100 percent FPL and adults without dependent children up to 100 percent FPL but limited to 10,000 enrollees due to budget constraints). As Table 6 shows, the federal match rate for these populations will be 100 percent in 2014 through 2016, then decline gradually to 90 percent by 2020, rather than the 50 percent federal share that would have occurred had Colorado opted not to expand. So, while expansion brought more Coloradans into coverage, it did so with a much higher federal contribution for both the newly eligible and the HB 09-1293 populations. For all of these enrollees, the General Fund bears no financial responsibility.

Published June 201622
TABLE 6: Federal Match for Expansion Populations under Different Expansion Scenarios
CY Federal Enhanced Match Under Expansion Federal Match for HB 09-1293 Populations without Expansion
2014 100% 50%
2015 100% 50%
2016 100% 50%
2017 95% 50%
2018 94% 50%
2019 93% 50%
2020 & Beyond 90% 50%
Cost Savings in Other State Programs Colorado operates several state social service and medical programs that serve the needs of Colorado’s medically indigent population. At the time of the 2012 analysis, a reduced funding need for these programs was anticipated with Medicaid expansion as the populations served would be paid for by Medicaid. Four programs, funded primarily with the General Fund, were expected to experience savings with Medicaid expansion. The programs are:
• Old Age Pension Health and Medical Care Program
• Inpatient hospitalizations for prison inmates
• Community mental health programs
• Drug and alcohol abuse treatment programs
While savings have begun to materialize in some of these programs, most of the savings were not as significant or easily identifiable as originally projected. The exception to this is the savings in the Department of Corrections (DOC) budget for inpatient hospitalizations. The DOC reported savings of $10 million in the first year of Medicaid expansion.
In the other areas, particularly in the human service programs, some of the savings have been reinvested back into the specific program to meet previously unmet service needs. In this manner, Medicaid expansion aided the state in addressing previous program deficiencies. Given the multiple uses of the savings, it is difficult to quantify the bottom line impact of savings. As such, some savings were realized but not included in our bottom line assessment of the General Fund.
Budget Bottom Line While Medicaid expansion is not free, Colorado currently is and will be able to insure the expansion populations with no negative impact to the state’s General Fund. The required state expenditures will be funded with the HPF which is paid only by hospitals and not the general taxpayer. The HPF revenue to the state is used solely for medical-related expenditures and not for the general expenditures of the state budget.
However, Medicaid expansion is one part of the ACA, a broader national health policy change that has and will continue to have General Fund impacts. Under the ACA’s individual mandate, most Americans are required to have health coverage and in the months leading up to ACA implementation, significant statewide O&E efforts were undertaken to inform and enroll Coloradans into coverage. As a result of these O&E efforts, many EBNE Coloradans enrolled into coverage. Since most of the EBNE populations are not expansion populations under the ACA’s Medicaid expansion, they were not eligible for full
100%

23
federal funding for the first three years. Instead, they most likely were in enrollment cohorts for which the expenditures were equally shared between the federal and state government. For most of these EBNE populations, the state fund used for the state share was the General Fund.
For the reasons noted above, EBNE populations are assumed to have enrolled regardless of the decision to expand Medicaid under SB 13-200. Therefore, the General Fund impact from the EBNE effect is not attributed to Medicaid expansion. Nevertheless, it is worth noting that the ACA did, in fact, have some broader General Fund expenditure impact.
There are, however, some positive General Fund impacts from the Medicaid expansion specifically. As noted above, one of these affects General Fund revenue. The expansion of Medicaid results in a larger economy with more jobs and higher average household earnings. As a result, tax revenues from the income and sales tax are projected to be larger due to the broader economic impact of Medicaid expansion. This increase in revenue to income and sales taxes, estimated to have been $83.4 million in FY 2014-15, $102.4 million in FY 2015-16 and projected to grow to $248.3 million in FY 2034-25, results in a positive fiscal impact in the General Fund and serves to partially offset the expenditure increase associated with covering the previously EBNE populations.
The second General Fund impact is to the expenditures in other state programs affected by Medicaid expansion. As noted on page 22, the reduction in spending pressure for four other General Fund programs has been reduced, with the largest reduction in the state paying for offsite inpatient hospitalizations for prison inmates, a $10 million reduction as these costs are eligible for the enhanced federal Medicaid match.
Taken together, the bottom line is that Medicaid expansion has been neutral for the General Fund. The direct costs associated with covering the expansion populations are fully covered with the HPF with the result that the expansion decision itself had no General Fund impact. The economic expansion that resulted from Medicaid expansion is now generating additional General Fund tax revenue helping to offset the General Fund impact for new EBNE enrollees attributable to the ACA more broadly. In addition, some General Fund programs have experienced savings which also help to defray the cost associated with the General Fund’s additional responsibility for new enrollees.
100%

Published June 201624
IV. Current Issues in Medicaid Expansion
Bump Payments and the Economic Impact of Medicaid Expansion
A lesser known provision of the ACA, Section 1202, required that states increase Medicaid reimbursement rates to the Medicare payment level. This provision applied only to CYs 2013 and 2014, and for those two years the federal government paid the full amount of the increase. By the end of 2014, Congress failed to reauthorize an extension of the federal support for Medicaid parity or bump payments.
In the wake of the federal inaction to extend bump payments, 16 states – including Colorado – opted to continue the program using state funds. However, Colorado’s extension was approved only through FY 2015-16. Without subsequent action, Medicaid payment parity with Medicare will lapse in FY 2016-17. By combining HCPF data on the total reduction in spending on bump payments by Medicaid cohort and estimated caseload for FY 2016-17, the following average reduction was calculated for FY 2016-17 per capita cost for the medical services premiums for the Medicaid expansion populations without the bump payments:
• Adults without dependent children - $110.11 reduction in per capita spending (from $4,060.17 to $3,950.06, a 2.7 percent reduction in per caseload cost)
• Parents/caretakers - $80.35 reduction in per capita spending (from $2,419.43 to $2,339.08, a 3.3 percent reduction in per caseload cost)
The bump payments did not apply to mental health services, so per capita costs in the mental health program remain unchanged.
As mentioned previously, HCPF’s forecasts of caseloads and cost have a horizon of FY 2017-18. To be consistent with the economic impact methodology, HCPF’s forecasts were used as the jumping off point for the long-term estimates of the impacts of eliminating bump payments for fiscal years 2018-19 through 2034-35. At the time HCPF completed its forecast, the General Assembly had not yet acted on the expansion of the bump payments. With no legislative action, HCPF completed its forecast under current law which included the bump payments. As a result, the baseline assessment of the economic impact of Medicaid expansion reported also assumed an extension of bump payments through the forecast horizon of FY 2034-35.
Eliminating the bump payments reduces spending on the Medicaid program, and with no offsetting expenditures elsewhere in the budget, reduces the economic impact of Medicaid expansion. However, the reduction is marginal. The economic and revenue impacts of eliminating bump payments for FY 2016-17 and FY 2034-35 are shown in Table 7. It is important to note that if any of the savings from the bump payments is reallocated to other needs within the Medicaid program, the reduction in economic impact will be even smaller.

25
TABLE 7: Medicaid Expansion Economic Impact Eliminating Bump Payments
FY 2016-17 FY 2034-35
With Bump Payments
Without Bump Payments
With Bump Payments
Without Bump Payments
Economic Activity
Increase in GDP ($ Billions) $3.88 $3.78 $8.53 $8.41
% Increase in GDP 1.11% 1.08% 1.38% 1.37%
Avg. Household Earnings ($) $639 $624 $1,033 $1,019
Jobs
Cumulative Increase 30,775 30,043 43,018 42,413
% Increase 1.18% 1.16% 1.35% 1.33%
General Fund Revenue Increase ($ Millions)
$104.10 $101.70 $248.30 $244.80
Methodology and Conclusion The marginal impact of the elimination of the bump payments was calculated by adjusting total spending forecasts used in the multiplier analysis and comparing the results to the results obtained assuming continuation of bump payments.
The elimination of bump payments can affect the cost and quantity of care in two ways. First, a reduction in payment levels has a direct effect on the per capita cost of care. To account for the price effect, HCPF’s data was used to calculate the average reduction in FY 2016-17 as described above. To forecast the average reduction forward to FY 2034-35, bump payments were assumed to grow at the rate of health care inflation. As in the baseline model, health care inflation was forecast according to the CBO methodology of adding an annual projection of excessive health care cost growth to the Colorado Futures Center forecast of general inflation as measured by the Denver-Boulder-Greeley Consumer Price Index. The outlook for excessive cost growth came directly from the CBO’s latest long-term projections, without modifications. In each year from FY 2016-17 through the end of the forecast, the per capita costs of medical services premiums for the expansion populations were reduced by the inflated amount of the bump payments. This methodology yielded a forecast for per capita cost without Medicaid parity.
The second way a lapse in the bump payments can affect costs is by restricting access to care. The bump payment program was designed to expand access to care under the assumption that payment parity would induce more caregivers into the Medicaid program. However, the early research on the relationship between the bump payments and expanded access to care was largely inconclusive, and HCPF’s assessment and baseline assumption is that the volume of care in Colorado will not decline with an elimination of the bump payments. Because neither the research nor HCPF’s assessments support a decline in the volume of care, the economic impact model was not adjusted to assume any quantity effect. For that reason, the assessment of the economic impact of the elimination of the bump payments reflects only a price effect.
After the price adjustment, the methodology for assessing the economic impact of eliminating bump payments was the same as the methodology in the baseline study. Total Medicaid costs per cohort were calculated by multiplying caseload forecasts by the per capita cost of care as adjusted by the elimination of bump payments. The appropriate federal/state spending split was then applied and the appropriate multipliers were applied to the spending. Finally, the positive impact of increased spending was offset to reflect the fact that the increased state HPF spending would be financed by a reduction in hospital spending.

Published June 201626
As Table 7 demonstrates, the reduction in the economic impact that would result from the elimination of the bump payments on the expansion populations is minimal, both in the first year of the projected elimination in the bump payments and even more so in the final year of the forecast. To the extent that any of the savings are deployed elsewhere in the expenditures for health care, the differential economic impact would dampen even further.11 Given the relatively small change in the estimated economic impact and the chance for replacement spending, it is difficult to conclude that eliminating the bump payments on the expansion populations will have a significant effect on the economic impact of Medicaid expansion.
However, it is important to note that this analysis looked only at how an elimination of the bump payments for the expansion populations affected the analysis of the positive economic impact of Medicaid expansion. There are, however, other effects of the elimination of the bump payment that extend well beyond the analysis of expansion. A discontinuation of bump payments means that all Medicaid populations will be affected, not only the expansion populations. Since the expansion populations represent approximately 29 percent of the total Medicaid population, the resulting negative economic impact of the elimination of bump payments on all Medicaid cohorts would be much larger than simply the offsetting effect of the positive impact of expansion. Because this study was limited to the impact of Medicaid expansion and not the full Medicaid program, an analysis of the overall economic impact of eliminating bump payments on all Medicaid populations was not undertaken.
Possible Implications of Repealing Medicaid Expansion
Much rhetoric and debate in elective politics at the national level, throughout the states and in Colorado has focused on the repeal of the ACA, including the repeal of Medicaid expansion. While a range of replacement options have been debated and the actions that states would take throughout the country in the wake of such a repeal are speculative, an outright repeal of expansion with no offsetting replacement would have significant consequences.
Based on a qualitative analysis, the repeal of Colorado’s Medicaid expansion is predicted to have four major consequences:
• It would undo the economic stimulus reported earlier in this analysis, so the trajectory of the economy would return to its pre-expansion status, with fewer jobs, a lower state GDP and lower household incomes.
• It would reduce health care access for low-income Coloradans.
• It would stress the budgets of low-income households.
• It would increase uncompensated care for health care providers, increase the use of emergency departments for non-emergency care and increase hospitalizations for illnesses that could have been treated in an outpatient setting.
11 The state share for these populations is paid by the HPF. As a result, redeployed spending can be only in the health care sector.
27
Undo the Economic Stimulus Reported Earlier in this Study If a repeal effort was successful, the trajectory of Colorado’s economy with Medicaid expansion would return to its pre-expansion status, meaning fewer jobs, a lower state GDP and lower household incomes. The earlier portion of this study found immediate economic impacts in Colorado. In the current year (FY 2015-16), Colorado is experiencing the following as a result of implementation of Medicaid expansion:
• An increase in state GDP of just over $3.8 billion. This represents approximately a 1.14 percent increase in the size of the state’s economy.
• Average household earnings were $643 higher than they would have been without expansion.
• The increased economic activity due to Medicaid expansion supported an additional 31,074 jobs statewide and across all industries.
A repeal of Colorado’s Medicaid expansion would reverse these impacts.
Reduce Health Care Access for Low-income Coloradans Research indicates that people with Medicaid coverage fare much better than the uninsured in several measures of access to care. Compared with uninsured adults, Medicaid adults are 25 percent more likely to report they are in good to excellent health, 40 percent less likely to report health declines in the last six months and 10 percent more likely to screen negative for depression. Catastrophic out-of-pocket spending was nearly eliminated among the adults who gained Medicaid coverage. Also, the likelihood of having medical debt was reduced by more than 20 percent.
Medicaid recipients have more office visits and fill more prescriptions. A study by Harvard University researchers and reported by the Center on Budget and Policy Priorities “surveyed low-income non-elderly adults in Arkansas and Kentucky (which have expanded Medicaid) and Texas (which has not expanded Medicaid). The share of residents with a personal doctor rose by 8 percentage points more in the expansion states than in Texas between 2013 and 2014. Similarly, the share of residents receiving a primary care checkup rose 7 points more in the expansion states and the share receiving care for a chronic condition rose 11 points more.”12
Other studies of low-income adults who lost their Medicaid coverage found significant declines in basic measures of health care access such as having a primary care professional. Those who lost Medicaid coverage had more unmet health care and medication needs. Research also shows that expanded eligibility for Medicaid at the state level is associated with significant reductions in mortality.13
A study done by the consulting firm Deloitte for the state of Kentucky14 found that improved health impacts of Medicaid expansion were significant. They concluded that Medicaid expansion populations sought health care at a 55 percent higher rate than a comparative group of existing Medicaid enrollees due to pent-up demand for care. This was especially the case for treatment of chronic conditions like high blood pressure, diabetes and depression.
12 Center on Budget and Policy Priorities. “More Evidence of Medicaid Expansion’s Positive Effects.” 2016. Available at http://www.cbpp.org/blog/more-evidence-of-medicaid-expansions-positive-effects. Accessed April 26, 2016.
13 Henry J. Kaiser Family Foundation. “What is Medicaid’s Impact on Access to Care, Health Outcomes, and Quality of Care? Setting the Record Straight on the Evidence.” 2013. Available at http://kff.org/report-section/what-is-medicaids-impact-on-access-to-care-health-outcomes-and-quality-of-care-setting-the-record-straight-on-the-evidence-issue-brief/. Accessed April 26, 2016.
14 State of Kentucky. “Kentucky’s Medicaid Expansion: 40,000 Jobs, $30B Economic Impact.” 2015. Available at http://kentucky.gov/Pages/Activity-Stream.aspx?viewMode=ViewDetailInNewPage&eventID=%7B97DA58DC-A167-4B3B-9B18-7C1E2CA79C88%7D&activityType=PressRelease. Accessed April 26, 2016.

Published June 201628
A rollback of the expansion would return the low-income populations to the pent-up demand situation. And while a repeal of Medicaid expansion would not return the level of uninsured in Colorado to the pre-ACA level of 14.3 percent, it would raise it significantly from the current level of 6.7 percent.15 With a repeal of Medicaid expansion, many of the newly uninsured will fall into the “coverage gap” or “donut hole” and be ineligible for premium tax credits to purchase insurance on Colorado’s health insurance marketplace, Connect for Health Colorado. In addition, a study by the Kaiser Family Foundation reports that without Medicaid expansion, the uninsured in the “coverage gap” are disproportionally likely to be African American or Hispanic.16
Stress the Budgets of Low-income Households Having Medicaid coverage has a significant beneficial effect on self-reported measures of financial strain due to health care costs. If individuals were removed from Medicaid, health options would be limited. Some could seek coverage from employers. Others might be able to find private insurance. However, these groups would pay premiums, co-pays and other out-of-pocket expenses and many would go without health insurance.
Recently, the Kaiser Family Foundation did a study “to gain a better understanding of the impact of insurance on the health care spending and budgets of low-income households.” Kaiser Family Foundation used data from the 2014 Consumer Expenditure Survey provided by the U.S. Bureau of Labor Statistics. The study compared health care spending among low-income households with and without Medicaid. The sample households had incomes below 138 percent of the FPL. This was about $27,310 for a family of three in 2014. The study looked at spending on health care as a share of total household spending, at health spending on premiums and at spending on out-of-pocket costs for medical services, supplies and prescription drugs.17
The following discussion summarizes the study:
The majority of spending among low-income households goes to housing, food and transportation. Average spending among these households “... greatly exceeds average income, suggesting that they accrue debt even as they earn. As a result, spending even small amounts on health care can crowd out other necessities or require low-income families to go further into debt.”
Low-income households in which all members are covered by Medicaid devote 1 percent of their annual budget to health care expenses. Households in which no members are covered by Medicaid devote 6 percent of the annual budget to health care. On average, health spending by Medicaid households was about $235 in 2014. For non-Medicaid households the average was $1,739. “The absence of premiums and only nominal co-payments for services in Medicaid likely explain the differences in spending.”
Since households with these levels of income have little flexibility in allocating budgets (i.e., no savings) this difference in health spending comes at the expense of other items. Non-Medicaid households, for example, spent 19 percent of their budget on food. Medicaid households spent 24 percent on food. On housing, non-Medicaid households spent 37 percent, whereas Medicaid households spent 44 percent. So, health care spending crowds out what non-Medicaid households are able to allocate to food and housing.
15 Data on the uninsured come from the Colorado Health Institute. “Colorado Health Access Survey.” 2015. Available at http://www.coloradohealthinstitute.org/key-issues/detail/new-models-of-health-care/colorado-health-access-survey-1. Accessed April 26, 2016.
16 Henry J. Kaiser Family Foundation. “The Impact of the Coverage Gap for Adults in States not Expanding Medicaid by Race and Ethnicity.” 2015. Available at http://kff.org/disparities-policy/issue-brief/the-impact-of-the-coverage-gap-in-states-not-expanding-medicaid-by-race-and-ethnicity/. Accessed April 26, 2016.
17 Henry J. Kaiser Family Foundation. “Health Care Spending Among Low-Income Households with and without Medicaid.” 2016. Available at http://kff.org/medicaid/issue-brief/health-care-spending-among-low-income-households-with-and-without-medicaid/. Accessed April 26, 2016.

29
The differences in health spending are more pronounced when comparing Medicaid households to those with private insurance. Medicaid households spent on average $235 on health care as stated previously. Households in which family members are covered by private insurance spend on average $2,401 annually on health care. Low-income private insurance households spend 8 percent of income on health care versus the 1 percent spent by Medicaid households. The study observes, “Other research indicates that uninsured individuals are less likely than those covered by private insurance or Medicaid to use health care services, and more likely to postpone or go without care due to cost.”
Private insurance households also are vulnerable to rising health insurance premiums, co-pays and other out-of-pocket costs. The study states “Focusing on premiums specifically, low-income households with private insurance spend an average of $1,729 on premiums or nearly 6 percent of their total household budgets. In comparison, Medicaid households spend an average of $88 on premiums or 0.4 percent of their total household budgets.” Normally, Medicaid households pay no premiums. The premiums appearing in the Consumer Expenditure Survey for Medicaid households “may be for limited dental or vision coverage or for a family member who may have private coverage in addition to Medicaid. Out-of-pocket health care spending among Medicaid households is a fraction of what it is among their uninsured and privately insured counterparts.”
The study concludes, “Medicaid enables beneficiaries to access health care services without placing additional strain on their resources, in comparison to the health spending faced by families with private insurance or among the uninsured.” Tables 8 and 9 summarize the Kaiser Family Foundation findings.
TABLE 8: Average Low-income Household Spending by Category
Item Medicaid Household Non-Medicaid Household
Transportation 15% 17%
Food 24% 19%
Health Care 1% 6%
Housing 44% 37%
Other 16% 21%
Total 100% 100%
Source: 2014 Consumer Expenditure Survey (BLS) and Kaiser Family Foundation
TABLE 9: Distribution of Out-of-pocket Spending by Low-income Households
Item Medicaid Household Uninsured Household Private Insurance Household
Medical Services $66.15 $297.16 $409.92
Medical Supplies $14.70 $15.64 $73.92
Prescription Drugs $66.15 $78.20 $194.88
Total $147.00 $391.00 $678.72
Source: 2014 Consumer Expenditure Survey (BLS) and Kaiser Family Foundation

Published June 201630
Increase Pressure on Hospitals and Other Health Care Providers A repeal of Medicaid would increase uncompensated care for health care providers. It is also projected to increase the use of emergency departments for non-emergency care and increase hospitalizations for illnesses that could have been treated in an outpatient setting.
The Deloitte study referenced earlier found increases in payments to providers in Kentucky and large declines in uncompensated care to hospitals. The study attributes these developments to Medicaid expansion. The reasonable conclusion is that the increases would reverse with a repeal.
Further supporting the impact on providers, a survey by the Arizona Hospital Association18 showed a 33 percent drop in uncompensated care during the first nine months of 2014. The Arizona survey also attributed this to Medicaid expansion. Finally, a recent Health Affairs study found that people who enrolled in Medicaid under the Arkansas and Kentucky expansions were less likely than before to rely on emergency departments as a usual source of care.19
Research from the Kaiser Family Foundation20 also shows that interruptions in Medicaid coverage can lead to greater emergency department utilization and significant increases in hospitalization for conditions that could have been managed on an outpatient basis. A study released by the Colorado Hospital Association21 reported similar findings. Between the first quarters of 2013 and 2014, Medicaid charges grew 37 percent in Colorado while self-paid charges dropped by 27 percent. Uncompensated care in Colorado hospitals declined according to the study. Colorado hospitals provided over $1.8 billion in uncompensated care in 2013.22
18 Modern Healthcare. “Arizona lawmakers cleared to challenge Medicaid expansion.” 2014. Available at http://www.modernhealthcare.com/article/20141231/NEWS/312319976. Accessed April 26, 2016.
19 Health Affairs. “Both The ‘Private Option’ And Traditional Medicaid Expansions Improved Access To Care For Low-Income Adults.” 2016. Available at http://content.healthaffairs.org/content/35/1/96.abstract. Accessed April 26, 2016.
20 Henry J. Kaiser Family Foundation. “What is Medicaid’s Impact on Access to Care, Health Outcomes, and Quality of Care? Setting the Record Straight on the Evidence.” 2013. Available at http://kff.org/report-section/what-is-medicaids-impact-on-access-to-care-health-outcomes-and-quality-of-care-setting-the-record-straight-on-the-evidence-issue-brief/. Accessed April 26, 2016.
21 The Coloradoan. “Colorado Medicaid expansion cutting charity care, bad debt.” 2014. Available at http://www.coloradoan.com/story/money/2014/06/03/colo-medicaid-expansion-cutting-charity-care-bad-debt/9931815/. Accessed April 26, 2016
22 Colorado Hospital Association. “Uncompensated Care.” 2014. Available at http://www.cha.com/Colorado-Hospitals/Uncompensated-Care.aspx. Accessed April 26, 2016.

31
V. Conclusion
In 2013, Colorado became one of 32 other states (including Washington D.C.) to expand Medicaid under the ACA. As a result, 312,000 low-income Coloradans qualified for Medicaid for the first time, a number expected to swell to 398,941 by FY 2017-18. In addition to the individual benefit to those newly eligible Coloradans, there are immediate macroeconomic impacts realized by all Coloradans that will continue in the future.
The decision to expand Medicaid also expands the state’s economy. While the ACA overall did have a General Fund impact, the Medicaid expansion to parents, caretakers, adults without dependent children and with incomes up to 138 percent of the FPL was accomplished with no direct effect on the General Fund. Additionally, the parents, caretakers and adults without dependent who received Medicaid with the passage of HB 09-1293 now qualify for the enhanced federal match, taking pressure off of the HPF and providing for the capacity within that revenue source to support the full ACA Medicaid expansion.
Finally, research shows that should Colorado subsequently choose to reverse its decision by repealing expansion, the negative impacts will extend beyond the loss of economic and revenue gains to the state and most directly impact the beneficiaries of expanded coverage. While the health of current expansion populations would decline and the household budgets of these populations would be distressed, Colorado’s economy also would shrink, jobs would be lost and household incomes would decline. Research shows that the utilization patterns experienced in the wake of Medicaid expansion would be reversed resulting in increased use of costly hospital emergency departments and an increase in the level of uncompensated care.

CONNECT WITH US
Facebook: www.facebook.com/coloradohealth I Twitter: @COHealthFDN I Instagram: @cohealthfdn
501 South Cherry Street, Suite 1100 I Denver, Colorado 80246 -1325TEL: 303.953.3600 I FREE: 877.225.0839
www.ColoradoHealth.org