Embed Size (px)
Citation preview

Presentation TitleSubtitle2019-20 Fast Facts
1
May 2020
Office of the Vice President for Budget and FinanceUniversity of Colorado1800 Grant Street, Suite 800Denver, Colorado 80203More data available at http://www.cu.edu/cu-data

2019-20 CU Fast Facts 2

44,061 43,857 43,074 43,246 43,694 44,355 45,484 46,625 47,535 47,730
13,300 13,882 14,518 14,920 15,973 16,661 17,718 18,750 19,467 19,656 57,361 57,739 57,592 58,166 59,667 61,016 63,202 65,375 67,002 67,386
Fall 10 Fall 11 Fall 12 Fall 13 Fall 14 Fall 15 Fall 16 Fall 17 Fall 18 Fall 19
Hea
dco
unt
Enr
ollm
ent
Resident Non-Resident
Student Headcount Enrollment
Student headcount has steadily increased and now exceeds 67,000.
• Resident enrollment increased 8 percent (~3,700 students).
• Non-resident enrollment increased 48 percent (~6,300 students) over the same time period.
• 1 in 4 students enrolled at a public college in Colorado are at CU*
CU Enrollment as of census date*Statewide statistic as of fall 2018 census enrollment reporting42,459 42,920 42,990 43,808 45,020 46,033 47,885 49,697 51,147 51,531
14,902 14,819 14,602 14,358 14,647 14,983 15,317 15,678 15,855 15,855 57,361 57,739 57,592 58,166 59,667 61,016 63,202 65,375 67,002 67,386
Fall 10 Fall 11 Fall 12 Fall 13 Fall 14 Fall 15 Fall 16 Fall 17 Fall 18 Fall 19
Hea
dco
unt
Enr
ollm
ent
Undergraduate Graduate
2019-20 CU Fast Facts 3

Student FTE
Full-time equivalent student enrollment (SFTE) increased 17 percent between FY 2010 and FY 2019.
• Resident SFTE enrollment has increased 7 percent (~2,800 FTE).
• Non-resident SFTE has increased 50 percent (~5,900 FTE).
• Undergraduate SFTE has increased 19 percent (~7,300 FTE).
• Graduate SFTE has increased 11 percent (~1,300 FTE).
Note: Graduate FTE calculation uses 24 credit hours.
38,998 39,100 38,817 38,273 38,291 38,755 39,059 40,443 41,259 41,817
11,868 12,159 12,741 13,056 13,469 14,441 15,149 16,107 17,054 17,74348,957 50,866 51,260 51,558 51,330 51,761 53,197 54,209 56,549 58,313
FY10 FY11 FY12 FY13 FY14 FY15 FY16 FY17 FY18 FY19
FTE
Enr
ollm
ent
Resident Non-Resident
39,096 39,034 39,313 39,303 39,901 41,044 41,913 43,792 45,171 46,448
11,770 12,226 12,245 12,026 11,860 12,153 12,296 12,757 13,142 13,11250,866 51,260 51,558 51,330 51,761 53,197 54,209 56,549 58,313 59,560
FY10 FY11 FY12 FY13 FY14 FY15 FY16 FY17 FY18 FY19
FTE
Enr
ollm
ent
Undergraduate Graduate
2019-20 CU Fast Facts 4

CU’s Changing Student PopulationSince 2010
2019-20 CU Fast Facts 5
+88%Student of
Color
+100%URM
1%White
+34%Pell
Recipients
10,108 to 13,508FY 2010 to FY 2019
10,894 to 20,483 Fall 2010 to Fall 2019
7,043 to 14,085 Fall 2010 to Fall 2019
41,055 to 41,463 Fall 2010 to Fall 2019
Source: Census Enrollment; Includes undergraduate and graduate level, both degree and non-degree seeking; Pell Recipients from CU Financial Aid;Students of Color include American Indian, Asian, Black, Hispanic, Pacific Islander, & 2 or more ethnicitiesURM (Under-Represented Minority) includes American Indian, Black, Hispanic, Pacific Islander

Resident UG Enrollment Change from Fall 2014 to Fall 2019
Since 2014, enrollment of Colorado residents at all public institutions has grown 1.2 percent.
CU campuses have led this growth, attracting an additional 3,400 resident students (10.3 percent system wide).
Data Source: CDHE Census Enrollment
CCCS Urban Campuses include Arapahoe, Aurora, Denver, Front Range, Pikes Peak, Red Rocks
CCCS Rural Campuses include CNCC, Lamar, Morgan, NJC, OJC, Pueblo, Trinidad State Junior College
-33.6%
-28.5%
-23.5%
-11.4%
-9.5%
-7.0%
-0.9%
1.2%
2.8%
3.8%
5.9%
8.1%
11.0%
11.1%
12.3%
19.5%
Fort Lewis College
Adams State University
Colorado State University - Pueblo
Metropolitan State University of Denver
University of Northern Colorado
CCCS Rural Campuses
Colorado State University
Statewide Grand Total
CCCS Urban Campuses
Colorado School of Mines
Colorado Mesa University
University of Colorado Colorado Springs
University of Colorado Boulder
University of Colorado Denver
University of Colorado Anschutz
Western State Colorado University
2019-20 CU Fast Facts 6

Online Enrollment is Growing Percentage of students taking online courses, by fall term
Source: Enrollment, end-of-term, Online Delivery based on IPEDS Distance definition; Includes all reportable hours; Prepared by CU System Office of Institutional Research
87% 87% 85% 84% 82% 82% 80%
8% 9% 11% 11% 12%13% 14%
5% 5% 5% 5% 5%6%
6%
-
10,000
20,000
30,000
40,000
50,000
60,000
70,000
80,000
90,000
Fall 2012 Fall 2013 Fall 2014 Fall 2015 Fall 2016 Fall 2017 Fall 2018
No Online Some Online 100% Online
2019-20 CU Fast Facts 7

Credit Hour Delivery
Source: Enrollment, end-of-term, summer/fall/spring; Online Delivery based on IPEDS Distance definition; Includes all reportable hours; Prepared by CU System Office of Institutional Research
94% 94% 93% 92% 91% 91% 90%
6% 6% 7% 8%9%
9% 10%1,607,656 1,626,061
1,673,410 1,709,870 1,777,942
1,830,540 1,877,418
-
200,000
400,000
600,000
800,000
1,000,000
1,200,000
1,400,000
1,600,000
1,800,000
2,000,000
FY 2013 FY 2014 FY 2015 FY 2016 FY 2017 FY 2018 FY 2019
Non-Online Delivery Online Delivery
2019-20 CU Fast Facts 8

Credit Hour Delivery (FY 2018-19)
2019-20 CU Fast Facts 9
Source: Enrollment, end-of-term, summer/fall/spring; Online & Hybrid based on IPEDS Distance definition; Includes all reportable hours; Prepared by CU System Office of Institutional Research
90%
91%
81%
83%
10%
9%
19%
17%
161,128
412,906
318,125
985,259
- 100,000 200,000 300,000 400,000 500,000 600,000 700,000 800,000 900,000 1,000,000
Anschutz
Denver
UCCS
Boulder
Non-Online Delivery Online Delivery
CU System Total
10% Online90% Non-Online

33% 36%
13%20%
11%
13%20%
13%
14% 6%
8% 12%
Total Credit Hours Online Credit Hours
9% 7%
17%28%
22%
41%
52%
24%
Total Credit Hours Online Credit Hours
Share of Credit Hours Delivered (FY 2018-19)
2019-20 CU Fast Facts 10
Boulder
Denver
UCCS
Anschutz
Business
Engineering
Other*
Health
Liberal Arts
Sciences
*Other includes Education, Law, Criminal Justice, Non-Degree
Source: Enrollment, end-of-term, summer/fall/spring; Online & Hybrid based on IPEDS Distance definition; Includes all reportable hours; Prepared by CU System Office of Institutional Research

History of State Funding
In FY 2020, state funding to CU is $263 million (including tobacco settlement funds).
Adjusted for inflation and enrollment, the university needs $177 million to maintain the purchasing power it had in FY 2001.
Note: Data is based on Budget Data Books and CDHE FTE. CPI from BLS
$207
$210
$190
$155
$151
$159 $1
79 $203 $2
27
$226
$208
$160
$158
$164 $1
80 $197
$202
$208 $2
35 $263
$0
$50
$100
$150
$200
$250
$300
$350
$400
$450FY
01
FY02
FY03
FY04
FY05
FY06
FY07
FY08
FY09
FY10
FY11
FY12
FY13
FY14
FY15
FY16
FY17
FY18
FY19
FY20
Mill
ions
State Funding ARRA Adjusted for enrollment & CPI
$440
2019-20 CU Fast Facts 11

24%21%
31%
41%
70%66%
76%79%
69%
59%
30%34%
0%
20%
40%
60%
80%
100%
1973 1983 1993 2003 2013 2020
% student share % state support
Student Share surpassed State Funding in FY2005
History of CU State Funding + Resident Tuition
The balance between state support and tuition revenue has changed markedly since the 1970s.
State support was once more than three times tuition revenue. State support is now less than half of resident tuition revenue.
Note: Percentages based on nominal (unadjusted) dollar amounts. Data 1993 to present based on Budget Data Books; Prior to 1993 based on State Appropriations Reports and CU Regents meeting minutes;
2019-20 CU Fast Facts 12

CO Higher Education Sources of Revenue
FY 2019-20
State support represents a small share of total revenue for all Colorado public institutions.
The largest share of CU revenue comes from auxiliary and restricted revenue sources.
Auxiliary revenues include self-supporting enterprises, such as student housing and bookstores.
Source: Colorado Legislative Council April 2019 Appropriations Report; Office of the State Auditor October 2019.
2019-20 CU Fast Facts 13
$114
.6
$41.
5
$20.
2
$73.
3
$273
.3
$91.
9
$152
.8
$19.
4
$501
.2
$113
3.3
$64.
$14.
1
$17.
3 $32.
5
$190
.4
$47.
1 $25.
4
$15.
2
$172
.4
$244
.3
$37.
2
$28.
$20.
2
$58.
5
$282
.7
$98.
5
$147
.6
$31.
6
$987
.2
$324
9.5
0%
20%
40%
60%
80%
100%
Perc
enta
ge o
f Tot
al R
even
ue
Other Funds State General Fund Tuition
($ in millions)

State Support per Resident Student
FY 2001 to FY 2020
State funding per resident SFTE at CU's main campuses is well below the average for Colorado's public four-year institutions.
CU AnschutzFY 2001: $54,521FY 2019: $23,170 (-58%)
Source: CO Legislative Council Forecast (Feb 2005), Higher Education Enterprise Status (Nov 2019), Dollars are adjusted for inflation (CPI from BLS);
2019-20 CU Fast Facts 14
$7,3
57
$7,0
74
$13,
620
$7,9
86
$11,
234
$5,4
47
$6,3
13
$5,5
00
$7,2
99
$9,5
17
$7,1
62
$5,8
16
$3,8
35
$3,7
41 $7
,337
$4,9
61 $8
,095
$4,1
26
$4,9
29
$4,2
99
$6,5
33 $1
0,80
7
$10,
030
$10,
112
$(2,000)
$-
$2,000
$4,000
$6,000
$8,000
$10,000
$12,000
$14,000
Sta
te S
upp
ort
per
SFT
E
FY 2001 FY 2020
Source: CO Legislative Council Forecast, Adjusted for inflation (CPI from BLS), CU splits from Budget Data Book
-48% -47%
-46%
-38%
-28%
-24%-22%
-22%
-11%
14%74%40%

Change in State Support per Resident Student
FY 2001 to FY 2020
While state funding has increased in recent years, funding per resident SFTE has declined at all CU campuses since FY 2001 (adjusted for inflation).
CU campuses have contended with cuts ranging from 37 percent (Boulder) to 58 percent (Anschutz Medical Campus).
Source: CO Legislative Council Forecast (Feb 2005), Higher Education Enterprise Status (Nov 2019), Note: Dollars adjusted for inflation (CPI from BLS)
2019-20 CU Fast Facts 15
-58%
-48% -47% -46%-38%
-28% -24% -22% -22%
-10%
14%
40%
74%
-80%
-60%
-40%
-20%
0%
20%
40%
60%
80%
100%
Cha
nge
in S
tate
Sup
po
rt
Source: CO Legislative Council Forecast, Adjusted for inflation (CPI from BLS), CU splits from Budget Data Book

Resident UG Tuition & Fees Compared to Peers
FY 2019-20
Despite recent increases in tuition rates, CU remains competitive with its peers.
Boulder resident undergraduate tuition remains below the peer group average, while Denver and Colorado Springs tuition rates are just above the peer average.
Note: Tuition rates are based on 30 credit hours per academic year. Peer tuition from published rates; Rates do not include the portion covered by the College Opportunity Fund (COF).
2019-20 CU Fast Facts 16
$10,536
$9,584
$12,747
$11,447
$10,463
$12,500
$0 $2,000 $4,000 $6,000 $8,000 $10,000 $12,000 $14,000
Denver
ColoradoSprings
Boulder
Tuition and Fees
CU Campus Peers

State Support + Tuition Comparison | CU Boulder
Page Title Here 17
$27,
876
$24,
132
$17,
149
$14,
004
$18,
565
$10,
006
$20,
812
$7,6
98
$9,1
94
$10,
864
$4,8
75
$8,6
58
$13,
040
$12,
677
$10,
670
$9,4
86
$8,9
39
$9,1
48
$16,
214
$9,3
22
$8,3
62
$6,7
21
$8,2
95
$4,2
77
$12,
424
$8,9
87
$14,
974
$15,
262
$10,
595
$17,
564
$6,3
81
$19,
080
$16,
004
$12,
467
$18,
454
$14,
460
$9,2
67
$8,9
88
$10,
680
$11,
148
$10,
968
$10,
606 $3
,229
$9,9
26
$10,
726
$11,
898
$9,6
25
$12,
532
$40,
300
$33,
119
$32,
123
$29,
266
$29,
160
$27,
570
$27,
193
$26,
778
$25,
198
$23,
331
$23,
329
$23,
118
$22,
307
$21,
665
$21,
350
$20,
634
$19,
907
$19,
754
$19,
443
$19,
248
$19,
088
$18,
619
$17,
920
$16,
809
$0
$5,000
$10,000
$15,000
$20,000
$25,000
$30,000
$35,000
$40,000
$45,000
FY19 State Appropriation per In-State FTE FY19 Resident UG Tuition & Fees
*May include some medical school funding. Data Source: CU Boulder AAUDE; Note: FY19 state appropriations and student FTE are from the CU Boulder Office of Planning, Budget and Analysis, via the Association of American Universities. Tuition & Fees direct from campus websites. Chart prepared by CU System Institutional Research, Dec 2019.
2019-20 CU Fast Facts 17

State Support + Tuition Comparison | UCCS
Page Title Here 18
$13,
716
$7,5
21
$11,
025
$11,
509
$6,7
26
$5,1
87
$9,6
87
$4,6
01
$6,5
16
$10,
665
$11,
549
$11,
757
$5,7
82
$10,
367
$2,9
76 $7
,909
$9,6
43
$6,0
50
$4,9
98
$7,0
59
$6,5
13
$6,0
76
$6,6
86
$5,3
08
$3,4
87
$4,0
19
$2,4
57
$5,2
45
$4,8
25
$4,2
24
$3,5
71
$12,
606
$17,
338
$10,
884
$9,9
52
$12,
790
$14,
167 $9
,636
$14,
409
$12,
150
$7,9
98
$6,9
84
$6,0
39
$11,
778 $7
,044
$13,
697 $8
,210
$6,3
94
$9,7
65
$10,
377
$7,7
98
$7,9
05
$8,0
54
$7,3
55
$8,6
64
$10,
412
$9,6
48
$10,
463
$7,2
40
$7,0
13
$7,2
31
$7,4
88
$26,
322
$24,
859
$21,
909
$21,
461
$19,
516
$19,
354
$19,
323
$19,
010
$18,
666
$18,
663
$18,
533
$17,
795
$17,
560
$17,
411
$16,
673
$16,
119
$16,
037
$15,
815
$15,
375
$14,
857
$14,
418
$14,
130
$14,
041
$13,
972
$13,
899
$13,
667
$12,
920
$12,
484
$11,
838
$11,
455
$11,
059
$-
$5,000
$10,000
$15,000
$20,000
$25,000
FY18 State & Local Appropriations per FTE FY19 Resident Undergraduate Tuition & Fees
Note: FY18 state appropriations and student FTE are the most recent IPEDS data available for peers. Tuition & Fees direct from campus websites. UCCS FY18 state appropriation is from budget data book (actual) and FY18 student FTE is from CDHE. Chart prepared by CU System Institutional Research, Dec 2019.
If only resident students at UCCS are included, State Appropriations per Resident FTE is $2,850
2019-20 CU Fast Facts 18

State Support + Tuition Comparison | CU Denver
Page Title Here 19
$10,
367
$8,0
22
$6,0
28
$9,3
79
$6,7
48
$5,7
82
$5,2
45
$3,2
71
$2,6
55
$6,0
76
$4,5
96
$4,6
01
$14,
167
$15,
180
$11,
846
$7,3
31
$9,7
01
$10,
377
$9,6
36
$11,
564
$11,
395
$7,6
06
$8,8
54
$6,0
70
$24,
534
$23,
202
$17,
874
$16,
710
$16,
449
$16,
159
$14,
881
$14,
835
$14,
050
$13,
682
$13,
450
$10,
671
$-
$5,000
$10,000
$15,000
$20,000
$25,000
FY18 State & Local Appropriations per FTE FY19 Resident Undergraduate Tuition & Fees
Note: FY18 state appropriations and student FTE are the most recent IPEDS data available for peers. Tuition & Fees direct from campus websites. CU Denver FY18 state appropriation is from budget data book (actual) and FY18 student FTE is from CDHE. Chart prepared by CU System Institutional Research, Dec 2019.
If only resident students at CU Denver are included, State Appropriations per Resident FTE is $3,159
2019-20 CU Fast Facts 19

State Support + Tuition Comparison | CU Anschutz
Page Title Here 202019-20 CU Fast Facts 20
$38,
939
$28,
624
$44,
583
$45,
651
$13,
878
$15,
335
$12,
571
$32,
456
$40,
860
$16,
025
$14,
500
$41,
596
$37,
850
$32,
378
$71,
395
$69,
484
$60,
608
$60,
151
$55,
474
$53,
185
$44,
949
$-
$10,000
$20,000
$30,000
$40,000
$50,000
$60,000
$70,000
$80,000
$90,000
$100,000
University of NebraskaMedical Center
Medical University ofSouth Carolina
The University ofTexas Health Science
Center at Houston
The University ofTexas Health ScienceCenter at San Antonio
Oregon Health &Science University
CU Anschutz MedicalCampus
University of Arkansasfor Medical Sciences
CU Anschutz Medical Campus FY 2018 State Appropriations and FY 2018 Tuition & Fees per Student FTE Compared to Peers
FY18 State & Local Appropriations per FTE FY18 First Year Resident Tuition (School of Medicine)Note: FY18 state appropriations and student FTE are the most recent IPEDS data available for peers. CU Anschutz FY18 state appropriation and FTE is from budget data book (actual). Tuition & Fees direct from campus websites. Chart updated Dec 2019.
If only resident students at CU Anschutz Medical Campus are included, State Appropriations per Resident FTE is $18,750

% Admin Expenditures compared to Peers
The proportion of CU's administrative expenditures to total expenditures is consistently below the average for peer institutions.
Peer list approved by CCHE Nov 2011
Source: FY11 to FY18 from IPEDS Finance (Institutional Support);
Note: FY 2017-18 is the most recent data available for peer institutions at the time of publication.
6.2% 6.1% 6.2%6.4% 6.3% 6.3% 6.1%
6.4%
3.5%4.1% 4.0%
4.6%4.9%
5.5% 5.4%5.8%
0.0%
2.0%
4.0%
6.0%
8.0%
10.0%FY
201
1
FY 2
012
FY 2
013
FY 2
014
FY 2
015
FY 2
016
FY 2
017
FY 2
018
Per
cent
of
Tota
l Exp
end
itur
es
Peer Average CU (all campuses)
2019-20 CU Fast Facts 21

Research Awards by Campus
FY 2018-19 Awards• $1.216 billion
• Boulder: $630.9m• UCCS: $8.0m• Denver: $23.4m• Anschutz: $553.5m
CU Boulder research total includes $56.5m from CU Foundation Gifts Supporting Research
Source: CU System Budget & Finance; CU Office of Contracts and Grants Annual Reports;
74%
74%
78%
76%
73%
71%
68%
69%
67%
74%
68%
69%
67% 69
%
65%
66%
62%
63% 63
%26% 29
%
32%
31%
33%
26%
32%
31% 33
%
26%
32%
31%
33%
31%
35% 34
% 38%
37%
37%
$499
$546
$561
$589
$617
$640
$637
$661
$714
$884
$793
$820
$771
$863
$878
$924
$1,0
34
$1,0
53
$1,2
16
$0
$200
$400
$600
$800
$1,000
$1,200
FY 2
001
FY 2
002
FY 2
003
FY 2
004
FY 2
005
FY 2
006
FY 2
007
FY 2
008
FY 2
009
FY 2
010
FY 2
011
FY 2
012
FY 2
013
FY 2
014
FY 2
015
FY 2
016
FY 2
017
FY 2
018
FY 2
019
Mill
ions
Federal Non-Federal
2019-20 CU Fast Facts 22

Research Awards by Funding Source
FY 2018-19
More than a quarter of all research funding received in FY 2018-19 was awarded by the Department of Health and Human Services, primarily from the National Institutes of Health.
CU is also very successful in attracting research dollars from the Department of Commerce, National Science Foundation, and NASA.
Source: CU System Budget & Finance; CU Office of Contracts and Grants Annual Reports;
Defense4%
Energy2%
Health and Human Services
28%
NASA11%
National Science Foundation
9%
Other Federal9%
Non-Federal37%
2019-20 CU Fast Facts 23

Research Expenditures FY 2017-18
Source: HERD (Higher Education Research and Development Survey), FY2018, All Fund Sources, Table 21. Higher education R&D expenditures, ranked by all R&D expenditures, by source of funds: FY 2018, https://ncsesdata.nsf.gov/herd/2018/html/herd18-dt-tab021.html; Population data from the U.S. Census Annual Estimates of the Resident Population for the United States, https://www.census.gov/newsroom/press-kits/2018/pop-estimates-national-state.html; NASA funding based on Table 25, FY2018;
Top 10 Public University Systems
Rank University SystemNumber
of Entities
FY2018 Higher Education R&D Expenditures
(in 1000s)
1 University of California 12 $6,816,402
2 University of Texas 14 $3,153,412
3 Florida Board of Governors 12 $2,310,089
4 North Carolina Board of Governors 15 $1,838,723
5 University of Michigan 3 $1,610,200
6 University of Washington 3 $1,425,005
7 SUNY (State University of New York) 14 $1,309,287
8 University of Wisconsin 9 $1,276,448
9 University of Maryland 5 $1,146,353
10 University of Colorado 3 $1,046,080
Top 10 Private Universities
Rank University
FY2018 Higher Education R&D Expenditures
(in 1000s)
1 Johns Hopkins U. $2,661,033
2 U. Pennsylvania $1,441,931
3 Harvard U. $1,173,371
4 Duke U. $1,167,611
5 Stanford U. $1,157,597
6 Cornell U. $1,071,621
7 Yale U. $990,399
8 MIT $964,336
9 Columbia U. (NY) $947,504
10 U. Southern California $891,625

CU Composite Financial Index
Scale is from -4 to 10.
A score of greater than 3 indicates acceptable fiscal health.
CU targets a score between 3 and 4.
A score of less than 3 indicates a need for attention.
The CFI is based on four financial ratios:- Primary Reserve Ratio- Net Operating Revenues
Ratio- Return on Net Assets
Ratio- Viability Ratio
Source: University Controller
4.8
4.0
3.5
4.2
3.6 3.7
-
2.0
4.0
6.0
FY 2014 FY 2015 FY 2016 FY 2017 FY 2018 FY 2019
Composite Financial Index GASB 68 Pension Liability
Source: University Controller; Includes the Foundation. Estimated CFI without Pension Liability does not match financial statementsThe decline of the CFI starting in FY2015 is related to the adoption of Governmental Accounting Standards Board (GASB) Statement No. 68 Accounting and Financial Reporting for Pensions (GASB 68). Due to pension reform, pension expense decreased in FY 2019, which caused the CFI to begin to increase again.
Estimated CFI without GASB 68 Pension Liability
2019-20 CU Fast Facts 25

Credit Ratings
Achieving and maintaining a high bond rating is a key measure of financial stewardship and accountability to university stakeholders.
Maintaining a high bond rating also helps to lower operating expenses.
Source: CU Office of the Treasurer; Quarterly Report November 2019;
Moody's Fitch
Aaa AAA
Aa1 AA+
Aa2 AA
Aa3 AA-
A1 A+
A2 A
A3 A-
Baa1 BBB+
Baa2 BBB
Baa3 BBB-
Ba1 BB+
Ba2 BB
Ba3 BB-
B1 B+
B2 B
B3 B-
Caa CCC
Ca CC
C C
RD/D
Inve
stm
ent
Gra
de
CU Rating
2019-20 CU Fast Facts 26

Age of Buildings Stock
Includes Auxiliary and General Fund buildings; Percentage based on Square Footage
Majority of square footage on the Boulder campus was built prior to 1970.
All Denver campus buildings were built since 1970. Includes South Denver.
At Colorado Springs, 79 percent of the square footage is in buildings constructed after 1990.
At the Anschutz Medical Campus, most of the square footage is in buildings added since 1990.
Source: OSA Building Inventory Report 2020-21;
2019-20 CU Fast Facts 27
15%
2%
23% 34%
1%
18%
39%
9%
84%
79%
61%
34%
0% 20% 40% 60% 80% 100%
AnschutzMedicalCampus
ColoradoSprings
Denver
Boulder
Percentage Built
Built Before 1950 Built Between 1950 & 1970 Built Between 1970 & 1990 Built After 1990

General Fund Maintenance Backlog
Boulder: 96 percent of buildings on the Boulder campus have a reported maintenance backlog.
Colorado Springs: 88 percent have a reported maintenance backlog.
Denver & Anschutz Medical Campus: More than 42 percent of general fund buildings have a backlog.
Source: OSA Building Inventory Report 2020-21;
Note: Only academic buildings eligible for future state controlled maintenance over 5,000 gross square feet are included. Total backlog reflects amount reported to the Office of the State Architect.
2019-20 CU Fast Facts 28
2
15 11
78
2
2 16
3
-
20
40
60
80
100
Denver Colorado Springs Anschutz MedicalCampus
Boulder
Num
ber
of B
uild
ings
No. of Buildings with Backlog No. of Buildings without Backlog
Total Backlog (GF buildings > 5000 GSF):
- Boulder $489.2 mil- Anschutz $38.9 mil- Colorado Springs $81.2 mil- Denver $15.3 mil- CU Total $624.6 mil

CU Boulder Faculty Compensation vs Peers
2018-19
Average total compensation for Boulder faculty lags that of their peers for associate and full professors. The disparity is greatest among full professors. Assistant Professor average compensation is above the peer average.
The data are based on an average across all disciplines. Faculty salaries vary considerably across disciplines.
Source: CU Institutional Research; AAUP 2018-19; 9-10 month faculty contracts;
$99,023
$93,864
$28,905
$28,583
$127,928
$122,447
$- $40,000 $80,000 $120,000 $160,000 $200,000
CU Boulder
Peer Average
Assistant Professor
Salary Benefits
$104,230
$106,777
$31,142
$31,885
$135,372
$138,662
$- $40,000 $80,000 $120,000 $160,000 $200,000
CU Boulder
Peer Average
Associate Professor
Salary Benefits
$147,613
$161,485
$38,260
$43,224
$185,873
$204,709
$- $40,000 $80,000 $120,000 $160,000 $200,000
CU Boulder
Peer Average
Professor
Salary Benefits
2019-20 CU Fast Facts 29
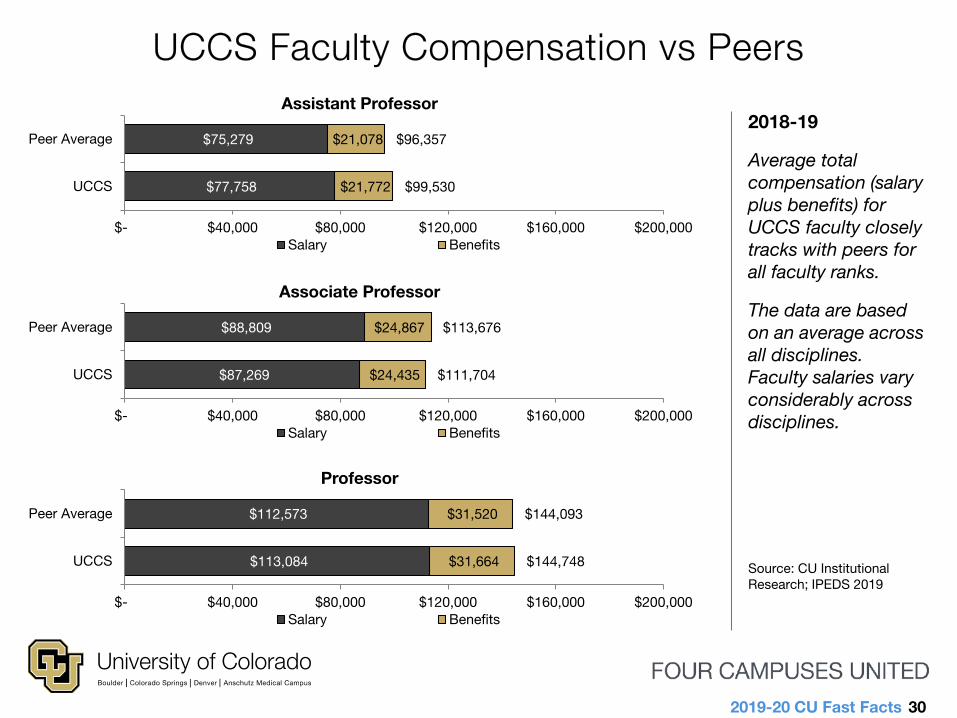
UCCS Faculty Compensation vs Peers
2018-19
Average total compensation (salary plus benefits) for UCCS faculty closely tracks with peers for all faculty ranks.
The data are based on an average across all disciplines. Faculty salaries vary considerably across disciplines.
Source: CU Institutional Research; IPEDS 2019
2019-20 CU Fast Facts 30
$77,758
$75,279
$21,772
$21,078
$99,530
$96,357
$- $40,000 $80,000 $120,000 $160,000 $200,000
UCCS
Peer Average
Assistant Professor
Salary Benefits
$87,269
$88,809
$24,435
$24,867
$111,704
$113,676
$- $40,000 $80,000 $120,000 $160,000 $200,000
UCCS
Peer Average
Associate Professor
Salary Benefits
$113,084
$112,573
$31,664
$31,520
$144,748
$144,093
$- $40,000 $80,000 $120,000 $160,000 $200,000
UCCS
Peer Average
Professor
Salary Benefits

CU Denver Faculty Compensation vs Peers
2018-19
Average total compensation for faculty is slightly above that of faculty at peer institutions.
The data are based on an average across all disciplines. Faculty salaries vary considerably across disciplines.
Source: : CU Institutional Research; Institutional and peer data provided by campus.
2019-20 CU Fast Facts 31
$87,584
$74,060
$23,707
$24,665
$111,292
$98,725
$- $40,000 $80,000 $120,000 $160,000 $200,000
CU Denver
Peer Average
Assistant Professor
Salary Benefits
$96,324
$88,114
$25,562
$29,109
$121,886
$117,223
$- $40,000 $80,000 $120,000 $160,000 $200,000
CU Denver
Peer Average
Associate Professor
Salary Benefits
$121,525
$116,212
$30,373
$38,295
$151,898
$154,507
$- $40,000 $80,000 $120,000 $160,000 $200,000
CU Denver
Peer Average
Professor
Salary Benefits

CU Anschutz School of Medicine Faculty Compensation vs AAMC Peers
2018-19
The data are based on an average total compensation across all disciplines.
Total compensation includes all salary, incentive, on-call and med/legal payments
Faculty salaries vary considerably across disciplines.
Source: CU Institutional Research; Institutional and peer data provided by campus. The reporting of data for CU based on such a small sample size significantly impacts the comparability to the AAMC salary survey.
2019-20 CU Fast Facts 32
$252,511
$263,718
$0 $50,000 $100,000 $150,000 $200,000 $250,000 $300,000
Anschutz MedicalCampus
Peer Average
Assistant Professor
$303,198
$316,692
$0 $50,000 $100,000 $150,000 $200,000 $250,000 $300,000 $350,000
Anschutz MedicalCampus
Peer Average
Associate Professor
$363,331
$361,524
$0 $50,000 $100,000 $150,000 $200,000 $250,000 $300,000 $350,000 $400,000
Anschutz MedicalCampus
Peer Average
Professor

CU Faculty & Staff - % Minority
In Colorado, 31% of the population are racial or ethnic minorities.
Source: IPEDS, CU Diversity Report; Colorado percentage from the State Demography Office, 2016
CU Boulder
UCCS
CU Denver | Anschutz
19% 19% 18% 17% 17%
24% 23% 22% 22% 22%
0%
20%
40%
Fall 2014 Fall 2015 Fall 2016 Fall 2017 Fall 2018
Faculty
Staff
13% 11% 13%16% 16%
21%18%
21% 22% 23%
0%
20%
40%
Fall 2014 Fall 2015 Fall 2016 Fall 2017 Fall 2018
Faculty
Staff
17% 17% 16% 16% 16%
22% 22% 22% 22% 24%
0%
20%
40%
Fall 2014 Fall 2015 Fall 2016 Fall 2017 Fall 2018
Faculty
Staff
2019-20 CU Fast Facts 33

15% 16% 18% 19% 20% 22% 23% 24% 25% 25%
11% 11% 12% 12% 13% 13% 13% 14% 15% 16%
Fall2009
Fall2010
Fall2011
Fall2012
Fall2013
Fall2014
Fall2015
Fall2016
Fall2017
Fall2018
Boulder
20%22% 24%
26%28% 30% 31% 32% 33% 34%
15% 15% 16% 17% 18% 18% 18%21% 23%
25%
Fall2009
Fall2010
Fall2011
Fall2012
Fall2013
Fall2014
Fall2015
Fall2016
Fall2017
Fall2018
UCCS
Student Enrollment – % Minority
The percentage of minority students at each CU campus has increased over the past decade.
In the state of Colorado, the percentage of minority race/ethnicity is 31%.
Source: CU Diversity Report;Statewide demographic percentage from State Demography Office.
29% 31% 33% 34% 36%38%
41% 43% 44%47%
13% 13% 13% 14% 15% 16% 17% 18% 19%22%
Fall2009
Fall2010
Fall2011
Fall2012
Fall2013
Fall2014
Fall2015
Fall2016
Fall2017
Fall2018
Denver
17% 19% 20% 22% 22% 22% 23% 25% 26% 26%
Fall2009
Fall2010
Fall2011
Fall2012
Fall2013
Fall2014
Fall2015
Fall2016
Fall2017
Fall2018
Anschutz Medical Campus
2019-20 CU Fast Facts 34

Percentage of International Students
Includes students on Temporary VISA, based on Fall Term Census Enrollment
International students represent 5% of undergraduate and 12% of graduate students.
Source: CU Diversity Report, Census Headcount Enrollment
3.6%4.1%
4.6%5.1%
5.6%
6.3% 6.6%7.0% 7.0%
6.6%
0%
2%
4%
6%
8%
10%
12%
Fall2009
Fall2010
Fall2011
Fall2012
Fall2013
Fall2014
Fall2015
Fall2016
Fall2017
Fall2018
Per
cent
Min
ori
ty
2019-20 CU Fast Facts 35

Financial Aid and Number of Pell Recipients
FY 2018-19
Student Financial Aid (other than loans) and Number of Pell Recipients
System wide, 27% of undergraduate students receive the Pell Grant.
Source: CU System Budget & Finance; CU Financial Aid;
2019-20 CU Fast Facts 36
9% 9% 10% 11% 12% 12% 13% 14% 13% 12%
52% 50% 55% 56% 55% 55%56%
56% 57% 58%11% 9%
8%8%
7%10%
10%10%
10%11%
9% 11% 7%6%
7%6%
5%5%
4%4%
19% 21% 20%19%
18%18%
16%15%
16%16%
10,108
11,39011,902 11,960 12,127 12,419 12,327 12,702
13,509 13,508
0
2,000
4,000
6,000
8,000
10,000
12,000
14,000
$0
$50
$100
$150
$200
$250
$300
$350
$400
FY2010
FY2011
FY2012
FY2013
FY2014
FY2015
FY2016
FY2017
FY2018
FY2019
Mill
ions
Other Scholarship Institutional AidState Aid Other Federal AidFederal Pell Number of Pell Recipients

Retention Rates of CO 4-Year Insts
Fall 2017 to Fall 2018
First-Time, full-time freshman students, enrolled first fall and returning second fall term
Source: IPEDS, 2017-18
54%
62%
65%
68%
69%
70%
72%
72%
74%
83%
88%
92%
0% 10% 20% 30% 40% 50% 60% 70% 80% 90% 100%
Adams
Fort Lewis
Metro State
CSU-Pueblo
UCCS
Western
CU Denver
UNC
CO Mesa
CSU
CU Boulder
CO School of Mines
2019-20 CU Fast Facts 37

Graduation Rates of CO 4-Year Insts
Fall 2012 to FY 2018
First-time, full-time freshman students, awarded a bachelor's degree within 6 years of first fall term.
Source: IPEDS, 2017-18
2019-20 CU Fast Facts 38
28%
32%
36%
44%
45%
47%
48%
48%
71%
71%
80%
0% 10% 20% 30% 40% 50% 60% 70% 80% 90%
Metro State
CSU-Pueblo
CO Mesa
Ft. Lewis
UCCS
UNC
Western
CU Denver
CU Boulder
CSU
CO School of Mines

CU Degree Recipients, by Level
FY 2010 to FY 2019
The number of degree recipients has grown 20% since FY 2010.
Growth was seen in the conferral of both undergraduate and graduate degrees.
Source: CU Institutional Research, Degrees Awarded. Data excludes double majors. Does not include any licensure or undergraduate certificates.
9,06
9
8,95
3
9,20
9
9,24
8
9,11
7
9,22
4
9,33
8
9,68
8
10,0
05
10,8
17
4,50
2
4,90
8
5,07
0
5,05
8
4,77
0
4,95
3
5,14
1
5,38
4
5,41
7
5,52
2 13,571 13,861 14,279 14,306
13,887 14,177 14,479 15,072 15,422
16,339
-
2,000
4,000
6,000
8,000
10,000
12,000
14,000
16,000
18,000
FY 2010 FY 2011 FY 2012 FY 2013 FY 2014 FY 2015 FY 2016 FY 2017 FY 2018 FY 2019
Undergraduate Graduate
2019-20 CU Fast Facts 39

Percent of Baccalaureate Degrees Awarded
FY 2017-18
Total Baccalaureate Degrees in CO: 27,911
In FY 2018, CU awarded over 10,000 baccalaureate degrees, 38 percent of the total awarded by Colorado's public four-year institutions.
Source: CDHE, Degrees Awarded. Data includes double majors.
Adams, 1%
CO Mesa, 4%
Mines, 4%
CMC, 1%
CSU, 19%
CSU-Pueblo, 3%
CSU-Global, 8%
Fort Lewis, 3%
Metro State, 11%
CU Boulder, 22%
UCCS, 7%
CU Anschutz, 1%CU Denver,
8%
UNC, 7%
Western, 2%
Total BaccalaureateDegrees: 27,911
CU Total: 38%
2019-20 CU Fast Facts 40
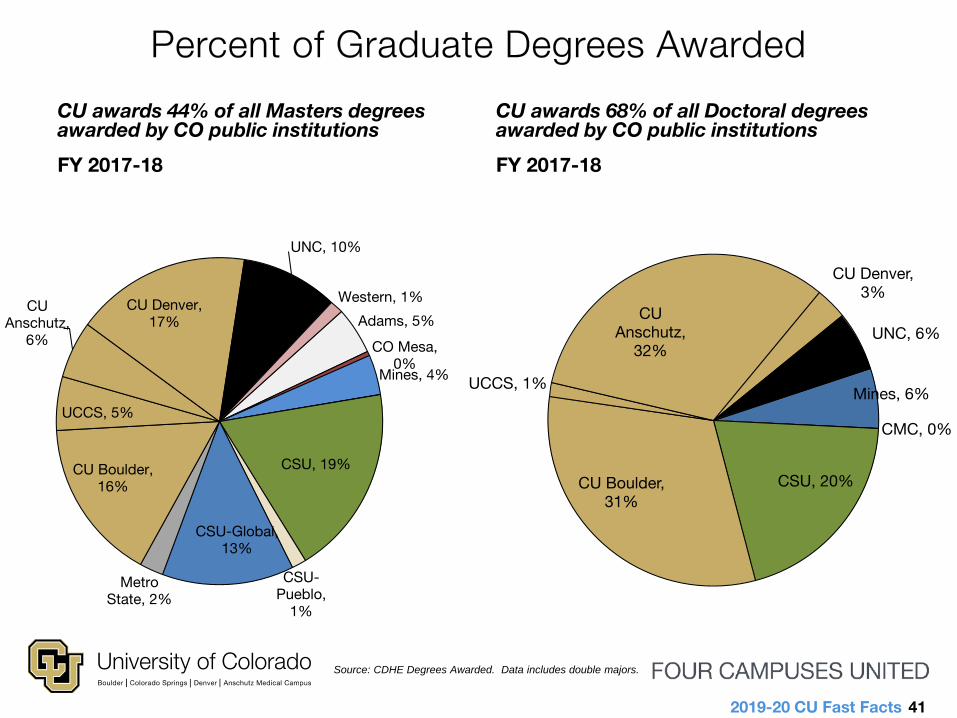
Percent of Graduate Degrees Awarded
CU awards 44% of all Masters degrees awarded by CO public institutions
FY 2017-18
CU awards 68% of all Doctoral degrees awarded by CO public institutions
FY 2017-18
41Source: CDHE Degrees Awarded. Data includes double majors.
Adams, 5%
CO Mesa, 0%
Mines, 4%
CSU, 19%
CSU-Pueblo,
1%
CSU-Global, 13%
Metro State, 2%
CU Boulder, 16%
UCCS, 5%
CU Anschutz,
6%
CU Denver, 17%
UNC, 10%
Western, 1%
Mines, 6%
CMC, 0%
CSU, 20%CU Boulder, 31%
UCCS, 1%
CU Anschutz,
32%
CU Denver, 3%
UNC, 6%
2019-20 CU Fast Facts 41

Average Earnings vs. Average Annual Loan Payment(Bachelor Degree Recipients by Area of Study)
2019-20 CU Fast Facts 42
Sources: * Average Annual Earnings based on CU System Alumni Survey FY 2009 - FY 2018; Based on full-time employment and excludes those pursuing additional education** Annual Loan Payment based on average loan from CDHE SURDS (2018) & *** standard 10 year repayment at 4.3%Slide from the Student Aid and Debt Presentation presented to the CU Board of Regents in November 2019
$3,407
$3,284
$3,179
$3,323
$3,506
$3,098
$2,908
$3,192
$3,738
$3,558
$27,667
$26,663
$25,812
$26,985
$28,469
$25,156
$23,609
$25,921
$30,354
$28,889
$50,266
$50,508
$53,592
$54,202
$54,635
$61,663
$61,974
$75,716
$81,363
$93,400
$0 $10,000 $20,000 $30,000 $40,000 $50,000 $60,000 $70,000 $80,000 $90,000 $100,000
50 Visual And Performing Arts.
23 English Language And Literature/Letters.
42 Psychology.
26 Biological And Biomedical Sciences.
51 Health Professions And Related Programs.
45 Social Sciences.
09 Communication, Journalism, And Related Programs.
52 Business, Management, Marketing, And Related Support Services.
14 Engineering.
11 Computer And Information Sciences And Support Services.
Average Annual Earnings 1 to 10 Years After Completion* Average Total Loans upon Earning a Degree** Estimated Annual Repayment***


![Meet the Players...Chodkiewicz W., Cadiot P., Willemart A.:. Compt. Rend. 1957, 245, 2061. 10 [Cu] Cu Cu Cu Cu Cu Cu Structure of Copper(I) Acetylides [Cu] Structure of Copper(I) Acetylides](https://img.pdfslide.us/doc/110x75/5ec93366fabef3665e12c060/meet-the-players-chodkiewicz-w-cadiot-p-willemart-a-compt-rend-1957.jpg)