Embed Size (px)
Citation preview
Future Opportunities for the Forest Products Industry in New BrunswickReport of the Task Force on Investment Opportunities in the New Brunswick Forest Sector
Submitted to:Business New Brunswick
Prepared by:Don Roberts, CIBC World Markets Inc.Peter Woodbridge, Woodbridge Associates Inc.
2008

f u t u r e o p p o r t u n i t i e s f o r t h e f o r e s t p r o d u c t s i n d u s t r y i n n e w b r u n s w i c k
f u t u r e o p p o r t u n i t i e s f o r t h e f o r e s t p r o d u c t s i n d u s t r y i n n e w b r u n s w i c k 1
ta b l e o f co n t e n ts
Foreword . . . . . . . . . . . . . . . . . . . . . . . . . . . . . . . . . . . . . . . . . . . . . . . . . . . . . . . . . . . . . . . . . . . . . . . . . . . . 2
Executive Summary . . . . . . . . . . . . . . . . . . . . . . . . . . . . . . . . . . . . . . . . . . . . . . . . . . . . . . . . . . . . . . . . . . . 3
1 . Structure and Recent Experience of New Brunswick’s Forest Industry . . . . . . . . . . . . . . . . . . . . 7 Industry Structure . . . . . . . . . . . . . . . . . . . . . . . . . . . . . . . . . . . . . . . . . . . . . . . . . . . . . . . . . . . . . . . . . . 7 Recent Performance . . . . . . . . . . . . . . . . . . . . . . . . . . . . . . . . . . . . . . . . . . . . . . . . . . . . . . . . . . . . . . . . 7 New Brunswick Timber Harvest Trends . . . . . . . . . . . . . . . . . . . . . . . . . . . . . . . . . . . . . . . . . . . . . . . . 9
2 . The Broader Context . . . . . . . . . . . . . . . . . . . . . . . . . . . . . . . . . . . . . . . . . . . . . . . . . . . . . . . . . . . . . . . 11 Is There a Long-Term Market? . . . . . . . . . . . . . . . . . . . . . . . . . . . . . . . . . . . . . . . . . . . . . . . . . . . . . . . 11 Trends in Global Wood Prices . . . . . . . . . . . . . . . . . . . . . . . . . . . . . . . . . . . . . . . . . . . . . . . . . . . . . . . 13 A New Game is Emerging . . . . . . . . . . . . . . . . . . . . . . . . . . . . . . . . . . . . . . . . . . . . . . . . . . . . . . . . . . . 14
3 . The Building Blocks: Wood and Energy . . . . . . . . . . . . . . . . . . . . . . . . . . . . . . . . . . . . . . . . . . . . . . 18 Wood Costs . . . . . . . . . . . . . . . . . . . . . . . . . . . . . . . . . . . . . . . . . . . . . . . . . . . . . . . . . . . . . . . . . . . . . . . 18 Energy Costs . . . . . . . . . . . . . . . . . . . . . . . . . . . . . . . . . . . . . . . . . . . . . . . . . . . . . . . . . . . . . . . . . . . . . . 22
4 . Conclusions and Outlook . . . . . . . . . . . . . . . . . . . . . . . . . . . . . . . . . . . . . . . . . . . . . . . . . . . . . . . . . . . 24 Are Forest Products a Sunset Industry in New Brunswick? . . . . . . . . . . . . . . . . . . . . . . . . . . . . . 24 What are the Most Attractive Investment Opportunities for the New Brunswick Forest Industry? . . . . . . . . . . . . . . . . . . . . . . . . . . . . . . . . . . . . . . . . . . . 24 Outlook . . . . . . . . . . . . . . . . . . . . . . . . . . . . . . . . . . . . . . . . . . . . . . . . . . . . . . . . . . . . . . . . . . . . . . . . . . . 28
5 . Observations and Recommendations . . . . . . . . . . . . . . . . . . . . . . . . . . . . . . . . . . . . . . . . . . . . . . . . 34
f u t u r e o p p o r t u n i t i e s f o r t h e f o r e s t p r o d u c t s i n d u s t r y i n n e w b r u n s w i c k2 f u t u r e o p p o r t u n i t i e s f o r t h e f o r e s t p r o d u c t s i n d u s t r y i n n e w b r u n s w i c k
f o r e wo r d
The central mandate of the Task Force on Investment Opportunities in the New Brunswick Forest Sector is to answer the following questions:1 . Are forest products a sunset industry in New Brunswick?2 . From New Brunswick’s perspective, what are the most (and least) attractive investment
opportunities in the traditional and emerging segments of the forest products industry?
The cost and quality attributes of forest products produced in the province are clearly critical in influencing the future prospects of the sector . However, the competitive position of the New Brunswick forest products industry will be increasingly influenced by forces external to the province . As a result, a key aspect of the study is a comprehensive assessment of global causes of change that will affect the New Brunswick industry through at least 2020 . This is important because the global forest sector is facing the most fundamental set of changes in markets and public polices since the colonial era .
The report provides an assessment of how potential market opportunities match with New Brunswick’s Crown and private timber base and its manufacturing capacity and industry capabilities . The report provides an evaluation of the prospects for the industry and product mix . The province’s best prospects for additional investment capital may well be its existing investors . Furthermore, even before the province tries to attract new investment, it is important to understand the conditions necessary to preserve existing investment .
As highlighted in the recent CIFPAC report Atlantic Canada’s Forest Industry: Part One,
Fibre supplies in the region are generally tight, given the prices that firms can pay and remain profitable . As a result, new uses and users must compete for fibre supplies . Developing new sectors will necessarily mean either reallocating existing supplies or finding new efficiencies within the current system .
The task force conducted its analysis during the first six months of 2008 . This document is an abridged version of a more detailed advisory report submitted to Business New Brunswick . Given space limitations and competitive considerations, this document does not include a series of product-market review analyses (PMRAs) conducted for a range of traditional and emerging products in the sector . These PMRAs provide much of the basis for the rankings of product opportunities summarized in this document .
The task force report concludes with a series of observations and associated recommendations which, in our view, will facilitate further investment in the province’s forest sector and create wealth for New Brunswick .
Don Roberts, managing director, CIBC World Markets Inc .Peter Woodbridge, president, Woodbridge Associates Inc .
June 2008
f u t u r e o p p o r t u n i t i e s f o r t h e f o r e s t p r o d u c t s i n d u s t r y i n n e w b r u n s w i c k f u t u r e o p p o r t u n i t i e s f o r t h e f o r e s t p r o d u c t s i n d u s t r y i n n e w b r u n s w i c k 3
e X e c u t i V e s u M M a ry
• Themost important finding of this report is that the potentialmedium- and longer-term(2010-12 and beyond) outlook for the forest products industry in New Brunswick is reasonably bright . This finding is made despite a perfect storm of globally driven adversity within the industry in recent years . There are good prospects of a significant turnaround .
• However,a turnaround inglobalcompetitivenesswillnothappenby itself.Manydifficultchallenges are ahead . With success, a new, more robust – and profitable – forest sector could emerge . Without success, the serious loss of critical mass within New Brunswick’s forest products manufacturing industry could lead to further withdrawals of investment .
• Givenwidespreadmillclosures,financiallosses,asignificantlossofjobsandthedepartureofsubstantive global investors from the sector in recent years, it is easy to have the impression that the forest sector within New Brunswick is a sunset industry .
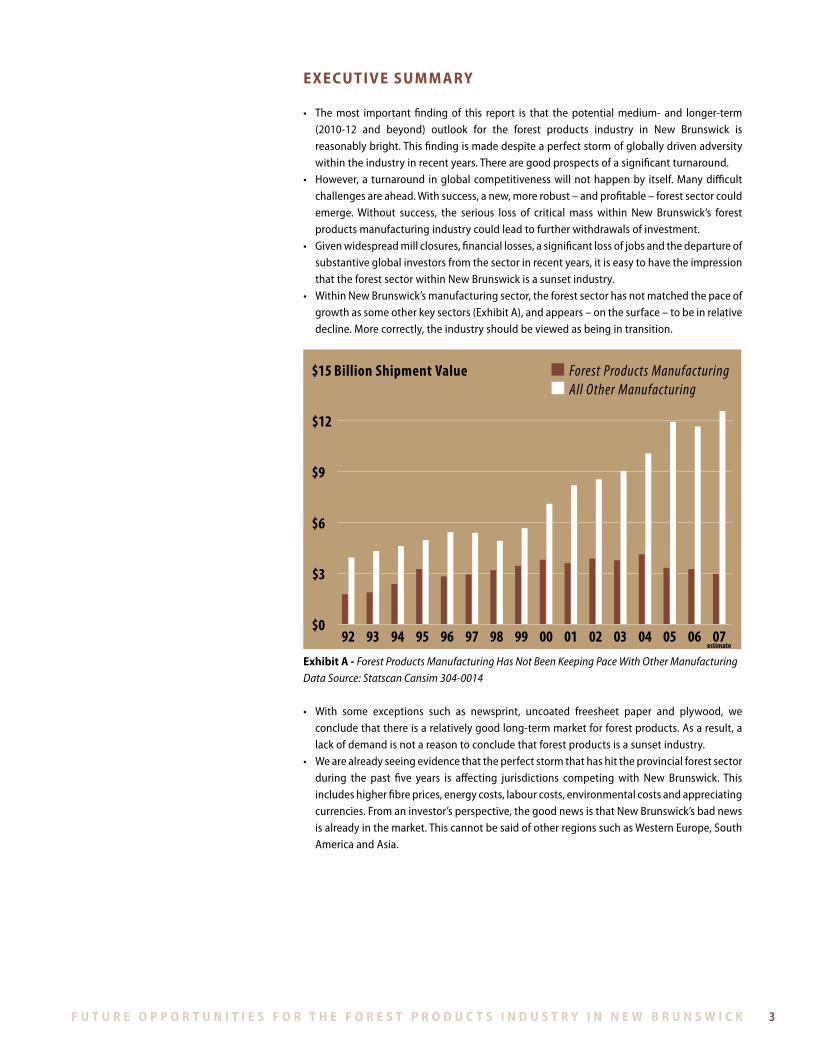
• WithinNewBrunswick’smanufacturingsector,theforestsectorhasnotmatchedthepaceofgrowth as some other key sectors (Exhibit A), and appears – on the surface – to be in relative decline . More correctly, the industry should be viewed as being in transition .
$0
$3
$6
$9
$12
$15 Billion Shipment Value Forest Products Manufacturing All Other Manufacturing
92 93 94 95 96 97 98 99 00 01 02 03 04 05 06 07estimate
exhibit a - Forest Products Manufacturing Has Not Been Keeping Pace With Other ManufacturingData Source: Statscan Cansim 304-0014
• With some exceptions such as newsprint, uncoated freesheet paper and plywood, weconclude that there is a relatively good long-term market for forest products . As a result, a lack of demand is not a reason to conclude that forest products is a sunset industry .
• Wearealreadyseeingevidencethattheperfectstormthathashittheprovincialforestsectorduring the past five years is affecting jurisdictions competingwith New Brunswick. Thisincludes higher fibre prices, energy costs, labour costs, environmental costs and appreciating currencies . From an investor’s perspective, the good news is that New Brunswick’s bad news is already in the market . This cannot be said of other regions such as Western Europe, South America and Asia .
f u t u r e o p p o r t u n i t i e s f o r t h e f o r e s t p r o d u c t s i n d u s t r y i n n e w b r u n s w i c k4 f u t u r e o p p o r t u n i t i e s f o r t h e f o r e s t p r o d u c t s i n d u s t r y i n n e w b r u n s w i c k
• Oneofthekeythemesofthereportisthattimber–whetherpubliclyorprivatelyowned– is increasingly scarce . Due to the combination of five different shocks to the global market for wood fibre, we think the long-term trend in real wood prices is turning positive . This has fundamentally positive implications for New Brunswick’s forest sector .1) The greatest fibre price increases are expected to occur in the regions that have traditionallyenjoyedthe lowestcostofwood.Asa result,differences inregionalwoodcosts will be less of a factor in determining where investment will flow than they have been .
2) While the Southern Hemisphere will continue to have an absolute advantage in growing trees, the comparative advantage may well be shifting back to the North .
3) Higher wood prices are expected to enhance the attractiveness of investing in forest management . They are also expected to increase product prices .
• Higherenergypricesandprospectivepricingofcarbonmaybethecatalystforthecommercialdevelopment of new products and markets . By providing the incentive to produce energy and chemicals from green hydrocarbons and sequester carbon from the atmosphere, they may help change the nature of the game for the forest products sector . New Brunswick can likely capture the greatest benefits from these opportunities if the forest industry helps execute them . A key reason for this is that there is a distinct cost advantage if the wood fibreisalreadyattheplant,andjoint-productscanbemadethatusesomeoftheexistinginfrastructure .
• From the perspective of allocating Crown timber, the Department of Natural Resourcesshould be careful how it encourages the bio-energy sector . Based on European data, a given volume of wood generates eight times more value-added and 13 times more employment when used in the production of pulp and paper as opposed to energy .
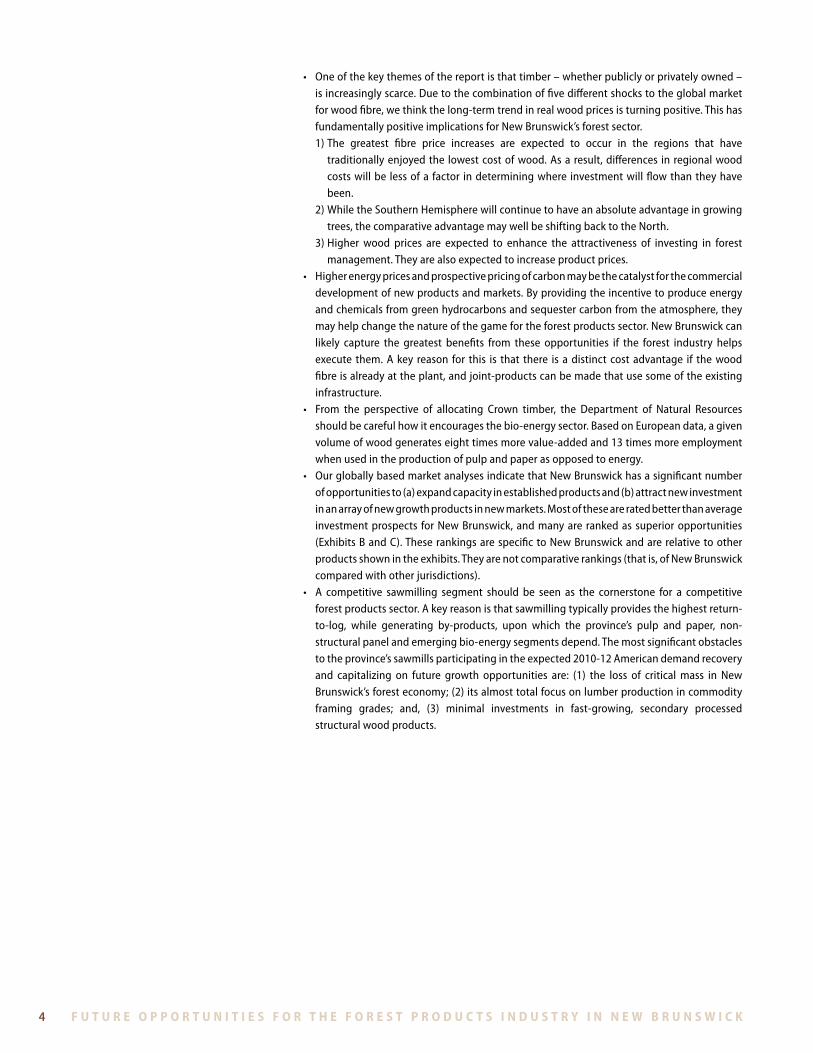
• OurgloballybasedmarketanalysesindicatethatNewBrunswickhasasignificantnumber of opportunities to (a) expand capacity in established products and (b) attract new investment in an array of new growth products in new markets . Most of these are rated better than average investment prospects for New Brunswick, and many are ranked as superior opportunities (Exhibits B and C) . These rankings are specific to New Brunswick and are relative to other products shown in the exhibits . They are not comparative rankings (that is, of New Brunswick comparedwithotherjurisdictions).
• A competitive sawmilling segment should be seen as the cornerstone for a competitiveforest products sector . A key reason is that sawmilling typically provides the highest return-to-log, while generating by-products, upon which the province’s pulp and paper, non-structural panel and emerging bio-energy segments depend . The most significant obstacles to the province’s sawmills participating in the expected 2010-12 American demand recovery and capitalizing on future growth opportunities are: (1) the loss of critical mass in New Brunswick’s forest economy; (2) its almost total focus on lumber production in commodity framing grades; and, (3) minimal investments in fast-growing, secondary processed structural wood products .
f u t u r e o p p o r t u n i t i e s f o r t h e f o r e s t p r o d u c t s i n d u s t r y i n n e w b r u n s w i c k f u t u r e o p p o r t u n i t i e s f o r t h e f o r e s t p r o d u c t s i n d u s t r y i n n e w b r u n s w i c k 5
exhibit b - Growth Prospects for New Brunswick – Group A: Ranked as Superior Opportunities
Product Group Ranking zero to 10 (10 = Most desirable) Observations
Wood Products Sector
Softwood Framing Lumber 9 Strong price recovery in prospect . Declining supplies of SPF from Quebec and BC
MDF/Particleboard (Supply Chain Linked) 9 Supply chain linkages provide strong competitive edge
Jobs Packs(Supply Chain Partnerships) 8 Value added opportunity for additional processing
within New Brunswick
Off-site Fabricated Structural Building Components 8 Value added opportunity for additional processing
within New Brunswick
Pulp, Paper, Bio-Fuels and Bio-Products Sector
Dissolving Pulp (integrated with Channel Partnerships) 9 Supply chain linkages provide strong competitive edge
Tissue 8 Serves regional/local markets with good growth prospects
Co-Generated Bio-Fuels 8 This ranking assumes that NB develops a competitive green energy policy!
Bio-Chemicals 8 With expected continuation of high energy prices, this revenue stream becomes viable
exhibit c - Growth Prospects for New Brunswick – Group B: Ranked Above Average
Product Group Ranking 0 to 10 (10 = Most desirable) Observations
Wood Products Sector
2nd Generation Engineered Wood Products, Open-Web Joists 7 Depends on a healthy and profitable
structural softwood lumber sector
Appearance Grade Value-Added Products 6 Improved clustering of existing facilites and
horizontal integration products needed
Pulp, Paper, Bio-Fuels and Bio-Products Sector
Paper Grade Market Pulp NBSK/NHBK 7 Depends on low cost, high quality residual fibre
from wood products sector
3rd Generation Mechanical Publication Papers 6 High electricity prices and small scale of operations are NB’s
current constraint to expansion
Existing Product
Emerging/New Product
• WehaveconcludedthattheNewBrunswickforestproductsindustryisnotmarket-limited.However, the traditional and emerging segments of the industry appear fibre-constrained . As a result, it is unlikely the province will be able to capitalize on the full range of market opportunities unless it makes a conscious choice to enhance its commercial timber supply .
• We have also provided projections of the financial outcomes of three outlook scenarios –ranging from industry decline to recovery and growth . Compared with forecast revenues of $2.5billionin2008,theDeclineScenarioprojectsrevenuesfallingto$1.4billionby2015.Incontrast,theRecoveryandGrowthScenarioprojectsrevenuegrowthto$4.7billionby2015.
• Theglobalforestsectorisfacingthemostfundamentalsetofchangesinmarketsandpublicpolices since the end of the colonial era . As a result, the importance of identifying and managing change has increased . It is critical that stakeholders in the New Brunswick forest sector further develop this ability .
f u t u r e o p p o r t u n i t i e s f o r t h e f o r e s t p r o d u c t s i n d u s t r y i n n e w b r u n s w i c k6 f u t u r e o p p o r t u n i t i e s f o r t h e f o r e s t p r o d u c t s i n d u s t r y i n n e w b r u n s w i c k
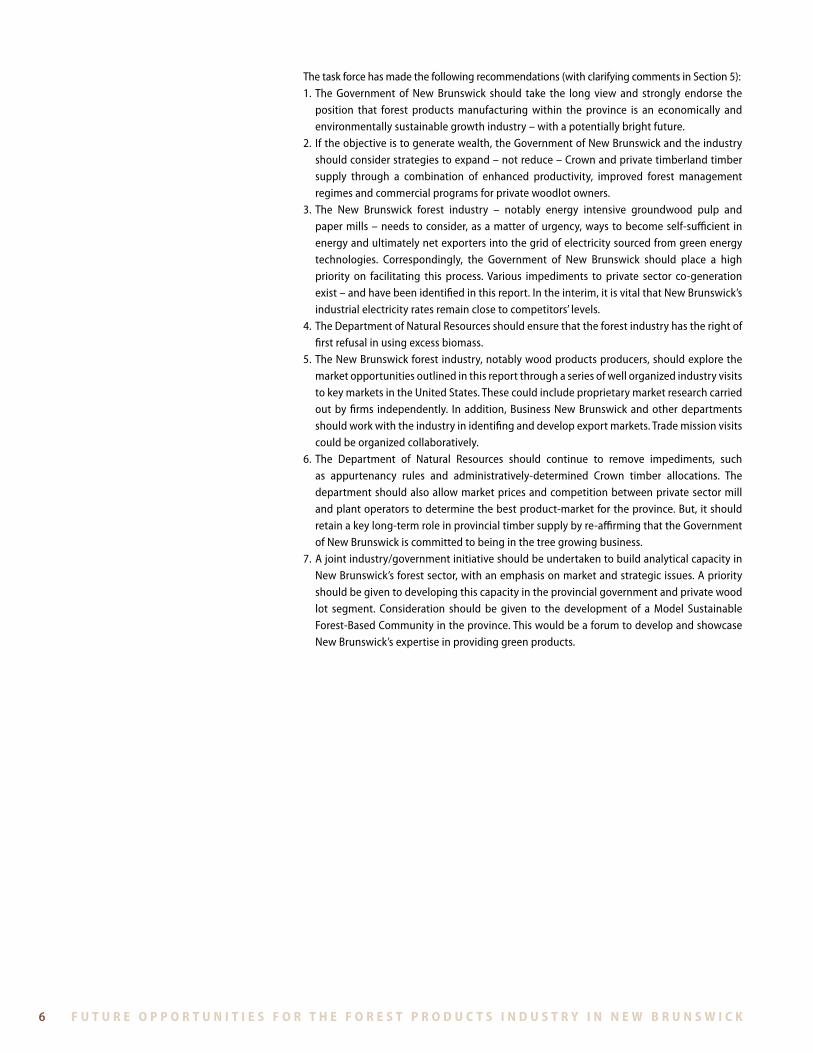
The task force has made the following recommendations (with clarifying comments in Section 5):1 . The Government of New Brunswick should take the long view and strongly endorse the
position that forest products manufacturing within the province is an economically and environmentally sustainable growth industry – with a potentially bright future .
2. Iftheobjectiveistogeneratewealth,theGovernmentofNewBrunswickandtheindustryshould consider strategies to expand – not reduce – Crown and private timberland timber supply through a combination of enhanced productivity, improved forest management regimes and commercial programs for private woodlot owners .
3 . The New Brunswick forest industry – notably energy intensive groundwood pulp and paper mills – needs to consider, as a matter of urgency, ways to become self-sufficient in energy and ultimately net exporters into the grid of electricity sourced from green energy technologies . Correspondingly, the Government of New Brunswick should place a high priority on facilitating this process . Various impediments to private sector co-generation exist – and have been identified in this report . In the interim, it is vital that New Brunswick’s industrial electricity rates remain close to competitors’ levels .
4 . The Department of Natural Resources should ensure that the forest industry has the right of first refusal in using excess biomass .
5 . The New Brunswick forest industry, notably wood products producers, should explore the market opportunities outlined in this report through a series of well organized industry visits to key markets in the United States . These could include proprietary market research carried out by firms independently . In addition, Business New Brunswick and other departments should work with the industry in identifing and develop export markets . Trade mission visits could be organized collaboratively .
6 . The Department of Natural Resources should continue to remove impediments, such as appurtenancy rules and administratively-determined Crown timber allocations . The department should also allow market prices and competition between private sector mill and plant operators to determine the best product-market for the province . But, it should retain a key long-term role in provincial timber supply by re-affirming that the Government of New Brunswick is committed to being in the tree growing business .
7.Ajointindustry/governmentinitiativeshouldbeundertakentobuildanalyticalcapacityin New Brunswick’s forest sector, with an emphasis on market and strategic issues . A priority should be given to developing this capacity in the provincial government and private wood lot segment . Consideration should be given to the development of a Model Sustainable Forest-Based Community in the province . This would be a forum to develop and showcase New Brunswick’s expertise in providing green products .
f u t u r e o p p o r t u n i t i e s f o r t h e f o r e s t p r o d u c t s i n d u s t r y i n n e w b r u n s w i c k f u t u r e o p p o r t u n i t i e s f o r t h e f o r e s t p r o d u c t s i n d u s t r y i n n e w b r u n s w i c k 7
1. s t ru c t u r e a n d r e c e n t e X p e r i e n c e o f n e w b ru n s w i c k’s f o r e s t i n d u s t ry
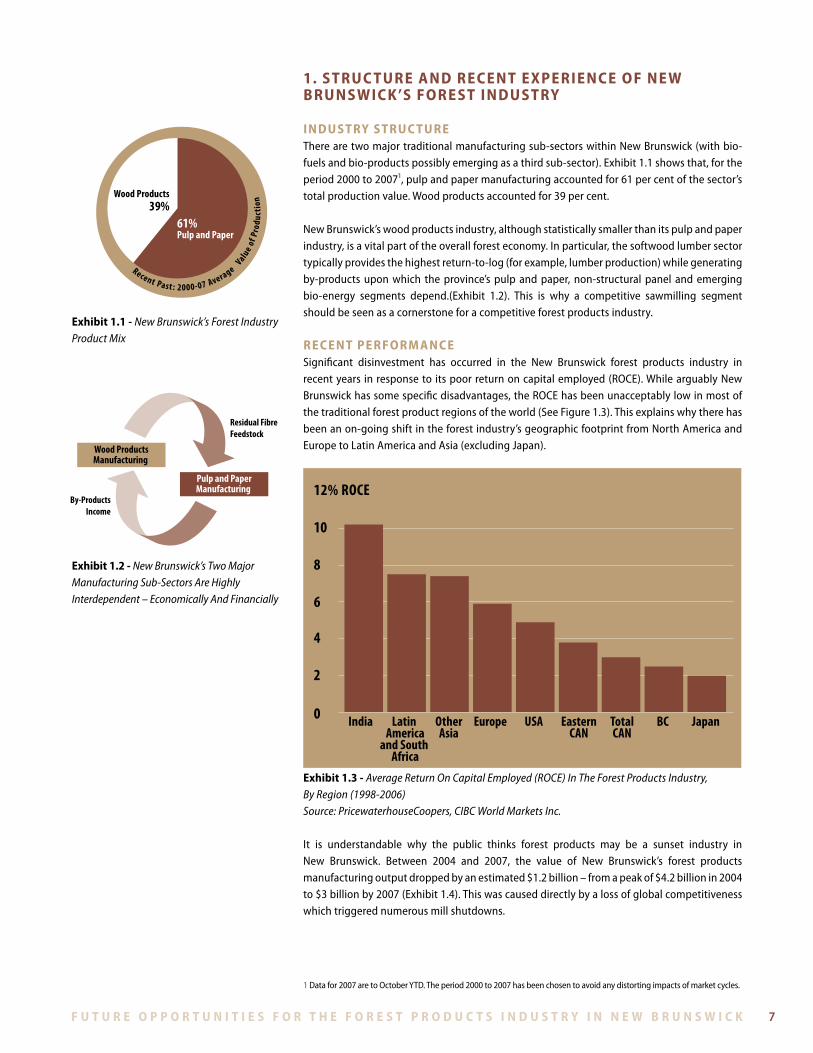
i n d u s t ry s t ru c t u r eTherearetwomajortraditionalmanufacturingsub-sectorswithinNewBrunswick(withbio-fuels and bio-products possibly emerging as a third sub-sector) . Exhibit 1 .1 shows that, for the period 2000 to 20071, pulp and paper manufacturing accounted for 61 per cent of the sector’s total production value . Wood products accounted for 39 per cent .
New Brunswick’s wood products industry, although statistically smaller than its pulp and paper industry, is a vital part of the overall forest economy . In particular, the softwood lumber sector typically provides the highest return-to-log (for example, lumber production) while generating by-products upon which the province’s pulp and paper, non-structural panel and emerging bio-energy segments depend .(Exhibit 1 .2) . This is why a competitive sawmilling segment should be seen as a cornerstone for a competitive forest products industry .
r e c e n t p e r f o r M a n c eSignificant disinvestment has occurred in the New Brunswick forest products industry in recent years in response to its poor return on capital employed (ROCE) . While arguably New Brunswick has some specific disadvantages, the ROCE has been unacceptably low in most of the traditional forest product regions of the world (See Figure 1 .3) . This explains why there has been an on-going shift in the forest industry’s geographic footprint from North America and Europe to Latin America and Asia (excluding Japan) .
0
468
3
1012
India Latin America
and South Africa
OtherAsia
Europe USA EasternCAN
TotalCAN
BC Japan0
2
4
6
8
10
12% ROCE
exhibit 1.3 - Average Return On Capital Employed (ROCE) In The Forest Products Industry, By Region (1998-2006)Source: PricewaterhouseCoopers, CIBC World Markets Inc.
It is understandable why the public thinks forest products may be a sunset industry in New Brunswick . Between 2004 and 2007, the value of New Brunswick’s forest products manufacturing output dropped by an estimated $1 .2 billion – from a peak of $4 .2 billion in 2004 to $3 billion by 2007 (Exhibit 1 .4) . This was caused directly by a loss of global competitiveness which triggered numerous mill shutdowns .
Recent Past : 2000-07 Average Valu
e of P
rodu
ctio
n
61%Pulp and Paper
Wood Products39%
exhibit 1.1 - New Brunswick’s Forest Industry Product Mix
exhibit 1.2 - New Brunswick’s Two Major Manufacturing Sub-Sectors Are Highly Interdependent – Economically And Financially
1 Data for 2007 are to October YTD . The period 2000 to 2007 has been chosen to avoid any distorting impacts of market cycles .
Wood ProductsManufacturing
Pulp and PaperManufacturing
Residual FibreFeedstock
By-ProductsIncome
f u t u r e o p p o r t u n i t i e s f o r t h e f o r e s t p r o d u c t s i n d u s t r y i n n e w b r u n s w i c k8 f u t u r e o p p o r t u n i t i e s f o r t h e f o r e s t p r o d u c t s i n d u s t r y i n n e w b r u n s w i c k
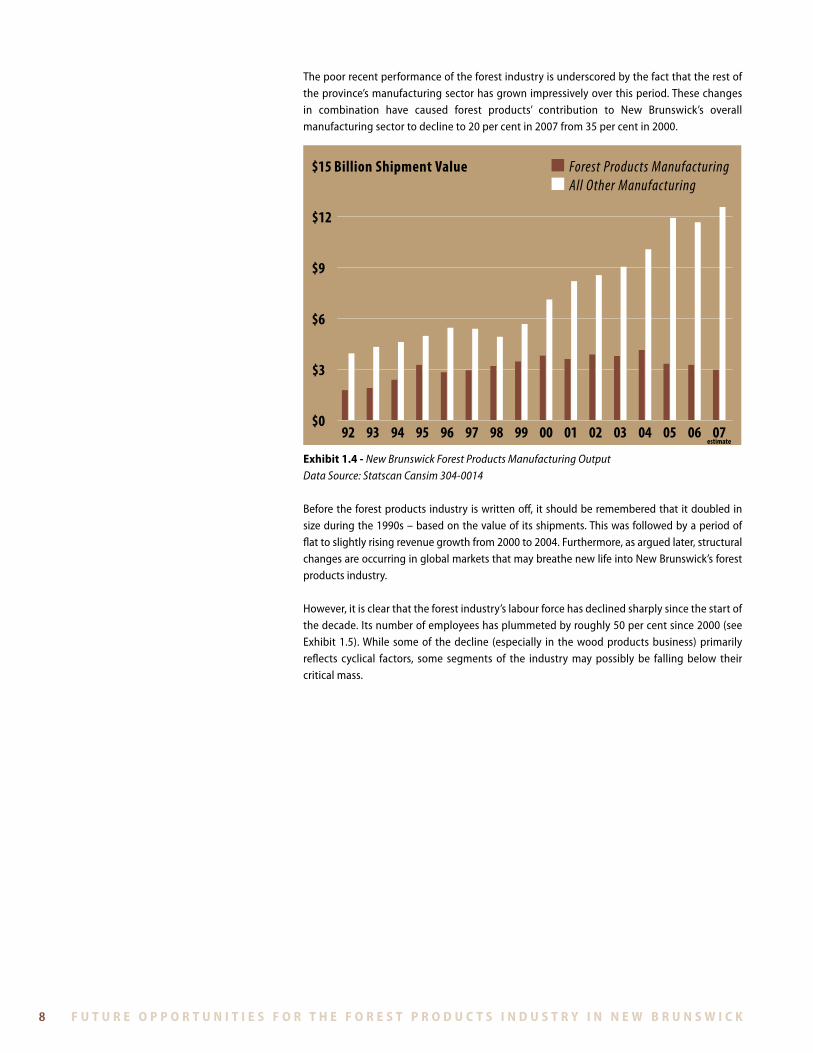
The poor recent performance of the forest industry is underscored by the fact that the rest of the province’s manufacturing sector has grown impressively over this period . These changes in combination have caused forest products’ contribution to New Brunswick’s overall manufacturing sector to decline to 20 per cent in 2007 from 35 per cent in 2000 .
$0
$3
$6
$9
$12
$15 Billion Shipment Value Forest Products Manufacturing All Other Manufacturing
92 93 94 95 96 97 98 99 00 01 02 03 04 05 06 07estimate
exhibit 1.4 - New Brunswick Forest Products Manufacturing OutputData Source: Statscan Cansim 304-0014
Before the forest products industry is written off, it should be remembered that it doubled in size during the 1990s – based on the value of its shipments . This was followed by a period of flat to slightly rising revenue growth from 2000 to 2004 . Furthermore, as argued later, structural changes are occurring in global markets that may breathe new life into New Brunswick’s forest products industry .
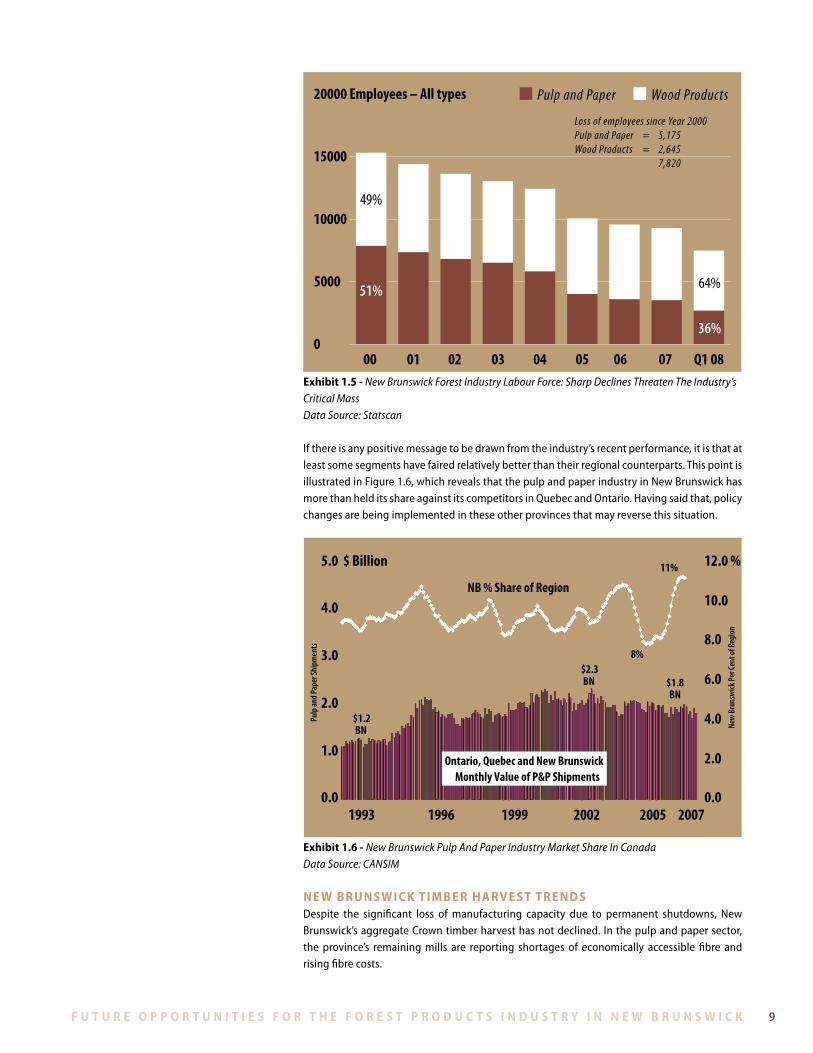
However, it is clear that the forest industry’s labour force has declined sharply since the start of the decade . Its number of employees has plummeted by roughly 50 per cent since 2000 (see Exhibit 1 .5) . While some of the decline (especially in the wood products business) primarily reflects cyclical factors, some segments of the industry may possibly be falling below their critical mass .
f u t u r e o p p o r t u n i t i e s f o r t h e f o r e s t p r o d u c t s i n d u s t r y i n n e w b r u n s w i c k f u t u r e o p p o r t u n i t i e s f o r t h e f o r e s t p r o d u c t s i n d u s t r y i n n e w b r u n s w i c k 9
0
5000
10000
15000
20000 Employees – All types Pulp and Paper Wood Products
00 01 02 03 04 05 06 07 Q1 08
49%
51%
36%
64%
Loss of employees since Year 2000Pulp and Paper = 5,175Wood Products = 2,645 7,820
exhibit 1.5 - New Brunswick Forest Industry Labour Force: Sharp Declines Threaten The Industry’s Critical MassData Source: Statscan
If there is any positive message to be drawn from the industry’s recent performance, it is that at least some segments have faired relatively better than their regional counterparts . This point is illustrated in Figure 1 .6, which reveals that the pulp and paper industry in New Brunswick has more than held its share against its competitors in Quebec and Ontario . Having said that, policy changes are being implemented in these other provinces that may reverse this situation .
1994/02 1996/03 1998/04 2000/05 2002/06 2004/07 2006/081993 200520021996 1999 20071994/02 1996/03 1998/040.0
1.0
2.0
3.0
4.0
5.0 $ Billion
1994/02 1996/03 1998/04 2000/05 2002/06 2004/07 2006/08
Pulp
and
Pape
r Shi
pmen
ts
0.0
2.0
4.0
6.0
8.0
10.0
12.0 %
New
Bru
nsw
ick P
er Ce
nt o
f Reg
ion
8%
11%
NB % Share of Region
Ontario, Quebec and New BrunswickMonthly Value of P&P Shipments
$2.3BN $1.8
BN
$1.2BN
1993 200520021996 1999 2007
exhibit 1.6 - New Brunswick Pulp And Paper Industry Market Share In CanadaData Source: CANSIM
n e w b ru n s w i c k t i M b e r h a rV e s t t r e n d sDespite the significant loss of manufacturing capacity due to permanent shutdowns, New Brunswick’s aggregate Crown timber harvest has not declined . In the pulp and paper sector, the province’s remaining mills are reporting shortages of economically accessible fibre and rising fibre costs .
f u t u r e o p p o r t u n i t i e s f o r t h e f o r e s t p r o d u c t s i n d u s t r y i n n e w b r u n s w i c k10 f u t u r e o p p o r t u n i t i e s f o r t h e f o r e s t p r o d u c t s i n d u s t r y i n n e w b r u n s w i c k
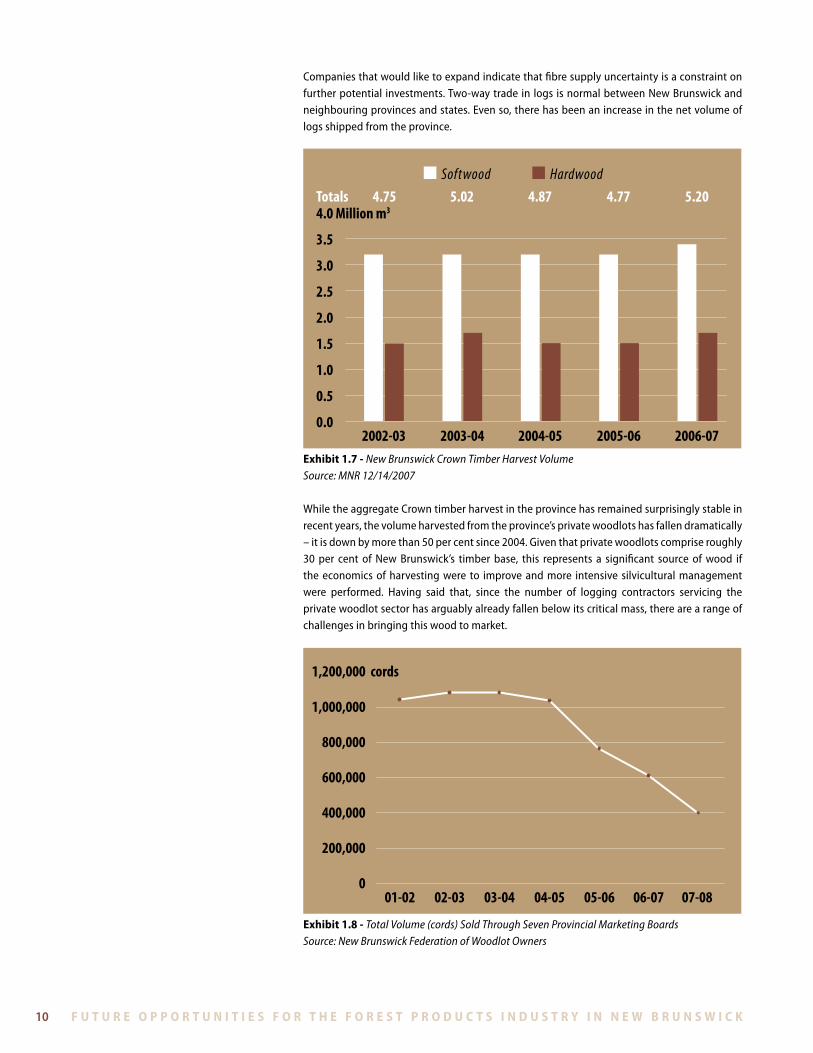
Companies that would like to expand indicate that fibre supply uncertainty is a constraint on further potential investments . Two-way trade in logs is normal between New Brunswick and neighbouring provinces and states . Even so, there has been an increase in the net volume of logs shipped from the province .
0.0
0.5
1.0
1.5
2.0
2.5
3.0
3.5
4.0 Million m3Totals 4.75 5.02 4.87 4.77 5.20
Softwood Hardwood
2002-03 2003-04 2004-05 2005-06 2006-07exhibit 1.7 - New Brunswick Crown Timber Harvest VolumeSource: MNR 12/14/2007
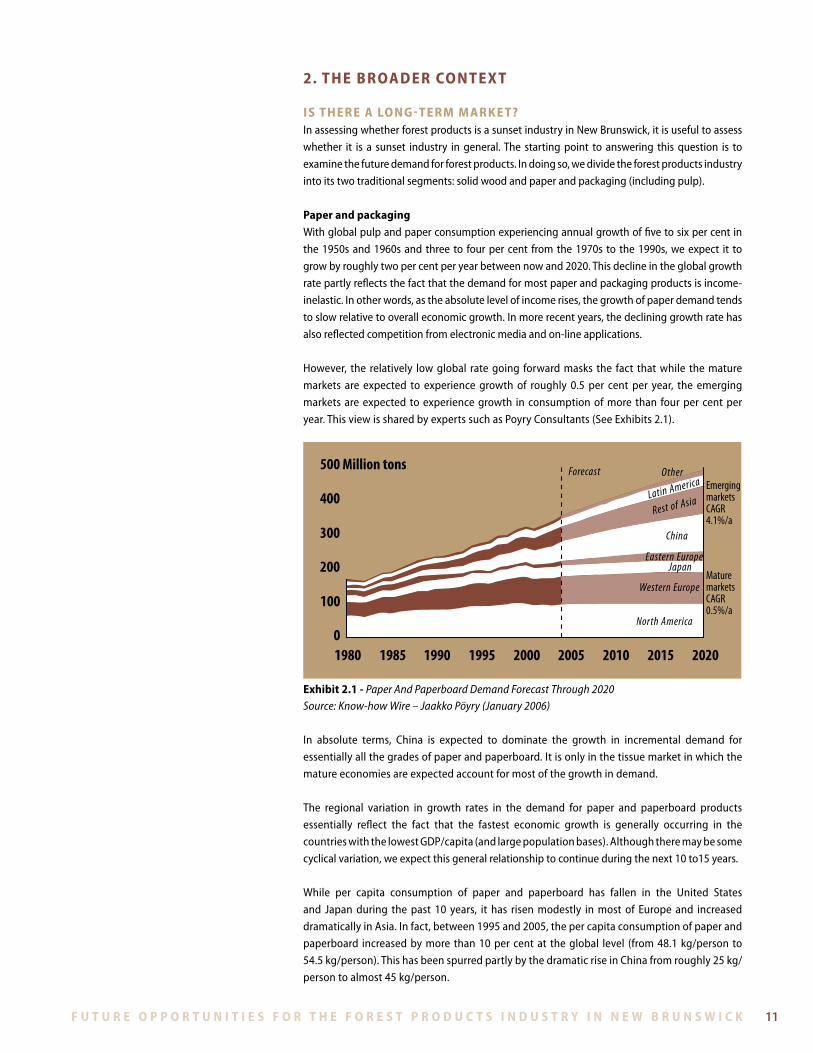
While the aggregate Crown timber harvest in the province has remained surprisingly stable in recent years, the volume harvested from the province’s private woodlots has fallen dramatically – it is down by more than 50 per cent since 2004 . Given that private woodlots comprise roughly 30 per cent of New Brunswick’s timber base, this represents a significant source of wood if the economics of harvesting were to improve and more intensive silvicultural management were performed . Having said that, since the number of logging contractors servicing the private woodlot sector has arguably already fallen below its critical mass, there are a range of challenges in bringing this wood to market .
0
200,000
400,000
600,000
800,000
1,000,000
1,200,000 cords
01-02 02-03 03-04 04-05 05-06 06-07 07-08
exhibit 1.8 - Total Volume (cords) Sold Through Seven Provincial Marketing BoardsSource: New Brunswick Federation of Woodlot Owners
f u t u r e o p p o r t u n i t i e s f o r t h e f o r e s t p r o d u c t s i n d u s t r y i n n e w b r u n s w i c k f u t u r e o p p o r t u n i t i e s f o r t h e f o r e s t p r o d u c t s i n d u s t r y i n n e w b r u n s w i c k 11
2. t h e b r oa d e r co n t e X t
i s t h e r e a lo n g - t e r M M a r k e t?In assessing whether forest products is a sunset industry in New Brunswick, it is useful to assess
whether it is a sunset industry in general . The starting point to answering this question is to
examine the future demand for forest products . In doing so, we divide the forest products industry
into its two traditional segments: solid wood and paper and packaging (including pulp) .
paper and packagingWith global pulp and paper consumption experiencing annual growth of five to six per cent in
the 1950s and 1960s and three to four per cent from the 1970s to the 1990s, we expect it to
grow by roughly two per cent per year between now and 2020 . This decline in the global growth
rate partly reflects the fact that the demand for most paper and packaging products is income-
inelastic . In other words, as the absolute level of income rises, the growth of paper demand tends
to slow relative to overall economic growth . In more recent years, the declining growth rate has
also reflected competition from electronic media and on-line applications .
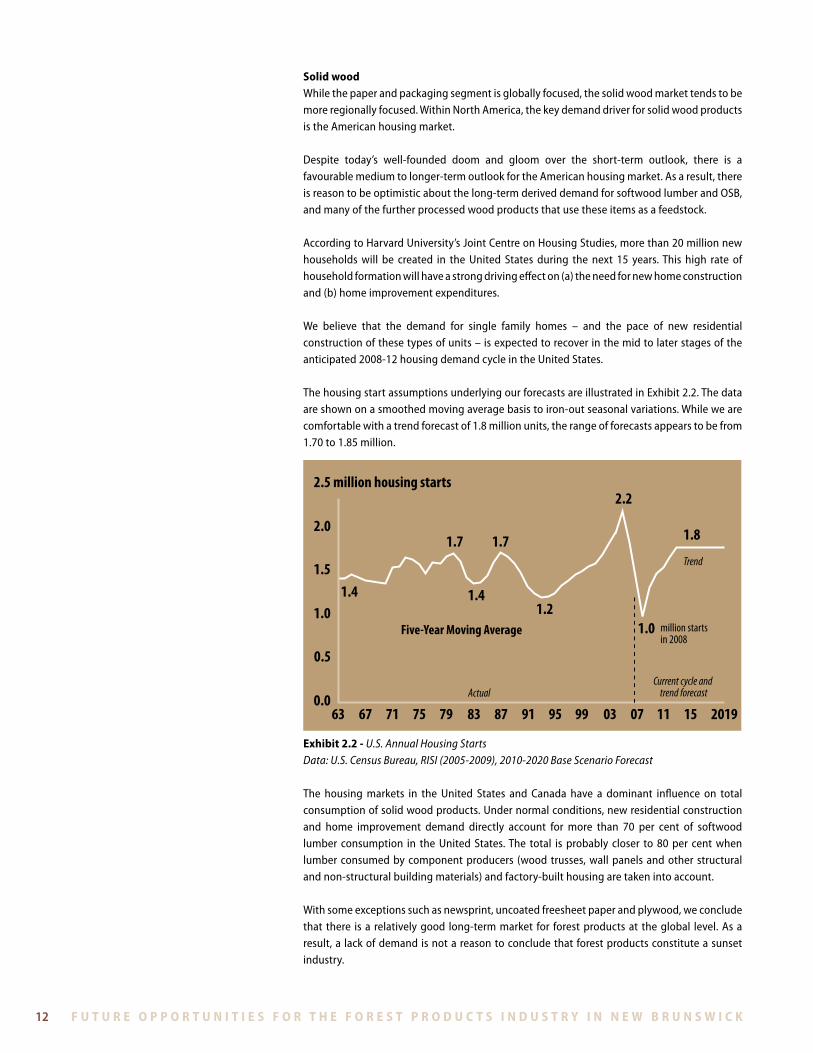
However, the relatively low global rate going forward masks the fact that while the mature
markets are expected to experience growth of roughly 0 .5 per cent per year, the emerging
markets are expected to experience growth in consumption of more than four per cent per
year . This view is shared by experts such as Poyry Consultants (See Exhibits 2 .1) .
0
100
200
300
400
500 Million tons
1980 1985 1990 1995 2000 2005 2010 2015 2020
EmergingmarketsCAGR4.1%/a
MaturemarketsCAGR0.5%/a
Forecast Other
Latin America
Rest of Asia
China
Eastern EuropeJapan
Western Europe
North America
exhibit 2.1 - Paper And Paperboard Demand Forecast Through 2020Source: Know-how Wire – Jaakko Pöyry (January 2006)
In absolute terms, China is expected to dominate the growth in incremental demand for
essentially all the grades of paper and paperboard . It is only in the tissue market in which the
mature economies are expected account for most of the growth in demand .
The regional variation in growth rates in the demand for paper and paperboard products
essentially reflect the fact that the fastest economic growth is generally occurring in the
countries with the lowest GDP/capita (and large population bases) . Although there may be some
cyclical variation, we expect this general relationship to continue during the next 10 to15 years .
While per capita consumption of paper and paperboard has fallen in the United States
and Japan during the past 10 years, it has risen modestly in most of Europe and increased
dramatically in Asia . In fact, between 1995 and 2005, the per capita consumption of paper and
paperboard increased by more than 10 per cent at the global level (from 48 .1 kg/person to
54 .5 kg/person) . This has been spurred partly by the dramatic rise in China from roughly 25 kg/
person to almost 45 kg/person .
f u t u r e o p p o r t u n i t i e s f o r t h e f o r e s t p r o d u c t s i n d u s t r y i n n e w b r u n s w i c k12 f u t u r e o p p o r t u n i t i e s f o r t h e f o r e s t p r o d u c t s i n d u s t r y i n n e w b r u n s w i c k
solid woodWhile the paper and packaging segment is globally focused, the solid wood market tends to be more regionally focused . Within North America, the key demand driver for solid wood products is the American housing market .
Despite today’s well-founded doom and gloom over the short-term outlook, there is a favourable medium to longer-term outlook for the American housing market . As a result, there is reason to be optimistic about the long-term derived demand for softwood lumber and OSB, and many of the further processed wood products that use these items as a feedstock .
According to Harvard University’s Joint Centre on Housing Studies, more than 20 million new households will be created in the United States during the next 15 years . This high rate of household formation will have a strong driving effect on (a) the need for new home construction and (b) home improvement expenditures .
We believe that the demand for single family homes – and the pace of new residential construction of these types of units – is expected to recover in the mid to later stages of the anticipated 2008-12 housing demand cycle in the United States .
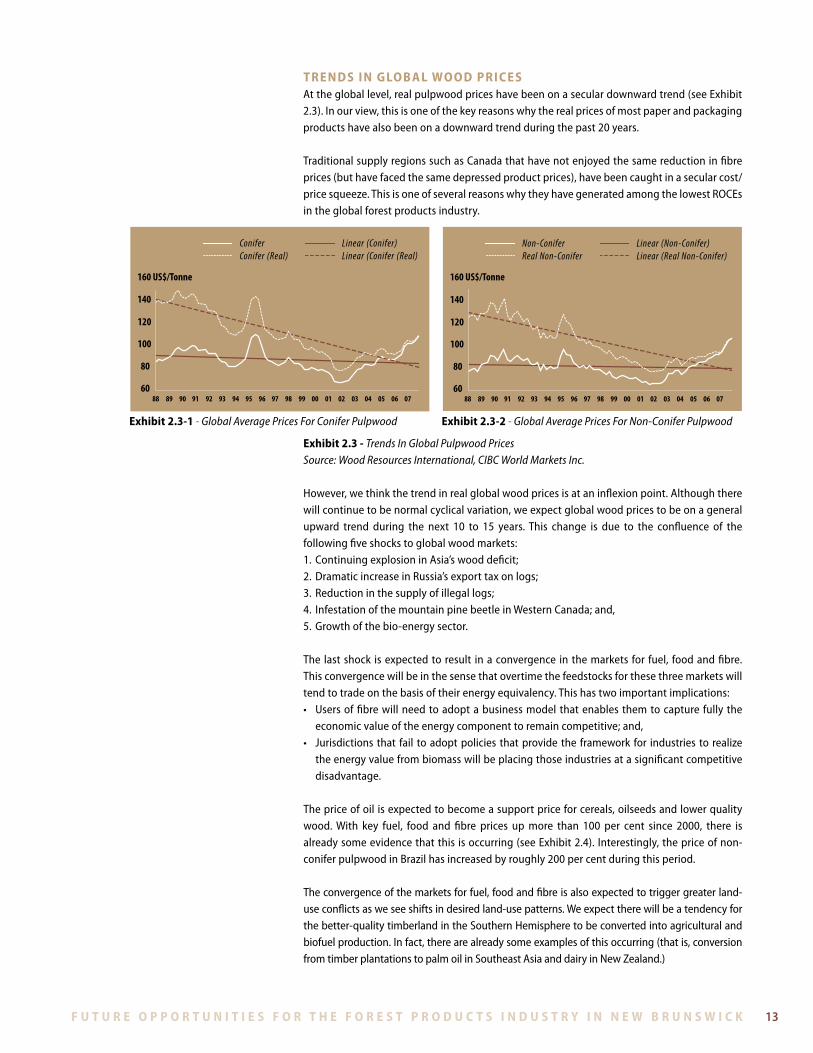
The housing start assumptions underlying our forecasts are illustrated in Exhibit 2 .2 . The data are shown on a smoothed moving average basis to iron-out seasonal variations . While we are comfortable with a trend forecast of 1 .8 million units, the range of forecasts appears to be from 1 .70 to 1 .85 million .
0.0
0.5
1.0
1.5
2.0
2.5 million housing starts
63 67 71 75 79 83 87 91 95 99 03 07 11 15 2019
1.4
1.7 1.7
1.41.2
2.2
1.0
1.8
million startsin 2008
Five-Year Moving Average
Actual
Trend
Current cycle and trend forecast
exhibit 2.2 - U.S. Annual Housing StartsData: U.S. Census Bureau, RISI (2005-2009), 2010-2020 Base Scenario Forecast
The housing markets in the United States and Canada have a dominant influence on total consumption of solid wood products . Under normal conditions, new residential construction and home improvement demand directly account for more than 70 per cent of softwood lumber consumption in the United States . The total is probably closer to 80 per cent when lumber consumed by component producers (wood trusses, wall panels and other structural and non-structural building materials) and factory-built housing are taken into account .
With some exceptions such as newsprint, uncoated freesheet paper and plywood, we conclude that there is a relatively good long-term market for forest products at the global level . As a result, a lack of demand is not a reason to conclude that forest products constitute a sunset industry .
f u t u r e o p p o r t u n i t i e s f o r t h e f o r e s t p r o d u c t s i n d u s t r y i n n e w b r u n s w i c k f u t u r e o p p o r t u n i t i e s f o r t h e f o r e s t p r o d u c t s i n d u s t r y i n n e w b r u n s w i c k 13
60
80
100
120
140
160 US$/Tonne
8988 90 91 92 93 94 95 96 97 98 99 00 01 02 03 04 05 06 07
Conifer Conifer (Real)
Linear (Conifer)Linear (Conifer (Real)
60
80
100
120
140
160 US$/Tonne
8988 90 91 92 93 94 95 96 97 98 99 00 01 02 03 04 05 06 07
Non-Conifer Real Non-Conifer
Linear (Non-Conifer)Linear (Real Non-Conifer)
exhibit 2.3-1 - Global Average Prices For Conifer Pulpwood exhibit 2.3-2 - Global Average Prices For Non-Conifer Pulpwood
t r e n d s i n g lo b a l wo o d p r i c e sAt the global level, real pulpwood prices have been on a secular downward trend (see Exhibit 2 .3) . In our view, this is one of the key reasons why the real prices of most paper and packaging products have also been on a downward trend during the past 20 years .
TraditionalsupplyregionssuchasCanadathathavenotenjoyedthesamereductioninfibreprices (but have faced the same depressed product prices), have been caught in a secular cost/price squeeze . This is one of several reasons why they have generated among the lowest ROCEs in the global forest products industry .
exhibit 2.3 - Trends In Global Pulpwood PricesSource: Wood Resources International, CIBC World Markets Inc.
However, we think the trend in real global wood prices is at an inflexion point . Although there will continue to be normal cyclical variation, we expect global wood prices to be on a general upward trend during the next 10 to 15 years . This change is due to the confluence of the following five shocks to global wood markets:1 . Continuing explosion in Asia’s wood deficit;2 . Dramatic increase in Russia’s export tax on logs;3 . Reduction in the supply of illegal logs;4 . Infestation of the mountain pine beetle in Western Canada; and,5 . Growth of the bio-energy sector .
The last shock is expected to result in a convergence in the markets for fuel, food and fibre . This convergence will be in the sense that overtime the feedstocks for these three markets will tend to trade on the basis of their energy equivalency . This has two important implications:• Usersoffibrewillneedtoadoptabusinessmodelthatenablesthemtocapturefullythe
economic value of the energy component to remain competitive; and,• Jurisdictionsthat fail toadoptpolicies thatprovidethe framework for industries to realize
the energy value from biomass will be placing those industries at a significant competitive disadvantage .
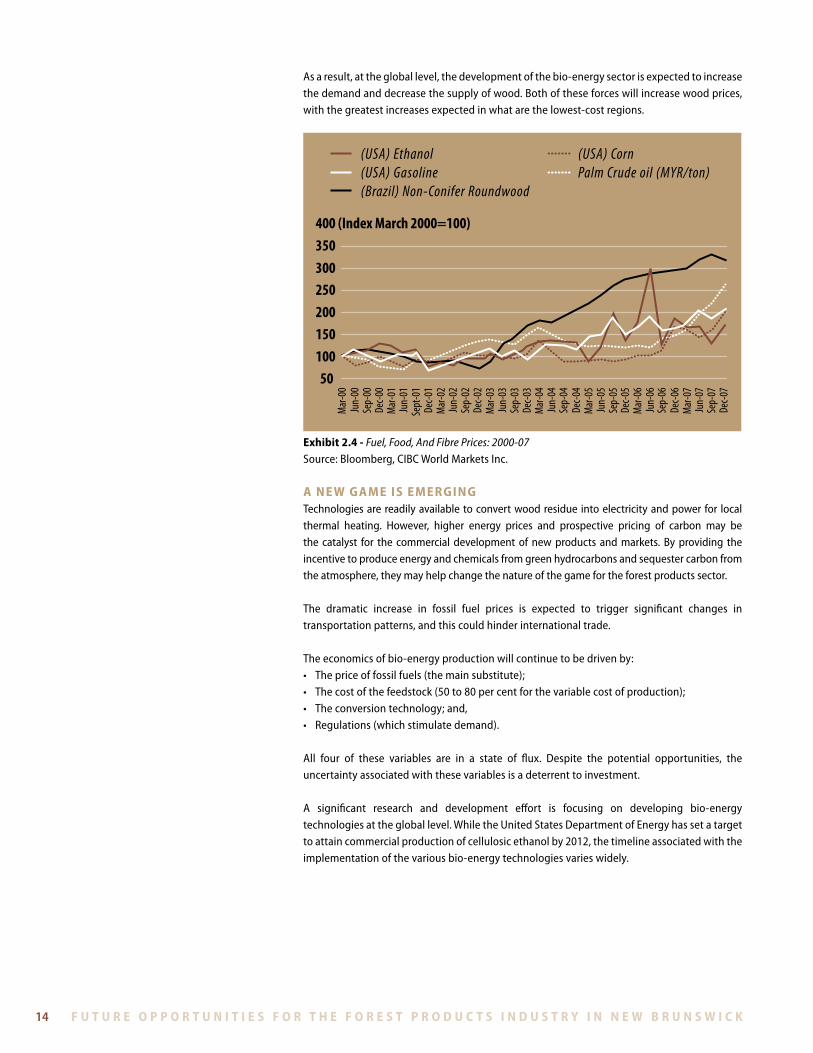
The price of oil is expected to become a support price for cereals, oilseeds and lower quality wood . With key fuel, food and fibre prices up more than 100 per cent since 2000, there is already some evidence that this is occurring (see Exhibit 2 .4) . Interestingly, the price of non-conifer pulpwood in Brazil has increased by roughly 200 per cent during this period .
The convergence of the markets for fuel, food and fibre is also expected to trigger greater land-use conflicts as we see shifts in desired land-use patterns . We expect there will be a tendency for the better-quality timberland in the Southern Hemisphere to be converted into agricultural and biofuel production . In fact, there are already some examples of this occurring (that is, conversion from timber plantations to palm oil in Southeast Asia and dairy in New Zealand .)
f u t u r e o p p o r t u n i t i e s f o r t h e f o r e s t p r o d u c t s i n d u s t r y i n n e w b r u n s w i c k14 f u t u r e o p p o r t u n i t i e s f o r t h e f o r e s t p r o d u c t s i n d u s t r y i n n e w b r u n s w i c k
As a result, at the global level, the development of the bio-energy sector is expected to increase the demand and decrease the supply of wood . Both of these forces will increase wood prices, with the greatest increases expected in what are the lowest-cost regions .
50100150200250300350400 (Index March 2000=100)
Mar-0
0Ju
n-00
Sep-
00De
c-00
Mar-0
1Ju
n-01
Sept
-01
Dec-0
1Ma
r-02
Jun-
02Se
p-02
Dec-0
2Ma
r-03
Jun-
03Se
p-03
Dec-0
3Ma
r-04
Jun-
04Se
p-04
Dec-0
4Ma
r-05
Jun-
05Se
p-05
Dec-0
5Ma
r-06
Jun-
06Se
p-06
Dec-0
6Ma
r-07
Jun-
07Se
p-07
Dec-0
7
(USA) Ethanol (USA) Gasoline(Brazil) Non-Conifer Roundwood
(USA) CornPalm Crude oil (MYR/ton)
exhibit 2.4 - Fuel, Food, And Fibre Prices: 2000-07Source: Bloomberg, CIBC World Markets Inc .
a n e w g a M e i s e M e r g i n gTechnologies are readily available to convert wood residue into electricity and power for local thermal heating . However, higher energy prices and prospective pricing of carbon may be the catalyst for the commercial development of new products and markets . By providing the incentive to produce energy and chemicals from green hydrocarbons and sequester carbon from the atmosphere, they may help change the nature of the game for the forest products sector .
The dramatic increase in fossil fuel prices is expected to trigger significant changes in transportation patterns, and this could hinder international trade .
The economics of bio-energy production will continue to be driven by:• Thepriceoffossilfuels(themainsubstitute);• Thecostofthefeedstock(50to80percentforthevariablecostofproduction);• Theconversiontechnology;and,• Regulations(whichstimulatedemand).
All four of these variables are in a state of flux . Despite the potential opportunities, the uncertainty associated with these variables is a deterrent to investment .
A significant research and development effort is focusing on developing bio-energy technologies at the global level . While the United States Department of Energy has set a target to attain commercial production of cellulosic ethanol by 2012, the timeline associated with the implementation of the various bio-energy technologies varies widely .
f u t u r e o p p o r t u n i t i e s f o r t h e f o r e s t p r o d u c t s i n d u s t r y i n n e w b r u n s w i c k f u t u r e o p p o r t u n i t i e s f o r t h e f o r e s t p r o d u c t s i n d u s t r y i n n e w b r u n s w i c k 15
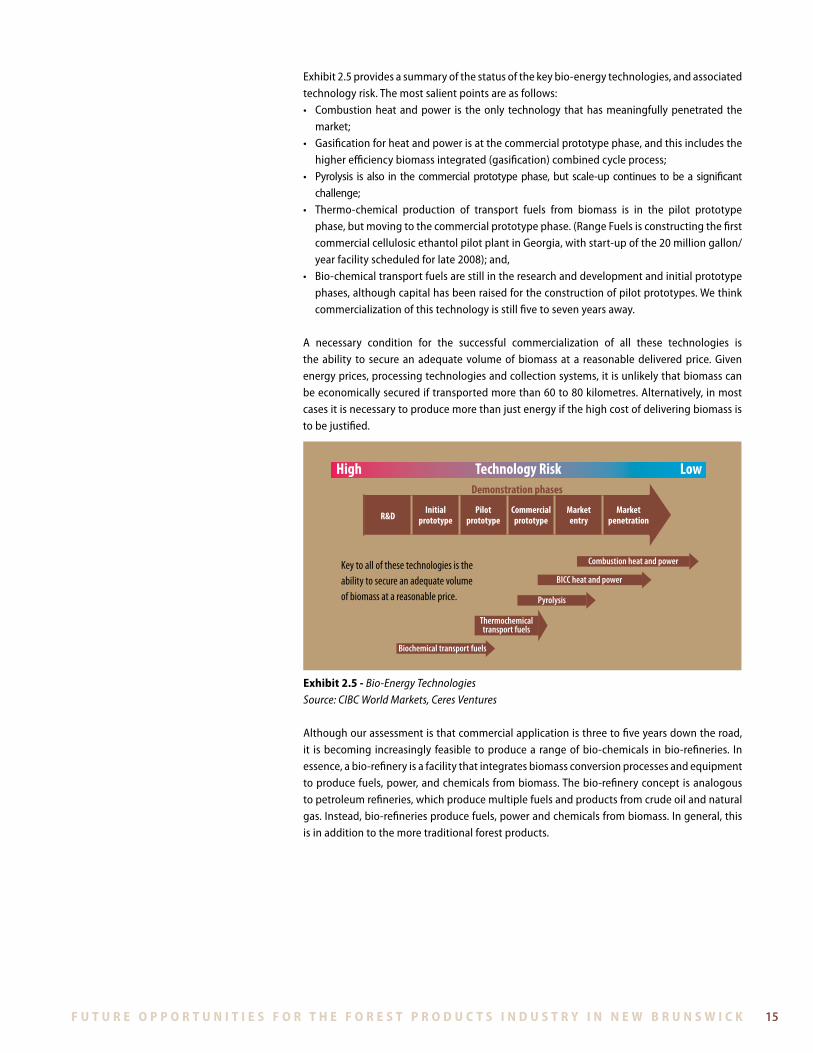
Exhibit 2 .5 provides a summary of the status of the key bio-energy technologies, and associated technology risk . The most salient points are as follows:• Combustionheatandpower is theonly technology thathasmeaningfullypenetrated the
market;• Gasificationforheatandpowerisatthecommercialprototypephase,andthisincludesthe
higher efficiency biomass integrated (gasification) combined cycle process;• Pyrolysis is also in the commercial prototypephase,but scale-up continues tobe a significant
challenge; • Thermo-chemical production of transport fuels from biomass is in the pilot prototype
phase, but moving to the commercial prototype phase . (Range Fuels is constructing the first commercial cellulosic ethantol pilot plant in Georgia, with start-up of the 20 million gallon/year facility scheduled for late 2008); and,
• Bio-chemicaltransportfuelsarestillintheresearchanddevelopmentandinitialprototypephases, although capital has been raised for the construction of pilot prototypes . We think commercialization of this technology is still five to seven years away .
A necessary condition for the successful commercialization of all these technologies is the ability to secure an adequate volume of biomass at a reasonable delivered price . Given energy prices, processing technologies and collection systems, it is unlikely that biomass can be economically secured if transported more than 60 to 80 kilometres . Alternatively, in most casesitisnecessarytoproducemorethanjustenergyifthehighcostofdeliveringbiomassistobejustified.
Key to all of these technologies is the ability to secure an adequate volume of biomass at a reasonable price.
Demonstration phases
High LowTechnology Risk
R&DInitial
prototypePilot
prototypeCommercialprototype
Marketentry
Marketpenetration
Combustion heat and power
BICC heat and power
Biochemical transport fuels
Pyrolysis
Thermochemicaltransport fuels
exhibit 2.5 - Bio-Energy TechnologiesSource: CIBC World Markets, Ceres Ventures
Although our assessment is that commercial application is three to five years down the road, it is becoming increasingly feasible to produce a range of bio-chemicals in bio-refineries . In essence, a bio-refinery is a facility that integrates biomass conversion processes and equipment to produce fuels, power, and chemicals from biomass . The bio-refinery concept is analogous to petroleum refineries, which produce multiple fuels and products from crude oil and natural gas . Instead, bio-refineries produce fuels, power and chemicals from biomass . In general, this is in addition to the more traditional forest products .
f u t u r e o p p o r t u n i t i e s f o r t h e f o r e s t p r o d u c t s i n d u s t r y i n n e w b r u n s w i c k16 f u t u r e o p p o r t u n i t i e s f o r t h e f o r e s t p r o d u c t s i n d u s t r y i n n e w b r u n s w i c k
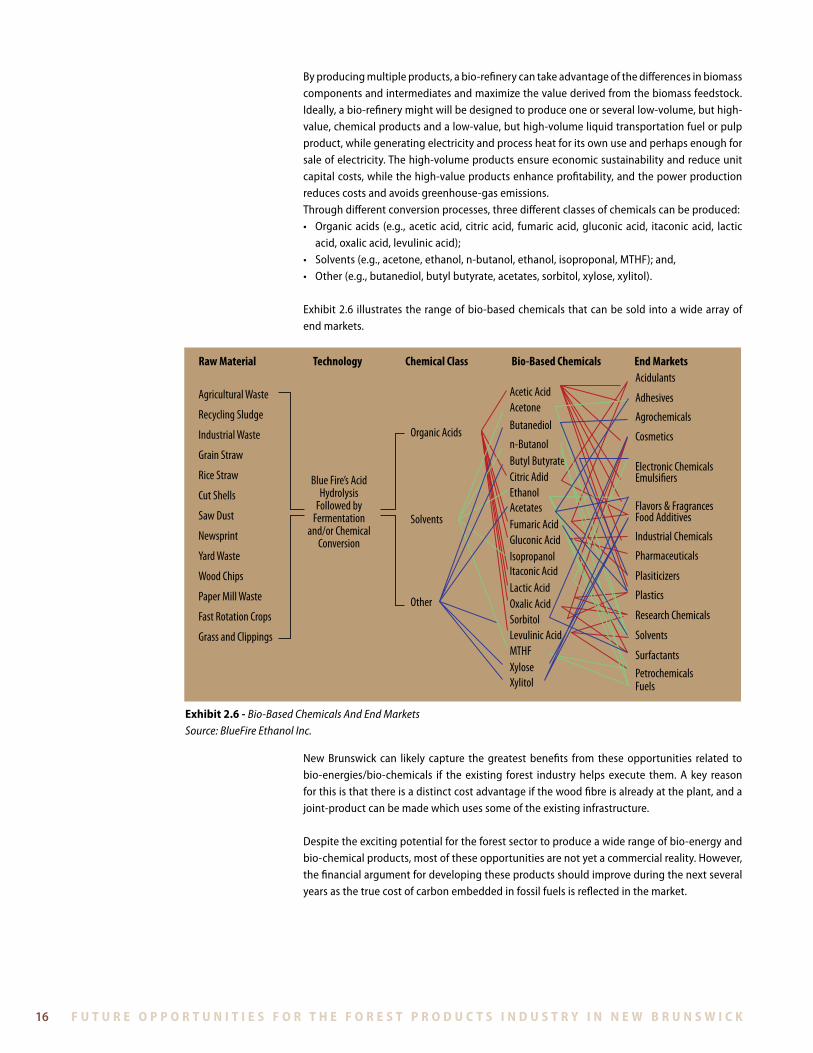
By producing multiple products, a bio-refinery can take advantage of the differences in biomass components and intermediates and maximize the value derived from the biomass feedstock . Ideally, a bio-refinery might will be designed to produce one or several low-volume, but high-value, chemical products and a low-value, but high-volume liquid transportation fuel or pulp product, while generating electricity and process heat for its own use and perhaps enough for sale of electricity . The high-volume products ensure economic sustainability and reduce unit capital costs, while the high-value products enhance profitability, and the power production reduces costs and avoids greenhouse-gas emissions .Through different conversion processes, three different classes of chemicals can be produced:• Organicacids (e.g., aceticacid, citricacid, fumaricacid,gluconicacid, itaconicacid, lactic
acid, oxalic acid, levulinic acid);• Solvents(e.g.,acetone,ethanol,n-butanol,ethanol,isoproponal,MTHF);and,• Other(e.g.,butanediol,butylbutyrate,acetates,sorbitol,xylose,xylitol).
Exhibit 2 .6 illustrates the range of bio-based chemicals that can be sold into a wide array of end markets .
New Brunswick can likely capture the greatest benefits from these opportunities related to bio-energies/bio-chemicals if the existing forest industry helps execute them . A key reason for this is that there is a distinct cost advantage if the wood fibre is already at the plant, and a joint-productcanbemadewhichusessomeoftheexistinginfrastructure.
Despite the exciting potential for the forest sector to produce a wide range of bio-energy and bio-chemical products, most of these opportunities are not yet a commercial reality . However, the financial argument for developing these products should improve during the next several years as the true cost of carbon embedded in fossil fuels is reflected in the market .
Agricultural Waste Acetic AcidAcidulants
Adhesives
Agrochemicals
Cosmetics
Electronic ChemicalsEmulsi�ers
Flavors & FragrancesFood Additives
Industrial Chemicals
Pharmaceuticals
Plasiticizers
Plastics
Research Chemicals
Solvents
SurfactantsPetrochemicalsFuels
AcetoneButanediol
n-ButanolButyl ButyrateCitric AdidEthanolAcetatesFumaric AcidGluconic AcidIsopropanolItaconic AcidLactic AcidOxalic AcidSorbitolLevulinic AcidMTHFXyloseXylitol
Organic Acids
Raw Material Technology Chemical Class Bio-Based Chemicals End Markets
Other
Solvents
Recycling Sludge
Industrial Waste
Grain Straw
Rice Straw
Cut ShellsBlue Fire’s Acid
HydrolysisFollowed by
Fermentationand/or Chemical
Conversion
Saw Dust
Newsprint
Yard Waste
Wood Chips
Paper Mill Waste
Fast Rotation Crops
Grass and Clippings
exhibit 2.6 - Bio-Based Chemicals And End MarketsSource: BlueFire Ethanol Inc.
f u t u r e o p p o r t u n i t i e s f o r t h e f o r e s t p r o d u c t s i n d u s t r y i n n e w b r u n s w i c k f u t u r e o p p o r t u n i t i e s f o r t h e f o r e s t p r o d u c t s i n d u s t r y i n n e w b r u n s w i c k 17
The National Roundtable on the Environment and the Economy estimates that attaining the federal government’s green house gas target would require carbon prices to rise from $15/tonne in 2015 to $200/tonne in 2030 . However, it is more likely that the carbon agenda for Canada will be set in Washington rather than in Ottawa .
In our view, direct or indirect pricing of carbon will come to the United States sooner than many expect . Although recently defeated, the bi-partisan Lieberman-Warner bill in the American Senate is widely regarded as reflecting the emerging political consensus about the likely structure of a future cap-and-trade system in the United States . Both presidential candidates also support some form of cap-and-trade system, and we expect Washington will leap-frog Ottawa on this issue within two years .
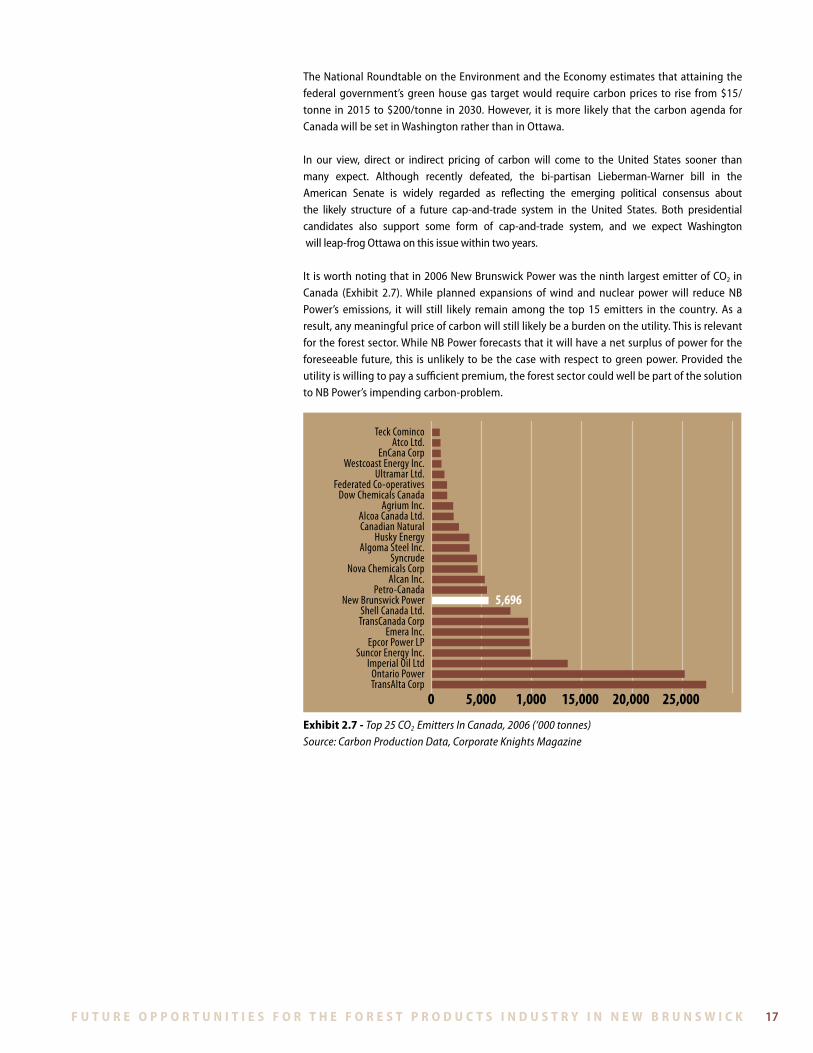
It is worth noting that in 2006 New Brunswick Power was the ninth largest emitter of CO2 in Canada (Exhibit 2 .7) . While planned expansions of wind and nuclear power will reduce NB Power’s emissions, it will still likely remain among the top 15 emitters in the country . As a result, any meaningful price of carbon will still likely be a burden on the utility . This is relevant for the forest sector . While NB Power forecasts that it will have a net surplus of power for the foreseeable future, this is unlikely to be the case with respect to green power . Provided the utility is willing to pay a sufficient premium, the forest sector could well be part of the solution to NB Power’s impending carbon-problem .
5,696
Teck ComincoAtco Ltd.
EnCana CorpWestcoast Energy Inc.
Ultramar Ltd.Federated Co-operatives
Dow Chemicals CanadaAgrium Inc.
Alcoa Canada Ltd.Canadian Natural
Husky EnergyAlgoma Steel Inc.
SyncrudeNova Chemicals Corp
Alcan Inc.Petro-Canada
New Brunswick PowerShell Canada Ltd.TransCanada Corp
Emera Inc.Epcor Power LP
Suncor Energy Inc.Imperial Oil Ltd
Ontario PowerTransAlta Corp
5,0000 1,000 15,000 20,000 25,000
exhibit 2.7 - Top 25 CO2 Emitters In Canada, 2006 (‘000 tonnes)Source: Carbon Production Data, Corporate Knights Magazine
f u t u r e o p p o r t u n i t i e s f o r t h e f o r e s t p r o d u c t s i n d u s t r y i n n e w b r u n s w i c k18 f u t u r e o p p o r t u n i t i e s f o r t h e f o r e s t p r o d u c t s i n d u s t r y i n n e w b r u n s w i c k
3. t h e b u i l d i n g b lo c k s: wo o d a n d e n e r g y
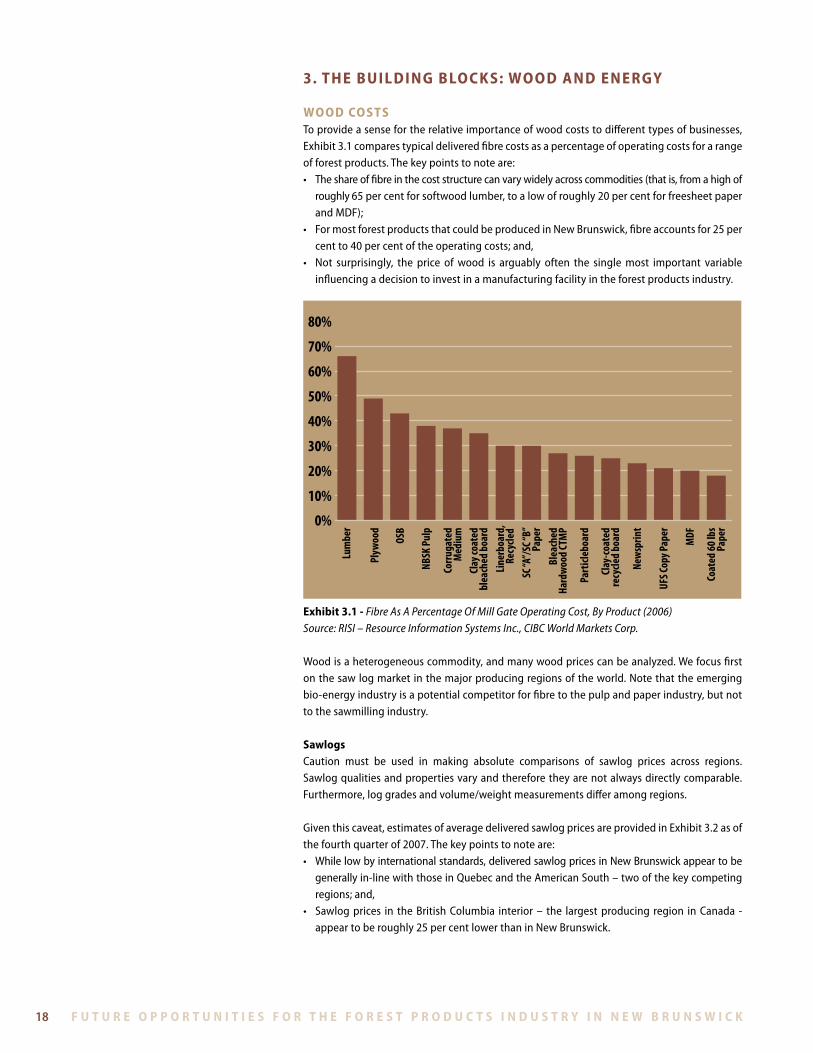
wo o d co s tsTo provide a sense for the relative importance of wood costs to different types of businesses, Exhibit 3 .1 compares typical delivered fibre costs as a percentage of operating costs for a range of forest products . The key points to note are:• Theshareoffibreinthecoststructurecanvarywidelyacrosscommodities(thatis,fromahighof
roughly 65 per cent for softwood lumber, to a low of roughly 20 per cent for freesheet paper and MDF);
• FormostforestproductsthatcouldbeproducedinNewBrunswick,fibreaccountsfor25percent to 40 per cent of the operating costs; and,
• Not surprisingly, the price ofwood is arguably often the singlemost important variableinfluencing a decision to invest in a manufacturing facility in the forest products industry .
0%
10%
20%
30%
40%
50%
60%
70%
80%Lu
mbe
r
Plyw
ood
OSB
NBSK
Pul
p
Corru
gate
dM
ediu
mCl
ay co
ated
blea
ched
boa
rdLin
erbo
ard,
Recy
cled
SC “A
”/SC
“B”
Pape
rBl
each
edHa
rdwo
od CT
MP
Clay
-coat
edre
cycle
d bo
ard
UFS C
opy P
aper
New
sprin
t
MDF
Coat
ed 60
lbs
Pape
r
Part
icleb
oard
exhibit 3.1 - Fibre As A Percentage Of Mill Gate Operating Cost, By Product (2006)Source: RISI – Resource Information Systems Inc., CIBC World Markets Corp.
Wood is a heterogeneous commodity, and many wood prices can be analyzed . We focus first onthesawlogmarketinthemajorproducingregionsoftheworld.Notethattheemergingbio-energy industry is a potential competitor for fibre to the pulp and paper industry, but not to the sawmilling industry .
sawlogsCaution must be used in making absolute comparisons of sawlog prices across regions . Sawlog qualities and properties vary and therefore they are not always directly comparable . Furthermore, log grades and volume/weight measurements differ among regions .
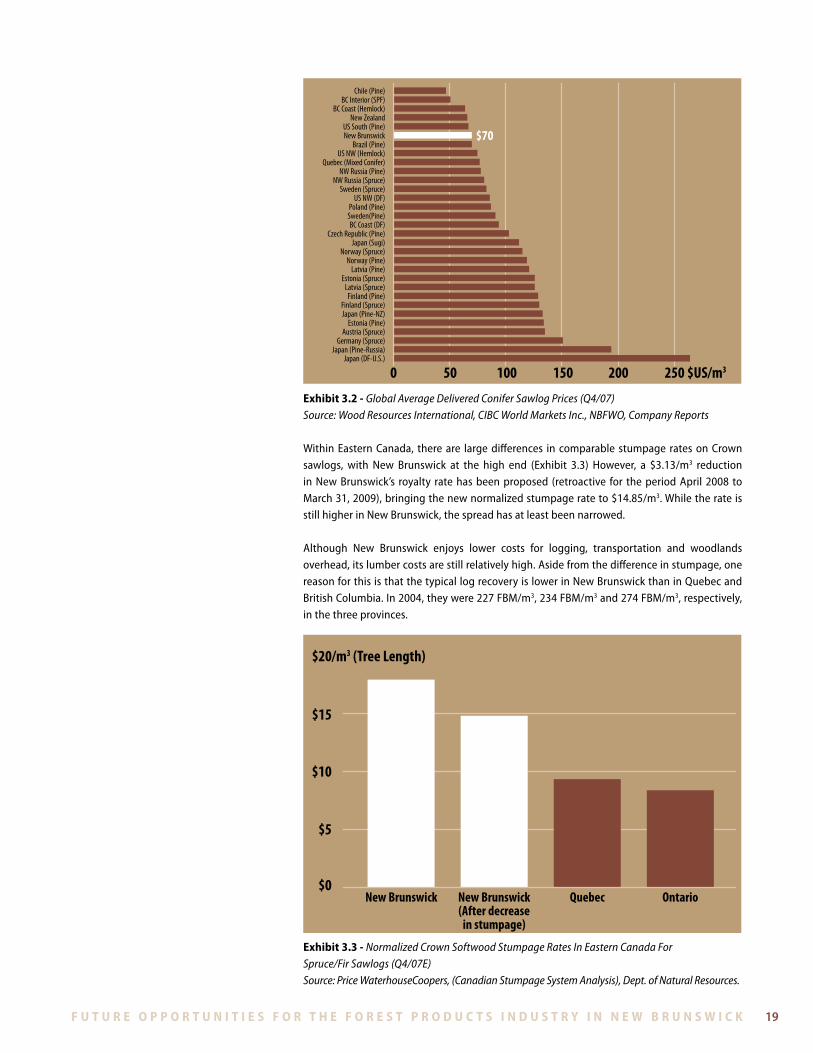
Given this caveat, estimates of average delivered sawlog prices are provided in Exhibit 3 .2 as of the fourth quarter of 2007 . The key points to note are:• Whilelowbyinternationalstandards,deliveredsawlogpricesinNewBrunswickappeartobe
generally in-line with those in Quebec and the American South – two of the key competing regions; and,
• Sawlogprices in theBritishColumbia interior– the largestproducing region inCanada -appear to be roughly 25 per cent lower than in New Brunswick .
f u t u r e o p p o r t u n i t i e s f o r t h e f o r e s t p r o d u c t s i n d u s t r y i n n e w b r u n s w i c k f u t u r e o p p o r t u n i t i e s f o r t h e f o r e s t p r o d u c t s i n d u s t r y i n n e w b r u n s w i c k 19
$70
500 100 150 200 250 $US/m3
Chile (Pine)BC Interior (SPF)
BC Coast (Hemlock)New Zealand
US South (Pine)New Brunswick
Brazil (Pine)US NW (Hemlock)
Quebec (Mixed Conifer)NW Russia (Pine)
NW Russia (Spruce)Sweden (Spruce)
US NW (DF)Poland (Pine)
Sweden(Pine)BC Coast (DF)
Czech Republic (Pine)Japan (Sugi)
Norway (Spruce)Norway (Pine)
Latvia (Pine)Estonia (Spruce)
Latvia (Spruce)Finland (Pine)
Finland (Spruce)Japan (Pine-NZ)
Estonia (Pine)Austria (Spruce)
Germany (Spruce)Japan (Pine-Russia)
Japan (DF-U.S.)
exhibit 3.2 - Global Average Delivered Conifer Sawlog Prices (Q4/07)Source: Wood Resources International, CIBC World Markets Inc., NBFWO, Company Reports
Within Eastern Canada, there are large differences in comparable stumpage rates on Crown sawlogs, with New Brunswick at the high end (Exhibit 3 .3) However, a $3 .13/m3 reduction in New Brunswick’s royalty rate has been proposed (retroactive for the period April 2008 to March 31, 2009), bringing the new normalized stumpage rate to $14 .85/m3 . While the rate is still higher in New Brunswick, the spread has at least been narrowed .
Although New Brunswick enjoys lower costs for logging, transportation and woodlandsoverhead, its lumber costs are still relatively high . Aside from the difference in stumpage, one reason for this is that the typical log recovery is lower in New Brunswick than in Quebec and British Columbia . In 2004, they were 227 FBM/m3, 234 FBM/m3 and 274 FBM/m3, respectively, in the three provinces .
$0
$5
$10
$15
$20/m3 (Tree Length)
New Brunswick New Brunswick(After decrease
in stumpage)
Quebec Ontario
exhibit 3.3 - Normalized Crown Softwood Stumpage Rates In Eastern Canada For Spruce/Fir Sawlogs (Q4/07E)Source: Price WaterhouseCoopers, (Canadian Stumpage System Analysis), Dept. of Natural Resources.
f u t u r e o p p o r t u n i t i e s f o r t h e f o r e s t p r o d u c t s i n d u s t r y i n n e w b r u n s w i c k20 f u t u r e o p p o r t u n i t i e s f o r t h e f o r e s t p r o d u c t s i n d u s t r y i n n e w b r u n s w i c k
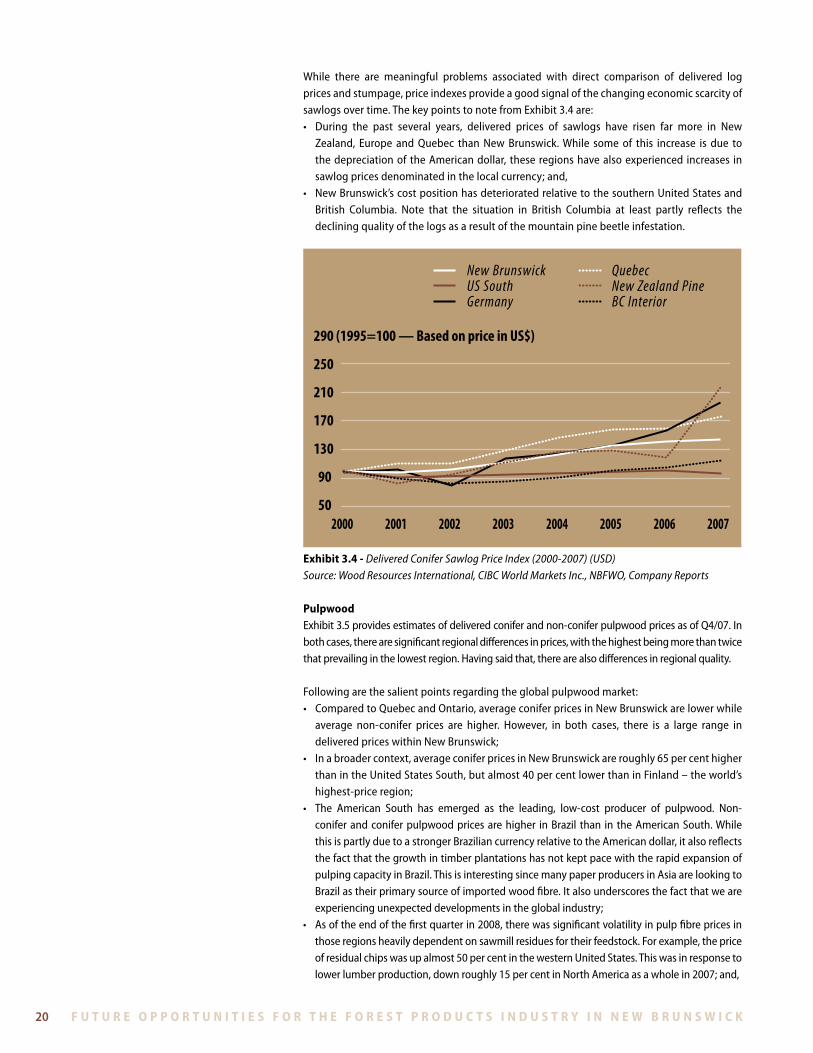
While there are meaningful problems associated with direct comparison of delivered log prices and stumpage, price indexes provide a good signal of the changing economic scarcity of sawlogs over time . The key points to note from Exhibit 3 .4 are:• During the past several years, delivered prices of sawlogs have risen far more in New
Zealand, Europe and Quebec than New Brunswick . While some of this increase is due to the depreciation of the American dollar, these regions have also experienced increases in sawlog prices denominated in the local currency; and,
• NewBrunswick’scostpositionhasdeterioratedrelativetothesouthernUnitedStatesandBritish Columbia . Note that the situation in British Columbia at least partly reflects the declining quality of the logs as a result of the mountain pine beetle infestation .
50
90
130
170
210
250
290 (1995=100 — Based on price in US$)
QuebecNew Zealand PineBC Interior
New BrunswickUS SouthGermany
2000 2001 2002 2003 2004 2005 2006 2007
exhibit 3.4 - Delivered Conifer Sawlog Price Index (2000-2007) (USD)Source: Wood Resources International, CIBC World Markets Inc., NBFWO, Company Reports
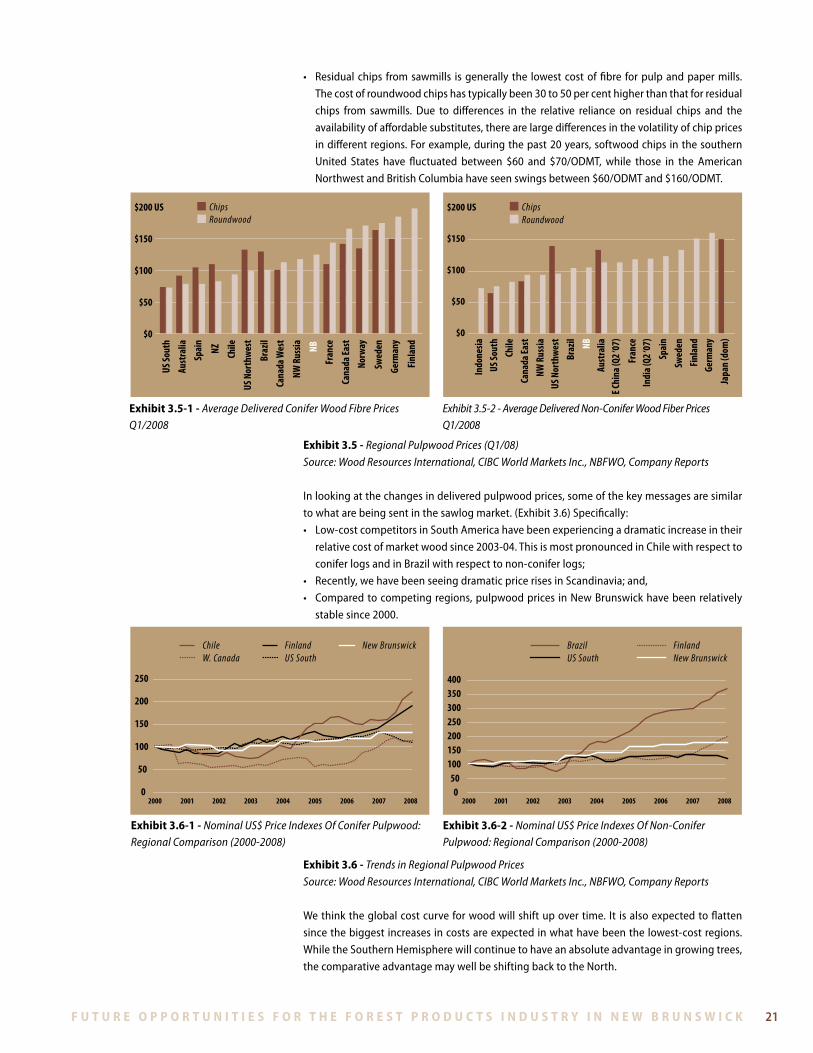
pulpwoodExhibit 3 .5 provides estimates of delivered conifer and non-conifer pulpwood prices as of Q4/07 . In both cases, there are significant regional differences in prices, with the highest being more than twice that prevailing in the lowest region . Having said that, there are also differences in regional quality .
Following are the salient points regarding the global pulpwood market: • ComparedtoQuebecandOntario,averageconiferpricesinNewBrunswickarelowerwhile
average non-conifer prices are higher . However, in both cases, there is a large range in delivered prices within New Brunswick;
• Inabroadercontext,averageconiferpricesinNewBrunswickareroughly65percenthigherthan in the United States South, but almost 40 per cent lower than in Finland – the world’s highest-price region;
• The American South has emerged as the leading, low-cost producer of pulpwood. Non-conifer and conifer pulpwood prices are higher in Brazil than in the American South . While this is partly due to a stronger Brazilian currency relative to the American dollar, it also reflects the fact that the growth in timber plantations has not kept pace with the rapid expansion of pulping capacity in Brazil . This is interesting since many paper producers in Asia are looking to Brazil as their primary source of imported wood fibre . It also underscores the fact that we are experiencing unexpected developments in the global industry;
• Asoftheendofthefirstquarterin2008,therewassignificantvolatilityinpulpfibrepricesinthose regions heavily dependent on sawmill residues for their feedstock . For example, the price of residual chips was up almost 50 per cent in the western United States . This was in response to lower lumber production, down roughly 15 per cent in North America as a whole in 2007; and,
f u t u r e o p p o r t u n i t i e s f o r t h e f o r e s t p r o d u c t s i n d u s t r y i n n e w b r u n s w i c k f u t u r e o p p o r t u n i t i e s f o r t h e f o r e s t p r o d u c t s i n d u s t r y i n n e w b r u n s w i c k 21
• Residualchips fromsawmills isgenerally the lowestcostoffibre forpulpandpapermills.
The cost of roundwood chips has typically been 30 to 50 per cent higher than that for residual
chips from sawmills . Due to differences in the relative reliance on residual chips and the
availability of affordable substitutes, there are large differences in the volatility of chip prices
in different regions . For example, during the past 20 years, softwood chips in the southern
United States have fluctuated between $60 and $70/ODMT, while those in the American
Northwest and British Columbia have seen swings between $60/ODMT and $160/ODMT .
exhibit 3.5 - Regional Pulpwood Prices (Q1/08)
Source: Wood Resources International, CIBC World Markets Inc., NBFWO, Company Reports
In looking at the changes in delivered pulpwood prices, some of the key messages are similar
to what are being sent in the sawlog market . (Exhibit 3 .6) Specifically:
• Low-costcompetitorsinSouthAmericahavebeenexperiencingadramaticincreaseintheir
relative cost of market wood since 2003-04 . This is most pronounced in Chile with respect to
conifer logs and in Brazil with respect to non-conifer logs;
• Recently,wehavebeenseeingdramaticpricerisesinScandinavia;and,
• Comparedtocompetingregions,pulpwoodprices inNewBrunswickhavebeenrelatively
stable since 2000 .
exhibit 3.6 - Trends in Regional Pulpwood Prices
Source: Wood Resources International, CIBC World Markets Inc., NBFWO, Company Reports
We think the global cost curve for wood will shift up over time . It is also expected to flatten
since the biggest increases in costs are expected in what have been the lowest-cost regions .
While the Southern Hemisphere will continue to have an absolute advantage in growing trees,
the comparative advantage may well be shifting back to the North .
ChipsRoundwood
US So
uth
Aust
ralia
Spai
n
NZ Chile
US N
orth
west
Braz
ilCa
nada
Wes
t
NW R
ussia NB
Fran
ce
Cana
da Ea
stNo
rway
Swed
en
Germ
any
Finl
and
$0
$50
$100
$150
$200 US ChipsRoundwood
Indo
nesia
US So
uth
Chile
Cana
da Ea
stNW
Rus
siaUS
Nor
thwe
stBr
azil NB
Aust
ralia
E Chi
na (Q
2 ‘07
)
Fran
ceIn
dia (
Q2 ‘0
7)
Spai
nSw
eden
Finl
and
Germ
any
Japa
n (d
om)$0
$50
$100
$150
$200 US
exhibit 3.5-1 - Average Delivered Conifer Wood Fibre Prices Q1/2008
Exhibit 3.5-2 - Average Delivered Non-Conifer Wood Fiber Prices Q1/2008
0
50
100
150
200
250
2000 2001 2002 2003 2004 2005 2006 2007 2008
Chile W. Canada Finland U.S. South New Brunswick
0
50
100
150
200
250
ChileW. Canada
FinlandUS South
New Brunswick
2000 2001 2002 2003 2004 2005 2006 2007 20080
50100150200250300350400
BrazilUS South
FinlandNew Brunswick
2000 2001 2002 2003 2004 2005 2006 2007 2008
exhibit 3.6-1 - Nominal US$ Price Indexes Of Conifer Pulpwood: Regional Comparison (2000-2008)
exhibit 3.6-2 - Nominal US$ Price Indexes Of Non-Conifer Pulpwood: Regional Comparison (2000-2008)
f u t u r e o p p o r t u n i t i e s f o r t h e f o r e s t p r o d u c t s i n d u s t r y i n n e w b r u n s w i c k22 f u t u r e o p p o r t u n i t i e s f o r t h e f o r e s t p r o d u c t s i n d u s t r y i n n e w b r u n s w i c k
e n e r g y co s tsEnergy is a significant cost component for several key products within the New Brunswick forest industry’s product mix – and recent rapid rises in a range of energy costs (that is, vehicle fuel and purchased electricity) have been of concern to all sub-sectors .
In several parts of the forest industry, energy costs account for more than 30 per cent of total manufacturing and delivery costs . Many producers have been experiencing very difficult market and competitive conditions, and they do not have any scope to pass along these costs to their customers .
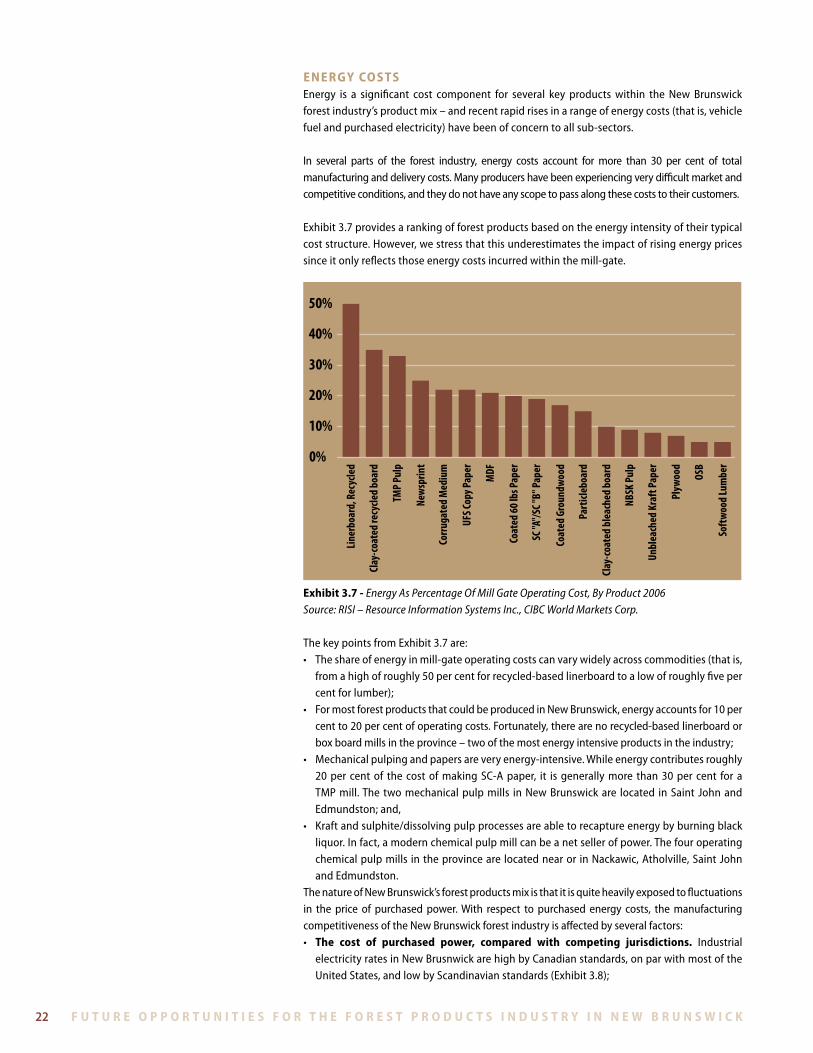
Exhibit 3 .7 provides a ranking of forest products based on the energy intensity of their typical cost structure . However, we stress that this underestimates the impact of rising energy prices since it only reflects those energy costs incurred within the mill-gate .
Liner
boar
d, R
ecyc
led
Clay
-coat
ed re
cycle
d bo
ard
TMP
Pulp
New
sprin
t
Corru
gate
d M
ediu
m
UFS C
opy P
aper
MDF
Coat
ed 60
lbs P
aper
SC "A
"/SC
"B" P
aper
Coat
ed G
roun
dwoo
d
Part
icleb
oard
Clay
-coat
ed b
leac
hed
boar
d
NBSK
Pul
p
Unbl
each
ed K
raft
Pape
r
Plyw
ood
OSB
Soft
wood
Lum
ber0%
10%
20%
30%
50%
40%
exhibit 3.7 - Energy As Percentage Of Mill Gate Operating Cost, By Product 2006Source: RISI – Resource Information Systems Inc., CIBC World Markets Corp.
The key points from Exhibit 3 .7 are:• Theshareofenergyinmill-gateoperatingcostscanvarywidelyacrosscommodities(thatis,
from a high of roughly 50 per cent for recycled-based linerboard to a low of roughly five per cent for lumber);
• FormostforestproductsthatcouldbeproducedinNewBrunswick,energyaccountsfor10percent to 20 per cent of operating costs . Fortunately, there are no recycled-based linerboard or box board mills in the province – two of the most energy intensive products in the industry;
• Mechanicalpulpingandpapersareveryenergy-intensive.Whileenergycontributesroughly20 per cent of the cost of making SC-A paper, it is generally more than 30 per cent for a TMP mill . The two mechanical pulp mills in New Brunswick are located in Saint John and Edmundston; and,
• Kraftandsulphite/dissolvingpulpprocessesareabletorecaptureenergybyburningblackliquor . In fact, a modern chemical pulp mill can be a net seller of power . The four operating chemical pulp mills in the province are located near or in Nackawic, Atholville, Saint John and Edmundston .
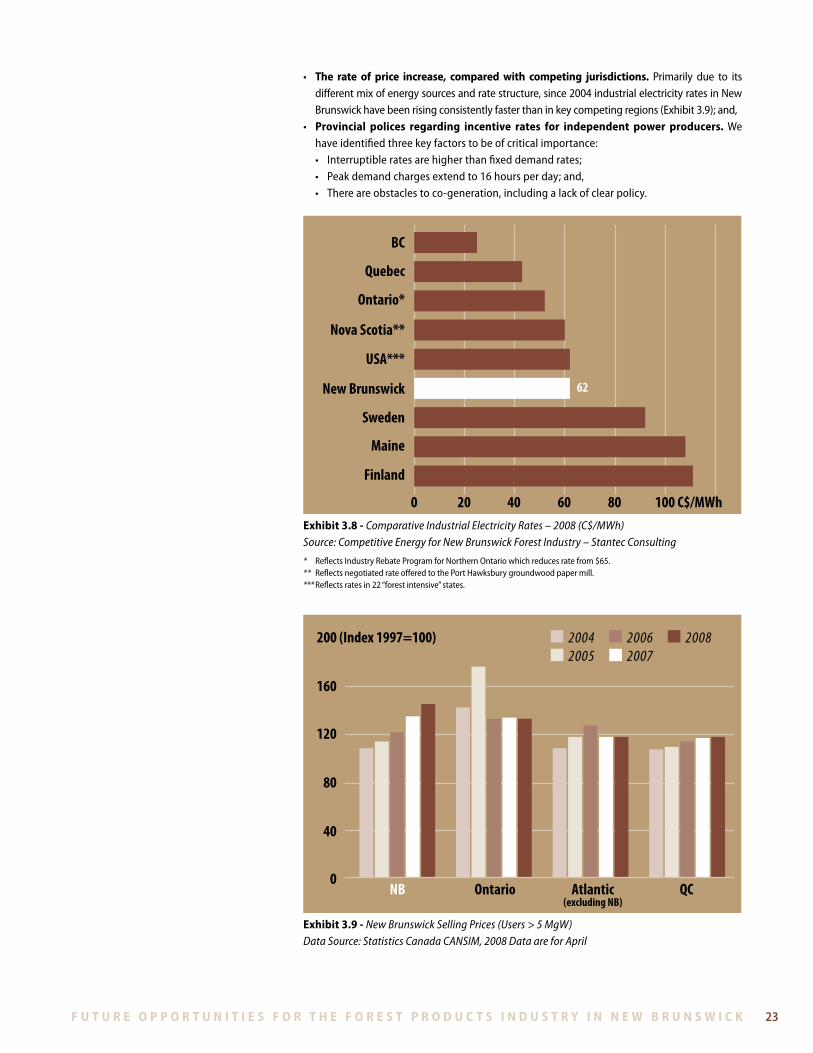
The nature of New Brunswick’s forest products mix is that it is quite heavily exposed to fluctuations in the price of purchased power . With respect to purchased energy costs, the manufacturing competitiveness of the New Brunswick forest industry is affected by several factors:• the cost of purchased power, compared with competing jurisdictions. Industrial
electricity rates in New Brusnwick are high by Canadian standards, on par with most of the United States, and low by Scandinavian standards (Exhibit 3 .8);
f u t u r e o p p o r t u n i t i e s f o r t h e f o r e s t p r o d u c t s i n d u s t r y i n n e w b r u n s w i c k f u t u r e o p p o r t u n i t i e s f o r t h e f o r e s t p r o d u c t s i n d u s t r y i n n e w b r u n s w i c k 23
• the rate of price increase, compared with competing jurisdictions. Primarily due to its different mix of energy sources and rate structure, since 2004 industrial electricity rates in New Brunswick have been rising consistently faster than in key competing regions (Exhibit 3 .9); and,
• provincial polices regarding incentive rates for independent power producers. We have identified three key factors to be of critical importance:• Interruptibleratesarehigherthanfixeddemandrates;• Peakdemandchargesextendto16hoursperday;and,• Thereareobstaclestoco-generation,includingalackofclearpolicy.
62
200 40 60 80 100 C$/MWh
BC
Quebec
Ontario*
Nova Scotia**
USA***
New Brunswick
Sweden
Maine
Finland
exhibit 3.8 - Comparative Industrial Electricity Rates – 2008 (C$/MWh)Source: Competitive Energy for New Brunswick Forest Industry – Stantec Consulting
* Reflects Industry Rebate Program for Northern Ontario which reduces rate from $65 .** Reflects negotiated rate offered to the Port Hawksbury groundwood paper mill . *** Reflects rates in 22 “forest intensive” states .
0
40
80
120
160
200 (Index 1997=100) 2004 2005
2006 2007
2008
NB Ontario Atlantic(excluding NB)
QC
exhibit 3.9 - New Brunswick Selling Prices (Users > 5 MgW)Data Source: Statistics Canada CANSIM, 2008 Data are for April
f u t u r e o p p o r t u n i t i e s f o r t h e f o r e s t p r o d u c t s i n d u s t r y i n n e w b r u n s w i c k24 f u t u r e o p p o r t u n i t i e s f o r t h e f o r e s t p r o d u c t s i n d u s t r y i n n e w b r u n s w i c k
4. co n c lu s i o n s a n d o u t lo o k
a r e f o r e s t p r o d u c ts a s u n s e t i n d u s t ry i n n e w b ru n s w i c k?We conclude that forest products need not be a sunset industry in New Brunswick .
However, a turnaround will not happen by itself . With the right set of changes, a robust and profitable forest industry could emerge . Without appropriate action, the recent serious loss of critical mass could result in a vicious cycle of further disinvestment .
In Section 5, we identify some of the actions which we think are necessary to ensure forest products are a sunrise as opposed to sunset industry in New Brunswick .
Some of the key ingredients for forest products transforming into a sunrise industry are in place:(i) In general, growing markets for the industry’s key products;(ii) The potential development of a new set of opportunities in the bio-energy and
bio-chemical segments; and,(iii) That the perfect storm has already hit the New Brunswick forest industry is now affecting
otherjurisdictions.
The first two points are discussed in Section 2 . With regard to the third point, key competitors in Europe, South America and Asia are being faced with:• Risingwoodcosts;• Highenergyprices;• Appreciatingcurrencies;• Expensiveregulations;and,• Increasinglyscarcelabour.
The affect of the traveling perfect storm is two-fold:• Duetorisingcosts,weareseeingareductionintherateofcapacityexpansioninthelow-
cost regions of the world and absolute declines in capacity in the higher cost regions . Both of these changes serve to reduce the future global supply of forest products, and thus exert upward pressure on output prices in the industry; and,
• TherelativecompetitivenessofNewBrunswick’sforestindustryisimproving;thusitsabilityto grow profitably in traditional and emerging product markets is enhanced .
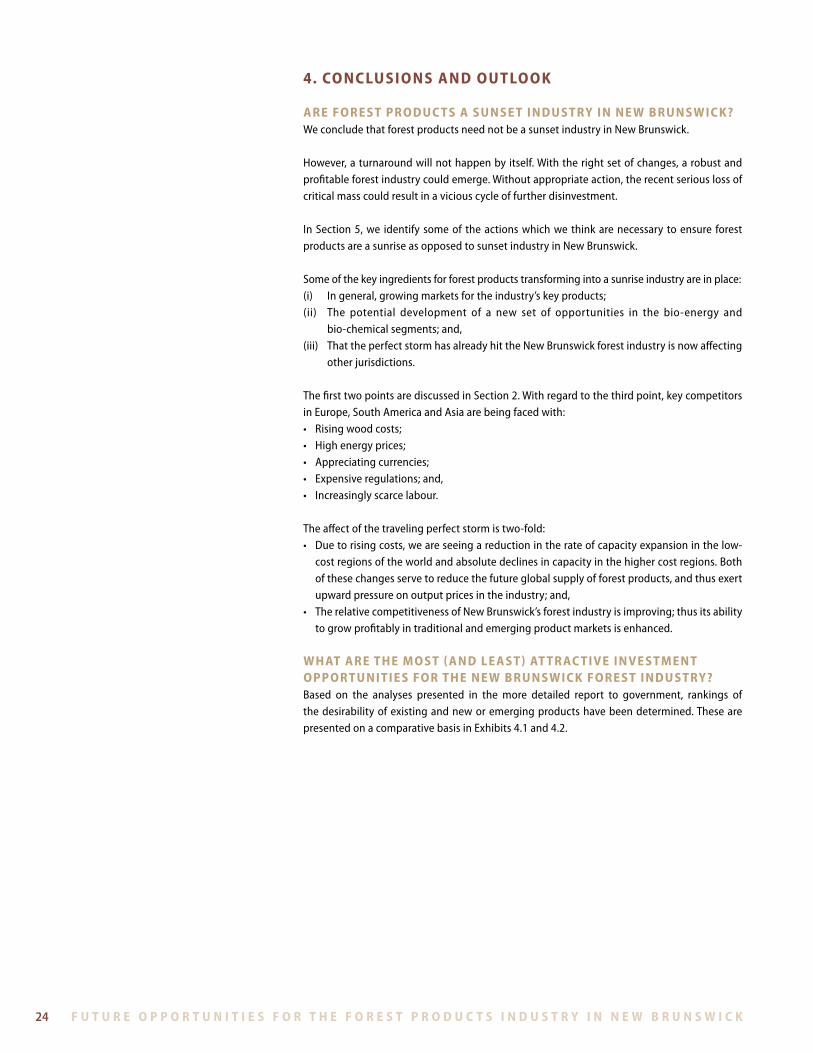
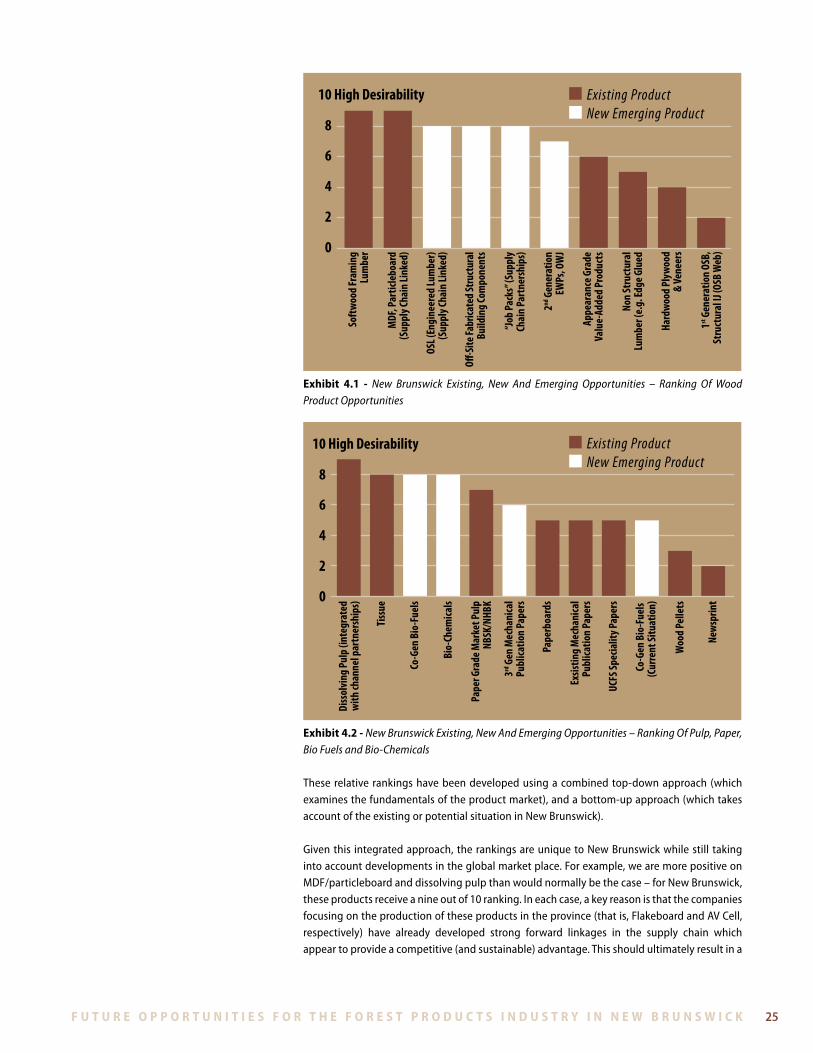
w h at a r e t h e M o s t ( a n d l e a s t ) at t r ac t i V e i n V e s t M e n t o p p o r t u n i t i e s f o r t h e n e w b ru n s w i c k f o r e s t i n d u s t ry?Based on the analyses presented in the more detailed report to government, rankings of the desirability of existing and new or emerging products have been determined . These are presented on a comparative basis in Exhibits 4 .1 and 4 .2 .
f u t u r e o p p o r t u n i t i e s f o r t h e f o r e s t p r o d u c t s i n d u s t r y i n n e w b r u n s w i c k f u t u r e o p p o r t u n i t i e s f o r t h e f o r e s t p r o d u c t s i n d u s t r y i n n e w b r u n s w i c k 25
Existing Product New Emerging Product
Soft
wood
Fram
ing
Lum
ber
MDF
, Par
ticle
boar
d(S
uppl
y Cha
in Li
nked
)
OSL (
Engi
neer
ed Lu
mbe
r)(S
uppl
y Cha
in Li
nked
)
O�-S
ite Fa
brica
ted S
truct
ural
Build
ing
Com
pone
nts
“Job
Pack
s” (S
uppl
yCh
ain
Part
ners
hips
)
2nd G
ener
atio
nEW
Ps, O
WJ
Appe
aran
ce G
rade
Valu
e-Ad
ded
Prod
ucts
Non
Stru
ctur
alLu
mbe
r (e.
g. Ed
ge G
lued
Hard
wood
Ply
wood
& Ve
neer
s
1st G
ener
atio
n OS
B,St
ruct
ural
IJ (O
SB W
eb)0
2
4
6
8
10 High Desirability
exhibit 4.1 - New Brunswick Existing, New And Emerging Opportunities – Ranking Of Wood Product Opportunities
Existing Product New Emerging Product
Diss
olvi
ng P
ulp
(inte
grat
edw
ith ch
anne
l par
tner
ship
s)
Tiss
ue
Co-G
en B
io-F
uels
Bio-
Chem
icals
3rd G
en M
echa
nica
lPu
blica
tion
Pape
rs
Pape
r Gra
de M
arke
t Pul
pNB
SK/N
HBK
Pape
rboa
rds
Exsis
ting
Mec
hani
cal
Publ
icatio
n Pa
pers
UCFS
Spec
ialit
y Pap
ers
Co-G
en B
io-F
uels
(Cur
rent
Situ
atio
n)
Woo
d Pe
llets
New
sprin
t0
2
4
6
8
10 High Desirability
exhibit 4.2 - New Brunswick Existing, New And Emerging Opportunities – Ranking Of Pulp, Paper, Bio Fuels and Bio-Chemicals
These relative rankings have been developed using a combined top-down approach (which examines the fundamentals of the product market), and a bottom-up approach (which takes account of the existing or potential situation in New Brunswick) .
Given this integrated approach, the rankings are unique to New Brunswick while still taking into account developments in the global market place . For example, we are more positive on MDF/particleboard and dissolving pulp than would normally be the case – for New Brunswick, these products receive a nine out of 10 ranking . In each case, a key reason is that the companies focusing on the production of these products in the province (that is, Flakeboard and AV Cell, respectively) have already developed strong forward linkages in the supply chain which appear to provide a competitive (and sustainable) advantage . This should ultimately result in a
f u t u r e o p p o r t u n i t i e s f o r t h e f o r e s t p r o d u c t s i n d u s t r y i n n e w b r u n s w i c k26 f u t u r e o p p o r t u n i t i e s f o r t h e f o r e s t p r o d u c t s i n d u s t r y i n n e w b r u n s w i c k
superior return on capital . Due to the specific strategies and partnerships in place, these New Brunswick-basedcompaniesalsohavetheopportunitytoproducejointproducts(thatis,bio-chemicals in the case of AV Cell) which have an attractive future .
From a commercial perspective, the order of preferred industry segments should simply reflect the expected return on capital employed they will generate during a normal business cycle . However, given the expected financial returns are highly sensitive to the specific business plan being implemented, it is difficult to develop meaningful ROCE forecasts at an aggregate level .
One of the key themes of this report is that timber – whether publicly or privately owned – is an increasingly scarce resource . If timber is indeed scarce, then, from a private sector perspective, the objectiveshouldbetomaximizethediscountedcashflowthatcanbegeneratedfromagivenm3 of wood .
From a public sector perspective, the objective is likely more complex. Forexample, when deciding to allocate Crown timber it is logical to also compare the relative contribution to GNP and/or employment when a given m3 of wood is allocated to different uses .
One of the most important conclusions arising from the analysis is that New Brunswick’s softwood lumber industry is a cornerstone of the forest economy – and should continue to be so . On the overall combined scale, softwood framing lumber – and a recommended increased focus on premium lumber grades (notably eastern SPF wane-free grade), rate nine out of 10 points .
By 2010, the American housing industry is likely to renew growth in demand for structural building components . These include a wide range of off-site fabricated products, including single and double wall panels; floor sections; engineered lumber and other components . These are significant opportunities for the New Brunswick industry .
Provided that a financially viable base is re-established for the province’s softwood lumber industry, it is expected that the industry, possibly along with new players bringing in new investment capital, will act on these opportunities – with increased profit margins in the process . However, framing grade lumber will remain as an important product .
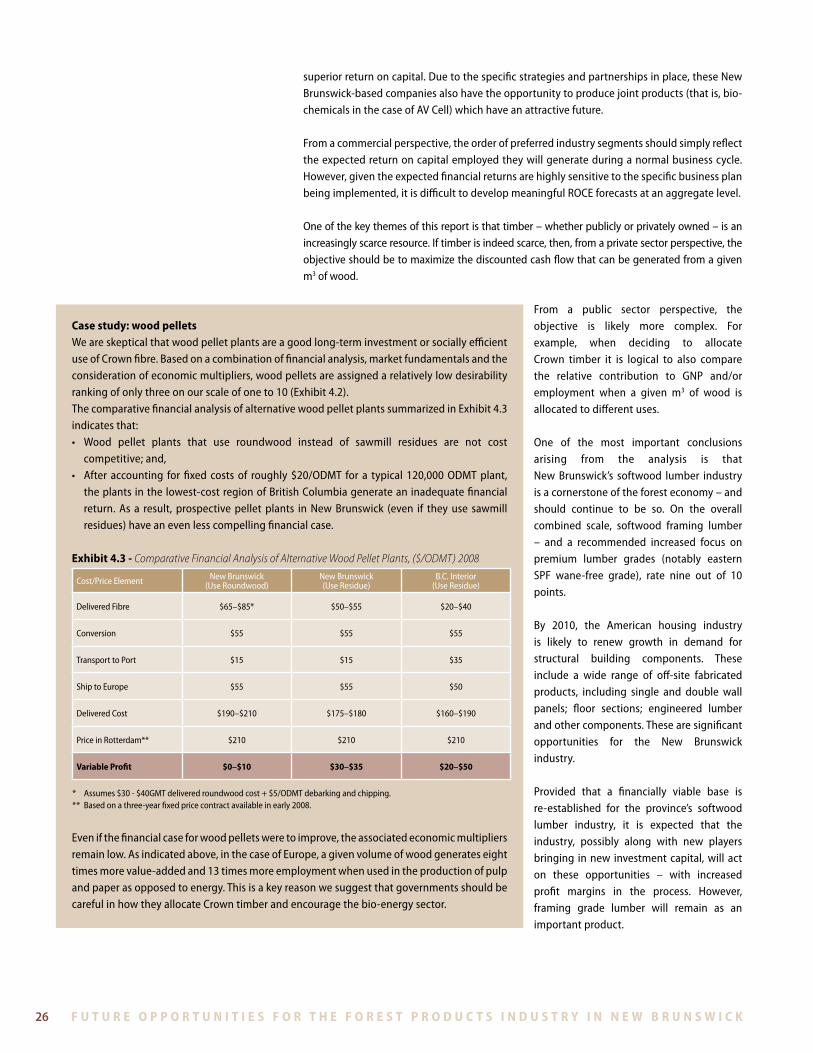
case study: wood pelletsWe are skeptical that wood pellet plants are a good long-term investment or socially efficient use of Crown fibre . Based on a combination of financial analysis, market fundamentals and the consideration of economic multipliers, wood pellets are assigned a relatively low desirability ranking of only three on our scale of one to 10 (Exhibit 4 .2) . The comparative financial analysis of alternative wood pellet plants summarized in Exhibit 4 .3 indicates that:• Wood pellet plants that use roundwood instead of sawmill residues are not cost
competitive; and,• After accounting forfixed costsof roughly$20/ODMT for a typical 120,000ODMTplant,
the plants in the lowest-cost region of British Columbia generate an inadequate financial return . As a result, prospective pellet plants in New Brunswick (even if they use sawmill residues) have an even less compelling financial case .
exhibit 4.3 - Comparative Financial Analysis of Alternative Wood Pellet Plants, ($/ODMT) 2008
Cost/Price Element New Brunswick(Use Roundwood)
New Brunswick(Use Residue)
B .C . Interior(Use Residue)
Delivered Fibre $65–$85* $50–$55 $20–$40
Conversion $55 $55 $55
Transport to Port $15 $15 $35
Ship to Europe $55 $55 $50
Delivered Cost $190–$210 $175–$180 $160–$190
Price in Rotterdam** $210 $210 $210
Variable profit $0–$10 $30–$35 $20–$50
* Assumes $30 - $40GMT delivered roundwood cost + $5/ODMT debarking and chipping .** Based on a three-year fixed price contract available in early 2008 .
Even if the financial case for wood pellets were to improve, the associated economic multipliers remain low . As indicated above, in the case of Europe, a given volume of wood generates eight times more value-added and 13 times more employment when used in the production of pulp and paper as opposed to energy . This is a key reason we suggest that governments should be careful in how they allocate Crown timber and encourage the bio-energy sector .
f u t u r e o p p o r t u n i t i e s f o r t h e f o r e s t p r o d u c t s i n d u s t r y i n n e w b r u n s w i c k f u t u r e o p p o r t u n i t i e s f o r t h e f o r e s t p r o d u c t s i n d u s t r y i n n e w b r u n s w i c k 27
Companies will have to make decisions with regard to commercial issues, including the precise productmarketmix inwhich they judgetheycanbemostcompetitive–andthe timingofentry into these new businesses . Moreover, much will depend on Crown timber policy decisions made in the interim and other economic development initiatives .
Given the policy uncertainty, it is difficult to rank the attractiveness of bio-mass based co-generation and bio-fuels in general . Under the status quo, we would assign a relatively low rank of five out of 10 points . The key reason is that economic returns are not sufficiently attractive in light of the relative prices of delivered biomass and green energy .
However, due largely to developments outside of New Brunswick, it is unlikely that the status quo will be maintained . As a result, we think a rank of eight points is more appropriate going forward . It is increasingly evident that forest and energy policy cannot be divorced from carbon policy . Asisalreadythecaseinotherjurisdictions,itisexpectedthatapricepremiumwillbepaidforthe production of green energy in the province .
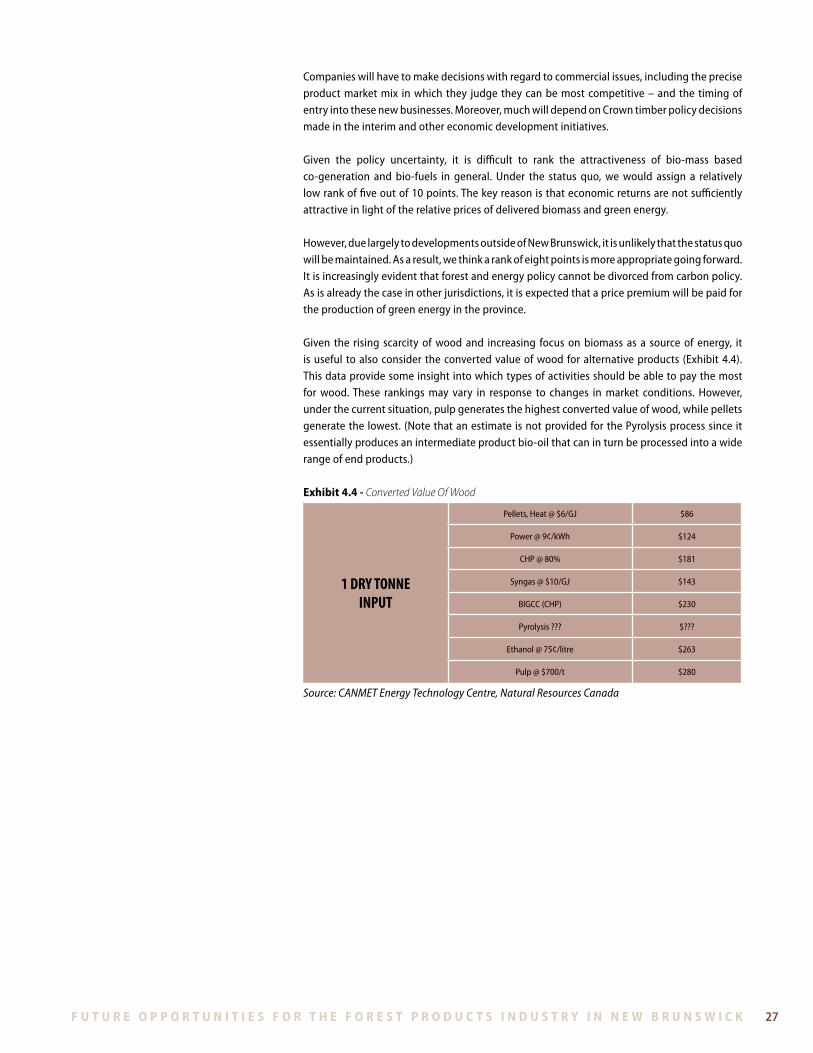
Given the rising scarcity of wood and increasing focus on biomass as a source of energy, it is useful to also consider the converted value of wood for alternative products (Exhibit 4 .4) . This data provide some insight into which types of activities should be able to pay the most for wood . These rankings may vary in response to changes in market conditions . However, under the current situation, pulp generates the highest converted value of wood, while pellets generate the lowest . (Note that an estimate is not provided for the Pyrolysis process since it essentially produces an intermediate product bio-oil that can in turn be processed into a wide range of end products .)
exhibit 4.4 - Converted Value Of Wood
1 DRY TONNEINPUT
Pellets, Heat @ $6/GJ $86
Power @ 9¢/kWh $124
CHP @ 80% $181
Syngas @ $10/GJ $143
BIGCC (CHP) $230
Pyrolysis ??? $???
Ethanol @ 75¢/litre $263
Pulp @ $700/t $280
Source: CANMET Energy Technology Centre, Natural Resources Canada
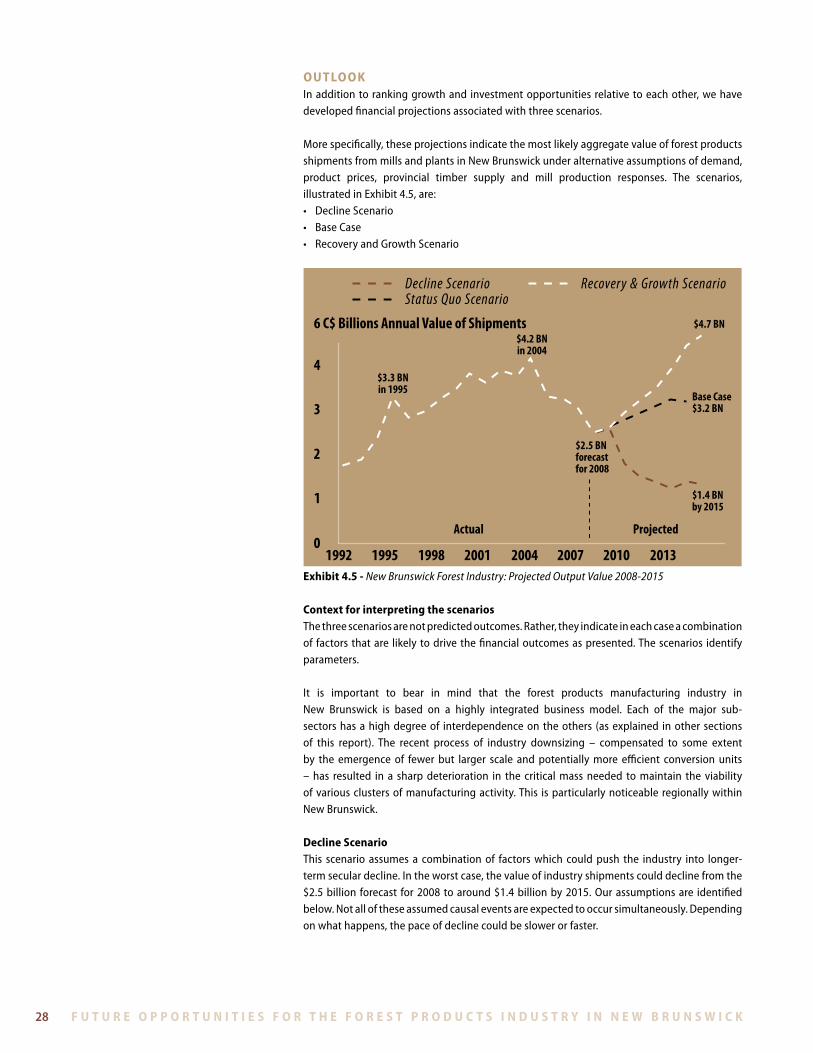
f u t u r e o p p o r t u n i t i e s f o r t h e f o r e s t p r o d u c t s i n d u s t r y i n n e w b r u n s w i c k28 f u t u r e o p p o r t u n i t i e s f o r t h e f o r e s t p r o d u c t s i n d u s t r y i n n e w b r u n s w i c k
o u t lo o kIn addition to ranking growth and investment opportunities relative to each other, we have developedfinancialprojectionsassociatedwiththreescenarios.
Morespecifically,theseprojectionsindicatethemostlikelyaggregatevalueofforestproductsshipments from mills and plants in New Brunswick under alternative assumptions of demand, product prices, provincial timber supply and mill production responses . The scenarios, illustrated in Exhibit 4 .5, are:• DeclineScenario• BaseCase• RecoveryandGrowthScenario
0
1
2
3
4
6 C$ Billions Annual Value of Shipments
1992 1995 1998 2001 2004 2007 2010 2013
Actual Projected
$3.3 BNin 1995
$4.2 BNin 2004
$2.5 BNforecastfor 2008
Base Case$3.2 BN
$1.4 BNby 2015
$4.7 BN
Decline Scenario Recovery & Growth ScenarioStatus Quo Scenario
exhibit 4.5 - New Brunswick Forest Industry: Projected Output Value 2008-2015
context for interpreting the scenarios The three scenarios are not predicted outcomes . Rather, they indicate in each case a combination of factors that are likely to drive the financial outcomes as presented . The scenarios identify parameters .
It is important to bear in mind that the forest products manufacturing industry in New Brunswick is based on a highly integrated business model. Each of the major sub-sectors has a high degree of interdependence on the others (as explained in other sections of this report) . The recent process of industry downsizing – compensated to some extent by the emergence of fewer but larger scale and potentially more efficient conversion units – has resulted in a sharp deterioration in the critical mass needed to maintain the viability of various clusters of manufacturing activity . This is particularly noticeable regionally within New Brunswick .
decline scenarioThis scenario assumes a combination of factors which could push the industry into longer-term secular decline . In the worst case, the value of industry shipments could decline from the $2 .5 billion forecast for 2008 to around $1 .4 billion by 2015 . Our assumptions are identified below . Not all of these assumed causal events are expected to occur simultaneously . Depending on what happens, the pace of decline could be slower or faster .
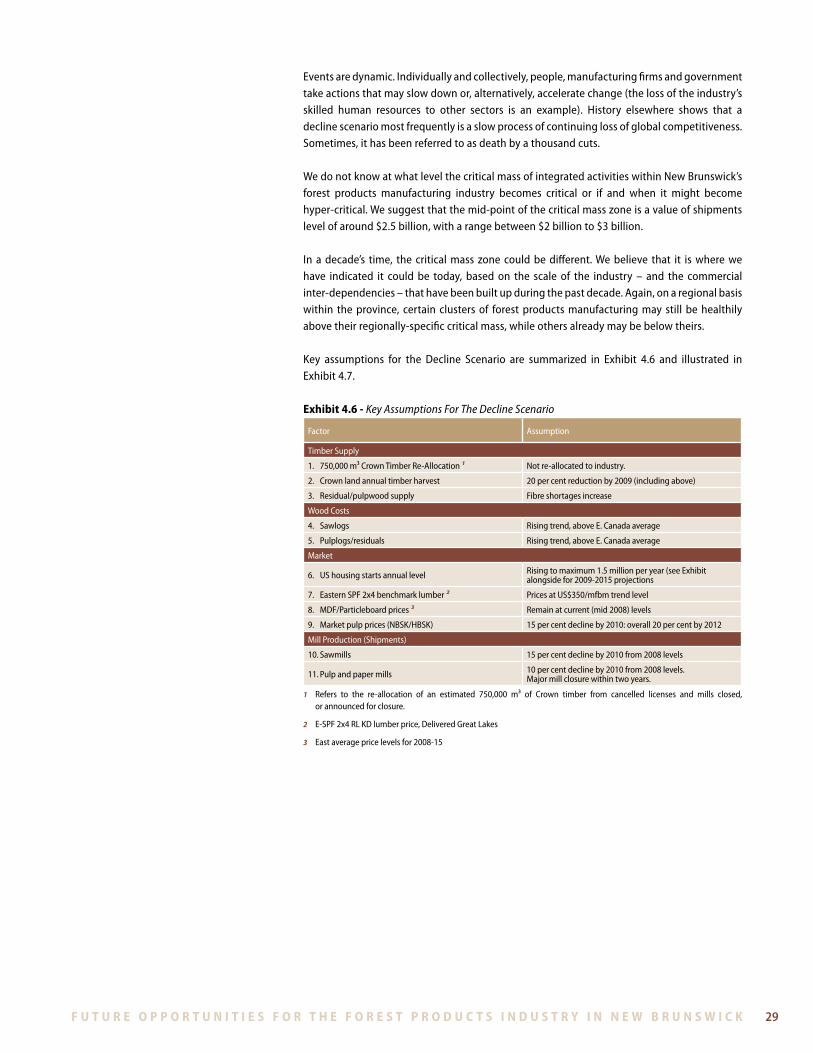
f u t u r e o p p o r t u n i t i e s f o r t h e f o r e s t p r o d u c t s i n d u s t r y i n n e w b r u n s w i c k f u t u r e o p p o r t u n i t i e s f o r t h e f o r e s t p r o d u c t s i n d u s t r y i n n e w b r u n s w i c k 29
Events are dynamic . Individually and collectively, people, manufacturing firms and government take actions that may slow down or, alternatively, accelerate change (the loss of the industry’s skilled human resources to other sectors is an example) . History elsewhere shows that a decline scenario most frequently is a slow process of continuing loss of global competitiveness . Sometimes, it has been referred to as death by a thousand cuts .
We do not know at what level the critical mass of integrated activities within New Brunswick’s forest products manufacturing industry becomes critical or if and when it might become hyper-critical . We suggest that the mid-point of the critical mass zone is a value of shipments level of around $2 .5 billion, with a range between $2 billion to $3 billion .
In a decade’s time, the critical mass zone could be different . We believe that it is where we have indicated it could be today, based on the scale of the industry – and the commercial inter-dependencies – that have been built up during the past decade . Again, on a regional basis within the province, certain clusters of forest products manufacturing may still be healthily above their regionally-specific critical mass, while others already may be below theirs .
Key assumptions for the Decline Scenario are summarized in Exhibit 4 .6 and illustrated in Exhibit 4 .7 .
exhibit 4.6 - Key Assumptions For The Decline Scenario
Factor Assumption
Timber Supply
1 . 750,000 m3 Crown Timber Re-Allocation 1 Not re-allocated to industry .
2 . Crown land annual timber harvest 20 per cent reduction by 2009 (including above)
3 . Residual/pulpwood supply Fibre shortages increase
Wood Costs
4 . Sawlogs Rising trend, above E . Canada average
5 . Pulplogs/residuals Rising trend, above E . Canada average
Market
6 . US housing starts annual level Rising to maximum 1 .5 million per year (see Exhibit alongsidefor2009-2015projections
7 . Eastern SPF 2x4 benchmark lumber 2 Prices at US$350/mfbm trend level
8 . MDF/Particleboard prices 3 Remain at current (mid 2008) levels
9 . Market pulp prices (NBSK/HBSK) 15 per cent decline by 2010: overall 20 per cent by 2012
Mill Production (Shipments)
10 . Sawmills 15 per cent decline by 2010 from 2008 levels
11 . Pulp and paper mills 10 per cent decline by 2010 from 2008 levels . Majormillclosurewithintwoyears.
1 Refers to the re-allocation of an estimated 750,000 m3 of Crown timber from cancelled licenses and mills closed, or announced for closure .
2 E-SPF 2x4 RL KD lumber price, Delivered Great Lakes
3 East average price levels for 2008-15
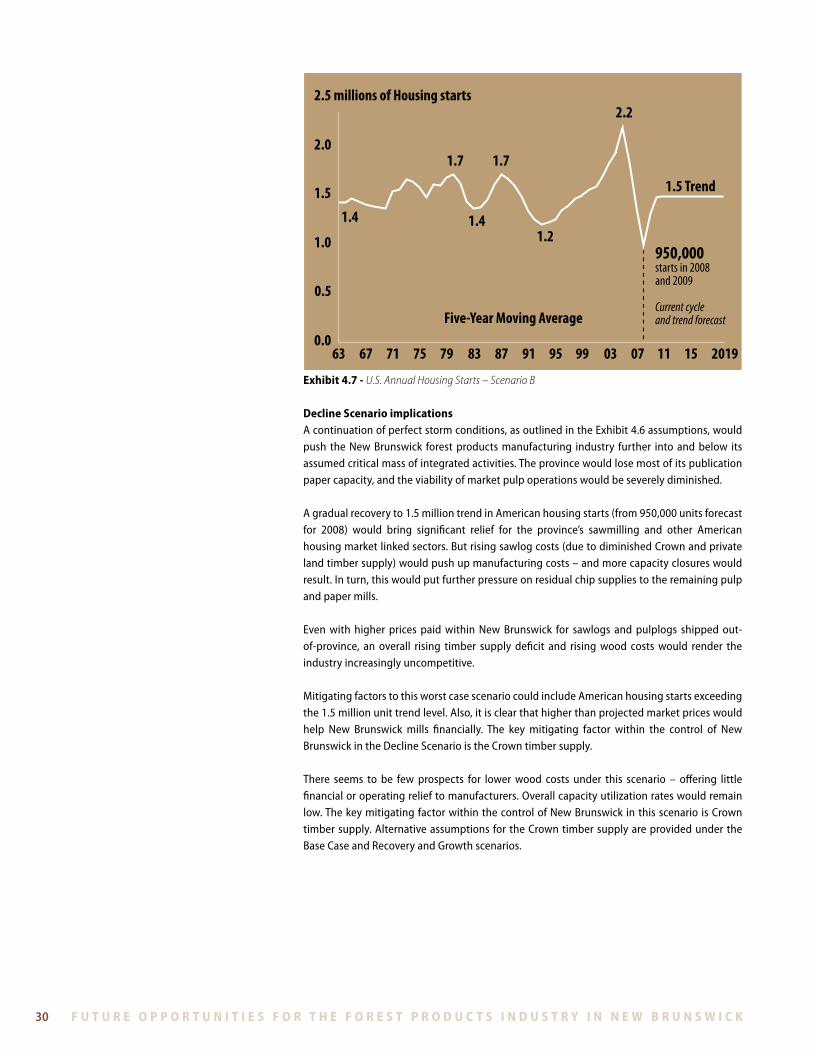
f u t u r e o p p o r t u n i t i e s f o r t h e f o r e s t p r o d u c t s i n d u s t r y i n n e w b r u n s w i c k30 f u t u r e o p p o r t u n i t i e s f o r t h e f o r e s t p r o d u c t s i n d u s t r y i n n e w b r u n s w i c k
0.0
0.5
1.0
1.5
2.0
2.5 millions of Housing starts
63 67 71 75 79 83 87 91 95 99 03 07 11 15 2019
1.4
1.7 1.7
1.41.2
2.2
Five-Year Moving Average
1.5 Trend
950,000starts in 2008and 2009
Current cycleand trend forecast
exhibit 4.7 - U.S. Annual Housing Starts – Scenario B
decline scenario implicationsA continuation of perfect storm conditions, as outlined in the Exhibit 4 .6 assumptions, would push the New Brunswick forest products manufacturing industry further into and below its assumed critical mass of integrated activities . The province would lose most of its publication paper capacity, and the viability of market pulp operations would be severely diminished .
A gradual recovery to 1 .5 million trend in American housing starts (from 950,000 units forecast for 2008) would bring significant relief for the province’s sawmilling and other American housing market linked sectors . But rising sawlog costs (due to diminished Crown and private land timber supply) would push up manufacturing costs – and more capacity closures would result . In turn, this would put further pressure on residual chip supplies to the remaining pulp and paper mills .
Even with higher prices paid within New Brunswick for sawlogs and pulplogs shipped out-of-province, an overall rising timber supply deficit and rising wood costs would render the industry increasingly uncompetitive .
Mitigating factors to this worst case scenario could include American housing starts exceeding the1.5millionunittrendlevel.Also,itisclearthathigherthanprojectedmarketpriceswouldhelp New Brunswick mills financially . The key mitigating factor within the control of New Brunswick in the Decline Scenario is the Crown timber supply .
There seems to be few prospects for lower wood costs under this scenario – offering little financial or operating relief to manufacturers . Overall capacity utilization rates would remain low . The key mitigating factor within the control of New Brunswick in this scenario is Crown timber supply . Alternative assumptions for the Crown timber supply are provided under the Base Case and Recovery and Growth scenarios .
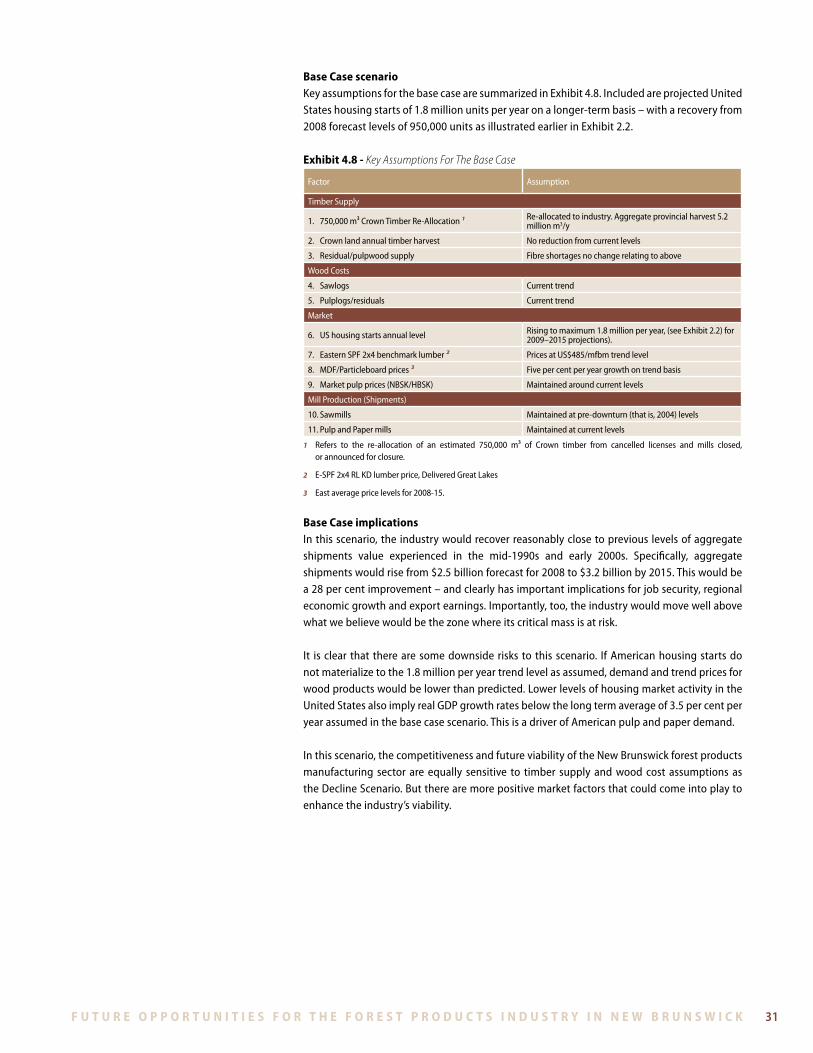
f u t u r e o p p o r t u n i t i e s f o r t h e f o r e s t p r o d u c t s i n d u s t r y i n n e w b r u n s w i c k f u t u r e o p p o r t u n i t i e s f o r t h e f o r e s t p r o d u c t s i n d u s t r y i n n e w b r u n s w i c k 31
base case scenarioKeyassumptionsforthebasecasearesummarizedinExhibit4.8.IncludedareprojectedUnitedStates housing starts of 1 .8 million units per year on a longer-term basis – with a recovery from 2008 forecast levels of 950,000 units as illustrated earlier in Exhibit 2 .2 .
exhibit 4.8 - Key Assumptions For The Base Case
Factor Assumption
Timber Supply
1 . 750,000 m3 Crown Timber Re-Allocation 1 Re-allocated to industry . Aggregate provincial harvest 5 .2 million m3/y
2 . Crown land annual timber harvest No reduction from current levels
3 . Residual/pulpwood supply Fibre shortages no change relating to above
Wood Costs
4 . Sawlogs Current trend
5 . Pulplogs/residuals Current trend
Market
6 . US housing starts annual level Rising to maximum 1 .8 million per year, (see Exhibit 2 .2) for 2009–2015projections).
7 . Eastern SPF 2x4 benchmark lumber 2 Prices at US$485/mfbm trend level
8 . MDF/Particleboard prices 3 Five per cent per year growth on trend basis
9 . Market pulp prices (NBSK/HBSK) Maintained around current levels
Mill Production (Shipments)
10 . Sawmills Maintained at pre-downturn (that is, 2004) levels
11 . Pulp and Paper mills Maintained at current levels
1 Refers to the re-allocation of an estimated 750,000 m3 of Crown timber from cancelled licenses and mills closed, or announced for closure .
2 E-SPF 2x4 RL KD lumber price, Delivered Great Lakes
3 East average price levels for 2008-15 .
base case implicationsIn this scenario, the industry would recover reasonably close to previous levels of aggregate shipments value experienced in the mid-1990s and early 2000s . Specifically, aggregate shipments would rise from $2 .5 billion forecast for 2008 to $3 .2 billion by 2015 . This would be a28percentimprovement–andclearlyhasimportantimplicationsforjobsecurity,regionaleconomic growth and export earnings . Importantly, too, the industry would move well above what we believe would be the zone where its critical mass is at risk .
It is clear that there are some downside risks to this scenario . If American housing starts do not materialize to the 1 .8 million per year trend level as assumed, demand and trend prices for wood products would be lower than predicted . Lower levels of housing market activity in the United States also imply real GDP growth rates below the long term average of 3 .5 per cent per year assumed in the base case scenario . This is a driver of American pulp and paper demand .
In this scenario, the competitiveness and future viability of the New Brunswick forest products manufacturing sector are equally sensitive to timber supply and wood cost assumptions as the Decline Scenario . But there are more positive market factors that could come into play to enhance the industry’s viability .
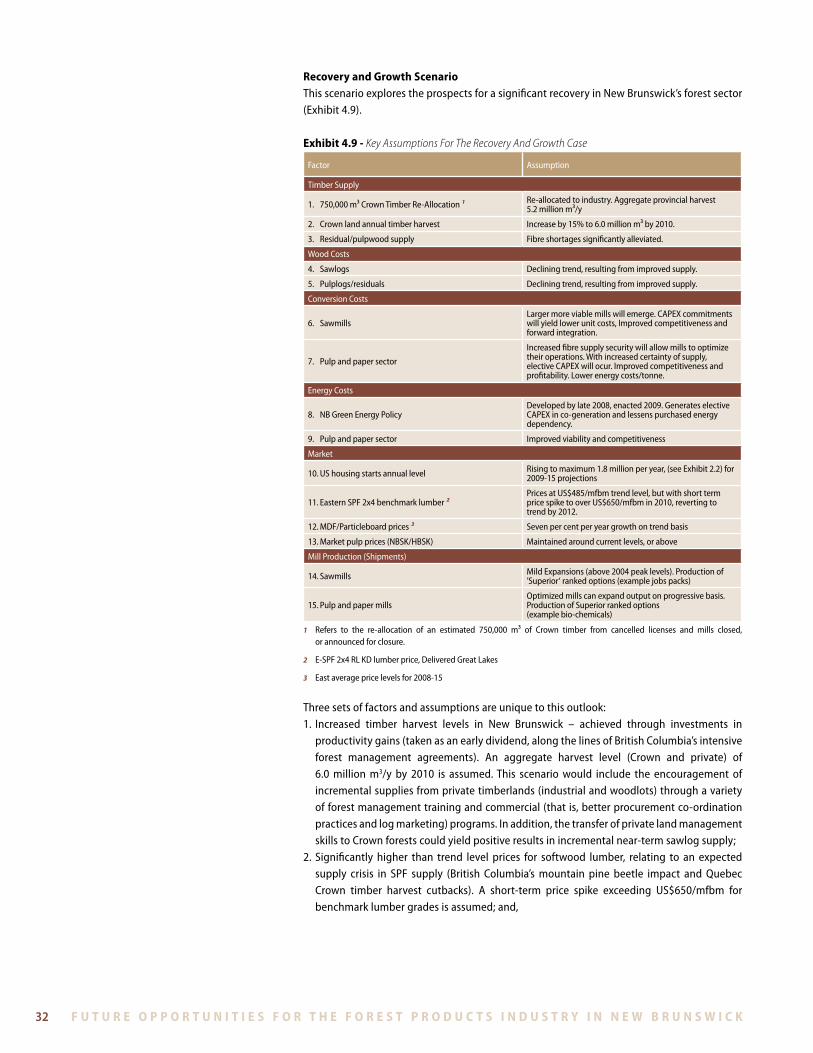
f u t u r e o p p o r t u n i t i e s f o r t h e f o r e s t p r o d u c t s i n d u s t r y i n n e w b r u n s w i c k32 f u t u r e o p p o r t u n i t i e s f o r t h e f o r e s t p r o d u c t s i n d u s t r y i n n e w b r u n s w i c k
recovery and growth scenarioThis scenario explores the prospects for a significant recovery in New Brunswick’s forest sector (Exhibit 4 .9) .
exhibit 4.9 - Key Assumptions For The Recovery And Growth Case
Factor Assumption
Timber Supply
1 . 750,000 m3 Crown Timber Re-Allocation 1 Re-allocated to industry . Aggregate provincial harvest 5 .2 million m3/y
2 . Crown land annual timber harvest Increase by 15% to 6 .0 million m3 by 2010 .
3 . Residual/pulpwood supply Fibre shortages significantly alleviated .
Wood Costs
4 . Sawlogs Declining trend, resulting from improved supply .
5 . Pulplogs/residuals Declining trend, resulting from improved supply .
Conversion Costs
6 . SawmillsLarger more viable mills will emerge . CAPEX commitments will yield lower unit costs, Improved competitiveness and forward integration .
7 . Pulp and paper sector
Increased fibre supply security will allow mills to optimize their operations . With increased certainty of supply, elective CAPEX will ocur . Improved competitiveness and profitability . Lower energy costs/tonne .
Energy Costs
8 . NB Green Energy PolicyDeveloped by late 2008, enacted 2009 . Generates elective CAPEX in co-generation and lessens purchased energy dependency .
9 . Pulp and paper sector Improved viability and competitiveness
Market
10 . US housing starts annual level Rising to maximum 1 .8 million per year, (see Exhibit 2 .2) for 2009-15projections
11 . Eastern SPF 2x4 benchmark lumber 2Prices at US$485/mfbm trend level, but with short term price spike to over US$650/mfbm in 2010, reverting to trend by 2012 .
12 . MDF/Particleboard prices 3 Seven per cent per year growth on trend basis
13 . Market pulp prices (NBSK/HBSK) Maintained around current levels, or above
Mill Production (Shipments)
14 . Sawmills Mild Expansions (above 2004 peak levels) . Production of ’Superior‘rankedoptions(examplejobspacks)
15 . Pulp and paper millsOptimized mills can expand output on progressive basis . Production of Superior ranked options (example bio-chemicals)
1 Refers to the re-allocation of an estimated 750,000 m3 of Crown timber from cancelled licenses and mills closed, or announced for closure .
2 E-SPF 2x4 RL KD lumber price, Delivered Great Lakes
3 East average price levels for 2008-15
Three sets of factors and assumptions are unique to this outlook:1 . Increased timber harvest levels in New Brunswick – achieved through investments in
productivity gains (taken as an early dividend, along the lines of British Columbia’s intensive forest management agreements) . An aggregate harvest level (Crown and private) of 6 .0 million m3/y by 2010 is assumed . This scenario would include the encouragement of incremental supplies from private timberlands (industrial and woodlots) through a variety of forest management training and commercial (that is, better procurement co-ordination practices and log marketing) programs . In addition, the transfer of private land management skills to Crown forests could yield positive results in incremental near-term sawlog supply;
2 . Significantly higher than trend level prices for softwood lumber, relating to an expected supply crisis in SPF supply (British Columbia’s mountain pine beetle impact and Quebec Crown timber harvest cutbacks) . A short-term price spike exceeding US$650/mfbm for benchmark lumber grades is assumed; and,

f u t u r e o p p o r t u n i t i e s f o r t h e f o r e s t p r o d u c t s i n d u s t r y i n n e w b r u n s w i c k f u t u r e o p p o r t u n i t i e s f o r t h e f o r e s t p r o d u c t s i n d u s t r y i n n e w b r u n s w i c k 33
3 . Investments by wood products manufacturers in high productivity equipment with more cutting for grade (value recovery) and targeting of higher margin markets in which New Brunswick mills could offer a higher-quality, branded product . The supply chain integration models discussed earlier are key to this scenario for all manufacturing sub-sectors . Employee skills training would be a vital supporting initiative reinforcing these productivity gains .
recovery and growth scenario implicationsIn the Recovery and Growth Scenario, significantly improved market conditions are the main driver of higher aggregate shipment levels for New Brunswick – but increased wood supply is the key to improved competitiveness and profitability .
Under this scenario, the aggregate value of forest industry shipments could exceed the previous peakof$4.2billionachievedin2004–andisprojectedtoreach$4.7billionby2015.
This would be almost double (88 per cent increase) the level expected in 2008 . Some of the key assumptionsunderlying these revenueprojectionshavebeenexploredearlier.Significantly,they are mostly market driven factors – facilitated by a comparatively modest 15 per cent increase in timber harvesting) along with expected higher product revenues . This is a significant level of earnings leverage from a single initiative .
Importantly, both factors send strong positive signals to investors in the sector – and in the growth products identified earlier .
In addition to investment attraction, growth in the industry in a range of higher value products would provide a significantly improved platform for human resource development, attracting and recruiting younger and more technically trained employees and prospective managers to the industry .
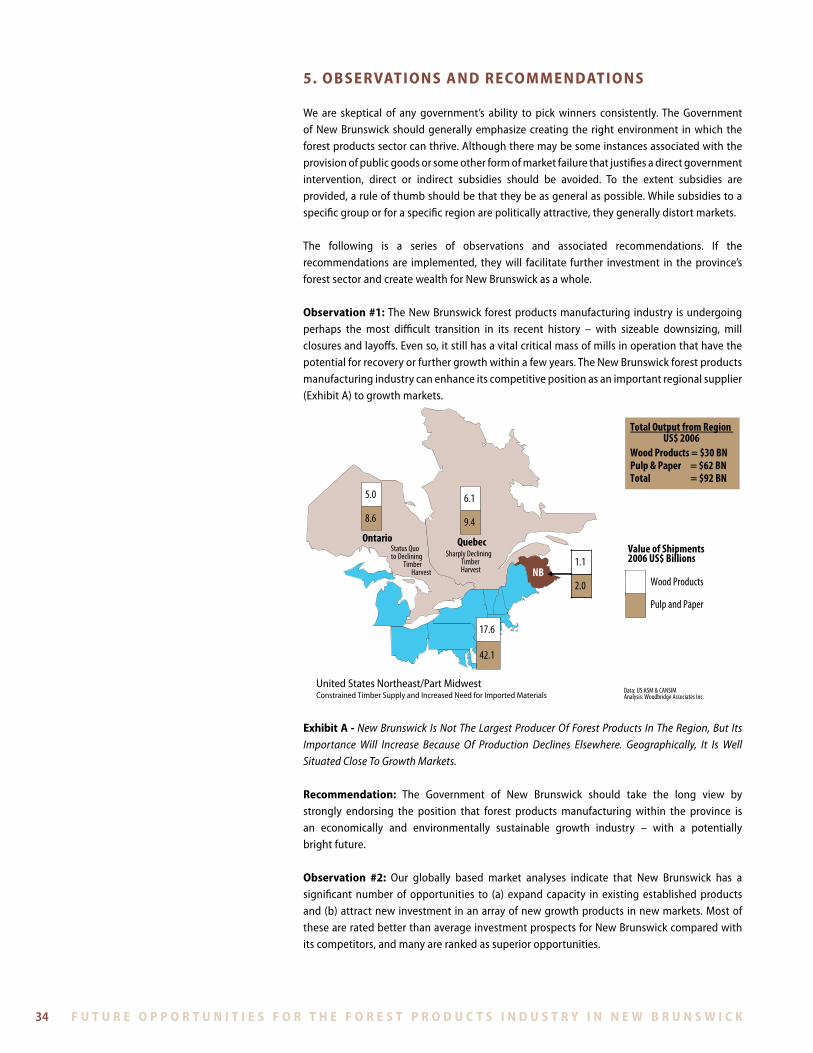
f u t u r e o p p o r t u n i t i e s f o r t h e f o r e s t p r o d u c t s i n d u s t r y i n n e w b r u n s w i c k34 f u t u r e o p p o r t u n i t i e s f o r t h e f o r e s t p r o d u c t s i n d u s t r y i n n e w b r u n s w i c k
5. o b s e rVat i o n s a n d r e co M M e n dat i o n s
We are skeptical of any government’s ability to pick winners consistently . The Government of New Brunswick should generally emphasize creating the right environment in which the forest products sector can thrive . Although there may be some instances associated with the provisionofpublicgoodsorsomeotherformofmarketfailurethatjustifiesadirectgovernmentintervention, direct or indirect subsidies should be avoided . To the extent subsidies are provided, a rule of thumb should be that they be as general as possible . While subsidies to a specific group or for a specific region are politically attractive, they generally distort markets .
The following is a series of observations and associated recommendations . If the recommendations are implemented, they will facilitate further investment in the province’s forest sector and create wealth for New Brunswick as a whole .
observation #1: The New Brunswick forest products manufacturing industry is undergoing perhaps the most difficult transition in its recent history – with sizeable downsizing, mill closures and layoffs . Even so, it still has a vital critical mass of mills in operation that have the potential for recovery or further growth within a few years . The New Brunswick forest products manufacturing industry can enhance its competitive position as an important regional supplier (Exhibit A) to growth markets .
Total Output from Region US$ 2006
Wood Products = $30 BNPulp & Paper = $62 BNTotal = $92 BN
6.1
9.4
Pulp and Paper
17.6
42.1
5.0
8.6
1.1
2.0
Value of Shipments 2006 US$ Billions
Wood Products
Quebec
United States Northeast/Part MidwestConstrained Timber Supply and Increased Need for Imported Materials
Ontario
Data: US ASM & CANSIMAnalysis: Woodbridge Associates Inc.
NB
Sharply Declining Timber Harvest
Status Quo to Declining
TimberHarvest
exhibit a - New Brunswick Is Not The Largest Producer Of Forest Products In The Region, But Its Importance Will Increase Because Of Production Declines Elsewhere. Geographically, It Is Well Situated Close To Growth Markets.
recommendation: The Government of New Brunswick should take the long view by strongly endorsing the position that forest products manufacturing within the province is an economically and environmentally sustainable growth industry – with a potentially bright future .
observation #2: Our globally based market analyses indicate that New Brunswick has a significant number of opportunities to (a) expand capacity in existing established products and (b) attract new investment in an array of new growth products in new markets . Most of these are rated better than average investment prospects for New Brunswick compared with its competitors, and many are ranked as superior opportunities .
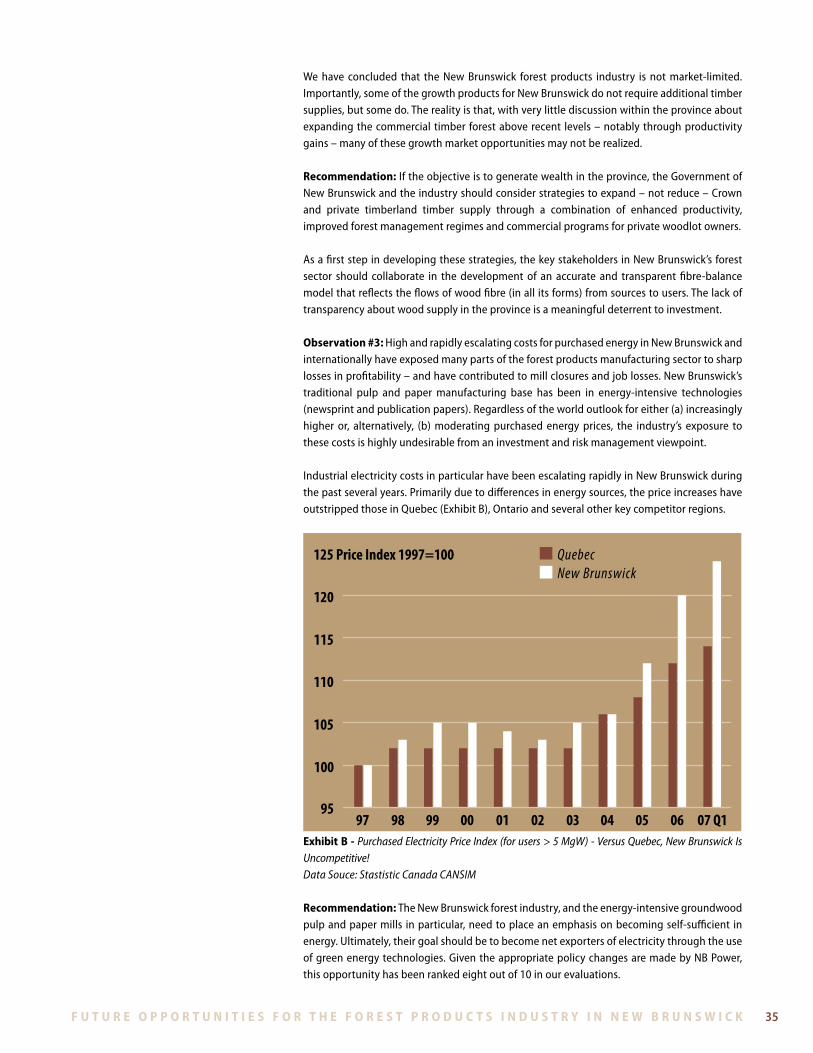
f u t u r e o p p o r t u n i t i e s f o r t h e f o r e s t p r o d u c t s i n d u s t r y i n n e w b r u n s w i c k f u t u r e o p p o r t u n i t i e s f o r t h e f o r e s t p r o d u c t s i n d u s t r y i n n e w b r u n s w i c k 35
We have concluded that the New Brunswick forest products industry is not market-limited . Importantly, some of the growth products for New Brunswick do not require additional timber supplies, but some do . The reality is that, with very little discussion within the province about expanding the commercial timber forest above recent levels – notably through productivity gains – many of these growth market opportunities may not be realized .
recommendation: Iftheobjectiveistogeneratewealthintheprovince,theGovernmentofNew Brunswick and the industry should consider strategies to expand – not reduce – Crown and private timberland timber supply through a combination of enhanced productivity, improved forest management regimes and commercial programs for private woodlot owners .
As a first step in developing these strategies, the key stakeholders in New Brunswick’s forest sector should collaborate in the development of an accurate and transparent fibre-balance model that reflects the flows of wood fibre (in all its forms) from sources to users . The lack of transparency about wood supply in the province is a meaningful deterrent to investment .
observation #3: High and rapidly escalating costs for purchased energy in New Brunswick and internationally have exposed many parts of the forest products manufacturing sector to sharp lossesinprofitability–andhavecontributedtomillclosuresandjoblosses.NewBrunswick’straditional pulp and paper manufacturing base has been in energy-intensive technologies (newsprint and publication papers) . Regardless of the world outlook for either (a) increasingly higher or, alternatively, (b) moderating purchased energy prices, the industry’s exposure to these costs is highly undesirable from an investment and risk management viewpoint .
Industrial electricity costs in particular have been escalating rapidly in New Brunswick during the past several years . Primarily due to differences in energy sources, the price increases have outstripped those in Quebec (Exhibit B), Ontario and several other key competitor regions .
95
100
105
110
115
120
125 Price Index 1997=100 Quebec New Brunswick
97 98 99 00 01 02 03 04 05 06 07 Q1exhibit b - Purchased Electricity Price Index (for users > 5 MgW) - Versus Quebec, New Brunswick Is Uncompetitive!Data Souce: Stastistic Canada CANSIM
recommendation: The New Brunswick forest industry, and the energy-intensive groundwood pulp and paper mills in particular, need to place an emphasis on becoming self-sufficient in energy . Ultimately, their goal should be to become net exporters of electricity through the use of green energy technologies . Given the appropriate policy changes are made by NB Power, this opportunity has been ranked eight out of 10 in our evaluations .
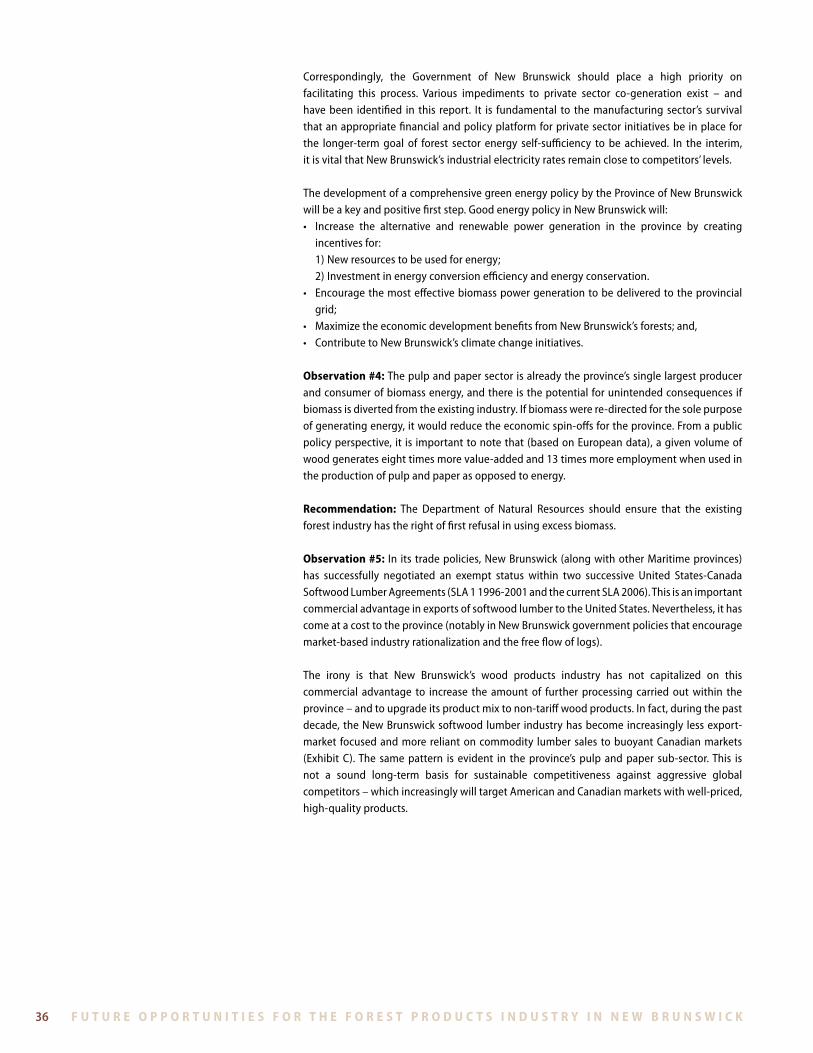
f u t u r e o p p o r t u n i t i e s f o r t h e f o r e s t p r o d u c t s i n d u s t r y i n n e w b r u n s w i c k36 f u t u r e o p p o r t u n i t i e s f o r t h e f o r e s t p r o d u c t s i n d u s t r y i n n e w b r u n s w i c k
Correspondingly, the Government of New Brunswick should place a high priority on facilitating this process . Various impediments to private sector co-generation exist – and have been identified in this report . It is fundamental to the manufacturing sector’s survival that an appropriate financial and policy platform for private sector initiatives be in place for the longer-term goal of forest sector energy self-sufficiency to be achieved . In the interim, it is vital that New Brunswick’s industrial electricity rates remain close to competitors’ levels .
The development of a comprehensive green energy policy by the Province of New Brunswick will be a key and positive first step . Good energy policy in New Brunswick will:• Increase the alternative and renewable power generation in the province by creating
incentives for:1) New resources to be used for energy;2) Investment in energy conversion efficiency and energy conservation .
• Encouragethemosteffectivebiomasspowergenerationtobedeliveredtotheprovincialgrid;
• MaximizetheeconomicdevelopmentbenefitsfromNewBrunswick’sforests;and,• ContributetoNewBrunswick’sclimatechangeinitiatives.
observation #4: The pulp and paper sector is already the province’s single largest producer and consumer of biomass energy, and there is the potential for unintended consequences if biomass is diverted from the existing industry . If biomass were re-directed for the sole purpose of generating energy, it would reduce the economic spin-offs for the province . From a public policy perspective, it is important to note that (based on European data), a given volume of wood generates eight times more value-added and 13 times more employment when used in the production of pulp and paper as opposed to energy .
recommendation: The Department of Natural Resources should ensure that the existing forest industry has the right of first refusal in using excess biomass .
observation #5: In its trade policies, New Brunswick (along with other Maritime provinces) has successfully negotiated an exempt status within two successive United States-Canada Softwood Lumber Agreements (SLA 1 1996-2001 and the current SLA 2006) . This is an important commercial advantage in exports of softwood lumber to the United States . Nevertheless, it has come at a cost to the province (notably in New Brunswick government policies that encourage market-based industry rationalization and the free flow of logs) .
The irony is that New Brunswick’s wood products industry has not capitalized on this commercial advantage to increase the amount of further processing carried out within the province – and to upgrade its product mix to non-tariff wood products . In fact, during the past decade, the New Brunswick softwood lumber industry has become increasingly less export-market focused and more reliant on commodity lumber sales to buoyant Canadian markets (Exhibit C) . The same pattern is evident in the province’s pulp and paper sub-sector . This is not a sound long-term basis for sustainable competitiveness against aggressive global competitors – which increasingly will target American and Canadian markets with well-priced, high-quality products .
f u t u r e o p p o r t u n i t i e s f o r t h e f o r e s t p r o d u c t s i n d u s t r y i n n e w b r u n s w i c k f u t u r e o p p o r t u n i t i e s f o r t h e f o r e s t p r o d u c t s i n d u s t r y i n n e w b r u n s w i c k 37
Domestic Exports
1997
New Brunswick’s Pulp and Paper Sector
Loss of Export Market Competitiveness,Increasing Dependance on Canadian Markets
Shipments Value
Wood Products Manufacturers’Increasing Focus on
Domestic Markets
2007
$2.1BN$1.9BN
23%
77%
35%
65%
1997 2007
$1.0BN$1.1BN
36%
64%
46%
54%
exhibit c - New Brunswick’s Forest Products Manufacturing Sector Is Becoming Increasingly Focused On Domestic Markets. Growth In Highly Ranked Emerging Products Would Provide A Valuable Stimulus To New Export Market Growth - And Insulate Against Domestic Market Downturns. But More Effort Is Needed In Market Development And Promotion
recommendation: The New Brunswick forest industry, notably wood products producers, should explore the market opportunities outlined in this report through a series of well-organized industry visits to key markets in the United States . These could include proprietary market research carried out by firms independently . In addition, Business New Brunswick and other ministries should work with the industry in helping to identify and develop export markets . Trade mission visits could be organized collaboratively .
observation #6: Globally, the allocation of public (Crown) timber is becoming increasingly complexandcontentiousduetonewdemandsandscarcity.Manyjurisdictionsareadoptingflexible management systems and regulations – regulating outcomes rather than the process . Also at the global level, there is a clear trend toward the devolution of forest management authority . In fact, nearly three-quarters of developing countries are shifting public authority from government to the private sector or locally .
The disadvantages of centralized authorities administratively deciding the allocation of public timber licences frequently outweigh the economic development advantages gained historically . Market mechanisms and market pricing avoid the need for governments to choose the winners in terms of determining the most globally competitive product-mix for a region orjurisdiction.
recommendation: The Department of Natural Resources should continue to remove impediments, such as appurtenancy rules and administratively-determined Crown timber allocations, and allow market prices and competition between private sector mill and plant operators to determine the optimum product-market for the province . But it should retain a key long-term role in provincial timber supply by re-affirming that the Government of New Brunswick is committed to being in the tree-growing business .
f u t u r e o p p o r t u n i t i e s f o r t h e f o r e s t p r o d u c t s i n d u s t r y i n n e w b r u n s w i c k38
observation #7: The global forest sector is witnessing the most fundamental changes in markets and public policies since the end of the colonial era . The resulting uncertainty is significant, and the importance of being able to identify and manage change has increased . This has been a concern during the past decade . There appears to have been a general decline in the amount of analytical resources devoted to market and strategic issues in the forest industry by the public and private sectors .
recommendation: A joint industry/government initiative should be undertaken to buildanalytical capacity in New Brunswick’s forest sector, with an emphasis on market and strategic issues . A priority should be given to developing this capacity in the provincial government and private wood lot segment .
Consideration should be given to the development of a Model Sustainable Forest-Based Community . The rationale is that it would be a forum in which to develop and showcase New Brunswick’s expertise in providing green products . This could include:• ElementsoftheGussingexperiencefromAustriainbio-energy;• Green-builtwoodproducts;and,• Marketing of environmental goods and services (that is, carbon-credits, bio-diversity
credits, etc .)
In essence, the Community would focus on the emerging green market place and serve as a laboratory for the rest of New Brunswick .