Embed Size (px)
Citation preview
Anvita Bieza
FUNCTIONAL MAGNETIC
RESONANCE IMAGING IN
FOLLOW-UP OF CEREBRAL
GLIAL TUMORS
Summary of Doctoral Thesis to obtain
PhD degree in medicine
Specialty Diagnostic Radiology
Riga, 2013
Doctoral thesis was developed in Riga Eastern Clinical University
Hospital “Gaiļezers” and Department of Radiology, Rīga Stradiņš
University
Scientific supervisor:
Dr. habil. med., Professor Gaida Krumina,
Rīga Stradiņš University
Official reviewers:
Dr. med., Professor A. Millers, Rīga Stradiņš University
Dr. habil. med., Professor I. Aksiks, University of Latvia
Dr. med. O. Utehina, Riga Eastern Clinical University
Hospital “Gaiļezers”
Doctoral Thesis will be defended on the 28th of June, 2013 at 14.00 at
Rīga Stradiņš University open meeting of Promotion Council of
Theoretical Medicine in Riga, Dzirciema Street 16, Hippocrate
auditorium.
Promotion thesis is available at Rīga Stradiņš University library and
home page: www.rsu.lv
The Doctoral Thesis was supported by the European Social Fund program
“Support for acquisition of doctoral study program and obtaining of a scientific
degree in Rīga Stradiņš University”
Secretary of the Promotional Council:
Dr. habil. med., Professor Liga Aberberga-Augskalne
3
TABLE OF CONTENTS
LIST OF ABBREVIATIONS ........................................................ 4 INTRODUCTION ......................................................................... 5
1. MATERIALS AND METHODS ............................................... 9 1.1. Patient selection .................................................................. 9 1.2. Morphological and immunohistochemical examinations . 10
1.3. Magnetic resonance imaging protocol .............................. 11 1.4. Magnetic resonance imaging data processing ................... 11
1.4.1. Fractional anisotropy measurements .......................... 12 1.4.2. Tractography .............................................................. 12 1.4.3. Magnetic resonance spectroscopy .............................. 13
1.5. Statistical analysis ............................................................. 14 2. RESULTS ................................................................................ 16
2.1. Glial tumors....................................................................... 16 2.1.1. Fractional anisotropy analysis .................................... 16 2.1.2. Metabolite ratio analysis ............................................ 17
2.1.3. Tractography findings ................................................ 22
2.2. Treatment induced brain injury ......................................... 31 2.2.1. Fractional anisotropy analysis .................................... 31 2.2.2. Metabolite ratio analysis ............................................ 32 2.2.3. Tractography findings ................................................ 33
2.3. Comparison of metabolites and FA between patients with
glial tumors and treatment induced brain injury ...................... 36 2.4. Analysis of diagnostic test accuracy ................................. 39
2.4.1. Repeatability of MRS and DTI measurements .......... 39 2.4.2. Influence of ROI size on FA measurements .............. 40
3. CONCLUSIONS ...................................................................... 42 4. PRACTICAL RECOMMENDATIONS .................................. 43
5. PUBLICATIONS AND PRESENTATIONS ON RESEARCH
THEME ........................................................................................ 44
6. ACKNOWLEDGMENTS ....................................................... 47 7. LIST OF REFERENCES ......................................................... 48
4
LIST OF ABBREVIATIONS
Cho choline
Cr creatine
DTI diffusion tensor imaging
FA fractional anisotropy
FOV field of view
LL lipids and lactate
MI myo-inositol
MRI magnetic resonance imaging
MRS magnetic resonance spectroscopy
NAA N-acetylaspartate
ROI region of interest
5
INTRODUCTION
Glioma is the most common malignant primary tumor that arises in the
brain (1,2). It accounts for approximately 70% of the malignant primary brain
tumors in adults, the incidence is 6 cases per 100 000 per year (3).
Despite the development of advanced surgical technique, new methods
of focused radiotherapy and novel chemotherapy schemes, the majority of glial
brain tumors recur due to the invasive growth pattern (2). Even after total
resection of tumor recurrence is observed near the primary tumor localization
(1). Malignant infiltrative brain gliomas have tendency to infiltrate surrounding
white matter for several centimeters from the core of tumor (4). Despite
numerous studies, preoperative assessment of glioma invasion and resection
border remains one of the major problems in neuro-oncology (5). Another
important, unresolved issue is the clinical and radiological distinction of glial
tumor recurrence and radiation/chemotherapy induced injury (6), as structural
MRI is often nonspecific in post-treatment period – both recurrent tumor and
inflammatory or necrotic changes due to radiation/chemotherapy typically
accumulate contrast agents.
Noninvasive evaluation of cerebral white matter, visualization of
white matter fibers, information about the tract destruction, especially in the
area around the tumor is essential in diagnosis, treatment planning and
determination of prognosis (1). In daily practice MRI with intravenous contrast
administration is the main additional method for the initial noninvasive
investigation of patients with intracranial mass. It helps to assess tumor volume,
but not the extent of tumor infiltration in white matter tracts. The use of
conventional structural MRI sequences is limited because of their insensitivity
for detection of tumor cells outside the visible tumor border (4,7), as well as
provides little functional information (8). In such cases, advanced imaging
6
techniques could be of great value, which allows monitoring the physiological
and metabolic characteristics of the tumor and surrounding brain tissue (1).
MRS is a noninvasive imaging of metabolic changes within the brain
(9). In parallel, the DTI sequence was developed in the last decade and has
application in the evaluation of white matter pathways by measuring the degree
and directionality of water diffusion in tissue (10).
In this study the quantitative parameter of DTI (FA) and MRS
metabolic ratios (Cho/Cr, NAA/Cr, LL/Cr and MI/Cr) were measured in
selected brain areas. The brain white matter tracts were reconstructed in
damaged hemisphere and compared with the opposite normal hemisphere
pathways using DTI 3-dimensional tractography method, color coded FA maps
and color coded fiber orientation maps. So far, such multimodal approaches in
glial tumors studies were not well described in the literature.
Although various studies indicate that DTI and MRS quantitative
measurements can provide additional information in glial tumors diagnostics
and monitoring, it is necessary to determine the repeatability of the tests so that
they could be more widely used in clinical practice. However, the
reproducibility of DTI and MRS derived indices has not yet been systematically
analyzed in the literature (11). Even less repeatability research has been
conducted from patients with glial brain tumor. This is the first study
evaluating the repeatability index of FA and MRS measures in the tumor, zone
of perifocal edema, as well as the distant and the contralateral symmetrical
normal-appearing white matter.
The structure of the doctoral thesis:
Doctoral thesis is written in Latvian and executed on 149 pages. It has one
attachment. The work has a classic design, it includes annotations in Latvian
and English, introduction, topicality, novelty and practical significance of the
study, the aim and the objectives of the study, hypotheses, literature review,
materials and methods, results, discussion, conclusions, list of publications and
7
reports, bibliography which includes 173 references. Doctoral thesis contains
10 tables and 156 figures.
The aim of the study was to assess the usefulness of DTI and MRS in
glial brain tumor specified primary radiological diagnosis, and in differentiation
between glial tumor recurrence and radiation/chemotherapy induced changes in
the brain.
Objectives:
1. Investigate FA changes in the specific areas of interest – tumor, zone of
perifocal edema, treatment induced injury zone, the distant and the
contralateral normal-appearing white matter.
2. Collect and analyze the MRS data - different metabolites ratios – in
identical areas of interest on patients with glial tumors and treatment
induced brain injury.
3. Assess the possibility of MRI tractography in characterization of white
matter injury caused by tumor and in evaluation of applied treatment.
Hypotheses:
1. Glial brain tumor and its perifocal zone are characterized by different
values and ratios of MRS neuronal markers, specific changes in brain
white matter tracts and quantitative differences in diffusion anisotropy
parameters that allow radiological evaluation of tumor spread in visually
unchanged peritumoral area.
2. Radiation and/or chemotherapy induced brain injury and tumor recurrence
is possible to differentiate, based on differences in MRS neuronal markers
and diffusion anisotropy parameters.
Topicality, novelty and practical significance of the study:
1. This is the first study in Latvia to evaluate the role of MRS and DTI in
glioma diagnosis and in the assessment of treatment effectiveness.
2. For the first time, multimodal approach has been used for the study of glial
tumors, combining structural MRI with analysis of MRS and DTI
8
quantitative parameters, color coded FA maps, color coded fiber
orientation maps and 3-dimensional tractography.
3. MRI tractography methodology has been approbated in clinical practice.
4. Results of this study indicate that DTI is able to differentiate between
different white matter tract lesions due to the spread of glial tumor, which
is important for preoperative planning and for determining treatment
effectiveness.
5. This is the first study evaluating the repeatability index of FA and MRS
measures in the tumor, zone of perifocal edema, as well as the distant and
the contralateral symmetrical normal-appearing white matter.
6. New data were obtained about the role of MRS and DTI in determination
of the vital glioma cells and infiltration area.
7. The most important MRI parameters for evaluating the effectiveness of
radiation/chemotherapy were identified.
8. Several recommendations have been developed to introduce DTI and MRS
in clinical practice.
9. Our MRI protocol improves the accuracy of radiological diagnosis both for
newly diagnosed glioma patients and repeated examination, evaluating the
efficacy and side effects of treatment. Accurate diagnosis allows choosing
the most appropriate treatment, thereby improving the quality of life and
prolonging survival.
Personal contribution:
The author personally participated in all stages of the research – in the study
design; in the collection of material, MRI data post-processing, statistical
analysis, interpretation of the results obtained, literature review, preparation of
publications, theses, conferences reports, and translation; is the author of the
published images.
9
1. MATERIALS AND METHODS
1.1. Patient selection
The study included 150 MRI examinations in 92 patients acquired
during the period between August 2009 and December 2011. The study
included patients with both newly diagnosed brain glioma and those in the
follow-up period after treatment.
Inclusion criteria:
1. Morphologically confirmed brain glioma.
2. MRI performed using a protocol including DTI and MRS sequences.
3. High quality MRI images (without motion artifacts).
Exclusion criteria:
1. Patients without morphologically confirmed brain glioma.
2. Patients with histologically confirmed another type of pathology.
3. MRI performed using a protocol without DTI and/or MRS sequences.
4. Poor quality MRI images (with motion artifacts).
Patients were divided into two major groups based on histological
findings and structural MRI appearance:
1. Patients with glial brain tumors.
2. Patients in remission after treatment.
73 patients were included in the first group with typical glial brain
tumors. Two subgroups were categorized depending on whether or not the
patient had received radiotherapy/chemotherapy: before radiotherapy/
chemotherapy (n=24), after radiotherapy/chemotherapy (n=49). The time
period between initiation of radiotherapy/chemotherapy and MRS, DTI
examinations were from 0.5 to 130 months. The majority of patients (n=53) had
received corticosteroids before the MRI examination, 20 patients had not
10
received corticosteroids. Depending on grades of malignancy two subgroups
were dealt: low-grade glioma (grade II) – 7 patients; high-grade glioma (grade
III and IV) – 66 patients.
The second study group included 77 patients in remission with treatment
induced brain injury. The treatment induced brain injury was determined by the
following criteria: long-term stability of the structural MRI findings or
spontaneous regression of lesions. In our study the median follow-up time was
9.41 months (range, 3 - 24 months).
1.2. Morphological and immunohistochemical examinations
The patients enrolled in this study had different types of
neuroepithelial tumors: 53 glioblastomas, 42 anaplastic oligoastrocytomas, 26
anaplastic astrocytomas, 11 astrocytomas, 7 oligoastrocytomas, 5 anaplastic
oligodendrogliomas, 4 oligodendrogliomas, 1 pleomorphic xanthoastrocytoma
and 1 astroblastoma. Tumors were classified by using the 2007 revised World
Health Organization classification of tumors of the central nervous system (12).
The final histopathological diagnosis was determined by analysis of formalin-
fixed, paraffin-embedded tissue samples. The standard method was
hematoxylin and eosin staining, and immunohistochemical analysis, including
Ki-67 antigen immunostaining (MIB-1 antibody) and GFAP (glial fibrillary
acidic protein).
Tumor grade was determined histologically, based on seven criteria of
malignancy: mitotic activity, microvascular proliferation - angiogenesis,
necrosis in tumor, cell polymorphism, nuclear pleomorphism, cell density,
lymphocytic muff around the blood vessels.
11
1.3. Magnetic resonance imaging protocol
All patients were examined using a 1.5 Tesla MR system (General
Electric Signa EXCITE MR) equipped with an eight-channel head coil. MRI
protocol included following examination sequences:
1. Standard structural sequences
a. Axial T2 propeller or coronal T2 FRFSE.
b. Axial T2 FLAIR propeller or coronal T2 FLAIR.
c. Axial diffusion-weighted imaging (0/Ax DWI 1000b ASSET).
d. Obl T1 3D FSPGR IR prep before and after intravenous
gadolinium-based contrast media administration.
2. DTI (TENSOR 25 directions 1000b).
3. MRS was performed with 2-dimensional multi-voxel chemical shift
imaging - (8ch) PROBE-2DSI PRESS 144TE.
The total MRI acquisition time was maximum 20 minutes 17 seconds.
1.4. Magnetic resonance imaging data processing
MRS and DTI primary data were automatically transferred to the
workstation MR GELS (General Electric) for post-processing. MRS spectral
curves, metabolite measurements and DTI images (color coded FA maps, color
coded fiber orientation maps and 3-dimensional tractography) were obtained by
using the program Functool.
Quantitative DTI and MRS measurements were made on identical
areas of interest, which were placed manually. In the study group of typical
glioma the measurements were made at four locations: tumor, zone of perifocal
edema, the distant and the contralateral normal-appearing white matter. In the
12
second study group of patients in remission the measurements were made at
three locations: abnormal signal intensity area around the postoperative cavity
(treatment induced injury zone), the distant and the contralateral normal-
appearing white matter. Placement of ROI was based on previously published
recommendations (4).
1.4.1. Fractional anisotropy measurements
To make the measurements of quantitative DTI parameter (FA), DTI
gray scale maps and color coded FA maps were reconstructed. FA
measurements were made on defined areas of interest, which were placed
manually on 2-dimensional DTI gray scale maps. Overall, 496 FA
measurements were obtained. Selection of the ROI was based on the different
brain areas which were identified by the structural T2, FLAIR, post-contrast T1
images and color coded FA maps. The ROI size for FA measurements was 30
pixels (41.2mm2).
1.4.2. Tractography
In order to distinguish the different tract lesions, the structural MRI
images, color coded FA maps, color coded fiber orientation maps and 3-
dimensional tractography reconstructions were used.
Overall, 243 brain white matter tracts were reconstructed in affected
hemisphere – 71 internal capsule/corona radiata, 62 subcortical U-fibers, 40
inferior longitudinal fasciculus, 28 uncinate fasciculus, 19 corpus callosum, 8
13
inferior frontooccipital fasciculus, 7 middle cerebellar peduncle fibers, 6
arcuate fasciculus, 2 cingulum.
In order to visualize white matter tracts by tractography, it was
necessary to find the ROIs - the starting points to reconstruct the tract. In our
study these starting points were placed manually on DTI color coded fiber
orientation maps, based on previously developed 3-dimensional tractography
atlas (13) and adapted it to our workstation. Both single and multiple ROIs
were used for tractography, depending on the type of tract.
White matter tract involvement adjacent to tumor was classified as
displacement, edema, infiltration and disruption according to previously
published criteria (5):
Tract displacement – tract maintained normal anisotropy relative to the
corresponding tract in the contralateral hemisphere, but was situated in an
abnormal location or with an abnormal orientation on color coded fiber
orientation maps (5).
Tract edema – tract maintained normal anisotropy and orientation, but
demonstrated high signal intensity on T2 and FLAIR images (5).
Tract infiltration – tract showed reduced anisotropy, but remained
identifiable on color coded fiber orientation maps (5).
Tract disruption – anisotropy was markedly reduced such that the tract
could not be identified on color coded fiber orientation maps (5).
1.4.3. Magnetic resonance spectroscopy
Quantitative measurements of MRS (Cho/Cr, NAA/Cr, LL/Cr, MI/Cr
ratios) were made in definite areas of interest – identical to those of FA
measurements. After the automatic MRS data post-processing we determined
14
the highest metabolic peaks at specific points of spectral curve - MI at 3.5-
3.6ppm, Cho 3.2ppm, Cr 3.0ppm and NAA 2.0ppm. Regarding LL we
determined the sum of peak heights between 0.8 and 1.3 ppm. Individual voxels
were placed on defined areas of interest at the previously scanned slice. Then
the spectrum was calculated automatically. Each metabolite peak was initially
assessed visually and metabolite ratios were calculated. Cr was used as the
denominator for calculating metabolite ratios, because it is considered the most
stable cerebral metabolite. Overall, 2057 measurements of metabolite ratios
were obtained.
1.5. Statistical analysis
Microsoft Office Excel 2003 was used for data collection. Statistical
analysis was performed by using the Statistical Package for the Social Sciences
(SPSS, version 20). Statistical methods of data analysis:
1. Descriptive statistics were used for calculating the mean and standard
deviations of the samples and the measures (Cho/Cr, NAA/Cr, MI/Cr,
LL/Cr and FA). The Kolmogorov - Smirnov test was used to determine if
the data were normally distributed.
2. Conclusive statistics:
Hypothesis testing. If the variables in paired samples did not meet the
normal distribution (p<0.05), the nonparametric related samples
Wilcoxon signed rank test was used to compare pairs. If the data were
normally distributed (p>0.05), the paired sample t-test was used to
compare the values of means for two related samples.
The repeatability of measurements was tested with single factor
analysis of variance (ANOVA, MS Excel). Mean squares between
15
groups (MSA) and mean squares within groups (MSW) were derived
from ANOVA. Repeatability index (r) was calculated using the
following formulas:
r=S2A/(S
2+S
2A) (1.formula)
S2 is mean square within group (MSW).
S2A = (MSA-MSW)/n0 (2.formula)
n0 is the weighted average number of observations per group (14).
In this study we have 2 observations per individual, so n0=2.
The following terminology was used to describe various degrees of
repeatability as recommended Martin and Bateson (1986):
r <0.2 – slight repeatability,
r 0.2-0.4 – low repeatability,
r 0.4-0.7 – moderate repeatability,
r 0.7-0.9 – high repeatability,
r >0.9 – very high repeatability. This repeatability index was
only used in cases if data were statistically significant (15).
A p value of less than 0.05 was considered to indicate a significant
difference.
16
2. RESULTS
After post-processing 150 MRI scans, 2553 quantitative measurements
of metabolite ratios (Cho/Cr, NAA/Cr, LL/Cr, MI/Cr) and FA parameter were
obtained on defined areas of interest: 362 measurements were made in the
tumor, 324 measurements in the zone of perifocal edema, 380 measurements in
the treatment induced injury zone, 744 measurements in the distant normal-
appearing white matter and 743 measurements in the contralateral normal-
appearing white matter.
2.1. Glial tumors
2.1.1. Fractional anisotropy analysis
We calculated FA mean values and standard deviations in each area of
interest using descriptive statistics method. We observed a gradual increase of
FA values in the direction from tumor to peritumoral zone and contralateral
normal-appearing white matter. The FA measurements results (mean ±
standard deviation) in patients with glial brain tumors: in the tumor
0.122(±0.049); in the perifocal edema 0.175(±0.323); in the distant normal-
appearing white matter 0.323(±0.091); in the contralateral normal-appearing
white matter 0.473(±0.068).
Comparing data in paired samples between tumor and perifocal
edema, statistically significant differences were observed between the FA mean
values (p<0.001, Wilcoxon test).
Comparing data in paired samples between tumor and distant normal-
appearing white matter, statistically significant differences were observed
between the FA mean values (p<0.001, Wilcoxon test).
17
Comparing data between tumor and contralateral normal-appearing
white matter, statistically significant differences were observed between the FA
mean values (p<0.001, Wilcoxon test).
Comparing data between perifocal edema and distant normal-
appearing white matter, statistically significant differences were observed
between the FA mean values (p<0.001, t–test).
Comparing data between perifocal edema and contralateral normal-
appearing white matter, statistically significant differences were observed
between the FA mean values (p<0.001, Wilcoxon test).
Comparing data between distant and contralateral normal-appearing
white matter, statistically significant differences were observed between the FA
mean values (p<0.001, Wilcoxon test).
To determine whether the received radiation/chemotherapy affected
diffusion anisotropy parameters, we compared the measurements in two
subgroups of patients - before radiotherapy/chemotherapy (n=24) and after
radiotherapy/chemotherapy (n=49) by the Wilcoxon test. At any of the
measured areas FA mean values did not show statistically significant
difference.
To determine whether the use of corticosteroids affected FA
parameters, we compared the measurements in two subgroups of patients by the
Wilcoxon test - patients who received corticosteroids (n=53) and who did not
receive corticosteroids (n=20) before MRI. At any of the measured areas FA
mean values did not show statistically significant difference.
2.1.2. Metabolite ratio analysis
We calculated mean values and standard deviations of Cho/Cr,
NAA/Cr, MI/Cr, LL/Cr ratios in each area of interest using descriptive statistics
18
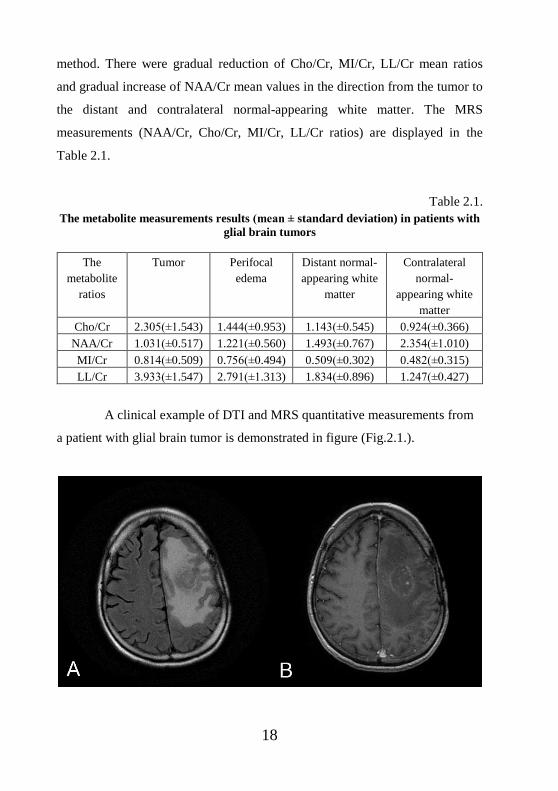
method. There were gradual reduction of Cho/Cr, MI/Cr, LL/Cr mean ratios
and gradual increase of NAA/Cr mean values in the direction from the tumor to
the distant and contralateral normal-appearing white matter. The MRS
measurements (NAA/Cr, Cho/Cr, MI/Cr, LL/Cr ratios) are displayed in the
Table 2.1.
Table 2.1.
The metabolite measurements results (mean ± standard deviation) in patients with
glial brain tumors
The
metabolite
ratios
Tumor Perifocal
edema
Distant normal-
appearing white
matter
Contralateral
normal-
appearing white
matter
Cho/Cr 2.305(±1.543) 1.444(±0.953) 1.143(±0.545) 0.924(±0.366)
NAA/Cr 1.031(±0.517) 1.221(±0.560) 1.493(±0.767) 2.354(±1.010)
MI/Cr 0.814(±0.509) 0.756(±0.494) 0.509(±0.302) 0.482(±0.315)
LL/Cr 3.933(±1.547) 2.791(±1.313) 1.834(±0.896) 1.247(±0.427)
A clinical example of DTI and MRS quantitative measurements from
a patient with glial brain tumor is demonstrated in figure (Fig.2.1.).
19
20
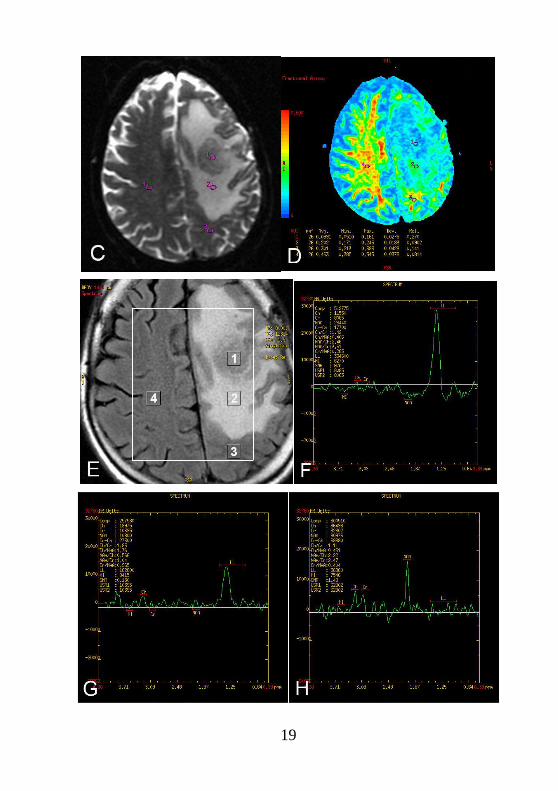
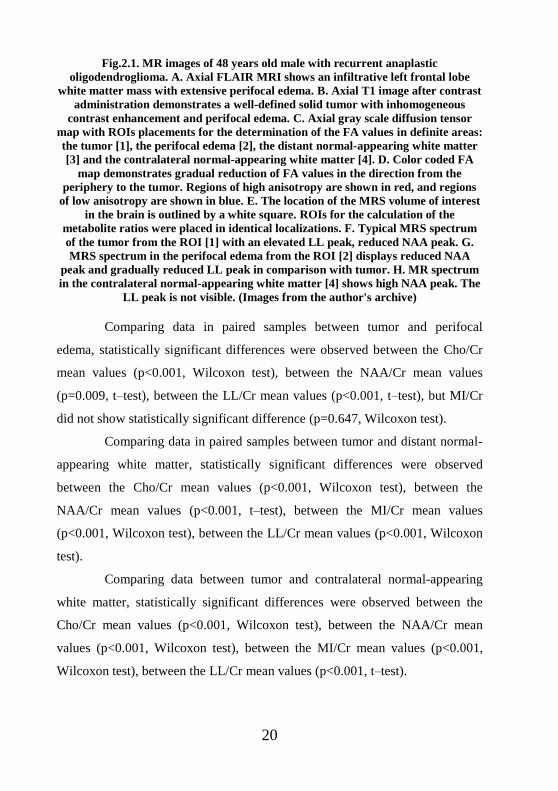
Fig.2.1. MR images of 48 years old male with recurrent anaplastic
oligodendroglioma. A. Axial FLAIR MRI shows an infiltrative left frontal lobe
white matter mass with extensive perifocal edema. B. Axial T1 image after contrast
administration demonstrates a well-defined solid tumor with inhomogeneous
contrast enhancement and perifocal edema. C. Axial gray scale diffusion tensor
map with ROIs placements for the determination of the FA values in definite areas:
the tumor [1], the perifocal edema [2], the distant normal-appearing white matter
[3] and the contralateral normal-appearing white matter [4]. D. Color coded FA
map demonstrates gradual reduction of FA values in the direction from the
periphery to the tumor. Regions of high anisotropy are shown in red, and regions
of low anisotropy are shown in blue. E. The location of the MRS volume of interest
in the brain is outlined by a white square. ROIs for the calculation of the
metabolite ratios were placed in identical localizations. F. Typical MRS spectrum
of the tumor from the ROI [1] with an elevated LL peak, reduced NAA peak. G.
MRS spectrum in the perifocal edema from the ROI [2] displays reduced NAA
peak and gradually reduced LL peak in comparison with tumor. H. MR spectrum
in the contralateral normal-appearing white matter [4] shows high NAA peak. The
LL peak is not visible. (Images from the author's archive)
Comparing data in paired samples between tumor and perifocal
edema, statistically significant differences were observed between the Cho/Cr
mean values (p<0.001, Wilcoxon test), between the NAA/Cr mean values
(p=0.009, t–test), between the LL/Cr mean values (p<0.001, t–test), but MI/Cr
did not show statistically significant difference (p=0.647, Wilcoxon test).
Comparing data in paired samples between tumor and distant normal-
appearing white matter, statistically significant differences were observed
between the Cho/Cr mean values (p<0.001, Wilcoxon test), between the
NAA/Cr mean values (p<0.001, t–test), between the MI/Cr mean values
(p<0.001, Wilcoxon test), between the LL/Cr mean values (p<0.001, Wilcoxon
test).
Comparing data between tumor and contralateral normal-appearing
white matter, statistically significant differences were observed between the
Cho/Cr mean values (p<0.001, Wilcoxon test), between the NAA/Cr mean
values (p<0.001, Wilcoxon test), between the MI/Cr mean values (p<0.001,
Wilcoxon test), between the LL/Cr mean values (p<0.001, t–test).
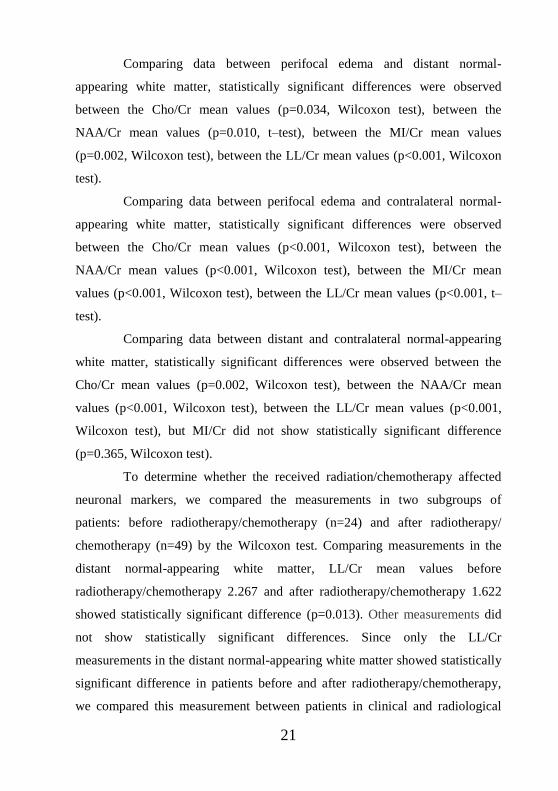
21
Comparing data between perifocal edema and distant normal-
appearing white matter, statistically significant differences were observed
between the Cho/Cr mean values (p=0.034, Wilcoxon test), between the
NAA/Cr mean values (p=0.010, t–test), between the MI/Cr mean values
(p=0.002, Wilcoxon test), between the LL/Cr mean values (p<0.001, Wilcoxon
test).
Comparing data between perifocal edema and contralateral normal-
appearing white matter, statistically significant differences were observed
between the Cho/Cr mean values (p<0.001, Wilcoxon test), between the
NAA/Cr mean values (p<0.001, Wilcoxon test), between the MI/Cr mean
values (p<0.001, Wilcoxon test), between the LL/Cr mean values (p<0.001, t–
test).
Comparing data between distant and contralateral normal-appearing
white matter, statistically significant differences were observed between the
Cho/Cr mean values (p=0.002, Wilcoxon test), between the NAA/Cr mean
values (p<0.001, Wilcoxon test), between the LL/Cr mean values (p<0.001,
Wilcoxon test), but MI/Cr did not show statistically significant difference
(p=0.365, Wilcoxon test).
To determine whether the received radiation/chemotherapy affected
neuronal markers, we compared the measurements in two subgroups of
patients: before radiotherapy/chemotherapy (n=24) and after radiotherapy/
chemotherapy (n=49) by the Wilcoxon test. Comparing measurements in the
distant normal-appearing white matter, LL/Cr mean values before
radiotherapy/chemotherapy 2.267 and after radiotherapy/chemotherapy 1.622
showed statistically significant difference (p=0.013). Other measurements did
not show statistically significant differences. Since only the LL/Cr
measurements in the distant normal-appearing white matter showed statistically
significant difference in patients before and after radiotherapy/chemotherapy,
we compared this measurement between patients in clinical and radiological
22
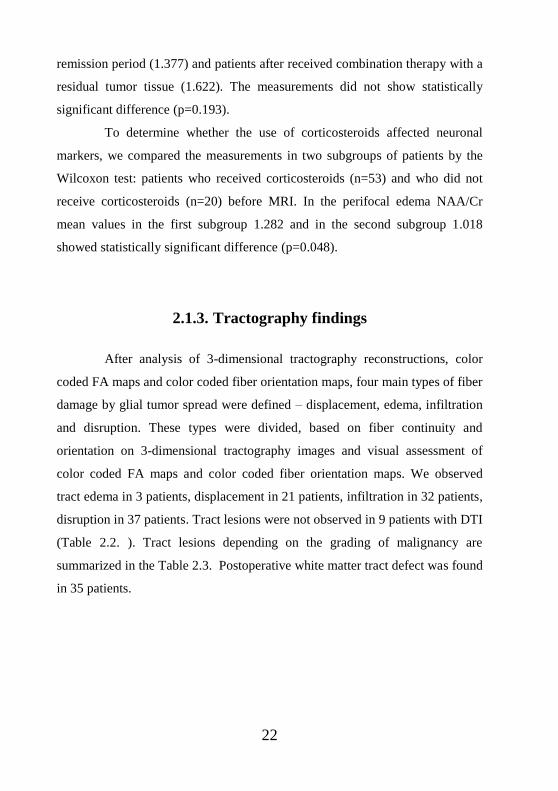
remission period (1.377) and patients after received combination therapy with a
residual tumor tissue (1.622). The measurements did not show statistically
significant difference (p=0.193).
To determine whether the use of corticosteroids affected neuronal
markers, we compared the measurements in two subgroups of patients by the
Wilcoxon test: patients who received corticosteroids (n=53) and who did not
receive corticosteroids (n=20) before MRI. In the perifocal edema NAA/Cr
mean values in the first subgroup 1.282 and in the second subgroup 1.018
showed statistically significant difference (p=0.048).
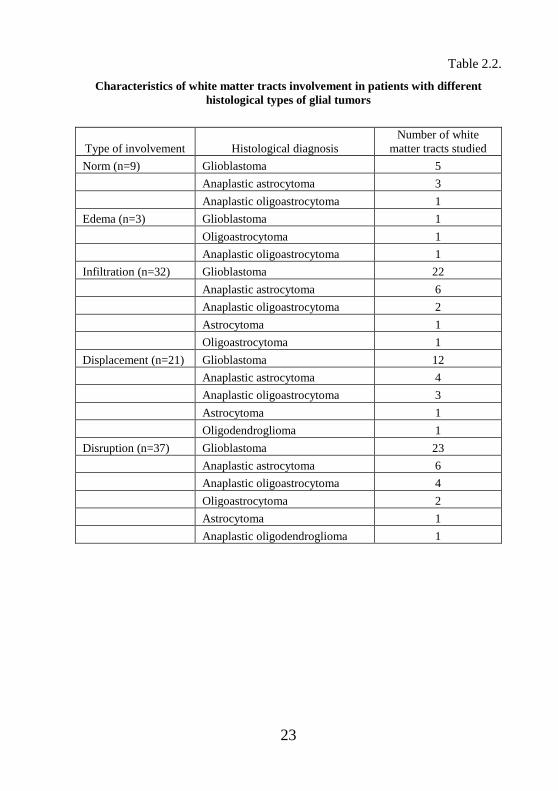
2.1.3. Tractography findings
After analysis of 3-dimensional tractography reconstructions, color
coded FA maps and color coded fiber orientation maps, four main types of fiber
damage by glial tumor spread were defined – displacement, edema, infiltration
and disruption. These types were divided, based on fiber continuity and
orientation on 3-dimensional tractography images and visual assessment of
color coded FA maps and color coded fiber orientation maps. We observed
tract edema in 3 patients, displacement in 21 patients, infiltration in 32 patients,
disruption in 37 patients. Tract lesions were not observed in 9 patients with DTI
(Table 2.2. ). Tract lesions depending on the grading of malignancy are
summarized in the Table 2.3. Postoperative white matter tract defect was found
in 35 patients.
23
Table 2.2.
Characteristics of white matter tracts involvement in patients with different
histological types of glial tumors
Type of involvement Histological diagnosis
Number of white
matter tracts studied
Norm (n=9) Glioblastoma 5
Anaplastic astrocytoma 3
Anaplastic oligoastrocytoma 1
Edema (n=3) Glioblastoma 1
Oligoastrocytoma 1
Anaplastic oligoastrocytoma 1
Infiltration (n=32) Glioblastoma 22
Anaplastic astrocytoma 6
Anaplastic oligoastrocytoma 2
Astrocytoma 1
Oligoastrocytoma 1
Displacement (n=21) Glioblastoma 12
Anaplastic astrocytoma 4
Anaplastic oligoastrocytoma 3
Astrocytoma 1
Oligodendroglioma 1
Disruption (n=37) Glioblastoma 23
Anaplastic astrocytoma 6
Anaplastic oligoastrocytoma 4
Oligoastrocytoma 2
Astrocytoma 1
Anaplastic oligodendroglioma 1
24
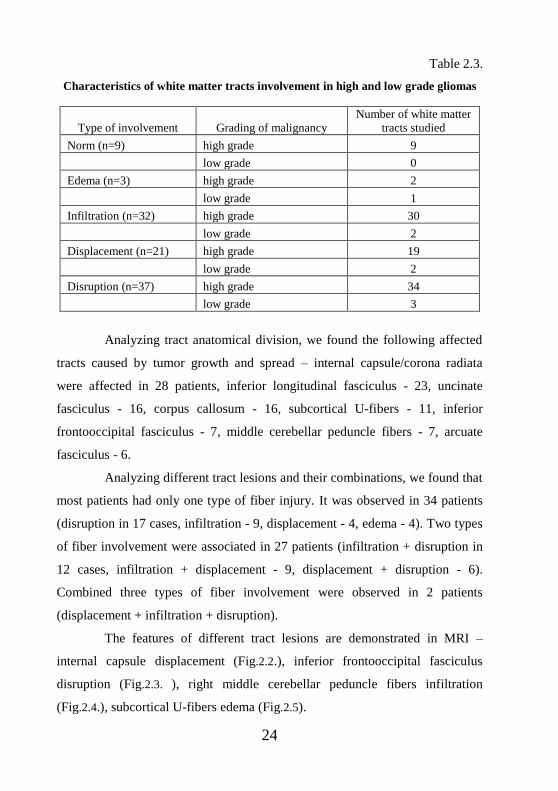
Table 2.3.
Characteristics of white matter tracts involvement in high and low grade gliomas
Type of involvement Grading of malignancy
Number of white matter
tracts studied
Norm (n=9) high grade 9
low grade 0
Edema (n=3) high grade 2
low grade 1
Infiltration (n=32) high grade 30
low grade 2
Displacement (n=21) high grade 19
low grade 2
Disruption (n=37) high grade 34
low grade 3
Analyzing tract anatomical division, we found the following affected
tracts caused by tumor growth and spread – internal capsule/corona radiata
were affected in 28 patients, inferior longitudinal fasciculus - 23, uncinate
fasciculus - 16, corpus callosum - 16, subcortical U-fibers - 11, inferior
frontooccipital fasciculus - 7, middle cerebellar peduncle fibers - 7, arcuate
fasciculus - 6.
Analyzing different tract lesions and their combinations, we found that
most patients had only one type of fiber injury. It was observed in 34 patients
(disruption in 17 cases, infiltration - 9, displacement - 4, edema - 4). Two types
of fiber involvement were associated in 27 patients (infiltration + disruption in
12 cases, infiltration + displacement - 9, displacement + disruption - 6).
Combined three types of fiber involvement were observed in 2 patients
(displacement + infiltration + disruption).
The features of different tract lesions are demonstrated in MRI –
internal capsule displacement (Fig.2.2.), inferior frontooccipital fasciculus
disruption (Fig.2.3. ), right middle cerebellar peduncle fibers infiltration
(Fig.2.4.), subcortical U-fibers edema (Fig.2.5).
25
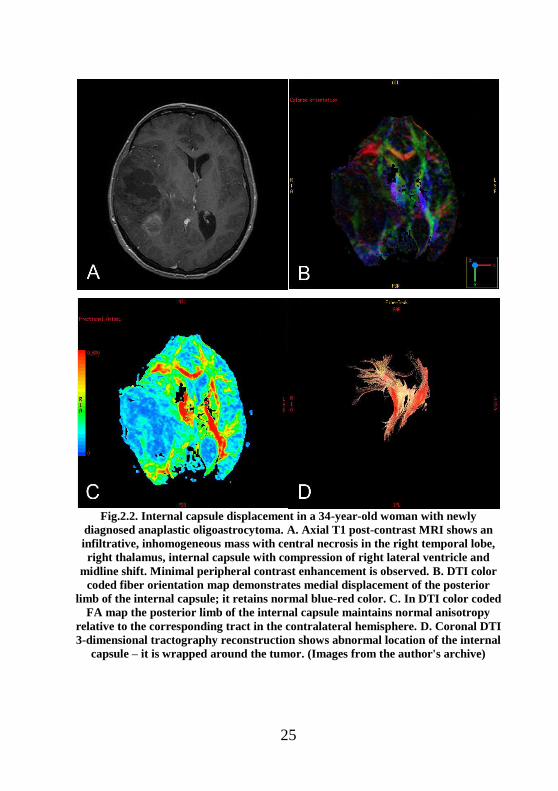
Fig.2.2. Internal capsule displacement in a 34-year-old woman with newly
diagnosed anaplastic oligoastrocytoma. A. Axial T1 post-contrast MRI shows an
infiltrative, inhomogeneous mass with central necrosis in the right temporal lobe,
right thalamus, internal capsule with compression of right lateral ventricle and
midline shift. Minimal peripheral contrast enhancement is observed. B. DTI color
coded fiber orientation map demonstrates medial displacement of the posterior
limb of the internal capsule; it retains normal blue-red color. C. In DTI color coded
FA map the posterior limb of the internal capsule maintains normal anisotropy
relative to the corresponding tract in the contralateral hemisphere. D. Coronal DTI
3-dimensional tractography reconstruction shows abnormal location of the internal
capsule – it is wrapped around the tumor. (Images from the author's archive)
26
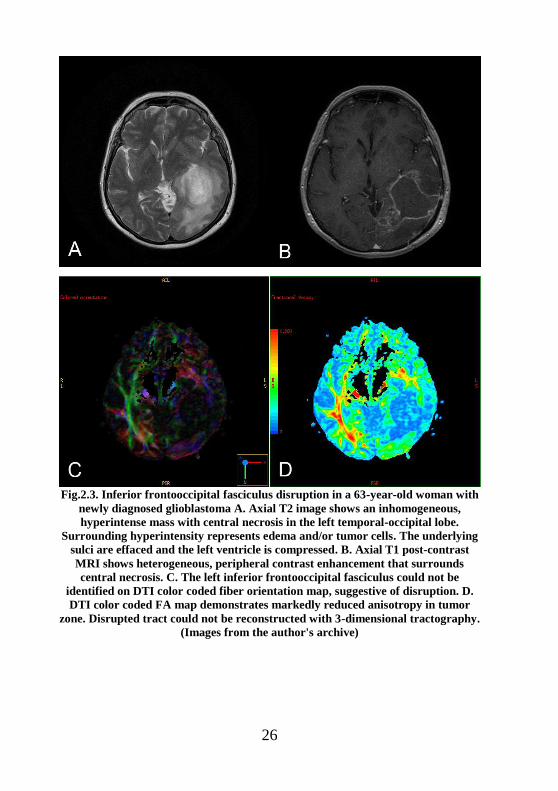
Fig.2.3. Inferior frontooccipital fasciculus disruption in a 63-year-old woman with
newly diagnosed glioblastoma A. Axial T2 image shows an inhomogeneous,
hyperintense mass with central necrosis in the left temporal-occipital lobe.
Surrounding hyperintensity represents edema and/or tumor cells. The underlying
sulci are effaced and the left ventricle is compressed. B. Axial T1 post-contrast
MRI shows heterogeneous, peripheral contrast enhancement that surrounds
central necrosis. C. The left inferior frontooccipital fasciculus could not be
identified on DTI color coded fiber orientation map, suggestive of disruption. D.
DTI color coded FA map demonstrates markedly reduced anisotropy in tumor
zone. Disrupted tract could not be reconstructed with 3-dimensional tractography.
(Images from the author's archive)
27
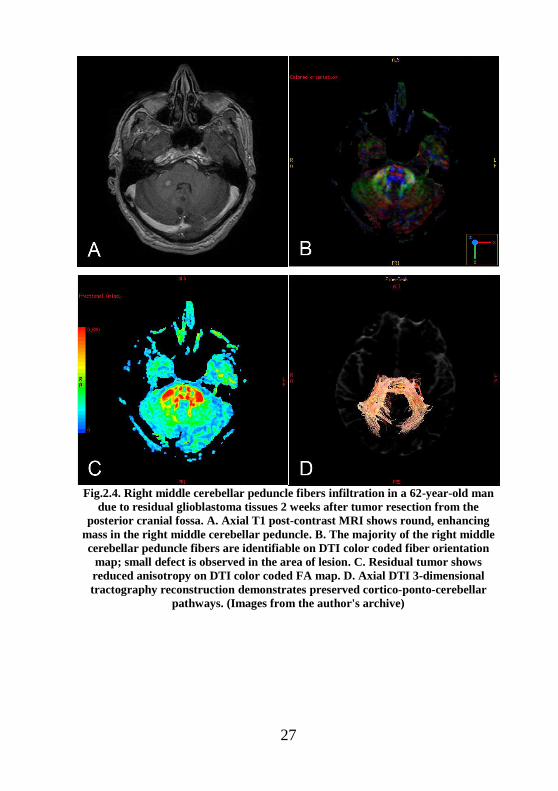
Fig.2.4. Right middle cerebellar peduncle fibers infiltration in a 62-year-old man
due to residual glioblastoma tissues 2 weeks after tumor resection from the
posterior cranial fossa. A. Axial T1 post-contrast MRI shows round, enhancing
mass in the right middle cerebellar peduncle. B. The majority of the right middle
cerebellar peduncle fibers are identifiable on DTI color coded fiber orientation
map; small defect is observed in the area of lesion. C. Residual tumor shows
reduced anisotropy on DTI color coded FA map. D. Axial DTI 3-dimensional
tractography reconstruction demonstrates preserved cortico-ponto-cerebellar
pathways. (Images from the author's archive)
28
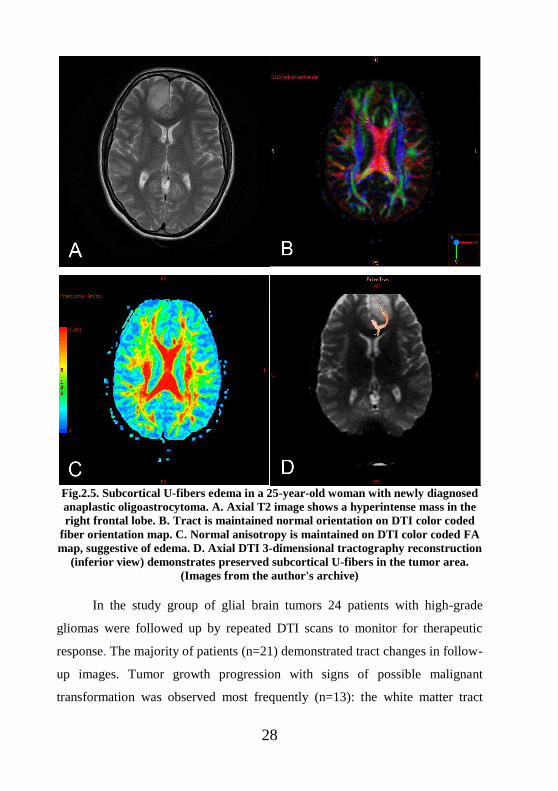
Fig.2.5. Subcortical U-fibers edema in a 25-year-old woman with newly diagnosed
anaplastic oligoastrocytoma. A. Axial T2 image shows a hyperintense mass in the
right frontal lobe. B. Tract is maintained normal orientation on DTI color coded
fiber orientation map. C. Normal anisotropy is maintained on DTI color coded FA
map, suggestive of edema. D. Axial DTI 3-dimensional tractography reconstruction
(inferior view) demonstrates preserved subcortical U-fibers in the tumor area.
(Images from the author's archive)
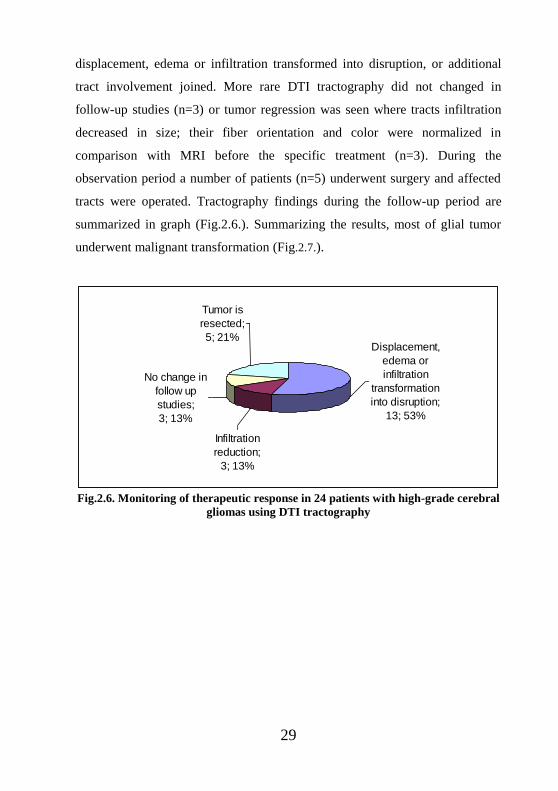
In the study group of glial brain tumors 24 patients with high-grade
gliomas were followed up by repeated DTI scans to monitor for therapeutic
response. The majority of patients (n=21) demonstrated tract changes in follow-
up images. Tumor growth progression with signs of possible malignant
transformation was observed most frequently (n=13): the white matter tract
29
displacement, edema or infiltration transformed into disruption, or additional
tract involvement joined. More rare DTI tractography did not changed in
follow-up studies (n=3) or tumor regression was seen where tracts infiltration
decreased in size; their fiber orientation and color were normalized in
comparison with MRI before the specific treatment (n=3). During the
observation period a number of patients (n=5) underwent surgery and affected
tracts were operated. Tractography findings during the follow-up period are
summarized in graph (Fig.2.6.). Summarizing the results, most of glial tumor
underwent malignant transformation (Fig.2.7.).
Displacement,
edema or
infiltration
transformation
into disruption;
13; 53%
Infiltration
reduction;
3; 13%
No change in
follow up
studies;
3; 13%
Tumor is
resected;
5; 21%
Fig.2.6. Monitoring of therapeutic response in 24 patients with high-grade cerebral
gliomas using DTI tractography
30
31
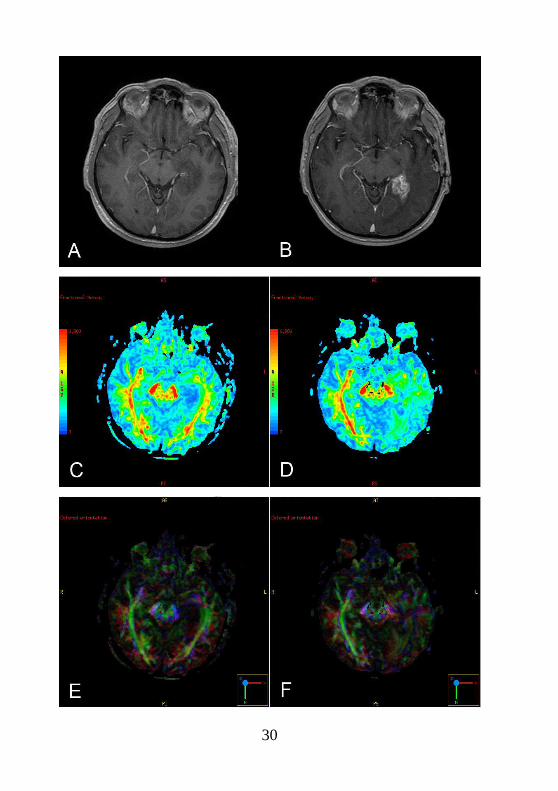
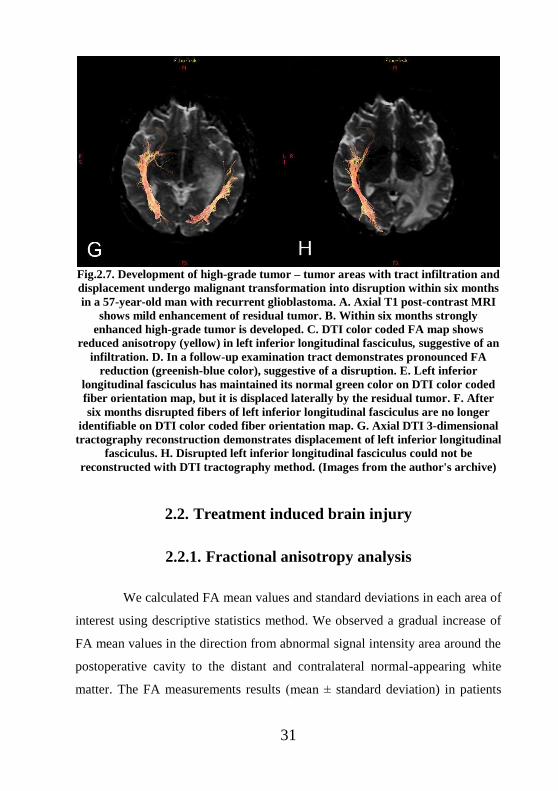
Fig.2.7. Development of high-grade tumor – tumor areas with tract infiltration and
displacement undergo malignant transformation into disruption within six months
in a 57-year-old man with recurrent glioblastoma. A. Axial T1 post-contrast MRI
shows mild enhancement of residual tumor. B. Within six months strongly
enhanced high-grade tumor is developed. C. DTI color coded FA map shows
reduced anisotropy (yellow) in left inferior longitudinal fasciculus, suggestive of an
infiltration. D. In a follow-up examination tract demonstrates pronounced FA
reduction (greenish-blue color), suggestive of a disruption. E. Left inferior
longitudinal fasciculus has maintained its normal green color on DTI color coded
fiber orientation map, but it is displaced laterally by the residual tumor. F. After
six months disrupted fibers of left inferior longitudinal fasciculus are no longer
identifiable on DTI color coded fiber orientation map. G. Axial DTI 3-dimensional
tractography reconstruction demonstrates displacement of left inferior longitudinal
fasciculus. H. Disrupted left inferior longitudinal fasciculus could not be
reconstructed with DTI tractography method. (Images from the author's archive)
2.2. Treatment induced brain injury
2.2.1. Fractional anisotropy analysis
We calculated FA mean values and standard deviations in each area of
interest using descriptive statistics method. We observed a gradual increase of
FA mean values in the direction from abnormal signal intensity area around the
postoperative cavity to the distant and contralateral normal-appearing white
matter. The FA measurements results (mean ± standard deviation) in patients
32
with treatment induced injury: in the abnormal signal intensity area around the
postoperative cavity 0.185(±0.065); in the distant normal-appearing white
matter 0.431(±0.058); in the contralateral white matter 0.446(±0.049).
Using a nonparametric related sample Wilcoxon signed rank test we
observed statistically significant differences in FA measurements between
treatment induced injury zone and distant normal-appearing white matter
(p<0.001), between distant and contralateral normal-appearing white matter
(p<0.001). Using a paired samples t-test, we observed statistically significant
differences in FA measurements between treatment induced injury zone and
contralateral normal-appearing white matter (p<0.001).
2.2.2. Metabolite ratio analysis
We calculated mean values and standard deviations of Cho/Cr,
NAA/Cr, MI/Cr, LL/Cr ratios in each area of interest using descriptive statistics
method. The results of metabolite measurements are displayed in the Table 2.4.
Table 2.4.
The metabolite measurements results (mean ± standard deviation) in patients with treatment induced injury
The
metabolite
ratios
Abnormal signal intensity
area around the
postoperative cavity
Distant normal-
appearing white
matter
Contralateral
normal-appearing
white matter
Cho/Cr 1.355(±0.606) 1.193(±0.418) 1.061(±0.432)
NAA/Cr 1.153(±0.507) 1.890(±0.705) 2.272(±0.725)
MI/Cr 0.607(±0.362) 0.452(±0.230) 0.383(±0.235)
LL/Cr 2.304(±1.213) 1.377(±0.556) 1.217(±0.353)
There were gradual reduction of Cho/Cr, MI/Cr, LL/Cr mean ratios
and gradual increase of NAA/Cr mean values in the direction from the
33
abnormal signal intensity area around the postoperative cavity to the distant and
contralateral normal-appearing white matter.
Using a nonparametric related sample Wilcoxon signed rank test we
observed statistically significant differences in Cho/Cr measurements between
treatment induced injury zone and distant normal-appearing white matter
(p=0.023), between distant and contralateral white matter (p=0.044).
Statistically significant differences in NAA/Cr measurements were observed
between treatment induced injury zone and distant normal-appearing white
matter (p<0.001), between treatment induced injury zone and contralateral
white matter (p<0.001), between distant and contralateral white matter
(p<0.001); in MI/Cr measurements were observed between treatment induced
injury zone and distant white matter (p<0.001), between treatment induced
injury zone and contralateral white matter (p<0.001), between distant and
contralateral white matter (p=0.035); in LL/Cr measurements were observed
between treatment induced injury zone and distant white matter (p<0.001),
between treatment induced injury zone and contralateral white matter
(p<0.001). LL/Cr measurements did not show statistically significant difference
between distant and contralateral white matter (p=0.054). Using t-test, we
observed statistically significant differences in Cho/Cr measurements between
treatment induced injury zone and contralateral white matter (p=0.001).
2.2.3. Tractography findings
Two main types of treatment induced white matter injury were
determined using 3-dimensional tractography reconstructions, color coded FA
maps and color coded fiber orientation maps - post-surgical fiber defect
(Fig.2.8.) and radiation/chemotherapy related demyelination destruction
(Fig.2.9.).
34
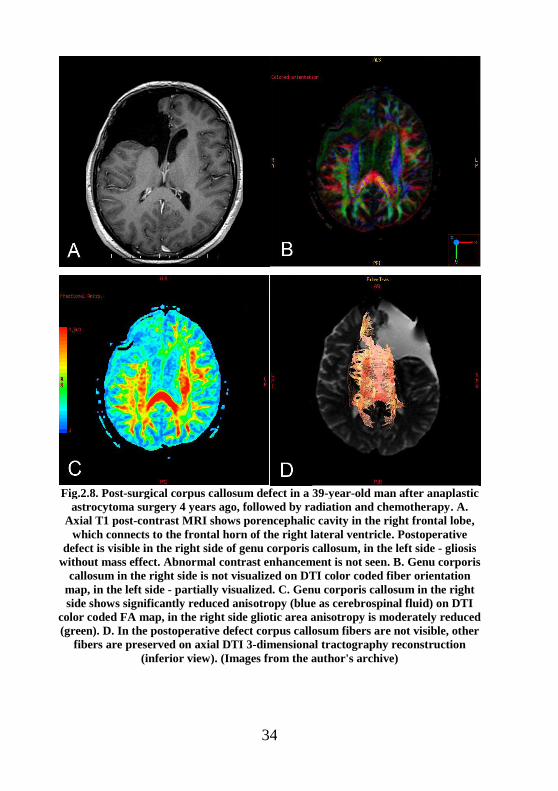
Fig.2.8. Post-surgical corpus callosum defect in a 39-year-old man after anaplastic
astrocytoma surgery 4 years ago, followed by radiation and chemotherapy. A.
Axial T1 post-contrast MRI shows porencephalic cavity in the right frontal lobe,
which connects to the frontal horn of the right lateral ventricle. Postoperative
defect is visible in the right side of genu corporis callosum, in the left side - gliosis
without mass effect. Abnormal contrast enhancement is not seen. B. Genu corporis
callosum in the right side is not visualized on DTI color coded fiber orientation
map, in the left side - partially visualized. C. Genu corporis callosum in the right
side shows significantly reduced anisotropy (blue as cerebrospinal fluid) on DTI
color coded FA map, in the right side gliotic area anisotropy is moderately reduced
(green). D. In the postoperative defect corpus callosum fibers are not visible, other
fibers are preserved on axial DTI 3-dimensional tractography reconstruction
(inferior view). (Images from the author's archive)
35
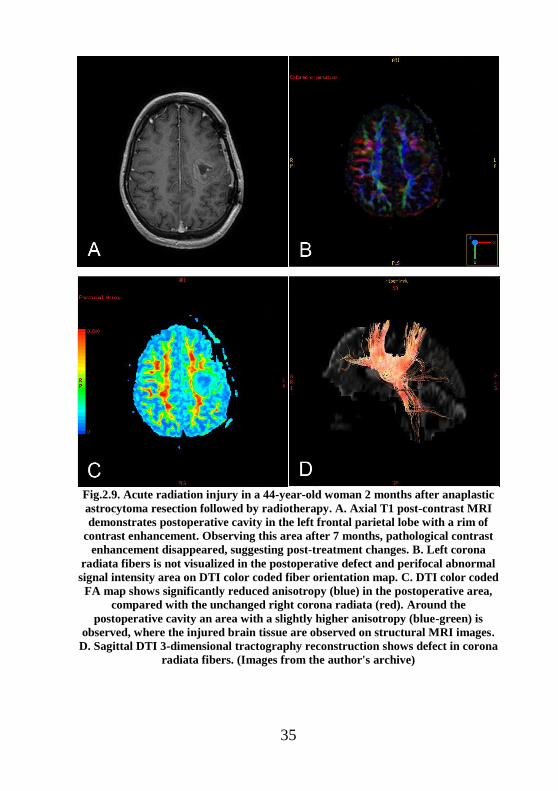
Fig.2.9. Acute radiation injury in a 44-year-old woman 2 months after anaplastic
astrocytoma resection followed by radiotherapy. A. Axial T1 post-contrast MRI
demonstrates postoperative cavity in the left frontal parietal lobe with a rim of
contrast enhancement. Observing this area after 7 months, pathological contrast
enhancement disappeared, suggesting post-treatment changes. B. Left corona
radiata fibers is not visualized in the postoperative defect and perifocal abnormal
signal intensity area on DTI color coded fiber orientation map. C. DTI color coded
FA map shows significantly reduced anisotropy (blue) in the postoperative area,
compared with the unchanged right corona radiata (red). Around the
postoperative cavity an area with a slightly higher anisotropy (blue-green) is
observed, where the injured brain tissue are observed on structural MRI images.
D. Sagittal DTI 3-dimensional tractography reconstruction shows defect in corona
radiata fibers. (Images from the author's archive)
36
In our study postoperative white matter tract defect was found in 71
patients, radiation/chemotherapy induced demyelination destruction in 40
patients (in 33 patients - only postoperative defect, in 2 patients - only
demyelination destruction, in 38 patients - both types of fiber injury).
Demyelination or gliosis around the postoperative cavity on T2 and FLAIR
images were observed in all cases of varying degrees. Destruction of myelin
fibers were found in 40 patients (55%) on DTI images, while in the remaining
33 patients (45%) the fibers were not affected, despite the changes on structural
conventional MRI.
Analyzing tract anatomical division, we found following white matter
tract lesions after treatment – in 46 patients subcortical U-fibers were affected,
38 internal capsule/corona radiata, 9 inferior longitudinal fasciculus, 3 uncinate
fasciculus, 3 corpus callosum, 1 inferior frontooccipital fasciculus and 1 middle
cerebellar peduncle fibers.
Postoperative fiber injury was mostly diagnosed in association and
projection fibers. Postoperative defect of commissural fibers was observed in
only two cases.
In this study group, 16 patients in remission were observed during
follow-up period, by repeated MRI scans. In 14 cases tractography findings
were not changed (control MRI was performed within 3-19 months). White
matter destruction had progressed only in 2 cases (in 5 and 7 months).
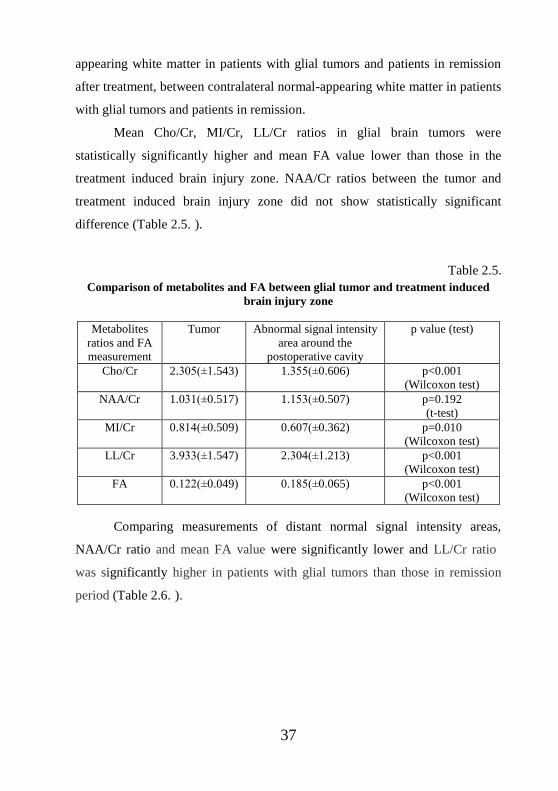
2.3. Comparison of metabolites and FA between patients with
glial tumors and treatment induced brain injury
Using nonparametric Wilcoxon test or t-test (depending on the data
distribution), mean metabolites ratios and FA values were compared between
tumor and treatment induced brain injury zone, between distant normal-
37
appearing white matter in patients with glial tumors and patients in remission
after treatment, between contralateral normal-appearing white matter in patients
with glial tumors and patients in remission.
Mean Cho/Cr, MI/Cr, LL/Cr ratios in glial brain tumors were
statistically significantly higher and mean FA value lower than those in the
treatment induced brain injury zone. NAA/Cr ratios between the tumor and
treatment induced brain injury zone did not show statistically significant
difference (Table 2.5. ).
Table 2.5.
Comparison of metabolites and FA between glial tumor and treatment induced
brain injury zone
Metabolites
ratios and FA
measurement
Tumor Abnormal signal intensity
area around the
postoperative cavity
p value (test)
Cho/Cr 2.305(±1.543) 1.355(±0.606) p<0.001
(Wilcoxon test)
NAA/Cr 1.031(±0.517) 1.153(±0.507) p=0.192
(t-test)
MI/Cr 0.814(±0.509) 0.607(±0.362) p=0.010
(Wilcoxon test)
LL/Cr 3.933(±1.547) 2.304(±1.213) p<0.001
(Wilcoxon test)
FA 0.122(±0.049) 0.185(±0.065) p<0.001
(Wilcoxon test)
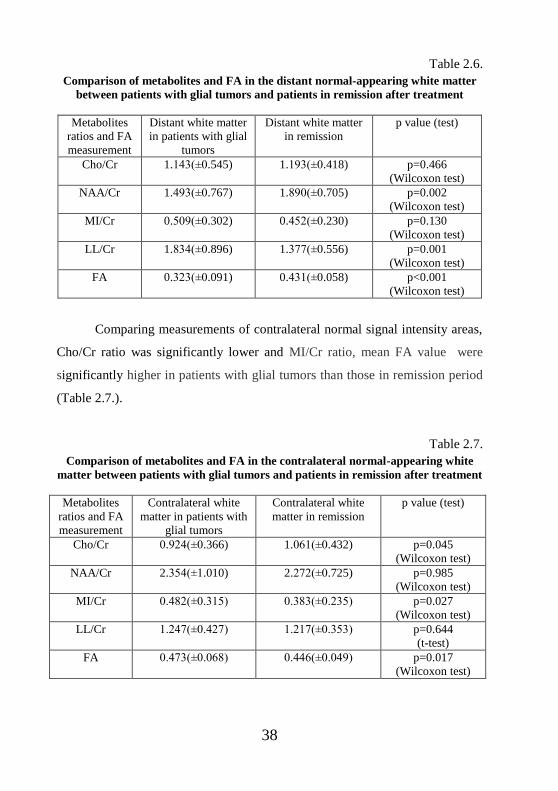
Comparing measurements of distant normal signal intensity areas,
NAA/Cr ratio and mean FA value were significantly lower and LL/Cr ratio
was significantly higher in patients with glial tumors than those in remission
period (Table 2.6. ).
38
Table 2.6.
Comparison of metabolites and FA in the distant normal-appearing white matter
between patients with glial tumors and patients in remission after treatment
Metabolites
ratios and FA
measurement
Distant white matter
in patients with glial
tumors
Distant white matter
in remission
p value (test)
Cho/Cr 1.143(±0.545) 1.193(±0.418) p=0.466
(Wilcoxon test)
NAA/Cr 1.493(±0.767) 1.890(±0.705) p=0.002
(Wilcoxon test)
MI/Cr 0.509(±0.302) 0.452(±0.230) p=0.130
(Wilcoxon test)
LL/Cr 1.834(±0.896) 1.377(±0.556) p=0.001
(Wilcoxon test)
FA 0.323(±0.091) 0.431(±0.058) p<0.001
(Wilcoxon test)
Comparing measurements of contralateral normal signal intensity areas,
Cho/Cr ratio was significantly lower and MI/Cr ratio, mean FA value were
significantly higher in patients with glial tumors than those in remission period
(Table 2.7.).
Table 2.7.
Comparison of metabolites and FA in the contralateral normal-appearing white
matter between patients with glial tumors and patients in remission after treatment
Metabolites
ratios and FA
measurement
Contralateral white
matter in patients with
glial tumors
Contralateral white
matter in remission
p value (test)
Cho/Cr 0.924(±0.366) 1.061(±0.432) p=0.045
(Wilcoxon test)
NAA/Cr 2.354(±1.010) 2.272(±0.725) p=0.985
(Wilcoxon test)
MI/Cr 0.482(±0.315) 0.383(±0.235) p=0.027
(Wilcoxon test)
LL/Cr 1.247(±0.427) 1.217(±0.353) p=0.644
(t-test)
FA 0.473(±0.068) 0.446(±0.049) p=0.017
(Wilcoxon test)
39
2.4. Analysis of diagnostic test accuracy
2.4.1. Repeatability of MRS and DTI measurements
To perform the repeatability analysis of DTI and MRS quantitative
measurements, 20 patients with glial tumors were selected. The metabolite
ratios (Cho/Cr, NAA/Cr, LL/Cr, MI/Cr) and FA measurements were repeatedly
measured using the identical methodology – ROIs were placed on the tumor,
zone of perifocal edema, the distant and the contralateral normal-appearing
white matter. Overall, 398 repeated measurements were made.
Analyzing repeated measurements in 20 patients, statistically
significant differences were not observed in the tumor between Cho/Cr
measurements (p=0.180, Wilcoxon test), NAA/Cr measurements (p=0.081, t-
test), MI/Cr measurements (p=0.789, t-test), FA measurements (p=0.671, t-
test); in the he perifocal edema between Cho/Cr measurements (p=0.273,
Wilcoxon test), MI/Cr measurements (p=0.285, Wilcoxon test), LL/Cr
measurements (p=0.347, t-test), FA measurements (p=0.755, t-test); in the
distant normal-appearing white matter between NAA/Cr measurements
(p=0.500, Wilcoxon test), MI/Cr measurements (p=0.686, Wilcoxon test),
LL/Cr measurements (p=0.528, t-test), FA measurements (p=0.563, t-test); in
the contralateral normal-appearing white matter between Cho/Cr measurements
(p=0.577, t-test), LL/Cr measurements (p=0.093, Wilcoxon test).
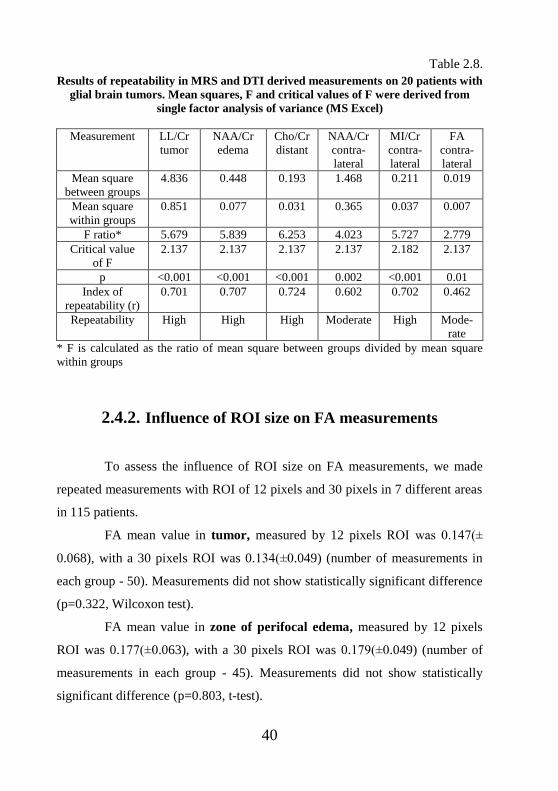
In six cases, repeated measurements were statistically significantly
different, so the repeatability index r was measured. Table 2.8. shows summary
of the repeatability index analysis for repeated measurements of MRS and DTI
derived measures.
40
Table 2.8.
Results of repeatability in MRS and DTI derived measurements on 20 patients with
glial brain tumors. Mean squares, F and critical values of F were derived from
single factor analysis of variance (MS Excel)
Measurement LL/Cr
tumor
NAA/Cr
edema
Cho/Cr
distant
NAA/Cr
contra-
lateral
MI/Cr
contra-
lateral
FA
contra-
lateral
Mean square
between groups
4.836 0.448 0.193 1.468 0.211 0.019
Mean square
within groups
0.851 0.077 0.031 0.365 0.037 0.007
F ratio* 5.679 5.839 6.253 4.023 5.727 2.779
Critical value
of F
2.137 2.137 2.137 2.137 2.182 2.137
p <0.001 <0.001 <0.001 0.002 <0.001 0.01
Index of
repeatability (r)
0.701 0.707 0.724 0.602 0.702 0.462
Repeatability High High High Moderate High Mode-
rate
* F is calculated as the ratio of mean square between groups divided by mean square
within groups
2.4.2. Influence of ROI size on FA measurements
To assess the influence of ROI size on FA measurements, we made
repeated measurements with ROI of 12 pixels and 30 pixels in 7 different areas
in 115 patients.
FA mean value in tumor, measured by 12 pixels ROI was 0.147(±
0.068), with a 30 pixels ROI was 0.134(±0.049) (number of measurements in
each group - 50). Measurements did not show statistically significant difference
(p=0.322, Wilcoxon test).
FA mean value in zone of perifocal edema, measured by 12 pixels
ROI was 0.177(±0.063), with a 30 pixels ROI was 0.179(±0.049) (number of
measurements in each group - 45). Measurements did not show statistically
significant difference (p=0.803, t-test).
41
FA mean value in abnormal signal intensity area around the
postoperative cavity, measured by 12 pixels ROI was 0.177(±0.098), with a 30
pixels ROI was 0.182(±0.066) (number of measurements in each group - 65).
Measurements did not show statistically significant difference (p=0.133,
Wilcoxon test).
FA mean value in the distant normal-appearing white matter
around the postoperative cavity, measured by 12 pixels ROI was
0.464(±0.113), with a 30 pixels ROI was 0.432(±0.051) (number of
measurements in each group - 65). Statistically significant differences were
observed between the both groups (p=0.018, Wilcoxon test).
FA mean value in the distant normal-appearing white matter on
patients with glial brain tumor, measured by 12 pixels ROI was
0.442(±0.096), with a 30 pixels ROI was 0.333(±0.099) (number of
measurements in each group - 50). Statistically significant differences were
observed between the both groups (p<0.001, t-test).
FA mean value in the contralateral normal-appearing white matter
on patients in remission period, measured by 12 pixels ROI was
0.532(±0.077), with a 30 pixels ROI was 0.442(±0.047) (number of
measurements in each group - 65). Statistically significant differences were
observed between the both groups (p<0.001, t-test).
FA mean value in the contralateral normal-appearing white matter
on patients with glial brain tumor, measured by 12 pixels ROI was
0.524(±0.0643), with a 30 pixels ROI was 0.473(±0.074) (number of
measurements in each group - 50). Statistically significant differences were
observed between the both groups (p<0.001, t-test).
42
3. CONCLUSIONS
1. MRS and DTI quantitative measurements in glioma peritumoral area
revealed pathological changes, despite the normal signal intensity on
structural MRI.
2. MRS and DTI in combination with structural MRI examination sequences
enhance vital glial tumor cells areas and possible infiltration border.
3. Increased LL/Cr ratios and decreased FA values have superior implications
in detecting glial tumors extent along the white matter tracts. NAA/Cr
reduction and Cho/Cr increase may provide additional diagnostic value.
4. LL/Cr ratio in distal normal signal intensity area could be used as
radiation/chemotherapy effectiveness criteria, as this will reduce after the
received treatment and in remission stage.
5. Using a combination of structural MRI, DTI color coded FA maps, color
coded fiber orientation maps and tractography method, it is possible to
distinguish between different white matter tract lesions, to consider the
possible malignant transformation of gliomas and evaluate the treatment
effect.
43
4. PRACTICAL RECOMMENDATIONS
The measurement results must be accurate, repeatable, so they can be
used for follow-up in determining the distribution of glial tumors and
evaluating the results of treatment and disease progression. We consider several
conditions relevant when performing MRS and DTI measurements from the
different zones of pathological and normal brain tissues in clinical practice.
First, select the appropriate slice for MRS examination; it must include the
tumor, the perifocal edema area, as well as the distant and the contralateral
normal white matter. Second, the MRS plane must be consistent with the DTI
selected image slice for FA measurements. Third, choose the same plane in
repeated MRI scans for follow-up dynamics after the treatment. Fourth, the
selected ROIs for both MRS and DTI measurements must be localized in the
identical areas. Fifth, one must be very accurate when conducting
measurements in the normal contralateral cerebral hemisphere – it is
recommended to use DTI color coded FA maps for ROI selection, which
visualize the areas of white matter with different fiber connectivity.
Comparative measurements must be done in the areas of normal white matter
with similar FA values. Sixth, an accurate methodology and multimodal
approach should be used to reconstruct tracts – combining structural MRI with
DTI color coded FA maps, color coded fiber orientation maps and 3-
dimensional tractography method. Seventh, the repeated measurements should
be performed by one experienced neuroradiologist to avoid errors due to the
subjective interpretation.
44
5. PUBLICATIONS AND PRESENTATIONS ON
RESEARCH THEME
Publications (scientific articles) on research theme:
1. Anvita Bieza, Gaida Krumina, Daina Apskalne, Oskars Rasnacs. Magnetic
resonance spectroscopy for evaluation of brain glioma extent. Acta
Chirurgica Latviensis 2011;11:50-55.
2. Anvita Bieza, Gaida Krumina. Magnetic resonance tractography in follow-
up of glial tumors. Collection of Scientific papers 2010. Research articles
in medicine & pharmacy 2011;106-114.
3. Anvita Bieza, Gaida Krumina. Magnetic resonance study on fractional
anisotropy and neuronal metabolites ratios in peritumoral area of cerebral
gliomas. Medicina (Kaunas) 2012;48(10):497-506.
4. Anvita Bieza, Gaida Krumina. The value of magnetic resonance
spectroscopy and diffusion tensor imaging in characterization of gliomas
growth patterns and treatment efficiency. J. Biomedical Science and
Engineering 2013;6:518-526.
5. Anvita Bieza, Gaida Krumina. The value of magnetic resonance in
differentiation between brain glioma and treatment induced injury. Acta
Chirurgica Latviensis 2012;12:24-28.
Congress abstracts on research theme:
1. Anvita Bieza, Gaida Krumina. Usefulness of MR spectroscopy in
differentiation between recurrent/residual brain glioma and post-
therapeutic changes. ESMRMB 2012 Congress. October 4–6, Lisbon/PT.
Book of Abstracts. EPOS™ Poster / Paper Poster / Clinical Review Poster
/ Software Exhibits DOI: 10.1007/s10334-012-0324-9. EPOSTM
Poster
Nr.528. Pg.398-399.
45
2. Anvita Bieza, Gaida Krumina. Functional magnetic resonance imaging in
differentiation between glial brain tumor recurrence and treatment effects.
Riga Stradins University 2012 Scientific Conference. Abstracts, pg.256.
3. Anvita Bieza, Gaida Krumina. Relationship between white matter tract
changes and neurological status during treatment and surveillance of glial
brain tumors. ESMRMB 2011 Congress. October 6-8, Leipzig/DE. Book
of Abstracts. EPOSTM
Posters / Paper Posters / Clinical Review Posters /
Software Exhibits. DOI: 10.1007/s10334-001-0268-5. EPOSTM
Poster
Nr.407. Pg.289.
4. Anvita Bieza, Gaida Krumina. Brain tractography changes after glial tumor
treatment. Riga Stradins University 2011 Scientific Conference. Abstracts,
pg.280.
5. A.Bieza, G.Krumina. Structural changes of association, projection and
commissural fibers after radiation therapy in patients with glial tumors.
Electronic Presentation Online System (EPOS TM) of the European
Society of radiology. www.myyESR.org/epos, DOI: 10.1594/ecr2011/C-
0644
6. Anvita Bieza, Gaida Krumina. Magnetic resonance tractography in the
diagnosis of cerebral gliomas. Riga Stradins University 2010 Scientific
Conference. Abstracts, pg. 247.
Presentations on research theme:
1. 13.12.2012. oral report - Anvita Bieza „MRS and DTI role in
characteristics of glioma growth type and treatment effects. The main
results of the doctoral thesis”, meeting of the Latvian Association of
Neuroradiology.
2. 04.10.2012. electronic poster - Anvita Bieza, Gaida Krumina „Usefulness
of MR spectroscopy in differentiation between recurrent/residual brain
46
glioma and post-therapeutic changes”, European Society for Magnetic
Resonance in Medicine and Biology Congress 2012, Lisbon/Portugal.
3. 30.03.2012. poster presentation - Anvita Bieza, Gaida Krumina
“Functional magnetic resonance imaging in differentiation between glial
brain tumor recurrence and treatment effects”, Riga Stradins University
2012 Scientific Conference.
4. 06.10.2011. electronic poster - Anvita Bieza, Gaida Krumina „Relationship
between white matter tract changes and neurological status during
treatment and surveillance of glial brain tumors", European Society for
Magnetic Resonance in Medicine and Biology Congress 2011, Leipzig,
Germany.
5. 15.04.2011. poster presentation - Anvita Bieza, Gaida Krumina “Brain
tractography changes after glial tumor treatment”, Riga Stradins University
2011 Scientific Conference.
6. 03.03.2011. electronic poster - A. Bieza, G. Krumina „Structural changes
of association, projection and commissural fibers after radiation therapy in
patients with glial tumors”, 23rd
European Congress of Radiology, Vienna,
Austria.
7. 19.03.2010. oral report - Anvita Bieza „Magnetic resonance tractography
in the diagnosis of cerebral gliomas”, Riga Stradins University 2010
Scientific Conference.
47
6. ACKNOWLEDGMENTS
I am very grateful to my scientific supervisor Professor Gaida
Krumina for insightful discussions and comments, for support in collecting the
study material.
Thanks to Professor Uldis Teibe, Oskars Rasnacs and Irena Rogovska
for help in statistical data analysis.
I thank Juris Novozilovs, Aigars Kiecis, Liga Maurisa, Dace Saule,
Ieva Berke, Irina Dovgopolika, Julija Pavaine for support in collecting the
study material.
I am deeply grateful to Daina Apskalne for the carefully conducted
morphological analyses and oral consultations.
I thank Laura Ziemane for technical assistance.
I wish to thank Janis Upmalis, Andris Norko, Anita Sterna, Sandra
Meskovska, Rita Gudele, and Irena Badovska for the responsiveness during
doctoral studies.
This study was supported by European Social Fund in Latvia (grant
number 2009/0147/1DP/1.1.2.1.2/09/IPIA/ VIAA/009).
48
7. LIST OF REFERENCES
1. Nelson SJ. Assessment of therapeutic response and treatment planning for
brain tumors using metabolic and physiological MRI. NMR Biomed
2011;24(6):734-49.
2. Wright AJ, Fellows G, Byrnes TJ, Opstad KS, McIntyre DJO, Griffiths JR,
Bell BA, Clark CA, Barrick TR, Howe FA. Pattern recognition of MRSI
data shows regions of glioma growth that agree with DTI markers of brain
tumor infiltration. Magn Reson Med 2009;62:1646–51.
3. Ricard D, Idbaih A, Ducray F, Lahutte M, Xuan KH, Delattre JY. Primary
brain tumours in adults. The Lancet 2012;379(9830):1984-96.
4. Wang W, Stewarda CE, Desmonda PM. Diffusion tensor imaging in
glioblastoma multiforme and brain metastases: the role of p, q, L, and
fractional anisotropy. Am J Neuroradiol 2009;30:203-8.
5. Yen PS, Teo BT, Chiu CH, Chen SC, Chiu TL, Su CF. White matter tract
involvement in brain tumors: a diffusion tensor imaging analysis. Surg
Neurol 2009;72:464–9.
6. Smith EA, Carlos RC, Junck LR, Tsien CI, Elias A, Sundgren PC.
Developing a clinical decision model: MR spectroscopy to differentiate
between recurrent tumor and radiation change in patients with new
contrast-enhancing lesions. Am J Roentgenol 2009;192(2):45-52.
7. Goebell E, Fiehler J, Ding XQ, Paustenbach S, Nietz S, Heese O, Kucinski
T, Hagel C, Westphal M, Zeumer H. Disarrangement of fiber tracts and
decline of neuronal density correlate in glioma patients – a combined
diffusion tensor imaging and 1H-MR spectroscopy study. Am J Neiroradiol
2006;27:1426-31.
8. Yamasaki F, Sugiyama K, Ohtaki M, Takeshima Y, Abe N, Akiyama Y,
Takaba J, Amatya VJ, Saito T, Kajiwara Y, Hanaya R, Kurisu K.
Glioblastoma treated with postoperative radio-chemotherapy: prognostic

49
value of apparent diffusion coefficient at MR imaging. Eur J Radiol
2010;73(3):532-7.
9. Yamasaki F, Kurisu K, Kajiwara Y, Watanabe Y, Takayasu T, Akiyama Y,
Saito T, Hanaya R, Suqiyama K. Magnetic resonance spectroscopic
detection of lactate is predictive of a poor prognosis in patients with diffuse
intrinsic pontine glioma. Neuro Oncol 2011;13(7):791-801.
10. Golby AJ, Kindlmann G, Norton I, Yarmarkovich A, Pieper S, Kikinis R.
Interactive diffusion tensor tractography visualization for neurosurgical
planning. Neurosurgery 2011;68(2):496-505.
11. Marcus CD, Marcus VL, Cucu C, Bouché O, Lucas L, Hoeffel C. Imaging
techniques to evaluate the response to treatment in oncology: current
standards and perspectives. Crit Rev Oncol Hemat 2009;72:217–38.
12. Louis DN, Ohgaki H, Wiestler OD, Cavenee WK, Burger PC, Jouvet A,
Scheithauer BW, Kleihues P. The 2007 WHO classification of tumours of
the central nervous system. Acta Neuropathol 2007;114:97–109.
13. Catani M, Schotten MT. A diffusion tensor imaging tractography atlas for
virtual in vivo dissections. Cortex 2008;44:1105-32.
14. Repeatability. Behavioral Ecology Fall 2001 [cited 2012 Sept 14].
Available from: URL: www.csun.edu/~dgray/BE528/Repeatability.doc
15. Measey GJ, Silva JB, Di-Bernardo M. Testing for repeatability in
measurements of length and mass in Chthonerpeton indistinctum
(Amphibia: Gymnophiona), including a novel method of calculating total
length of live caecilians. Herpetol Rev 2003;34:35–9.