Embed Size (px)
Citation preview
Functional magnetic resonance imaging outcomesfrom a comprehensive magnetic resonance study of childrenwith fetal alcohol spectrum disorders
Susan J. Astley & Elizabeth H. Aylward &
Heather Carmichael Olson & Kimberly Kerns &
Allison Brooks & Truman E. Coggins & Julian Davies &
Susan Dorn & Beth Gendler & Tracy Jirikowic &
Paul Kraegel & Kenneth Maravilla & Todd Richards
Received: 20 August 2008 /Accepted: 23 January 2009 /Published online: 12 March 2009# Springer Science + Business Media, LLC 2009
Abstract A comprehensive neuropsychological/psychiat-ric, MR imaging, (MRI), MR spectroscopy (MRS), andfunctional MRI (fMRI) assessment was administered tochildren with fetal alcohol spectrum disorders (FASD) todetermine if global and/or focal abnormalities could be
identified, and distinguish diagnostic subclassificationsacross the spectrum. The four study groups included: 1.FAS/Partial FAS; 2. Static Encephalopathy/Alcohol Ex-posed (SE/AE); 3. Neurobehavioral Disorder/Alcohol Ex-posed (ND/AE); and 4. healthy peers with no prenatalalcohol exposure. fMRI outcomes are reported here. Theneuropsychological/psychiatric, MRI, and MRS outcomesare reported separately. fMRI was used to assess activationin seven brain regions during performance of N-backworking memory tasks. Children across the full spectrumof FASD exhibited significant working memory deficits andaltered activation patterns in brain regions that are known tobe involved in working memory. These results demonstratethe potential research and diagnostic value of this non-invasive MR tool in the field of FASD.
Keywords Fetal alcohol spectrum disorder (FASD) .
Functional magnetic resonance imaging (fMRI) .
Working memory . FASD 4-Digit Diagnostic Code .N-back
Introduction
Fetal alcohol syndrome (FAS) is a permanent birth defectsyndrome caused by maternal alcohol consumption duringpregnancy. FAS is defined by growth deficiency, a uniquecluster of minor facial anomalies, and central nervoussystem (CNS) dysfunction and/or structural brain abnor-malities [1]. The cognitive/behavioral problems in thiscondition stem from prenatal brain damage. Not allindividuals with prenatal alcohol exposure present with mea-surable CNS dysfunction or structural brain abnormalities,
J Neurodevelop Disord (2009) 1:61–80DOI 10.1007/s11689-009-9004-0
S. J. Astley (*) :A. Brooks : S. Dorn :B. Gendler : P. KraegelDepartment of Epidemiology,Center on Human Development and Disability,University of Washington,Box 357920, Seattle, WA 98195-7920, USAe-mail: [email protected]
E. H. Aylward :K. Maravilla : T. RichardsDepartment of Radiology, University of Washington,Seattle, WA 98195, USA
H. C. OlsonDepartment of Psychiatry and Behavioral Sciences,University of Washington,Seattle, WA 98195, USA
K. KernsDepartment of Psychology, University of Victoria,Victoria, BC V8P 5C2, Canada
T. E. CogginsDepartment of Speech and Hearing Sciences,University of Washington,Seattle, WA 98195, USA
J. DaviesDepartment of Pediatrics, University of Washington,Seattle, WA 98195, USA
T. JirikowicDepartment of Rehabilitation Medicine, University of Washington,Seattle, WA 98195, USA
and not all who present with measurable CNS dysfunctionor structural brain abnormalities have FAS. Recently, theterm Fetal Alcohol Spectrum Disorders (FASD) was coinedto depict the spectrum of outcomes observed amongindividuals with prenatal alcohol exposure. FASD is not amedical diagnosis. Rather, diagnoses like FAS, Partial FAS,Static Encephalopathy/Alcohol Exposed, and Neurobeha-vioral Disorder/Alcohol Exposed fall under the umbrella ofFASD. The degree of brain damage among individuals withprenatal alcohol exposure may vary from microcellular andneurochemical aberrations to gross structural anomalies.Similarly, cognitive/behavioral dysfunction varies alongthe full continuum from mild developmental delay orlearning disabilities to global developmental disability.The specificity of the FAS facial phenotype to prenatalalcohol exposure lends credence to the clinical judgmentthat the cognitive and behavioral dysfunction observed inindividuals with FAS is due, at least in part, to brain damagecaused by a teratogen [2–4]. Unfortunately, without theunique facial phenotype of FAS or at least a severe orclinically obvious expression of brain damage, the neuro-developmental disabilities of an individual affected byprenatal alcohol exposure often go unrecognized andinappropriately served [5].
Many individuals with prenatal alcohol exposure exhibitcognitive difficulties and significant maladaptation thatprevent them from leading productive, independent lives[6, 7]. Across the population, the profile of cognitivedysfunction among individuals with prenatal alcoholexposure is highly variable, though there are somecommonalities in functional compromise among subgroups,and conceptual models of overarching deficits have beenproposed [8]. However, no single behavioral phenotypespecific to alcohol teratogenicity has been described.Without a behavioral phenotype specific to the teratogenalcohol, attributing an alcohol-exposed child’s dysfunctionto brain damage is often questionable at a clinical level [4].If indisputable evidence of brain damage (e.g., alterations inneurostructure, neurometabolites and/or neuroactivation)could be found in these individuals, and linked tobehavioral deficit, diagnostic efforts could be improved.The “disability” of these alcohol-exposed children wouldbe clearly established, and help facilitate eligibility forneeded services. Further, if specific alterations in neuro-structure, neurometabolites, and/or neuroactivation could belinked to clinically meaningful, discrete neuropsychologicaldeficits, development of appropriate intervention programscould be accelerated.
The overall goal of this research study was to determineif magnetic resonance imaging, (MRI), magnetic resonancespectroscopy (MRS), and/or functional MRI (fMRI) couldserve as non-invasive methods for definitively identifyingglobal and/or focal brain abnormality across the full
continuum of FASD, and distinguish diagnostic subclassi-fications within the spectrum. The results of this com-prehensive study are presented in four separate reports:fMRI (presented here), and the neuropsychological/behavioral [9], MRI (submitted for publication), andMRS [10] outcomes reported separately.
fMRI is a potentially powerful tool that can assessregional brain activation in response to performance onspecific cognitive, perceptual, or motor tasks. Many studies,spanning a broad array of disease states and disorders, haveused this tool to document activation that is different inintensity and/or spatial extent in subjects with brain damageand/or impairment on the specific tasks being assessed [11–13]. Only three FASD fMRI studies have been published todate. Significant differences in brain activation patternswere observed between FASD and Control groups duringverbal learning [14], response inhibition [15], and spacialworking memory [16] tasks. All of these tasks requirehigher-order cognitive abilities that are often deficient inindividuals with FASD [17–21]. All three studies clearlydemonstrated the value of fMRI in this clinical population.The present study extends this line of inquiry to nonspatialworking memory, using an fMRI N-back paradigm.Working memory is the ability to hold and manipulateinformation online in the brain [22, 23]. The constituentprocesses involved in working memory are encoding,rehearsal, storage, and executive processes on the contentsof stored memory [13]. Working memory is subserved by aneurocognitive network comprising regions involved inattention (anterior cingulate), executive function (dorsolat-eral prefrontal cortex), and short-term mnemonic strategies(parietal cortex and precuneous) [24–26].
Materials and methods
Subjects and study groups
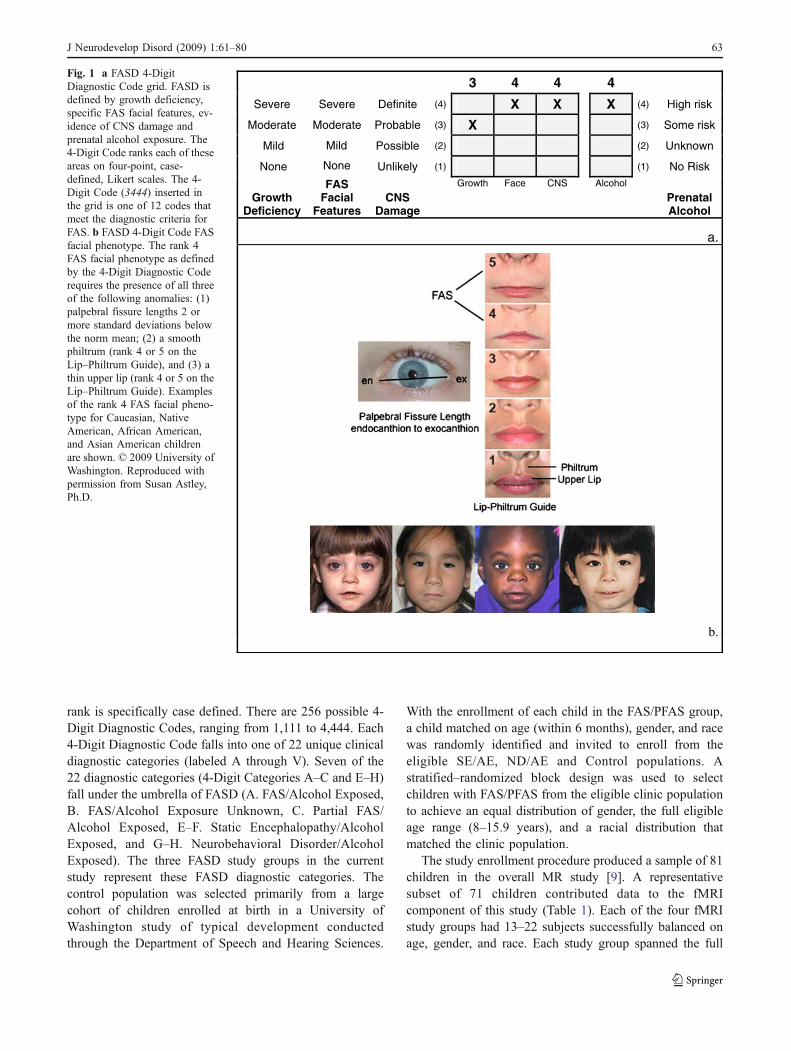
The protocol was approved by the University of Wash-ington Human Subjects Review Board. The three FASDgroups were selected from among 1,200 patients previouslydiagnosed by an interdisciplinary team in the WA State FASDiagnostic & Prevention Network (FAS DPN) of clinicsusing the FASD 4-Digit Code [27, 28]. Briefly, the fourdigits of the FASD 4-Digit Code reflect the magnitude ofexpression of the four key diagnostic features of FASD, inthe following order: (1) growth deficiency, (2) characteristicFAS facial phenotype, (3) CNS structural/functional abnor-malities, and (4) prenatal alcohol exposure (Fig. 1). Themagnitude of expression of each feature is ranked indepen-dently on a four-point Likert scale, with 1 reflectingcomplete absence of the FASD feature and 4 reflecting astrong “classic” presence of the FASD feature. Each Likert
62 J Neurodevelop Disord (2009) 1:61–80
rank is specifically case defined. There are 256 possible 4-Digit Diagnostic Codes, ranging from 1,111 to 4,444. Each4-Digit Diagnostic Code falls into one of 22 unique clinicaldiagnostic categories (labeled A through V). Seven of the22 diagnostic categories (4-Digit Categories A–C and E–H)fall under the umbrella of FASD (A. FAS/Alcohol Exposed,B. FAS/Alcohol Exposure Unknown, C. Partial FAS/Alcohol Exposed, E–F. Static Encephalopathy/AlcoholExposed, and G–H. Neurobehavioral Disorder/AlcoholExposed). The three FASD study groups in the currentstudy represent these FASD diagnostic categories. Thecontrol population was selected primarily from a largecohort of children enrolled at birth in a University ofWashington study of typical development conductedthrough the Department of Speech and Hearing Sciences.
With the enrollment of each child in the FAS/PFAS group,a child matched on age (within 6 months), gender, and racewas randomly identified and invited to enroll from theeligible SE/AE, ND/AE and Control populations. Astratified–randomized block design was used to selectchildren with FAS/PFAS from the eligible clinic populationto achieve an equal distribution of gender, the full eligibleage range (8–15.9 years), and a racial distribution thatmatched the clinic population.
The study enrollment procedure produced a sample of 81children in the overall MR study [9]. A representativesubset of 71 children contributed data to the fMRIcomponent of this study (Table 1). Each of the four fMRIstudy groups had 13–22 subjects successfully balanced onage, gender, and race. Each study group spanned the full
3 4 4 4
Severe Severe Definite (4) X X X (4) High risk
Moderate Moderate Probable (3) X (3) Some risk
Mild Possible (2) (2) Unknown
None Unlikely (1) (1) No Risk
Growth Deficiency
FAS Facial
Features CNS
Damage
Growth Face CNS Alcohol
Prenatal Alcohol
a.
b.
Mild
None
Fig. 1 a FASD 4-DigitDiagnostic Code grid. FASD isdefined by growth deficiency,specific FAS facial features, ev-idence of CNS damage andprenatal alcohol exposure. The4-Digit Code ranks each of theseareas on four-point, case-defined, Likert scales. The 4-Digit Code (3444) inserted inthe grid is one of 12 codes thatmeet the diagnostic criteria forFAS. b FASD 4-Digit Code FASfacial phenotype. The rank 4FAS facial phenotype as definedby the 4-Digit Diagnostic Coderequires the presence of all threeof the following anomalies: (1)palpebral fissure lengths 2 ormore standard deviations belowthe norm mean; (2) a smoothphiltrum (rank 4 or 5 on theLip–Philtrum Guide), and (3) athin upper lip (rank 4 or 5 on theLip–Philtrum Guide). Examplesof the rank 4 FAS facial pheno-type for Caucasian, NativeAmerican, African American,and Asian American childrenare shown. © 2009 University ofWashington. Reproduced withpermission from Susan Astley,Ph.D.
J Neurodevelop Disord (2009) 1:61–80 63
age range of 8.0 to 15.9 years at the time of enrollment. Thediagnostic features specific to each group were as follows:
1. Children in Group 1 had a 4-Digit diagnosis of FAS orPartial FAS (FAS/PFAS) (e.g., 4-Digit DiagnosticCategories A, B, C: with Growth Ranks 1–4, FaceRanks 3–4, CNS Ranks 3 and/or 4, and Alcohol Ranks2–4) (Fig. 1). Alcohol Rank 2 (unknown exposure)could only be present if the child had a diagnosis of fullFAS because the Rank 4 FAS facial features are sospecific to prenatal alcohol exposure [3, 29]. Since theonly clinical difference between FAS and PFAS in thisstudy was the presence of growth deficiency in theformer, FAS and PFAS were combined. Children inGroup 1 had severe cognitive/behavioral dysfunctionand the FAS facial phenotype.
2. Children in Group 2 had a 4-Digit diagnosis of StaticEncephalopathy/Alcohol Exposed (SE/AE) (e.g., 4-Digit Diagnostic Categories E and F: with GrowthRanks 1–4, Face Ranks 1–2, CNS Ranks 3 and/or 4,and Alcohol Ranks 3–4). Children in Group 2 hadsevere cognitive/behavioral dysfunction, comparable toGroup 1, but did not have the FAS facial phenotype.
3. Children in Group 3 had a 4-Digit diagnosis ofNeurobehavioral Disorder/Alcohol Exposed (ND/AE)(e.g. 4-Digit Diagnostic Categories G and H: withGrowth Ranks 1–4, Face Ranks 1–2, CNS Rank 2, andAlcohol Ranks 3–4). Children in Group 3 had pre-natal alcohol exposure comparable to Groups 1 and 2,but had only mild to moderate cognitive/behavioraldysfunction, and did not have the FAS facialphenotype.
Table 1 Sociodemographic and FASD 4-Digit Diagnostic Code profile of the four study groups that participated in the fMRI study
Characteristic 1. FAS/PFASf 2. SE/AE 3. ND/AE 4. ControlN=16 N=22 N=20 N=13
Gender: n (%)a Female 7 (43.8) 8 (36.4) 10 (50.0) 6 (46.2)Age at enrollment (years): mean (SD)b 13.3 (2.0) 12.4 (2.0) 12.5 (2.2) 12.9 (2.6)Race: n (%)c Caucasian 11 (68.8) 10 (45.5) 12 (60.0) 10 (60.6)
Black 4 (25.0) 3 (13.6) 5 (25.0) 2 (15.4)Other 1 (6.3) 9 (40.9) 3 (15.0) 1 (7.7)
Growth rank from 4-Digit Code: n (%) 1. none 9 (56.3) 13 (59.1) 12 (60.0) 12 (92.3)2. mild 1 (6.3) 2 (9.1) 6 (30.0) 1 (7.7)3. moderate 4 (25.0) 3 (13.6) 1 (5.0) 0 (0.0)4. severe 2 (12.5) 4 (18.2) 1 (5.0) 0 (0.0)
Face rank from 4-Digit Code: n (%) 1. none 0 (0.0) 3 (13.6) 6 (30.0) 9 (69.2)2. mild 0 (0.0) 19 (86.4) 14 (70.0) 4 (30.8)3. moderate 3 (18.8) 0 (0.0) 0 (0.0) 0 (0.0)4. severed 13 (81.3) 0 (0.0) 0 (0.0) 0 (0.0)
CNS ranks 1–3 from 4-Digit CodeLevel of functional impairment: n (%) 1. none 0 (0.0) 0 (0.0) 0 (0.0) 13 (100.0)
2. moderate 0 (0.0) 3 (13.6)g 20 (100.0) 0 (0.0)3. severe 16 (100.0) 19 (86.4) 0 (0.0) 0 (0.0)
CNS rank 4 from 4-Digit Code Structural/neurological abnormalitypresent: n (%)
9 (56.3) 6 (27.3) 0 (0.0) 0 (0.0)
Alcohol rank from 4-Digit Code: n (%) 1. No exposure 0 (0.0) 0 (0.0) 0 (0.0) 13 (100.0)2. Unknown exposuree 1 (6.3) 0 (0.0) 0 (0.0) 0 (0.0)3. Confirmed exposure. Level
moderate or unknown5 (31.3) 11 (50.0) 11 (55.0) 0 (0.0)
4. Confirmed exposure: Level high 10 (62.5) 11 (50.0) 9 (45.0) 0 (0.0)
A comprehensive profile of the entire study sample is presented in Astley et al. [9]a Percent female: chi-square=0.8 (df 3), p=0.84bMean age: ANOVA F(3, 67) 3.2, p=0.56c Percent Caucasian: chi-square=4.0 (df 3), p=0.26d Definition of rank 4 FAS face: palpebral fissure lengths 2 or more SDs below the mean norm, and lip and philtrum are Rank 4 or 5 on the Lip–Philtrum Guide [27]e The one child with unknown prenatal alcohol exposure had full FASf Four of the 16 subjects in group 1 had full FAS using the FASD 4-Digit Code. Nine of the 12 PFAS had rank 4 faces, but received a diagnosis ofPFAS because of their absence of growth deficiency (growth rank 1)g All three children with moderate functional impairment had structural evidence of brain abnormality (microcephaly)
64 J Neurodevelop Disord (2009) 1:61–80
4. Children in Group 4 (Healthy Controls/No AlcoholExposure) were selected based on parental report thatthe child was healthy, had no academic concerns, andno prenatal alcohol exposure (e.g., 4-Digit DiagnosticCategory V: with Growth Ranks 1–2, FAS Face Ranks(no restrictions), CNS Rank 1, Alcohol Rank 1).
Using the FASD terminology introduced by the Strattonet al. [6], the SE/AE group most closely reflects ‘severeARND’ and the ND/AE group reflects ‘mild ARND’. Acomprehensive analysis of the between-group differences ofthese diagnostic features is presented in the neuropsycho-logical/behavioral report for this study [9].
Study participation
Participation in the study involved five visits over a 4 to6 week study period. The neuropsycological and socio-demographic data were collected during visits 1 and 2. TheMR data were collected during visits 3 and 4. Outcomes ofthe neuropsycological assessments were shared with thecaregivers on visit 5, and submitted to the child’s medicalrecord with caregiver consent.
Sociodemographic and clinical assessment
A comprehensive sociodemographic and health/medicationhistory of each child was obtained by parent interview andrecord review. Information included birth data, growth, andall prenatal and lifetime exposures and adverse events. Forsubjects with FASD, most information was obtained at thetime of their FASD diagnostic evaluation. All controls hada reported absence of prenatal alcohol exposure. Allchildren had a standardized digital facial photograph takenat the time of enrollment. The facial photographs wereanalyzed using the FAS Facial Analysis Software [30] todocument the magnitude of expression of the FAS facialphenotype [29]. A more detailed methodology and analysisof the sociodemographic and FASD diagnostic outcomes,including prenatal alcohol exposure histories, are presentedin the neuropsychological/behavioral report from this study[9].
Neuropsychological and psychiatric assessments
A detailed description of the assessment battery and acomprehensive analysis of the between-group differences inneuropsychological outcome are presented in the neuropsy-chological/behavioral report for this study [9]. Briefly, acomprehensive, standardized assessment battery was ad-ministered to each child/caregiver by a psychologistmasked to group assignment. The assessment battery was
designed to capture the domains of potential neuropsycho-logical impairment seen as the result of the typically diffusebrain damage arising from alcohol teratogenesis [8, 20, 31–34]. The neuropsychological/behavioral outcomes served toprofile the study groups and confirm the groups wereclinically and statistically distinct from one another;fundamental to the interpretation of the MR outcomes.
MR scanner
All scans (MRI, MRS, and fMRI) were acquired using aGeneral Electric 1.5 Tesla scanner in the DiagnosticImaging Sciences Center (DISC) at the University ofWashington.
MRI and MRS
The MRI and MRS [10] components of this study arereported separately. Briefly, MRI was used to measure thesize of the following brain regions: total brain, frontal lobe,caudate, putamen, hippocampus, corpus callosum, andcerebellar vermis. MRS was used to measure the concen-trations of three neurometabolites: (1) choline, a marker ofcell membrane stability and myelination, (2) N-acetylaspartate, a neuronal or axonal marker, and (3) creatine, amarker of metabolic activity in selected brain regions.
fMRI: N-back working memory task
An existing fMRI paradigm [35] was modified for thisclinical population to assess activation in specific brainregions during working memory. In agreement with otherfMRI studies of working memory [24–26], testing withnormal controls using this paradigm demonstrated consis-tent activation of the dorsolateral prefrontal cortex (DLPFC).The N-back task [36] involved viewing a series of images(e.g., faces), one at a time, and deciding whether the presentimage matched the image presented n images back, where nis 1 or 2. The images were four male and four female faces.N-back paradigms often use numbers for stimuli. Becauseresearch indicates alcohol-affected children often have mathdeficits and difficulty with numbers, faces were selected asthe stimuli. Two tasks were developed, one using a 0-backand 1-back condition, and one using a 0-back and 2-backcondition. The 0-back (control) condition required thesubject to press the button whenever a man's face waspresented. The 1-back (activation) condition required thesubject to press the button whenever the face they werecurrently viewing was the same as the one immediatelypreceding it. The 2-back (activation) condition required thesubject to press the button whenever the face they werecurrently viewing was the same as the one presented twoimages back. The subjects were presented with a series of
J Neurodevelop Disord (2009) 1:61–80 65
80 images (one at a time) for each of the 1-back and 2-backtasks. The 80 images for the 1-back task were presented inthe following order: the first 20 images represented the 0-back condition with seven man’s faces presented in randomorder. The next 20 images represented the 1-back conditionwith six randomly placed images meeting the 1-backcriteria. The next 20 images returned to the 0-backcondition with seven man’s faces presented in randomorder. The final 20 images presented the 1-back conditionwith six randomly placed images meeting the 1-backcriteria. The 2-back task followed the same patternalternating the 0-back and 2-back conditions. Of the 80images, 26 were positive (the subject should press thebutton because the image met the N-back condition) and 54were negative (the subject should not press the buttonbecause the image did not meet the N-back condition). TheN-back tasks were scored based on the number of true-positive, true-negative, false-positive, and false-negativeresponses recorded across the 80 images. Subject’s reactiontimes (ms) also were measured.
To collect meaningful activation data during an N-backtask, it is essential for subjects to be actively engaged in thetask while lying perfectly still in the scanner. To prepare thechild for the fMRI session in the scanner, the child wasacclimated to the scanner environment in the mock scanner.A single practice session of the N-back task was adminis-tered to the child while in the mock scanner, to confirm thechild understood the task well enough to perform it in thereal scanner. Children performing with >65% accuracy onthe practice version of the 1-back task were scanned usingthe 1-back condition. Children performing with >65% on thepractice version of the 2-back task were scanned using the 2-back condition. Children performing at <65% accuracy onthe N-back tasks were unlikely to perform the tasks in thescanner so as to yield meaningful activation data. Once in thescanner, only data from N-back tasks where the number oftrue-positive and true-negative responses were >65% correctwere used to assess activation.
fMRI acquisition and analysis
Scans were acquired on a 1.5 T GE Signa MR scanner,using a 21 slice blood oxygenation level-dependent(BOLD) EPI pulse sequence with the following parameters:gradient echo pulse, TR=3,000 ms, TE=50 ms, flip angle=90, matrix=64 X 64, FOV=24, slice thickness=6.0 mm,0 gap. Two scans were acquired; one during the 1-back taskand one during the 2-back task. Each scan lasted 5 min and18 s. The 1-back task included two repetitions of thefollowing: 18 s of fixation, followed by 6 s of instruction,60 s of 0-back (control) condition, 6 s of instruction, and60 s of 1-back (activation) condition. The scan ended withanother 18 s of fixation. The 2-back task followed the same
pattern, using the 2-back condition for the activationcondition.
Data from the fMRI scans were transferred from thescanner to the UNIX workstation, globally normalized, andarchived on CD-ROMs. fMRI scans were analyzed usingthe software package MEDx 3.2, a multimodal radiologicalimage processing program (Sensor Systems, Sterling, VA),run on a workstation with Linux operating system software.Motion detection was performed using a center-of-intensityplot. Scans with greater than five volumes with motion thatexceed 0.3 mm from the center of intensity in any planewere considered unusable.
For scans with motion not exceeding this threshold,motion correction was performed, using the AIR algorithm[37, 38] (version 3.08, including the alignlinear andalignwarp programs). This algorithm minimizes the vari-ance of the ratio of the intensities of two images. A gradientdescent search was performed to arrive at a globalminimum. All images were registered to the same referenceimage normalized to Tailarach space. A linear rigid body(six parameter) model, with trilinear interpolation was used.Pixel-by-pixel linear detrending was applied to correct forgradual drift in pixel intensity during the time course of theseries. Paradigms were then applied, assigning individualvolumes to either the control (0-back) or activation (1- or 2-back) conditions. Based on examination of the hemody-namic lag, 3 s of data were omitted from the beginning ofthe series. A statistic summarizing the activation differencebetween control and activation conditions was computedfor each voxel. The statistic was computed as that of a two-sample t-test, and was subsequently transformed to a Z-score via the Fisher transformation [11]. Active voxels werethen identified as those with Z-scores exceeding a fixedthreshold (a z-score>3). Previous experience with normalsubjects indicated that threshold values in the range of 2.4–6.0 (corresponding to 1-tailed P-value of <0.0082) provideinformative, reliable binary activation maps.
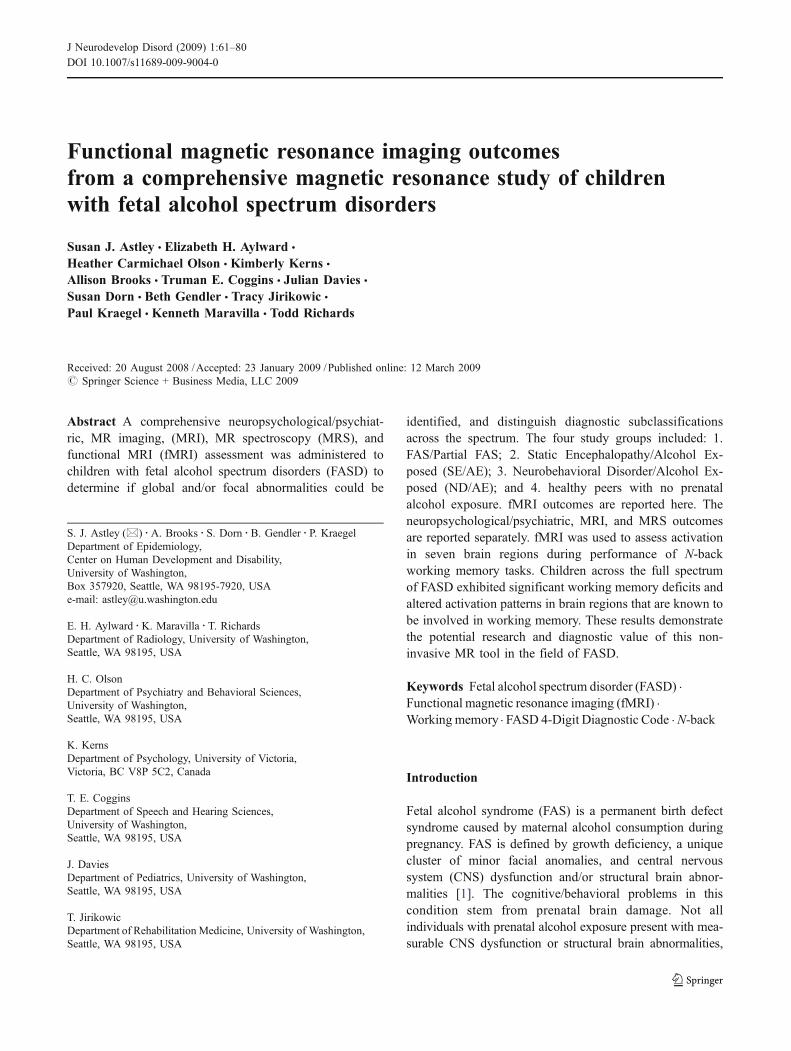
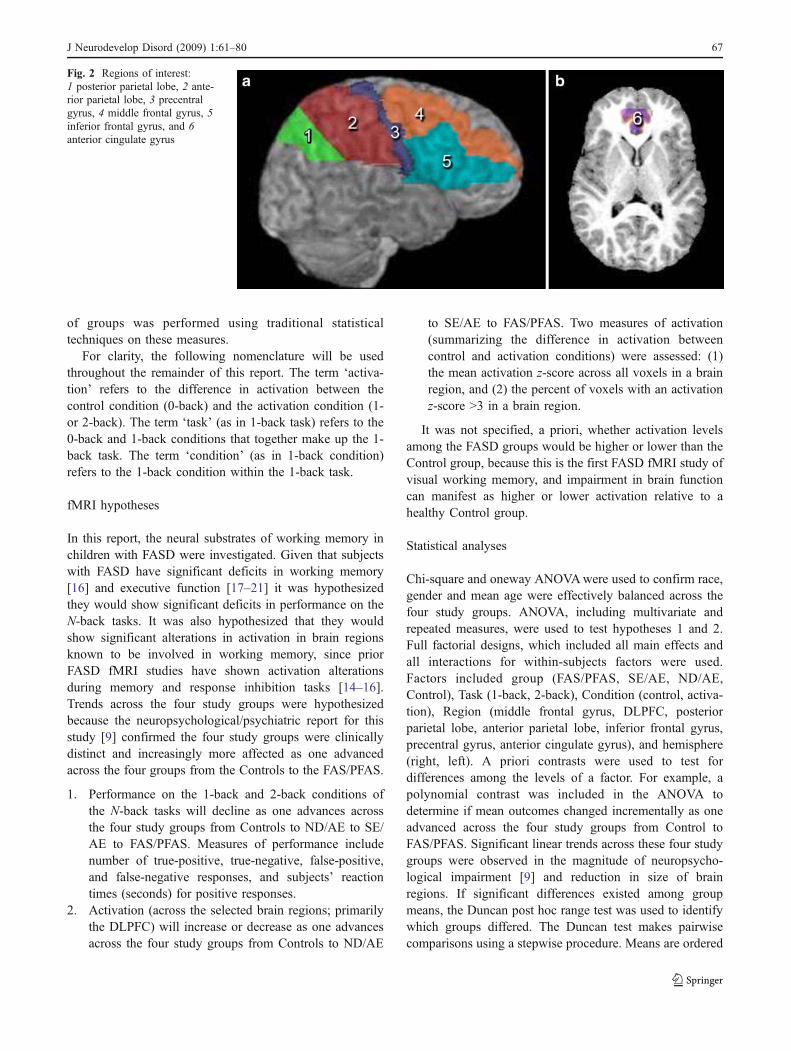
Group maps were first produced for each of the fourstudy groups, and areas of primary activation (for anygroup) were identified. Consistent with previous literature,these regions included left and right anterior cingulate,parietal lobe, particularly the anterior parietal region,dorsolateral prefrontal, inferior frontal, middle frontal andprecentral regions of the frontal lobe (Fig. 2). Using theROIs identified on the template brain, two measures ofactivation were computed for each subject for each of thesebrain regions: (1) the number of voxels whose z valueexceeded the threshold (z=3.0; cluster corrected), and (2)the average z score within the region. For each subject andeach region, number of activated voxels (i.e., those whose zvalue exceeded the threshold) was divided by the numberof voxels in the region, yielding a measure reflecting thepercent of activated voxels within the region. Comparison
66 J Neurodevelop Disord (2009) 1:61–80
of groups was performed using traditional statisticaltechniques on these measures.
For clarity, the following nomenclature will be usedthroughout the remainder of this report. The term ‘activa-tion’ refers to the difference in activation between thecontrol condition (0-back) and the activation condition (1-or 2-back). The term ‘task’ (as in 1-back task) refers to the0-back and 1-back conditions that together make up the 1-back task. The term ‘condition’ (as in 1-back condition)refers to the 1-back condition within the 1-back task.
fMRI hypotheses
In this report, the neural substrates of working memory inchildren with FASD were investigated. Given that subjectswith FASD have significant deficits in working memory[16] and executive function [17–21] it was hypothesizedthey would show significant deficits in performance on theN-back tasks. It was also hypothesized that they wouldshow significant alterations in activation in brain regionsknown to be involved in working memory, since priorFASD fMRI studies have shown activation alterationsduring memory and response inhibition tasks [14–16].Trends across the four study groups were hypothesizedbecause the neuropsychological/psychiatric report for thisstudy [9] confirmed the four study groups were clinicallydistinct and increasingly more affected as one advancedacross the four groups from the Controls to the FAS/PFAS.
1. Performance on the 1-back and 2-back conditions ofthe N-back tasks will decline as one advances acrossthe four study groups from Controls to ND/AE to SE/AE to FAS/PFAS. Measures of performance includenumber of true-positive, true-negative, false-positive,and false-negative responses, and subjects’ reactiontimes (seconds) for positive responses.
2. Activation (across the selected brain regions; primarilythe DLPFC) will increase or decrease as one advancesacross the four study groups from Controls to ND/AE
to SE/AE to FAS/PFAS. Two measures of activation(summarizing the difference in activation betweencontrol and activation conditions) were assessed: (1)the mean activation z-score across all voxels in a brainregion, and (2) the percent of voxels with an activationz-score >3 in a brain region.
It was not specified, a priori, whether activation levelsamong the FASD groups would be higher or lower than theControl group, because this is the first FASD fMRI study ofvisual working memory, and impairment in brain functioncan manifest as higher or lower activation relative to ahealthy Control group.
Statistical analyses
Chi-square and oneway ANOVAwere used to confirm race,gender and mean age were effectively balanced across thefour study groups. ANOVA, including multivariate andrepeated measures, were used to test hypotheses 1 and 2.Full factorial designs, which included all main effects andall interactions for within-subjects factors were used.Factors included group (FAS/PFAS, SE/AE, ND/AE,Control), Task (1-back, 2-back), Condition (control, activa-tion), Region (middle frontal gyrus, DLPFC, posteriorparietal lobe, anterior parietal lobe, inferior frontal gyrus,precentral gyrus, anterior cingulate gyrus), and hemisphere(right, left). A priori contrasts were used to test fordifferences among the levels of a factor. For example, apolynomial contrast was included in the ANOVA todetermine if mean outcomes changed incrementally as oneadvanced across the four study groups from Control toFAS/PFAS. Significant linear trends across these four studygroups were observed in the magnitude of neuropsycho-logical impairment [9] and reduction in size of brainregions. If significant differences existed among groupmeans, the Duncan post hoc range test was used to identifywhich groups differed. The Duncan test makes pairwisecomparisons using a stepwise procedure. Means are ordered
Fig. 2 Regions of interest:1 posterior parietal lobe, 2 ante-rior parietal lobe, 3 precentralgyrus, 4 middle frontal gyrus, 5inferior frontal gyrus, and 6anterior cingulate gyrus
J Neurodevelop Disord (2009) 1:61–80 67
from highest to lowest, and extreme differences are testedfirst. The Duncan test sets a protection level for the errorrate for the collection of tests and identifies homogeneoussubsets of means that are not different from one another atthe p=0.05 level. Two-tailed p-values of 0.05 were usedthroughout the analyses.
Results
Proportion of subjects who were able to participatesuccessfully in N-back-fMRI tasks
Seventy-one of the 81 children enrolled in the larger MRstudy were able to participate successfully in the N-backtasks and fMRI evaluation (Table 2). To obtain validactivation data, the subject had to: (1) provide adequateperformance/effort during the N-back tasks (the child had tobe engaged throughout the task, even if they failed to getthe correct answers), and (2) lay sufficiently still throughoutthe scan. Because of the cognitive/behavioral impairment ofour FASD study groups, there was concern that manywould not be able to successfully participate in the fMRIportion of the study. Only one subject in each study groupfailed to demonstrate adequate performance/effort duringthe 1-back task (Table 2). Adequate performance/effort wasdefined as >65% correct true-positive and true-negativeresponses with active response throughout the task. One tofour subjects per group failed to demonstrate adequateperformance/effort during the more difficult 2-back task.Subjects in the alcohol-exposed groups were more likely toperform below criteria on the 2-back task than Controls, butthe group contrasts were not significantly different. Thesubjects in the FAS/PFAS were more likely to havedifficulty in adapting adequately to the scanner (entering
the scanner or lying still within the scanner) in order toproduce valid fMRI data, than the remaining groups, butthis contrast was also not statistically significant (Table 2).Overall, the subset of 71 children (16/20 FAS/PFAS, 22/24SE/AE, 20/21 ND/AE and 13/16 Controls) who were ableto participate successfully in this fMRI study were highlyrepresentative (clinically and sociodemographically) of thefull set of 81 children enrolled in the larger MR study.
As described in the neuropsycological/behavioral reportfrom this study [9], two subjects in the FAS/PFAS grouphad agenesis (ACC) and hypogenesis (HCC) of the corpuscallosum. These anomalies were known prior to enrollmentinto the study. The subject with ACC was able to provideadequate performance on both N-back tasks, but validactivation data could not be obtained. The subject withHCC was not able to provide adequate performance oneither N-back task, thus activation data were not assessed.As a consequence, data on these two individuals are notincluded in this report.
N-back performance across the four study groups(hypothesis 1)
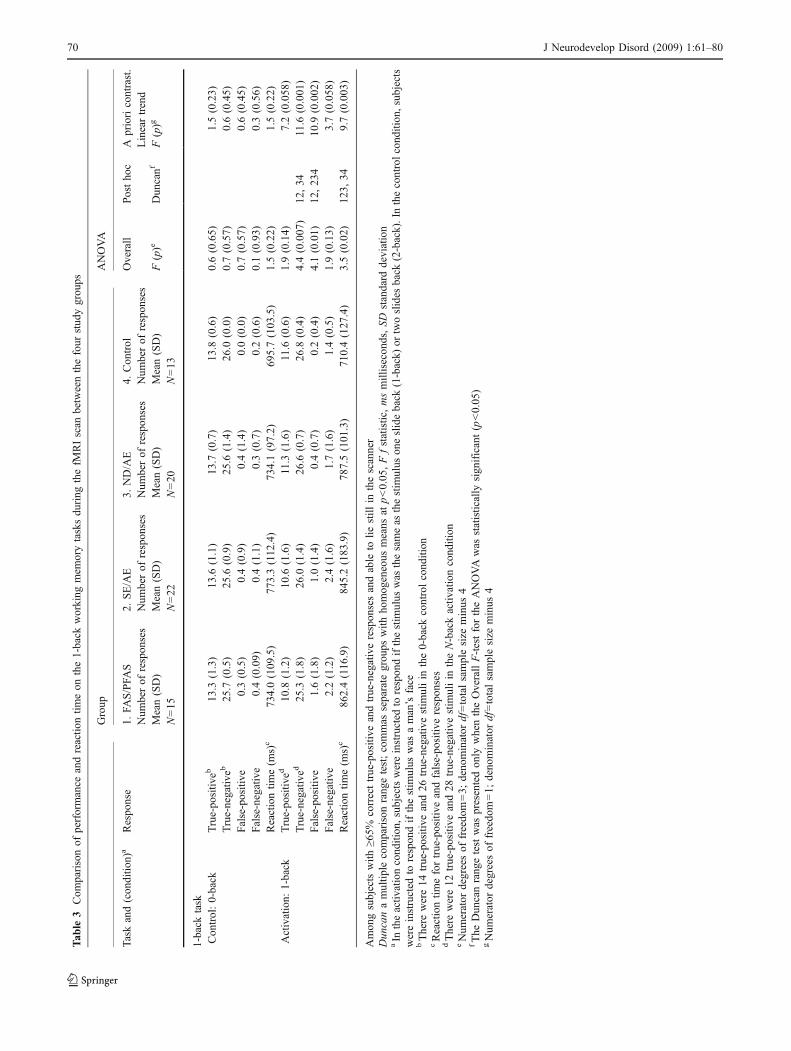
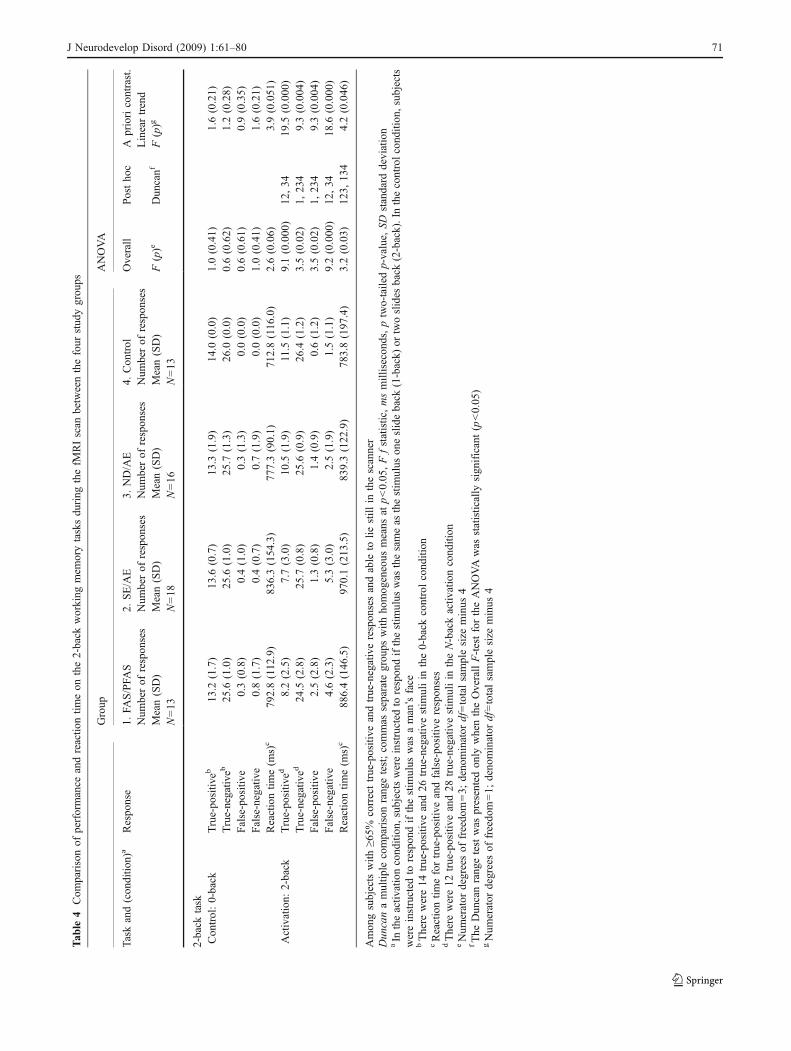
N-back performance did not vary by age, race, or gender inthis study population. 1-back Task. Performance andreaction times for the control condition (0-back) werecomparable between the four groups (Table 3). The FAS/PFAS group had significantly poorer performance andlonger reaction times than the Control group on the 1-backcondition. Performance on the 1-back condition decreasedand reaction times increased linearly as one advancedacross the four groups from Control to FAS/PFAS. 2-backTask. Performance and reaction times for the controlcondition (0-back) were again comparable between the fourgroups (Table 4). The FAS/PFAS group had significantly
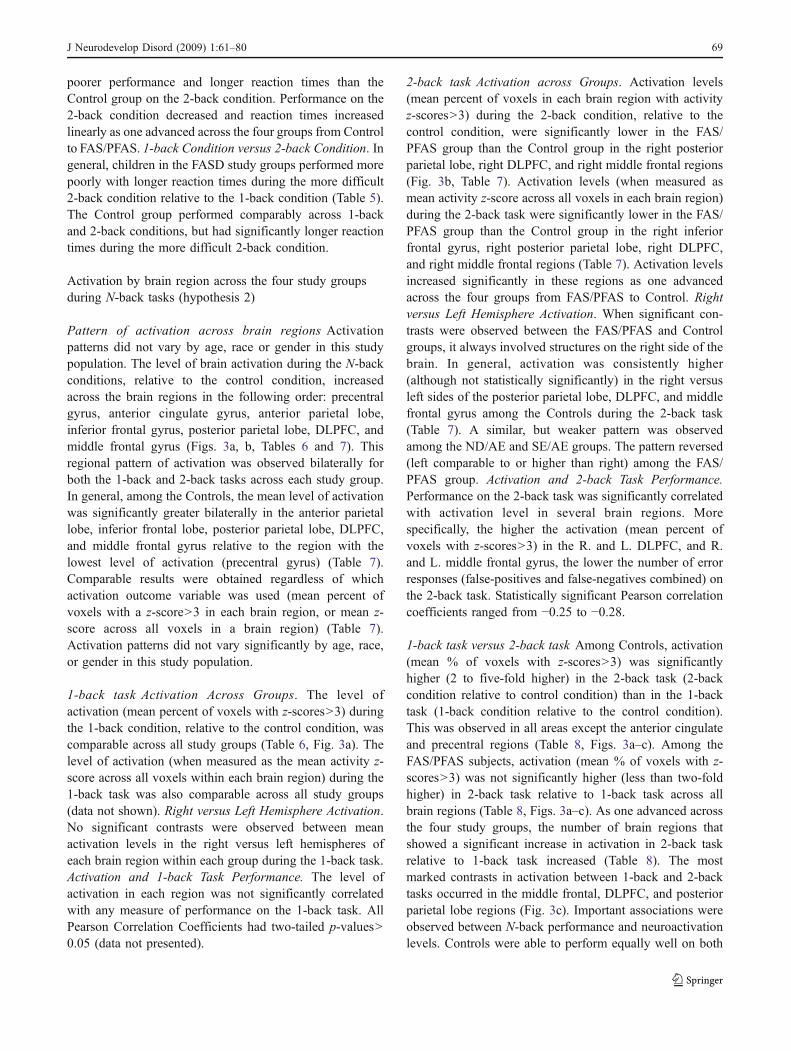
Table 2 Number of subjects able to participate successfully in the N-back tasks and the fMRI scan across the four study groups
fMRI—N-back task participation 1. FAS/PFAS 2. SE/AE 3. ND/AE 4. ControlN=20 N=24 N=21 N=16N (%) N (%) N (%) N (%)
1-back taskUnable to enter or lie still in the scanner 4 (20.0) 1 (4.2) 0 (0.0) 2 (12.5)Entered scannerBut did not provide adequate performance/efforta 1 (5.0) 1 (4.2) 1 (4.7) 1 (6.3)And provided adequate performance/efforta 15 (75.0) 22 (91.6) 20 (95.3) 13 (81.3)
2-back taskUnable to enter or lie still in the scanner 5 (25.0) 2 (8.3) 2 (9.5) 2 (12.5)Entered scannerBut did not provide adequate performance/efforta 2 (10.0) 4 (16.7) 3 (14.3) 1 (6.3)And provided adequate performance/efforta 13 (65.0) 18 (75.0) 16 (76.2) 13 (81.3)
a Adequate performance on N-back was defined as ≥65% correct true-positive and true-negative responses
68 J Neurodevelop Disord (2009) 1:61–80
poorer performance and longer reaction times than theControl group on the 2-back condition. Performance on the2-back condition decreased and reaction times increasedlinearly as one advanced across the four groups from Controlto FAS/PFAS. 1-back Condition versus 2-back Condition. Ingeneral, children in the FASD study groups performed morepoorly with longer reaction times during the more difficult2-back condition relative to the 1-back condition (Table 5).The Control group performed comparably across 1-backand 2-back conditions, but had significantly longer reactiontimes during the more difficult 2-back condition.
Activation by brain region across the four study groupsduring N-back tasks (hypothesis 2)
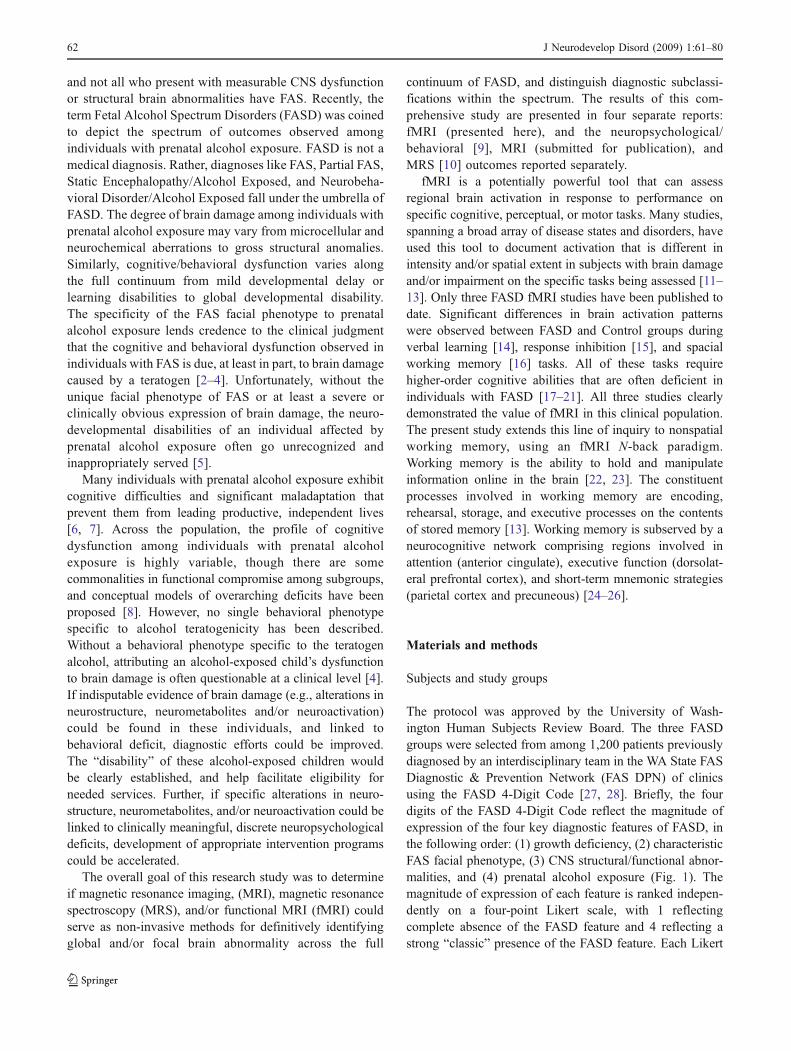
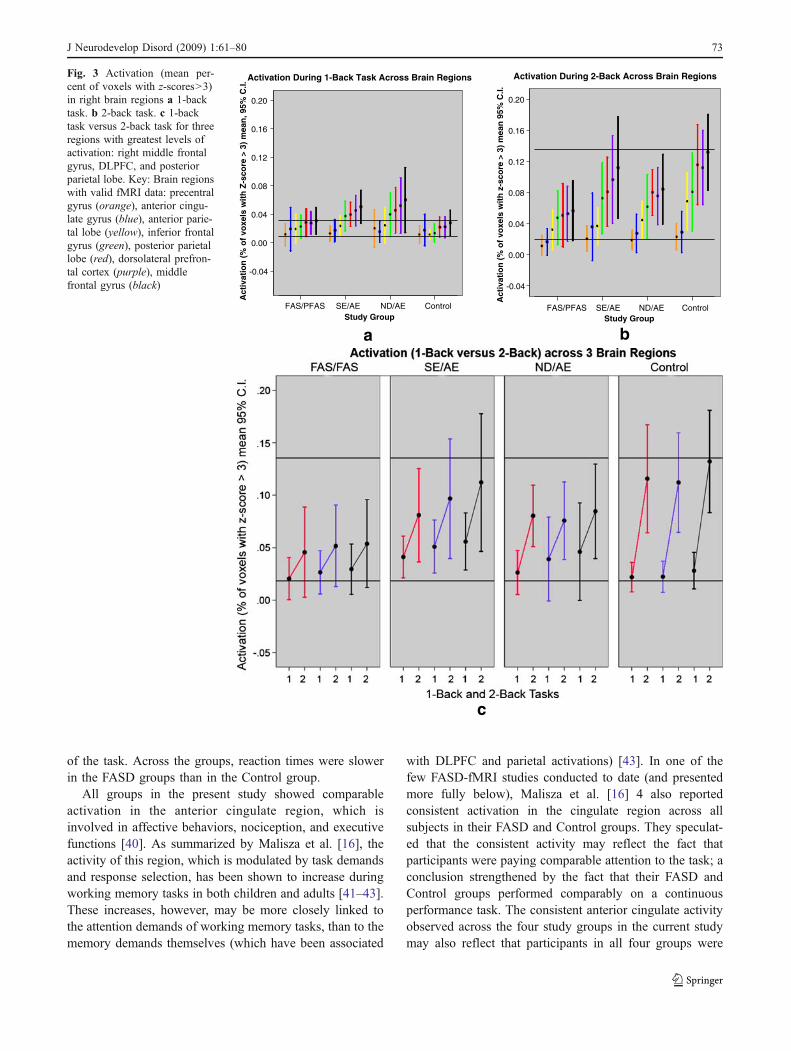
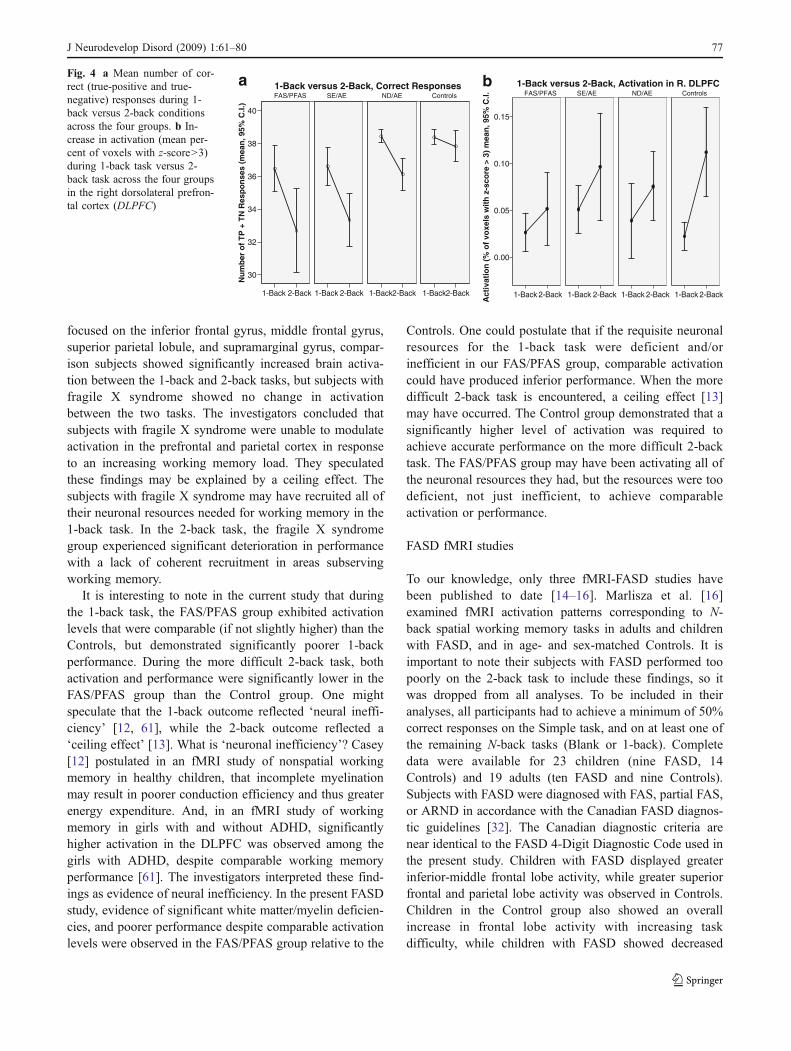
Pattern of activation across brain regions Activationpatterns did not vary by age, race or gender in this studypopulation. The level of brain activation during the N-backconditions, relative to the control condition, increasedacross the brain regions in the following order: precentralgyrus, anterior cingulate gyrus, anterior parietal lobe,inferior frontal gyrus, posterior parietal lobe, DLPFC, andmiddle frontal gyrus (Figs. 3a, b, Tables 6 and 7). Thisregional pattern of activation was observed bilaterally forboth the 1-back and 2-back tasks across each study group.In general, among the Controls, the mean level of activationwas significantly greater bilaterally in the anterior parietallobe, inferior frontal lobe, posterior parietal lobe, DLPFC,and middle frontal gyrus relative to the region with thelowest level of activation (precentral gyrus) (Table 7).Comparable results were obtained regardless of whichactivation outcome variable was used (mean percent ofvoxels with a z-score>3 in each brain region, or mean z-score across all voxels in a brain region) (Table 7).Activation patterns did not vary significantly by age, race,or gender in this study population.
1-back task Activation Across Groups. The level ofactivation (mean percent of voxels with z-scores>3) duringthe 1-back condition, relative to the control condition, wascomparable across all study groups (Table 6, Fig. 3a). Thelevel of activation (when measured as the mean activity z-score across all voxels within each brain region) during the1-back task was also comparable across all study groups(data not shown). Right versus Left Hemisphere Activation.No significant contrasts were observed between meanactivation levels in the right versus left hemispheres ofeach brain region within each group during the 1-back task.Activation and 1-back Task Performance. The level ofactivation in each region was not significantly correlatedwith any measure of performance on the 1-back task. AllPearson Correlation Coefficients had two-tailed p-values>0.05 (data not presented).
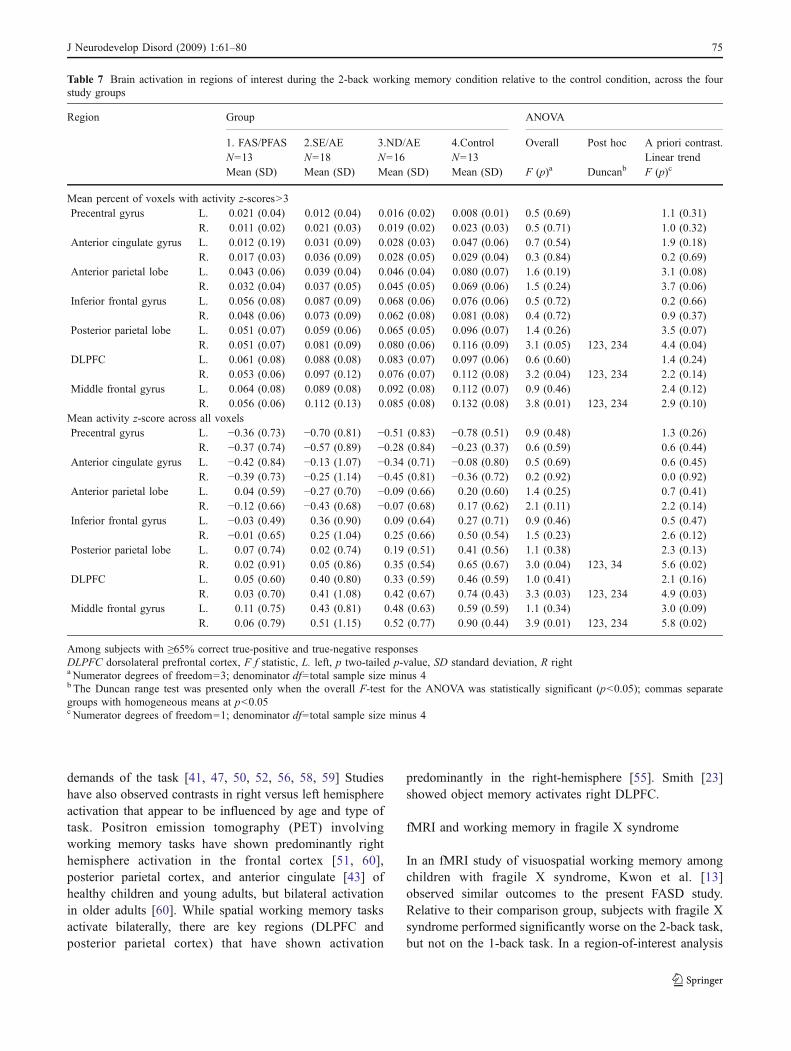
2-back task Activation across Groups. Activation levels(mean percent of voxels in each brain region with activityz-scores>3) during the 2-back condition, relative to thecontrol condition, were significantly lower in the FAS/PFAS group than the Control group in the right posteriorparietal lobe, right DLPFC, and right middle frontal regions(Fig. 3b, Table 7). Activation levels (when measured asmean activity z-score across all voxels in each brain region)during the 2-back task were significantly lower in the FAS/PFAS group than the Control group in the right inferiorfrontal gyrus, right posterior parietal lobe, right DLPFC,and right middle frontal regions (Table 7). Activation levelsincreased significantly in these regions as one advancedacross the four groups from FAS/PFAS to Control. Rightversus Left Hemisphere Activation. When significant con-trasts were observed between the FAS/PFAS and Controlgroups, it always involved structures on the right side of thebrain. In general, activation was consistently higher(although not statistically significantly) in the right versusleft sides of the posterior parietal lobe, DLPFC, and middlefrontal gyrus among the Controls during the 2-back task(Table 7). A similar, but weaker pattern was observedamong the ND/AE and SE/AE groups. The pattern reversed(left comparable to or higher than right) among the FAS/PFAS group. Activation and 2-back Task Performance.Performance on the 2-back task was significantly correlatedwith activation level in several brain regions. Morespecifically, the higher the activation (mean percent ofvoxels with z-scores>3) in the R. and L. DLPFC, and R.and L. middle frontal gyrus, the lower the number of errorresponses (false-positives and false-negatives combined) onthe 2-back task. Statistically significant Pearson correlationcoefficients ranged from −0.25 to −0.28.
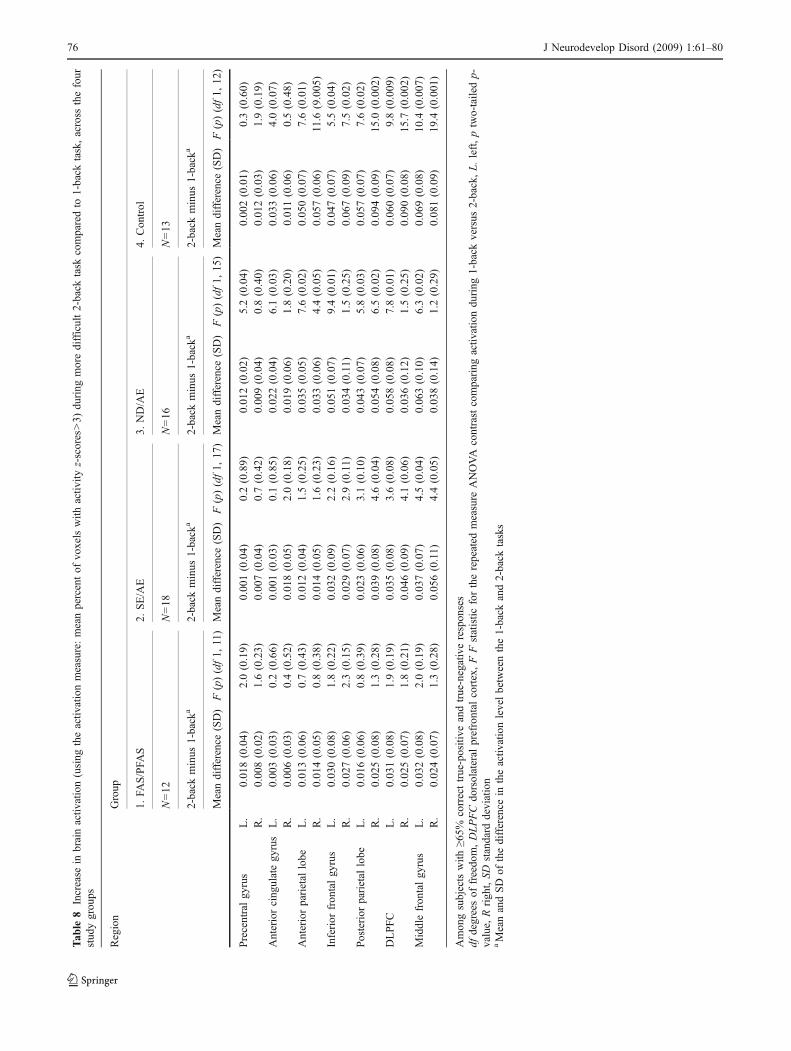
1-back task versus 2-back task Among Controls, activation(mean % of voxels with z-scores>3) was significantlyhigher (2 to five-fold higher) in the 2-back task (2-backcondition relative to control condition) than in the 1-backtask (1-back condition relative to the control condition).This was observed in all areas except the anterior cingulateand precentral regions (Table 8, Figs. 3a–c). Among theFAS/PFAS subjects, activation (mean % of voxels with z-scores>3) was not significantly higher (less than two-foldhigher) in 2-back task relative to 1-back task across allbrain regions (Table 8, Figs. 3a–c). As one advanced acrossthe four study groups, the number of brain regions thatshowed a significant increase in activation in 2-back taskrelative to 1-back task increased (Table 8). The mostmarked contrasts in activation between 1-back and 2-backtasks occurred in the middle frontal, DLPFC, and posteriorparietal lobe regions (Fig. 3c). Important associations wereobserved between N-back performance and neuroactivationlevels. Controls were able to perform equally well on both
J Neurodevelop Disord (2009) 1:61–80 69
Tab
le3
Com
parisonof
performance
andreactio
ntim
eon
the1-back
working
mem
orytasksdu
ring
thefM
RIscan
betweenthefour
stud
ygrou
ps
Group
ANOVA
Taskand(con
ditio
n)a
Respo
nse
1.FA
S/PFA
S2.
SE/AE
3.ND/AE
4.Con
trol
Overall
Postho
cA
prioricontrast.
Lineartrend
Num
berof
respon
ses
Num
berof
respon
ses
Num
berof
respon
ses
Num
berof
respon
ses
Mean(SD)
Mean(SD)
Mean(SD)
Mean(SD)
F(p)e
Dun
canf
F(p)g
N=15
N=22
N=20
N=13
1-back
task
Con
trol:0-back
True-po
sitiv
eb13
.3(1.3)
13.6
(1.1)
13.7
(0.7)
13.8
(0.6)
0.6(0.65)
1.5(0.23)
True-negativ
eb25
.7(0.5)
25.6
(0.9)
25.6
(1.4)
26.0
(0.0)
0.7(0.57)
0.6(0.45)
False-positive
0.3(0.5)
0.4(0.9)
0.4(1.4)
0.0(0.0)
0.7(0.57)
0.6(0.45)
False-negative
0.4(0.09)
0.4(1.1)
0.3(0.7)
0.2(0.6)
0.1(0.93)
0.3(0.56)
Reactiontim
e(m
s)c
734.0(109
.5)
773.3(112
.4)
734.1(97.2)
695.7(103
.5)
1.5(0.22)
1.5(0.22)
Activation:
1-back
True-po
sitiv
ed10
.8(1.2)
10.6
(1.6)
11.3
(1.6)
11.6
(0.6)
1.9(0.14)
7.2(0.058
)True-negativ
ed25
.3(1.8)
26.0
(1.4)
26.6
(0.7)
26.8
(0.4)
4.4(0.007
)12
,34
11.6
(0.001
)False-positive
1.6(1.8)
1.0(1.4)
0.4(0.7)
0.2(0.4)
4.1(0.01)
12,23
410
.9(0.002
)False-negative
2.2(1.2)
2.4(1.6)
1.7(1.6)
1.4(0.5)
1.9(0.13)
3.7(0.058
)Reactiontim
e(m
s)c
862.4(116
.9)
845.2(183
.9)
787.5(101
.3)
710.4(127
.4)
3.5(0.02)
123,
349.7(0.003
)
Amon
gsubjectswith
≥65%
correcttrue-positive
andtrue-negativerespon
sesandable
tolie
still
inthescanner
Dun
canamultip
lecomparisonrang
etest;commas
separate
grou
pswith
homog
eneous
means
atp<0.05
,Ffstatistic,msmillisecon
ds,SD
standard
deviation
aIn
theactiv
ationcond
ition
,sub
jectswereinstructed
torespon
difthestim
ulus
was
thesameas
thestim
ulus
oneslideback
(1-back)
ortwoslides
back
(2-back).Inthecontrolcond
ition
,sub
jects
wereinstructed
torespon
difthestim
ulus
was
aman’sface
bThere
were14
true-positive
and26
true-negativestim
uliin
the0-back
controlcond
ition
cReactiontim
efortrue-positive
andfalse-po
sitiv
erespon
ses
dThere
were12
true-positive
and28
true-negativestim
uliin
theN-backactiv
ationcond
ition
eNum
erator
degreesof
freedo
m=3;
deno
minator
df=totalsamplesize
minus
4fThe
Dun
canrang
etestwas
presentedon
lywhentheOverallF-testfortheANOVAwas
statistically
sign
ificant(p<0.05
)gNum
erator
degreesof
freedo
m=1;
deno
minator
df=totalsamplesize
minus
4
70 J Neurodevelop Disord (2009) 1:61–80
Tab
le4
Com
parisonof
performance
andreactio
ntim
eon
the2-back
working
mem
orytasksdu
ring
thefM
RIscan
betweenthefour
stud
ygrou
ps
Group
ANOVA
Taskand(con
ditio
n)a
Respo
nse
1.FA
S/PFA
S2.
SE/AE
3.ND/AE
4.Con
trol
Overall
Postho
cA
prioricontrast.
Lineartrend
Num
berof
respon
ses
Num
berof
respon
ses
Num
berof
respon
ses
Num
berof
respon
ses
Mean(SD)
Mean(SD)
Mean(SD)
Mean(SD)
F(p)e
Dun
canf
F(p)g
N=13
N=18
N=16
N=13
2-back
task
Con
trol:0-back
True-po
sitiv
eb13
.2(1.7)
13.6
(0.7)
13.3
(1.9)
14.0
(0.0)
1.0(0.41)
1.6(0.21)
True-negativ
eb25
.6(1.0)
25.6
(1.0)
25.7
(1.3)
26.0
(0.0)
0.6(0.62)
1.2(0.28)
False-positive
0.3(0.8)
0.4(1.0)
0.3(1.3)
0.0(0.0)
0.6(0.61)
0.9(0.35)
False-negative
0.8(1.7)
0.4(0.7)
0.7(1.9)
0.0(0.0)
1.0(0.41)
1.6(0.21)
Reactiontim
e(m
s)c
792.8(112
.9)
836.3(154
.3)
777.3(90.1)
712.8(116
.0)
2.6(0.06)
3.9(0.051
)Activation:
2-back
True-po
sitiv
ed8.2(2.5)
7.7(3.0)
10.5
(1.9)
11.5
(1.1)
9.1(0.000
)12
,34
19.5
(0.000
)True-negativ
ed24
.5(2.8)
25.7
(0.8)
25.6
(0.9)
26.4
(1.2)
3.5(0.02)
1,23
49.3(0.004
)False-positive
2.5(2.8)
1.3(0.8)
1.4(0.9)
0.6(1.2)
3.5(0.02)
1,23
49.3(0.004
)False-negative
4.6(2.3)
5.3(3.0)
2.5(1.9)
1.5(1.1)
9.2(0.000
)12
,34
18.6
(0.000
)Reactiontim
e(m
s)c
886.4(146
.5)
970.1(213
.5)
839.3(122
.9)
783.8(197
.4)
3.2(0.03)
123,
134
4.2(0.046
)
Amon
gsubjectswith
≥65%
correcttrue-positive
andtrue-negativerespon
sesandable
tolie
still
inthescanner
Dun
canamultip
lecomparisonrang
etest;commas
separate
grou
pswith
homog
eneous
means
atp<0.05
,Ffstatistic,msmillisecon
ds,ptwo-tailedp-value,
SDstandard
deviation
aIn
theactiv
ationcond
ition
,sub
jectswereinstructed
torespon
difthestim
ulus
was
thesameas
thestim
ulus
oneslideback
(1-back)
ortwoslides
back
(2-back).Inthecontrolcond
ition
,sub
jects
wereinstructed
torespon
difthestim
ulus
was
aman’sface
bThere
were14
true-positive
and26
true-negativestim
uliin
the0-back
controlcond
ition
cReactiontim
efortrue-positive
andfalse-po
sitiv
erespon
ses
dThere
were12
true-positive
and28
true-negativestim
uliin
theN-backactiv
ationcond
ition
eNum
erator
degreesof
freedo
m=3;
deno
minator
df=totalsamplesize
minus
4fThe
Dun
canrang
etestwas
presentedon
lywhentheOverallF-testfortheANOVAwas
statistically
sign
ificant(p<0.05
)gNum
erator
degreesof
freedo
m=1;
deno
minator
df=totalsamplesize
minus
4
J Neurodevelop Disord (2009) 1:61–80 71
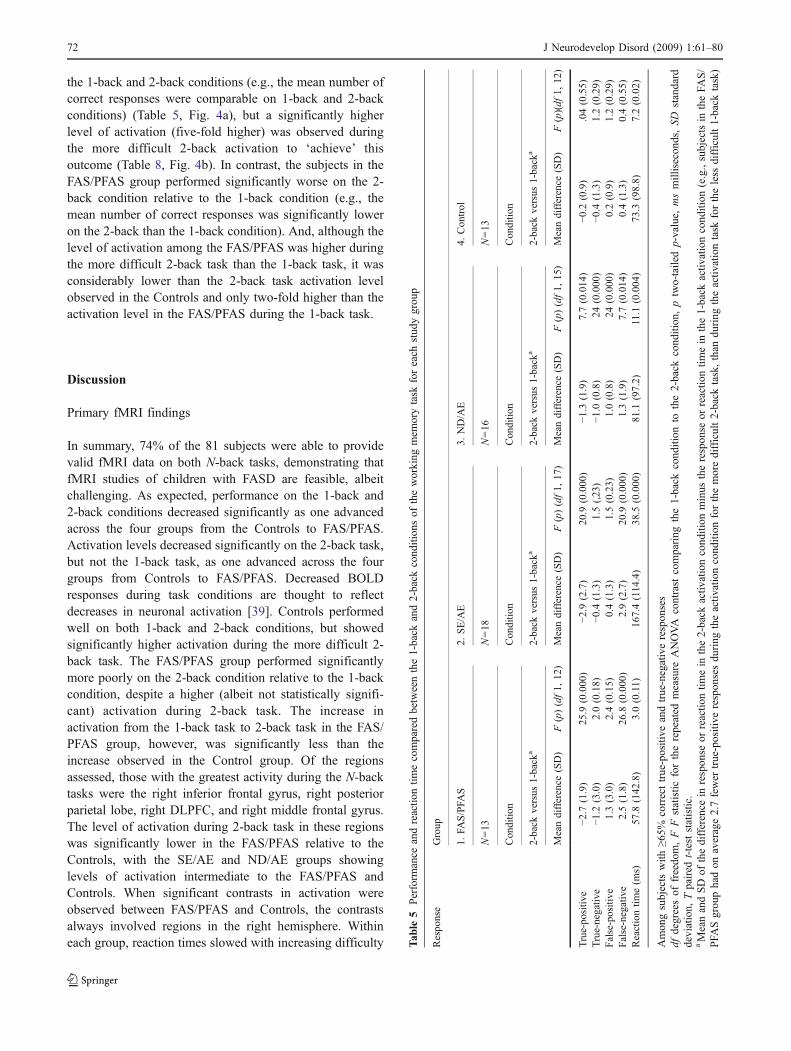
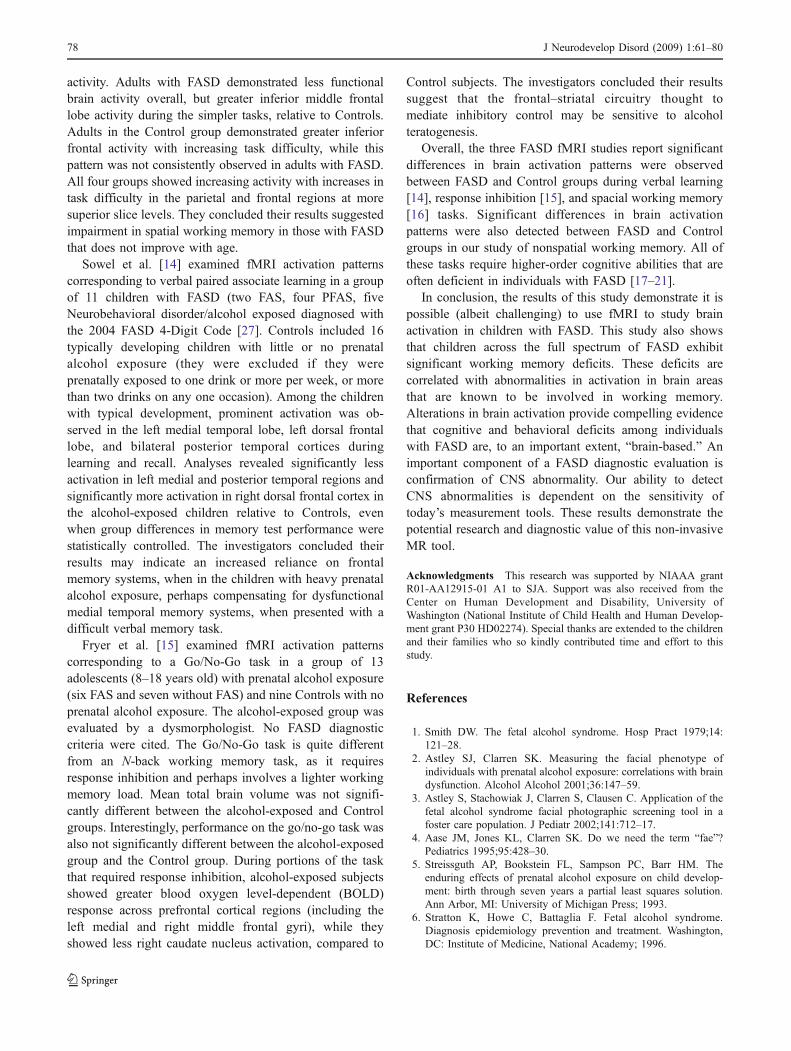
the 1-back and 2-back conditions (e.g., the mean number ofcorrect responses were comparable on 1-back and 2-backconditions) (Table 5, Fig. 4a), but a significantly higherlevel of activation (five-fold higher) was observed duringthe more difficult 2-back activation to ‘achieve’ thisoutcome (Table 8, Fig. 4b). In contrast, the subjects in theFAS/PFAS group performed significantly worse on the 2-back condition relative to the 1-back condition (e.g., themean number of correct responses was significantly loweron the 2-back than the 1-back condition). And, although thelevel of activation among the FAS/PFAS was higher duringthe more difficult 2-back task than the 1-back task, it wasconsiderably lower than the 2-back task activation levelobserved in the Controls and only two-fold higher than theactivation level in the FAS/PFAS during the 1-back task.
Discussion
Primary fMRI findings
In summary, 74% of the 81 subjects were able to providevalid fMRI data on both N-back tasks, demonstrating thatfMRI studies of children with FASD are feasible, albeitchallenging. As expected, performance on the 1-back and2-back conditions decreased significantly as one advancedacross the four groups from the Controls to FAS/PFAS.Activation levels decreased significantly on the 2-back task,but not the 1-back task, as one advanced across the fourgroups from Controls to FAS/PFAS. Decreased BOLDresponses during task conditions are thought to reflectdecreases in neuronal activation [39]. Controls performedwell on both 1-back and 2-back conditions, but showedsignificantly higher activation during the more difficult 2-back task. The FAS/PFAS group performed significantlymore poorly on the 2-back condition relative to the 1-backcondition, despite a higher (albeit not statistically signifi-cant) activation during 2-back task. The increase inactivation from the 1-back task to 2-back task in the FAS/PFAS group, however, was significantly less than theincrease observed in the Control group. Of the regionsassessed, those with the greatest activity during the N-backtasks were the right inferior frontal gyrus, right posteriorparietal lobe, right DLPFC, and right middle frontal gyrus.The level of activation during 2-back task in these regionswas significantly lower in the FAS/PFAS relative to theControls, with the SE/AE and ND/AE groups showinglevels of activation intermediate to the FAS/PFAS andControls. When significant contrasts in activation wereobserved between FAS/PFAS and Controls, the contrastsalways involved regions in the right hemisphere. Withineach group, reaction times slowed with increasing difficulty T
able
5Perform
ance
andreactio
ntim
ecomparedbetweenthe1-back
and2-back
cond
ition
sof
theworking
mem
orytask
foreach
stud
ygrou
p
Respo
nse
Group
1.FA
S/PFA
S2.
SE/AE
3.ND/AE
4.Con
trol
N=13
N=18
N=16
N=13
Conditio
nConditio
nConditio
nConditio
n
2-back
versus
1-back
a2-back
versus
1-back
a2-back
versus
1-back
a2-back
versus
1-back
a
Meandifference
(SD)
F(p)(df1,
12)
Meandifference
(SD)
F(p)(df1,
17)
Meandifference
(SD)
F(p)(df1,
15)
Meandifference
(SD)
F(p)(df
1,12
)
True-po
sitiv
e−2
.7(1.9)
25.9
(0.000
)−2
.9(2.7)
20.9
(0.000
)−1
.3(1.9)
7.7(0.014
)−0
.2(0.9)
.04(0.55)
True-negativ
e−1
.2(3.0)
2.0(0.18)
−0.4
(1.3)
1.5(,23)
−1.0
(0.8)
24(0.000
)−0
.4(1.3)
1.2(0.29)
False-positive
1.3(3.0)
2.4(0.15)
0.4(1.3)
1.5(0.23)
1.0(0.8)
24(0.000
)0.2(0.9)
1.2(0.29)
False-negative
2.5(1.8)
26.8
(0.000)
2.9(2.7)
20.9
(0.000)
1.3(1.9)
7.7(0.014)
0.4(1.3)
0.4(0.55)
Reactiontim
e(m
s)57
.8(142
.8)
3.0(0.11)
167.4(114
.4)
38.5
(0.000
)81
.1(97.2)
11.1
(0.004
)73
.3(98.8)
7.2(0.02)
Amon
gsubjectswith
≥65%
correcttrue-positive
andtrue-negativerespon
ses
dfdegreesof
freedo
m,F
Fstatistic
fortherepeated
measure
ANOVA
contrast
comparing
the1-back
cond
ition
tothe2-back
cond
ition
,ptwo-tailedp-value,
msmillisecon
ds,SD
standard
deviation,
Tpaired
t-teststatistic.
aMeanandSD
ofthedifference
inrespon
seor
reactio
ntim
ein
the2-back
activ
ationcond
ition
minus
therespon
seor
reactio
ntim
ein
the1-back
activ
ationcond
ition
(e.g.,subjectsin
theFA
S/
PFA
Sgrou
phadon
average2.7fewer
true-positive
respon
sesdu
ring
theactiv
ationcond
ition
forthemoredifficult2-back
task,than
during
theactiv
ationtask
fortheless
difficult1-back
task)
72 J Neurodevelop Disord (2009) 1:61–80
of the task. Across the groups, reaction times were slowerin the FASD groups than in the Control group.
All groups in the present study showed comparableactivation in the anterior cingulate region, which isinvolved in affective behaviors, nociception, and executivefunctions [40]. As summarized by Malisza et al. [16], theactivity of this region, which is modulated by task demandsand response selection, has been shown to increase duringworking memory tasks in both children and adults [41–43].These increases, however, may be more closely linked tothe attention demands of working memory tasks, than to thememory demands themselves (which have been associated
with DLPFC and parietal activations) [43]. In one of thefew FASD-fMRI studies conducted to date (and presentedmore fully below), Malisza et al. [16] 4 also reportedconsistent activation in the cingulate region across allsubjects in their FASD and Control groups. They speculat-ed that the consistent activity may reflect the fact thatparticipants were paying comparable attention to the task; aconclusion strengthened by the fact that their FASD andControl groups performed comparably on a continuousperformance task. The consistent anterior cingulate activityobserved across the four study groups in the current studymay also reflect that participants in all four groups were
ControlND/AESE/AEFAS/PFASStudy Group
ControlND/AESE/AEFAS/PFASStudy Group
0.20
0.16
0.12
0.08
0.04
0.00
-0.04
Act
ivat
ion
(%
of
voxe
ls w
ith
Z-s
core
> 3
) m
ean
, 95%
C.I.
Activation During 1-Back Task Across Brain Regions
a
0.20
0.16
0.12
0.08
0.04
0.00
-0.04
Act
ivat
ion
(%
of
voxe
ls w
ith
z-s
core
> 3
) m
ean
95%
C.I.
Activation During 2-Back Across Brain Regions
b
c
Fig. 3 Activation (mean per-cent of voxels with z-scores>3)in right brain regions a 1-backtask. b 2-back task. c 1-backtask versus 2-back task for threeregions with greatest levels ofactivation: right middle frontalgyrus, DLPFC, and posteriorparietal lobe. Key: Brain regionswith valid fMRI data: precentralgyrus (orange), anterior cingu-late gyrus (blue), anterior parie-tal lobe (yellow), inferior frontalgyrus (green), posterior parietallobe (red), dorsolateral prefron-tal cortex (purple), middlefrontal gyrus (black)
J Neurodevelop Disord (2009) 1:61–80 73
paying comparable attention to the task. Perhaps this is anindication that the method used to identify subjects trulyengaged in the tasks (>65% correct true-positive and true-negative responses on the n-back tasks) was successful. It isalso worth noting that event-related fMRI studies [44, 45]have shown activation in the anterior cingulate associatedwith error commission and detection. More specifically,Kiehl et al. [45] used event-related fMRI techniques toexamine the neural responses to appropriate (correct rejectsand correct hits) and inappropriate (errors of commission)behavioral responses during a go/no-go task. Analyses ofthe inappropriate responses revealed extensive activation inthe rostral anterior cingulate cortex and in the left lateralfrontal cortex. These areas were not activated for correctlyclassified trials (correct rejects and correct hits). Althoughsignificantly more N-back commission errors were ob-served among the FAS/PFAS group relative to the Controlsin the current study, anterior cingulate activation was nothigher in the FAS/PFAS group relative to the Controls.Perhaps this reflected an absence of error detection amongthe FAS/PFAS, which could explain, in part, their poorerperformance on N-back. When typically developing sub-jects make an error, their reaction times are typically sloweron the subsequent trial [44, 46]. This phenomenon isconsidered evidence for central error monitoring. Whenreaction times during correct responses and commission
errors were compared between the FAS/PFAS and Controlgroups in the current study, the children with FAS/PFASexhibited significantly less slowing of reaction time aftercommission errors. For Control subjects, the mean reactiontime was significantly slower (mean 207, SD 1.2 ms)during commission errors than during correct responses(mean 115, SD 58 m) (paired t=3l.9, p=0.03) in the 2-backcondition. In contrast, the FAS/PFAS group had comparablereaction times during commission errors and correctresponses (mean 212, SD 64 and mean 183, SD 55respectively) (paired t=0.3, p=0.80). This observationfurther supports that the FAS/PFAS group may not havebeen detecting their errors.
fMRI and working memory in healthy populations
Research on healthy populations suggest regional activationpatterns during working memory tasks that closely mirrorthe findings in our Control group. The DLPFC, posteriorparietal cortex, middle frontal gyrus, and Broca’s area areessential in successful working memory performance [41,47–55]. The middle frontal gyrus is known to be importantfor ongoing storage and maintenance of information [50,56, 57], while posterior parietal lobe is seen activated inmost working memory tasks with some spatial processingcomponent, and DLPFC is highly activated the greater the
Table 6 Brain activation (mean percent of voxels with activity z-scores>3) in regions of interest during the 1-back working memory conditionrelative to the control condition, across the four study groups
Region: in ascending order of activation Group ANOVA
1. FAS/PFAS 2. SE/AE 3. ND/AE 4. Control Overall Post hoc A priori contrast.Linear trendN=15 N=22 N=20 N=13
Mean (SD) Mean (SD) Mean (SD) Mean (SD) F (p)a Duncanb F (p)c
Precentral gyrus L. 0.006 (0.009) 0.010 (0.013) 0.018 (0.056) 0.006 (0.009) 0.6 (0.64) 0.1 (0.86)R. 0.012 (0.028) 0.013 (0.025) 0.020 (0.057) 0.012 (0.020) 0.3 (0.87) 0.1 (0.88)
Anterior cingulate gyrus L. 0.020 (0.049) 0.028 (0.059) 0.010 (0.016) 0.014 (0.023) 0.6 (0.60) 0.4 (0.48)R. 0.019 (0.055) 0.017 (0.035) 0.016 (0.031) 0.012 (0.031) 0.1 (0.99) 0.1 (0.89)
Anterior parietal lobe L. 0.022 (0.022) 0.025 (0.025) 0.029 (0.067) 0.029 (0.036) 0.1 (0.96) 0.2 (0.63)R. 0.019 (0.037) 0.024 (0.033) 0.024 (0.055) 0.012 (0.011) 0.3 (0.79) 0.2 (0.62)
Inferior frontal gyrus L. 0.027 (0.032) 0.047 (0.046) 0.034 (0.043) 0.029 (0.029) 0.0 (0.98) 0.1 (0.87)R. 0.023 (0.029) 0.038 (0.047) 0.039 (0.066) 0.013 (0.021) 1.1 (0.35) 0.2 (0.64)
Posterior parietal lobe L. 0.032 (0.030) 0.036 (0.031) 0.044 (0.078) 0.039 (0.049) 0.2 (0.92) 0.2 (0.62)R. 0.028 (0.036) 0.039 (0.037) 0.045 (0.069) 0.022 (0.023) 0.8 (0.84) 0.1 (0.80)
DLPFC L. 0.029 (0.029) 0.046 (0.034) 0.039 (0.049) 0.037 (0.037) 0.6 (0.63) 0.1 (0.71)R. 0.028 (0.029) 0.045 (0.048) 0.052 (0.083) 0.022 (0.025) 1.1 (0.36) 0.1 (0.89)
Middle frontal gyrus L. 0.031 (0.031) 0.045 (0.033) 0.043 (0.055) 0.043 (0.044) 0.4 (0.76) 0.5 (0.50)R. 0.031 (0.034) 0.050 (0.052) 0.060 (0.029) 0.028 (0.029) 1.0 (0.40) 0.1 (0.98)
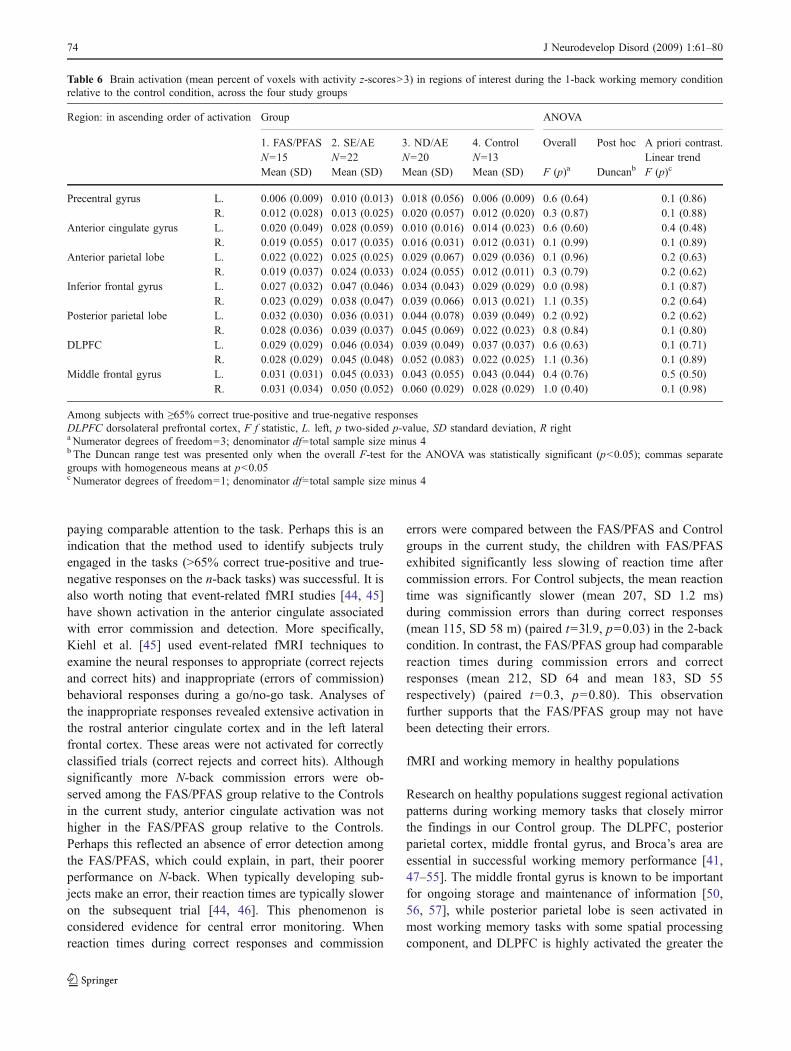
Among subjects with ≥65% correct true-positive and true-negative responsesDLPFC dorsolateral prefrontal cortex, F f statistic, L. left, p two-sided p-value, SD standard deviation, R righta Numerator degrees of freedom=3; denominator df=total sample size minus 4b The Duncan range test was presented only when the overall F-test for the ANOVA was statistically significant (p<0.05); commas separategroups with homogeneous means at p<0.05c Numerator degrees of freedom=1; denominator df=total sample size minus 4
74 J Neurodevelop Disord (2009) 1:61–80
demands of the task [41, 47, 50, 52, 56, 58, 59] Studieshave also observed contrasts in right versus left hemisphereactivation that appear to be influenced by age and type oftask. Positron emission tomography (PET) involvingworking memory tasks have shown predominantly righthemisphere activation in the frontal cortex [51, 60],posterior parietal cortex, and anterior cingulate [43] ofhealthy children and young adults, but bilateral activationin older adults [60]. While spatial working memory tasksactivate bilaterally, there are key regions (DLPFC andposterior parietal cortex) that have shown activation
predominantly in the right-hemisphere [55]. Smith [23]showed object memory activates right DLPFC.
fMRI and working memory in fragile X syndrome
In an fMRI study of visuospatial working memory amongchildren with fragile X syndrome, Kwon et al. [13]observed similar outcomes to the present FASD study.Relative to their comparison group, subjects with fragile Xsyndrome performed significantly worse on the 2-back task,but not on the 1-back task. In a region-of-interest analysis
Table 7 Brain activation in regions of interest during the 2-back working memory condition relative to the control condition, across the fourstudy groups
Region Group ANOVA
1. FAS/PFAS 2.SE/AE 3.ND/AE 4.Control Overall Post hoc A priori contrast.Linear trendN=13 N=18 N=16 N=13
Mean (SD) Mean (SD) Mean (SD) Mean (SD) F (p)a Duncanb F (p)c
Mean percent of voxels with activity z-scores>3Precentral gyrus L. 0.021 (0.04) 0.012 (0.04) 0.016 (0.02) 0.008 (0.01) 0.5 (0.69) 1.1 (0.31)
R. 0.011 (0.02) 0.021 (0.03) 0.019 (0.02) 0.023 (0.03) 0.5 (0.71) 1.0 (0.32)Anterior cingulate gyrus L. 0.012 (0.19) 0.031 (0.09) 0.028 (0.03) 0.047 (0.06) 0.7 (0.54) 1.9 (0.18)
R. 0.017 (0.03) 0.036 (0.09) 0.028 (0.05) 0.029 (0.04) 0.3 (0.84) 0.2 (0.69)Anterior parietal lobe L. 0.043 (0.06) 0.039 (0.04) 0.046 (0.04) 0.080 (0.07) 1.6 (0.19) 3.1 (0.08)
R. 0.032 (0.04) 0.037 (0.05) 0.045 (0.05) 0.069 (0.06) 1.5 (0.24) 3.7 (0.06)Inferior frontal gyrus L. 0.056 (0.08) 0.087 (0.09) 0.068 (0.06) 0.076 (0.06) 0.5 (0.72) 0.2 (0.66)
R. 0.048 (0.06) 0.073 (0.09) 0.062 (0.08) 0.081 (0.08) 0.4 (0.72) 0.9 (0.37)Posterior parietal lobe L. 0.051 (0.07) 0.059 (0.06) 0.065 (0.05) 0.096 (0.07) 1.4 (0.26) 3.5 (0.07)
R. 0.051 (0.07) 0.081 (0.09) 0.080 (0.06) 0.116 (0.09) 3.1 (0.05) 123, 234 4.4 (0.04)DLPFC L. 0.061 (0.08) 0.088 (0.08) 0.083 (0.07) 0.097 (0.06) 0.6 (0.60) 1.4 (0.24)
R. 0.053 (0.06) 0.097 (0.12) 0.076 (0.07) 0.112 (0.08) 3.2 (0.04) 123, 234 2.2 (0.14)Middle frontal gyrus L. 0.064 (0.08) 0.089 (0.08) 0.092 (0.08) 0.112 (0.07) 0.9 (0.46) 2.4 (0.12)
R. 0.056 (0.06) 0.112 (0.13) 0.085 (0.08) 0.132 (0.08) 3.8 (0.01) 123, 234 2.9 (0.10)Mean activity z-score across all voxelsPrecentral gyrus L. −0.36 (0.73) −0.70 (0.81) −0.51 (0.83) −0.78 (0.51) 0.9 (0.48) 1.3 (0.26)
R. −0.37 (0.74) −0.57 (0.89) −0.28 (0.84) −0.23 (0.37) 0.6 (0.59) 0.6 (0.44)Anterior cingulate gyrus L. −0.42 (0.84) −0.13 (1.07) −0.34 (0.71) −0.08 (0.80) 0.5 (0.69) 0.6 (0.45)
R. −0.39 (0.73) −0.25 (1.14) −0.45 (0.81) −0.36 (0.72) 0.2 (0.92) 0.0 (0.92)Anterior parietal lobe L. 0.04 (0.59) −0.27 (0.70) −0.09 (0.66) 0.20 (0.60) 1.4 (0.25) 0.7 (0.41)
R. −0.12 (0.66) −0.43 (0.68) −0.07 (0.68) 0.17 (0.62) 2.1 (0.11) 2.2 (0.14)Inferior frontal gyrus L. −0.03 (0.49) 0.36 (0.90) 0.09 (0.64) 0.27 (0.71) 0.9 (0.46) 0.5 (0.47)
R. −0.01 (0.65) 0.25 (1.04) 0.25 (0.66) 0.50 (0.54) 1.5 (0.23) 2.6 (0.12)Posterior parietal lobe L. 0.07 (0.74) 0.02 (0.74) 0.19 (0.51) 0.41 (0.56) 1.1 (0.38) 2.3 (0.13)
R. 0.02 (0.91) 0.05 (0.86) 0.35 (0.54) 0.65 (0.67) 3.0 (0.04) 123, 34 5.6 (0.02)DLPFC L. 0.05 (0.60) 0.40 (0.80) 0.33 (0.59) 0.46 (0.59) 1.0 (0.41) 2.1 (0.16)
R. 0.03 (0.70) 0.41 (1.08) 0.42 (0.67) 0.74 (0.43) 3.3 (0.03) 123, 234 4.9 (0.03)Middle frontal gyrus L. 0.11 (0.75) 0.43 (0.81) 0.48 (0.63) 0.59 (0.59) 1.1 (0.34) 3.0 (0.09)
R. 0.06 (0.79) 0.51 (1.15) 0.52 (0.77) 0.90 (0.44) 3.9 (0.01) 123, 234 5.8 (0.02)
Among subjects with ≥65% correct true-positive and true-negative responsesDLPFC dorsolateral prefrontal cortex, F f statistic, L. left, p two-tailed p-value, SD standard deviation, R righta Numerator degrees of freedom=3; denominator df=total sample size minus 4b The Duncan range test was presented only when the overall F-test for the ANOVA was statistically significant (p<0.05); commas separategroups with homogeneous means at p<0.05c Numerator degrees of freedom=1; denominator df=total sample size minus 4
J Neurodevelop Disord (2009) 1:61–80 75
Tab
le8
Increase
inbrainactiv
ation(using
theactiv
ationmeasure:meanpercentof
voxelswith
activ
ityz-scores>3)
during
moredifficult2-back
task
comparedto
1-back
task,across
thefour
stud
ygrou
ps
Region
Group
1.FA
S/PFA
S2.
SE/AE
3.ND/AE
4.Con
trol
N=12
N=18
N=16
N=13
2-back
minus
1-back
a2-back
minus
1-back
a2-back
minus
1-back
a2-back
minus
1-back
a
Meandifference
(SD)
F(p)(df1,
11)
Meandifference
(SD)
F(p)(df1,
17)
Meandifference
(SD)
F(p)(df1,
15)
Meandifference
(SD)
F(p)(df1,
12)
Precentralgy
rus
L.
0.01
8(0.04)
2.0(0.19)
0.00
1(0.04)
0.2(0.89)
0.01
2(0.02)
5.2(0.04)
0.00
2(0.01)
0.3(0.60)
R.
0.00
8(0.02)
1.6(0.23)
0.00
7(0.04)
0.7(0.42)
0.00
9(0.04)
0.8(0.40)
0.01
2(0.03)
1.9(0.19)
Anteriorcing
ulategy
rus
L.
0.00
3(0.03)
0.2(0.66)
0.00
1(0.03)
0.1(0.85)
0.02
2(0.04)
6.1(0.03)
0.03
3(0.06)
4.0(0.07)
R.
0.00
6(0.03)
0.4(0.52)
0.01
8(0.05)
2.0(0.18)
0.01
9(0.06)
1.8(0.20)
0.011(0.06)
0.5(0.48)
Anteriorparietal
lobe
L.
0.01
3(0.06)
0.7(0.43)
0.01
2(0.04)
1.5(0.25)
0.03
5(0.05)
7.6(0.02)
0.05
0(0.07)
7.6(0.01)
R.
0.01
4(0.05)
0.8(0.38)
0.01
4(0.05)
1.6(0.23)
0.03
3(0.06)
4.4(0.05)
0.05
7(0.06)
11.6
(9.005
)Inferior
fron
talgy
rus
L.
0.03
0(0.08)
1.8(0.22)
0.03
2(0.09)
2.2(0.16)
0.05
1(0.07)
9.4(0.01)
0.04
7(0.07)
5.5(0.04)
R.
0.02
7(0.06)
2.3(0.15)
0.02
9(0.07)
2.9(0.11)
0.03
4(0.11)
1.5(0.25)
0.06
7(0.09)
7.5(0.02)
Posterior
parietal
lobe
L.
0.01
6(0.06)
0.8(0.39)
0.02
3(0.06)
3.1(0.10)
0.04
3(0.07)
5.8(0.03)
0.05
7(0.07)
7.6(0.02)
R.
0.02
5(0.08)
1.3(0.28)
0.03
9(0.08)
4.6(0.04)
0.05
4(0.08)
6.5(0.02)
0.09
4(0.09)
15.0
(0.002
)DLPFC
L.
0.03
1(0.08)
1.9(0.19)
0.03
5(0.08)
3.6(0.08)
0.05
8(0.08)
7.8(0.01)
0.06
0(0.07)
9.8(0.009
)R.
0.02
5(0.07)
1.8(0.21)
0.04
6(0.09)
4.1(0.06)
0.03
6(0.12)
1.5(0.25)
0.09
0(0.08)
15.7
(0.002
)Middlefron
talgy
rus
L.
0.03
2(0.08)
2.0(0.19)
0.03
7(0.07)
4.5(0.04)
0.06
3(0.10)
6.3(0.02)
0.06
9(0.08)
10.4
(0.007
)R.
0.02
4(0.07)
1.3(0.28)
0.05
6(0.11)
4.4(0.05)
0.03
8(0.14)
1.2(0.29)
0.08
1(0.09)
19.4
(0.001
)
Amon
gsubjectswith
≥65%
correcttrue-positive
andtrue-negativerespon
ses
dfdegreesof
freedo
m,DLPFCdo
rsolateral
prefrontal
cortex,FFstatistic
fortherepeated
measure
ANOVA
contrastcomparing
activ
ationdu
ring
1-back
versus
2-back,L.left,ptwo-tailedp-
value,
Rrigh
t,SD
standard
deviation
aMeanandSD
ofthedifference
intheactiv
ationlevelbetweenthe1-back
and2-back
tasks
76 J Neurodevelop Disord (2009) 1:61–80
focused on the inferior frontal gyrus, middle frontal gyrus,superior parietal lobule, and supramarginal gyrus, compar-ison subjects showed significantly increased brain activa-tion between the 1-back and 2-back tasks, but subjects withfragile X syndrome showed no change in activationbetween the two tasks. The investigators concluded thatsubjects with fragile X syndrome were unable to modulateactivation in the prefrontal and parietal cortex in responseto an increasing working memory load. They speculatedthese findings may be explained by a ceiling effect. Thesubjects with fragile X syndrome may have recruited all oftheir neuronal resources needed for working memory in the1-back task. In the 2-back task, the fragile X syndromegroup experienced significant deterioration in performancewith a lack of coherent recruitment in areas subservingworking memory.
It is interesting to note in the current study that duringthe 1-back task, the FAS/PFAS group exhibited activationlevels that were comparable (if not slightly higher) than theControls, but demonstrated significantly poorer 1-backperformance. During the more difficult 2-back task, bothactivation and performance were significantly lower in theFAS/PFAS group than the Control group. One mightspeculate that the 1-back outcome reflected ‘neural ineffi-ciency’ [12, 61], while the 2-back outcome reflected a‘ceiling effect’ [13]. What is ‘neuronal inefficiency’? Casey[12] postulated in an fMRI study of nonspatial workingmemory in healthy children, that incomplete myelinationmay result in poorer conduction efficiency and thus greaterenergy expenditure. And, in an fMRI study of workingmemory in girls with and without ADHD, significantlyhigher activation in the DLPFC was observed among thegirls with ADHD, despite comparable working memoryperformance [61]. The investigators interpreted these find-ings as evidence of neural inefficiency. In the present FASDstudy, evidence of significant white matter/myelin deficien-cies, and poorer performance despite comparable activationlevels were observed in the FAS/PFAS group relative to the
Controls. One could postulate that if the requisite neuronalresources for the 1-back task were deficient and/orinefficient in our FAS/PFAS group, comparable activationcould have produced inferior performance. When the moredifficult 2-back task is encountered, a ceiling effect [13]may have occurred. The Control group demonstrated that asignificantly higher level of activation was required toachieve accurate performance on the more difficult 2-backtask. The FAS/PFAS group may have been activating all ofthe neuronal resources they had, but the resources were toodeficient, not just inefficient, to achieve comparableactivation or performance.
FASD fMRI studies
To our knowledge, only three fMRI-FASD studies havebeen published to date [14–16]. Marlisza et al. [16]examined fMRI activation patterns corresponding to N-back spatial working memory tasks in adults and childrenwith FASD, and in age- and sex-matched Controls. It isimportant to note their subjects with FASD performed toopoorly on the 2-back task to include these findings, so itwas dropped from all analyses. To be included in theiranalyses, all participants had to achieve a minimum of 50%correct responses on the Simple task, and on at least one ofthe remaining N-back tasks (Blank or 1-back). Completedata were available for 23 children (nine FASD, 14Controls) and 19 adults (ten FASD and nine Controls).Subjects with FASD were diagnosed with FAS, partial FAS,or ARND in accordance with the Canadian FASD diagnos-tic guidelines [32]. The Canadian diagnostic criteria arenear identical to the FASD 4-Digit Diagnostic Code used inthe present study. Children with FASD displayed greaterinferior-middle frontal lobe activity, while greater superiorfrontal and parietal lobe activity was observed in Controls.Children in the Control group also showed an overallincrease in frontal lobe activity with increasing taskdifficulty, while children with FASD showed decreased
2-Back1-Back 2-Back1-Back 2-Back1-Back 2-Back1-Back
40
38
36
34
32
30
Nu
mb
er o
f T
P +
TN
Res
po
nse
s (m
ean
, 95%
C.I.
)
1-Back versus 2-Back, Correct ResponsesFAS/PFAS SE/AE ND/AE Controls FAS/PFAS SE/AE ND/AE Controls
a
2-Back1-Back
0.15
0.10
0.05
0.00
Act
ivat
ion
(%
of
voxe
ls w
ith
z-s
core
> 3
) m
ean
, 95%
C.I.
2-Back1-Back 2-Back1-Back 2-Back1-Back
1-Back versus 2-Back, Activation in R. DLPFCbFig. 4 a Mean number of cor-rect (true-positive and true-negative) responses during 1-back versus 2-back conditionsacross the four groups. b In-crease in activation (mean per-cent of voxels with z-score>3)during 1-back task versus 2-back task across the four groupsin the right dorsolateral prefron-tal cortex (DLPFC)
J Neurodevelop Disord (2009) 1:61–80 77
activity. Adults with FASD demonstrated less functionalbrain activity overall, but greater inferior middle frontallobe activity during the simpler tasks, relative to Controls.Adults in the Control group demonstrated greater inferiorfrontal activity with increasing task difficulty, while thispattern was not consistently observed in adults with FASD.All four groups showed increasing activity with increases intask difficulty in the parietal and frontal regions at moresuperior slice levels. They concluded their results suggestedimpairment in spatial working memory in those with FASDthat does not improve with age.
Sowel et al. [14] examined fMRI activation patternscorresponding to verbal paired associate learning in a groupof 11 children with FASD (two FAS, four PFAS, fiveNeurobehavioral disorder/alcohol exposed diagnosed withthe 2004 FASD 4-Digit Code [27]. Controls included 16typically developing children with little or no prenatalalcohol exposure (they were excluded if they wereprenatally exposed to one drink or more per week, or morethan two drinks on any one occasion). Among the childrenwith typical development, prominent activation was ob-served in the left medial temporal lobe, left dorsal frontallobe, and bilateral posterior temporal cortices duringlearning and recall. Analyses revealed significantly lessactivation in left medial and posterior temporal regions andsignificantly more activation in right dorsal frontal cortex inthe alcohol-exposed children relative to Controls, evenwhen group differences in memory test performance werestatistically controlled. The investigators concluded theirresults may indicate an increased reliance on frontalmemory systems, when in the children with heavy prenatalalcohol exposure, perhaps compensating for dysfunctionalmedial temporal memory systems, when presented with adifficult verbal memory task.
Fryer et al. [15] examined fMRI activation patternscorresponding to a Go/No-Go task in a group of 13adolescents (8–18 years old) with prenatal alcohol exposure(six FAS and seven without FAS) and nine Controls with noprenatal alcohol exposure. The alcohol-exposed group wasevaluated by a dysmorphologist. No FASD diagnosticcriteria were cited. The Go/No-Go task is quite differentfrom an N-back working memory task, as it requiresresponse inhibition and perhaps involves a lighter workingmemory load. Mean total brain volume was not signifi-cantly different between the alcohol-exposed and Controlgroups. Interestingly, performance on the go/no-go task wasalso not significantly different between the alcohol-exposedgroup and the Control group. During portions of the taskthat required response inhibition, alcohol-exposed subjectsshowed greater blood oxygen level-dependent (BOLD)response across prefrontal cortical regions (including theleft medial and right middle frontal gyri), while theyshowed less right caudate nucleus activation, compared to
Control subjects. The investigators concluded their resultssuggest that the frontal–striatal circuitry thought tomediate inhibitory control may be sensitive to alcoholteratogenesis.
Overall, the three FASD fMRI studies report significantdifferences in brain activation patterns were observedbetween FASD and Control groups during verbal learning[14], response inhibition [15], and spacial working memory[16] tasks. Significant differences in brain activationpatterns were also detected between FASD and Controlgroups in our study of nonspatial working memory. All ofthese tasks require higher-order cognitive abilities that areoften deficient in individuals with FASD [17–21].
In conclusion, the results of this study demonstrate it ispossible (albeit challenging) to use fMRI to study brainactivation in children with FASD. This study also showsthat children across the full spectrum of FASD exhibitsignificant working memory deficits. These deficits arecorrelated with abnormalities in activation in brain areasthat are known to be involved in working memory.Alterations in brain activation provide compelling evidencethat cognitive and behavioral deficits among individualswith FASD are, to an important extent, “brain-based.” Animportant component of a FASD diagnostic evaluation isconfirmation of CNS abnormality. Our ability to detectCNS abnormalities is dependent on the sensitivity oftoday’s measurement tools. These results demonstrate thepotential research and diagnostic value of this non-invasiveMR tool.
Acknowledgments This research was supported by NIAAA grantR01-AA12915-01 A1 to SJA. Support was also received from theCenter on Human Development and Disability, University ofWashington (National Institute of Child Health and Human Develop-ment grant P30 HD02274). Special thanks are extended to the childrenand their families who so kindly contributed time and effort to thisstudy.
References
1. Smith DW. The fetal alcohol syndrome. Hosp Pract 1979;14:121–28.
2. Astley SJ, Clarren SK. Measuring the facial phenotype ofindividuals with prenatal alcohol exposure: correlations with braindysfunction. Alcohol Alcohol 2001;36:147–59.
3. Astley S, Stachowiak J, Clarren S, Clausen C. Application of thefetal alcohol syndrome facial photographic screening tool in afoster care population. J Pediatr 2002;141:712–17.
4. Aase JM, Jones KL, Clarren SK. Do we need the term “fae”?Pediatrics 1995;95:428–30.
5. Streissguth AP, Bookstein FL, Sampson PC, Barr HM. Theenduring effects of prenatal alcohol exposure on child develop-ment: birth through seven years a partial least squares solution.Ann Arbor, MI: University of Michigan Press; 1993.
6. Stratton K, Howe C, Battaglia F. Fetal alcohol syndrome.Diagnosis epidemiology prevention and treatment. Washington,DC: Institute of Medicine, National Academy; 1996.
78 J Neurodevelop Disord (2009) 1:61–80
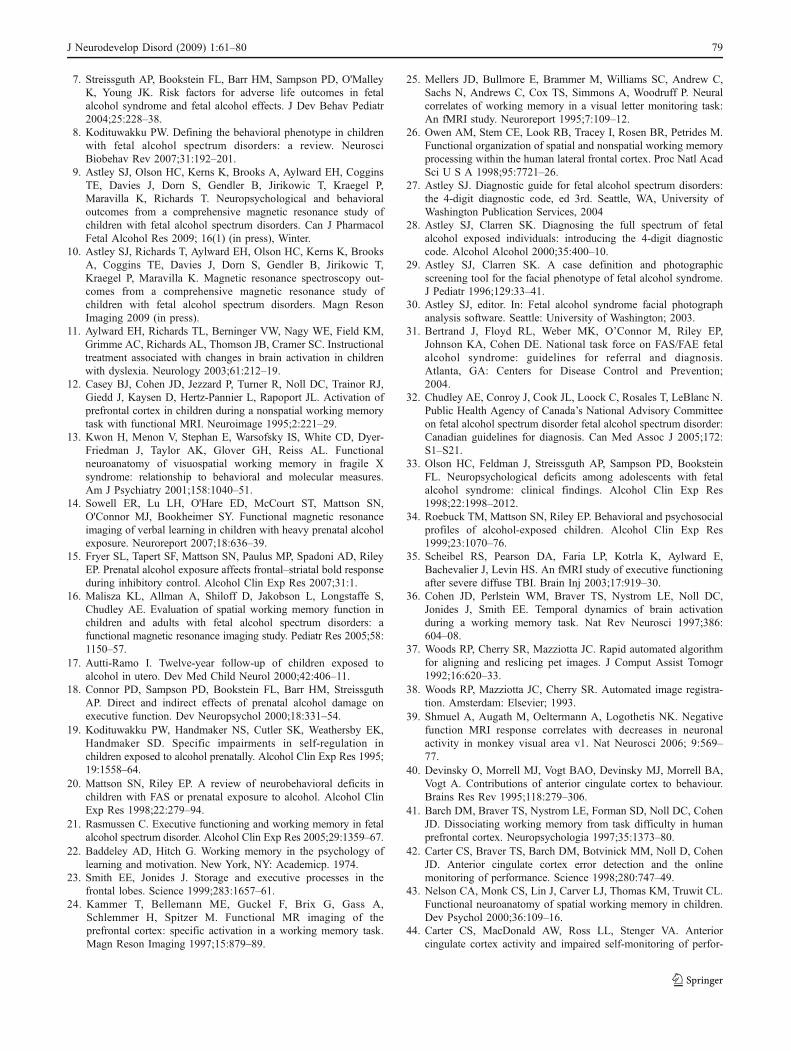
7. Streissguth AP, Bookstein FL, Barr HM, Sampson PD, O'MalleyK, Young JK. Risk factors for adverse life outcomes in fetalalcohol syndrome and fetal alcohol effects. J Dev Behav Pediatr2004;25:228–38.
8. Kodituwakku PW. Defining the behavioral phenotype in childrenwith fetal alcohol spectrum disorders: a review. NeurosciBiobehav Rev 2007;31:192–201.
9. Astley SJ, Olson HC, Kerns K, Brooks A, Aylward EH, CogginsTE, Davies J, Dorn S, Gendler B, Jirikowic T, Kraegel P,Maravilla K, Richards T. Neuropsychological and behavioraloutcomes from a comprehensive magnetic resonance study ofchildren with fetal alcohol spectrum disorders. Can J PharmacolFetal Alcohol Res 2009; 16(1) (in press), Winter.
10. Astley SJ, Richards T, Aylward EH, Olson HC, Kerns K, BrooksA, Coggins TE, Davies J, Dorn S, Gendler B, Jirikowic T,Kraegel P, Maravilla K. Magnetic resonance spectroscopy out-comes from a comprehensive magnetic resonance study ofchildren with fetal alcohol spectrum disorders. Magn ResonImaging 2009 (in press).
11. Aylward EH, Richards TL, Berninger VW, Nagy WE, Field KM,Grimme AC, Richards AL, Thomson JB, Cramer SC. Instructionaltreatment associated with changes in brain activation in childrenwith dyslexia. Neurology 2003;61:212–19.
12. Casey BJ, Cohen JD, Jezzard P, Turner R, Noll DC, Trainor RJ,Giedd J, Kaysen D, Hertz-Pannier L, Rapoport JL. Activation ofprefrontal cortex in children during a nonspatial working memorytask with functional MRI. Neuroimage 1995;2:221–29.
13. Kwon H, Menon V, Stephan E, Warsofsky IS, White CD, Dyer-Friedman J, Taylor AK, Glover GH, Reiss AL. Functionalneuroanatomy of visuospatial working memory in fragile Xsyndrome: relationship to behavioral and molecular measures.Am J Psychiatry 2001;158:1040–51.
14. Sowell ER, Lu LH, O'Hare ED, McCourt ST, Mattson SN,O'Connor MJ, Bookheimer SY. Functional magnetic resonanceimaging of verbal learning in children with heavy prenatal alcoholexposure. Neuroreport 2007;18:636–39.
15. Fryer SL, Tapert SF, Mattson SN, Paulus MP, Spadoni AD, RileyEP. Prenatal alcohol exposure affects frontal–striatal bold responseduring inhibitory control. Alcohol Clin Exp Res 2007;31:1.
16. Malisza KL, Allman A, Shiloff D, Jakobson L, Longstaffe S,Chudley AE. Evaluation of spatial working memory function inchildren and adults with fetal alcohol spectrum disorders: afunctional magnetic resonance imaging study. Pediatr Res 2005;58:1150–57.
17. Autti-Ramo I. Twelve-year follow-up of children exposed toalcohol in utero. Dev Med Child Neurol 2000;42:406–11.
18. Connor PD, Sampson PD, Bookstein FL, Barr HM, StreissguthAP. Direct and indirect effects of prenatal alcohol damage onexecutive function. Dev Neuropsychol 2000;18:331–54.
19. Kodituwakku PW, Handmaker NS, Cutler SK, Weathersby EK,Handmaker SD. Specific impairments in self-regulation inchildren exposed to alcohol prenatally. Alcohol Clin Exp Res 1995;19:1558–64.
20. Mattson SN, Riley EP. A review of neurobehavioral deficits inchildren with FAS or prenatal exposure to alcohol. Alcohol ClinExp Res 1998;22:279–94.
21. Rasmussen C. Executive functioning and working memory in fetalalcohol spectrum disorder. Alcohol Clin Exp Res 2005;29:1359–67.
22. Baddeley AD, Hitch G. Working memory in the psychology oflearning and motivation. New York, NY: Academicp. 1974.
23. Smith EE, Jonides J. Storage and executive processes in thefrontal lobes. Science 1999;283:1657–61.
24. Kammer T, Bellemann ME, Guckel F, Brix G, Gass A,Schlemmer H, Spitzer M. Functional MR imaging of theprefrontal cortex: specific activation in a working memory task.Magn Reson Imaging 1997;15:879–89.
25. Mellers JD, Bullmore E, Brammer M, Williams SC, Andrew C,Sachs N, Andrews C, Cox TS, Simmons A, Woodruff P. Neuralcorrelates of working memory in a visual letter monitoring task:An fMRI study. Neuroreport 1995;7:109–12.
26. Owen AM, Stem CE, Look RB, Tracey I, Rosen BR, Petrides M.Functional organization of spatial and nonspatial working memoryprocessing within the human lateral frontal cortex. Proc Natl AcadSci U S A 1998;95:7721–26.
27. Astley SJ. Diagnostic guide for fetal alcohol spectrum disorders:the 4-digit diagnostic code, ed 3rd. Seattle, WA, University ofWashington Publication Services, 2004
28. Astley SJ, Clarren SK. Diagnosing the full spectrum of fetalalcohol exposed individuals: introducing the 4-digit diagnosticcode. Alcohol Alcohol 2000;35:400–10.
29. Astley SJ, Clarren SK. A case definition and photographicscreening tool for the facial phenotype of fetal alcohol syndrome.J Pediatr 1996;129:33–41.
30. Astley SJ, editor. In: Fetal alcohol syndrome facial photographanalysis software. Seattle: University of Washington; 2003.
31. Bertrand J, Floyd RL, Weber MK, O’Connor M, Riley EP,Johnson KA, Cohen DE. National task force on FAS/FAE fetalalcohol syndrome: guidelines for referral and diagnosis.Atlanta, GA: Centers for Disease Control and Prevention;2004.
32. Chudley AE, Conroy J, Cook JL, Loock C, Rosales T, LeBlanc N.Public Health Agency of Canada’s National Advisory Committeeon fetal alcohol spectrum disorder fetal alcohol spectrum disorder:Canadian guidelines for diagnosis. Can Med Assoc J 2005;172:S1–S21.
33. Olson HC, Feldman J, Streissguth AP, Sampson PD, BooksteinFL. Neuropsychological deficits among adolescents with fetalalcohol syndrome: clinical findings. Alcohol Clin Exp Res1998;22:1998–2012.
34. Roebuck TM, Mattson SN, Riley EP. Behavioral and psychosocialprofiles of alcohol-exposed children. Alcohol Clin Exp Res1999;23:1070–76.
35. Scheibel RS, Pearson DA, Faria LP, Kotrla K, Aylward E,Bachevalier J, Levin HS. An fMRI study of executive functioningafter severe diffuse TBI. Brain Inj 2003;17:919–30.
36. Cohen JD, Perlstein WM, Braver TS, Nystrom LE, Noll DC,Jonides J, Smith EE. Temporal dynamics of brain activationduring a working memory task. Nat Rev Neurosci 1997;386:604–08.
37. Woods RP, Cherry SR, Mazziotta JC. Rapid automated algorithmfor aligning and reslicing pet images. J Comput Assist Tomogr1992;16:620–33.
38. Woods RP, Mazziotta JC, Cherry SR. Automated image registra-tion. Amsterdam: Elsevier; 1993.
39. Shmuel A, Augath M, Oeltermann A, Logothetis NK. Negativefunction MRI response correlates with decreases in neuronalactivity in monkey visual area v1. Nat Neurosci 2006; 9:569–77.
40. Devinsky O, Morrell MJ, Vogt BAO, Devinsky MJ, Morrell BA,Vogt A. Contributions of anterior cingulate cortex to behaviour.Brains Res Rev 1995;118:279–306.
41. Barch DM, Braver TS, Nystrom LE, Forman SD, Noll DC, CohenJD. Dissociating working memory from task difficulty in humanprefrontal cortex. Neuropsychologia 1997;35:1373–80.
42. Carter CS, Braver TS, Barch DM, Botvinick MM, Noll D, CohenJD. Anterior cingulate cortex error detection and the onlinemonitoring of performance. Science 1998;280:747–49.
43. Nelson CA, Monk CS, Lin J, Carver LJ, Thomas KM, Truwit CL.Functional neuroanatomy of spatial working memory in children.Dev Psychol 2000;36:109–16.
44. Carter CS, MacDonald AW, Ross LL, Stenger VA. Anteriorcingulate cortex activity and impaired self-monitoring of perfor-
J Neurodevelop Disord (2009) 1:61–80 79
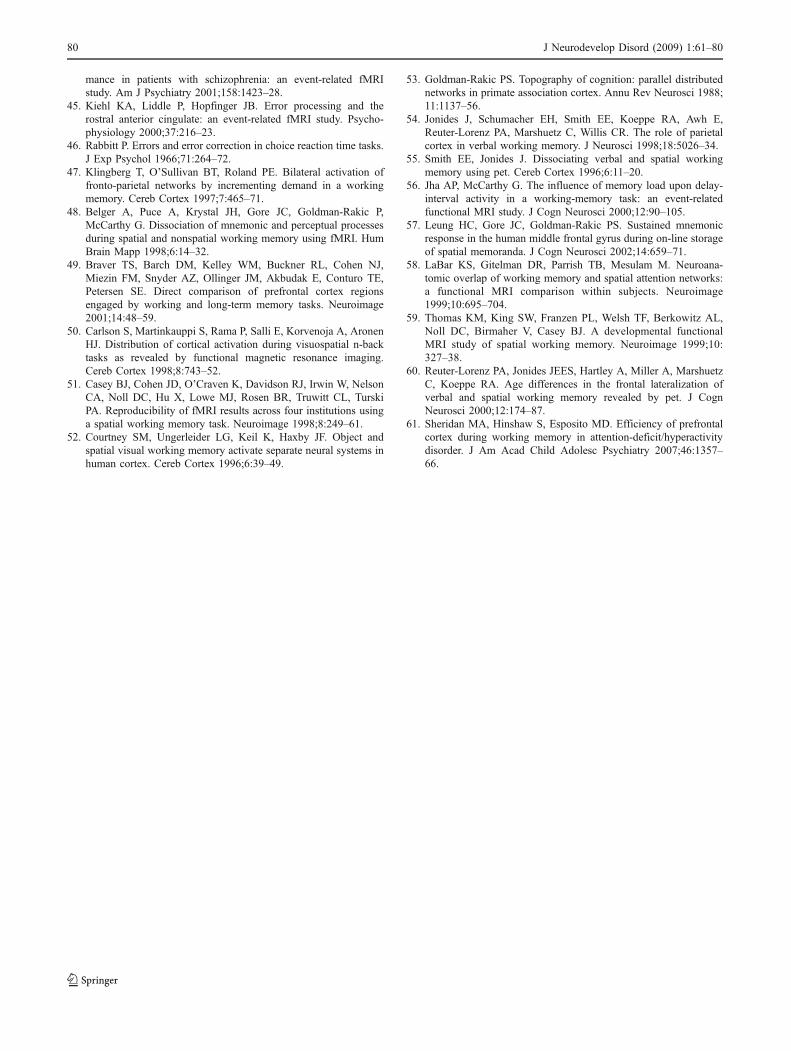
mance in patients with schizophrenia: an event-related fMRIstudy. Am J Psychiatry 2001;158:1423–28.
45. Kiehl KA, Liddle P, Hopfinger JB. Error processing and therostral anterior cingulate: an event-related fMRI study. Psycho-physiology 2000;37:216–23.
46. Rabbitt P. Errors and error correction in choice reaction time tasks.J Exp Psychol 1966;71:264–72.
47. Klingberg T, O’Sullivan BT, Roland PE. Bilateral activation offronto-parietal networks by incrementing demand in a workingmemory. Cereb Cortex 1997;7:465–71.
48. Belger A, Puce A, Krystal JH, Gore JC, Goldman-Rakic P,McCarthy G. Dissociation of mnemonic and perceptual processesduring spatial and nonspatial working memory using fMRI. HumBrain Mapp 1998;6:14–32.
49. Braver TS, Barch DM, Kelley WM, Buckner RL, Cohen NJ,Miezin FM, Snyder AZ, Ollinger JM, Akbudak E, Conturo TE,Petersen SE. Direct comparison of prefrontal cortex regionsengaged by working and long-term memory tasks. Neuroimage2001;14:48–59.
50. Carlson S, Martinkauppi S, Rama P, Salli E, Korvenoja A, AronenHJ. Distribution of cortical activation during visuospatial n-backtasks as revealed by functional magnetic resonance imaging.Cereb Cortex 1998;8:743–52.
51. Casey BJ, Cohen JD, O’Craven K, Davidson RJ, Irwin W, NelsonCA, Noll DC, Hu X, Lowe MJ, Rosen BR, Truwitt CL, TurskiPA. Reproducibility of fMRI results across four institutions usinga spatial working memory task. Neuroimage 1998;8:249–61.
52. Courtney SM, Ungerleider LG, Keil K, Haxby JF. Object andspatial visual working memory activate separate neural systems inhuman cortex. Cereb Cortex 1996;6:39–49.
53. Goldman-Rakic PS. Topography of cognition: parallel distributednetworks in primate association cortex. Annu Rev Neurosci 1988;11:1137–56.
54. Jonides J, Schumacher EH, Smith EE, Koeppe RA, Awh E,Reuter-Lorenz PA, Marshuetz C, Willis CR. The role of parietalcortex in verbal working memory. J Neurosci 1998;18:5026–34.
55. Smith EE, Jonides J. Dissociating verbal and spatial workingmemory using pet. Cereb Cortex 1996;6:11–20.
56. Jha AP, McCarthy G. The influence of memory load upon delay-interval activity in a working-memory task: an event-relatedfunctional MRI study. J Cogn Neurosci 2000;12:90–105.
57. Leung HC, Gore JC, Goldman-Rakic PS. Sustained mnemonicresponse in the human middle frontal gyrus during on-line storageof spatial memoranda. J Cogn Neurosci 2002;14:659–71.
58. LaBar KS, Gitelman DR, Parrish TB, Mesulam M. Neuroana-tomic overlap of working memory and spatial attention networks:a functional MRI comparison within subjects. Neuroimage1999;10:695–704.
59. Thomas KM, King SW, Franzen PL, Welsh TF, Berkowitz AL,Noll DC, Birmaher V, Casey BJ. A developmental functionalMRI study of spatial working memory. Neuroimage 1999;10:327–38.
60. Reuter-Lorenz PA, Jonides JEES, Hartley A, Miller A, MarshuetzC, Koeppe RA. Age differences in the frontal lateralization ofverbal and spatial working memory revealed by pet. J CognNeurosci 2000;12:174–87.
61. Sheridan MA, Hinshaw S, Esposito MD. Efficiency of prefrontalcortex during working memory in attention-deficit/hyperactivitydisorder. J Am Acad Child Adolesc Psychiatry 2007;46:1357–66.
80 J Neurodevelop Disord (2009) 1:61–80