Embed Size (px)
Citation preview

1
Full-year results presentation 2013
Zurich, 26 February 2014
Practitioners of the craft of private banking

2
Disclaimer
This presentation has been prepared by EFG International AG solely for use by you for general
information only and does not contain and is not to be taken as containing any securities advice,
recommendation, offer or invitation to subscribe for or purchase or redemption of any securities
regarding EFG International AG.
This presentation contains specific forward-looking statements, e.g. statements which include
terms like "believe", "assume", "expect" or similar expressions. Such forward-looking statements
represent EFG International AG’s judgements and expectations and are subject to known and
unknown risks, uncertainties and other factors which may result in a substantial divergence
between the actual results, the financial situation, and/or the development or performance of the
company and those explicitly or implicitly presumed in these statements. These factors include,
but are not limited to: (1) general market, macroeconomic, governmental and regulatory trends, (2)
movements in securities markets, exchange rates and interest rates, (3) competitive pressures, (4)
no additional cost will be incurred in connection with the businesses closed or exited further to the
business review announced on 18 October 2011, and (5) other risks and uncertainties inherent in
our business. EFG International AG is not under any obligation to (and expressly disclaims any
such obligation to) update or alter its forward-looking statements, whether as a result of new
information, future events or otherwise, except as required by applicable law or regulation.

3
§
Introduction
Financial performance
Current status, outlook
John Williamson, CEO

4
Financials summary
IFRS net profit CHF 111.8 m
IFRS net profit attributable to ordinary shareholders CHF 110.9 m
Underlying recurring net profit to ordinary shareholders* CHF 111.2 m
Operating income CHF 666.0 m
Revenue margin 88 bps
Net new assets – continuing businesses CHF 3.2 bn**
Net new assets - total CHF 2.5 bn
Revenue-generating AUM CHF 75.9 bn
Operating expenses CHF 547.2 m
Cost-income ratio 81.5%
CROs 435
Total headcount 1,989
BIS total capital ratio (Basel III) 18.0%
CET 1 capital ratio (Basel III) 13.5%
Return on shareholders’ equity 11.3%
vs. 2012 restated
from 93 bps
0.5%
7.6%
0.3%
12.0%
4.5%
1.3%
from 15.9%
from 10.8%
0.9%
from CHF 3.0 bn
from CHF (0.2) bn
from 78.8%
from 414
from 11.7%
* Excluding impact of non-recurring items ** Adjusted for one-off single stock outflow: CHF 0.6 bn

5
Performance impacted by industry-wide pressures
Market conditions
• Economic and market conditions still fragile.
• Client sentiment remains volatile – particular constraint during Q3.
• Low interest rates - lower asset and liability management revenues.
• Swiss franc remains strong.
Regulatory and legal
• Exceptional legal and regulatory expenses.
• US Tax Programme, Category 2.
• In Asia, regulatory changes relating to affluent clients.

6
Committed to growth & step-change in profits
• Business review completed. As a result, business simplified and risks lessened.
• Strong commitment to regulatory compliance. External assessment confirmed
approach in line with leading peers. Ongoing investment.
• Quality of earnings improved – mainstream private banking revenues increasing.
• Progress in relation to NNA. Slower in H2, but mitigating factors.
• CRO hiring up significantly.
• Recent small acquisition of Falcon Private Bank in Asia.
• Relocated head office to a prestige building; room to grow.
• Successfully rebranded.
• Organisational changes designed to deliver growth.
• Improved profitability and capital strength enables, as evidenced this year,
a more progressive dividend policy.
Number, range and quickening pace of growth-related initiatives.

7
§
Introduction
Financial performance
Current status, outlook
Giorgio Pradelli, CFO
8
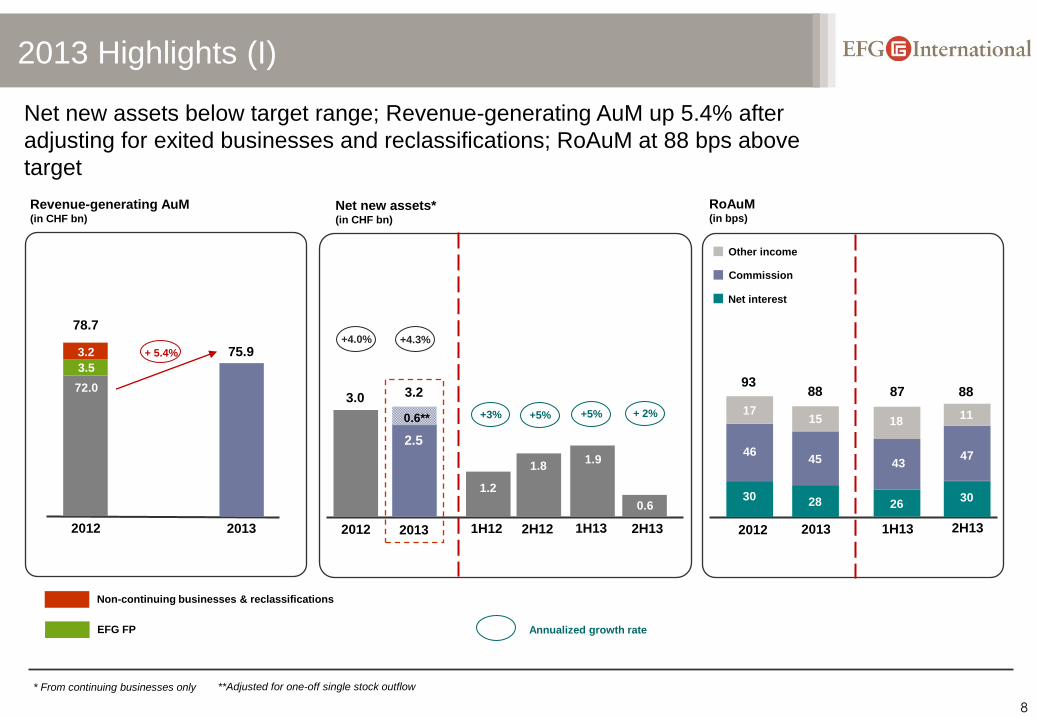
2013 Highlights (I)
* From continuing businesses only
Revenue-generating AuM (in CHF bn)
2012
72.0
Net new assets* (in CHF bn)
RoAuM (in bps)
Net interest
Commission
Other income
2013 2013 2H12
+4.0%
+5%
+4.3%
2012
Annualized growth rate
0.6** + 2%
**Adjusted for one-off single stock outflow
Net new assets below target range; Revenue-generating AuM up 5.4% after
adjusting for exited businesses and reclassifications; RoAuM at 88 bps above
target
78.7
75.9
EFG FP
3.0
2.5
1H12 2H13 1H13
1.2
1.8 1.9
0.6
3.2
2012
30
46
17
93
1H13
26
43
87
18
88
2H13 2013
28
45
88
15
30
47
11 +3% +5%
Non-continuing businesses & reclassifications
3.5
3.2 + 5.4%

9
IFRS net profit to ordinary shareholders up by 8%, including profit on sale of
stake in EFG FP
2013 Highlights (II)
Discontinued operations
EFG International
IFRS net profit to ordinary shareholders (in CHF m)
110.9
103.1
2013
10.1 36.4
74.5
2012
93.0
Pre-tax profit (in CHF m)
134.2 144.0
2013
84.2
2012
120.3
23.7 50.0
Operating income (in CHF m)
Operating expenses (in CHF m)
547.2
2012
554.3
2013
- 4%
Operating income down 4% reflecting lower
revenues from ALM, increased Tier 2 interest
costs and absence of structuring transactions
relating to large clients
Mainstream PB revenues from continuing
businesses up approx. 5% vs 2012
Underlying decrease in operating expenses is
greater than 1% as in 2013 a circa CHF 6 m
additional bonus for “one-off” incentive scheme
was expensed, will not be in future run-rate
On top of CHF 2.8 m of 2013 costs, additional
provision of CHF 6.5 m to cover future legal
expenses related to US Tax Programme
2012
697.1
2013
666.0
- 1%
+ 8%

10
2013 Highlights (III)
BIS total capital ratio (in %)
* After proposed dividend of CHF 0.20 per share
Continued strengthening of capital base, with BIS Capital ratio in high teens
and Common Equity ratio in low teens
Strong capital ratio composition
with a CET1 capital ratio of
13.5% Basel III fully applied
Adoption of a progressive
dividend policy commenced,
proposed increased dividend
from CHF 0.10 to CHF 0.20,
representing payout ratio of 27%
of underlying net profit
31 Dec 2011
Basel II
31 Dec 2012
Basel II 30 Jun 2013
Basel III
Fully applied
4.1
8.7
12.9
Tier 2 Additional Tier 1 Common Equity
8.9
5.3
18.1
11.9
5.2
31 Dec 2013
Basel III
Fully applied
13.5
11.7
18.0*
0.1
1.0
4.2
0.3
13.5
11.7
18.0
4.2
0.3
31 Dec 2012
Basel III
Fully applied
11.7
11.7
15.9
4.2
** Including Additional Tier 1 of CHF 16 m post BdP buy-back
**

11
Underlying recurring net profit vs reported IFRS profit
Underlying profit constrained by market conditions. Absence of structuring
transactions for large clients and lower revenues from asset and liability
management. Quality of earnings continued to improve
IFRS
profit
for 2013
111.8 4.0
„Business
Review“
impact
111.2
2013 Underlying
recurring
profit to
ordinary
shareholders
(in CHF m)
(36.4)
P&L and
gain on
disposal
of EFG FP
8.0
Provision
for UK with-
holding tax
agreement
(0.9)
BdP
dividend
15.4
UK
litigation
9.3
US tax
related
legal costs
2013 2012
IFRS
profit
for 2012
111.2
20.1
„Business
Review“
impact
11.4
124.5
2012 Underlying
recurring
profit to ordinary
shareholders
(in CHF m)
(10.1)
P&L
EFG FP
Loss on
Greek
sovereign
exposure
(8.1)
BdP
dividend

12
Quality of earnings improved in 2013 (I)
Core private banking revenues from continuing businesses increased by 5%
during 2013
Quality of operating income
improved vs. last year given
absence of structuring
transactions to large clients in
2013
ALM approx. 16% lower,
includes effect of CHF 180 m
Tier 2 issuance in Jan 2013
Net revenues from life
portfolio decreased from CHF
39.3 m in 2012 to CHF 28.8 m
in 2013 on the back of more
conservative treatment
2012
29.9
567.1
19.5
80.6
Operating income components (in CHF m)
Operating income – structuring transactions for large clients
Operating income – Private banking & Asset management
Operating income – Non continuing businesses
Operating income – ALM
2013
1.0
595.8
2.2
68.0
697.1
666.0
2Q13
152.9 0.5
1Q13
143.4
0.8 6.9
25.8 151.1
179.2
4Q13
154.7 0.7
3Q13
141.8 0.2
13.1
25.2
155.1
180.6
+ 5%

13
Quality of earnings improved in 2013 (II)
Profit before tax from core private banking increases by 33%
Contribution of ALM related profit before tax declined by 20%
Absence of structuring transactions for large clients during
2013
2013 impacted by CHF 36.8 m for US and UK tax and UK
litigation case
Profit before tax components (in CHF m)
Profit contribution from Core Private Banking increased by 33% year-on-year
20.8
55.5
(20.0)
64.0
1.0
74.0
(4.0)
51.0
120.3 84.2
2012 2013
+ 33%
(36.8)
Operating income – structuring transactions for large clients
Operating income – Private banking & Asset management
Operating income – Non continuing businesses
Operating income – ALM
US and UK tax and UK litigation

14
Operating income
Improved contribution from recurring revenue streams
Decrease in commissions
from structuring transactions
offset by higher core private
banking and asset
management revenues
2012 benefited from CHF
13.9 m gain on disposal of
MBAM revenue share
Lower operating income for
2013 reflects lower ALM and
large structuring transactions
Net interest income
(in CHF m)
Net other income
(in CHF m)
30.5
Net commissions
(in CHF m)
2012
224.1
2013
213.2
Operating income
(in CHF m)
2013 1H13 2012 2H13
335.9
2012
345.6
2013
343.3
2012
127.4
2013
109.5
697.1
666.0
330.1
Tier II interest expense of
CHF 16.5 m, up from CHF
7.7 m in 2012, compensated
by reduction of BdP dividend
“below the line”

15
Operating expenses
Operating expenses - 1% vs. previous year, personnel expenses down 4%
despite increase in CRO hiring
In 2H13 circa CHF 6 m of additional CRO
bonus for “one-off” 2013 incentive scheme
Other operating expenses in 2H13 up CHF 4 m
for legal costs (UK litigation and US tax)
Improvement of CIR will primarily rely on
operating leverage “kicking-in” with stable cost
base and improvement of the top line
Other operating expenses decreased circa
7% excluding impact of 2011 legal
provisions reversed in 2012 and impact of
CHF 4 m of incremental legal costs in 2013
Personnel expenses (in CHF m)
Other operating expenses (in CHF m)
Cost-income ratio*
(in %)
2012
406.5
2013
396.2
2012
147.8
2013
151.0
Operating expenses (in CHF m)
2012
554.3
2013
547.2 81.5
2013 2012
78.8
* CIR = Ratio of IFRS operating expenses before
amortisation of acquisition related intangibles
- 4%
4.0
147.0
10.3**
158.1 - 7%
6.0
390.2
* * 2011 legal accrual reversed in 2012 through operating
expenses

16
Detailed analysis of headcount & personnel expenses
Headcount stable; personnel expenses down by 3%
Decrease in fixed compensation as continued
focus on cost control yields results
Variable compensation increase by circa CHF 6 m
for “one-off” incentive scheme for 2013
Headcount
2012 1H13
1,994
1,977
1,989
2013 2H13
1,989
Breakdown personnel expenses (in CHF m)
2013
Private banking and asset management
fixed compensation
Non continuing businesses / Business review impacts
New CROs
1H13
Continuing private banking and asset management
variable compensation including incentive shares
2H13 2012
269.2
105.4
4.2
406.5
27.7
134.3
53.5
6.7
2.5
197.0
263.9
111.8
17.3
396.2
3.2
129.6
52.3
10.6
0.7
199.2
One-off incentive scheme CHF 6 m
6.0

17
Underlying cost analysis
Underlying expenses declined by 3% year-on-year
IFRS
operating
expenses
547.2
517.7
(in CHF m)
(6.0)
(17.3)
(6.2)
2013 2012
"One-off" 2013
incentive
scheme
Business
review impact Underlying
expenses
(in CHF m)
New CRO
investment* IFRS
operating
expenses
554.3
532.7
10.3
(4.2)
(27.7)
Litigation
provision
reversed
Business
review impact Underlying
expenses
New CRO
investment*
* CROs hired from 1 January 2012 on 24 months rolling-basis

18
Growth and productivity drivers
EFG International continues to attract high-quality CROs; business returned
to net CRO hiring mode and AuM per CRO increased by 12% since 2011
Number of CROs increased by 19 CROs (+ 5%)
during 2H13 only
Gross hiring in 2013 was approx. 60% higher than
in 2012
Total number of CROs excl. non-continuing
businesses increased by 7% since Dec 2012
Good progress in Switzerland (+ 10), Continental
Europe (+10), UK (+5) and Americas (+6)
Number of CROs
1H12 1H13
440
416 414
2H12 2013
435
407*
* CROs continuing businesses only
+ 7%
AuM per CRO increased by 12% since the end
of 2011
Excluding newly hired CROs during FY 2013
AuM per CRO stood at CHF 183 m, up 17%
since end of 2011
AuM per CRO (in CHF m)
2011
156
179
2012 2013
174
+ 17%
183
excl. CROs
hired in 2013
Recently announced transaction
with Falcon Private Bank in
Hong Kong
Is expected to add 5 CROs
Introduction of clients expected
during 1H 2014
EFGI’s Asia business
2013
CROs
103 108
Incl. Falcon PB in HK
2013
AuMs (in CHF bn)
14.9 15.5*
* If 75% of total AuM of CHF 0.8 bn would
be transferred
Note: continuing businesses only

19
Capital position (I)
BIS total capital ratio (in %)
Breakdown of RWAs (in CHF bn)
Dec 12
Credit risk
Operational risk
Market / Settlement / Non-
counterparty related
6.0
1.4
4.0
0.6
RWA market risk and
operational risk decreased
by CHF 0.4 m, mainly due
to EFG FP sale
Year-end 2013 capital
ratios in line with in July
2013 announced target
range of BIS Capital Ratio
in “high teens” and
Common Equity Ratio in
“low teens”
* After proposed dividend of CHF 0.20 per share
Capital position remains strong and in target range; RWAs decreased
due to EFG FP sale and disciplined RWA management
Dec 13
5.7
1.3
4.1
0.3
31 Dec 2011
Basel II 31 Dec 2012
Basel III
Fully applied
4.1
8.7
12.9
Tier 2 Additional Tier 1 Common Equity
31 Dec 2013
Basel III
Fully applied
13.5
18.0*
0.1
4.2
0.3
11.7
11.7
15.9
4.2 **
** Including Additional Tier 1 of CHF 16 m post BdP buy-back

20
Capital position (II)
Evolution of BIS capital ratio (in %)
11.7
Dec 2012
Basel III
Fully applied
P&L
1.8
FY 2013 profit generation added 180 bps to capital ratio, EFG FP sale during 1H13 added another
120 bps
Capital ratios exceeded target range after taking into account proposed increased dividend from
CHF 0.10 to CHF 0.20 per share
The Basel III CET1 ratio (fully applied) increased by 180 bps from 11.7% to 13.5% in range of target
level "low teens"
4.2
15.9
18.0
Dec
2013
13.5
4.5
Additional Tier 1 & Tier 2
Common Equity (CET1)
Organic capital generation added 180 bps to capital ratio
RWA
(0.3)
Dividend
(0.5)
18.1
6.2
11.9
Dec
2012
Basel III
impact:
220 bps
EFG FP
sale
1.2
Others
impacts
(0.1)

21
Adoption of a progressive dividend policy commenced
Proposed increased dividend from CHF 0.10 to CHF 0.20, representing
payout ratio of 27% of underlying net profit
Dividend per share (in CHF) & Payout ratio
2013
IFRS underlying net profit (in CHF m)
Total amount of proposed ordinary dividend (in CHF m)
Payout ratio (in %)
Proposed dividend per share (in CHF)
111.2
27%
0.20
29.5
Dividend proposal for 2014
0.10
0.20
12%
27%
2012 2013

22
Revenue-generating AuM development
* Adjusted for one-off single stock outflow ** EFG FP (CHF 4.3 bn) , OnFinance (CHF 0.2 bn) and Canada (CHF 1.5 bn)
Net new assets slightly below target range; Revenue-generating AuM
up 5.4% after adjusting for exited businesses and reclassifications
CHF 2.5 bn NNA for continuing
businesses, growth rate of
3.5%
Adjusted for one-off single
stock outflow in 1H13 growth
rate of 4.3%
Underlying revenue-generating
AuM up 5.4% after adjusting
for exited businesses and
reclassifications
Increase in revenue-generating
AuM through market
performance was 3.6% in 2013
(CHF bn)
Dec 12
78.7
FX
(1.1)
Dec 13
75.9
AuM
continuing
businesses
Market
2.8
NNA locations
to be exited /
restructured /
sold
(6.0)
73.3
2.5
NNA
continuing
businesses
(0.1)
Disposals**
(1.0)
Transfer
to AuA
0.6
3.2*

23
AuM and NNA by business region
Note: Breakdown excludes CHF 0.1 bn included in Corporate Center
* External business only ** Total AuM partly included in business regions *** Adjusted for one-off single outflow: CHF 0.6 bn
2.2*
17.8
11.4
14.9
13.9 Continental
Europe
UK
Americas
Asia
Asset
Management
Dec 2013 AuMs
CHF 75.9 bn
2013 NNA: CHF 2.5 bn / CHF 3.2 bn***
0.5
1.6
(0.2)
1.0
(0.1)*
8.2** 0.8
15.6 Switzerland 21%
18%
20%
15%
23%
3%
as % of
total AuM
RoAuM
(in bps)
NNA growth
(in %)
99
77
80
89
97
100
14%
4%
3%
6%
10%
(0.3) -2%
44
0.4*** -2%
-4%

24
Regional performance
Switzerland Continental
Europe Asia Americas UK
Asset***
Management
Focus on high-growth markets; good diversification of business
AuM (in bn)
Annualized
NNA growth
(in %)
Pre-tax profit
(in CHF m)
-2%
-5%
15.6 15.9
35.3
43.7
14%
8%
13.9 11.6
22.8 17.8
4% 6%
14.9 14.4
36.4 31.9
3%* 1%
11.4 12.2
19.5
37.9
6%
8%
17.8 16.4
41.6
2012 2013 2012 2013 2012 2013 2012 2013 2012 2013
2012 2013 2012 2013 2012 2013 2012 2013 2012 2013
2012 2013
2012 2013 2012 2013 2012 2013 2012 2013
30%
8.2 7.4
45.3
27.9
2012
2012
2012 2013
2013
2013
* Adjusted for one-off single stock outflow ** CHF 20.0 m related to UK litigation
*** Asset Management total “gross” business view, partly included in business regions
10%
35.2
20.0**
54.4

25
Balance sheet
Total assets: CHF 21.7 bn
Cash & banks
Treasury bills
3.0
0.6
11.6
0.3
0.6
5.4
0.2
Derivatives
Financial
instruments
Loans
Goodwill &
intangibles
Other
Total liabilities &
equity: CHF 21.7 bn
Derivatives
2.7
0.6
1.1
16.4
0.3 Due to banks
Deposits
Financials
liabilities
Total Equity
0.3 Other
- CHF 7.6 bn secured
by financial assets
- CHF 3.0 bn secured
real estate financing,
approx. 47% in UK
prime real-estate
Available
for sale 3.8
0.4
0.1
Designated
at inception
Trading assets
1.1 Held to maturity
Solid, liquid and simplified balance sheet
Composition reflects
deconsolidation of EFG FP
and BdP exchange into Tier 2
instruments
Deposit/Loan ratio of 162%
Loan increase mostly driven
by increase in lombard lending
Subordinated loans with total
amount of CHF 245.1 m
0.3 Subordinated loans

26
Life insurance policies portfolios
Impact of life insurance portfolio on current financials
Portfolio “Held to Maturity”*
- Carrying value CHF 692 million (acquisition cost, premium paid, accrued interest);
with actual yield of 4.1%
Portfolio details
Diversified portfolio of 243 life insurance policies issued by US life insurance
companies; booked in HTM**
67% males and 33% females
Average age of lives insured: 85.1 years
Average life expectation: 4.9 years°, i.e. 90 years
Total remaining death benefits ~USD 1,665m ***
* Data as of 31 December 2013; In addition to Held to Maturity portfolio, EFGI owns a 10.7% stake in a life insurance fund which it fully consolidates and
has some physical life insurance exposure which it has synthetically hedged (whereby the residual exposure is estimated to be non material); ° implied life expectancy
is 7.0 years; ** 239 policies booked in HTM; 4 policies booked in designated at fair value; *** 10 maturities in 2013, total death benefits USD 78.5m
Net revenues in FY 2013 on life portfolios of CHF 28.8 million (FY 2012: CHF 39.3 million)
10 maturities in 2013 (vs 8 in 2012 and 3 in 2011) and USD 78.5 m in total death benefits (vs USD 62.7 m in
2012 and USD 11.5 m in 2011)

27
§
Introduction
Financial performance
Current status, outlook John Williamson, CEO

28
• Market – HNWI market recovered strongly post-financial crisis. Cross-border still
growing, albeit at a slower pace. Environment remains highly competitive, but
consolidation presenting opportunities.
• Positioning – Total focus on private banking. Asset management clearly
positioned as an integral part of private banking.
• Scale – A good size, combining international breadth, full range of services, and
intimacy of relationship-driven model.
• Regional balance – Business evenly distributed on a regional basis, with good
exposure to growth markets.
• On/offshore – International footprint facilitates access to wealth being created in
national markets. Reduces relative exposure to legacy business. Well placed in
relation to emerging growth markets.
• Leadership – Business head continuity.
• Business approach – Qualitative benefits of model still a source of competitive
differentation.
• Offering – Advice-based; open architecture. Enhanced support for CROs in form
of Investment & Wealth Solutions.
• Brand / marketing – A distinctive, cost-effective approach to marketing has raised
international profile in recent years.
Real
competitive
differentiation
Remain convinced that EFG is highly differentiated
And taking steps to reinforce this.

29
Most private banking businesses performing strongly
Americas
•Unable to sustain strong
performance seen in 2012, as a
result of geo-political factors /
outflows due to cessation of
number of significant structuring
transactions re large clients.
•NNA below target range, but
marked improvement in H2.
UK
•Robust growth in revenues and
strong double-digit increase in
profit before legal settlement
expenses.
•Within NNA target range.
Continental Europe
•Double-digit growth in operating income and
profits.
•Good progress in Monaco (particularly
strong), Luxembourg and Spain.
•NNA growth in excess of target range.
Asia
•Double-digit growth in operating
income.
•Maintained record of increased
profits, in region where lack of
profitability an industry issue.
•NNA slightly below target range.
Would have been comfortably
within but for exiting of lower
value accounts.
Switzerland
•Business relatively stable, given
particularly challenging
environment.
•NNA slightly negative. Strong
gross inflows offsetting outflows
re legacy businesses
All regional businesses (except Americas) increased their profit contribution during 2013.

30
Notable improvement in CRO hiring
• Total number of CROs (excluding EFG Financial Products): 435 end-2013,
up from 414 end-2012 (407 excluding non-continuing businesses).
• Focus remains on high quality individuals and, in particular, teams.
• All regional businesses up year on year, with exception of Asia.
• For Asia, reflects further tranche of under-performing CROs let go during
Q1. Added 10 CROs during remainder of year.
• Good momentum – added 19 CROs during H2.
• Pipeline strong.

31
Overriding focus on delivering growth
Switzerland
• New Heads of Private Banking now in place
in Zurich and Geneva - important role in
attracting new CROs / driving growth in
Switzerland.
• Completed relocation of Zurich head office to
prestige property at Bleicherweg 8. Clear
reflection of ambition to grow business
significantly.
Continental Europe
• In Spain, AyG applying for a banking license.
• New Greece team head in Luxembourg.
Complements strong teams elsewhere.
Evaluating representation in Athens.
CEE
• CEE a focal point for CRO hiring. Region
delivered very strong growth in 2013.
Asia
• New Head of Emerging Wealth (with a focus on
China), based in Hong Kong, joined February
2014.
• Application approved for wholesale banking
license in Singapore. To commence in March.
Global Indians
• New international role to capitalise on the Global
Indian opportunity. Hiring in process, to be based
in Singapore.
Latin America / Middle East
• Actively looking to grow business in both these
regions. Taking steps organisationally to improve
market focus.
Quickening tempo of growth initiatives

32
Overriding focus on delivering growth (cont.)
Investment & Wealth Solutions
• Comprehensive, integrated solutions platform now in place - wealth
structuring, investment solutions and credit.
• Re investment solutions, further emphasis on advisory services.
Significant enhancements made to internal research capabilities.
• Continue to invest selectively, reflecting significant opportunity to
broaden and deepen relationships with clients (e.g. in excess of CHF 1
billion added to discretionary mandates in 2013). But focus is now
capitalising on platform already in place.
• Selective hiring of investment talent. Recently hired former head of
Swiss equities at Zurich Cantonal Bank. Two earlier fund manager hires
have proven successful.
• Continued strong progress re investment solutions, with clients’ assets
under some form of investment management of CHF 8.2 billion at end-
2013. More than doubled over past four years; continues to deliver
strong, double-digit growth.

33
Focus remains on organic growth, but targeted acquisitions
• Strong focus on organic growth. Delivering on latent potential clearly
offers significant short-term upside to shareholder value.
• Open to acquisitions, subject to: shared appreciation of private banking;
complementary cultures and capabilities; scope for synergies.
• In January, agreed on referral of Falcon Private Bank's clients in Hong
Kong. Five CROs moving from Falcon to EFG. AUM c. CHF 800m, with
lion's share of this expected to move across to EFG.
• Presently seeing a significant number of opportunities, but adopting a
disciplined and objective approach in relation to quality and value.

34
Significant upside profit potential
Aim is for top-line growth to flow through with minimal dilution to productivity
and profits.
Committed to maintaining strong cost discipline. Non-CRO hiring freeze
remains in place.
Potential to deliver strong, double digit growth for foreseeable future.
Significant potential upside as a result of market factors and business drivers.
Higher interest rates: 50bps
increase on CHF 4 billion non-
interest bearing deposits.
Illustrative revenue impact
(communicated at half-year but worth reiterating)
+ CHF 20 million.
Margin increase as a result of
solutions platform: 5bps on
AUM of CHF 80 billion.
+ CHF 40 million.
Net new assets: CHF 5 billion
per annum at 84bps.
+ CHF 42 million per
annum (full year).

35
Organising to deliver growth
Chief Executive Officer
John Williamson
Chief Operating Officer
Mark Bagnall
Chief Risk Officer
Frederick Link
Group General Counsel
Henric Immink
Deputy CEO &
Chief Financial Officer
Giorgio Pradelli
Head of Strategy &
Marketing
Keith Gapp
Head of Investment &
Wealth Solutions
James T. H. Lee
Executive Committee
Regional CEOs
Asia
Americas*
United Kingdom
Continental Europe
EFG Asset Management
Albert Chiu
Sixto Campano
Anthony Cooke-Yarborough
Alain Diriberry
James T. H. Lee
* Including Caribbean region
John Williamson
Switzerland

36
Rebranded - projecting a joined up business
Adoption of new circular logo device implemented during H2 2013.
An evolution from existing symbol, maintaining many of its strengths.
Increasingly projecting a unified approach under the marketing name, “EFG”.
In certain regions, also frequently accompanied by descriptor, ‘Private bankers’,
reflecting sole focus on private banking.
Business entity
For marketing purposes For marketing purposes in certain jurisdictions

37
Committed to delivering medium-term objectives
• Net new assets in the range 5-10% per annum.
• Reduced cost-income ratio - to below 75% by 2015 (formerly 2014).
• Maintain strong capital position. High teens for Basel III BIS Capital
Ratio and low teens for the Common Equity Ratio (CET 1).
• Gross margin to remain broadly at level prevailing at the time of the
business review (84bps excluding EFG FP).
• As a result, delivering strong double-digit growth in profit and a
double-digit return on shareholders' equity.
EFGI reaffirms its other medium-term objectives:
Objective of delivering IFRS net profit of CHF 200 million in 2015 now
dependent on NNA growth at top of target range and significantly better
market conditions / rising interest rates.
But objective retained as a stretch target, as focus in 2014/2015
unequivocally about delivering growth and a step-change in business
performance.

38
Practitioners of the craft of private banking
www.efginternational.com

39
Appendix

40
Consolidated income statement (IFRS)
(in CHF million) 2012 2013
Net interest income 224.1 213.2
Net banking fee & commission income 345.6 343.3
Net other income 127.4 109.5
Operating income 697.1 666.0
Personnel expenses (406.5) (396.2)
Other operating expenses (130.1) (135.4)
Amortisation of tangible fixed assets & software (12.8) (11.1)
Amortisation of acquisition related intangibles (4.9) (4.5)
Total operating expenses (554.3) (547.2)
Gain / (loss) on disposal of subsidiaries (1.7) 0.5
Currency translation losses transferred from the Statement of Other Comprehensive
Income (3.3) -
Provision for restructuring costs (11.7) -
Other provisions - (33.7)
Impairment of intangible assets and goodwill (1.4) -
Impairment on loans and advances to customers (4.4) (1.4)
Profit before tax 120.3 84.2
Income tax expense (18.6) (8.2)
Net profit from continuing operations 101.7 76.0
Profit for the year from discontinued operations 22.2 46.7
Non-controlling interests (12.7) (10.9)
Net profit attributable to Group equity holders 111.2 111.8
Expected dividend on Bons de Participation (8.1) (0.9)
Net profit loss attributable to ordinary shareholders 103.1 110.9
41
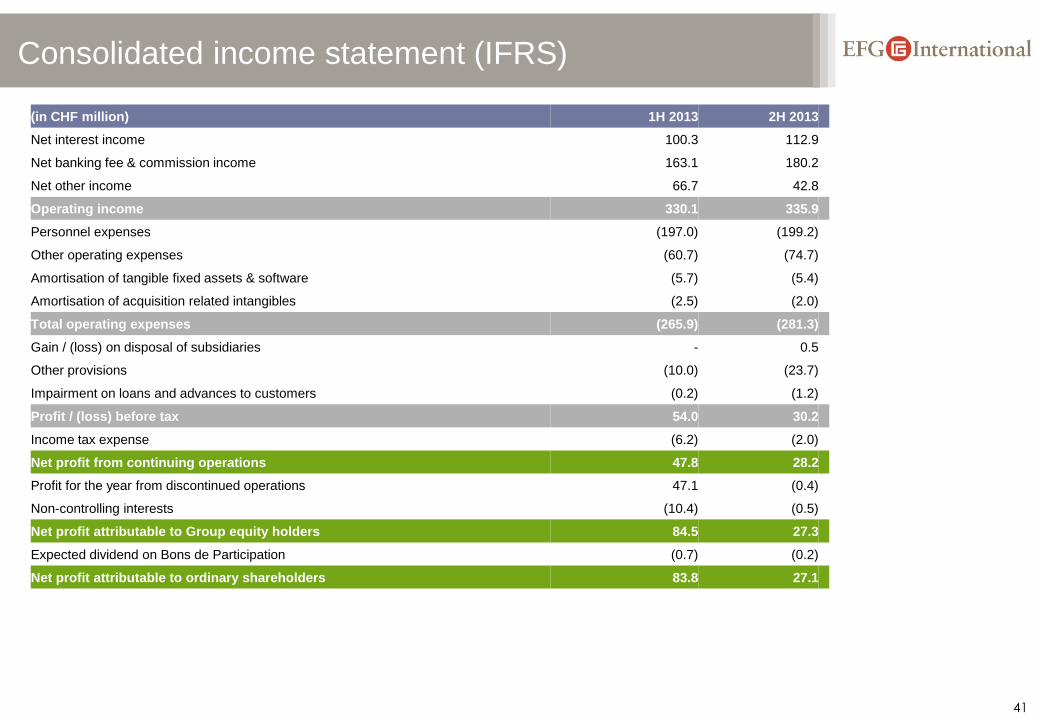
Consolidated income statement (IFRS)
(in CHF million) 1H 2013 2H 2013
Net interest income 100.3 112.9
Net banking fee & commission income 163.1 180.2
Net other income 66.7 42.8
Operating income 330.1 335.9
Personnel expenses (197.0) (199.2)
Other operating expenses (60.7) (74.7)
Amortisation of tangible fixed assets & software (5.7) (5.4)
Amortisation of acquisition related intangibles (2.5) (2.0)
Total operating expenses (265.9) (281.3)
Gain / (loss) on disposal of subsidiaries - 0.5
Other provisions (10.0) (23.7)
Impairment on loans and advances to customers (0.2) (1.2)
Profit / (loss) before tax 54.0 30.2
Income tax expense (6.2) (2.0)
Net profit from continuing operations 47.8 28.2
Profit for the year from discontinued operations 47.1 (0.4)
Non-controlling interests (10.4) (0.5)
Net profit attributable to Group equity holders 84.5 27.3
Expected dividend on Bons de Participation (0.7) (0.2)
Net profit attributable to ordinary shareholders 83.8 27.1

42
Consolidated income statement incl. EFG FP
(Pro forma & unaudited)
(in CHF million) 2012 2013
Net interest income 224.9 212.9
Net banking fee & commission income 491.7 396.5
Net other income 108.0 107.6
Operating income 824.6 717.0
Personnel expenses (466.8) (418.5)
Other operating expenses (164.2) (145.4)
Amortisation of tangible fixed assets & software (22.2) (13.6)
Amortisation of acquisition related intangibles (4.9) (4.5)
Total operating expenses (658.1) (582.0)
Gain / (loss) on disposal of subsidiaries (1.7) 34.3
Currency translation losses transferred from the Statement of Other Comprehensive
Income (3.3) -
Provision for restructuring costs (11.7) -
Other provisions - (33.7)
Impairment of intangible assets and goodwill (1.4)
Impairment on loans and advances to customers (4.4) (1.4)
Profit before tax 144.0 134.2
Income tax expense (20.1) (11.5)
Net profit from continuing operations 123.9 122.7
Non-controlling interests (12.7) (10.9)
Net profit attributable to Group equity holders 111.2 111.8
Expected dividend on Bons de Participation (8.1) (0.9)
Net profit loss attributable to ordinary shareholders 103.1 110.9

43
Consolidated balance sheet (IFRS)
(in CHF million) Dec 2012* Dec 2013
Cash and balances with central banks 1,364 849
Treasury bills and other eligible bills 817 631
Due from other banks 3,393 2,200
Derivative financial instruments 563 560
Financial instruments 6,113 5,415
Loans and advances to customers 10,434 11,562
Intangible assets 295 267
Property, plant and equipment 33 23
Deferred income tax assets 32 36
Other assets 561 156
Total assets 23,605 21,699
Due to other banks 885 290
Due to customers 16,084 16,444
Subordinated loans 57 245
Derivative financial instruments 729 545
Financial liabilities designated at fair value 1,131 311
Other financial liabilities 2,938 2,421
Current income tax liabilities 2 5
Deferred income tax liabilities 35 35
Provisions 12 27
Other liabilities 456 269
Total liabilities 22,329 20,592
Share capital 77 74
Share premium 1,239 1,238
Other reserves and retained earnings (140) (210)
Non controlling interests 100 5
Total shareholders‘ equity 1,276 1,107
Total equity and liabilities 23,605 21,699
* Restated for change in accounting policy (IAS 19 Revised)

44
Breakdown of Assets under Management
By category 31.12.12 31.12.13 31.12.13
(in CHF bn)
Cash & Deposits 25% 26% 19.7
Bonds 20% 20% 15.4
Equities 23% 26% 19.8
Structured products 8% 3% 2.3
Loans 14% 16% 11.9
Hedge Funds / Funds of HFs 5% 4% 3.1
Other 5% 5% 3.7
Total 100% 100% 75.9
By currency 31.12.12 31.12.13 31.12.13
(in CHF bn)
USD 51% 51% 38.8
EUR 19% 21% 15.8
GBP 16% 17% 13.0
CHF 5% 4% 2.8
Other 9% 7% 5.5
Total 100% 100% 75.9
45
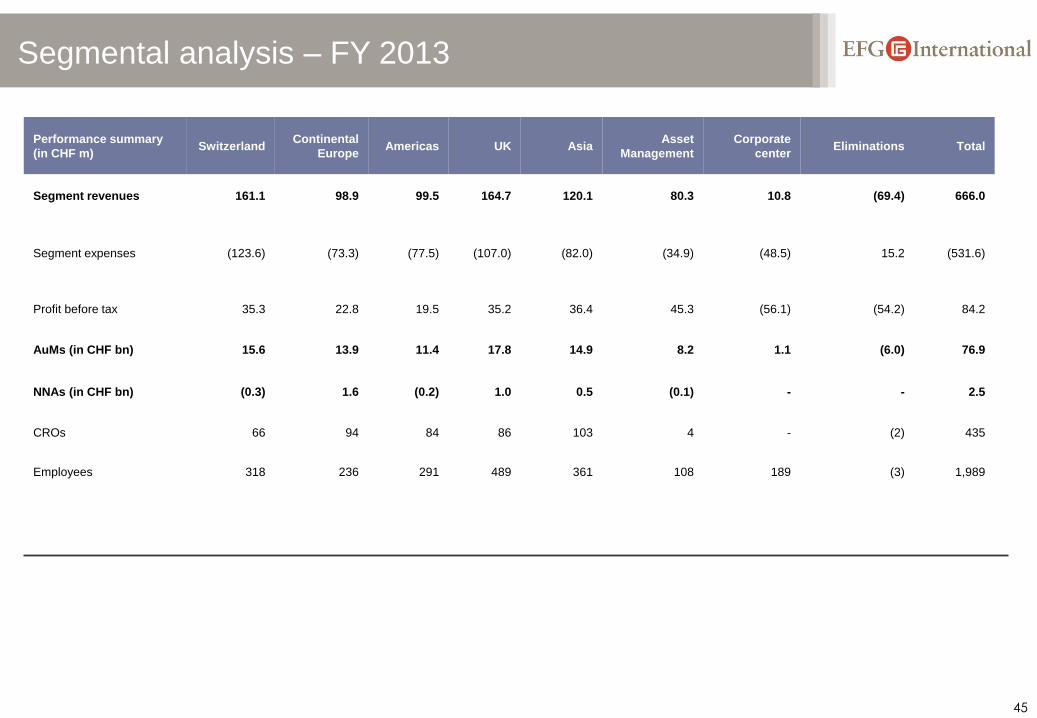
Segmental analysis – FY 2013
Performance summary
(in CHF m) Switzerland
Continental
Europe Americas UK Asia
Asset
Management
Corporate
center Eliminations Total
Segment revenues 161.1 98.9 99.5 164.7 120.1 80.3 10.8 (69.4) 666.0
Segment expenses (123.6) (73.3) (77.5) (107.0) (82.0) (34.9) (48.5) 15.2 (531.6)
Profit before tax 35.3 22.8 19.5 35.2 36.4 45.3 (56.1) (54.2) 84.2
AuMs (in CHF bn) 15.6 13.9 11.4 17.8 14.9 8.2 1.1 (6.0) 76.9
NNAs (in CHF bn) (0.3) 1.6 (0.2) 1.0 0.5 (0.1) - - 2.5
CROs 66 94 84 86 103 4 - (2) 435
Employees 318 236 291 489 361 108 189 (3) 1,989

46
Segmental analysis – FY 2012
Performance summary
(in CHF m) Switzerland
Continental
Europe Americas UK Asia
Asset
Management
Corporate
center Eliminations Total
Segment revenues 175.5 85.2 122.7 154.1 109.2 58.0 45.0 (52.6) 697.1
Segment expenses (126.3) (64.4) (64.1) (107.8) (73.3) (30.0) (69.4) 15.5 (519.8)
Profit before tax 43.7 17.8 37.9 41.6 31.9 27.9 (43.4) (37.1) 120.3
AuMs (in CHF bn) 15.9 11.6 12.2 16.4 14.4 7.4 3.1 (5.0) 76.0
NNAs (in CHF bn) (0.8) 0.8 0.1 1.2 0.8 0.5 0.0 - 2.6
CROs 57 83 79 81 105 3 6 - 414
Employees 311 231 268 483 371 98 235 (3) 1,994

47
Overview of sovereign and bank exposure
GIIPS exposure further reduced
(in CHF m) 31 December 2013 31 December 2012
Country Sovereign Bank bonds
Bank
placements &
other
Sovereign
Bank bonds
Bank
placements &
other
Italy 12.5 - 0.8 12.5 - 1.2
Portugal - - - - 20.0 -
Spain 61.6 - 38.7* 64.7 - 39.5*
Direct
Greece - - - - - 0.2
Total
GIIPS 74.1 - 39.5 77.2 20.0 40.9
Indirect
Greece 66.2** - - 66.3**
* Includes client funds deposited in local Spanish bank by our Spanish business (client operations) **Exposure to non-GIIPS European subsidiaries of Greek banks

48
Contacts
EFG International AG, Bleicherweg 8,
8001 Zurich, Switzerland
Telephone: +41 44 212 73 77
Fax: +41 44 226 18 55
www.efginternational.com
Reuters: EFGN.S
Bloomberg: EFGN SW
Jens Brueckner, Head of Investor Relations
Telephone: +41 44 226 1799
E-mail: [email protected]
EFG International Investor Relations
Keith Gapp, Head of Strategy and Marketing
Telephone: +41 44 226 1217
E-mail: [email protected]
Strategy, Marketing & Communications
Media Investors


![[1996]Shell EFG(TB)](https://img.pdfslide.us/doc/110x75/55cf8e4c550346703b90a107/1996shell-efgtb.jpg)