Embed Size (px)
Citation preview

Hammerson Full-Year Results
1 March 2013
Hammerson
Full-Year Results
1 March 2013
Creating winning
retail locations
1

Today’s presentation
Overview and operations David Atkins – CEO
Financials Timon Drakesmith – CFO
Our business in France Jean-Philippe Mouton – MD France
Capital allocation Peter Cole – CIO
Conclusion David Atkins – CEO
2
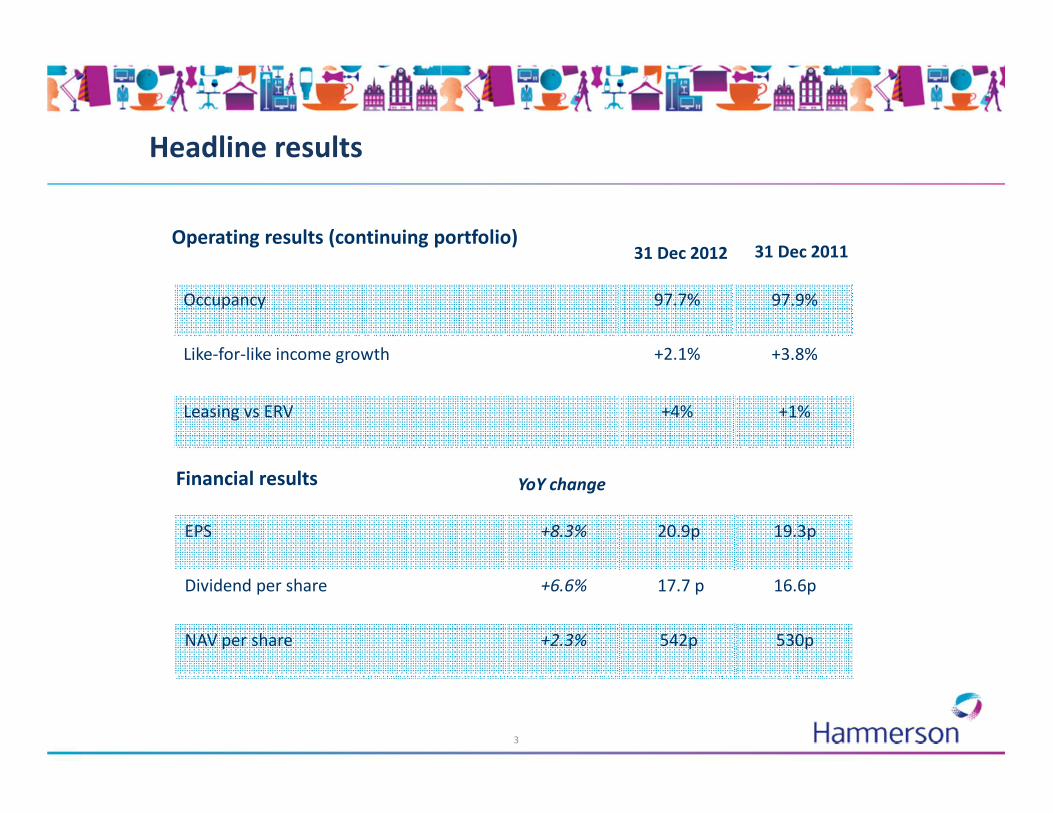
Headline results
Operating results (continuing portfolio)
Financial results
Occupancy 97.7% 97.9%
Like-for-like income growth +2.1% +3.8%
Leasing vs ERV +4% +1%
31 Dec 201131 Dec 2012
EPS +8.3% 20.9p 19.3p
Dividend per share +6.6% 17.7 p 16.6p
NAV per share +2.3% 542p 530p
3
YoY change

Vision
Our vision is to be the best owner-manager
and developer of retail property within Europe
By capitalising on our strengths we aim to provide
industry-leading shareholder returns
4

Our strategy in action...
Recycling capital
Managing interest expense
Reducing costs
� £541m re-invested into winning retail locations
High Occupancy Positive NRI Growth
1
5
4
� 7% YoY savings in operating costs� £6.8m reduction, well ahead of target� Cost/income ratio improved by 130
bps
� 11% reduction in finance costs� €220m bond buy back� Increasing use of floating rates� €500m unsecured bond� 20bps reduction average interest cost
Maximising income
3
� Completion of office disposal programme
� 7% premium to book value
2.1%
1.0%
2.5%
Group
France
UK
A pure retail player
Year-End 2011 Year-End 2012 (1)
Retail
Office
89%
11%
Recycling capital
Strategic focus
Maximising income
Managing interest expense
Reducing Costs
1
Retail
100%
5
2012 TSR
+41%Creating winning retail venues
97.0%97.7%
Min target Dec-12
2
2
34
5

...And plenty more to come
Investment &
Development
Leasing & Asset
Management
Leasing & Asset
Management
Financing &
Operations
Commitment to start Le Jeu de Paume, Beauvais
Deliver Les Terrasses du Port – Spring 2014
Advance development pipeline of c.520,000 sq. m
Further selective acquisitions
Commitment to start Le Jeu de Paume, Beauvais
Deliver Les Terrasses du Port – Spring 2014
Advance development pipeline of c.520,000 sq. m
Further selective acquisitions
Advance UK extension and refurbishment
programme of c.200,000 sq. m
Complete €100m French SC refurbishment
Drive LfL NRI growth
Advance UK extension and refurbishment
programme of c.200,000 sq. m
Complete €100m French SC refurbishment
Drive LfL NRI growth
Aim to further reduce cost/income ratio
Reduce average interest rate to below 5%
Maintain LTV below 40% and high liquidity
6
Supports future
EPS and DPS
growth
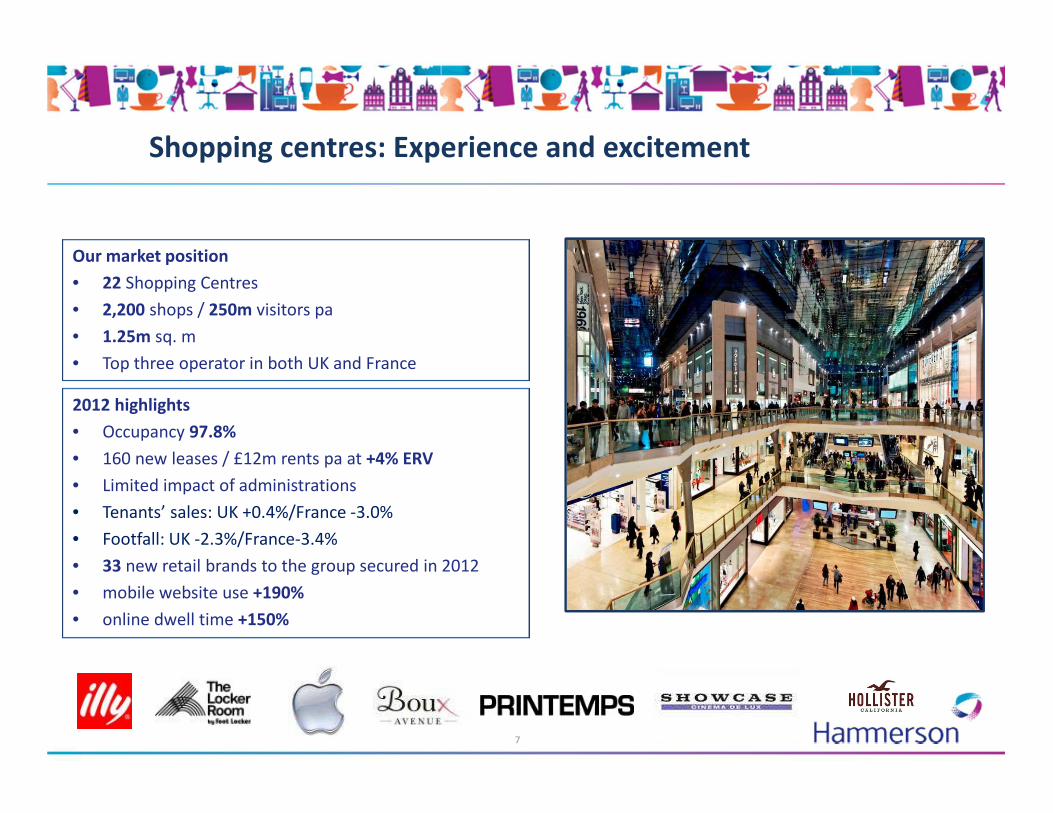
Shopping centres: Experience and excitement
Our market position
• 22 Shopping Centres
• 2,200 shops / 250m visitors pa
• 1.25m sq. m
• Top three operator in both UK and France
7
2012 highlights
• Occupancy 97.8%
• 160 new leases / £12m rents pa at +4% ERV
• Limited impact of administrations
• Tenants’ sales: UK +0.4%/France -3.0%
• Footfall: UK -2.3%/France-3.4%
• 33 new retail brands to the group secured in 2012
• mobile website use +190%
• online dwell time +150%
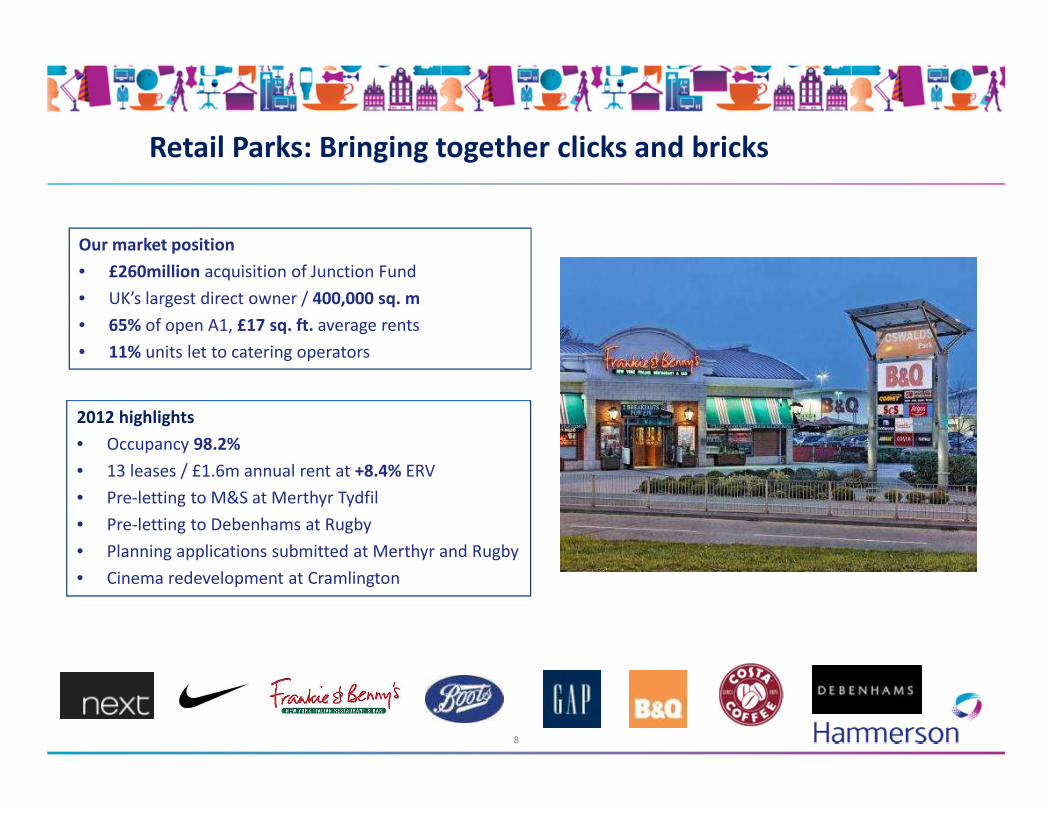
Retail Parks: Bringing together clicks and bricks
8
Our market position
• £260million acquisition of Junction Fund
• UK’s largest direct owner / 400,000 sq. m
• 65% of open A1, £17 sq. ft. average rents
• 11% units let to catering operators
2012 highlights
• Occupancy 98.2%
• 13 leases / £1.6m annual rent at +8.4% ERV
• Pre-letting to M&S at Merthyr Tydfil
• Pre-letting to Debenhams at Rugby
• Planning applications submitted at Merthyr and Rugby
• Cinema redevelopment at Cramlington

Designer outlets; Luxury and tourism
9
Our market position
• 9 villages in Europe’s major cities, 165,000 sq. m floor space
• 22% stake in VR holding companies
• Total brand sales £1.3bn
• 30 million annual shoppers
2012 highlights
• Additional £100m invested
• Tenants’ sales +13%
• Extension completed at La Vallee / floor space +20%
• Burberry flagship opened at La Vallee
• Planning permission granted for additional 5,800 sq. m at La
Roca
• 25% floor space re-let / remerchandised
• Village valuations +18%, driven by income growth
Financial Results
Timon Drakesmith
10

Financial highlights
Net Rental Income (£m) (1) 258.8 +2.1%(2)
Adjusted Profit Before Tax (£m) 152.5 +7.7%
Adjusted EPS (pence) 20.9 +8.3%
Final Dividend (pence per share)10.0 7.5%
31 Dec 2012 Change vs
31 Dec 2011
Income statement
Portfolio Value (£m) (1) 5,458 -0.5%
NAV (pence per share) 542 +2.3%
LTV (%) 36 n/a
Balance sheet
Notes:
(1) For continuing portfolio
(2) For continuing portfolio on a like for like basis
Change vs
31 Dec 2011
11
31 Dec 2012
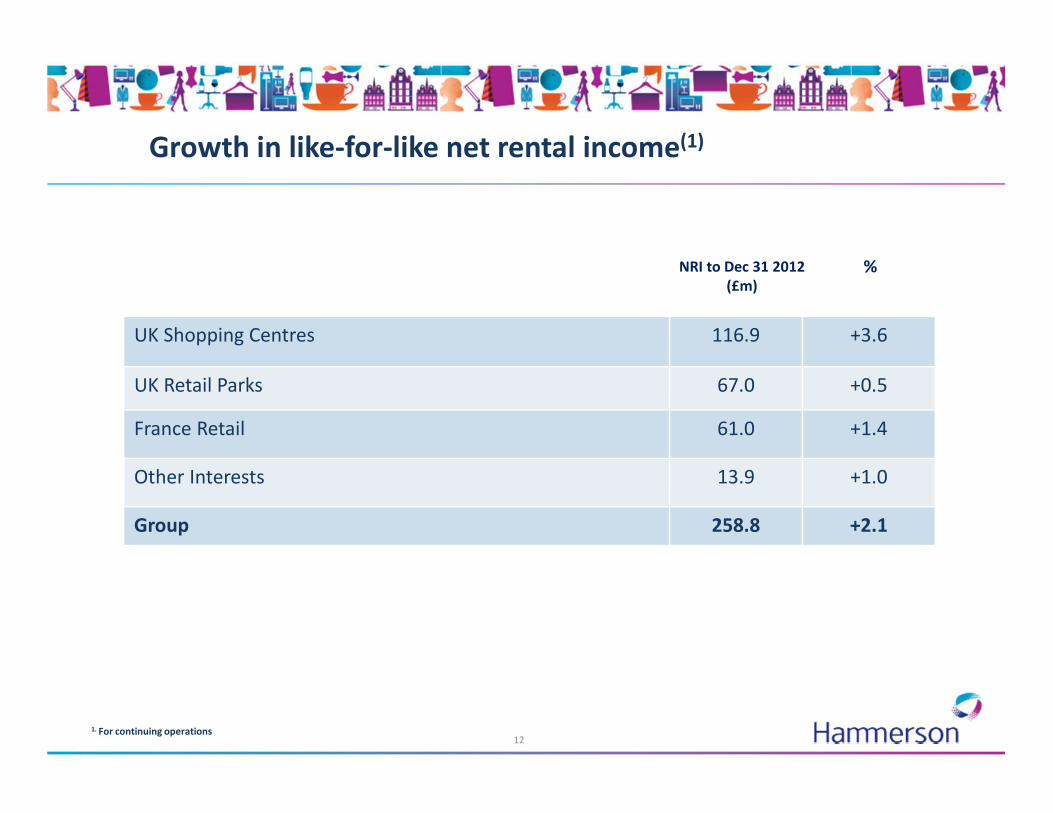
Growth in like-for-like net rental income(1)
UK Shopping Centres 116.9 +3.6
UK Retail Parks 67.0 +0.5
France Retail 61.0 +1.4
Other Interests 13.9 +1.0
Group 258.8 +2.1
%NRI to Dec 31 2012
(£m)
121. For continuing operations
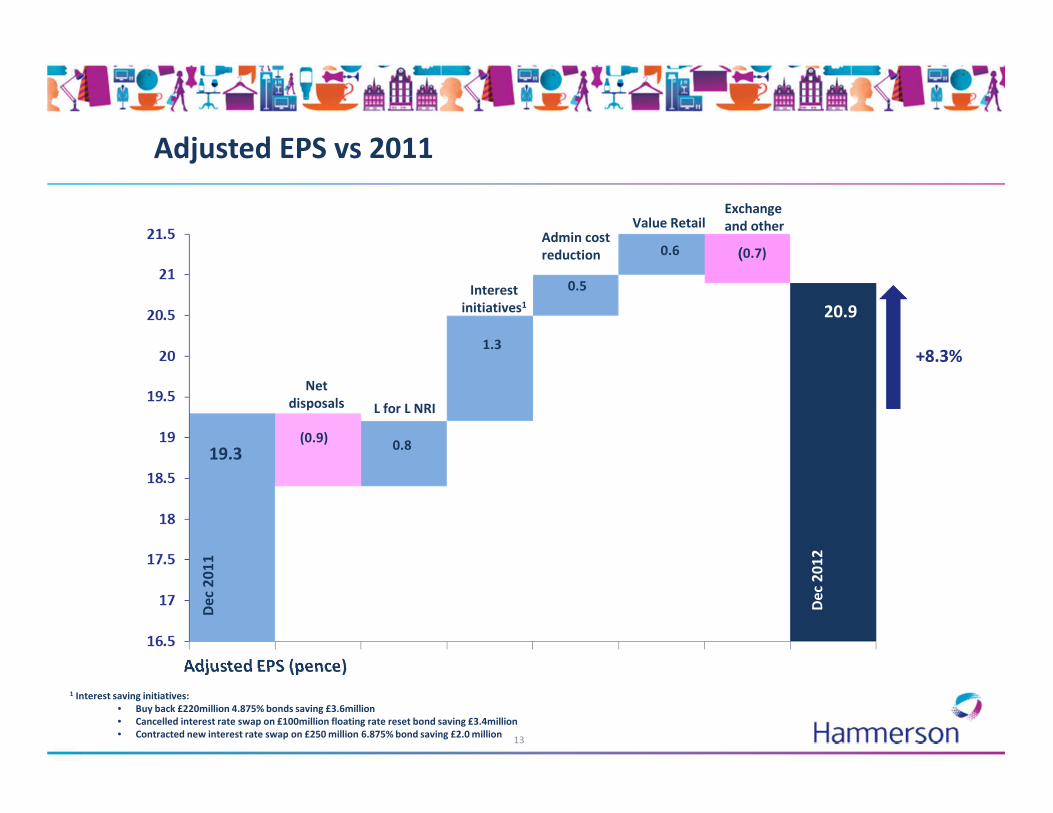
Adjusted EPS vs 2011
Adjusted EPS (pence)
Interest
initiatives1
Exchange
and other
L for L NRI
Net
disposals
De
c 2
01
1
20.9
((((0.7)
(0.9)0.8
19.3
1.3
De
c 2
01
2
0.5
0.6
+8.3%
Value RetailAdmin cost
reduction
13
1 Interest saving initiatives:
• Buy back £220million 4.875% bonds saving £3.6million
• Cancelled interest rate swap on £100million floating rate reset bond saving £3.4million
• Contracted new interest rate swap on £250 million 6.875% bond saving £2.0 million

Cost management
14
Operating
Costs(1) (£m)
(LHS)
Cost/income(1)(2)
ratio (%)
(RHS)
Net interest
expense (£m)
(LHS)
WAIR(3) (%)
(RHS)
(1) Continuing operations
(2) Cost ratio is defined as: net service charge expense + property outgoings + administration expenses – management fees receivable / Gross rental income
(3) WAIR: Weighted average interest rate
Operating cost control - £6.3m saving Interest expense management - £11.6m saving
2011 20122011 2012

Portfolio value capital movement
UK Shopping Centres 2,413 -0.8
UK Retail Parks 1,423 -2.5
France Retail 1,188 +0.8
Current Developments 275 +11.5
Other UK interests(1) 159 -8.3
Discontinued Operations(2) 195 +5.3
Total(3)(4) 5,653 +0.1
IPD UK Index-
-2.8%
Value at 31
Dec 2012
£m
% Change
From Dec
2011
15
Notes:
(1) Principally assets held for redevelopment
(2) The remaining London office portfolio has been contracted for sale. Excludes 10 Grosvenor Street and The Goodsyard that have been retained
(3) Excludes Value Retail
(4) Continuing portfolio had capital movement of -0.5%
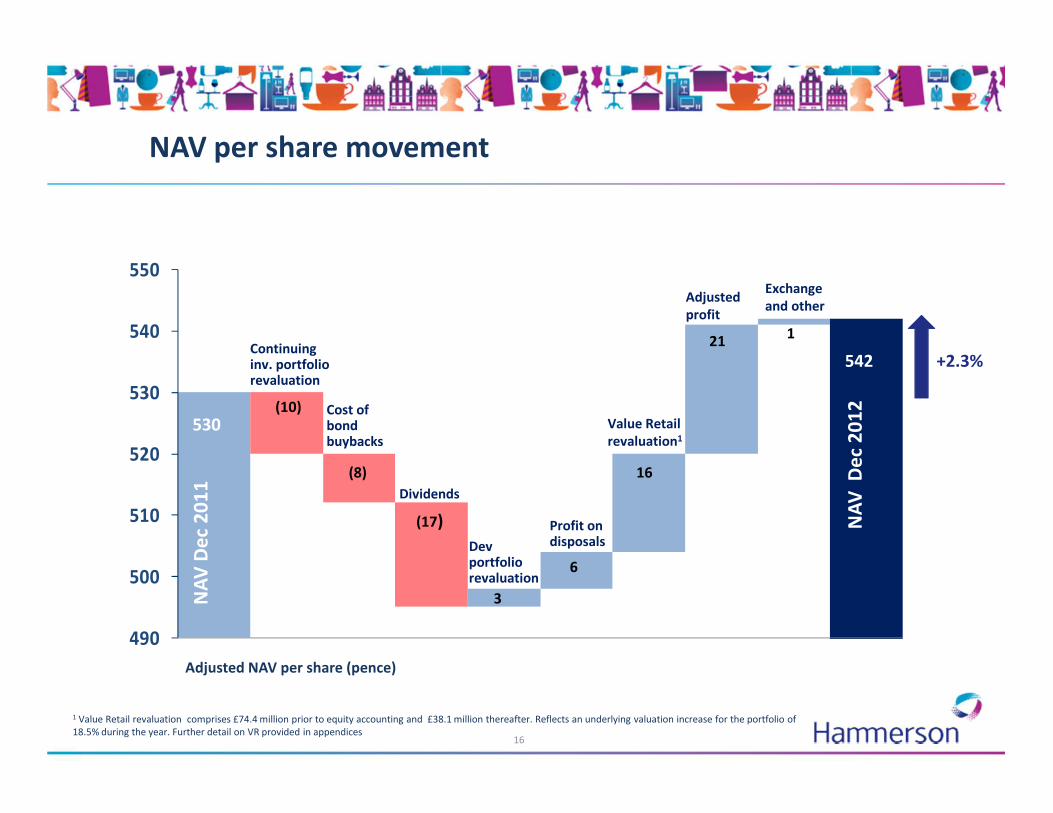
NAV per share movement
16
Adjusted NAV per share (pence)
490
500
510
520
530
540
550
530
(17)
6
16
211
542
Profit on disposals
Dividends
Adjusted
profit
Dev portfolio revaluation
Exchange
and other
Value Retail
revaluation1
NA
V D
ec
20
11
NA
V D
ec
20
12
Continuinginv. portfolio revaluation
3
(10) Cost of bond buybacks
(8)
+2.3%
1 Value Retail revaluation comprises £74.4 million prior to equity accounting and £38.1 million thereafter. Reflects an underlying valuation increase for the portfolio of
18.5% during the year. Further detail on VR provided in appendices
£m£m
EPRA Net assets2
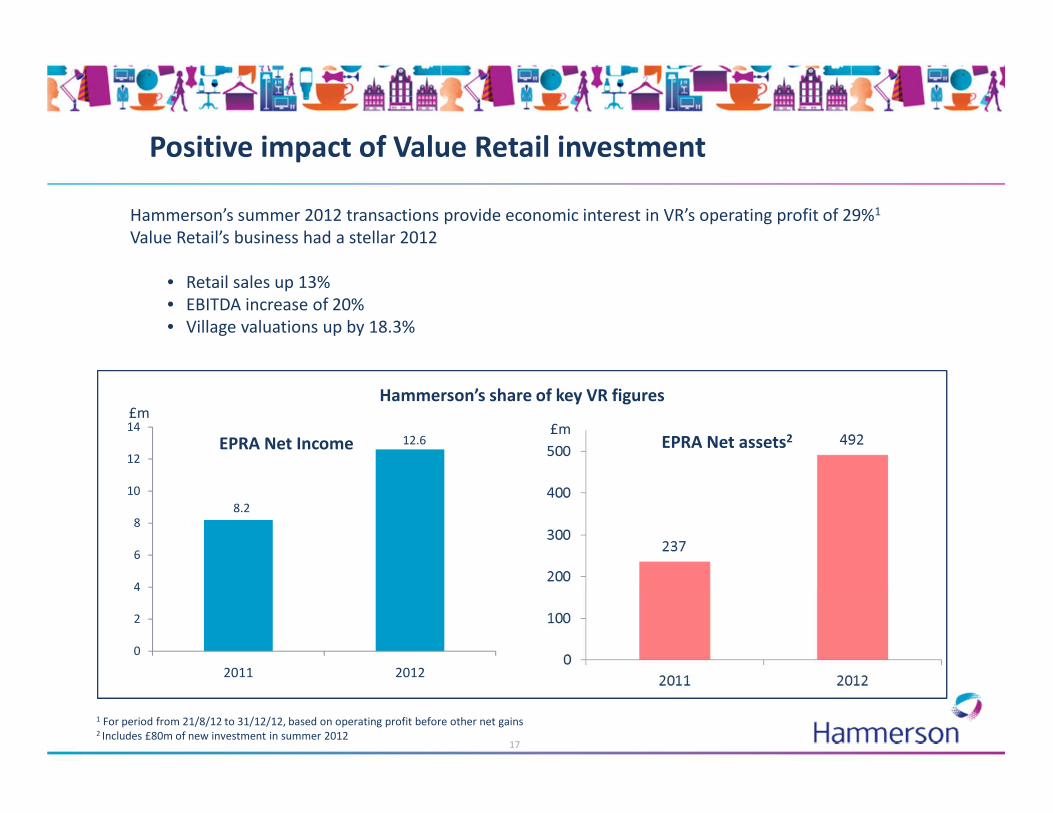
Positive impact of Value Retail investment
Hammerson’s summer 2012 transactions provide economic interest in VR’s operating profit of 29%1
Value Retail’s business had a stellar 2012
• Retail sales up 13%
• EBITDA increase of 20%
• Village valuations up by 18.3%
EPRA Net Income
17
Hammerson’s share of key VR figures
8.2
12.6
0
2
4
6
8
10
12
14
2011 2012
1 For period from 21/8/12 to 31/12/12, based on operating profit before other net gains2 Includes £80m of new investment in summer 2012

Healthy financing ratios
Net debt £2,036m £1,964m
Gearing <85% 53% 52%
Loan to value <40% 36% 34%
Cash/undrawn facilities £696m £696m(1)
Weighted average (cost of finance) 5.0% 5.2%
Interest cover >2.0x 2.8x 2.6x
Net debt/EBITDA <10x 7.9x 7.7x
Debt fixed/hedged 80% 88%
31 Dec
2011
Note:
(1) Restated to exclude FX swaps. Previously reported at £711million
31 Dec 2012
18
Financing policies
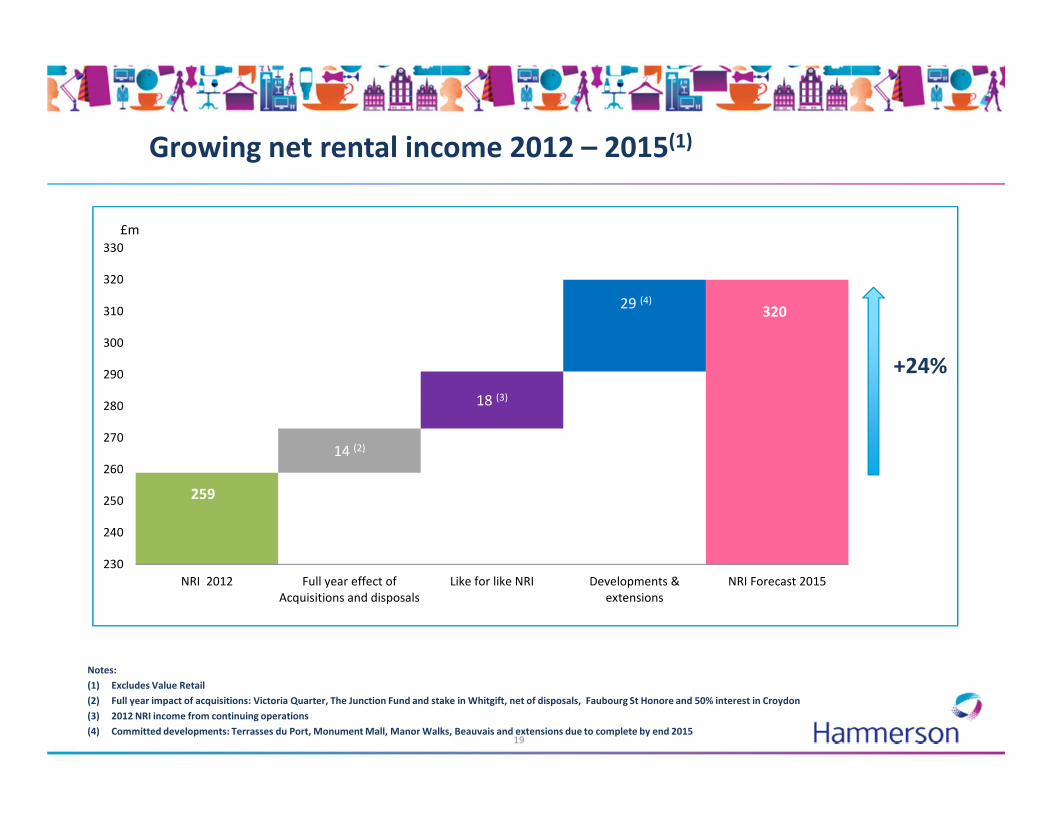
Growing net rental income 2012 – 2015(1)
19
+24%
Notes:
(1) Excludes Value Retail
(2) Full year impact of acquisitions: Victoria Quarter, The Junction Fund and stake in Whitgift, net of disposals, Faubourg St Honore and 50% interest in Croydon
(3) 2012 NRI income from continuing operations
(4) Committed developments: Terrasses du Port, Monument Mall, Manor Walks, Beauvais and extensions due to complete by end 2015
14 (2)
18 (3)
29 (4)
259
320
230
240
250
260
270
280
290
300
310
320
330
NRI 2012 Full year effect of
Acquisitions and disposals
Like for like NRI Developments &
extensions
NRI Forecast 2015
£m
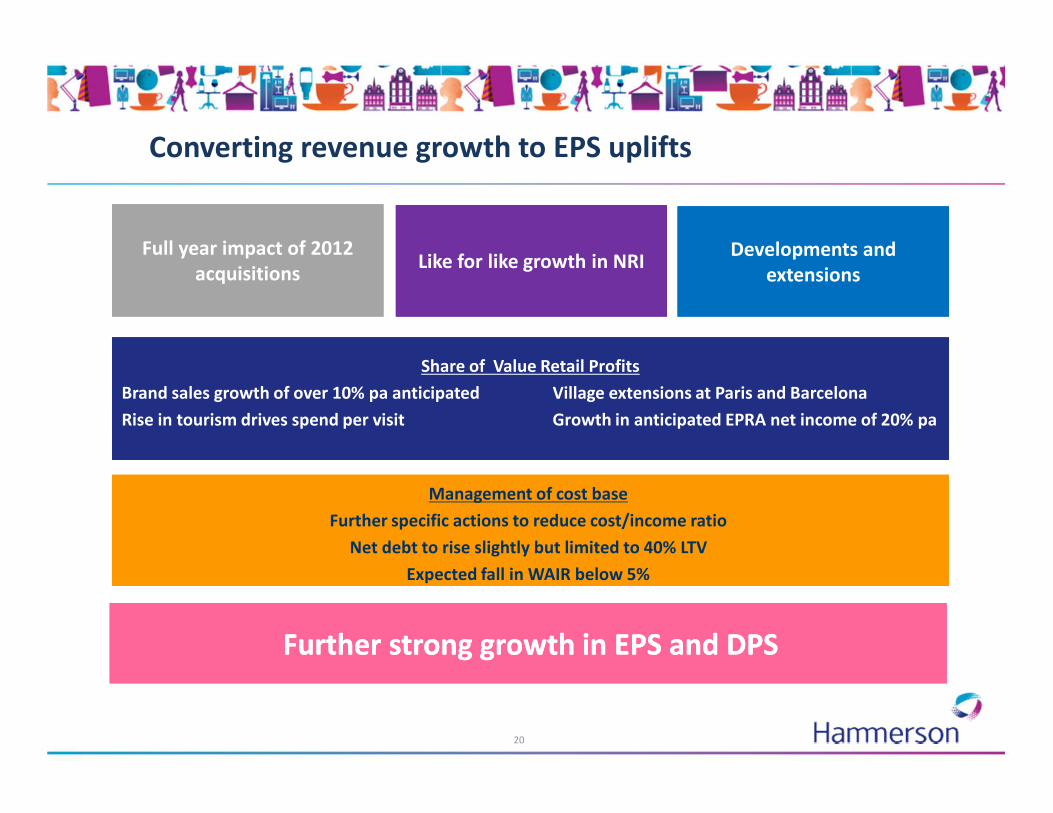
Converting revenue growth to EPS uplifts
Management of cost base
Further specific actions to reduce cost/income ratio
Net debt to rise slightly but limited to 40% LTV
Expected fall in WAIR below 5%
Like for like growth in NRILike for like growth in NRIDevelopments and
extensions
Developments and
extensions
Share of Value Retail Profits
Brand sales growth of over 10% pa anticipated Village extensions at Paris and Barcelona
Rise in tourism drives spend per visit Growth in anticipated EPRA net income of 20% pa
Further strong growth in EPS and DPSFurther strong growth in EPS and DPS
20
Full year impact of 2012
acquisitions
Full year impact of 2012
acquisitions

21
Our Business in France
Jean-Philippe Mouton
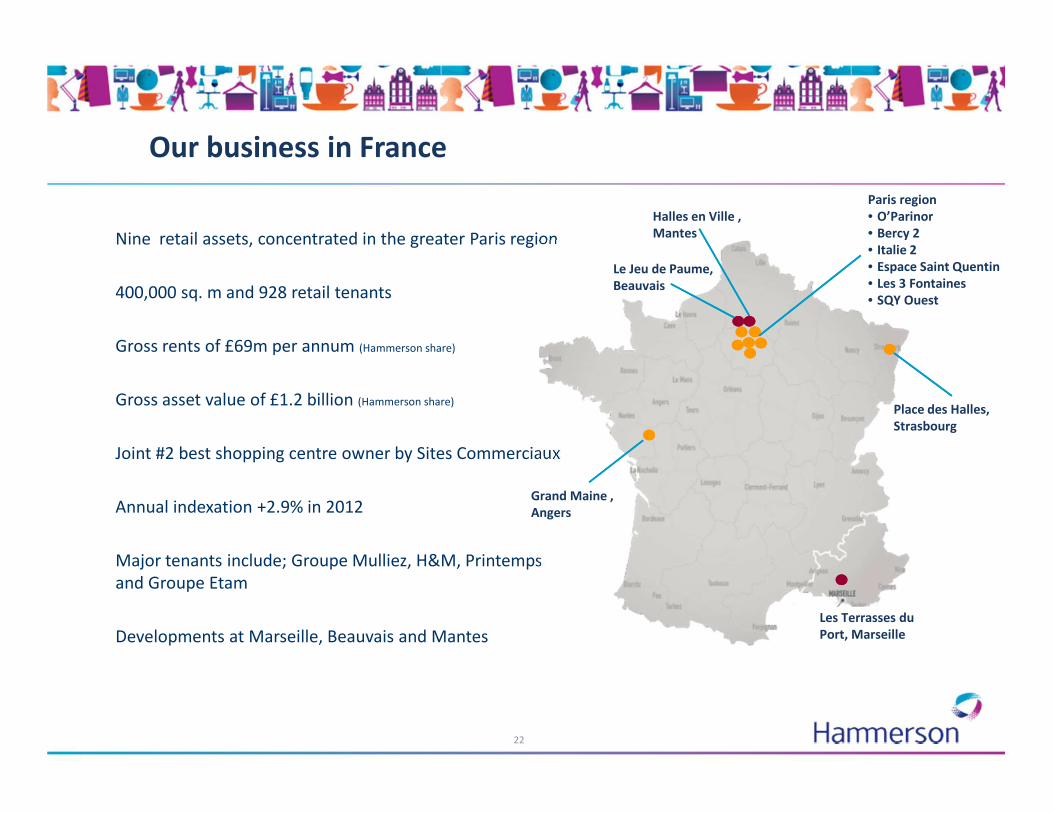
Our business in France
Nine retail assets, concentrated in the greater Paris region
400,000 sq. m and 928 retail tenants
Gross rents of £69m per annum (Hammerson share)
Gross asset value of £1.2 billion (Hammerson share)
Joint #2 best shopping centre owner by Sites Commerciaux
Annual indexation +2.9% in 2012
Major tenants include; Groupe Mulliez, H&M, Printemps
and Groupe Etam
Developments at Marseille, Beauvais and Mantes
Paris region
• O’Parinor
• Bercy 2
• Italie 2
• Espace Saint Quentin
• Les 3 Fontaines
• SQY Ouest
Grand Maine ,
Angers
Place des Halles,
Strasbourg
Les Terrasses du
Port, Marseille
Halles en Ville ,
Mantes
Le Jeu de Paume,
Beauvais
22

Investing in our assets
Italie 2 O’Parinor
Extension & redevelopmentRefurbishment
• Only Parisian shopping centre with a department store
• Adjacent one of Paris’ busiest metro stations
• Renovation to be complete by Q3 2013
• €17 million1 project
• Leases agreed with Adidas and Armand Thierry
• 7 further leases agreed +14% previous rents
• New 7,200 sq. m, 14 screen cinema and food court
extension
• Anchor letting exchanged with UGC
• Predicted to attract over 1 million visitors per annum
• €20million1 extension project
• 58% food court rent already secured
• Retail and building permits received
23
Note:
(1) Before recharged to tenant and JV partners
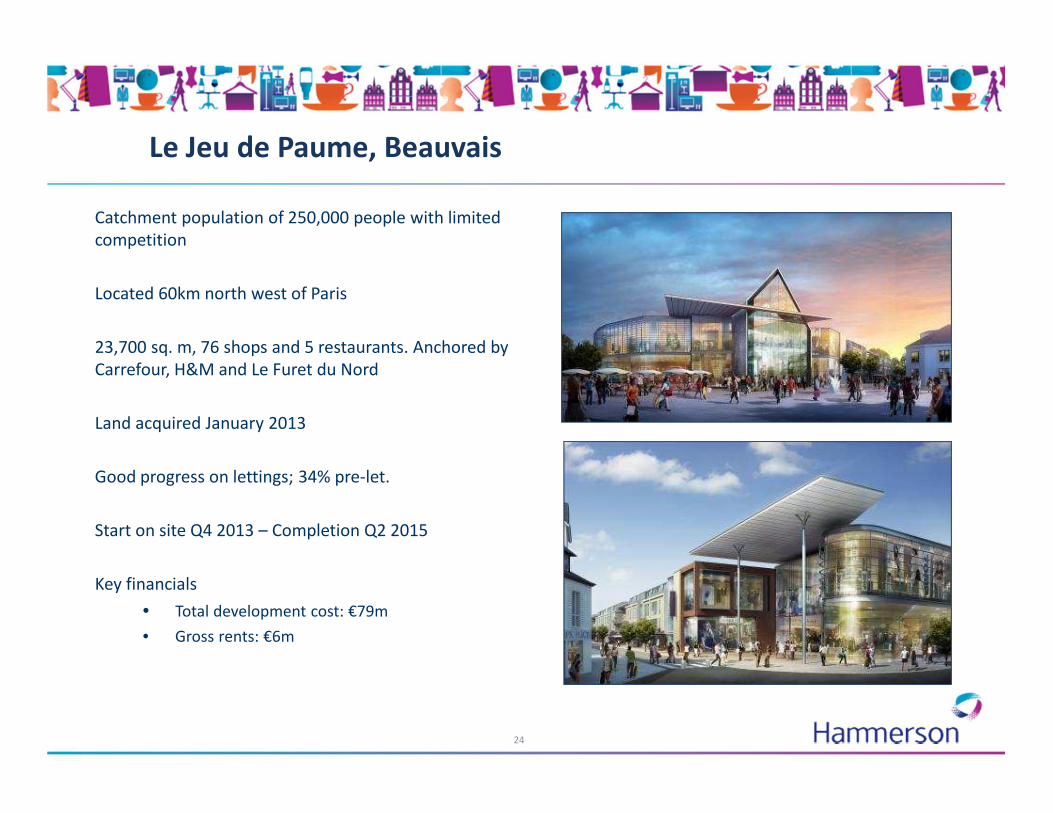
Le Jeu de Paume, Beauvais
Catchment population of 250,000 people with limited
competition
Located 60km north west of Paris
23,700 sq. m, 76 shops and 5 restaurants. Anchored by
Carrefour, H&M and Le Furet du Nord
Land acquired January 2013
Good progress on lettings; 34% pre-let.
Start on site Q4 2013 – Completion Q2 2015
Key financials
• Total development cost: €79m
• Gross rents: €6m
24
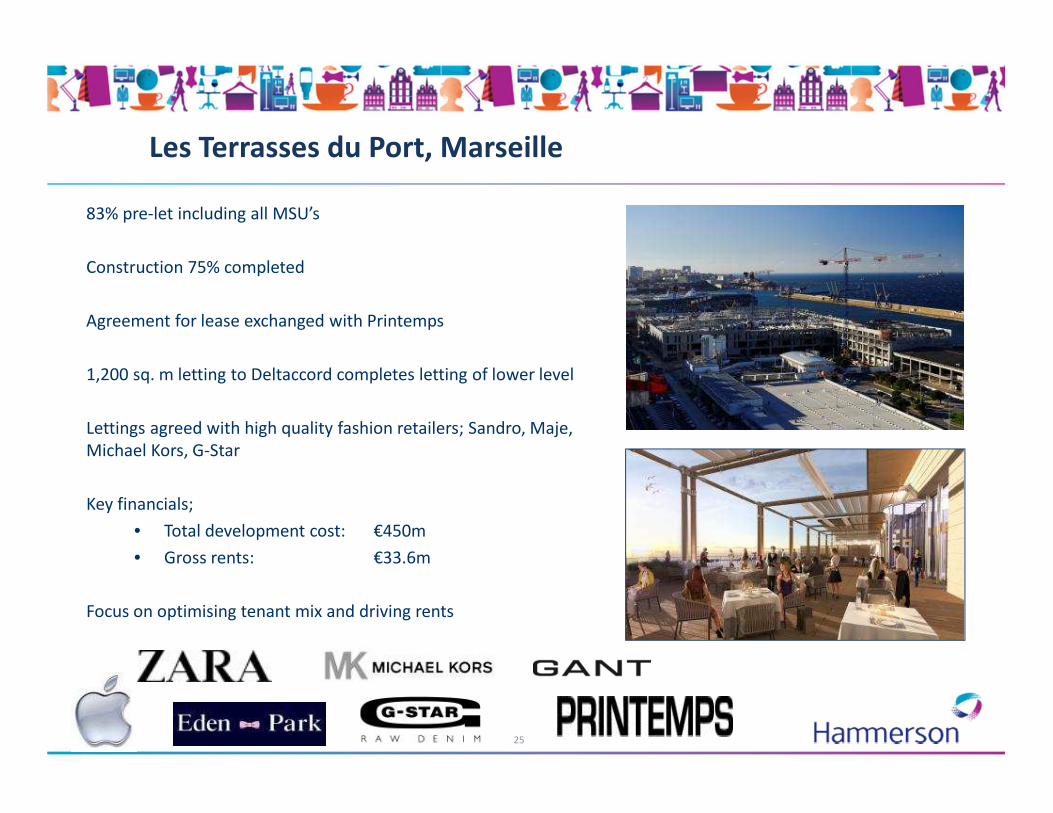
Les Terrasses du Port, Marseille
83% pre-let including all MSU’s
Construction 75% completed
Agreement for lease exchanged with Printemps
1,200 sq. m letting to Deltaccord completes letting of lower level
Lettings agreed with high quality fashion retailers; Sandro, Maje,
Michael Kors, G-Star
Key financials;
• Total development cost: €450m
• Gross rents: €33.6m
Focus on optimising tenant mix and driving rents
25

26
Multi-channel retail
Jean-Philippe Mouton

A busy year for digital engagement
April
Amazon lockers
introduced
Jan July
Ocado shopping wall
@Bullring
August
Full portfolio websites
launched/mobile enabled
October Nov
Google indoor
mapping – BX/WQ
Sept
Google product search live at The
Oracle
January 2013
Google product
search rolled out to
all UK centres
March 2013
Venteprivee.com
“Drive to store”
operation
Average basket :
+34%
Fidall Aps
partnership : digital
loyalty card
acquisition (40% of
new members /
100% opt in)
Trial web/mobile
platform live at Oracle
Dance Flashmob
in O’Parinor
displayed on
(23% footfall
increase)
Foursquare Aps
for each
shopping centerVenteprivee.com “Drive to
store” operation
Average basket : +30%
27
Portfolio student
events @ Highcross,
11k students attended
Free public
wifi across UK
shopping
centres


29
Capital Allocation
Peter Cole

Our investment criteria and recent acquisitions
30
• Principle cities and dominant market
positions
• Well anchored and strong tenant mix
• Sustainable rent:sales ratio
• Developments and acquisitions
• Value Retail investments
• City centres and tourist destinations
• Selective developments and
acquisitions
• Well located and good transport links
• Open A1 planning consents
• Low rents
• Development and asset management
situations
Luxury ConvenienceExperience
Our investment criteria
The Junction FundVictoria Quarter, LeedsWhitgift, Croydon

Whitgift, Croydon: The south London retail opportunity
• Joint venture announced January 2013
• 50% stake in Centrale sold to Westfield
• Outline planning anticipated Q2 2013
• 200,000 sq. m project
• £1 billion total forecast investment
• Accelerated programme targets 2015
start on site
• World class retail venue to open in 2018
31
Whitgift
Centrale

Commitment to Eastgate Quarters, Leeds
• Agreement for lease exchanged with John Lewis
• Outline planning consent already achieved
• Detailed planning application in Q2 2013
• Start on site Spring 2014 – Completion Autumn
2016
• 37,000 sq. m scheme initial phase
• £130m total development cost
• Gross rents £10m
• Linking Victoria and Eastgate Quarters
32

Excellent progress on Junction Fund
Thurrock
• Development of former UCI Cinema completed
• UK’s first Nike retail park store
• 6 hectare conditional land sale agreed for £18.5m
Paisley
• Former Comet re-let to CSL
• Planning permission secured for 5,000 sq. m. redevelopment
• Solicitors instructed with Wren Kitchens, Maplin and Dunelm
• Extension now >60% under offer
Performance
• £25m (10%) valuation uplift since acquisition
• 100,000 sq. m
• 70% floor space openly consented
• Low average rents of £19 psf
• 7% yield rising to 8% with fixed uplifts
33

Conclusion
David Atkins
34

Delivering against our vision
Reorientation to a specialist retail REIT complete
Operating expenses lower by 7%
Les Terrasses du Port 83% let
JV agreed for Whitgift, Croydon
NRI +2.1%
Leases agreed 4% above ERV
Digital engagement with consumers
Excellent contribution from Value Retail
8.3% EPS growth and 7.5% growth in final dividend
2012 total shareholder return of 41%
Strong growth in EPS and dividends
Acquisitions to further boost returns
Delivering on our
strategy
Focused on
winning retail
venues
Industry leading
shareholder
returns
35

36
QuestionsQuestions

Disclaimer
This presentation contains certain statements that are neither reported financial results nor other
historical information. These statements are forward-looking in nature and are subject to risks and
uncertainties. Actual future results may differ materially from those expressed in or implied by these
statements.
Many of these risks and uncertainties relate to factors that are beyond Hammerson's ability to
control or estimate precisely, such as future market conditions, currency fluctuations, the behaviour
of other market participants, the actions of governmental regulators and other risk factors such as
the Company's ability to continue to obtain financing to meet its liquidity needs, changes in the
political, social and regulatory framework in which the Company operates or in economic or
technological trends or conditions, including inflation and consumer confidence, on a global, regional
or national basis.
Readers are cautioned not to place undue reliance on these forward-looking statements, which
speak only as of the date of this document. Hammerson does not undertake any obligation to
publicly release any revisions to these forward-looking statements to reflect events or circumstances
after the date of these materials. Information contained in this presentation relating to the Company
or its share price, or the yield on its shares, should not be relied upon as a guide to future
performance.
37

38
AppendicesAppendices

Our assets
£5.5 billion property portfolio
Assets in UK and France
20 shopping centres
22 retail parks
Investment in Value Retail
2,800 shop units
250 million annual visitors

40
Developments and extensions
Notes: all costs and income are incremental, income is stated net of head rents and rent-free periods (€ converted at £1= €1.233)
% let comprises let or in solicitors hands by income at 25 February 2013
# Phase 1 only, area reflects retail space component
1 50% ownership interest
2 retail space only
3 41% interest
Scheme Lettable area
Earliest start Potential completion
Value at 31/12/12
Estimated costs to complete
Estimated annual income
Let
m2 £m £m £m %ON SITELes Terrasses du Port, Marseille 61,000 Commenced Q2 2014 229 178 27 83Manor Walks, Cramlington 5,900 Commenced Q2 2013 n/a 5 1 44Monument Mall, Newcastle 11,400 Commenced Q3 2013 37 11 1 38
78,300 194 29NEAR TERMAbbotsinch, Paisley 4,900 2013 2014 10 1 60Cyfarthfa, Methyr Tydfil 14,500 2013 2014 28 2 33Elliott's Field, Rugby 16,000 2013 2015 35 3 13Le Jeu de Paume, Beauvais 23,700 2013 2015 64 5 34Brent Cross Cinema, London NW43 9,000 2014 2015 20 2 -Eastgate Quarters (phase 1), Leeds 37,000 2014 2016 120 10 18Halle en Ville, Mantes 32,000 2014 2016 110 9 30Silverburn extension 10,700 2014 2015 12 1 37SQY Ouest 30,000 2014 2015 16 1 -Watermark, Southampton 19,400 2014 2016 70 5 -
197,200 485 39MEDIUM TERMCroydon town centre1 200,000 2015 2018 500 35 -Italie 2, Paris 13eme 6,000 2015 2017 26 2 -Orchard Centre, Didcot 21,000 2015 2016 50 4 -Sevenstone, Sheffield 60,500 2015 2017 285 24 -The Goodsyard, London# 1,2 5,750 2015 phased 100 - -Brent Cross extension, London NW43 87,000 2016 2019 350 26 -Eastgate Quarters (phase 2), Leeds 73,000 2016 2019 470 40 -
453,250 1,781 1312,460 199

Value Retail performance drivers (1)
41
Value Retail
Year ended 31 December
2012
Year ended 31 December
2011 £m £m Income statement Distributions received 4.9 6.1 Share of results of associate 47.5 - Interest receivable 3.4 2.1 Less: EPRA adjustments (43.2) - Total impact of VR on income statement – EPRA basis 12.6 8.2 Balance sheet Other investments - 214.0 Investment in associate 428.4 - Add: EPRA adjustments 16.2 - EPRA adjusted investment in associate 444.6 214.0 Loan to VR 47.0 23.4 Total impact of VR on balance sheet – EPRA basis 491.6 237.4
1. Share of result of associate, less EPRA adjustments, equals £4.3m, the net income from VR recognised from 21 August to 31
December 2012

Hammerson’s Investments in Value Retail
42
Holding Companies
22% equity
Holding Companies
22% equityHammerson
£47 m shareholder
loan
Bicester
Village
La Roca
Village
Las Rozas
Village
La Vallée
Village
Maasmechelen
Village
Fidenza
Village
Wertheim
Village
Ingolstadt
Village
Kildare
Village
Hammerson invests directly in Asset Companies at ‘Investor’ level.
Total Village
ownership (%)
Village Ownership
via LP’s (%)33 15 15 0 13 20 31 0 3
45 26 26 11 24 32 43 11 14

Value Retail investment to associate
200
240
280
320
360
400
440
Additions
Revaluation
31 Aug 2012
Associate
Share of
Income (1)
Distribution
EPRA
adjustments
1 Jan 2012
Investment
31 Dec 2012
Associate
94
214
74 382
48
(2)16
444
431. Includes £38 million portfolio revaluation uplift
£m

Debt maturity (1)
44
0.0
100.0
200.0
300.0
400.0
500.0
600.0
700.0
800.0
900.0
2013 2014 2015 2016 2017 2018 2019 2020 2021 2022 2023 2024 2025 2026 2027 2028
£m
Bank debt drawn Secured debt Euro bonds Sterling bonds Undrawn facilities
1 Does not include new £175m credit facility with April 2018 maturity

2012 components of valuation change
45
(7.1)
(25.9)(30.4)
(6.6)
(70.0)
(9.2)
37.9
(15.6)
(6.7)
6.3
(4.9)
8.8
15.3
(4.0)
15.2
(21.2)
20.7
(30.7)
(17.3)
(48.6)
-80
-60
-40
-20
0
20
40
60
UK shopping centres France retail UK retail parks UK other Total continuing
portfolio
Yield
Income
Development and
other
Total
£m

Rental uplifts from reversions
46
Outstanding rent
reviews 2012 2013 2014 Total
£m £m £m £m £m
Expiries and breaks (UK and France)
ERV 45.8 19.5 17.4 82.7
Passing rents 40.0 19.3 16.8 76.1
Uplift 5.8 0.2 0.6 6.6
Rent reviews (UK only)
ERV 44.5 26.0 43.5 27.5 141.5
Passing rents 41.3 24.3 41.8 25.0 132.4
Uplift 3.2 1.7 1.7 2.5 9.1
Total uplift 3.2 7.5 1.9 3.1 15.7

Trading environment
47
27 Feb 2013
79 in administration (2.3% passing rent)
28 units unoccupied (0.7% passing rent)
UK Shopping Centres
Sales +0.4%
Footfall -2.3%
Rent:Sales 12.3% (Dec 2011: 13.2%)
France Shopping Centres
Sales -3.3%
Footfall -3.4%
Rent:Sales 10.3% (Dec 2011: 9.7%)
31 Dec 2012
63 units in administration (1.19% passing rent)
25 units unoccupied (0.5% passing rent)
Sales & Footfall
Group administrations – 2800 units in portfolio