Embed Size (px)
Citation preview

Full Year 2014 Investor’s Briefing Financial and Operating Results
March 19, 2015
ABS-CBN Investor Presentation 1

14,046 14,664
18,049 18,880
0
5,000
10,000
15,000
20,000
25,000
30,000
35,000
2013 2014
Ad Revenues Consumer Sales
ABS-CBN Investor Presentation 2
Revenues – Excl. Pol Ads
56% 56%
44% 44%
32,094 33,544 4.5%
4.6%
4.4%
For the year ended December 31, 2014

14,046 14,664
19,332 18,880
0
5,000
10,000
15,000
20,000
25,000
30,000
35,000
2013 2014
Ad Revenues Consumer Sales
ABS-CBN Investor Presentation 3
Revenues - Reported
58% 56%
42% 44%
33,378 33,544 0.5%
2.3%
4.4%
For the year ended December 31, 2014
2014 revenues higher than the previous election year

Costs and Expenses
ABS-CBN Investor Presentation 4
9,615 10,114
9,184 9,247
11,499 11,008
0
5,000
10,000
15,000
20,000
25,000
30,000
35,000
2013 2014
For the year ended December 31, 2014
Production
Costs
Cost of Sales
& Services
GAEX
4.3%
5.2%
0.7%
30,298 30,369 0.2%
Production costs down 4.3%

1,430
2,030
0
500
1,000
1,500
2,000
2,500
3,000
3,500
4,000
2013 2014
32,095 33,544
0
5,000
10,000
15,000
20,000
25,000
30,000
35,000
40,000
2013 2014
Financial Summary – Excl. Pol Ads
ABS-CBN Investor Presentation 5
Net Revenues
In PHP Millions
For the year ended December 31, 2014
Costs and Expenses Net Income
Excluding election-related advertisements, 2014 revenues grew by 4.5% due to the strong performance of broadcast group, films both locally and internationally and
further supported by the performance of Sky Cable.
4.5%
29,870 30,369
0
5,000
10,000
15,000
20,000
25,000
30,000
35,000
40,000
2013 2014
1.7%
42.0%

33,378 33,544
0
5,000
10,000
15,000
20,000
25,000
30,000
35,000
40,000
2013 2014
30,298 30,369
0
5,000
10,000
15,000
20,000
25,000
30,000
35,000
40,000
2013 2014
Financial Summary
ABS-CBN Investor Presentation 6
Net Revenues
In PHP Millions
For the year ended December 31, 2014
2,028 2,030
0
500
1,000
1,500
2,000
2,500
3,000
3,500
4,000
2013 2014
Costs and Expenses Net Income
0.5%
0.2%
0.1%

Business Segments – Excl. Pol Ads
ABS-CBN Investor Presentation 7
In Php Millions Revenues EBITDA Net Income
2014 2013 % Ch 2014 2013 % Ch 2014 2013 % Ch
A. TV and Studio 25,555 24,804 3.0% 6,376 5,598 13.9% 2,976 2,137 39.3%
Margins 25.0% 22.6% 11.6% 8.6%
B. Pay TV Networks 7,764 6,937 11.9% 1,856 1,644 12.9% 272 247 10.1%
Margins 23.9% 23.7% 3.5% 3.6%
C. New Businesses 442 545 -18.9% -756 -899 -15.9% -1,218 -954 27.7%
D. Eliminations -217 -192
TOTAL 33,544 32,094 4.5% 7,476 6,343 17.9% 2,030 1,430 41.9%
Margins 22.3% 19.8% 6.1% 4.5%
*** Numbers presented are net of ABS-CBNmobile TVCs.
Our TV and Studio business has continued to strengthen…
For the year ended December 31, 2014

Business Segments - Reported
ABS-CBN Investor Presentation 8
In Php Millions Revenues EBITDA Net Income
2014 2013 % Ch 2014 2013 % Ch 2014 2013 % Ch
A. TV and Studio 25,555 26,087 -2.0% 6,376 6,452 -1.2% 2,976 2,735 8.8%
Margins 25.0% 24.7% 11.6% 10.5%
B. Pay TV Networks 7,764 6,937 11.9% 1,856 1,644 12.9% 272 247 10.1%
Margins 23.9% 23.7% 3.5% 3.6%
C. New Businesses 442 545 -18.9% -756 -899 -15.9% -1,218 -954 27.6%
D. Eliminations -217 -192
TOTAL 33,544 33,377 0.5% 7,476 7,197 3.9% 2,030 2,028 0.1%
Margins 22.3% 21.6% 6.1% 6.1%
*** Numbers presented are net of ABS-CBNmobile TVCs.
For the year ended December 31, 2014
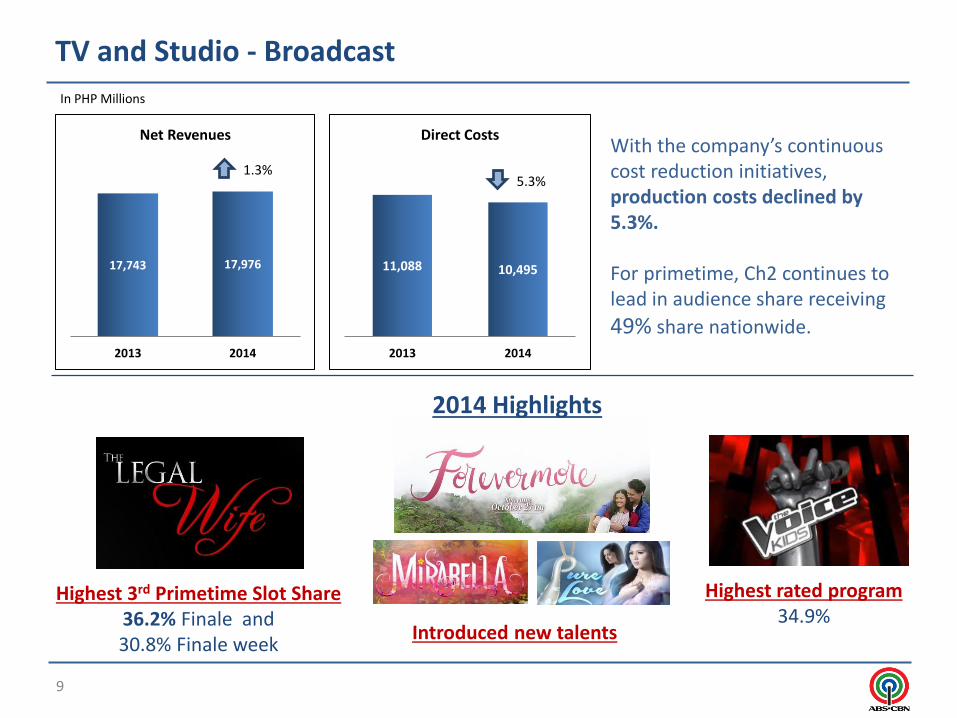
11,088 10,495
2013 2014
Direct Costs
TV and Studio - Broadcast
ABS-CBN Investor Presentation 9
In PHP Millions
With the company’s continuous cost reduction initiatives, production costs declined by 5.3%. For primetime, Ch2 continues to lead in audience share receiving
49% share nationwide.
17,743 17,976
2013 2014
Net Revenues
5.3% 1.3%
Highest 3rd Primetime Slot Share 36.2% Finale and 30.8% Finale week
Highest rated program 34.9%
2014 Highlights
Introduced new talents

TV and Studio - Broadcast
ABS-CBN Investor Presentation 10
2014 Audience
Share
CHANNELS TOTAL DAY PRIMETIME
Total PH Mega
Manila Metro Manila
Total PH
Mega Manila
Metro Manila
ABS-CBN 2 44 31 33 49 34 37
GMA 7 34 40 35 32 40 35
TV 5 9 12 10 8 10 10
Others 14 18 23 11 17 20
Source: Kantar Media, January – December 2014
CHANNELS TOTAL DAY PRIMETIME
Total PH Mega
Manila Metro Manila
Total PH
Mega Manila
Metro Manila
ABS-CBN 2 42 30 32 47 33 35
GMA 7 33 38 35 31 38 35
TV 5 10 13 12 9 12 11
Others 15 19 22 13 18 20
2013 Audience
Share
ABS-CBN has further solidified its leadership in terms of national total day and primetime audience share

TV and Studio - Broadcast
ABS-CBN Investor Presentation 11
Source: Kantar Media, January – December 2014
2014 Top 10 Programs
Rank Channel Program Share
1 ABS-CBN THE VOICE KIDS SUNDAY 34.9 Weekend
2 ABS-CBN THE VOICE KIDS SATURDAY 34.0 Weekend
GMA 7 Pacquiao versus Algieri 34.0 Weekend
3 ABS-CBN HONESTO 31.7 Weekday
4 ABS-CBN MARS RAVELO'S DYESEBEL 30.1 Weekday
5 ABS-CBN BOSES NG BULILIT KAMI ULIT! 28.9 Weekend
6 ABS-CBN IKAW LAMANG 28.4 Weekday
7 ABS-CBN GOT TO BELIEVE 28.3 Weekday
8 ABS-CBN HAWAK KAMAY 28.1 Weekday
9 ABS-CBN MMK ANG TAHANAN MO 28.0 Weekend
THE VOICE OF PH 28.0 Weekend
10 ABS-CBN PBB ALL IN 27.9 Weekend

5,527 5,651
2013 2014
Net Revenues
TV and Studio - Global
ABS-CBN Investor Presentation 12
Global Viewership
The success of international releases played a major role in boosting the revenue of our Global business (12 movies screened across the Global Regions in 2014 vs 8 in 2013)
In PHP Millions
3,341 3,399
2013 2014
Cost of Sales and Servies
2.2% 1.7%
Anti-Piracy Initiatives
$12M federal lawsuits filed against 18 pirate sites
$10M judgment won in Oregon, USA
Search and seizure of pirate DVDs from Mary Smith in Australia
$25M anti-piracy legal victory in New Zealand
2,449 2,522
2,786 2,844
2011 2012 2013 2014
Global Events
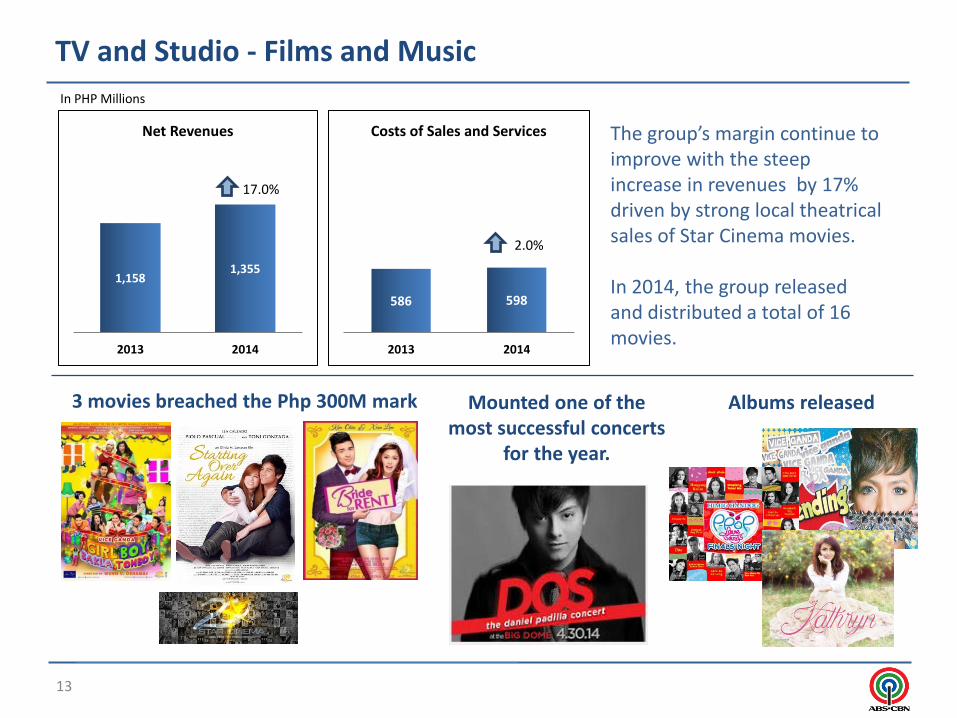
586 598
2013 2014
Costs of Sales and Services
1,158 1,355
2013 2014
Net Revenues
ABS-CBN Investor Presentation 13
The group’s margin continue to improve with the steep increase in revenues by 17% driven by strong local theatrical sales of Star Cinema movies. In 2014, the group released and distributed a total of 16 movies.
TV and Studio - Films and Music
In PHP Millions
2.0%
17.0%
3 movies breached the Php 300M mark Mounted one of the most successful concerts
for the year.
Albums released

Pay TV Networks - SkyCable
6,937 7,764
2013 2014
Net Revenues
ABS-CBN Investor Presentation 14
In PHP Millions
Total revenues grew by Php 827M driven by a 8% increase in cable revenues and 37% increase in broadband revenues. Our broadband subscriber base continues to expand, growing by 24% in 2014.
11.9%
4,484 5,014
2013 2014
Costs and Expenses
11.8%
842 874
-
200
400
600
800
1,000
1,200
2013 2014
Tho
usa
nd
s
Over 40 HD channels currently being offered
2014 Cable and Broadband Subscribers
Cable + Broadband

• Implementing Rules and Regulations released
last December 17, 2014.
• Launched February 2015.
• More than 200,000 boxes to date.
• Target: 1M boxes by year-end.
Digital Terrestrial TV (DTT)
ABS-CBN Investor Presentation 15
- Viewing clarity
- New channels
- No monthly fee
TRANSFORMATIVE
EXPERIENCE FOR THE FAMILY

A Complete Range of Entertainment & Information Content
ABS-CBN Investor Presentation 16

ABS-CBN Investor Presentation 17
Over 1.5M subs as of
end December 2014
with ARPU of Php 65
Exclusive Mobile Content Partnerships

Capital Expenditures - 2014
ABS-CBN Investor Presentation 18
In P
HP
Mill
ion
s
593
2,308 2,684
-
500
1,000
1,500
2,000
2,500
3,000
Program Rights Pay TV Digital TV,Maintenance and Others
Total Spent of Php 5.6 billion in 2014

Capital Expenditures – 2015 Budget
ABS-CBN Investor Presentation 19
In P
HP
Mill
ion
s
1,212
3,149
4,095
-
500
1,000
1,500
2,000
2,500
3,000
3,500
4,000
4,500
Program Rights Pay TV Digital TV,Maintenance and Others
Budgeted Php 8.5 billion in 2015
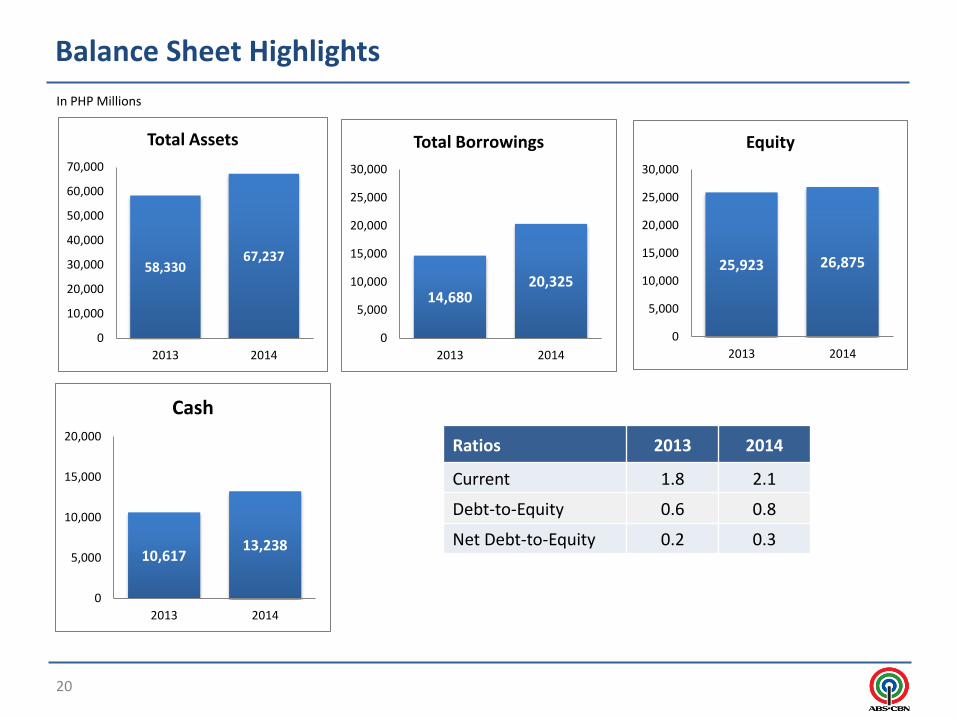
Balance Sheet Highlights
ABS-CBN Investor Presentation 20
Ratios 2013 2014
Current 1.8 2.1
Debt-to-Equity 0.6 0.8
Net Debt-to-Equity 0.2 0.3
In PHP Millions
58,330 67,237
0
10,000
20,000
30,000
40,000
50,000
60,000
70,000
2013 2014
Total Assets
14,680 20,325
0
5,000
10,000
15,000
20,000
25,000
30,000
2013 2014
Total Borrowings
25,923 26,875
0
5,000
10,000
15,000
20,000
25,000
30,000
2013 2014
Equity
10,617 13,238
0
5,000
10,000
15,000
20,000
2013 2014
Cash
Except for historical and operating data and other information of historical matters, the statements contained herein are “forward-looking statements”. The words “believe”, “intend”, “plan”, “anticipate”, “continue”, “estimate”, “expect”, “may”, “will” or other similar words are frequently used to indicate these forward looking statements. Any such forward-looking statement is not a guarantee of future performance and involves a number of known and unknown risks, uncertainties and other factors that could cause the actual performance, financial condition or results of operation of ABS-CBN to be materially different from any future performance, financial condition or results of operation implied by such forward-looking statement.
ABS-CBN Investor Presentation 21

THE END
ABS-CBN Investor Presentation 22