Embed Size (px)
Citation preview
Banks
www.fitchratings.com 18 January 2016
Austria
Erste Group Bank AG Full Rating Report
Key Rating Drivers
IDRs Driven by VR: Erste Group Bank AG’s (Erste) IDRs are based on its stand-alone profile
reflected by its Viability Rating (VR) and factor in its strong and diversified franchise in its core
Austrian, Czech, Slovakian and Romanian markets, generally adequate asset quality (although
this varies across markets) and solid capitalisation, funding and liquidity profiles. They also
reflect improving profitability, still burdened by regulatory charges and persistently low interest
rates, but less affected by one-off events than in previous years.
Improving Asset Quality: Erste’s NPL ratio improved to 7.4% at end-3Q15 from 9.6% at end-
2013, due to intensive workout and NPL sales, especially in Romania, and recovering loan
growth (up 2.3% in 9M15), and NPL coverage at 69% is adequate. The NPL ratio remains
weak in Romania (20%) and Hungary (22%), but Fitch Ratings believes the risk of large NPL
inflows has fallen in both countries, unlike in Croatia, where economic prospects are weaker.
Recovering Earnings on Fewer One-Offs: In 9M15, profit contributions from the individual
central and eastern European (CEE) markets were far more balanced than in previous years as
Romania and Hungary stabilised. Accordingly, the Czech unit’s share of the group’s profit
before tax (PBT) declined to 19% from 34% in 2013. Net profit from Austria doubled yoy,
largely driven by exceptionally low risk costs, which we deem unsustainable through the cycle.
We expect moderate loan growth to mitigate pressure on net interest income (NII) in 2016.
Cost pressure is likely to remain high in the medium term due to high recurring regulatory costs
(bank levies and contributions to the new resolution and deposit protection funds) and
investments in adapting to the changing regulatory and competitive landscapes. Mid-term
profits will depend heavily on the pace of recovery in Hungary and Romania, structurally high
margin pressure in Austria and the risk of new harsher regulation for banks in CEE countries.
Recovering Internal Capital Generation: Internal capital generation turned positive in 9M15
after two negative years. Erste’s fully-loaded Basel III common equity Tier 1 (CET1) ratio
including its 1H15 profit was an adequate 11.2% at end-9M15 and non-risk-weighted leverage
is solid. We expect capitalisation to improve gradually on the back of adequate retained
earnings supported by modest growth, manageable risk costs and resilient operating profit.
Sound Funding and Liquidity: Erste’s funding profile compares favourably with its peers’ and
benefits strongly from its leading retail deposit franchises in Austria, the Czech Republic and
Slovakia. Wholesale funding needs are limited and maturities are well spread. Intragroup
funding needs in Croatia and Romania have declined substantially in recent years but remain
material. Erste’s sound liquidity benefits from a large portfolio of high-quality liquid assets.
Rating Sensitivities
LICs Stabilisation: Any changes to Erste’s standalone creditworthiness would be reflected in
its IDRs. A downgrade of the VR would most probably result from an unexpected deterioration
in Hungary or Croatia or a failure to bolster recovery in Romania or improve its core
capitalisation by maintaining moderate loan impairment charges (LICs) in these markets.
More Balanced CEE Profits: A VR upgrade would require a better risk/return profile across
CEE resulting from normalised regulatory, political and risk costs leading to sustainably higher
profits in these three countries (even though their mid-term contribution to group profits is likely
to remain modest). Continued efforts to further raise the Austrian savings banks segment’s cost
efficiency would also be important to reduce Erste’s reliance on CEE for capital generation.
Ratings
Long-Term IDR BBB+
Short-Term IDR F2
Viability Rating bbb+ Support Rating 5 Support Rating Floor NF
Sovereign Risk Foreign-Currency Long-Term IDR AA+ Local-Currency Long-Term IDR AA+
Outlooks
Foreign-Currency Long-Term IDR Stable Sovereign Foreign-Currency Long-Term IDR
Stable
Sovereign Local-Currency Long-Term IDR
Stable
Financial Data
Erste Group Bank AG
30 Sep
2015 31 Dec
2014
Total assets (USDm) 225,377 238,300 Total assets (EURm) 201,172 196,287 Total equity (EURm) 14,437 13,444 Operating profit (EURm) 1,508 466 Net income (EURm) 1,039 -1,313 LIC/pre-impairment profit (%) 25 81 Operating ROAA (%) 1.0 0.2 Operating ROAE (%) 14.4 3.3 Impaired loans ratio(%) 7.4 8.5 Fitch core capital ratio (%) 12.8 11.8 CET1 ratio (fully loaded) (%) 11.2 10.6 Tangible equity/tangible asset ratio (%)
6.5 6.1
Related Research
2016 Outlook: Austrian Banks (December 2015)
Peer Review: Major Austrian Banks (November 2015)
Erste Group Bank AG - Ratings Navigator (October 2015)
Fitch Downgrades Large Austrian Banks on Support Revision (May 2015)
Fitch Affirms Austria at ‘AA+’; Outlook Stable (August 2015)
Peer Review: Hungarian Banks (November 2015)
Fitch Affirms Hungarian K&H, ERSTE and CIB at 'BBB-' (October 2015)
Fitch Affirms 4 Romanian Banks, Upgrades Banca Comerciala Romana's VR (October 2015)
Fitch Downgrades Erste's Czech and Slovak Subs; Affirms Komercni Banka (May 2015)
Analysts
Patrick Rioual +49 69 768076 123 [email protected]
Maria Shishkina +44 203 530 1379 [email protected]
Banks
Erste Group Bank AG
January 2016 2
Operating Environment
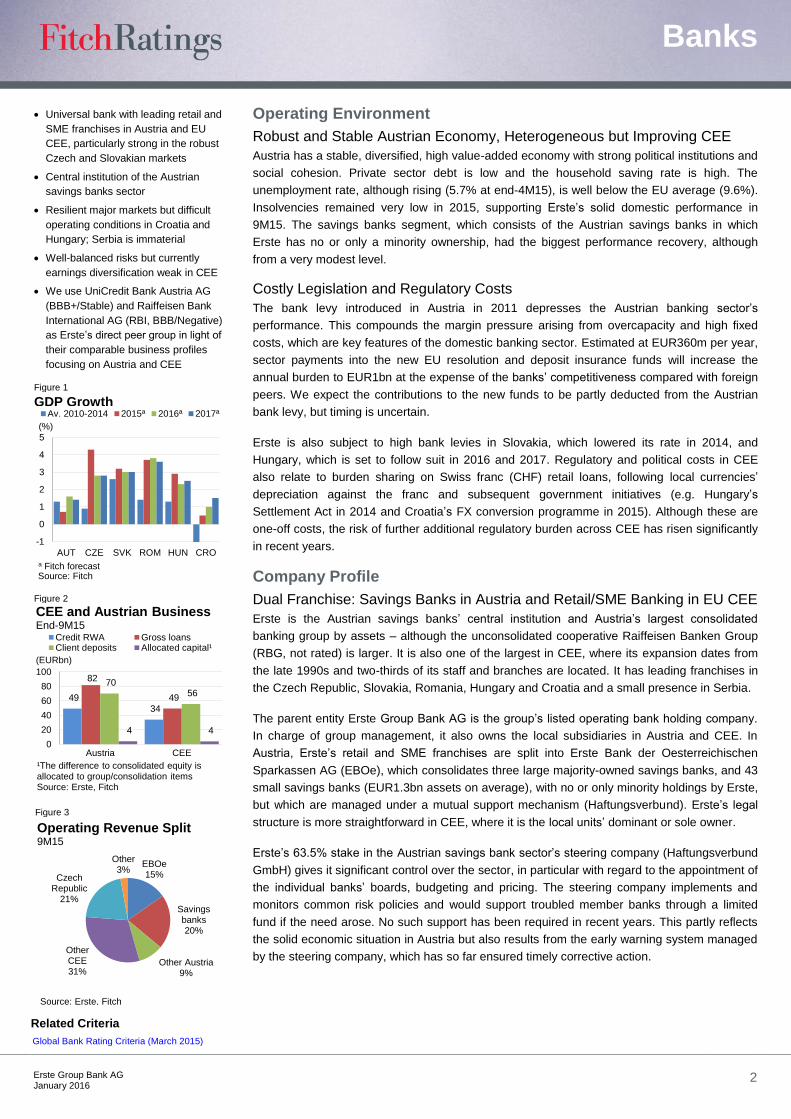
Robust and Stable Austrian Economy, Heterogeneous but Improving CEE
Austria has a stable, diversified, high value-added economy with strong political institutions and
social cohesion. Private sector debt is low and the household saving rate is high. The
unemployment rate, although rising (5.7% at end-4M15), is well below the EU average (9.6%).
Insolvencies remained very low in 2015, supporting Erste’s solid domestic performance in
9M15. The savings banks segment, which consists of the Austrian savings banks in which
Erste has no or only a minority ownership, had the biggest performance recovery, although
from a very modest level.
Costly Legislation and Regulatory Costs
The bank levy introduced in Austria in 2011 depresses the Austrian banking sector’s
performance. This compounds the margin pressure arising from overcapacity and high fixed
costs, which are key features of the domestic banking sector. Estimated at EUR360m per year,
sector payments into the new EU resolution and deposit insurance funds will increase the
annual burden to EUR1bn at the expense of the banks’ competitiveness compared with foreign
peers. We expect the contributions to the new funds to be partly deducted from the Austrian
bank levy, but timing is uncertain.
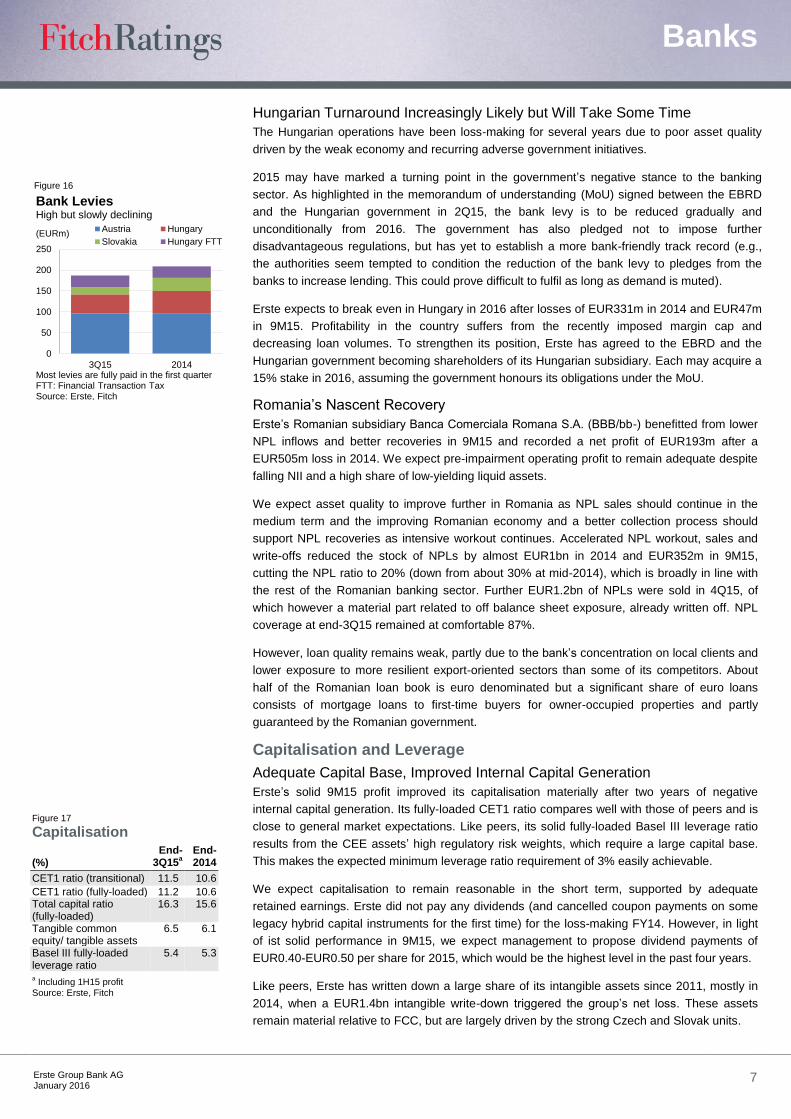
Erste is also subject to high bank levies in Slovakia, which lowered its rate in 2014, and
Hungary, which is set to follow suit in 2016 and 2017. Regulatory and political costs in CEE
also relate to burden sharing on Swiss franc (CHF) retail loans, following local currencies’
depreciation against the franc and subsequent government initiatives (e.g. Hungary’s
Settlement Act in 2014 and Croatia’s FX conversion programme in 2015). Although these are
one-off costs, the risk of further additional regulatory burden across CEE has risen significantly
in recent years.
Company Profile
Dual Franchise: Savings Banks in Austria and Retail/SME Banking in EU CEE
Erste is the Austrian savings banks’ central institution and Austria’s largest consolidated
banking group by assets – although the unconsolidated cooperative Raiffeisen Banken Group
(RBG, not rated) is larger. It is also one of the largest in CEE, where its expansion dates from
the late 1990s and two-thirds of its staff and branches are located. It has leading franchises in
the Czech Republic, Slovakia, Romania, Hungary and Croatia and a small presence in Serbia.
The parent entity Erste Group Bank AG is the group’s listed operating bank holding company.
In charge of group management, it also owns the local subsidiaries in Austria and CEE. In
Austria, Erste’s retail and SME franchises are split into Erste Bank der Oesterreichischen
Sparkassen AG (EBOe), which consolidates three large majority-owned savings banks, and 43
small savings banks (EUR1.3bn assets on average), with no or only minority holdings by Erste,
but which are managed under a mutual support mechanism (Haftungsverbund). Erste’s legal
structure is more straightforward in CEE, where it is the local units’ dominant or sole owner.
Erste’s 63.5% stake in the Austrian savings bank sector’s steering company (Haftungsverbund
GmbH) gives it significant control over the sector, in particular with regard to the appointment of
the individual banks’ boards, budgeting and pricing. The steering company implements and
monitors common risk policies and would support troubled member banks through a limited
fund if the need arose. No such support has been required in recent years. This partly reflects
the solid economic situation in Austria but also results from the early warning system managed
by the steering company, which has so far ensured timely corrective action.
Figure 1
Figure 2
Figure 3
Related Criteria
Global Bank Rating Criteria (March 2015)
-1
0
1
2
3
4
5
AUT CZE SVK ROM HUN CRO
(%)
Av. 2010-2014 2015ª 2016ª 2017ª
Source: Fitch
GDP Growth
a Fitch forecast
49
34
82
49
70 56
4 4
0
20
40
60
80
100
Austria CEE
Credit RWA Gross loansClient deposits Allocated capital¹
CEE and Austrian BusinessEnd-9M15
(EURbn)
¹The difference to consolidated equity is allocated to group/consolidation itemsSource: Erste, Fitch
EBOe15%
Other CEE 31%
Other3%
Operating Revenue Split9M15
Source: Erste, Fitch
Czech Republic
21%Savings banks20%
Other Austria9%
Universal bank with leading retail and
SME franchises in Austria and EU
CEE, particularly strong in the robust
Czech and Slovakian markets
Central institution of the Austrian
savings banks sector
Resilient major markets but difficult
operating conditions in Croatia and
Hungary; Serbia is immaterial
Well-balanced risks but currently
earnings diversification weak in CEE
We use UniCredit Bank Austria AG
(BBB+/Stable) and Raiffeisen Bank
International AG (RBI, BBB/Negative)
as Erste’s direct peer group in light of
their comparable business profiles
focusing on Austria and CEE
Banks
Erste Group Bank AG
January 2016 3
However, the performance of the savings banks which are not part of EBOe is materially
weaker than (and converging only slowly toward) that of EBOe despite a similar retail focus. In
our view, this not only results from their smaller size, which constrains efficiency, but also from
less stringent adherence to the profit-maximisation principles of a listed group.
Strong Market Shares in Austria and CEE
Erste’s market shares in Austrian retail and corporate banking are high (19% at end-9M15). It is
also the market leader in the Czech Republic, Slovakia and Romania and number three in
Croatia. However, its market share in corporate lending in Hungary and Romania has declined
in the last few years. This has resulted from very low new business in Hungary on the back of
the adverse legislative environment and muted demand and large NPL sales in Romania.
Management and Strategy
Instrumental Long-Standing CEO but Limited Succession Risk
In 3Q15, the contract of Erste’s CEO was extended until mid-2020 and a successor has yet to
be selected. As a board member for more than 20 years, he has been instrumental in
restructuring the savings bank sector from a domestically focused, relatively inefficient,
decentralised organisation into a consolidated, more cohesive, integrated and listed group with
a leading CEE franchise and corporate governance in line with market standards.
However, we do not view the prospect of the CEO’s succession as a major challenge despite
his long tenure. We believe that Erste’s management resources, governance and organisation
will allow a reasonably smooth transition. The recent management board reshuffle (three of the
six current members joined in 2014) highlights management’s ability to address the bank’s
recent challenges in CEE and the Austrian retail market.
Committed to EU CEE Despite Challenges
Erste aims to become the leading retail and SME lender in the eastern EU, including Austria.
Its focus on improving efficiency and organic growth makes large acquisitions unlikely until
2017, in our view, although small opportunistic acquisitions such as Citigroup’s Hungarian retail
assets in 3Q15 remain possible. In the long term, we believe the bank could expand its small
Serbian presence if the country converges sufficiently toward EU standards. Its strong long-
term interest in the Polish market is unlikely to materialise until Polish bank assets become
more affordable and regulatory and market pressure to improve capitalisation abates.
Risk Appetite
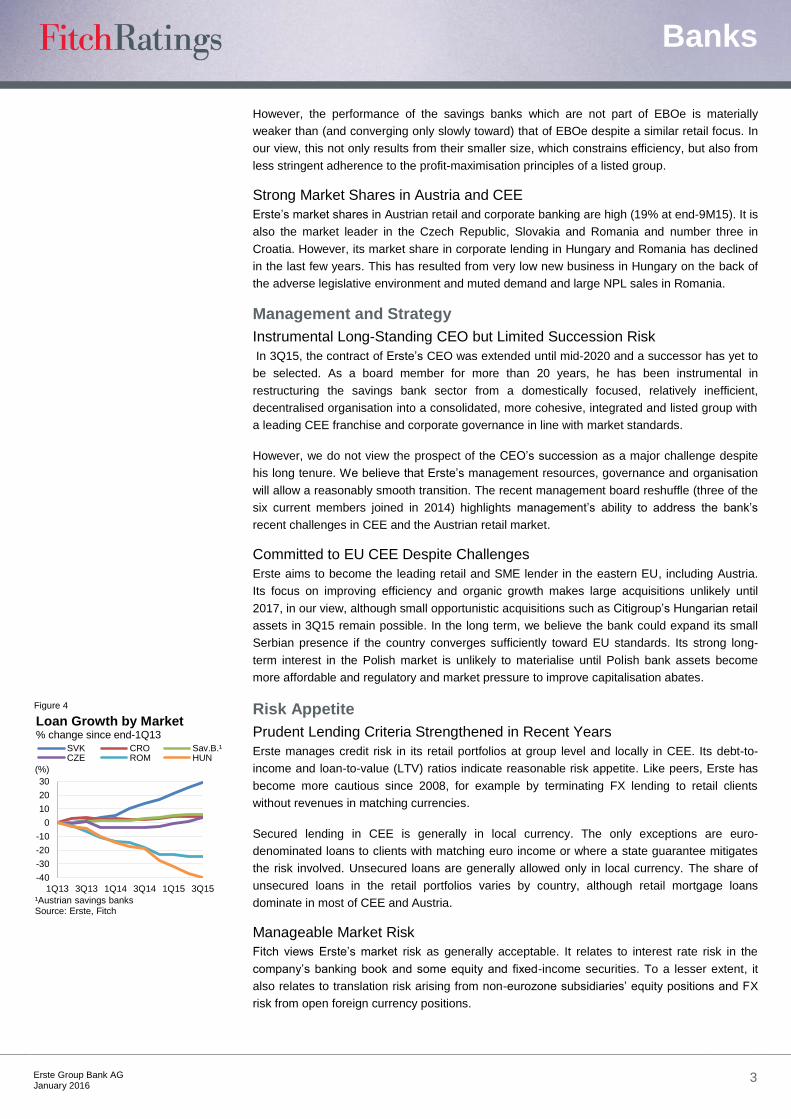
Prudent Lending Criteria Strengthened in Recent Years
Erste manages credit risk in its retail portfolios at group level and locally in CEE. Its debt-to-
income and loan-to-value (LTV) ratios indicate reasonable risk appetite. Like peers, Erste has
become more cautious since 2008, for example by terminating FX lending to retail clients
without revenues in matching currencies.
Secured lending in CEE is generally in local currency. The only exceptions are euro-
denominated loans to clients with matching euro income or where a state guarantee mitigates
the risk involved. Unsecured loans are generally allowed only in local currency. The share of
unsecured loans in the retail portfolios varies by country, although retail mortgage loans
dominate in most of CEE and Austria.
Manageable Market Risk
Fitch views Erste’s market risk as generally acceptable. It relates to interest rate risk in the
company’s banking book and some equity and fixed-income securities. To a lesser extent, it
also relates to translation risk arising from non-eurozone subsidiaries’ equity positions and FX
risk from open foreign currency positions.
Figure 4
-40
-30
-20
-10
0
10
20
30
1Q13 3Q13 1Q14 3Q14 1Q15 3Q15
SVK CRO Sav.B.¹CZE ROM HUN
Loan Growth by Market% change since end-1Q13
¹Austrian savings banksSource: Erste, Fitch
(%)
Banks
Erste Group Bank AG
January 2016 4
Erste uses a value-at-risk approach (VaR, historical simulation, 99% confidence interval, one-
day holding and two-year simulation period) to measure market risk in its banking and trading
books complemented with stressed VaR. Sensitivity and economic capital analyses are used to
control banking book interest rate risk and back tests are performed regularly.
At end-2014, Erste’s total VaR was around EUR18m (based on a one-day holding period).
Based on a 10-day holding period, the VaR would be about EUR57m (or around 0.5% of end-
2014 Fitch Core Capital (FCC)). It mostly relates to structural interest rate risk, largely in the
savings banks, the holding company and a group’s building society (Bausparkasse). While
overall interest rate risk is acceptable, at some subsidiaries it is high. This is specifically the
case at the Bausparkasse (business model driven) and Croatia (partly driven by local
regulation).
Group Risk Management Framework Replicated in All Main CEE Subsidiaries
Control over CEE subsidiaries is tight, with modest local loan approval limits. Interest rate risk
is manageable at group level. Currency and equity risks are more modest and relate mostly to
FX treasury positions and moderate strategic equity positions at the capital market unit.
Erste’s response to the challenges in CEE and the recurring earning pressure in Austria has so
far largely consisted of continuous optimisation, despite the strong reduction of its exposure in
Hungary and Romania and large NPL sales in Romania. It has therefore been more moderate
than its peers’ broad restructuring programmes. RBI’s ongoing deleveraging in CEE is triggered
by capital constraints, and Bank Austria is scaling back retail lending in Austria to cut costs. In
our view, Erste’s need to optimise its cost structure is less pressing than its peers’. However,
unless the Austrian banking sector as a whole steps up its efforts to reduce excess capacity,
improve price discipline and address high fixed costs in its home retail market, we believe that
earning pressure will remain high.
In 9M15, Erste’s loan portfolio grew primarily in its lower-risk markets (Austria, the Czech
Republic and Slovakia) while it stabilised in Romania and contracted further in Hungary. We
expect the group to maintain moderate loan growth in 2016 while its peers will shrink as they
restructure. Management expects the low single-digit growth to continue. This would mitigate
earning pressure arising from planned investments and increasingly demanding regulation.
Asset Quality
Credit Risk Dominates
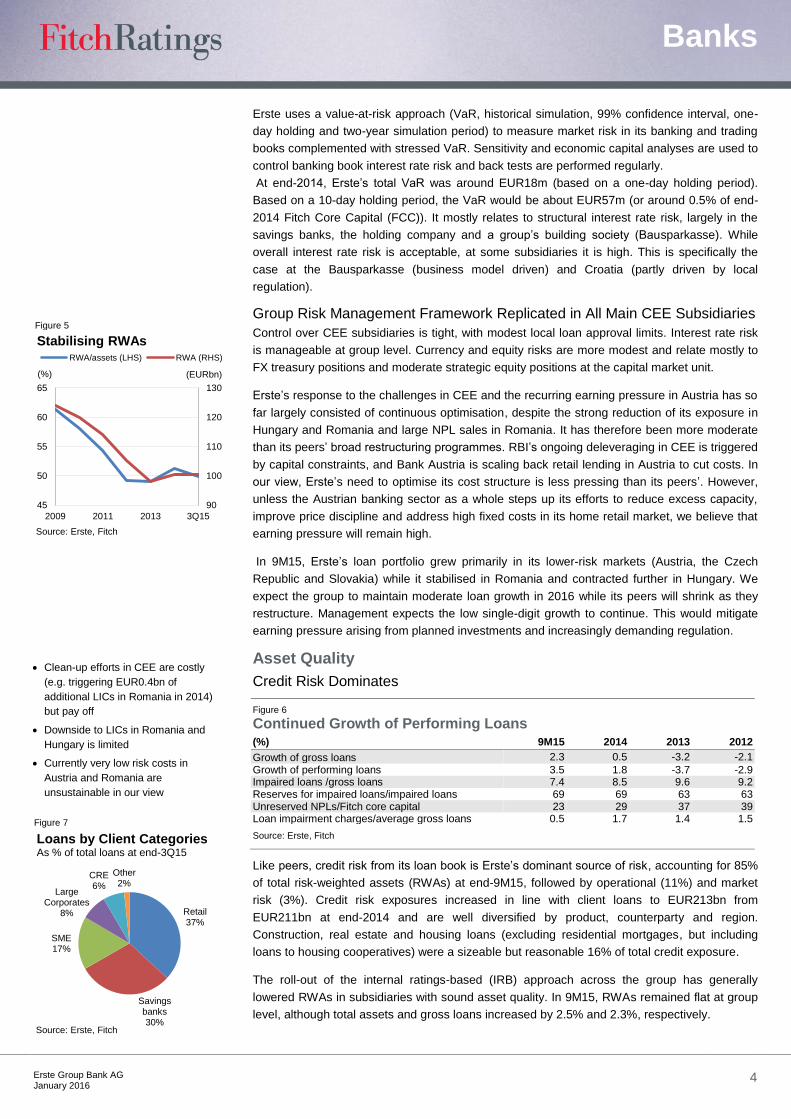
Figure 6 Continued Growth of Performing Loans (%) 9M15 2014 2013 2012
Growth of gross loans 2.3 0.5 -3.2 -2.1
Growth of performing loans 3.5 1.8 -3.7 -2.9 Impaired loans /gross loans 7.4 8.5 9.6 9.2 Reserves for impaired loans/impaired loans 69 69 63 63 Unreserved NPLs/Fitch core capital 23 29 37 39 Loan impairment charges/average gross loans 0.5 1.7 1.4 1.5
Source: Erste, Fitch
Like peers, credit risk from its loan book is Erste’s dominant source of risk, accounting for 85%
of total risk-weighted assets (RWAs) at end-9M15, followed by operational (11%) and market
risk (3%). Credit risk exposures increased in line with client loans to EUR213bn from
EUR211bn at end-2014 and are well diversified by product, counterparty and region.
Construction, real estate and housing loans (excluding residential mortgages, but including
loans to housing cooperatives) were a sizeable but reasonable 16% of total credit exposure.
The roll-out of the internal ratings-based (IRB) approach across the group has generally
lowered RWAs in subsidiaries with sound asset quality. In 9M15, RWAs remained flat at group
level, although total assets and gross loans increased by 2.5% and 2.3%, respectively.
Figure 5
Figure 7
90
100
110
120
130
45
50
55
60
65
2009 2011 2013 3Q15
RWA/assets (LHS) RWA (RHS)
(%)
Stabilising RWAs
Source: Erste, Fitch
(EURbn)
Retail37%
SME17%
CRE6%
Other2%
Source: Erste, Fitch
Loans by Client CategoriesAs % of total loans at end-3Q15
Savings banks30%
Large Corporates
8%
Clean-up efforts in CEE are costly
(e.g. triggering EUR0.4bn of
additional LICs in Romania in 2014)
but pay off
Downside to LICs in Romania and
Hungary is limited
Currently very low risk costs in
Austria and Romania are
unsustainable in our view
Banks
Erste Group Bank AG
January 2016 5
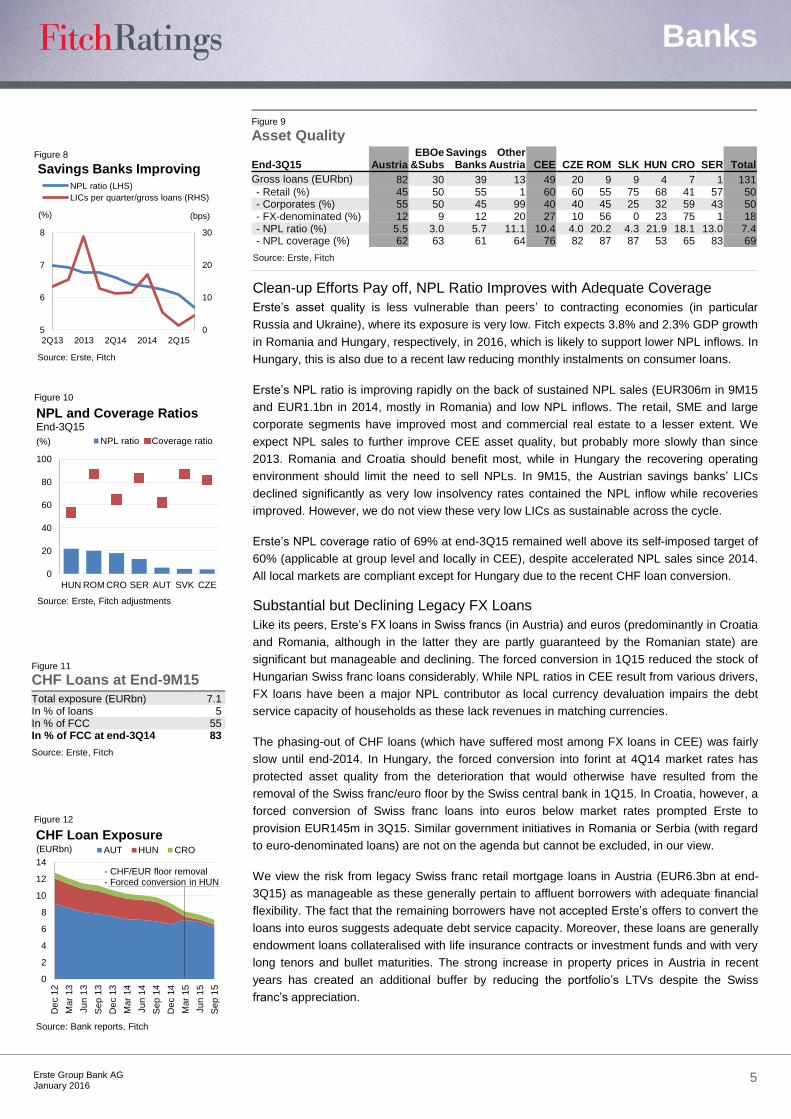
Clean-up Efforts Pay off, NPL Ratio Improves with Adequate Coverage
Erste’s asset quality is less vulnerable than peers’ to contracting economies (in particular
Russia and Ukraine), where its exposure is very low. Fitch expects 3.8% and 2.3% GDP growth
in Romania and Hungary, respectively, in 2016, which is likely to support lower NPL inflows. In
Hungary, this is also due to a recent law reducing monthly instalments on consumer loans.
Erste’s NPL ratio is improving rapidly on the back of sustained NPL sales (EUR306m in 9M15
and EUR1.1bn in 2014, mostly in Romania) and low NPL inflows. The retail, SME and large
corporate segments have improved most and commercial real estate to a lesser extent. We
expect NPL sales to further improve CEE asset quality, but probably more slowly than since
2013. Romania and Croatia should benefit most, while in Hungary the recovering operating
environment should limit the need to sell NPLs. In 9M15, the Austrian savings banks’ LICs
declined significantly as very low insolvency rates contained the NPL inflow while recoveries
improved. However, we do not view these very low LICs as sustainable across the cycle.
Erste’s NPL coverage ratio of 69% at end-3Q15 remained well above its self-imposed target of
60% (applicable at group level and locally in CEE), despite accelerated NPL sales since 2014.
All local markets are compliant except for Hungary due to the recent CHF loan conversion.
Substantial but Declining Legacy FX Loans
Like its peers, Erste’s FX loans in Swiss francs (in Austria) and euros (predominantly in Croatia
and Romania, although in the latter they are partly guaranteed by the Romanian state) are
significant but manageable and declining. The forced conversion in 1Q15 reduced the stock of
Hungarian Swiss franc loans considerably. While NPL ratios in CEE result from various drivers,
FX loans have been a major NPL contributor as local currency devaluation impairs the debt
service capacity of households as these lack revenues in matching currencies.
The phasing-out of CHF loans (which have suffered most among FX loans in CEE) was fairly
slow until end-2014. In Hungary, the forced conversion into forint at 4Q14 market rates has
protected asset quality from the deterioration that would otherwise have resulted from the
removal of the Swiss franc/euro floor by the Swiss central bank in 1Q15. In Croatia, however, a
forced conversion of Swiss franc loans into euros below market rates prompted Erste to
provision EUR145m in 3Q15. Similar government initiatives in Romania or Serbia (with regard
to euro-denominated loans) are not on the agenda but cannot be excluded, in our view.
We view the risk from legacy Swiss franc retail mortgage loans in Austria (EUR6.3bn at end-
3Q15) as manageable as these generally pertain to affluent borrowers with adequate financial
flexibility. The fact that the remaining borrowers have not accepted Erste’s offers to convert the
loans into euros suggests adequate debt service capacity. Moreover, these loans are generally
endowment loans collateralised with life insurance contracts or investment funds and with very
long tenors and bullet maturities. The strong increase in property prices in Austria in recent
years has created an additional buffer by reducing the portfolio’s LTVs despite the Swiss
franc’s appreciation.
Figure 9 Asset Quality
End-3Q15 Austria EBOe
&Subs Savings
Banks Other
Austria CEE CZE ROM SLK HUN CRO SER Total
Gross loans (EURbn) 82 30 39 13 49 20 9 9 4 7 1 131 - Retail (%) 45 50 55 1 60 60 55 75 68 41 57 50 - Corporates (%) 55 50 45 99 40 40 45 25 32 59 43 50 - FX-denominated (%) 12 9 12 20 27 10 56 0 23 75 1 18 - NPL ratio (%) 5.5 3.0 5.7 11.1 10.4 4.0 20.2 4.3 21.9 18.1 13.0 7.4 - NPL coverage (%) 62 63 61 64 76 82 87 87 53 65 83 69
Source: Erste, Fitch
Figure 8
Figure 10
Figure 11
CHF Loans at End-9M15
Total exposure (EURbn) 7.1 In % of loans 5 In % of FCC 55 In % of FCC at end-3Q14 83
Source: Erste, Fitch
Figure 12
0
10
20
30
5
6
7
8
2Q13 2013 2Q14 2014 2Q15
(bps)(%)
NPL ratio (LHS)
LICs per quarter/gross loans (RHS)
Source: Erste, Fitch
Savings Banks Improving
0
20
40
60
80
100
HUN ROM CRO SER AUT SVK CZE
NPL ratio Coverage ratio
NPL and Coverage Ratios End-3Q15
Source: Erste, Fitch adjustments
(%)
0
2
4
6
8
10
12
14
De
c 1
2
Mar
13
Ju
n 1
3
Sep
13
De
c 1
3
Mar
14
Ju
n 1
4
Sep
14
De
c 1
4
Mar
15
Ju
n 1
5
Sep
15
AUT HUN CRO
CHF Loan Exposure
Source: Bank reports, Fitch
(EURbn)
- CHF/EUR floor removal- Forced conversion in HUN
Banks
Erste Group Bank AG
January 2016 6
Large Securities Portfolio Ensures Ample Liquidity
Erste maintains a large securities portfolio (EUR42bn or 21% of total assets at end-3Q15),
mainly to optimise liquidity locally and at group level. The significant liquidity buffers in CEE
demanded by local regulators pressure profitability due to their low interest rates as the bulk of
the portfolio relates to sovereign securities (e.g. Czech sovereign bonds with maturities of up to
six years currently have negative yields). The geographic split mirrors Erste’s operational
presence. Interbank assets have declined substantially since the beginning of the financial
crisis and were less than 4% of total assets at end-3Q15.
Earnings and Profitability
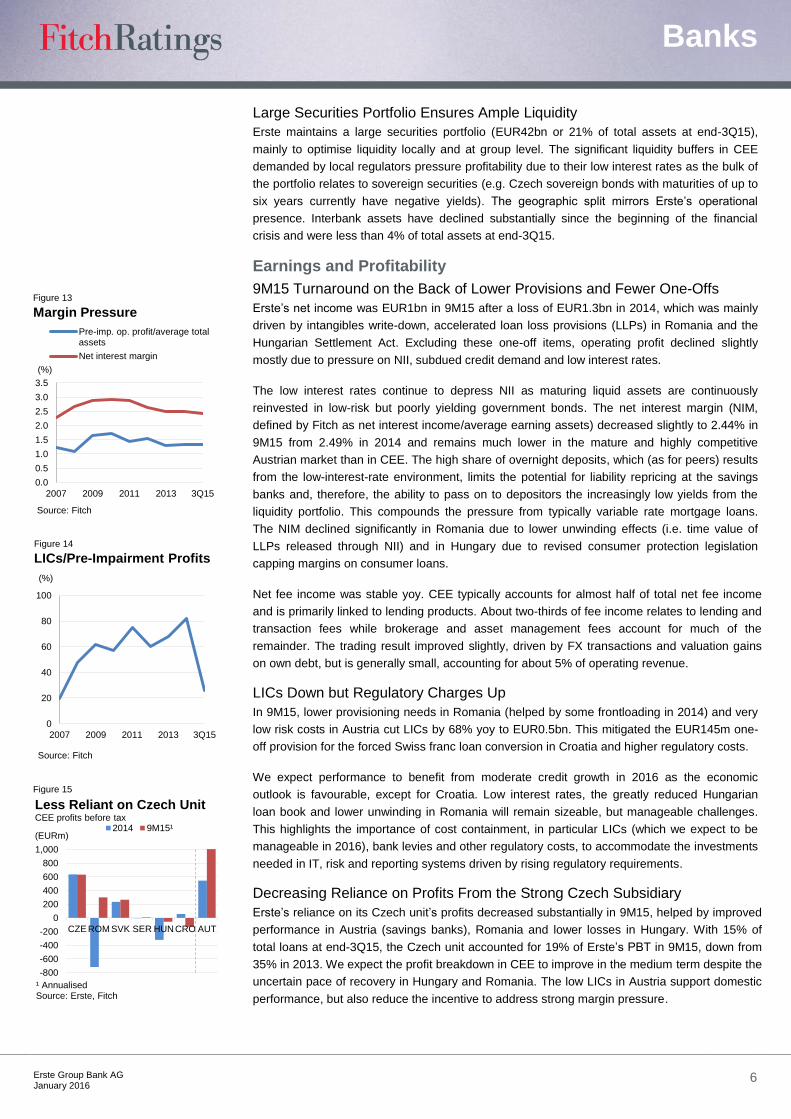
9M15 Turnaround on the Back of Lower Provisions and Fewer One-Offs
Erste’s net income was EUR1bn in 9M15 after a loss of EUR1.3bn in 2014, which was mainly
driven by intangibles write-down, accelerated loan loss provisions (LLPs) in Romania and the
Hungarian Settlement Act. Excluding these one-off items, operating profit declined slightly
mostly due to pressure on NII, subdued credit demand and low interest rates.
The low interest rates continue to depress NII as maturing liquid assets are continuously
reinvested in low-risk but poorly yielding government bonds. The net interest margin (NIM,
defined by Fitch as net interest income/average earning assets) decreased slightly to 2.44% in
9M15 from 2.49% in 2014 and remains much lower in the mature and highly competitive
Austrian market than in CEE. The high share of overnight deposits, which (as for peers) results
from the low-interest-rate environment, limits the potential for liability repricing at the savings
banks and, therefore, the ability to pass on to depositors the increasingly low yields from the
liquidity portfolio. This compounds the pressure from typically variable rate mortgage loans.
The NIM declined significantly in Romania due to lower unwinding effects (i.e. time value of
LLPs released through NII) and in Hungary due to revised consumer protection legislation
capping margins on consumer loans.
Net fee income was stable yoy. CEE typically accounts for almost half of total net fee income
and is primarily linked to lending products. About two-thirds of fee income relates to lending and
transaction fees while brokerage and asset management fees account for much of the
remainder. The trading result improved slightly, driven by FX transactions and valuation gains
on own debt, but is generally small, accounting for about 5% of operating revenue.
LICs Down but Regulatory Charges Up
In 9M15, lower provisioning needs in Romania (helped by some frontloading in 2014) and very
low risk costs in Austria cut LICs by 68% yoy to EUR0.5bn. This mitigated the EUR145m one-
off provision for the forced Swiss franc loan conversion in Croatia and higher regulatory costs.
We expect performance to benefit from moderate credit growth in 2016 as the economic
outlook is favourable, except for Croatia. Low interest rates, the greatly reduced Hungarian
loan book and lower unwinding in Romania will remain sizeable, but manageable challenges.
This highlights the importance of cost containment, in particular LICs (which we expect to be
manageable in 2016), bank levies and other regulatory costs, to accommodate the investments
needed in IT, risk and reporting systems driven by rising regulatory requirements.
Decreasing Reliance on Profits From the Strong Czech Subsidiary
Erste’s reliance on its Czech unit’s profits decreased substantially in 9M15, helped by improved
performance in Austria (savings banks), Romania and lower losses in Hungary. With 15% of
total loans at end-3Q15, the Czech unit accounted for 19% of Erste’s PBT in 9M15, down from
35% in 2013. We expect the profit breakdown in CEE to improve in the medium term despite the
uncertain pace of recovery in Hungary and Romania. The low LICs in Austria support domestic
performance, but also reduce the incentive to address strong margin pressure.
Figure 13
Figure 14
Figure 15
0.0
0.5
1.0
1.5
2.0
2.5
3.0
3.5
2007 2009 2011 2013 3Q15
(%)
Pre-imp. op. profit/average totalassets
Net interest margin
Source: Fitch
Margin Pressure
0
20
40
60
80
100
2007 2009 2011 2013 3Q15
(%)
Source: Fitch
LICs/Pre-Impairment Profits
-800
-600
-400
-200
0
200
400
600
800
1,000
CZE ROM SVK SER HUNCRO AUT
2014 9M15¹
Less Reliant on Czech UnitCEE profits before tax
¹ AnnualisedSource: Erste, Fitch
(EURm)
Banks
Erste Group Bank AG
January 2016 7
Hungarian Turnaround Increasingly Likely but Will Take Some Time
The Hungarian operations have been loss-making for several years due to poor asset quality
driven by the weak economy and recurring adverse government initiatives.
2015 may have marked a turning point in the government’s negative stance to the banking
sector. As highlighted in the memorandum of understanding (MoU) signed between the EBRD
and the Hungarian government in 2Q15, the bank levy is to be reduced gradually and
unconditionally from 2016. The government has also pledged not to impose further
disadvantageous regulations, but has yet to establish a more bank-friendly track record (e.g.,
the authorities seem tempted to condition the reduction of the bank levy to pledges from the
banks to increase lending. This could prove difficult to fulfil as long as demand is muted).
Erste expects to break even in Hungary in 2016 after losses of EUR331m in 2014 and EUR47m
in 9M15. Profitability in the country suffers from the recently imposed margin cap and
decreasing loan volumes. To strengthen its position, Erste has agreed to the EBRD and the
Hungarian government becoming shareholders of its Hungarian subsidiary. Each may acquire a
15% stake in 2016, assuming the government honours its obligations under the MoU.
Romania’s Nascent Recovery
Erste’s Romanian subsidiary Banca Comerciala Romana S.A. (BBB/bb-) benefitted from lower
NPL inflows and better recoveries in 9M15 and recorded a net profit of EUR193m after a
EUR505m loss in 2014. We expect pre-impairment operating profit to remain adequate despite
falling NII and a high share of low-yielding liquid assets.
We expect asset quality to improve further in Romania as NPL sales should continue in the
medium term and the improving Romanian economy and a better collection process should
support NPL recoveries as intensive workout continues. Accelerated NPL workout, sales and
write-offs reduced the stock of NPLs by almost EUR1bn in 2014 and EUR352m in 9M15,
cutting the NPL ratio to 20% (down from about 30% at mid-2014), which is broadly in line with
the rest of the Romanian banking sector. Further EUR1.2bn of NPLs were sold in 4Q15, of
which however a material part related to off balance sheet exposure, already written off. NPL
coverage at end-3Q15 remained at comfortable 87%.
However, loan quality remains weak, partly due to the bank’s concentration on local clients and
lower exposure to more resilient export-oriented sectors than some of its competitors. About
half of the Romanian loan book is euro denominated but a significant share of euro loans
consists of mortgage loans to first-time buyers for owner-occupied properties and partly
guaranteed by the Romanian government.
Capitalisation and Leverage
Adequate Capital Base, Improved Internal Capital Generation
Erste’s solid 9M15 profit improved its capitalisation materially after two years of negative
internal capital generation. Its fully-loaded CET1 ratio compares well with those of peers and is
close to general market expectations. Like peers, its solid fully-loaded Basel III leverage ratio
results from the CEE assets’ high regulatory risk weights, which require a large capital base.
This makes the expected minimum leverage ratio requirement of 3% easily achievable.
We expect capitalisation to remain reasonable in the short term, supported by adequate
retained earnings. Erste did not pay any dividends (and cancelled coupon payments on some
legacy hybrid capital instruments for the first time) for the loss-making FY14. However, in light
of ist solid performance in 9M15, we expect management to propose dividend payments of
EUR0.40-EUR0.50 per share for 2015, which would be the highest level in the past four years.
Like peers, Erste has written down a large share of its intangible assets since 2011, mostly in
2014, when a EUR1.4bn intangible write-down triggered the group’s net loss. These assets
remain material relative to FCC, but are largely driven by the strong Czech and Slovak units.
Figure 16
Figure 17 Capitalisation
(%) End-
3Q15a
End-2014
CET1 ratio (transitional) 11.5 10.6
CET1 ratio (fully-loaded) 11.2 10.6 Total capital ratio (fully-loaded)
16.3 15.6
Tangible common equity/ tangible assets
6.5 6.1
Basel III fully-loaded leverage ratio
5.4 5.3
a Including 1H15 profit
Source: Erste, Fitch
0
50
100
150
200
250
3Q15 2014
Austria Hungary
Slovakia Hungary FTT
Bank LeviesHigh but slowly declining
Most levies are fully paid in the first quarterFTT: Financial Transaction TaxSource: Erste, Fitch
(EURm)
Banks
Erste Group Bank AG
January 2016 8
New Pillar II Requirements Likely to be Manageable
Similar to most major banks directly supervised by the ECB, Erste was assigned a new (but
undisclosed) Pillar II CET1 ratio requirement (Supervisory Review and Evaluation Process;
SREP ratio) in 4Q15, to be applied from January 2016. The EU’s minimum requirement for own
funds and eligible liabilities (MREL) regulations have not yet been finalised in any of Erste’s
markets. In anticipation of the final requirements and further regulatory clarifications next year,
Erste could issue additional Tier 1 (AT1) or Basel III-compliant Tier 2 debt.
Erste has not yet issued AT1 under its EUR2bn AT1 issuance programme in place since
2Q14. The programme offers some flexibility to seize market opportunities as these arise,
notably to compensate the regulatory phasing-out of legacy hybrids. In addition, in 3Q15 the
Austrian Financial Market Stability Board recommended activating a systemic risk buffer
requirement for the largest Austrian banks (including Erste) on top of the individual SREP
ratios, to be phased in from 25bp of RWAs in 2016 to 200bp in 2019.
Institution Protection Scheme Enables Beneficial Minorities Treatment
In 2014, Erste updated the statutes of the institutional protection scheme it shares with the
Austrian savings banks. The resulting stronger group cohesion enables the scheme to comply
with the EU’s Capital Requirement Directive (CRR). As a result, Erste remains exempt from
deducting EUR3.3bn minority interests in savings bank members of the scheme from its
regulatory CET1 capital.
Funding and Liquidity
Solid Funding Profile
Erste’s funding profile compares favourably with those of peers due to the savings banks’
strong retail deposit franchises in Austria (over half of total deposits), and the Czech Republic
and Slovakia (together about 30% of total deposits).
Moderate Wholesale Funding Needs
The bank cut its short-term market funding and increased its local currency deposits during the
financial crisis, and modest deleveraging since 2012 has improved its funding position. Despite
its moderate wholesale funding needs, Erste is developing its CEE subsidiaries’ local debt
issuance, with the Czech and Slovak units being the most advanced. Annual debt maturities,
which Erste aims to limit to EUR4bn, are declining thanks to its more balanced loan/deposit
profile, to a moderate EUR4.2bn in 2016 and EUR2.6bn in 2017. Longer-term debt issuance
(mostly under the EUR30bn issuance programme) is well-diversified by instrument and maturity.
Client deposits account for more than two-thirds of total funding, having risen by EUR7.8bn
since 2010 while gross loans contracted by EUR1.5bn, resulting in a more balanced funding
structure and reducing Erste’s loan/deposit ratio to 105% at end-3Q15 from 113% at end-2010..
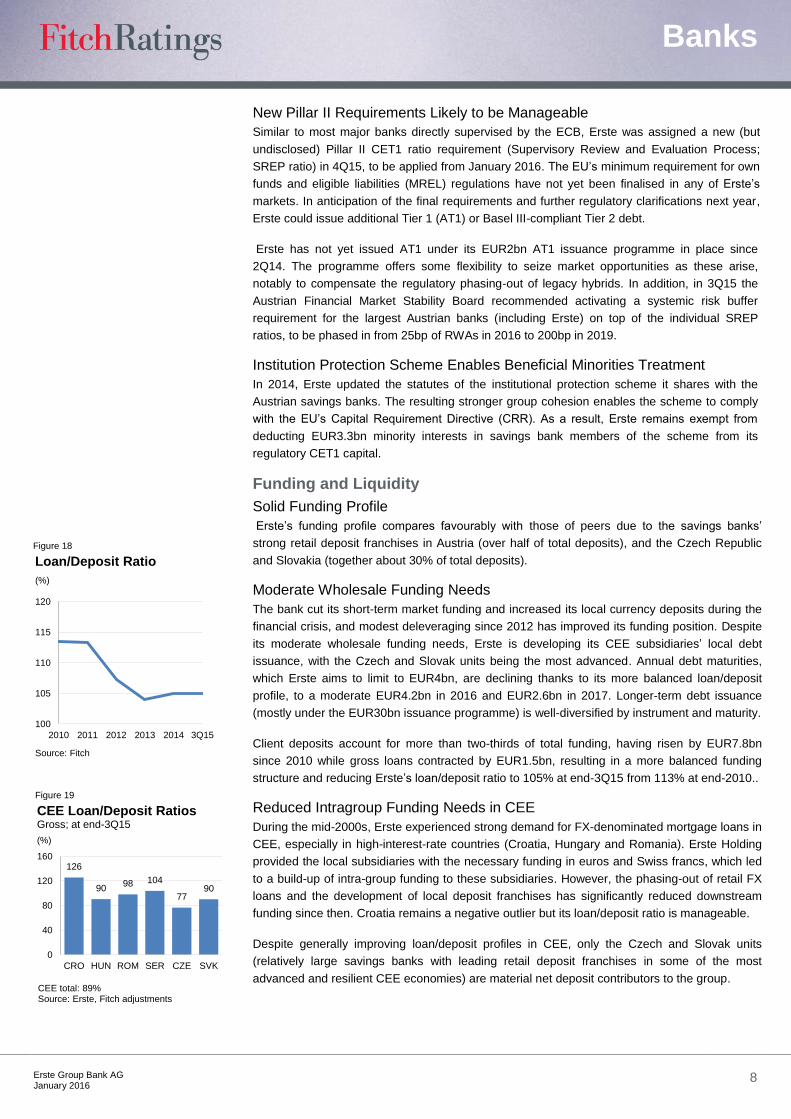
Reduced Intragroup Funding Needs in CEE
During the mid-2000s, Erste experienced strong demand for FX-denominated mortgage loans in
CEE, especially in high-interest-rate countries (Croatia, Hungary and Romania). Erste Holding
provided the local subsidiaries with the necessary funding in euros and Swiss francs, which led
to a build-up of intra-group funding to these subsidiaries. However, the phasing-out of retail FX
loans and the development of local deposit franchises has significantly reduced downstream
funding since then. Croatia remains a negative outlier but its loan/deposit ratio is manageable.
Despite generally improving loan/deposit profiles in CEE, only the Czech and Slovak units
(relatively large savings banks with leading retail deposit franchises in some of the most
advanced and resilient CEE economies) are material net deposit contributors to the group.
Figure 18
Figure 19
100
105
110
115
120
2010 2011 2012 2013 2014 3Q15
Loan/Deposit Ratio
Source: Fitch
(%)
126
9098 104
7790
0
40
80
120
160
CRO HUN ROM SER CZE SVK
CEE total: 89%Source: Erste, Fitch adjustments
(%)
CEE Loan/Deposit RatiosGross; at end-3Q15
Banks
Erste Group Bank AG
January 2016 9
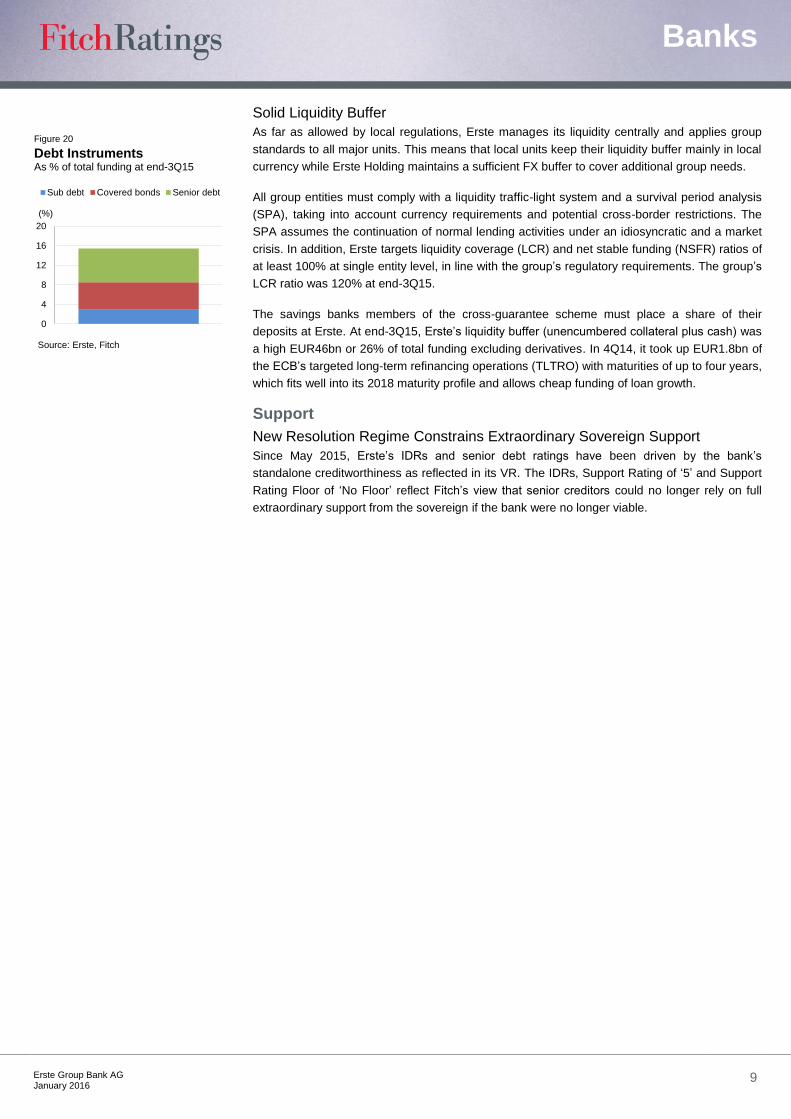
Solid Liquidity Buffer
As far as allowed by local regulations, Erste manages its liquidity centrally and applies group
standards to all major units. This means that local units keep their liquidity buffer mainly in local
currency while Erste Holding maintains a sufficient FX buffer to cover additional group needs.
All group entities must comply with a liquidity traffic-light system and a survival period analysis
(SPA), taking into account currency requirements and potential cross-border restrictions. The
SPA assumes the continuation of normal lending activities under an idiosyncratic and a market
crisis. In addition, Erste targets liquidity coverage (LCR) and net stable funding (NSFR) ratios of
at least 100% at single entity level, in line with the group’s regulatory requirements. The group’s
LCR ratio was 120% at end-3Q15.
The savings banks members of the cross-guarantee scheme must place a share of their
deposits at Erste. At end-3Q15, Erste’s liquidity buffer (unencumbered collateral plus cash) was
a high EUR46bn or 26% of total funding excluding derivatives. In 4Q14, it took up EUR1.8bn of
the ECB’s targeted long-term refinancing operations (TLTRO) with maturities of up to four years,
which fits well into its 2018 maturity profile and allows cheap funding of loan growth.
Support
New Resolution Regime Constrains Extraordinary Sovereign Support
Since May 2015, Erste’s IDRs and senior debt ratings have been driven by the bank’s
standalone creditworthiness as reflected in its VR. The IDRs, Support Rating of ‘5’ and Support
Rating Floor of ‘No Floor’ reflect Fitch’s view that senior creditors could no longer rely on full
extraordinary support from the sovereign if the bank were no longer viable.
Figure 20
0
4
8
12
16
20
(%)
Sub debt Covered bonds Senior debt
Source: Erste, Fitch
Debt InstrumentsAs % of total funding at end-3Q15
Banks
Erste Group Bank AG
January 2016 10
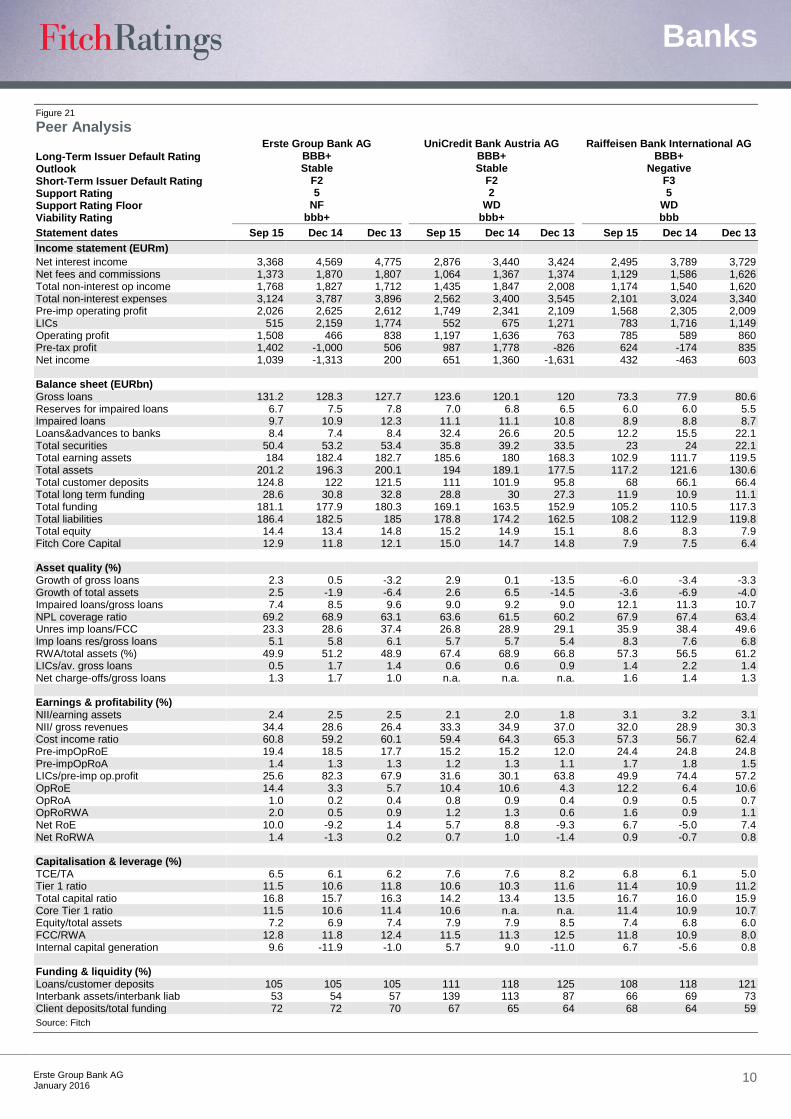
Figure 21 Peer Analysis
Long-Term Issuer Default Rating Outlook Short-Term Issuer Default Rating Support Rating Support Rating Floor Viability Rating
Erste Group Bank AG BBB+ Stable
F2 5
NF bbb+
UniCredit Bank Austria AG BBB+ Stable
F2 2
WD bbb+
Raiffeisen Bank International AG BBB+
Negative F3 5
WD bbb
Statement dates Sep 15 Dec 14 Dec 13 Sep 15 Dec 14 Dec 13 Sep 15 Dec 14 Dec 13
Income statement (EURm)
Net interest income 3,368 4,569 4,775 2,876 3,440 3,424 2,495 3,789 3,729 Net fees and commissions 1,373 1,870 1,807 1,064 1,367 1,374 1,129 1,586 1,626 Total non-interest op income 1,768 1,827 1,712 1,435 1,847 2,008 1,174 1,540 1,620 Total non-interest expenses 3,124 3,787 3,896 2,562 3,400 3,545 2,101 3,024 3,340 Pre-imp operating profit 2,026 2,625 2,612 1,749 2,341 2,109 1,568 2,305 2,009 LICs 515 2,159 1,774 552 675 1,271 783 1,716 1,149 Operating profit 1,508 466 838 1,197 1,636 763 785 589 860 Pre-tax profit 1,402 -1,000 506 987 1,778 -826 624 -174 835 Net income 1,039 -1,313 200 651 1,360 -1,631 432 -463 603 Balance sheet (EURbn)
Gross loans 131.2 128.3 127.7 123.6 120.1 120 73.3 77.9 80.6 Reserves for impaired loans 6.7 7.5 7.8 7.0 6.8 6.5 6.0 6.0 5.5 Impaired loans 9.7 10.9 12.3 11.1 11.1 10.8 8.9 8.8 8.7 Loans&advances to banks 8.4 7.4 8.4 32.4 26.6 20.5 12.2 15.5 22.1 Total securities 50.4 53.2 53.4 35.8 39.2 33.5 23 24 22.1 Total earning assets 184 182.4 182.7 185.6 180 168.3 102.9 111.7 119.5 Total assets 201.2 196.3 200.1 194 189.1 177.5 117.2 121.6 130.6 Total customer deposits 124.8 122 121.5 111 101.9 95.8 68 66.1 66.4 Total long term funding 28.6 30.8 32.8 28.8 30 27.3 11.9 10.9 11.1 Total funding 181.1 177.9 180.3 169.1 163.5 152.9 105.2 110.5 117.3 Total liabilities 186.4 182.5 185 178.8 174.2 162.5 108.2 112.9 119.8 Total equity 14.4 13.4 14.8 15.2 14.9 15.1 8.6 8.3 7.9 Fitch Core Capital 12.9 11.8 12.1 15.0 14.7 14.8 7.9 7.5 6.4 Asset quality (%)
Growth of gross loans 2.3 0.5 -3.2 2.9 0.1 -13.5 -6.0 -3.4 -3.3 Growth of total assets 2.5 -1.9 -6.4 2.6 6.5 -14.5 -3.6 -6.9 -4.0 Impaired loans/gross loans 7.4 8.5 9.6 9.0 9.2 9.0 12.1 11.3 10.7 NPL coverage ratio 69.2 68.9 63.1 63.6 61.5 60.2 67.9 67.4 63.4 Unres imp loans/FCC 23.3 28.6 37.4 26.8 28.9 29.1 35.9 38.4 49.6 Imp loans res/gross loans 5.1 5.8 6.1 5.7 5.7 5.4 8.3 7.6 6.8 RWA/total assets (%) 49.9 51.2 48.9 67.4 68.9 66.8 57.3 56.5 61.2 LICs/av. gross loans 0.5 1.7 1.4 0.6 0.6 0.9 1.4 2.2 1.4 Net charge-offs/gross loans 1.3 1.7 1.0 n.a. n.a. n.a. 1.6 1.4 1.3 Earnings & profitability (%)
NII/earning assets 2.4 2.5 2.5 2.1 2.0 1.8 3.1 3.2 3.1 NII/ gross revenues 34.4 28.6 26.4 33.3 34.9 37.0 32.0 28.9 30.3 Cost income ratio 60.8 59.2 60.1 59.4 64.3 65.3 57.3 56.7 62.4 Pre-impOpRoE 19.4 18.5 17.7 15.2 15.2 12.0 24.4 24.8 24.8 Pre-impOpRoA 1.4 1.3 1.3 1.2 1.3 1.1 1.7 1.8 1.5 LICs/pre-imp op.profit 25.6 82.3 67.9 31.6 30.1 63.8 49.9 74.4 57.2 OpRoE 14.4 3.3 5.7 10.4 10.6 4.3 12.2 6.4 10.6 OpRoA 1.0 0.2 0.4 0.8 0.9 0.4 0.9 0.5 0.7 OpRoRWA 2.0 0.5 0.9 1.2 1.3 0.6 1.6 0.9 1.1 Net RoE 10.0 -9.2 1.4 5.7 8.8 -9.3 6.7 -5.0 7.4 Net RoRWA 1.4 -1.3 0.2 0.7 1.0 -1.4 0.9 -0.7 0.8 Capitalisation & leverage (%)
TCE/TA 6.5 6.1 6.2 7.6 7.6 8.2 6.8 6.1 5.0 Tier 1 ratio 11.5 10.6 11.8 10.6 10.3 11.6 11.4 10.9 11.2 Total capital ratio 16.8 15.7 16.3 14.2 13.4 13.5 16.7 16.0 15.9 Core Tier 1 ratio 11.5 10.6 11.4 10.6 n.a. n.a. 11.4 10.9 10.7 Equity/total assets 7.2 6.9 7.4 7.9 7.9 8.5 7.4 6.8 6.0 FCC/RWA 12.8 11.8 12.4 11.5 11.3 12.5 11.8 10.9 8.0 Internal capital generation 9.6 -11.9 -1.0 5.7 9.0 -11.0 6.7 -5.6 0.8
Funding & liquidity (%) Loans/customer deposits 105 105 105 111 118 125 108 118 121
Interbank assets/interbank liab 53 54 57 139 113 87 66 69 73 Client deposits/total funding 72 72 70 67 65 64 68 64 59
Source: Fitch
Banks
Erste Group Bank AG
January 2016 11
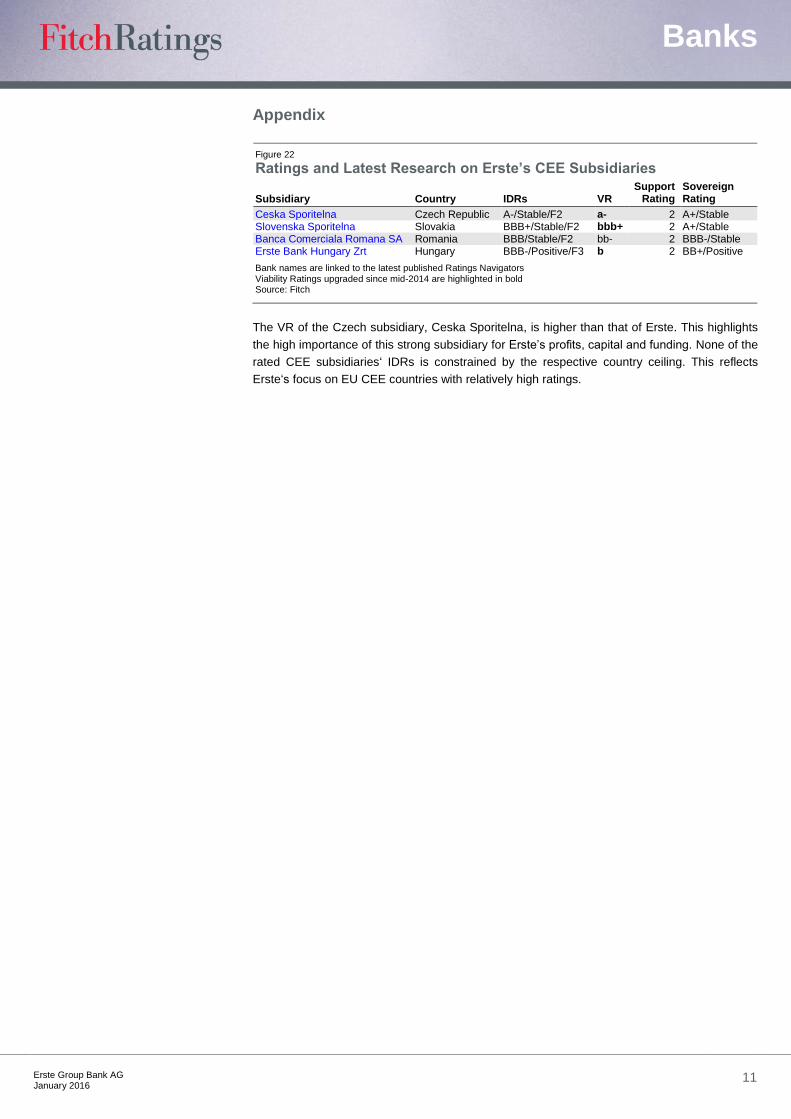
Appendix
Figure 22 Ratings and Latest Research on Erste’s CEE Subsidiaries
Subsidiary Country IDRs VR Support
Rating Sovereign Rating
Ceska Sporitelna Czech Republic A-/Stable/F2 a- 2 A+/Stable Slovenska Sporitelna Slovakia BBB+/Stable/F2 bbb+ 2 A+/Stable Banca Comerciala Romana SA Romania BBB/Stable/F2 bb- 2 BBB-/Stable Erste Bank Hungary Zrt Hungary BBB-/Positive/F3 b 2 BB+/Positive
Bank names are linked to the latest published Ratings Navigators Viability Ratings upgraded since mid-2014 are highlighted in bold Source: Fitch
The VR of the Czech subsidiary, Ceska Sporitelna, is higher than that of Erste. This highlights
the high importance of this strong subsidiary for Erste’s profits, capital and funding. None of the
rated CEE subsidiaries‘ IDRs is constrained by the respective country ceiling. This reflects
Erste‘s focus on EU CEE countries with relatively high ratings.
Banks
Erste Group Bank AG
January 2016 12
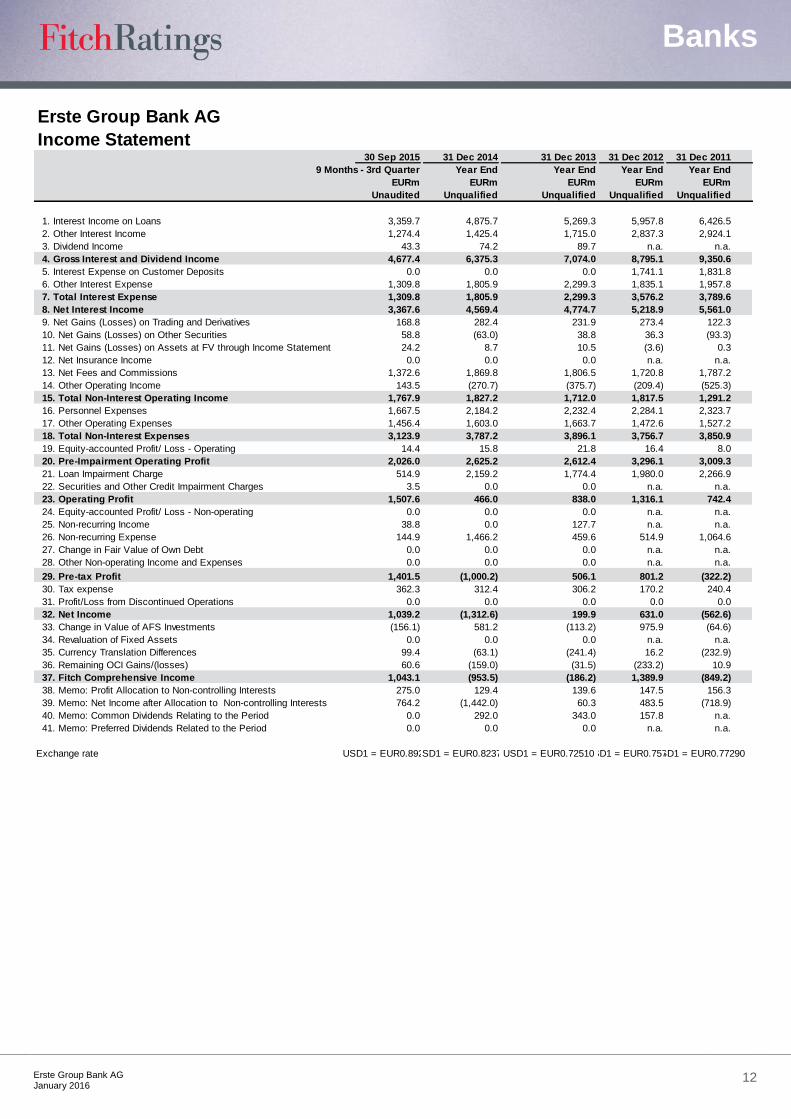
Erste Group Bank AG
Income Statement30 Sep 2015 31 Dec 2014 31 Dec 2013 31 Dec 2012 31 Dec 2011
9 Months - 3rd Quarter Year End Year End Year End Year End
EURm EURm EURm EURm EURm
Unaudited Unqualified Unqualified Unqualified Unqualified
1. Interest Income on Loans 3,359.7 4,875.7 5,269.3 5,957.8 6,426.5
2. Other Interest Income 1,274.4 1,425.4 1,715.0 2,837.3 2,924.1
3. Dividend Income 43.3 74.2 89.7 n.a. n.a.
4. Gross Interest and Dividend Income 4,677.4 6,375.3 7,074.0 8,795.1 9,350.6
5. Interest Expense on Customer Deposits 0.0 0.0 0.0 1,741.1 1,831.8
6. Other Interest Expense 1,309.8 1,805.9 2,299.3 1,835.1 1,957.8
7. Total Interest Expense 1,309.8 1,805.9 2,299.3 3,576.2 3,789.6
8. Net Interest Income 3,367.6 4,569.4 4,774.7 5,218.9 5,561.0
9. Net Gains (Losses) on Trading and Derivatives 168.8 282.4 231.9 273.4 122.3
10. Net Gains (Losses) on Other Securities 58.8 (63.0) 38.8 36.3 (93.3)
11. Net Gains (Losses) on Assets at FV through Income Statement 24.2 8.7 10.5 (3.6) 0.3
12. Net Insurance Income 0.0 0.0 0.0 n.a. n.a.
13. Net Fees and Commissions 1,372.6 1,869.8 1,806.5 1,720.8 1,787.2
14. Other Operating Income 143.5 (270.7) (375.7) (209.4) (525.3)
15. Total Non-Interest Operating Income 1,767.9 1,827.2 1,712.0 1,817.5 1,291.2
16. Personnel Expenses 1,667.5 2,184.2 2,232.4 2,284.1 2,323.7
17. Other Operating Expenses 1,456.4 1,603.0 1,663.7 1,472.6 1,527.2
18. Total Non-Interest Expenses 3,123.9 3,787.2 3,896.1 3,756.7 3,850.9
19. Equity-accounted Profit/ Loss - Operating 14.4 15.8 21.8 16.4 8.0
20. Pre-Impairment Operating Profit 2,026.0 2,625.2 2,612.4 3,296.1 3,009.3
21. Loan Impairment Charge 514.9 2,159.2 1,774.4 1,980.0 2,266.9
22. Securities and Other Credit Impairment Charges 3.5 0.0 0.0 n.a. n.a.
23. Operating Profit 1,507.6 466.0 838.0 1,316.1 742.4
24. Equity-accounted Profit/ Loss - Non-operating 0.0 0.0 0.0 n.a. n.a.
25. Non-recurring Income 38.8 0.0 127.7 n.a. n.a.
26. Non-recurring Expense 144.9 1,466.2 459.6 514.9 1,064.6
27. Change in Fair Value of Own Debt 0.0 0.0 0.0 n.a. n.a.
28. Other Non-operating Income and Expenses 0.0 0.0 0.0 n.a. n.a.
29. Pre-tax Profit 1,401.5 (1,000.2) 506.1 801.2 (322.2)
30. Tax expense 362.3 312.4 306.2 170.2 240.4
31. Profit/Loss from Discontinued Operations 0.0 0.0 0.0 0.0 0.0
32. Net Income 1,039.2 (1,312.6) 199.9 631.0 (562.6)
33. Change in Value of AFS Investments (156.1) 581.2 (113.2) 975.9 (64.6)
34. Revaluation of Fixed Assets 0.0 0.0 0.0 n.a. n.a.
35. Currency Translation Differences 99.4 (63.1) (241.4) 16.2 (232.9)
36. Remaining OCI Gains/(losses) 60.6 (159.0) (31.5) (233.2) 10.9
37. Fitch Comprehensive Income 1,043.1 (953.5) (186.2) 1,389.9 (849.2)
38. Memo: Profit Allocation to Non-controlling Interests 275.0 129.4 139.6 147.5 156.3
39. Memo: Net Income after Allocation to Non-controlling Interests 764.2 (1,442.0) 60.3 483.5 (718.9)
40. Memo: Common Dividends Relating to the Period 0.0 292.0 343.0 157.8 n.a.
41. Memo: Preferred Dividends Related to the Period 0.0 0.0 0.0 n.a. n.a.
Exchange rate USD1 = EUR0.89260USD1 = EUR0.82370USD1 = EUR0.72510USD1 = EUR0.75790USD1 = EUR0.77290
Banks
Erste Group Bank AG
January 2016 13
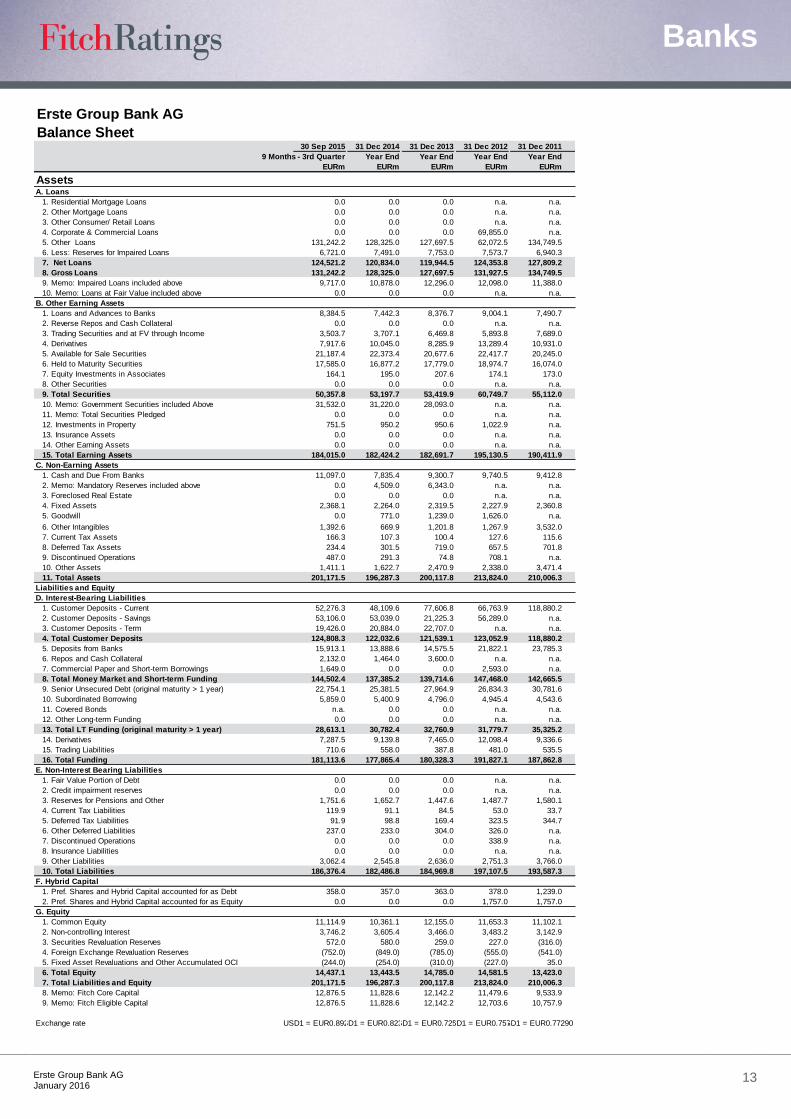
Erste Group Bank AG
Balance Sheet30 Sep 2015 31 Dec 2014 31 Dec 2013 31 Dec 2012 31 Dec 2011
9 Months - 3rd Quarter Year End Year End Year End Year End
EURm EURm EURm EURm EURm
AssetsA. Loans
1. Residential Mortgage Loans 0.0 0.0 0.0 n.a. n.a.
2. Other Mortgage Loans 0.0 0.0 0.0 n.a. n.a.
3. Other Consumer/ Retail Loans 0.0 0.0 0.0 n.a. n.a.
4. Corporate & Commercial Loans 0.0 0.0 0.0 69,855.0 n.a.
5. Other Loans 131,242.2 128,325.0 127,697.5 62,072.5 134,749.5
6. Less: Reserves for Impaired Loans 6,721.0 7,491.0 7,753.0 7,573.7 6,940.3
7. Net Loans 124,521.2 120,834.0 119,944.5 124,353.8 127,809.2
8. Gross Loans 131,242.2 128,325.0 127,697.5 131,927.5 134,749.5
9. Memo: Impaired Loans included above 9,717.0 10,878.0 12,296.0 12,098.0 11,388.0
10. Memo: Loans at Fair Value included above 0.0 0.0 0.0 n.a. n.a.
B. Other Earning Assets
1. Loans and Advances to Banks 8,384.5 7,442.3 8,376.7 9,004.1 7,490.7
2. Reverse Repos and Cash Collateral 0.0 0.0 0.0 n.a. n.a.
3. Trading Securities and at FV through Income 3,503.7 3,707.1 6,469.8 5,893.8 7,689.0
4. Derivatives 7,917.6 10,045.0 8,285.9 13,289.4 10,931.0
5. Available for Sale Securities 21,187.4 22,373.4 20,677.6 22,417.7 20,245.0
6. Held to Maturity Securities 17,585.0 16,877.2 17,779.0 18,974.7 16,074.0
7. Equity Investments in Associates 164.1 195.0 207.6 174.1 173.0
8. Other Securities 0.0 0.0 0.0 n.a. n.a.
9. Total Securities 50,357.8 53,197.7 53,419.9 60,749.7 55,112.0
10. Memo: Government Securities included Above 31,532.0 31,220.0 28,093.0 n.a. n.a.
11. Memo: Total Securities Pledged 0.0 0.0 0.0 n.a. n.a.
12. Investments in Property 751.5 950.2 950.6 1,022.9 n.a.
13. Insurance Assets 0.0 0.0 0.0 n.a. n.a.
14. Other Earning Assets 0.0 0.0 0.0 n.a. n.a.
15. Total Earning Assets 184,015.0 182,424.2 182,691.7 195,130.5 190,411.9
C. Non-Earning Assets
1. Cash and Due From Banks 11,097.0 7,835.4 9,300.7 9,740.5 9,412.8
2. Memo: Mandatory Reserves included above 0.0 4,509.0 6,343.0 n.a. n.a.
3. Foreclosed Real Estate 0.0 0.0 0.0 n.a. n.a.
4. Fixed Assets 2,368.1 2,264.0 2,319.5 2,227.9 2,360.8
5. Goodwill 0.0 771.0 1,239.0 1,626.0 n.a.
6. Other Intangibles 1,392.6 669.9 1,201.8 1,267.9 3,532.0
7. Current Tax Assets 166.3 107.3 100.4 127.6 115.6
8. Deferred Tax Assets 234.4 301.5 719.0 657.5 701.8
9. Discontinued Operations 487.0 291.3 74.8 708.1 n.a.
10. Other Assets 1,411.1 1,622.7 2,470.9 2,338.0 3,471.4
11. Total Assets 201,171.5 196,287.3 200,117.8 213,824.0 210,006.3
Liabilities and Equity
D. Interest-Bearing Liabilities
1. Customer Deposits - Current 52,276.3 48,109.6 77,606.8 66,763.9 118,880.2
2. Customer Deposits - Savings 53,106.0 53,039.0 21,225.3 56,289.0 n.a.
3. Customer Deposits - Term 19,426.0 20,884.0 22,707.0 n.a. n.a.
4. Total Customer Deposits 124,808.3 122,032.6 121,539.1 123,052.9 118,880.2
5. Deposits from Banks 15,913.1 13,888.6 14,575.5 21,822.1 23,785.3
6. Repos and Cash Collateral 2,132.0 1,464.0 3,600.0 n.a. n.a.
7. Commercial Paper and Short-term Borrowings 1,649.0 0.0 0.0 2,593.0 n.a.
8. Total Money Market and Short-term Funding 144,502.4 137,385.2 139,714.6 147,468.0 142,665.5
9. Senior Unsecured Debt (original maturity > 1 year) 22,754.1 25,381.5 27,964.9 26,834.3 30,781.6
10. Subordinated Borrowing 5,859.0 5,400.9 4,796.0 4,945.4 4,543.6
11. Covered Bonds n.a. 0.0 0.0 n.a. n.a.
12. Other Long-term Funding 0.0 0.0 0.0 n.a. n.a.
13. Total LT Funding (original maturity > 1 year) 28,613.1 30,782.4 32,760.9 31,779.7 35,325.2
14. Derivatives 7,287.5 9,139.8 7,465.0 12,098.4 9,336.6
15. Trading Liabilities 710.6 558.0 387.8 481.0 535.5
16. Total Funding 181,113.6 177,865.4 180,328.3 191,827.1 187,862.8
E. Non-Interest Bearing Liabilities
1. Fair Value Portion of Debt 0.0 0.0 0.0 n.a. n.a.
2. Credit impairment reserves 0.0 0.0 0.0 n.a. n.a.
3. Reserves for Pensions and Other 1,751.6 1,652.7 1,447.6 1,487.7 1,580.1
4. Current Tax Liabilities 119.9 91.1 84.5 53.0 33.7
5. Deferred Tax Liabilities 91.9 98.8 169.4 323.5 344.7
6. Other Deferred Liabilities 237.0 233.0 304.0 326.0 n.a.
7. Discontinued Operations 0.0 0.0 0.0 338.9 n.a.
8. Insurance Liabilities 0.0 0.0 0.0 n.a. n.a.
9. Other Liabilities 3,062.4 2,545.8 2,636.0 2,751.3 3,766.0
10. Total Liabilities 186,376.4 182,486.8 184,969.8 197,107.5 193,587.3
F. Hybrid Capital
1. Pref. Shares and Hybrid Capital accounted for as Debt 358.0 357.0 363.0 378.0 1,239.0
2. Pref. Shares and Hybrid Capital accounted for as Equity 0.0 0.0 0.0 1,757.0 1,757.0
G. Equity
1. Common Equity 11,114.9 10,361.1 12,155.0 11,653.3 11,102.1
2. Non-controlling Interest 3,746.2 3,605.4 3,466.0 3,483.2 3,142.9
3. Securities Revaluation Reserves 572.0 580.0 259.0 227.0 (316.0)
4. Foreign Exchange Revaluation Reserves (752.0) (849.0) (785.0) (555.0) (541.0)
5. Fixed Asset Revaluations and Other Accumulated OCI (244.0) (254.0) (310.0) (227.0) 35.0
6. Total Equity 14,437.1 13,443.5 14,785.0 14,581.5 13,423.0
7. Total Liabilities and Equity 201,171.5 196,287.3 200,117.8 213,824.0 210,006.3
8. Memo: Fitch Core Capital 12,876.5 11,828.6 12,142.2 11,479.6 9,533.9
9. Memo: Fitch Eligible Capital 12,876.5 11,828.6 12,142.2 12,703.6 10,757.9
Exchange rate USD1 = EUR0.89260USD1 = EUR0.82370USD1 = EUR0.72510USD1 = EUR0.75790USD1 = EUR0.77290
Banks
Erste Group Bank AG
January 2016 14
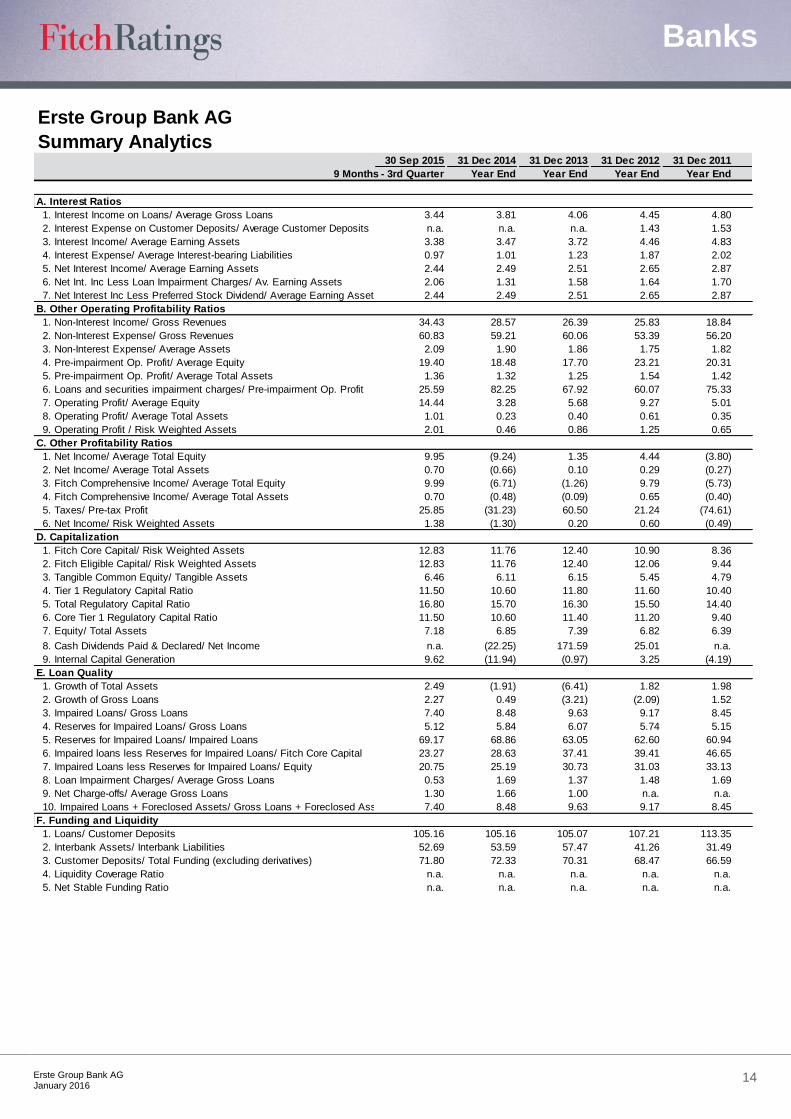
Erste Group Bank AG
Summary Analytics30 Sep 2015 31 Dec 2014 31 Dec 2013 31 Dec 2012 31 Dec 2011
9 Months - 3rd Quarter Year End Year End Year End Year End
A. Interest Ratios
1. Interest Income on Loans/ Average Gross Loans 3.44 3.81 4.06 4.45 4.80
2. Interest Expense on Customer Deposits/ Average Customer Deposits n.a. n.a. n.a. 1.43 1.53
3. Interest Income/ Average Earning Assets 3.38 3.47 3.72 4.46 4.83
4. Interest Expense/ Average Interest-bearing Liabilities 0.97 1.01 1.23 1.87 2.02
5. Net Interest Income/ Average Earning Assets 2.44 2.49 2.51 2.65 2.87
6. Net Int. Inc Less Loan Impairment Charges/ Av. Earning Assets 2.06 1.31 1.58 1.64 1.70
7. Net Interest Inc Less Preferred Stock Dividend/ Average Earning Assets 2.44 2.49 2.51 2.65 2.87
B. Other Operating Profitability Ratios
1. Non-Interest Income/ Gross Revenues 34.43 28.57 26.39 25.83 18.84
2. Non-Interest Expense/ Gross Revenues 60.83 59.21 60.06 53.39 56.20
3. Non-Interest Expense/ Average Assets 2.09 1.90 1.86 1.75 1.82
4. Pre-impairment Op. Profit/ Average Equity 19.40 18.48 17.70 23.21 20.31
5. Pre-impairment Op. Profit/ Average Total Assets 1.36 1.32 1.25 1.54 1.42
6. Loans and securities impairment charges/ Pre-impairment Op. Profit 25.59 82.25 67.92 60.07 75.33
7. Operating Profit/ Average Equity 14.44 3.28 5.68 9.27 5.01
8. Operating Profit/ Average Total Assets 1.01 0.23 0.40 0.61 0.35
9. Operating Profit / Risk Weighted Assets 2.01 0.46 0.86 1.25 0.65
C. Other Profitability Ratios
1. Net Income/ Average Total Equity 9.95 (9.24) 1.35 4.44 (3.80)
2. Net Income/ Average Total Assets 0.70 (0.66) 0.10 0.29 (0.27)
3. Fitch Comprehensive Income/ Average Total Equity 9.99 (6.71) (1.26) 9.79 (5.73)
4. Fitch Comprehensive Income/ Average Total Assets 0.70 (0.48) (0.09) 0.65 (0.40)
5. Taxes/ Pre-tax Profit 25.85 (31.23) 60.50 21.24 (74.61)
6. Net Income/ Risk Weighted Assets 1.38 (1.30) 0.20 0.60 (0.49)
D. Capitalization
1. Fitch Core Capital/ Risk Weighted Assets 12.83 11.76 12.40 10.90 8.36
2. Fitch Eligible Capital/ Risk Weighted Assets 12.83 11.76 12.40 12.06 9.44
3. Tangible Common Equity/ Tangible Assets 6.46 6.11 6.15 5.45 4.79
4. Tier 1 Regulatory Capital Ratio 11.50 10.60 11.80 11.60 10.40
5. Total Regulatory Capital Ratio 16.80 15.70 16.30 15.50 14.40
6. Core Tier 1 Regulatory Capital Ratio 11.50 10.60 11.40 11.20 9.40
7. Equity/ Total Assets 7.18 6.85 7.39 6.82 6.39
8. Cash Dividends Paid & Declared/ Net Income n.a. (22.25) 171.59 25.01 n.a.
9. Internal Capital Generation 9.62 (11.94) (0.97) 3.25 (4.19)
E. Loan Quality
1. Growth of Total Assets 2.49 (1.91) (6.41) 1.82 1.98
2. Growth of Gross Loans 2.27 0.49 (3.21) (2.09) 1.52
3. Impaired Loans/ Gross Loans 7.40 8.48 9.63 9.17 8.45
4. Reserves for Impaired Loans/ Gross Loans 5.12 5.84 6.07 5.74 5.15
5. Reserves for Impaired Loans/ Impaired Loans 69.17 68.86 63.05 62.60 60.94
6. Impaired loans less Reserves for Impaired Loans/ Fitch Core Capital 23.27 28.63 37.41 39.41 46.65
7. Impaired Loans less Reserves for Impaired Loans/ Equity 20.75 25.19 30.73 31.03 33.13
8. Loan Impairment Charges/ Average Gross Loans 0.53 1.69 1.37 1.48 1.69
9. Net Charge-offs/ Average Gross Loans 1.30 1.66 1.00 n.a. n.a.
10. Impaired Loans + Foreclosed Assets/ Gross Loans + Foreclosed Assets 7.40 8.48 9.63 9.17 8.45
F. Funding and Liquidity
1. Loans/ Customer Deposits 105.16 105.16 105.07 107.21 113.35
2. Interbank Assets/ Interbank Liabilities 52.69 53.59 57.47 41.26 31.49
3. Customer Deposits/ Total Funding (excluding derivatives) 71.80 72.33 70.31 68.47 66.59
4. Liquidity Coverage Ratio n.a. n.a. n.a. n.a. n.a.
5. Net Stable Funding Ratio n.a. n.a. n.a. n.a. n.a.
Banks
Erste Group Bank AG
January 2016 15
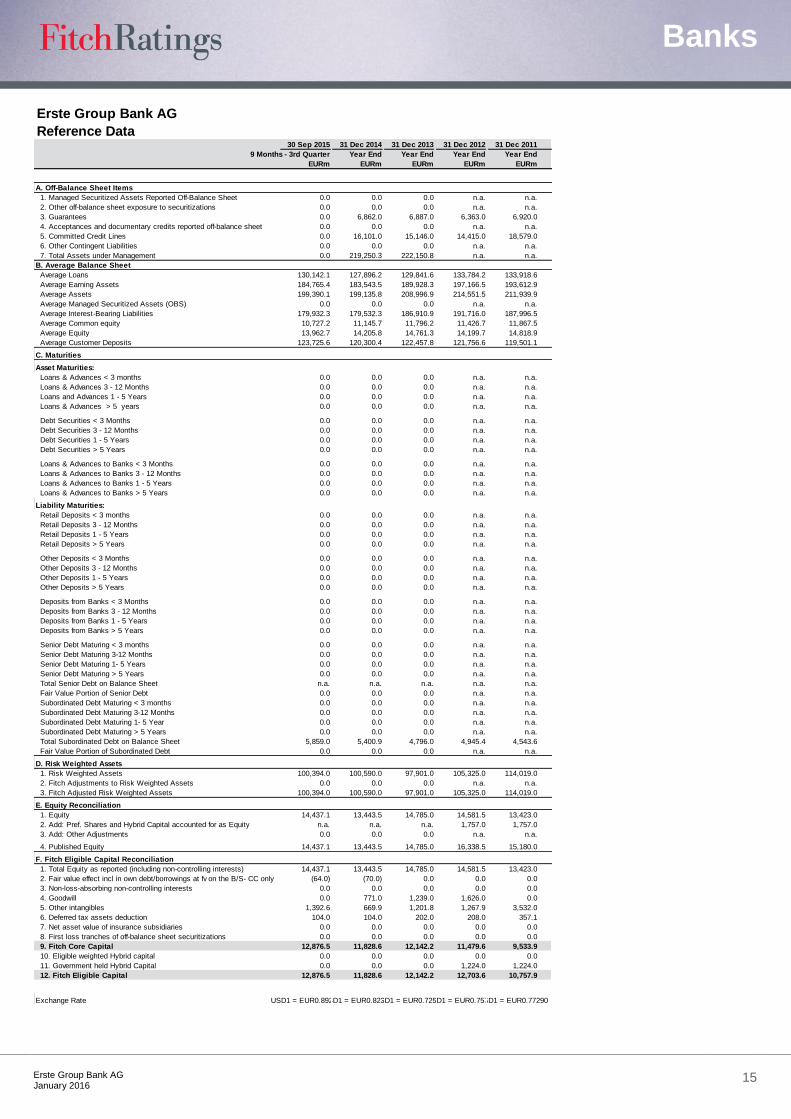
Erste Group Bank AG
Reference Data30 Sep 2015 31 Dec 2014 31 Dec 2013 31 Dec 2012 31 Dec 2011
9 Months - 3rd Quarter Year End Year End Year End Year End
EURm EURm EURm EURm EURm
A. Off-Balance Sheet Items
1. Managed Securitized Assets Reported Off-Balance Sheet 0.0 0.0 0.0 n.a. n.a.
2. Other off-balance sheet exposure to securitizations 0.0 0.0 0.0 n.a. n.a.
3. Guarantees 0.0 6,862.0 6,887.0 6,363.0 6,920.0
4. Acceptances and documentary credits reported off-balance sheet 0.0 0.0 0.0 n.a. n.a.
5. Committed Credit Lines 0.0 16,101.0 15,146.0 14,415.0 18,579.0
6. Other Contingent Liabilities 0.0 0.0 0.0 n.a. n.a.
7. Total Assets under Management 0.0 219,250.3 222,150.8 n.a. n.a.
B. Average Balance Sheet
Average Loans 130,142.1 127,896.2 129,841.6 133,784.2 133,918.6
Average Earning Assets 184,765.4 183,543.5 189,928.3 197,166.5 193,612.9
Average Assets 199,390.1 199,135.8 208,996.9 214,551.5 211,939.9
Average Managed Securitized Assets (OBS) 0.0 0.0 0.0 n.a. n.a.
Average Interest-Bearing Liabilities 179,932.3 179,532.3 186,910.9 191,716.0 187,996.5
Average Common equity 10,727.2 11,145.7 11,796.2 11,426.7 11,867.5
Average Equity 13,962.7 14,205.8 14,761.3 14,199.7 14,818.9
Average Customer Deposits 123,725.6 120,300.4 122,457.8 121,756.6 119,501.1
C. Maturities
Asset Maturities:
Loans & Advances < 3 months 0.0 0.0 0.0 n.a. n.a.
Loans & Advances 3 - 12 Months 0.0 0.0 0.0 n.a. n.a.
Loans and Advances 1 - 5 Years 0.0 0.0 0.0 n.a. n.a.
Loans & Advances > 5 years 0.0 0.0 0.0 n.a. n.a.
Debt Securities < 3 Months 0.0 0.0 0.0 n.a. n.a.
Debt Securities 3 - 12 Months 0.0 0.0 0.0 n.a. n.a.
Debt Securities 1 - 5 Years 0.0 0.0 0.0 n.a. n.a.
Debt Securities > 5 Years 0.0 0.0 0.0 n.a. n.a.
Loans & Advances to Banks < 3 Months 0.0 0.0 0.0 n.a. n.a.
Loans & Advances to Banks 3 - 12 Months 0.0 0.0 0.0 n.a. n.a.
Loans & Advances to Banks 1 - 5 Years 0.0 0.0 0.0 n.a. n.a.
Loans & Advances to Banks > 5 Years 0.0 0.0 0.0 n.a. n.a.
Liability Maturities:
Retail Deposits < 3 months 0.0 0.0 0.0 n.a. n.a.
Retail Deposits 3 - 12 Months 0.0 0.0 0.0 n.a. n.a.
Retail Deposits 1 - 5 Years 0.0 0.0 0.0 n.a. n.a.
Retail Deposits > 5 Years 0.0 0.0 0.0 n.a. n.a.
Other Deposits < 3 Months 0.0 0.0 0.0 n.a. n.a.
Other Deposits 3 - 12 Months 0.0 0.0 0.0 n.a. n.a.
Other Deposits 1 - 5 Years 0.0 0.0 0.0 n.a. n.a.
Other Deposits > 5 Years 0.0 0.0 0.0 n.a. n.a.
Deposits from Banks < 3 Months 0.0 0.0 0.0 n.a. n.a.
Deposits from Banks 3 - 12 Months 0.0 0.0 0.0 n.a. n.a.
Deposits from Banks 1 - 5 Years 0.0 0.0 0.0 n.a. n.a.
Deposits from Banks > 5 Years 0.0 0.0 0.0 n.a. n.a.
Senior Debt Maturing < 3 months 0.0 0.0 0.0 n.a. n.a.
Senior Debt Maturing 3-12 Months 0.0 0.0 0.0 n.a. n.a.
Senior Debt Maturing 1- 5 Years 0.0 0.0 0.0 n.a. n.a.
Senior Debt Maturing > 5 Years 0.0 0.0 0.0 n.a. n.a.
Total Senior Debt on Balance Sheet n.a. n.a. n.a. n.a. n.a.
Fair Value Portion of Senior Debt 0.0 0.0 0.0 n.a. n.a.
Subordinated Debt Maturing < 3 months 0.0 0.0 0.0 n.a. n.a.
Subordinated Debt Maturing 3-12 Months 0.0 0.0 0.0 n.a. n.a.
Subordinated Debt Maturing 1- 5 Year 0.0 0.0 0.0 n.a. n.a.
Subordinated Debt Maturing > 5 Years 0.0 0.0 0.0 n.a. n.a.
Total Subordinated Debt on Balance Sheet 5,859.0 5,400.9 4,796.0 4,945.4 4,543.6
Fair Value Portion of Subordinated Debt 0.0 0.0 0.0 n.a. n.a.
D. Risk Weighted Assets
1. Risk Weighted Assets 100,394.0 100,590.0 97,901.0 105,325.0 114,019.0
2. Fitch Adjustments to Risk Weighted Assets 0.0 0.0 0.0 n.a. n.a.
3. Fitch Adjusted Risk Weighted Assets 100,394.0 100,590.0 97,901.0 105,325.0 114,019.0
E. Equity Reconciliation
1. Equity 14,437.1 13,443.5 14,785.0 14,581.5 13,423.0
2. Add: Pref. Shares and Hybrid Capital accounted for as Equity n.a. n.a. n.a. 1,757.0 1,757.0
3. Add: Other Adjustments 0.0 0.0 0.0 n.a. n.a.
4. Published Equity 14,437.1 13,443.5 14,785.0 16,338.5 15,180.0
F. Fitch Eligible Capital Reconciliation
1. Total Equity as reported (including non-controlling interests) 14,437.1 13,443.5 14,785.0 14,581.5 13,423.0
2. Fair value effect incl in own debt/borrowings at fv on the B/S- CC only (64.0) (70.0) 0.0 0.0 0.0
3. Non-loss-absorbing non-controlling interests 0.0 0.0 0.0 0.0 0.0
4. Goodwill 0.0 771.0 1,239.0 1,626.0 0.0
5. Other intangibles 1,392.6 669.9 1,201.8 1,267.9 3,532.0
6. Deferred tax assets deduction 104.0 104.0 202.0 208.0 357.1
7. Net asset value of insurance subsidiaries 0.0 0.0 0.0 0.0 0.0
8. First loss tranches of off-balance sheet securitizations 0.0 0.0 0.0 0.0 0.0
9. Fitch Core Capital 12,876.5 11,828.6 12,142.2 11,479.6 9,533.9
10. Eligible weighted Hybrid capital 0.0 0.0 0.0 0.0 0.0
11. Government held Hybrid Capital 0.0 0.0 0.0 1,224.0 1,224.0
12. Fitch Eligible Capital 12,876.5 11,828.6 12,142.2 12,703.6 10,757.9
Exchange Rate USD1 = EUR0.89260USD1 = EUR0.82370USD1 = EUR0.72510USD1 = EUR0.75790USD1 = EUR0.77290
Banks
Erste Group Bank AG
January 2016 16
ALL FITCH CREDIT RATINGS ARE SUBJECT TO CERTAIN LIMITATIONS AND DISCLAIMERS. PLEASE READ THESE LIMITATIONS AND DISCLAIMERS BY FOLLOWING THIS LINK: HTTPS://FITCHRATINGS.COM/UNDERSTANDINGCREDITRATINGS. IN ADDITION, RATING DEFINITIONS AND THE TERMS OF USE OF SUCH RATINGS ARE AVAILABLE ON THE AGENCY'S PUBLIC WEB SITE AT WWW.FITCHRATINGS.COM. PUBLISHED RATINGS, CRITERIA, AND METHODOLOGIES ARE AVAILABLE FROM THIS SITE AT ALL TIMES. FITCH'S CODE OF CONDUCT, CONFIDENTIALITY, CONFLICTS OF INTEREST, AFFILIATE FIREWALL, COMPLIANCE, AND OTHER RELEVANT POLICIES AND PROCEDURES ARE ALSO AVAILABLE FROM THE CODE OF CONDUCT SECTION OF THIS SITE. FITCH MAY HAVE PROVIDED ANOTHER PERMISSIBLE SERVICE TO THE RATED ENTITY OR ITS RELATED THIRD PARTIES. DETAILS OF THIS SERVICE FOR RATINGS FOR WHICH THE LEAD ANALYST IS BASED IN AN EU-REGISTERED ENTITY CAN BE FOUND ON THE ENTITY SUMMARY PAGE FOR THIS ISSUER ON THE FITCH WEBSITE.
Copyright © 2016 by Fitch Ratings, Inc., Fitch Ratings Ltd. and its subsidiaries. 33 Whitehall Street, NY, NY 10004. Telephone: 1-800-753-4824, (212) 908-0500. Fax: (212) 480-4435. Reproduction or retransmission in whole or in part is prohibited except by permission. All rights reserved. In issuing and maintaining its ratings and in making other reports (including forecast information), Fitch relies on factual information it receives from issuers and underwriters and from other sources Fitch believes to be credible. Fitch conducts a reasonable investigation of the factual information relied upon by it in accordance with its ratings methodology, and obtains reasonable verification of that information from independent sources, to the extent such sources are available for a given security or in a given jurisdiction. The manner of Fitch’s factual investigation and the scope of the third-party verification it obtains will vary depending on the nature of the rated security and its issuer, the requirements and practices in the jurisdiction in which the rated security is offered and sold and/or the issuer is located, the availability and nature of relevant public information, access to the management of the issuer and its advisers, the availability of pre-existing third-party verifications such as audit reports, agreed-upon procedures letters, appraisals, actuarial reports, engineering reports, legal opinions and other reports provided by third parties, the availability of independent and competent third-party verification sources with respect to the particular security or in the particular jurisdiction of the issuer, and a variety of other factors. Users of Fitch’s ratings and reports should understand that neither an enhanced factual investigation nor any third-party verification can ensure that all of the information Fitch relies on in connection with a rating or a report will be accurate and complete. Ultimately, the issuer and its advisers are responsible for the accuracy of the information they provide to Fitch and to the market in offering documents and other reports. In issuing its ratings and its reports, Fitch must rely on the work of experts, including independent auditors with respect to financial statements and attorneys with respect to legal and tax matters. Further, ratings and forecasts of financial and other information are inherently forward-looking and embody assumptions and predictions about future events that by their nature cannot be verified as facts. As a result, despite any verification of current facts, ratings and forecasts can be affected by future events or conditions that were not anticipated at the time a rating or forecast was issued or affirmed.
The information in this report is provided “as is” without any representation or warranty of any kind, and Fitch does not represent or warrant that the report or any of its contents will meet any of the requirements of a recipient of the report. A Fitch rating is an opinion as to the creditworthiness of a security. This opinion and reports made by Fitch are based on established criteria and methodologies that Fitch is continuously evaluating and updating. Therefore, ratings and reports are the collective work product of Fitch and no individual, or group of individuals, is solely responsible for a rating or a report. The rating does not address the risk of loss due to risks other than credit risk, unless such risk is specifically mentioned. Fitch is not engaged in the offer or sale of any security. All Fitch reports have shared authorship. Individuals identified in a Fitch report were involved in, but are not solely responsible for, the opinions stated therein. The individuals are named for contact purposes only. A report providing a Fitch rating is neither a prospectus nor a substitute for the information assembled, verified and presented to investors by the issuer and its agents in connection with the sale of the securities. Ratings may be changed or withdrawn at any time for any reason in the sole discretion of Fitch. Fitch does not provide investment advice of any sort. Ratings are not a recommendation to buy, sell, or hold any security. Ratings do not comment on the adequacy of market price, the suitability of any security for a particular investor, or the tax-exempt nature or taxability of payments made in respect to any security. Fitch receives fees from issuers, insurers, guarantors, other obligors, and underwriters for rating securities. Such fees generally vary from US$1,000 to US$750,000 (or the applicable currency equivalent) per issue. In certain cases, Fitch will rate all or a number of issues issued by a particular issuer, or insured or guaranteed by a particular insurer or guarantor, for a single annual fee. Such fees are expected to vary from US$10,000 to US$1,500,000 (or the applicable currency equivalent). The assignment, publication, or dissemination of a rating by Fitch shall not constitute a consent by Fitch to use its name as an expert in connection with any registration statement filed under the United States securities laws, the Financial Services and Markets Act of 2000 of the United Kingdom, or the securities laws of any particular jurisdiction. Due to the relative efficiency of electronic publishing and distribution, Fitch research may be available to electronic subscribers up to three days earlier than to print subscribers.
For Australia, New Zealand, Taiwan and South Korea only: Fitch Australia Pty Ltd holds an Australian financial services license (AFS license no. 337123) which authorizes it to provide credit ratings to wholesale clients only. Credit ratings information published by Fitch is not intended to be used by persons who are retail clients within the meaning of the Corporations Act 2001.
The ratings above were solicited by, or on behalf of, the issuer, and therefore, Fitch has been compensated for the provision of the ratings.