Embed Size (px)
Citation preview
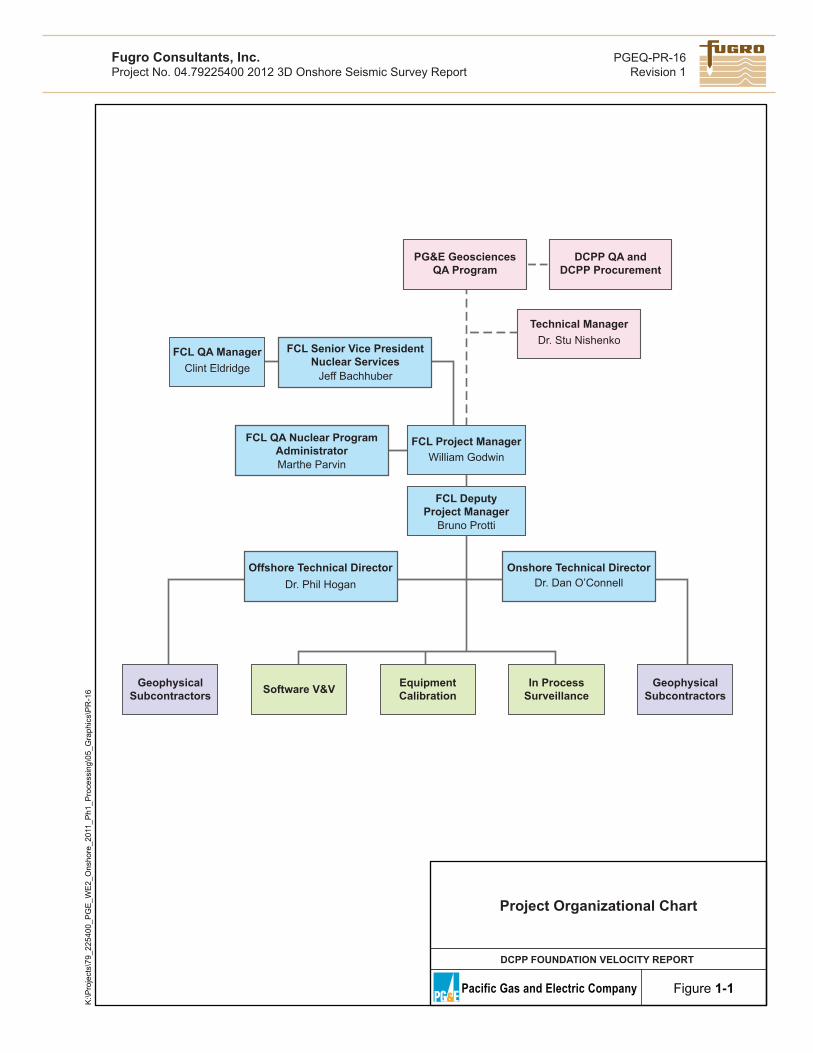
Project Organizational Chart
DCPP FOUNDATION VELOCITY REPORT
Pacific Gas and Electric Company Figure 1-1
K:\P
roje
cts\
79_2
2540
0_P
GE
_WE
2_O
nsho
re_2
011_
Ph1
_Pro
cess
ing\
05_G
raph
ics\
PR
-16
PGEQ-PR-16Revision 1
Fugro Consultants, Inc.Project No. 04.79225400 2012 3D Onshore Seismic Survey Report
PG&E GeosciencesQA Program
DCPP QA andDCPP Procurement
FCL QA Manager
FCL Project Manager
FCL Senior Vice PresidentNuclear Services
FCL QA Nuclear ProgramAdministrator
Offshore Technical Director Onshore Technical Director
GeophysicalSubcontractors Software V&V Equipment
CalibrationIn Process
SurveillanceGeophysical
Subcontractors
Clint EldridgeJeff Bachhuber
Technical ManagerDr. Stu Nishenko
FCL DeputyProject Manager
Bruno Protti
William GodwinMarthe Parvin
Dr. Phil Hogan Dr. Dan O’Connell
!A
!A
!A
!A
SLO2
Lower Quail Flat
Parking Lot 10
Water Tank
Parking Lot 8
DDH-B
DDH-D
DDH-C
DDH-A-2
A-A'
D-D'C-C'
B-B'
120°51'W
120°51'W
120°52'W
120°52'W
35°1
4'N
35°1
4'N
35°1
3'N
35°1
3'N
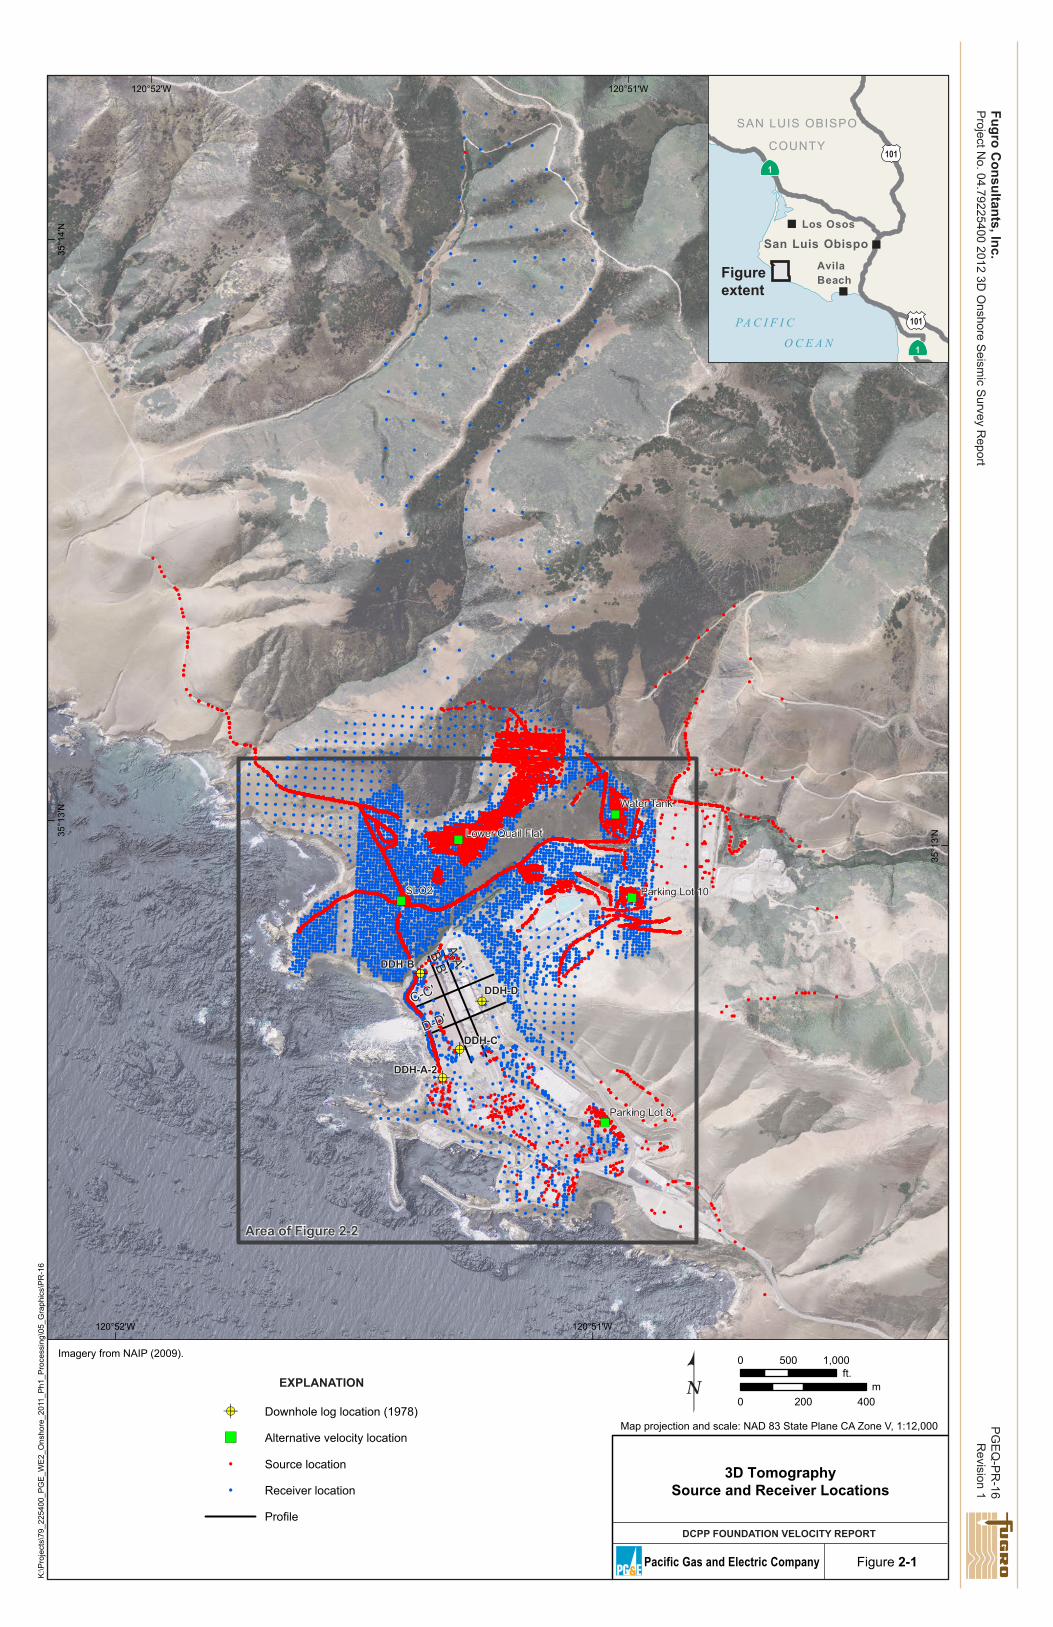
Map projection and scale: NAD 83 State Plane CA Zone V, 1:12,000
0 500 1,000ft.
0 200 400m
Imagery from NAIP (2009).
3D TomographySource and Receiver Locations
DCPP FOUNDATION VELOCITY REPORT
Pacific Gas and Electric Company Figure 2-1
K:\P
roje
cts\
79_2
2540
0_P
GE
_WE
2_O
nsho
re_2
011_
Ph1
_Pro
cess
ing\
05_G
raph
ics\
PR
-16
PG
EQ
-PR
-16R
evision 1Fugro C
onsultants, Inc.P
roject No. 04.79225400 2012 3D
Onshore S
eismic S
urvey Report
SAN LUIS OBISPO
COUNTY
Los Osos
AvilaBeach
San Luis Obispo
Area of Figure 2-2
!A Downhole log location (1978)
") Alternative velocity location
! Source location
! Receiver location
Profile
PA C I F I C
O C E A N
1
1
Figureextent
101
101
EXPLANATION
!A
!A
!A
!A
SLO2
Lower Quail Flat
Parking Lot 10
Water Tank
Parking Lot 8
DDH-B
DDH-D
DDH-C
DDH-A-2
A-A'
B-B'
D-D'
C-C'
120°51'W
120°51'W
120°51'30"W
120°51'30"W
35°1
3'N
35°1
3'N
35°1
2'30
"N
35°1
2'30
"N
!A!A
!A!ADHH-4
DHH-3
DHH-2DHH-1
0 500 1,000
0 100 200m
ft.
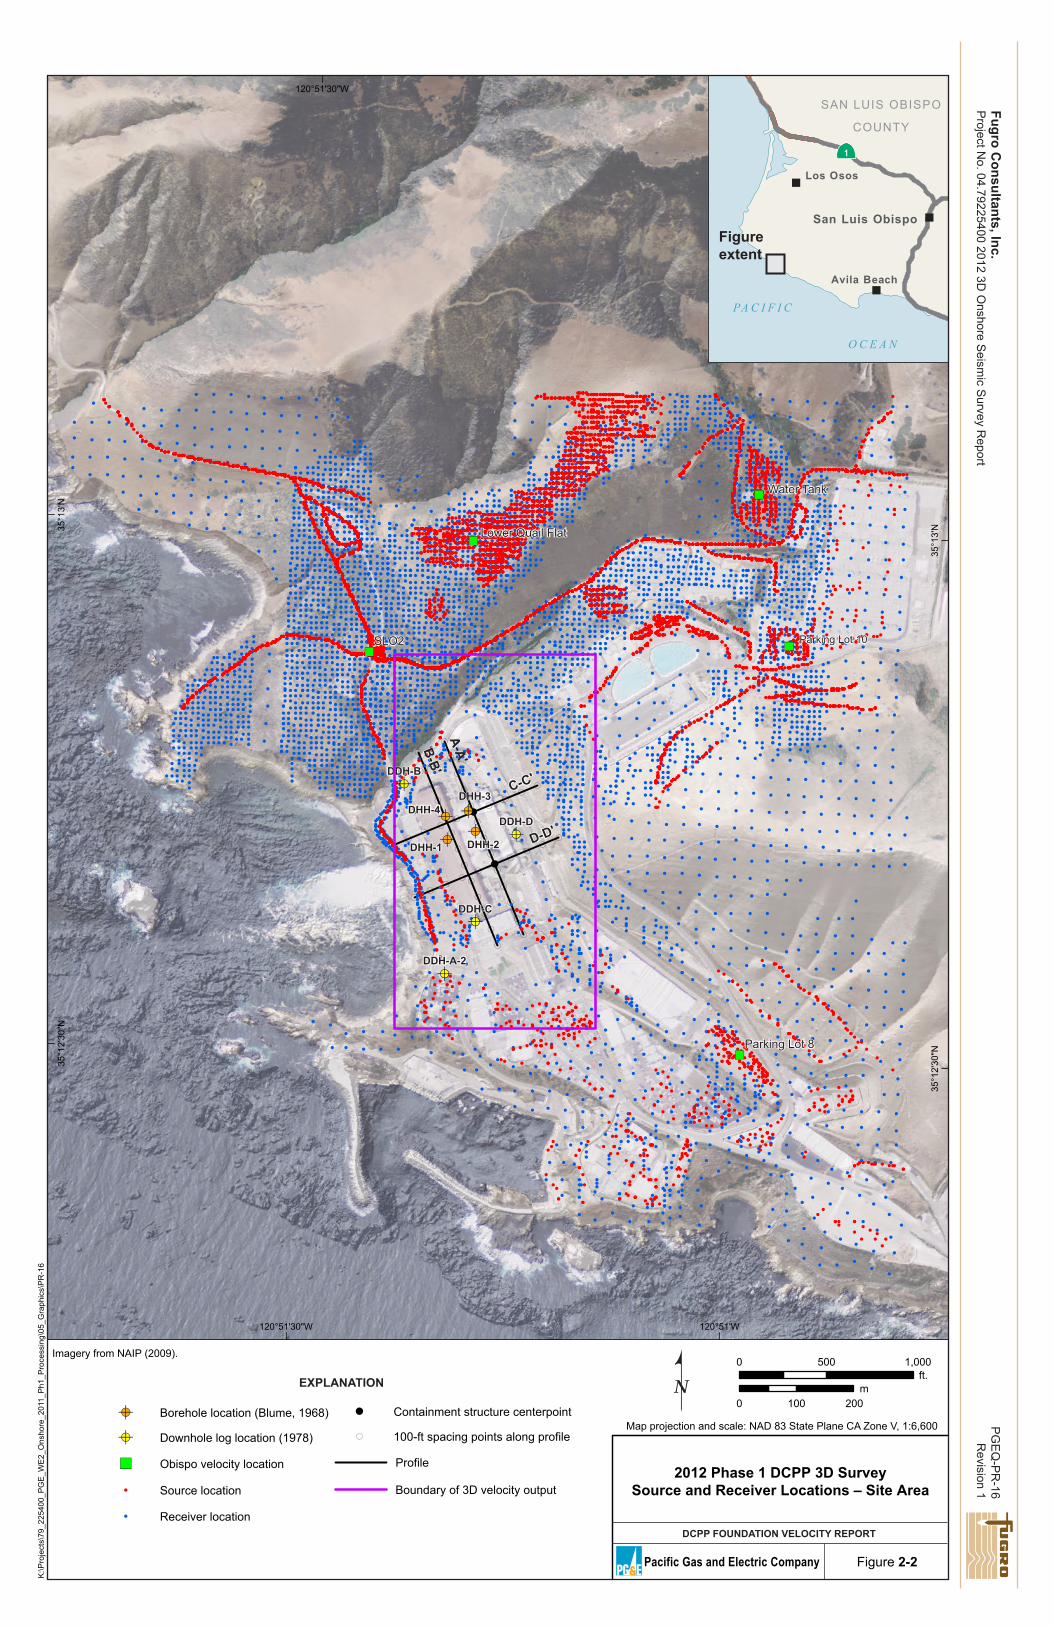
Imagery from NAIP (2009).
Map projection and scale: NAD 83 State Plane CA Zone V, 1:6,600
Los Osos
Avila Beach
San Luis Obispo
SAN LUIS OBISPO
COUNTY
! Containment structure centerpoint
( 100-ft spacing points along profile!A Downhole log location (1978)
") Obispo velocity location
! Source location
! Receiver location
Borehole location (Blume, 1968)!A
Profile
Boundary of 3D velocity output
PA C I F I C
O C E A N
1
Figureextent
2012 Phase 1 DCPP 3D SurveySource and Receiver Locations – Site Area
DCPP FOUNDATION VELOCITY REPORT
Pacific Gas and Electric Company
K:\P
roje
cts\
79_2
2540
0_P
GE
_WE
2_O
nsho
re_2
011_
Ph1
_Pro
cess
ing\
05_G
raph
ics\
PR
-16
Figure 2-2
PG
EQ
-PR
-16R
evision 1Fugro C
onsultants, Inc.P
roject No. 04.79225400 2012 3D
Onshore S
eismic S
urvey Report
EXPLANATION
_̂
!
!
!
!DDH-B
DDH-D
DDH-C
DDH-A-2
120°51'W
120°51'W
120°51'30"W
120°51'30"W35
°13'
N
35°1
3'N
35°1
2'30
"N
35°1
2'30
"N
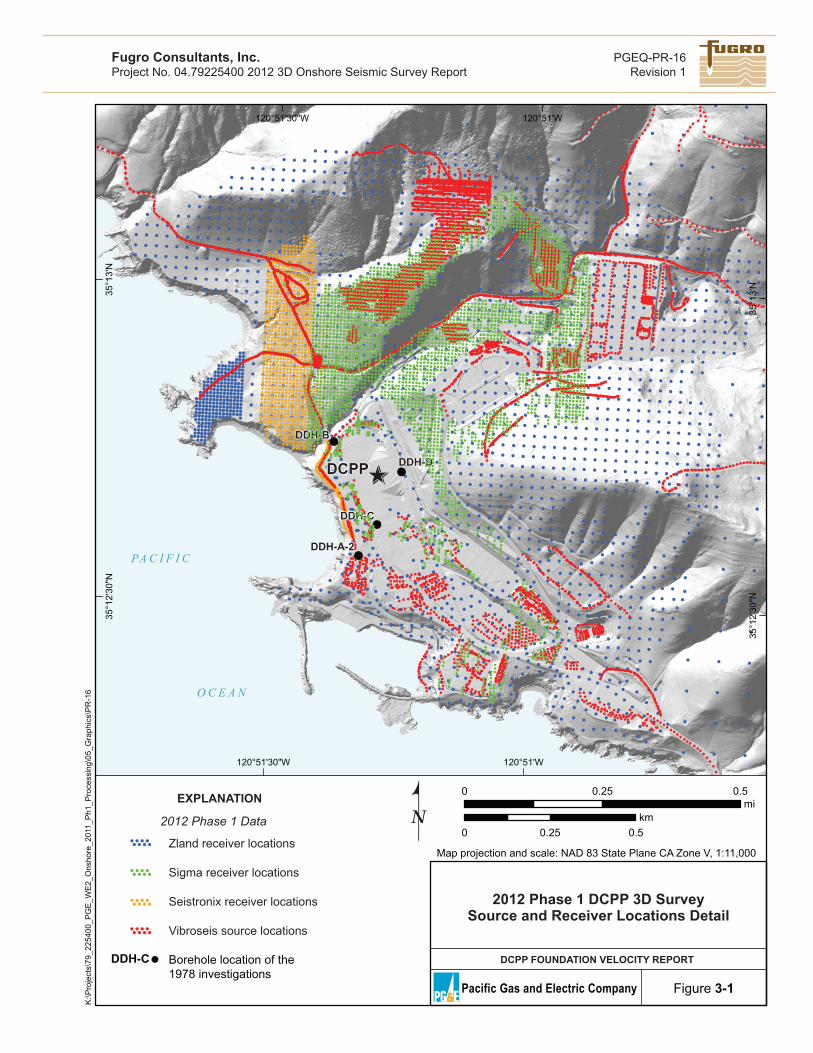
2012 Phase 1 DCPP 3D SurveySource and Receiver Locations Detail
DCPP FOUNDATION VELOCITY REPORT
Pacific Gas and Electric Company Figure 3-1
K:\P
roje
cts\
79_2
2540
0_P
GE
_WE
2_O
nsho
re_2
011_
Ph1
_Pro
cess
ing\
05_G
raph
ics\
PR
-16
Zland receiver locations
Sigma receiver locations
Seistronix receiver locations
Vibroseis source locations
Borehole location of the 1978 investigations
DDH-C
2012 Phase 1 Data
EXPLANATION
DCPP
0 0.25 0.5mi
0 0.25 0.5km
Map projection and scale: NAD 83 State Plane CA Zone V, 1:11,000
PA C I F I C
O C E A N
PGEQ-PR-16Revision 1
Fugro Consultants, Inc.Project No. 04.79225400 2012 3D Onshore Seismic Survey Report
Res
idua
l fra
ctal
rang
e
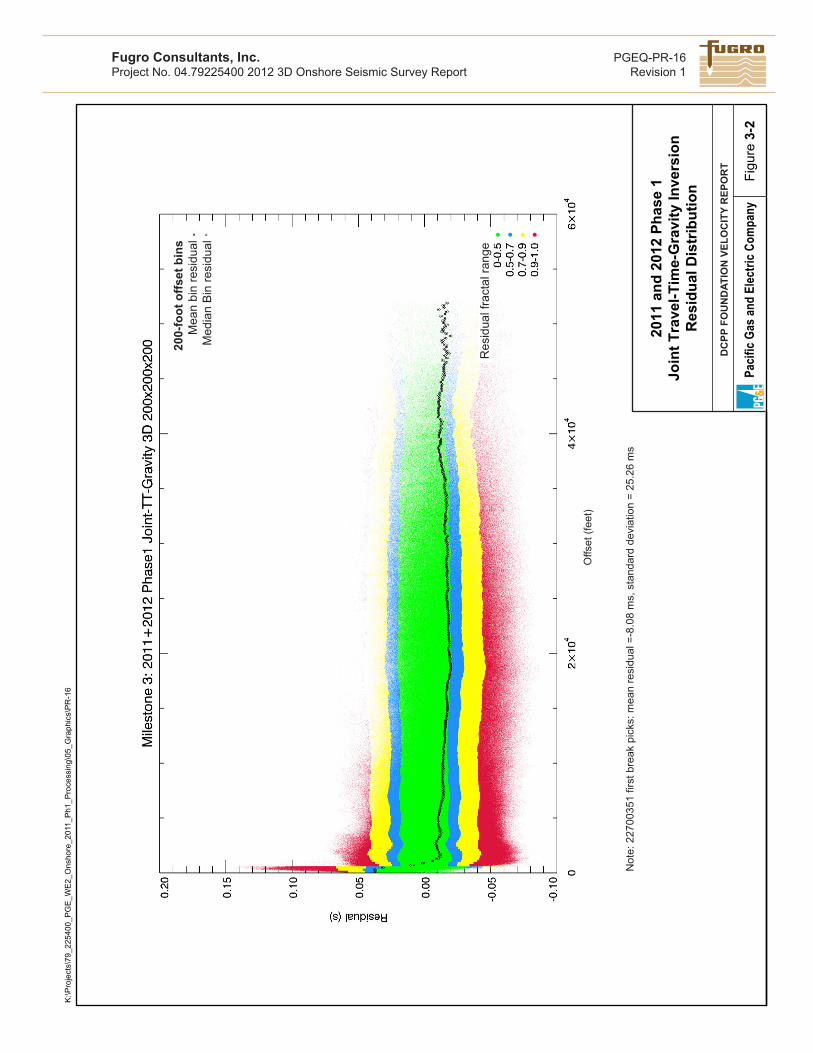
200-
foot
offs
et b
ins
Mea
n bi
n re
sidu
alM
edia
n B
in re
sidu
al
Offs
et (f
eet)
Not
e: 2
2700
351
first
bre
ak p
icks
: mea
n re
sidu
al =
-8.0
8 m
s, s
tand
ard
devi
atio
n =
25.2
6 m
s
Figu
re 3
-2
2011
and
201
2 Ph
ase
1Jo
int T
rave
l-Tim
e-G
ravi
ty In
vers
ion
Res
idua
l Dis
trib
utio
n
Pacif
ic Ga
s and
Elec
tric C
ompa
ny
DC
PP F
OU
ND
ATIO
N V
ELO
CIT
Y R
EPO
RT
K:\P
roje
cts\
79_2
2540
0_P
GE
_WE
2_O
nsho
re_2
011_
Ph1
_Pro
cess
ing\
05_G
raph
ics\
PR
-16
PGEQ-PR-16Revision 1
Fugro Consultants, Inc.Project No. 04.79225400 2012 3D Onshore Seismic Survey Report
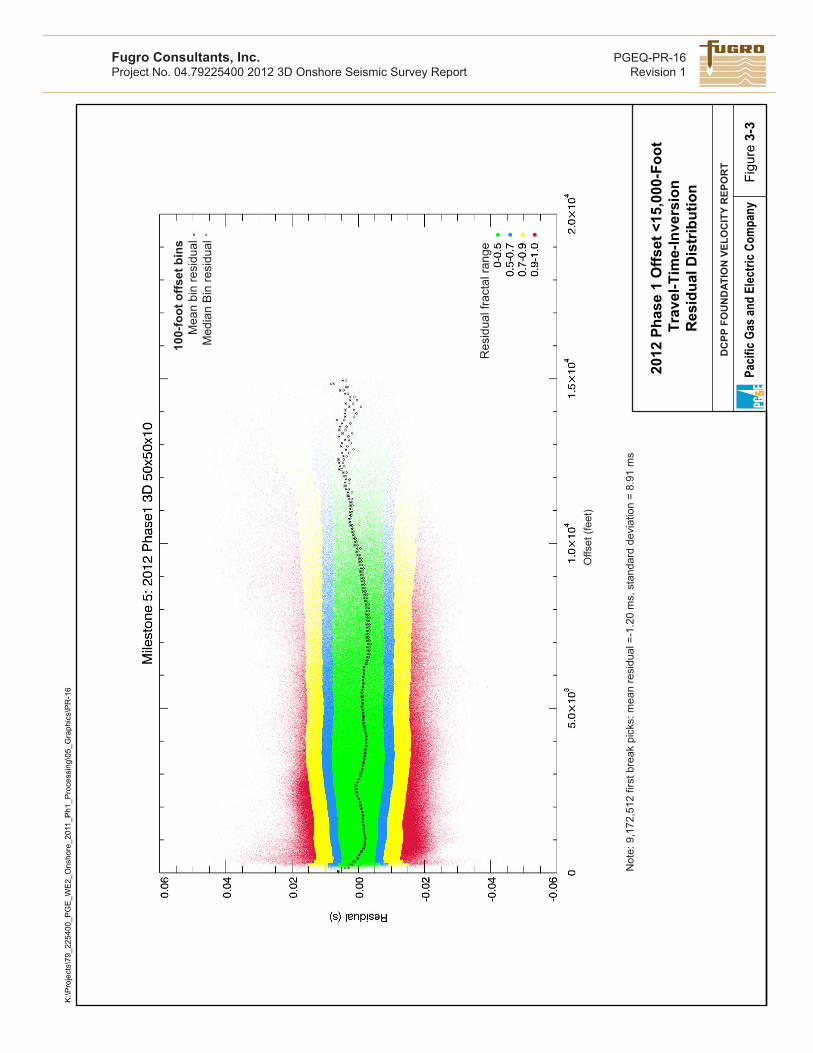
Res
idua
l fra
ctal
rang
e
100-
foot
offs
et b
ins
Mea
n bi
n re
sidu
alM
edia
n B
in re
sidu
al
Offs
et (f
eet)
Not
e: 9
,172
,512
firs
t bre
ak p
icks
: mea
n re
sidu
al =
-1.2
0 m
s, s
tand
ard
devi
atio
n =
8.91
ms
Figu
re 3
-3
2012
Pha
se 1
Offs
et <
15,0
00-F
oot
Tra
vel-T
ime-
Inve
rsio
nR
esid
ual D
istr
ibut
ion
Pacif
ic Ga
s and
Elec
tric C
ompa
ny
K:\P
roje
cts\
79_2
2540
0_P
GE
_WE
2_O
nsho
re_2
011_
Ph1
_Pro
cess
ing\
05_G
raph
ics\
PR
-16
DC
PP F
OU
ND
ATIO
N V
ELO
CIT
Y R
EPO
RT
PGEQ-PR-16Revision 1
Fugro Consultants, Inc.Project No. 04.79225400 2012 3D Onshore Seismic Survey Report
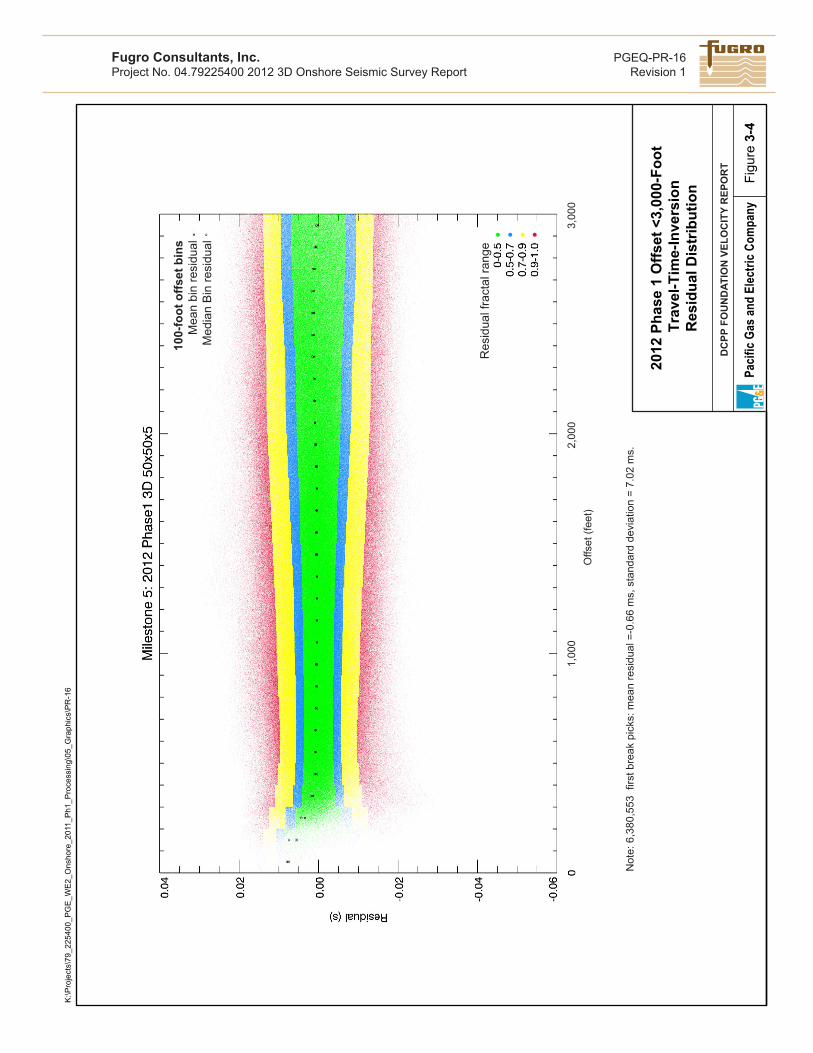
Res
idua
l fra
ctal
rang
e
100-
foot
offs
et b
ins
Mea
n bi
n re
sidu
alM
edia
n B
in re
sidu
al
Offs
et (f
eet)
Not
e: 6
,380
,553
firs
t bre
ak p
icks
: mea
n re
sidu
al =
-0.6
6 m
s, s
tand
ard
devi
atio
n =
7.02
ms.
1,00
02,
000
3,00
0
Figu
re 3
-4Pa
cific
Gas a
nd E
lectri
c Com
pany
2012
Pha
se 1
Offs
et <
3,00
0-Fo
ot T
rave
l-Tim
e-In
vers
ion
Res
idua
l Dis
trib
utio
n
K:\P
roje
cts\
79_2
2540
0_P
GE
_WE
2_O
nsho
re_2
011_
Ph1
_Pro
cess
ing\
05_G
raph
ics\
PR
-16
DC
PP F
OU
ND
ATIO
N V
ELO
CIT
Y R
EPO
RT
PGEQ-PR-16Revision 1
Fugro Consultants, Inc.Project No. 04.79225400 2012 3D Onshore Seismic Survey Report
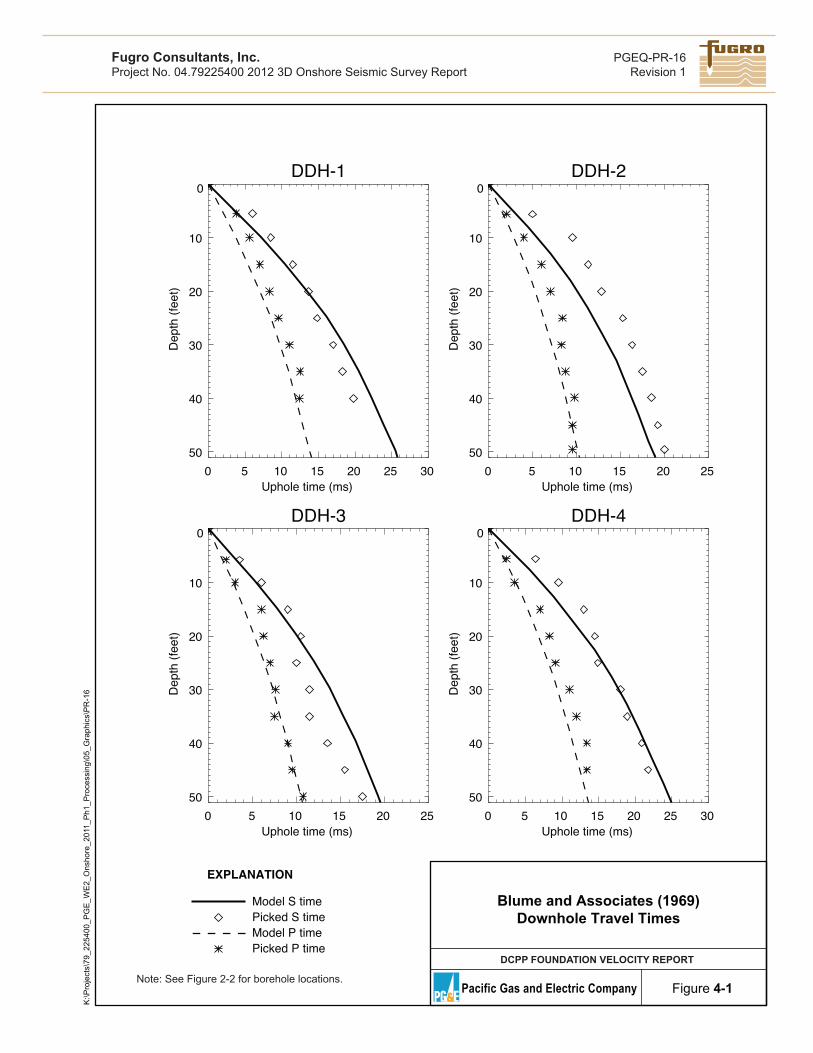
DDH-1
0 5 10 15 20 25 30Uphole time (ms)
50
40
30
20
10
0D
epth
(fee
t)DDH-2
0 5 10 15 20 25Uphole time (ms)
50
40
30
20
10
0
Dep
th (f
eet)
DDH-3
0 5 10 15 20 25Uphole time (ms)
50
40
30
20
10
0
Dep
th (f
eet)
DDH-4
0 5 10 15 20 25 30Uphole time (ms)
50
40
30
20
10
0
Dep
th (f
eet)
Model S time
EXPLANATION
Picked S timeModel P timePicked P time
Note: See Figure 2-2 for borehole locations.
Blume and Associates (1969)Downhole Travel Times
DCPP FOUNDATION VELOCITY REPORT
Pacific Gas and Electric Company Figure 4-1
K:\P
roje
cts\
79_2
2540
0_P
GE
_WE
2_O
nsho
re_2
011_
Ph1
_Pro
cess
ing\
05_G
raph
ics\
PR
-16
PGEQ-PR-16Revision 1
Fugro Consultants, Inc.Project No. 04.79225400 2012 3D Onshore Seismic Survey Report
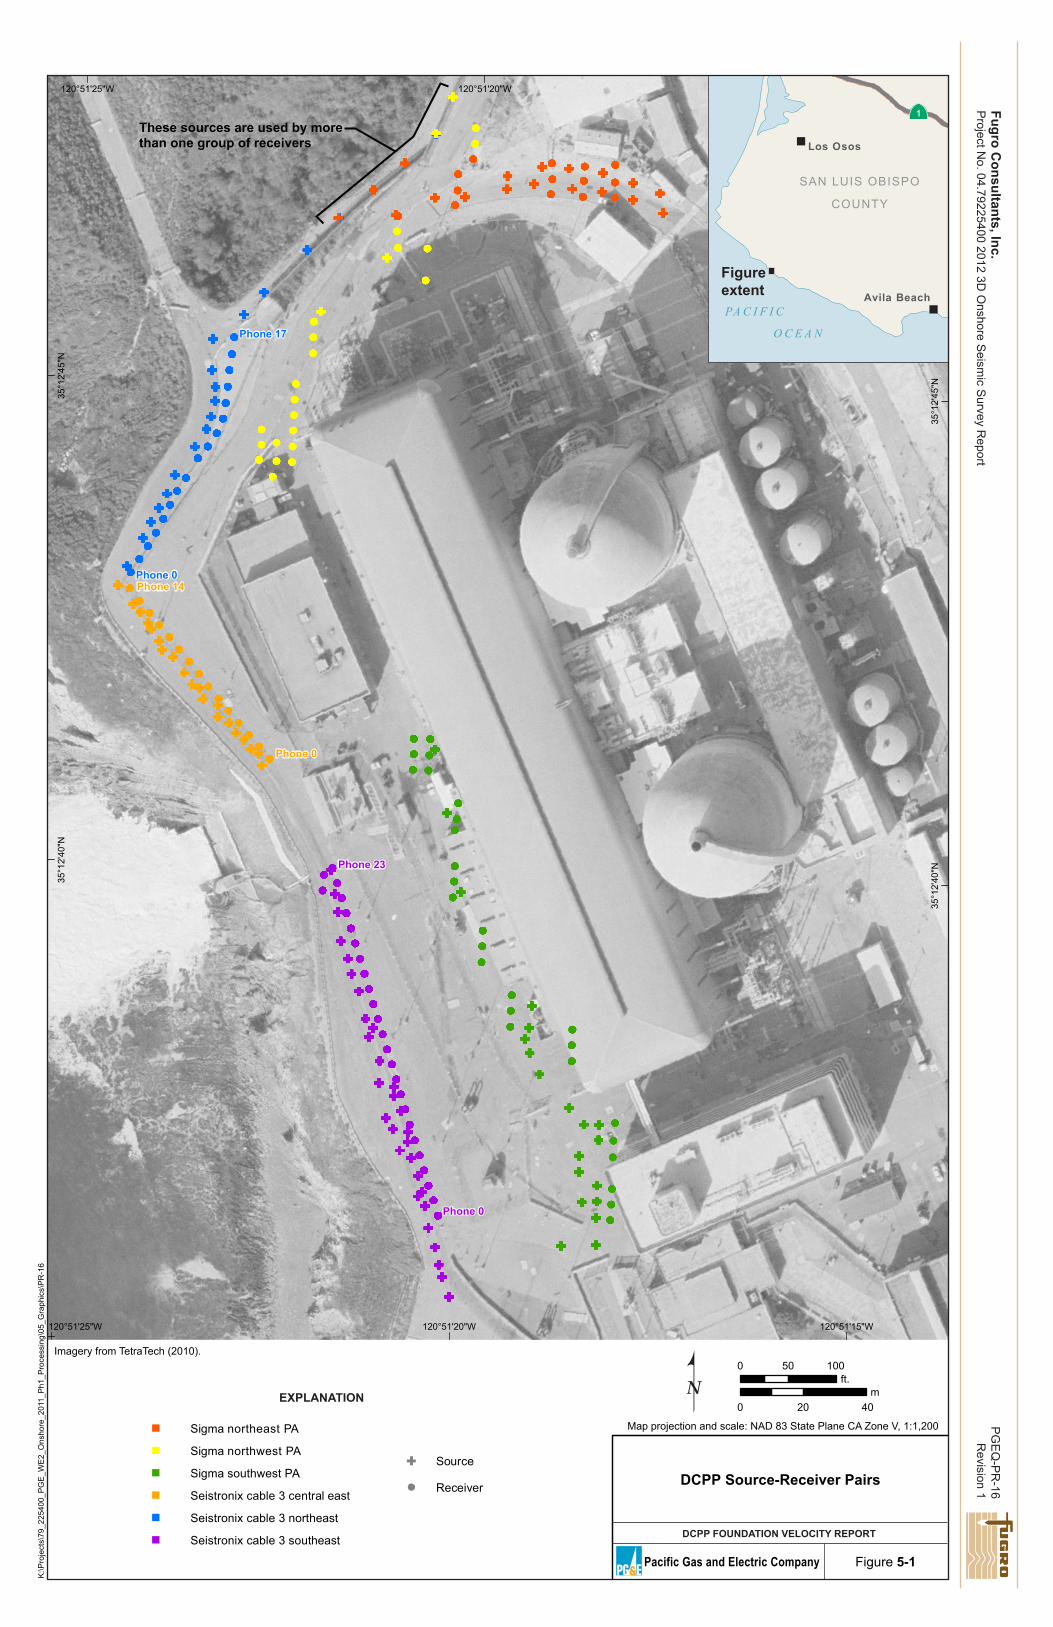
Sigma northeast PA
Sigma northwest PA
Sigma southwest PA
Seistronix cable 3 central east
Seistronix cable 3 northeast
Seistronix cable 3 southeast
Source
Receiver
120°51'15"W
120°51'15"W
120°51'20"W
120°51'20"W
120°51'25"W
120°51'25"W
35°1
2'45
"N
35°1
2'45
"N
35°1
2'40
"N
35°1
2'40
"N
0 50 100ft.
m0 20 40
Map projection and scale: NAD 83 State Plane CA Zone V, 1:1,200
Imagery from TetraTech (2010).
Avila Beach
Los Osos
SAN LUIS OBISPO
COUNTY
These sources are used by morethan one group of receivers
PA C I F I C
O C E A N
1
Figureextent
DCPP Source-Receiver Pairs
DCPP FOUNDATION VELOCITY REPORT
Pacific Gas and Electric Company Figure 5-1
Phone 17
Phone 0Phone 14
Phone 0
Phone 0
Phone 23
K:\P
roje
cts\
79_2
2540
0_P
GE
_WE
2_O
nsho
re_2
011_
Ph1
_Pro
cess
ing\
05_G
raph
ics\
PR
-16
PG
EQ
-PR
-16R
evision 1Fugro C
onsultants, Inc.P
roject No. 04.79225400 2012 3D
Onshore S
eismic S
urvey Report
EXPLANATION
40004000
6500
6500
9000
9000
0 1 2 3 4 5 6 7 8 9 10 11 12 13 14 15 16 17
0 50 100 150 200 250Distance (feet)
-20
0
20
40
60
80
100
Ele
vatio
n (fe
et)
2000
2500
3000
3500
4000
4500
5000
5500
6000
6500
7000
7500
8000
8500
9000
9500
10000
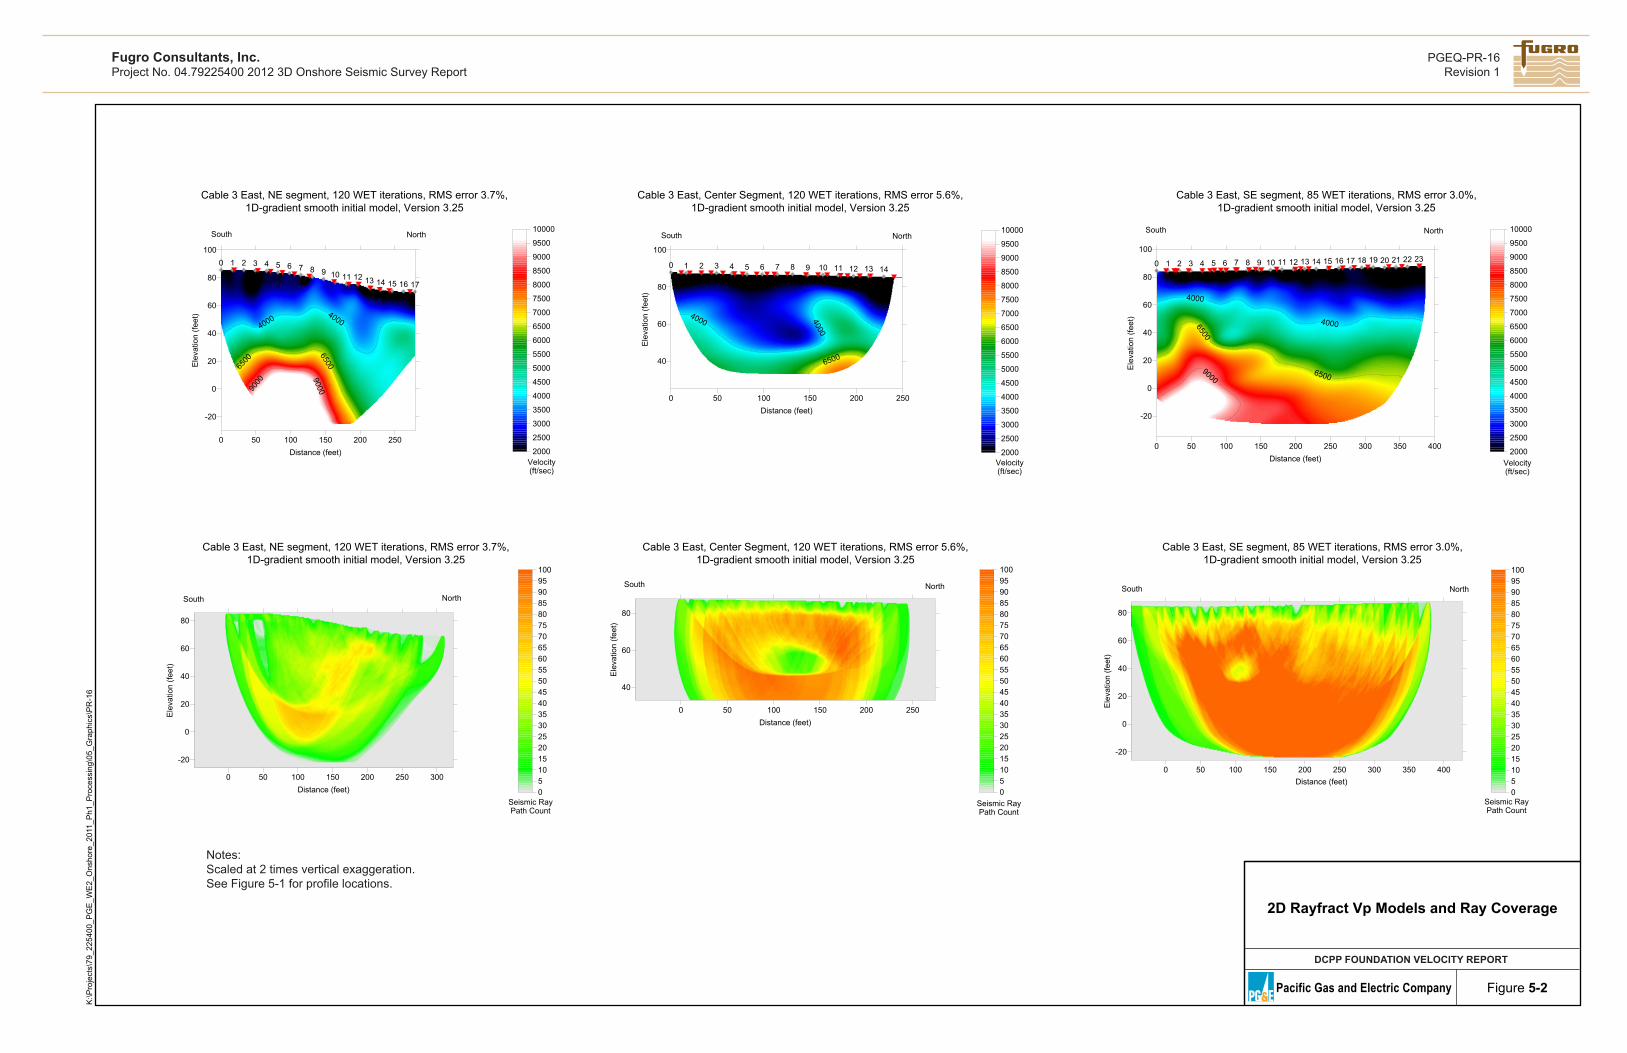
Cable 3 East, NE segment, 120 WET iterations, RMS error 3.7%,1D-gradient smooth initial model, Version 3.25
Velocity(ft/sec)
South North
0 50 100 150 200 250 300Distance (feet)
-20
0
20
40
60
80
Ele
vatio
n (fe
et)
Cable 3 East, NE segment, 120 WET iterations, RMS error 3.7%,1D-gradient smooth initial model, Version 3.25
05101520253035404550556065707580859095100
Seismic RayPath Count
South North
4000 4000
6500
0 1 2 3 4 5 6 7 8 9 10 11 12 13 14
0 50 100 150 200 250Distance (feet)
40
60
80
100
Ele
vatio
n (fe
et)
2000
2500
3000
3500
4000
4500
5000
5500
6000
6500
7000
7500
8000
8500
9000
9500
10000
Cable 3 East, Center Segment, 120 WET iterations, RMS error 5.6%,1D-gradient smooth initial model, Version 3.25
Velocity(ft/sec)
South North
0 50 100 150 200 250Distance (feet)
Distance (feet)
40
60
80E
leva
tion
(feet
)
05101520253035404550556065707580859095100
Cable 3 East, Center Segment, 120 WET iterations, RMS error 5.6%,1D-gradient smooth initial model, Version 3.25
Seismic RayPath Count
South North
4000
40006500
65009000
0 1 2 3 4 5 6 7 8 9 10 11 12 13 14 15 16 17 18 19 20 21 22 23
0 50 100 150 200 250 300 350 400Distance (feet)
-20
0
20
40
60
80
100
Ele
vatio
n (fe
et)
2000
2500
3000
3500
4000
4500
5000
5500
6000
6500
7000
7500
8000
8500
9000
9500
10000
Cable 3 East, SE segment, 85 WET iterations, RMS error 3.0%,1D-gradient smooth initial model, Version 3.25
Velocity(ft/sec)
South North
0 50 100 150 200 250 300 350 400
-20
0
20
40
60
80
Ele
vatio
n (fe
et)
05101520253035404550556065707580859095100
Cable 3 East, SE segment, 85 WET iterations, RMS error 3.0%,1D-gradient smooth initial model, Version 3.25
Seismic RayPath Count
South North
Notes:Scaled at 2 times vertical exaggeration. See Figure 5-1 for profile locations.
2D Rayfract Vp Models and Ray Coverage
DCPP FOUNDATION VELOCITY REPORT
Pacific Gas and Electric Company Figure 5-2
K:\P
roje
cts\
79_2
2540
0_P
GE
_WE
2_O
nsho
re_2
011_
Ph1
_Pro
cess
ing\
05_G
raph
ics\
PR
-16
PGEQ-PR-16Revision 1
Fugro Consultants, Inc.Project No. 04.79225400 2012 3D Onshore Seismic Survey Report
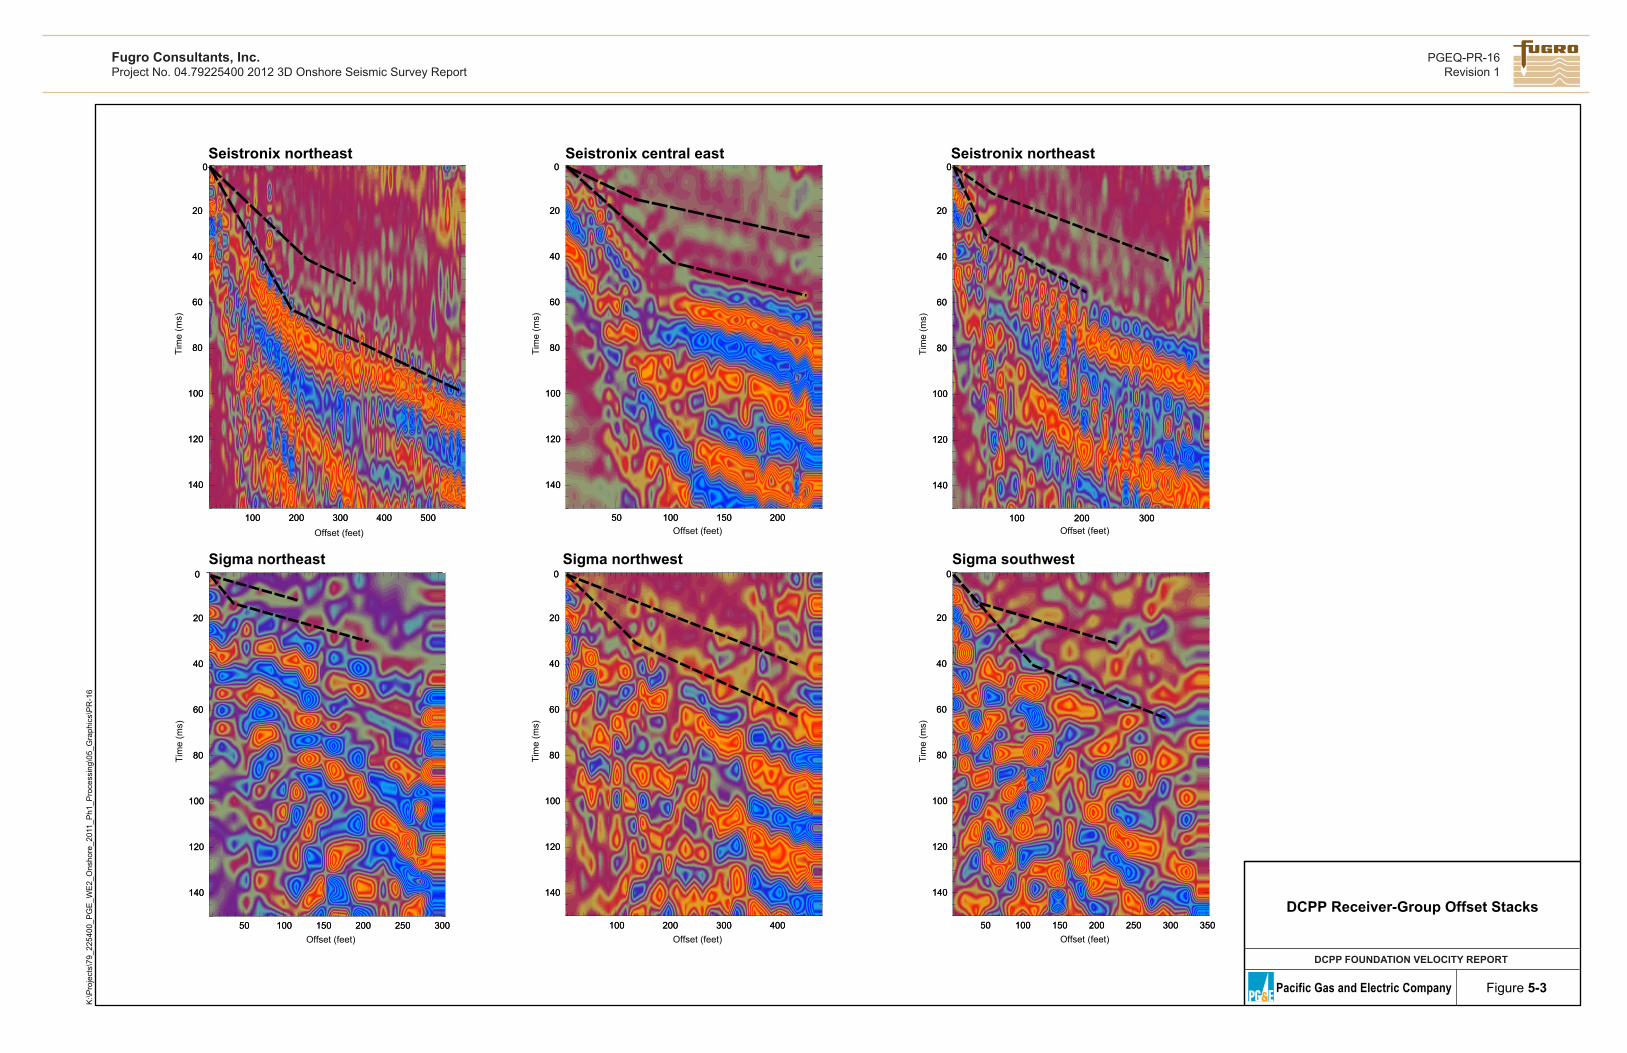
Seistronix northeast Seistronix central east Seistronix northeast
Sigma northeast Sigma northwest Sigma southwest
100 200 300 400 500
140
120
100
80
60
40
20
0Ti
me
(ms)
100 200 300 400 500
140
120
100
80
60
40
20
0
50 100 150 200 250 300Offset (feet)
140
120
100
80
60
40
20
0
Tim
e (m
s)
50 100 150 200 250 300
140
120
100
80
60
40
20
0
50 100 150 200
140
120
100
80
60
40
20
0
Tim
e (m
s)
50 100 150 200
140
120
100
80
60
40
20
0
100 200 300 400Offset (feet)
140
120
100
80
60
40
20
0
100 200 300 400
140
120
100
80
60
40
20
0
Tim
e (m
s)
100 200 300
140
120
100
80
60
40
20
0
Tim
e (m
s)
100 200 300
140
120
100
80
60
40
20
0
50 100 150 200 250 300 350Offset (feet)
Offset (feet) Offset (feet) Offset (feet)
140
120
100
80
60
40
20
0
Tim
e (m
s)50 100 150 200 250 300 350
140
120
100
80
60
40
20
0
DCPP Receiver-Group Offset Stacks
DCPP FOUNDATION VELOCITY REPORT
Pacific Gas and Electric Company Figure 5-3
K:\P
roje
cts\
79_2
2540
0_P
GE
_WE
2_O
nsho
re_2
011_
Ph1
_Pro
cess
ing\
05_G
raph
ics\
PR
-16
PGEQ-PR-16Revision 1
Fugro Consultants, Inc.Project No. 04.79225400 2012 3D Onshore Seismic Survey Report
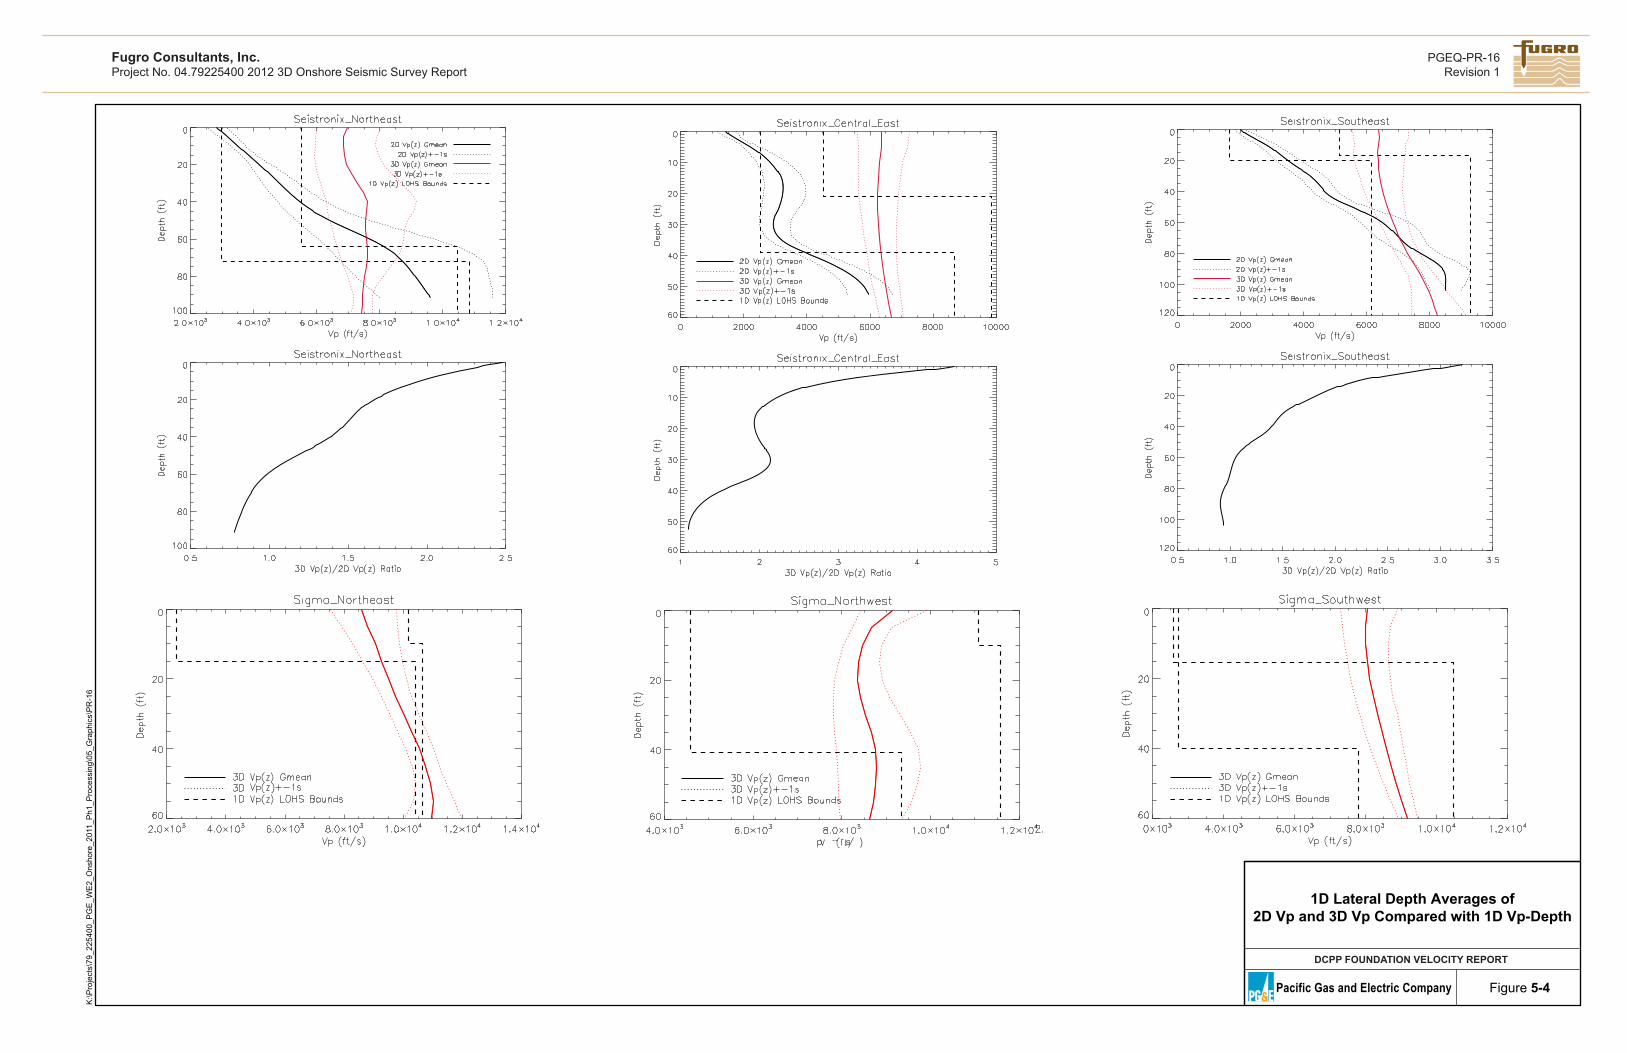
1D Lateral Depth Averages of2D Vp and 3D Vp Compared with 1D Vp-Depth
DCPP FOUNDATION VELOCITY REPORT
Pacific Gas and Electric Company Figure 5-4
K:\P
roje
cts\
79_2
2540
0_P
GE
_WE
2_O
nsho
re_2
011_
Ph1
_Pro
cess
ing\
05_G
raph
ics\
PR
-16
PGEQ-PR-16Revision 1
Fugro Consultants, Inc.Project No. 04.79225400 2012 3D Onshore Seismic Survey Report
Sigma northeast
Sigma northwest
Sigma southwest
Seistronix northeast
Seistronix central east
Seistronix southeast
10 20 30 40Frequency (Hz)
0.001
0.002
0.003
0.004
0.005
Slo
wne
ss (s
/m)
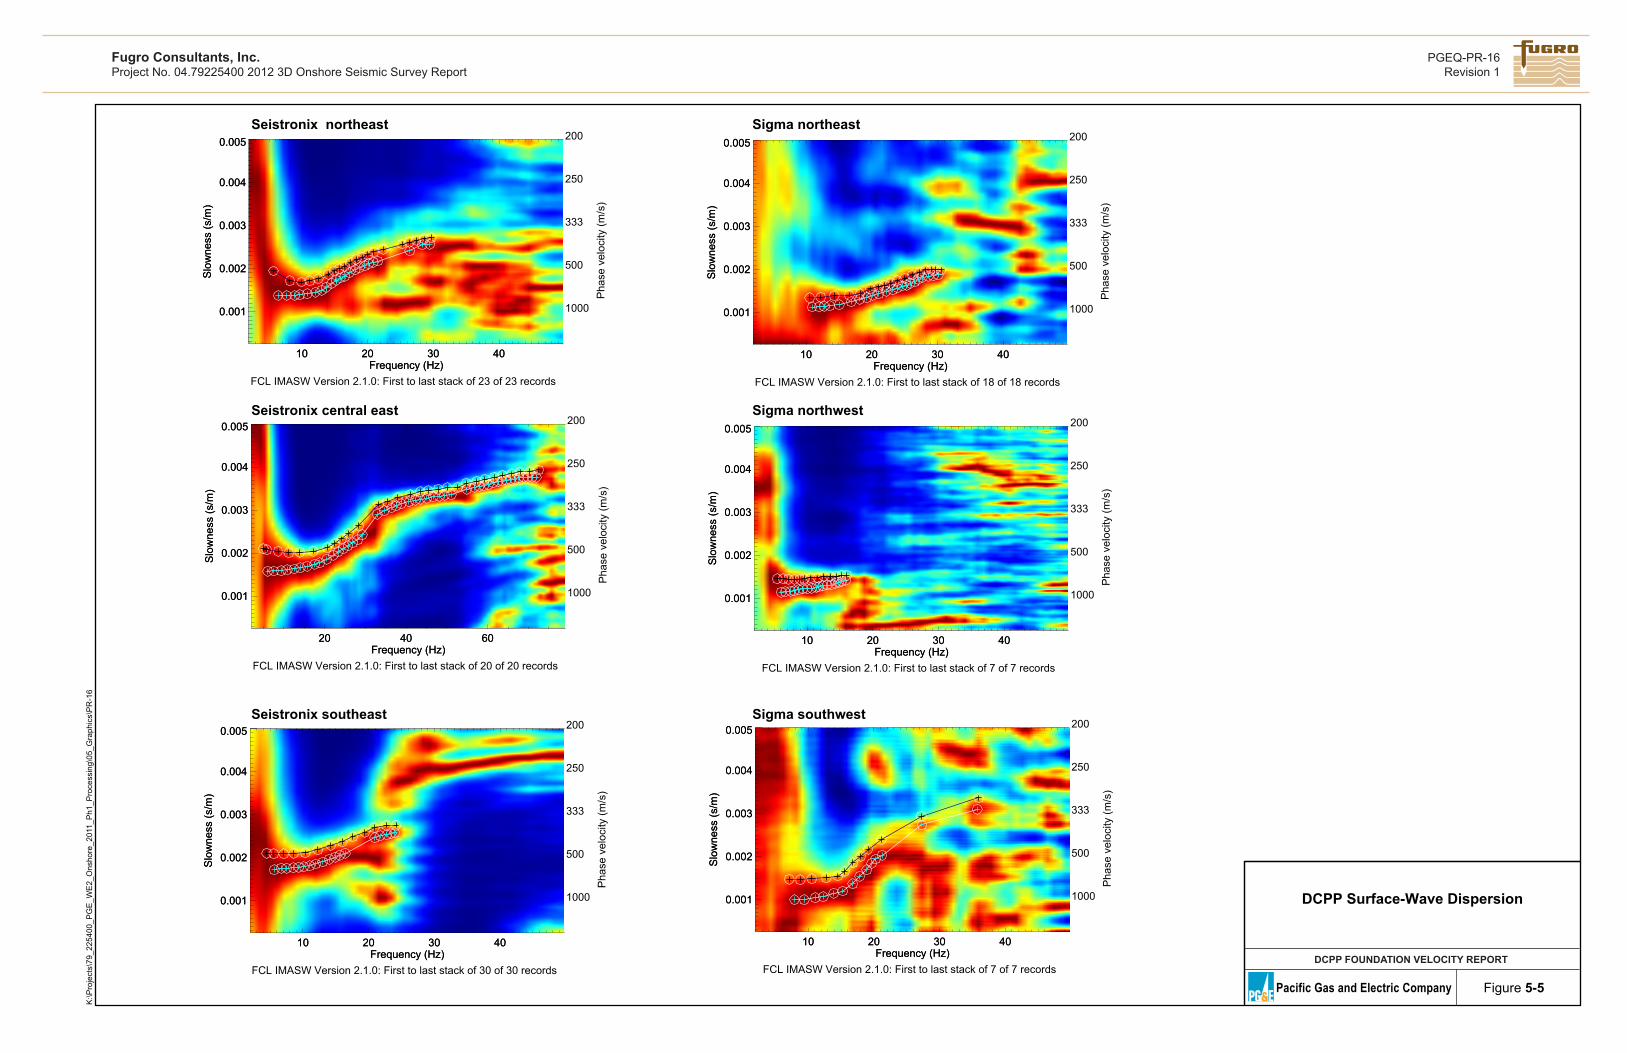
FCL IMASW Version 2.1.0: First to last stack of 23 of 23 records
10 20 30 40Frequency (Hz)
0.001
0.002
0.003
0.004
0.005
Slo
wne
ss (s
/m)
1000
500
333
250
200
Pha
se v
eloc
ity (m
/s)
20 40 60Frequency (Hz)
0.001
0.002
0.003
0.004
0.005
Slo
wne
ss (s
/m)
FCL IMASW Version 2.1.0: First to last stack of 20 of 20 records
20 40 60Frequency (Hz)
0.001
0.002
0.003
0.004
0.005
Slo
wne
ss (s
/m)
1000
500
333
250
200
Pha
se v
eloc
ity (m
/s)
10 20 30 40Frequency (Hz)
0.001
0.002
0.003
0.004
0.005
Slo
wne
ss (s
/m)
FCL IMASW Version 2.1.0: First to last stack of 30 of 30 records
10 20 30 40Frequency (Hz)
0.001
0.002
0.003
0.004
0.005
Slo
wne
ss (s
/m)
1000
500
333
250
200
Pha
se v
eloc
ity (m
/s)
10 20 30 40Frequency (Hz)
0.001
0.002
0.003
0.004
0.005
Slo
wne
ss (s
/m)
FCL IMASW Version 2.1.0: First to last stack of 18 of 18 records
10 20 30 40Frequency (Hz)
0.001
0.002
0.003
0.004
0.005
Slo
wne
ss (s
/m)
1000
500
333
250
200
Pha
se v
eloc
ity (m
/s)
10 20 30 40Frequency (Hz)
0.001
0.002
0.003
0.004
0.005
Slo
wne
ss (s
/m)
FCL IMASW Version 2.1.0: First to last stack of 7 of 7 records
10 20 30 40Frequency (Hz)
0.001
0.002
0.003
0.004
0.005
Slo
wne
ss (s
/m)
1000
500
333
250
200
Pha
se v
eloc
ity (m
/s)
10 20 30 40Frequency (Hz)
0.001
0.002
0.003
0.004
0.005S
low
ness
(s/m
)
FCL IMASW Version 2.1.0: First to last stack of 7 of 7 records
10 20 30 40Frequency (Hz)
0.001
0.002
0.003
0.004
0.005S
low
ness
(s/m
)
1000
500
333
250
200
Pha
se v
eloc
ity (m
/s)
DCPP Surface-Wave Dispersion
DCPP FOUNDATION VELOCITY REPORT
Pacific Gas and Electric Company Figure 5-5
K:\P
roje
cts\
79_2
2540
0_P
GE
_WE
2_O
nsho
re_2
011_
Ph1
_Pro
cess
ing\
05_G
raph
ics\
PR
-16
PGEQ-PR-16Revision 1
Fugro Consultants, Inc.Project No. 04.79225400 2012 3D Onshore Seismic Survey Report
Southwest_PA_sigma
5 10 15 20 25 30 35 40Frequency (Hz)
200
400
600
800
1000
1200
Vel
ocity
(m/s
)
Observed phaseModel phase
Observed slow phase
0 20 40 60 80 1000
1000
2000
3000
4000
S-w
ave
velo
city
(m/s
)
0 100 200 300Depth (ft)
0
2
4
6
8
10
12
S-w
ave
velo
city
(kft/
s)
Mean of 21 best modelsMedian of 21 best modelsFinal ~1σ
Likelihood ~1σChi-squared ~1σ
Northwest_PA_sigma
6 8 10 12 14 16Frequency (Hz)
650
700
750
800
850
900
950
Vel
ocity
(m/s
)
Observed phaseModel phase
Observed slow phase
0 20 40 60 80 100 1200
1000
2000
3000
4000
S-w
ave
velo
city
(m/s
)
0 100 200 300 400Depth (ft)
0
2
4
6
8
10
12
S-w
ave
velo
city
(kft/
s)
Mean of 21 best modelsMedian of 21 best modelsFinal ~1σ
Likelihood ~1σChi-squared ~1σ
Northeast_PA_sigma
10 15 20 25 30 35Frequency (Hz)
500
600
700
800
900
1000
Vel
ocity
(m/s
)
Observed phaseModel phase
Observed slow phase
0 20 40 60Depth (m)
0
1000
2000
3000
4000
S-w
ave
velo
city
(m/s
)
0 50 100 150 200 250Depth (ft)
0
2
4
6
8
10
12
S-w
ave
velo
city
(kft/
s)
Mean of 21 best modelsMedian of 21 best modelsFinal ~1σ
Likelihood ~1σChi-squared ~1σ
Depth (m)Depth (m)
Seistronix_Cbl-3-East_South_segment
5 10 15 20 25Frequency (Hz)
350
400
450
500
550
600
Vel
ocity
(m/s
)
Observed phaseModel phase
Observed slow phase
0 20 40 60 80Depth (m)
0
1000
2000
3000
4000
S-w
ave
velo
city
(m/s
)
0 50 100 150 200 250 300Depth (ft)
0
2
4
6
8
10
12
S-w
ave
velo
city
(kft/
s)
Mean of 21 best modelsMedian of 21 best modelsFinal ~1σ
Likelihood ~1σChi-squared ~1σ
Seistronix_Cbl-3-East_Central_segment
0 20 40 60 80Frequency (Hz)
200
300
400
500
600
700
Vel
ocity
(m/s
)
Observed phaseModel phase
Observed Slow Phase
0 20 40 60 80Depth (m)
0
500
1000
1500
2000
S-w
ave
velo
city
(m/s
)
0 50 100 150 200 250 300Depth (ft)
0
1
2
3
4
5
6
S-w
ave
velo
city
(kft/
s)
Mean of 21 best modelsMedian of 21 best modelsFinal ~1σ
Likelihood ~1σChi-squared ~1σ
Seistronix_Cbl-3-East_North_segment
5 10 15 20 25 30Frequency (Hz)
300
400
500
600
700
800
Vel
ocity
(m/s
)
Observed phaseModel phase
Observed slow phase
0 20 40 60 80 100Depth (m)
0
1000
2000
3000
4000
S-w
ave
velo
city
(m/s
)
0 50 100 150 200 250 300Depth (ft)
0
2
4
6
8
10
12
S-w
ave
velo
city
(kft/
s)
Mean of 21 best modelsMedian of 21 best modelsFinal ~1σ
Likelihood ~1σChi-squared ~1σ
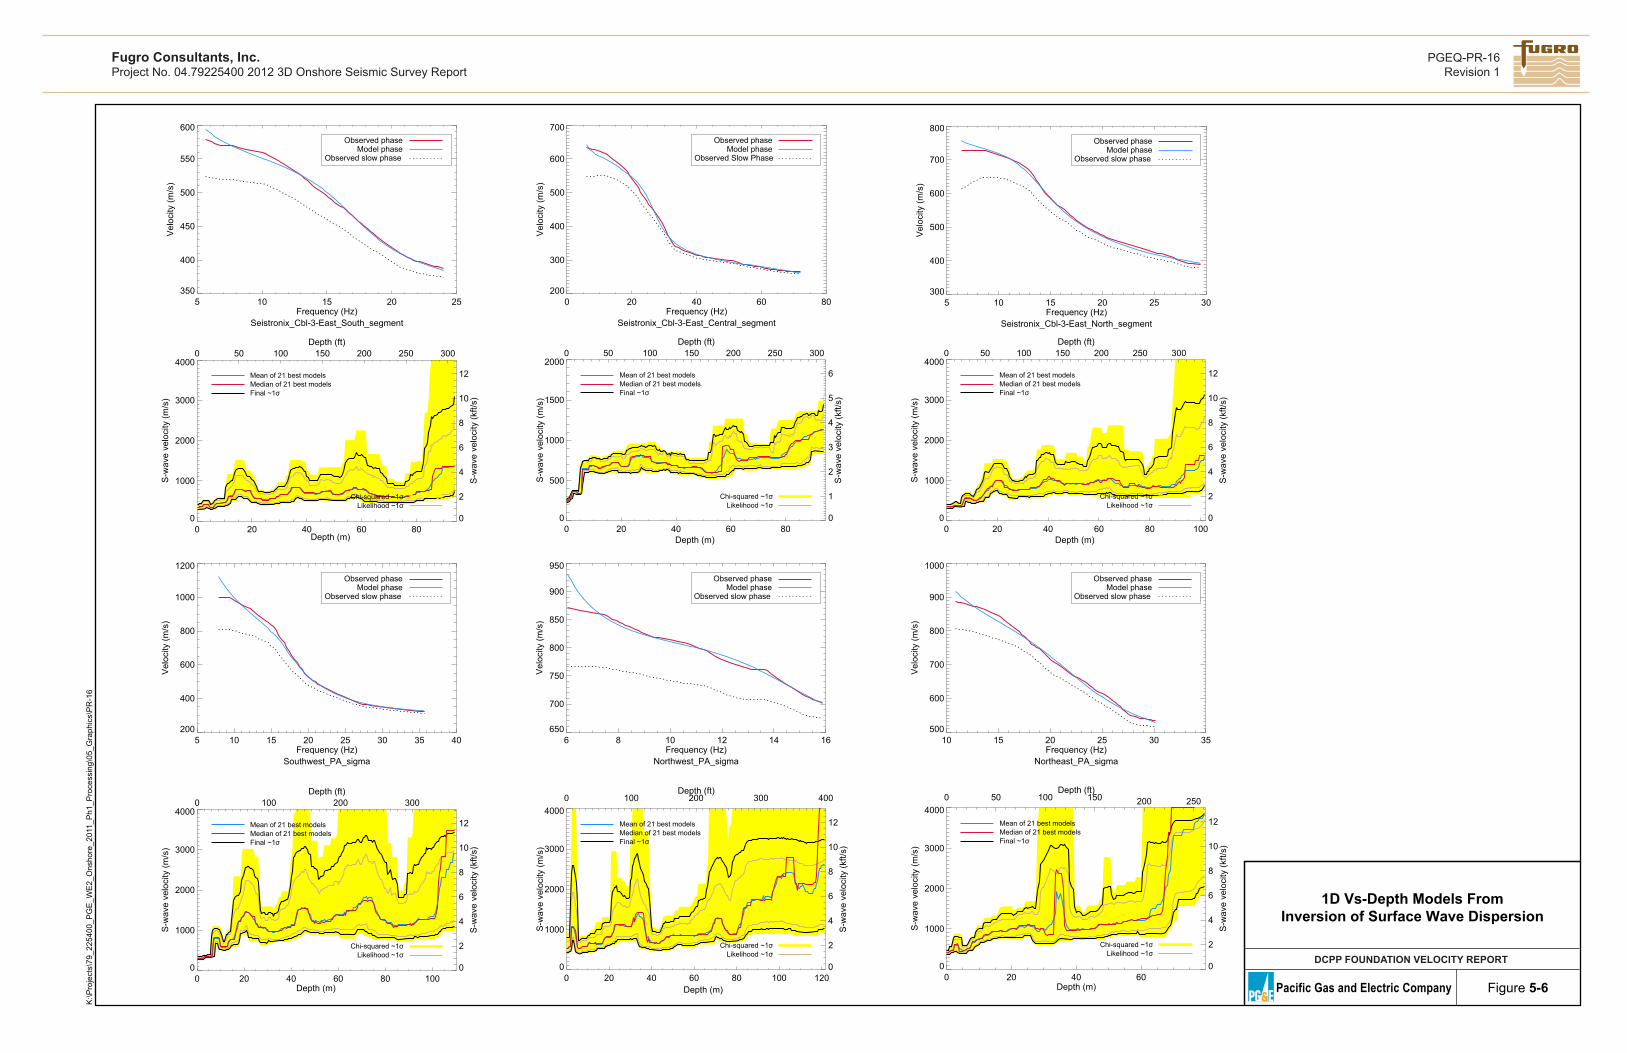
1D Vs-Depth Models FromInversion of Surface Wave Dispersion
DCPP FOUNDATION VELOCITY REPORT
Pacific Gas and Electric Company Figure 5-6
K:\P
roje
cts\
79_2
2540
0_P
GE
_WE
2_O
nsho
re_2
011_
Ph1
_Pro
cess
ing\
05_G
raph
ics\
PR
-16
PGEQ-PR-16Revision 1
Fugro Consultants, Inc.Project No. 04.79225400 2012 3D Onshore Seismic Survey Report
Seistronix northeast
0 500 1,000 1,500 2,000Vs (m/sec)
50
40
30
20
10
0D
epth
(m)
Sigma northeast
0 500 1,000 1,500 2,000Vs (m/sec)
50
40
30
20
10
0
Dep
th (m
)
Seistronix central east
0 500 1,000 1,500 2,000Vs (m/sec)
50
40
30
20
10
0
Dep
th (m
)
Sigma northwest
0 500 1,000 1,500 2,000Vs (m/sec)
50
40
30
20
10
0
Dep
th (m
)
Seistronix southeast
0 500 1,000 1,500 2,000Vs (m/sec)
50
40
30
20
10
0
Dep
th (m
)
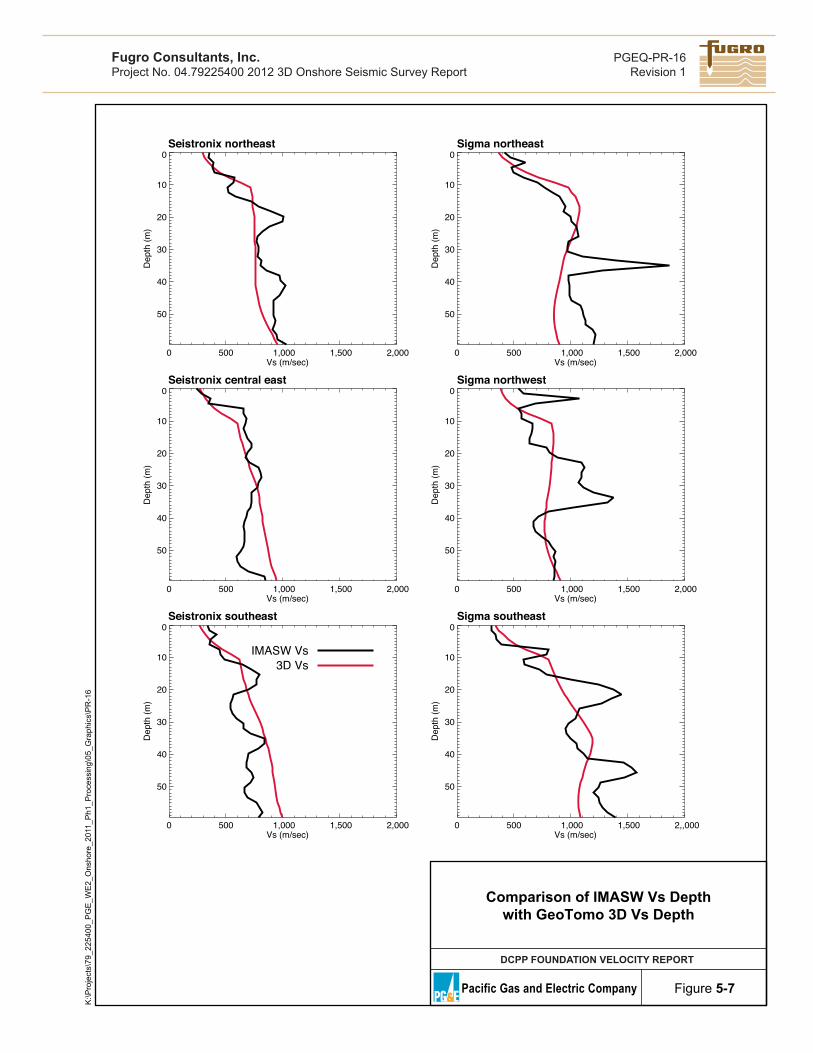
IMASW Vs3D Vs
Sigma southeast
0 500 1,000 1,500 2,,000Vs (m/sec)
50
40
30
20
10
0
Dep
th (m
)
Comparison of IMASW Vs Depthwith GeoTomo 3D Vs Depth
DCPP FOUNDATION VELOCITY REPORT
Pacific Gas and Electric Company Figure 5-7
K:\P
roje
cts\
79_2
2540
0_P
GE
_WE
2_O
nsho
re_2
011_
Ph1
_Pro
cess
ing\
05_G
raph
ics\
PR
-16
PGEQ-PR-16Revision 1
Fugro Consultants, Inc.Project No. 04.79225400 2012 3D Onshore Seismic Survey Report
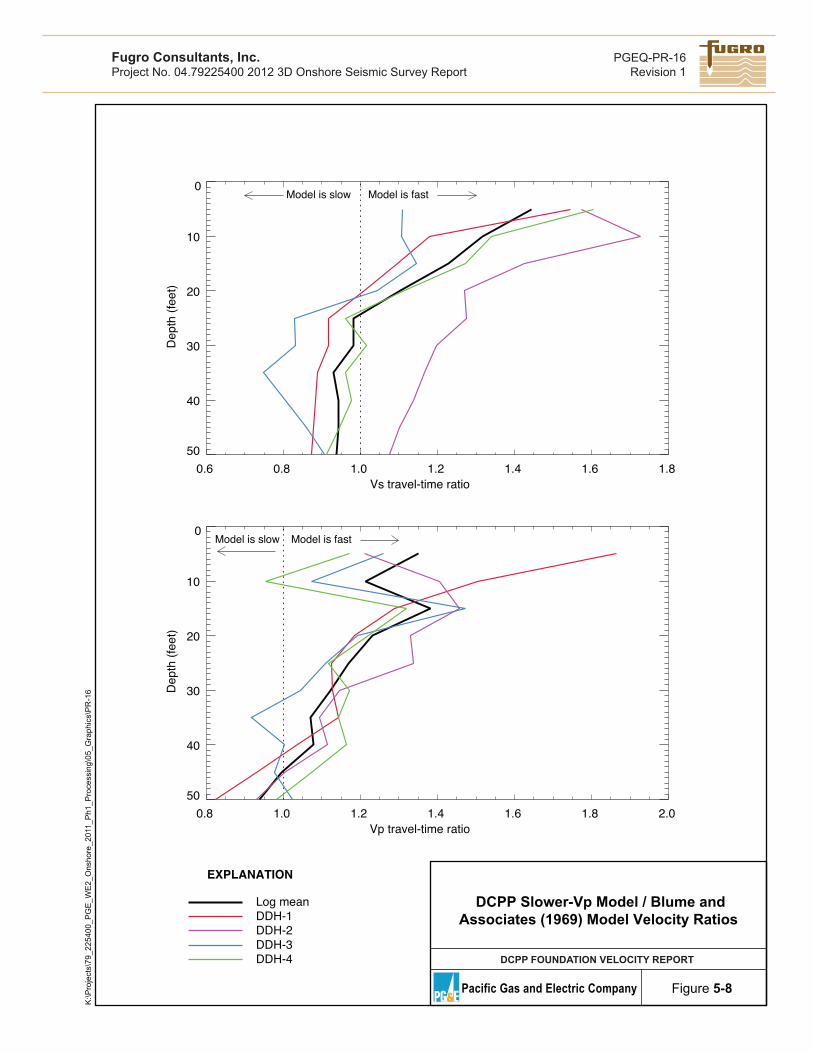
0.6 0.8 1.0 1.2 1.4 1.6 1.8Vs travel-time ratio
50
40
30
20
10
0D
epth
(fee
t)
Model is fastModel is slow
EXPLANATION
0.8 1.0 1.2 1.4 1.6 1.8 2.0Vp travel-time ratio
50
40
30
20
10
0
Dep
th (f
eet)
Model is fastModel is slow
DDH-4DDH-3DDH-2DDH-1Log mean DCPP Slower-Vp Model / Blume and
Associates (1969) Model Velocity Ratios
DCPP FOUNDATION VELOCITY REPORT
Pacific Gas and Electric Company Figure 5-8
K:\P
roje
cts\
79_2
2540
0_P
GE
_WE
2_O
nsho
re_2
011_
Ph1
_Pro
cess
ing\
05_G
raph
ics\
PR
-16
PGEQ-PR-16Revision 1
Fugro Consultants, Inc.Project No. 04.79225400 2012 3D Onshore Seismic Survey Report
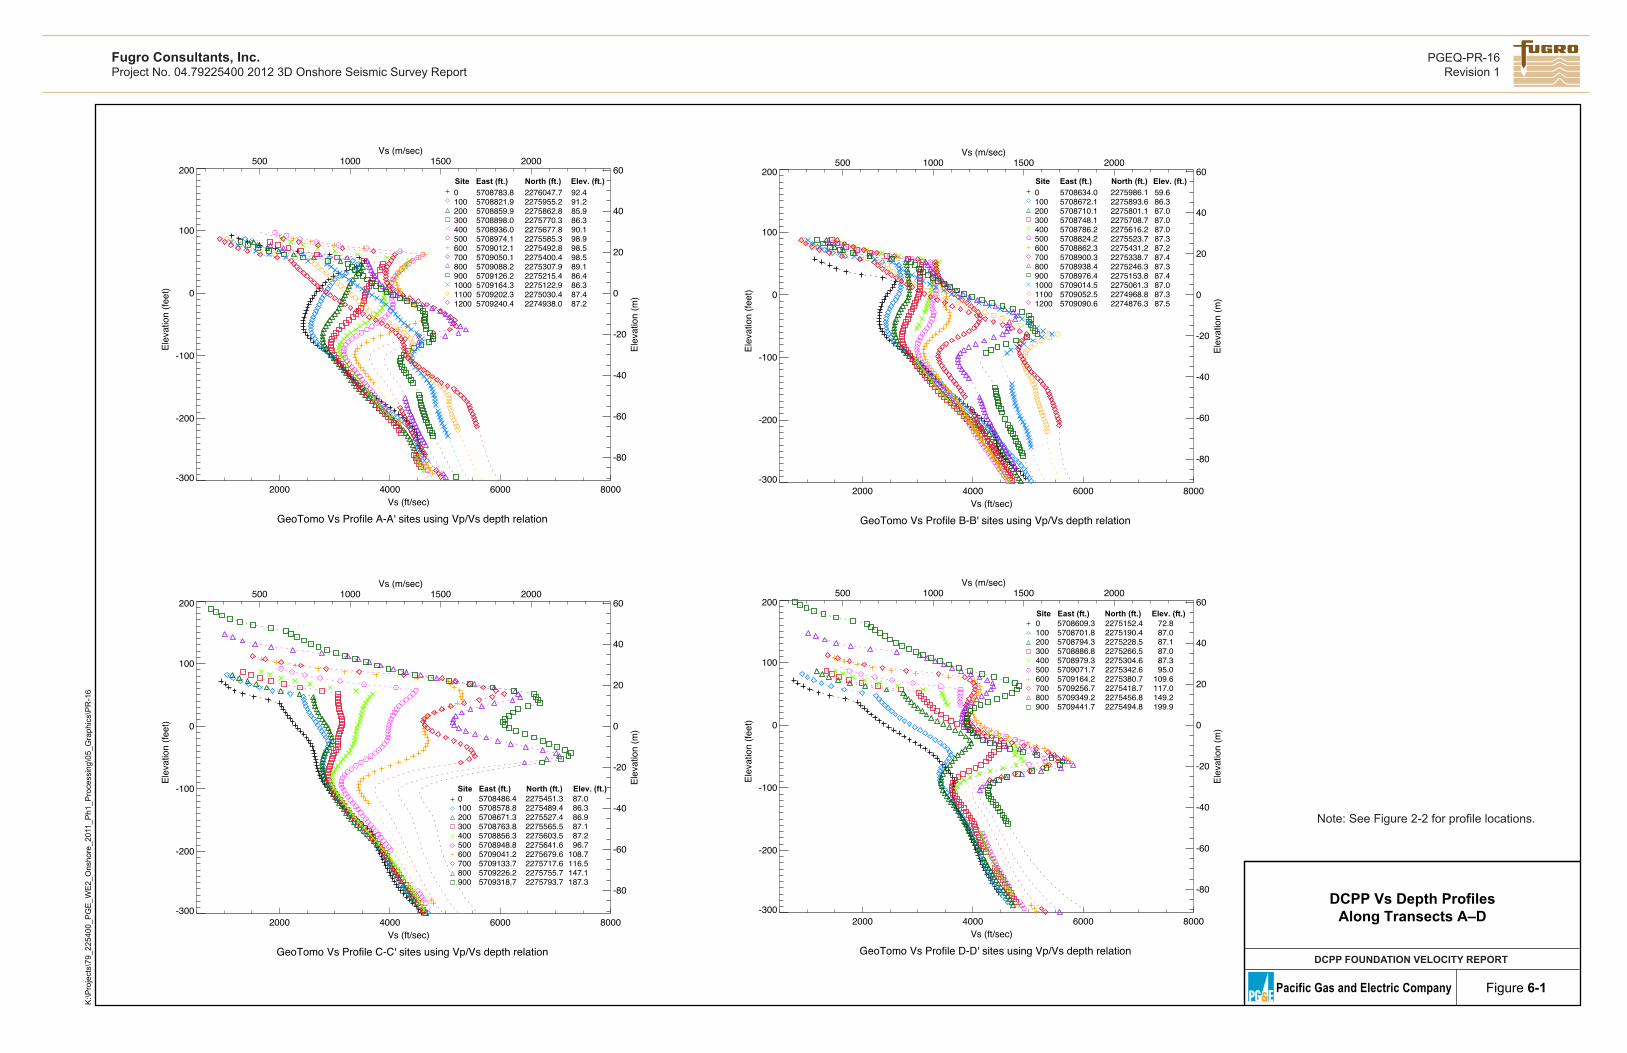
GeoTomo Vs Profile A-A' sites using Vp/Vs depth relation
2000 4000 6000 8000Vs (ft/sec)
-300
-200
-100
0
100
200El
evat
ion
(feet
)500 1000 1500 2000
Vs (m/sec)
-80
-60
-40
-20
0
20
40
60
Elev
atio
n (m
)
GeoTomo Vs Profile B-B' sites using Vp/Vs depth relation
2000 4000 6000 8000Vs (ft/sec)
-300
-200
-100
0
100
200
Elev
atio
n (fe
et)
500 1000 1500 2000Vs (m/sec)
-80
-60
-40
-20
0
20
40
60
Elev
atio
n (m
)
GeoTomo Vs Profile C-C' sites using Vp/Vs depth relation
2000 4000 6000 8000Vs (ft/sec)
-300
-200
-100
0
100
200
Elev
atio
n (fe
et)
500 1000 1500 2000Vs (m/sec)
-80
-60
-40
-20
0
20
40
60
Elev
atio
n (m
)
GeoTomo Vs Profile D-D' sites using Vp/Vs depth relation
2000 4000 6000 8000Vs (ft/sec)
-300
-200
-100
0
100
200
Elev
atio
n (fe
et)
500 1000 1500 2000Vs (m/sec)
-80
-60
-40
-20
0
20
40
60
Elev
atio
n (m
)
0 5708783.8 2276047.7 92.4100 5708821.9 2275955.2 91.2200 5708859.9 2275862.8 85.9300 5708898.0 2275770.3 86.3400 5708936.0 2275677.8 90.1500 5708974.1 2275585.3 98.9600 5709012.1 2275492.8 98.5700 5709050.1 2275400.4 98.5800 5709088.2 2275307.9 89.1900 5709126.2 2275215.4 86.41000 5709164.3 2275122.9 86.31100 5709202.3 2275030.4 87.41200 5709240.4 2274938.0 87.2
Site East (ft.) North (ft.) Elev. (ft.) Site East (ft.) North (ft.) Elev. (ft.)0 5708634.0 2275986.1 59.6100 5708672.1 2275893.6 86.3200 5708710.1 2275801.1 87.0300 5708748.1 2275708.7 87.0400 5708786.2 2275616.2 87.0500 5708824.2 2275523.7 87.3600 5708862.3 2275431.2 87.2700 5708900.3 2275338.7 87.4800 5708938.4 2275246.3 87.3900 5708976.4 2275153.8 87.41000 5709014.5 2275061.3 87.01100 5709052.5 2274968.8 87.31200 5709090.6 2274876.3 87.5
900 5709318.7 2275793.7 187.3800 5709226.2 2275755.7 147.1700 5709133.7 2275717.6 116.5600 5709041.2 2275679.6 108.7500 5708948.8 2275641.6 96.7400 5708856.3 2275603.5 87.2300 5708763.8 2275565.5 87.1200 5708671.3 2275527.4 86.9100 5708578.8 2275489.4 86.30 5708486.4 2275451.3 87.0Site East (ft.) North (ft.) Elev. (ft.)
0 5708609.3 2275152.4 72.8100 5708701.8 2275190.4 87.0200 5708794.3 2275228.5 87.1300 5708886.8 2275266.5 87.0400 5708979.3 2275304.6 87.3500 5709071.7 2275342.6 95.0600 5709164.2 2275380.7 109.6700 5709256.7 2275418.7 117.0800 5709349.2 2275456.8 149.2900 5709441.7 2275494.8 199.9
Site East (ft.) North (ft.) Elev. (ft.)
Note: See Figure 2-2 for profile locations.
DCPP Vs Depth ProfilesAlong Transects A–D
DCPP FOUNDATION VELOCITY REPORT
Pacific Gas and Electric Company Figure 6-1
K:\P
roje
cts\
79_2
2540
0_P
GE
_WE
2_O
nsho
re_2
011_
Ph1
_Pro
cess
ing\
05_G
raph
ics\
PR
-16
PGEQ-PR-16Revision 1
Fugro Consultants, Inc.Project No. 04.79225400 2012 3D Onshore Seismic Survey Report
2.0E
103
4.0E
103
6.0∑
103
8.0E
103
1.0E
104
1.2E
104
1.4E
104
1.6E
104
Vp (f
t/sec
)
-300
-200
-1000
100
200
300
Elevation (feet)
1,00
02,
000
3,00
04,
000
Vp (m
/sec
)
-50
050100
Elevation (m)
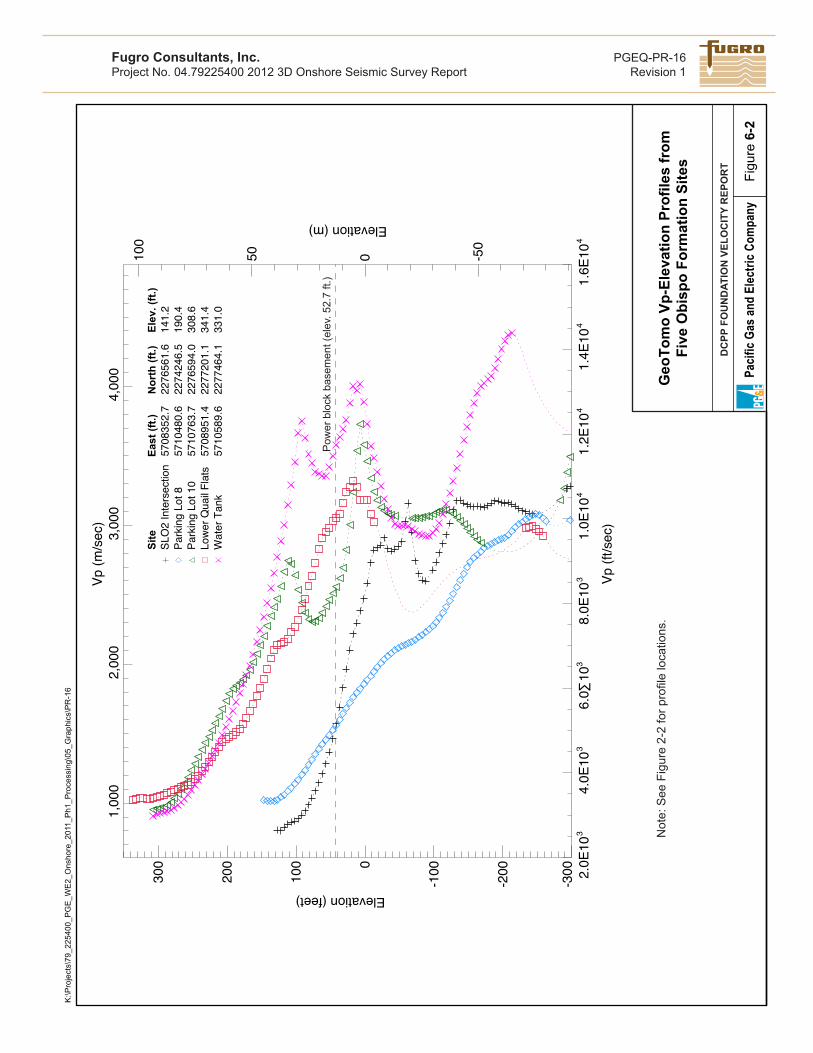
SLO
2 In
ters
ectio
n 57
0835
2.7
2276
561.
6 14
1.2
Park
ing
Lot 8
57
1048
0.6
2274
246.
5 19
0.4
Park
ing
Lot 1
0 57
1076
3.7
2276
594.
0 30
8.6
Low
er Q
uail
Flat
s 57
0895
1.4
2277
201.
1 34
1.4
Wat
er T
ank
5710
589.
6 22
7746
4.1
331.
0
Site
East
(ft.)
Nor
th (f
t.)El
ev. (
ft.)
Not
e: S
ee F
igur
e 2-
2 fo
r pro
file
loca
tions
.
Figu
re 6
-2
Geo
Tom
o Vp
-Ele
vatio
n Pr
ofile
s fr
omFi
ve O
bisp
o Fo
rmat
ion
Site
s
Pacif
ic Ga
s and
Elec
tric C
ompa
ny
DC
PP F
OU
ND
ATIO
N V
ELO
CIT
Y R
EPO
RT
K:\P
roje
cts\
79_2
2540
0_P
GE
_WE
2_O
nsho
re_2
011_
Ph1
_Pro
cess
ing\
05_G
raph
ics\
PR
-16
PGEQ-PR-16Revision 1
Fugro Consultants, Inc.Project No. 04.79225400 2012 3D Onshore Seismic Survey Report
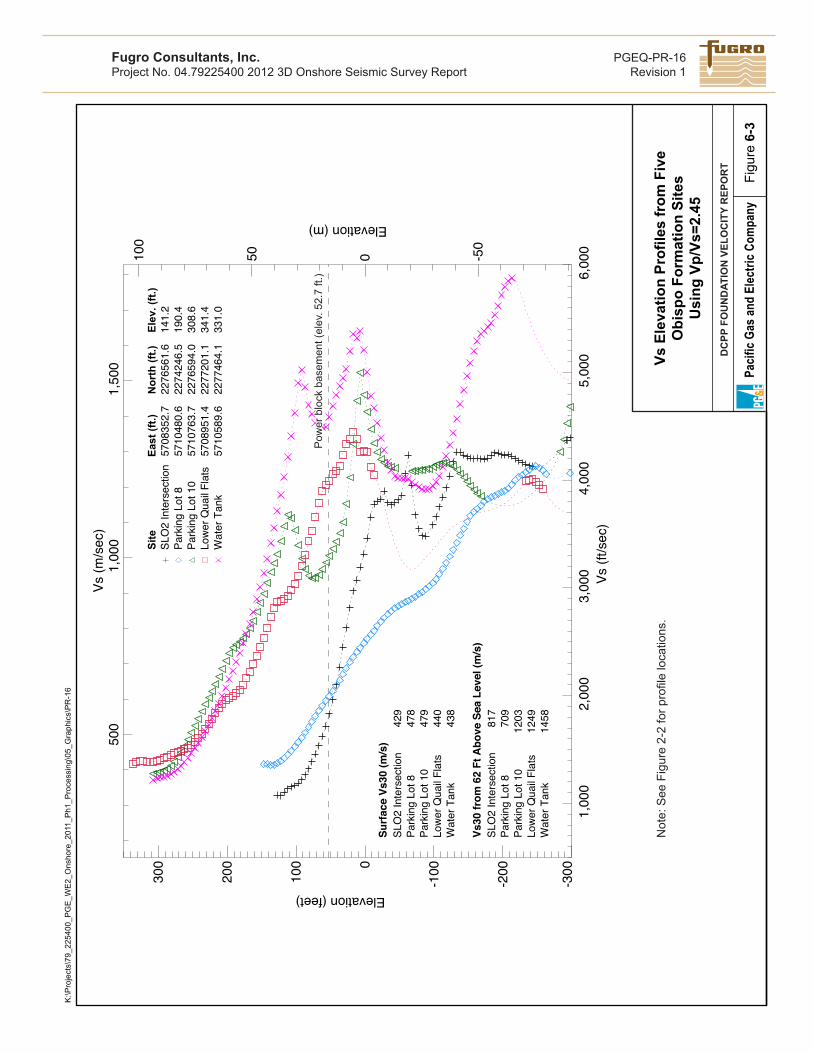
Pow
er b
lock
bas
emen
t (el
ev. 5
2.7
ft.)
1,00
02,
000
3,00
04,
000
5,00
06,
000
Vs (f
t/sec
)
-300
-200
-1000
100
200
300
Elevation (feet)
500
1,00
01,
500
Vs (m
/sec
)
-50
050100
Elevation (m)
SLO
2 In
ters
ectio
n 57
0835
2.7
2276
561.
6 14
1.2
Park
ing
Lot 8
57
1048
0.6
2274
246.
5 19
0.4
Park
ing
Lot 1
0 57
1076
3.7
2276
594.
0 30
8.6
Low
er Q
uail
Flat
s 57
0895
1.4
2277
201.
1 34
1.4
Wat
er T
ank
5710
589.
6 22
7746
4.1
331.
0
Site
East
(ft.)
Nor
th (f
t.)El
ev. (
ft.)
Wat
er T
ank
1458
Low
er Q
uail
Flat
s 12
49Pa
rkin
g Lo
t 10
1203
Park
ing
Lot 8
70
9SL
O2
Inte
rsec
tion
817
Vs30
from
62
Ft A
bove
Sea
Lev
el (m
/s)
Wat
er T
ank
438
Low
er Q
uail
Flat
s 44
0Pa
rkin
g Lo
t 10
479
Park
ing
Lot 8
47
8SL
O2
Inte
rsec
tion
429
Surf
ace
Vs30
(m/s
)
Not
e: S
ee F
igur
e 2-
2 fo
r pro
file
loca
tions
.
Figu
re 6
-3Pa
cific
Gas a
nd E
lectri
c Com
pany
DC
PP F
OU
ND
ATIO
N V
ELO
CIT
Y R
EPO
RT
Vs E
leva
tion
Prof
iles
from
Fiv
eO
bisp
o Fo
rmat
ion
Site
sU
sing
Vp/
Vs=2
.45
K:\P
roje
cts\
79_2
2540
0_P
GE
_WE
2_O
nsho
re_2
011_
Ph1
_Pro
cess
ing\
05_G
raph
ics\
PR
-16
PGEQ-PR-16Revision 1
Fugro Consultants, Inc.Project No. 04.79225400 2012 3D Onshore Seismic Survey Report
Pow
er b
lock
bas
emen
t (el
ev. 5
2.7
ft.)
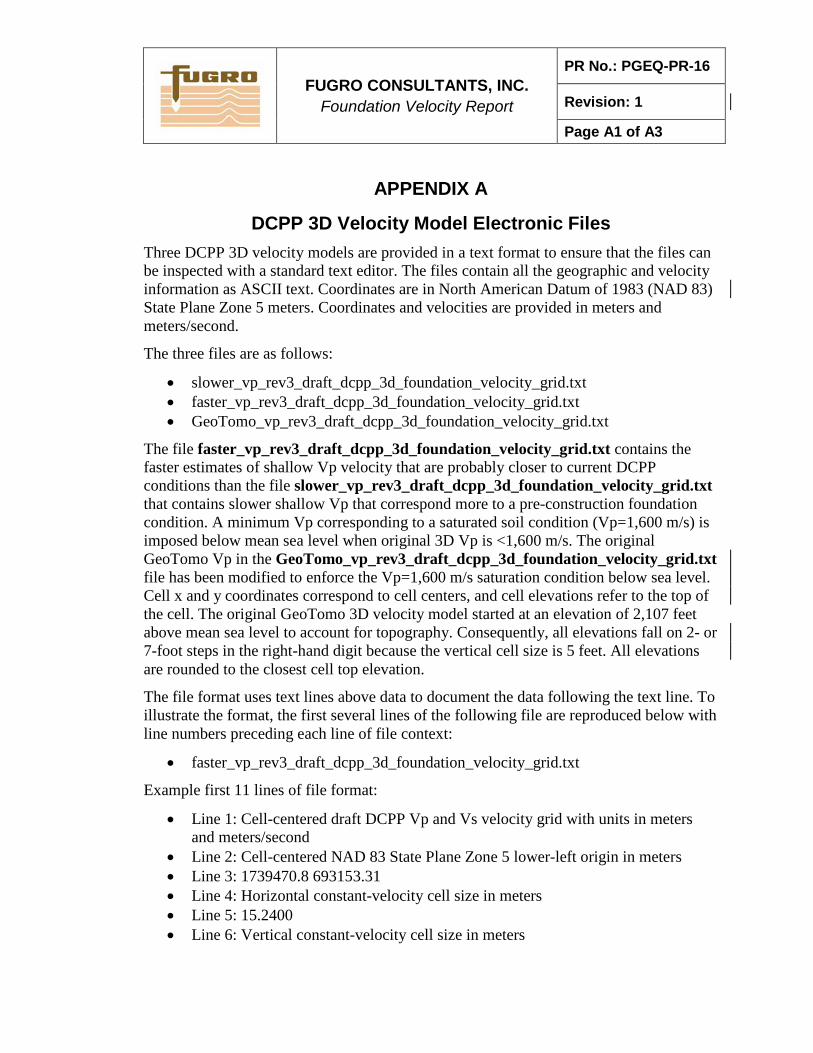
FUGRO CONSULTANTS, INC. Foundation Velocity Report
PR No.: PGEQ-PR-16
Revision: 1
Page A1 of A3
APPENDIX A
DCPP 3D Velocity Model Electronic Files Three DCPP 3D velocity models are provided in a text format to ensure that the files can be inspected with a standard text editor. The files contain all the geographic and velocity information as ASCII text. Coordinates are in North American Datum of 1983 (NAD 83) State Plane Zone 5 meters. Coordinates and velocities are provided in meters and meters/second.
The three files are as follows:
• slower_vp_rev3_draft_dcpp_3d_foundation_velocity_grid.txt • faster_vp_rev3_draft_dcpp_3d_foundation_velocity_grid.txt • GeoTomo_vp_rev3_draft_dcpp_3d_foundation_velocity_grid.txt
The file faster_vp_rev3_draft_dcpp_3d_foundation_velocity_grid.txt contains the faster estimates of shallow Vp velocity that are probably closer to current DCPP conditions than the file slower_vp_rev3_draft_dcpp_3d_foundation_velocity_grid.txt that contains slower shallow Vp that correspond more to a pre-construction foundation condition. A minimum Vp corresponding to a saturated soil condition (Vp=1,600 m/s) is imposed below mean sea level when original 3D Vp is <1,600 m/s. The original GeoTomo Vp in the GeoTomo_vp_rev3_draft_dcpp_3d_foundation_velocity_grid.txt file has been modified to enforce the Vp=1,600 m/s saturation condition below sea level. Cell x and y coordinates correspond to cell centers, and cell elevations refer to the top of the cell. The original GeoTomo 3D velocity model started at an elevation of 2,107 feet above mean sea level to account for topography. Consequently, all elevations fall on 2- or 7-foot steps in the right-hand digit because the vertical cell size is 5 feet. All elevations are rounded to the closest cell top elevation.
The file format uses text lines above data to document the data following the text line. To illustrate the format, the first several lines of the following file are reproduced below with line numbers preceding each line of file context:
• faster_vp_rev3_draft_dcpp_3d_foundation_velocity_grid.txt
Example first 11 lines of file format:
• Line 1: Cell-centered draft DCPP Vp and Vs velocity grid with units in meters and meters/second
• Line 2: Cell-centered NAD 83 State Plane Zone 5 lower-left origin in meters • Line 3: 1739470.8 693153.31 • Line 4: Horizontal constant-velocity cell size in meters • Line 5: 15.2400 • Line 6: Vertical constant-velocity cell size in meters
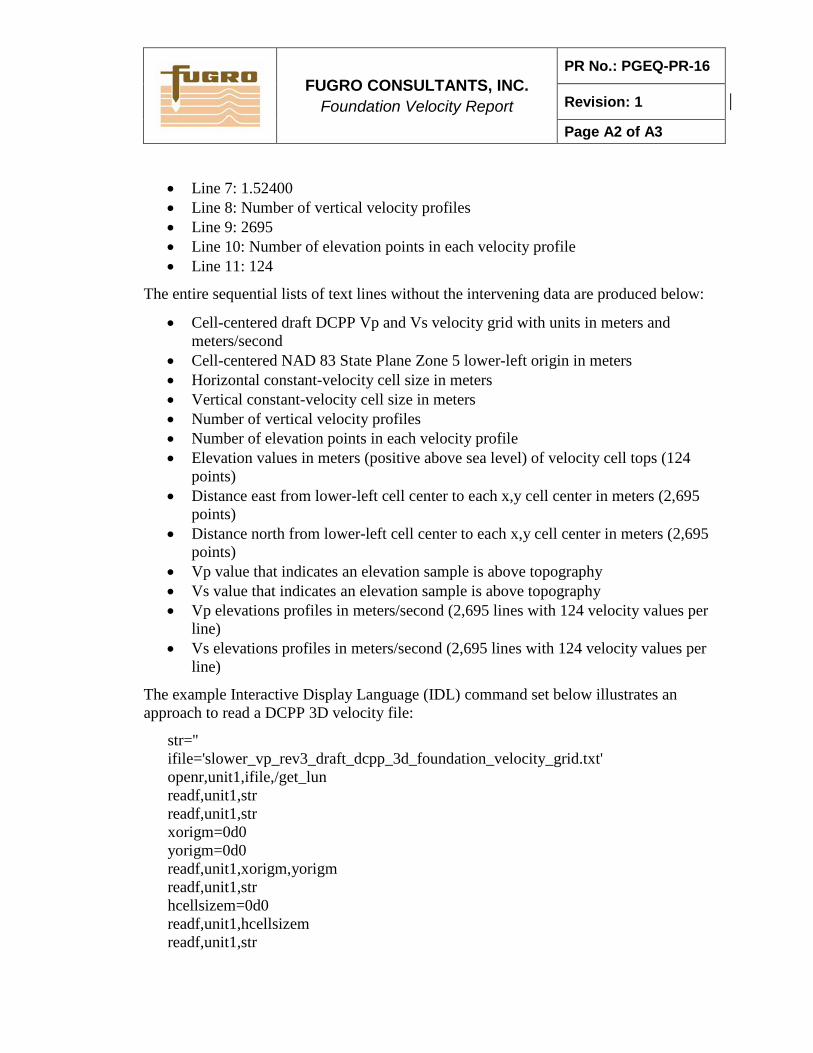
FUGRO CONSULTANTS, INC. Foundation Velocity Report
PR No.: PGEQ-PR-16
Revision: 1
Page A2 of A3
• Line 7: 1.52400 • Line 8: Number of vertical velocity profiles • Line 9: 2695 • Line 10: Number of elevation points in each velocity profile • Line 11: 124
The entire sequential lists of text lines without the intervening data are produced below:
• Cell-centered draft DCPP Vp and Vs velocity grid with units in meters and meters/second
• Cell-centered NAD 83 State Plane Zone 5 lower-left origin in meters • Horizontal constant-velocity cell size in meters • Vertical constant-velocity cell size in meters • Number of vertical velocity profiles • Number of elevation points in each velocity profile • Elevation values in meters (positive above sea level) of velocity cell tops (124
points) • Distance east from lower-left cell center to each x,y cell center in meters (2,695
points) • Distance north from lower-left cell center to each x,y cell center in meters (2,695
points) • Vp value that indicates an elevation sample is above topography • Vs value that indicates an elevation sample is above topography • Vp elevations profiles in meters/second (2,695 lines with 124 velocity values per
line) • Vs elevations profiles in meters/second (2,695 lines with 124 velocity values per
line)
The example Interactive Display Language (IDL) command set below illustrates an approach to read a DCPP 3D velocity file:
str='' ifile='slower_vp_rev3_draft_dcpp_3d_foundation_velocity_grid.txt' openr,unit1,ifile,/get_lun readf,unit1,str readf,unit1,str xorigm=0d0 yorigm=0d0 readf,unit1,xorigm,yorigm readf,unit1,str hcellsizem=0d0 readf,unit1,hcellsizem readf,unit1,str
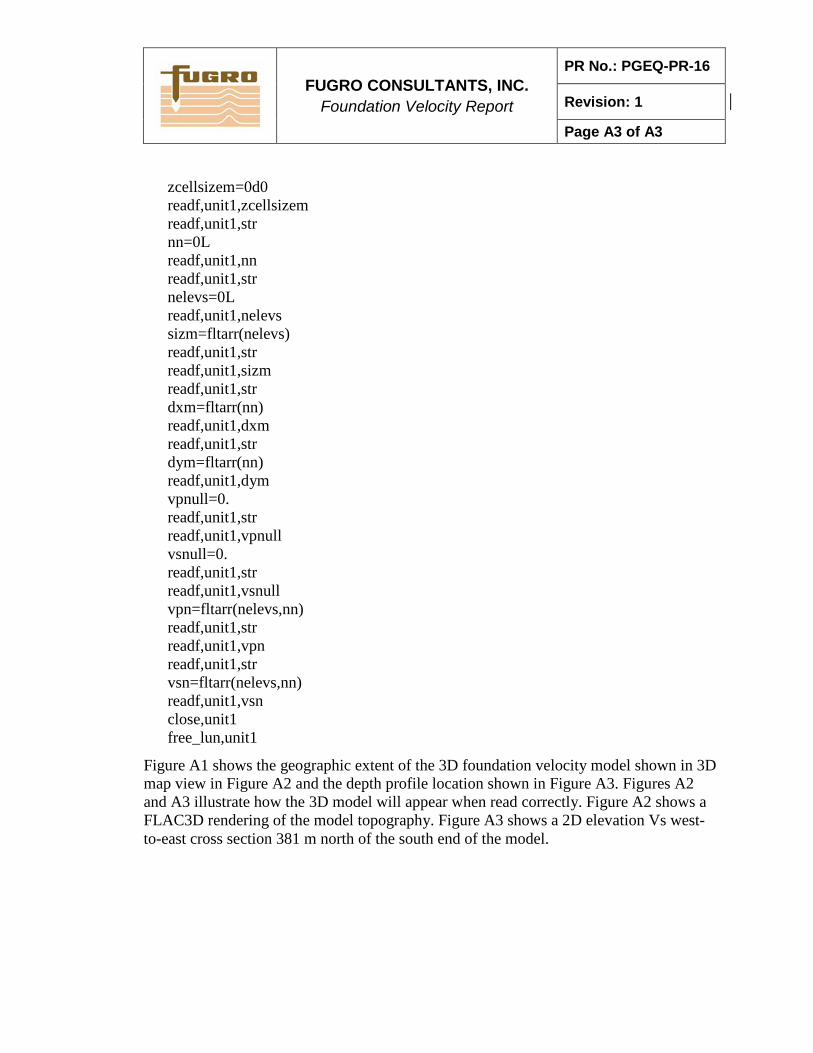
FUGRO CONSULTANTS, INC. Foundation Velocity Report
PR No.: PGEQ-PR-16
Revision: 1
Page A3 of A3
zcellsizem=0d0 readf,unit1,zcellsizem readf,unit1,str nn=0L readf,unit1,nn readf,unit1,str nelevs=0L readf,unit1,nelevs sizm=fltarr(nelevs) readf,unit1,str readf,unit1,sizm readf,unit1,str dxm=fltarr(nn) readf,unit1,dxm readf,unit1,str dym=fltarr(nn) readf,unit1,dym vpnull=0. readf,unit1,str readf,unit1,vpnull vsnull=0. readf,unit1,str readf,unit1,vsnull vpn=fltarr(nelevs,nn) readf,unit1,str readf,unit1,vpn readf,unit1,str vsn=fltarr(nelevs,nn) readf,unit1,vsn close,unit1 free_lun,unit1
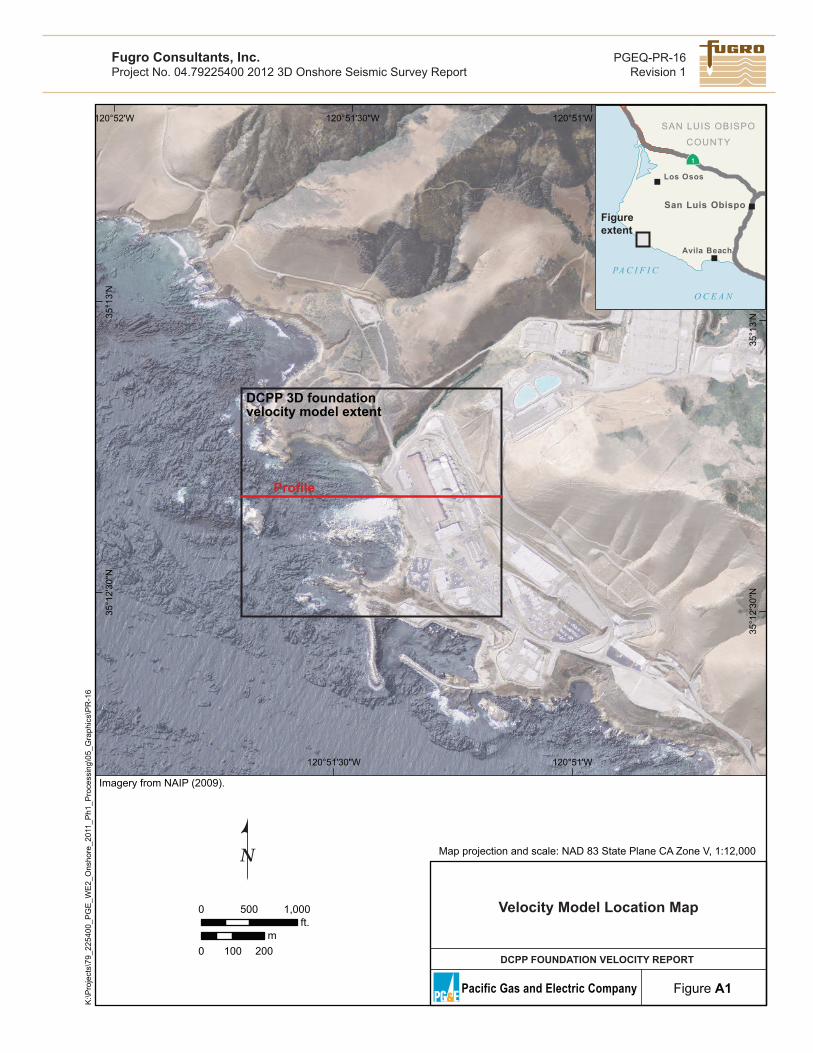
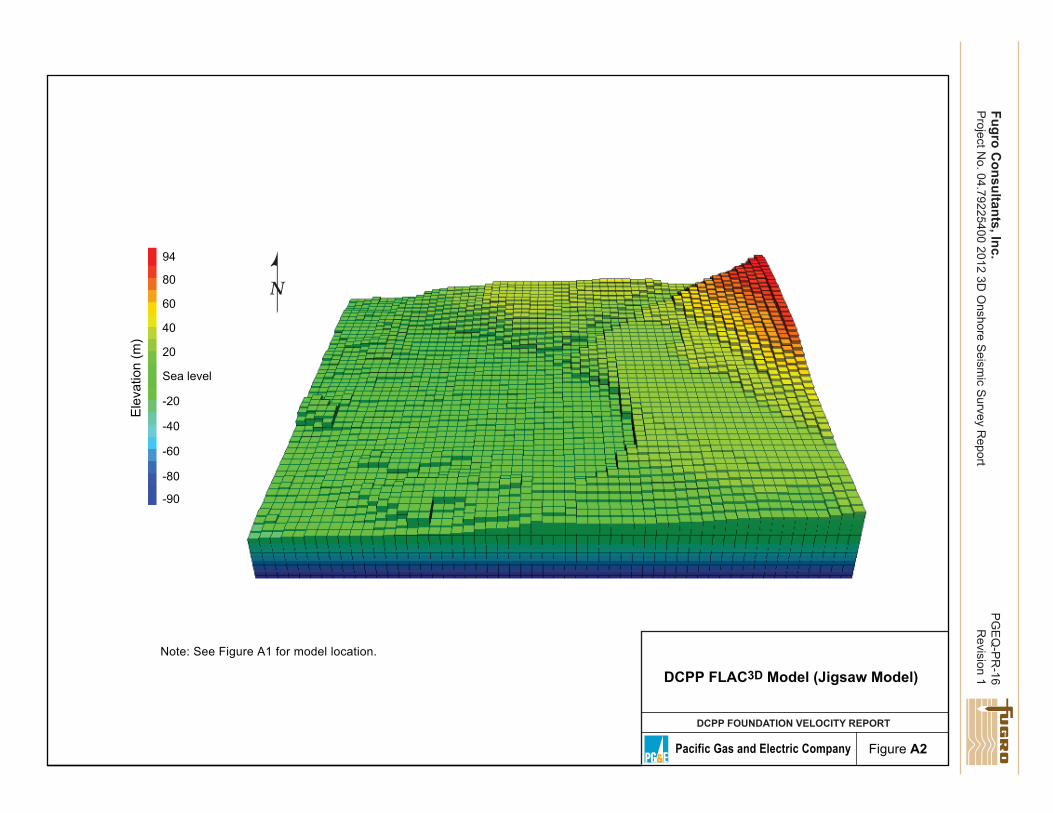
Figure A1 shows the geographic extent of the 3D foundation velocity model shown in 3D map view in Figure A2 and the depth profile location shown in Figure A3. Figures A2 and A3 illustrate how the 3D model will appear when read correctly. Figure A2 shows a FLAC3D rendering of the model topography. Figure A3 shows a 2D elevation Vs west-to-east cross section 381 m north of the south end of the model.
120°51'W
120°51'W
120°51'30"W
120°51'30"W120°52'W35
°13'
N
35°1
3'N
35°1
2'30
"N
35°1
2'30
"N
Velocity Model Location Map
DCPP FOUNDATION VELOCITY REPORT
Pacific Gas and Electric Company Figure A1
K:\P
roje
cts\
79_2
2540
0_P
GE
_WE
2_O
nsho
re_2
011_
Ph1
_Pro
cess
ing\
05_G
raph
ics\
PR
-16
Imagery from NAIP (2009).
0 500 1,000ft.
0 100 200m
Map projection and scale: NAD 83 State Plane CA Zone V, 1:12,000
DCPP 3D foundationvelocity model extent
Profile
Los Osos
Avila Beach
San Luis Obispo
SAN LUIS OBISPO
COUNTY
PA C I F I C
O C E A N
1
Figureextent
PGEQ-PR-16Revision 1
Fugro Consultants, Inc.Project No. 04.79225400 2012 3D Onshore Seismic Survey Report
Ele
vatio
n (m
)
94
80
60
40
20
-20
-40
-60
-80
-90
Sea level
Note: See Figure A1 for model location.
Figure A2Pacific Gas and Electric Company
DCPP FOUNDATION VELOCITY REPORT
DCPP FLAC3D Model (Jigsaw Model)
PG
EQ
-PR
-16R
evision 1Fugro C
onsultants, Inc.P
roject No. 04.79225400 2012 3D
Onshore S
eismic S
urvey Report
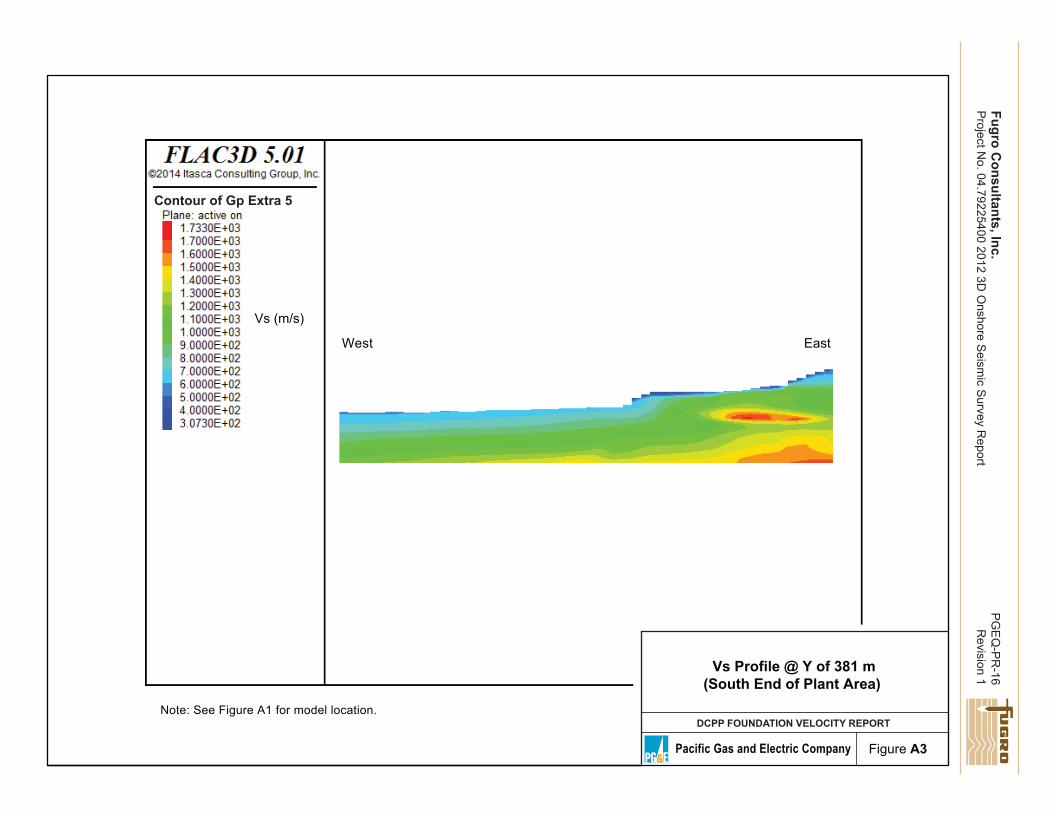
Vs (m/s)
West
Note: See Figure A1 for model location.
Contour of Gp Extra 5
East
Figure A3Pacific Gas and Electric Company
DCPP FOUNDATION VELOCITY REPORT
Vs Profile @ Y of 381 m(South End of Plant Area)
PG
EQ
-PR
-16R
evision 1Fugro C
onsultants, Inc.P
roject No. 04.79225400 2012 3D
Onshore S
eismic S
urvey Report
FUGRO CONSULTANTS, INC. Foundation Velocity Report
PR No.: PGEQ-PR-16
Revision: 1
APPENDIX B DCPP VS-DEPTH PROFILES ALONG TRANSECTS A-D
(Total 4-Figures)
CENTRAL COASTAL CALIFORNIA SEISMIC IMAGING PROJECT
Pacific Gas and Electric Company Figure B-1
PGEQ-PR-16Revision 1
Fugro Consultants, Inc.Project No. 04.79225400 2012 3D Onshore Seismic Survey Report
fwla
-lk-fi
le/D
ATA
/Pro
ject
s/79
_225
400_
PG
E_W
E2_
Ons
hore
_201
1_P
h1_P
roce
ssin
g/05
_Gra
phic
s/P
R-1
6/A
ppen
dix
B
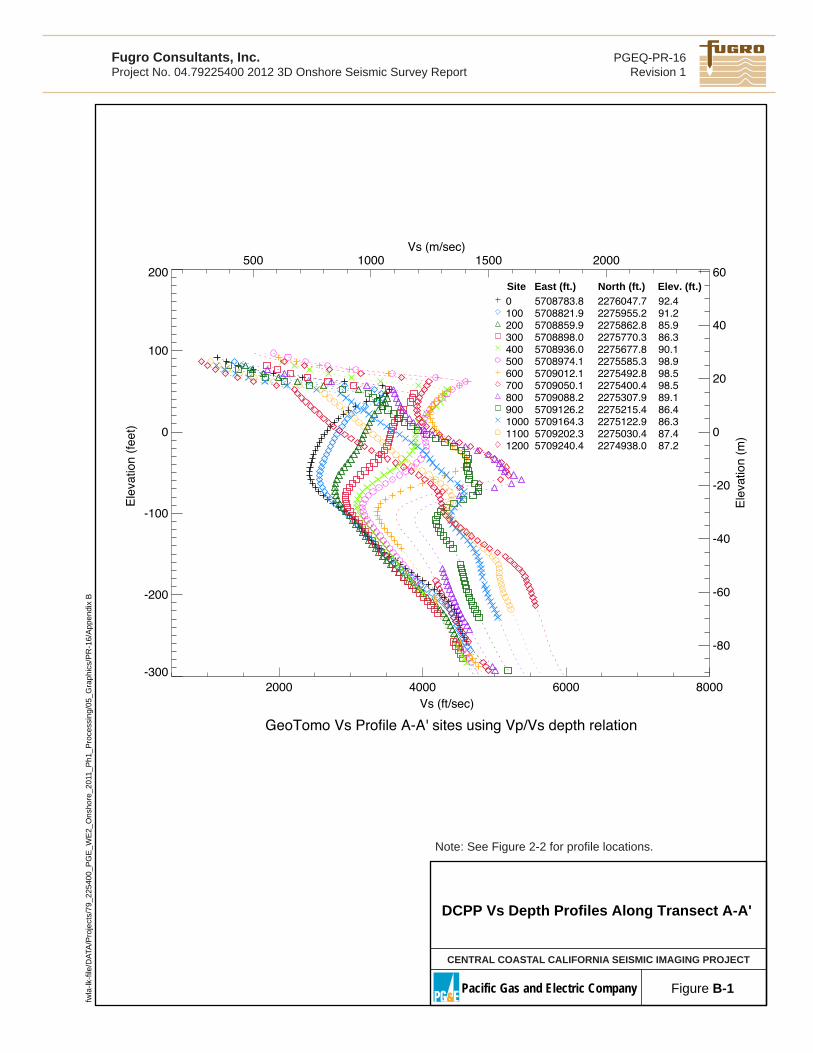
GeoTomo Vs Profile A-A' sites using Vp/Vs depth relation
2000 4000 6000 8000Vs (ft/sec)
-300
-200
-100
0
100
200
Ele
vatio
n (f
eet)
500 1000 1500 2000Vs (m/sec)
-80
-60
-40
-20
0
20
40
60
Ele
vatio
n (m
)
0 5708783.8 2276047.7 92.4100 5708821.9 2275955.2 91.2200 5708859.9 2275862.8 85.9300 5708898.0 2275770.3 86.3400 5708936.0 2275677.8 90.1500 5708974.1 2275585.3 98.9600 5709012.1 2275492.8 98.5700 5709050.1 2275400.4 98.5800 5709088.2 2275307.9 89.1900 5709126.2 2275215.4 86.41000 5709164.3 2275122.9 86.31100 5709202.3 2275030.4 87.41200 5709240.4 2274938.0 87.2
Site East (ft.) North (ft.) Elev. (ft.)
DCPP Vs Depth Profiles Along Transect A-A'
Note: See Figure 2-2 for profile locations.
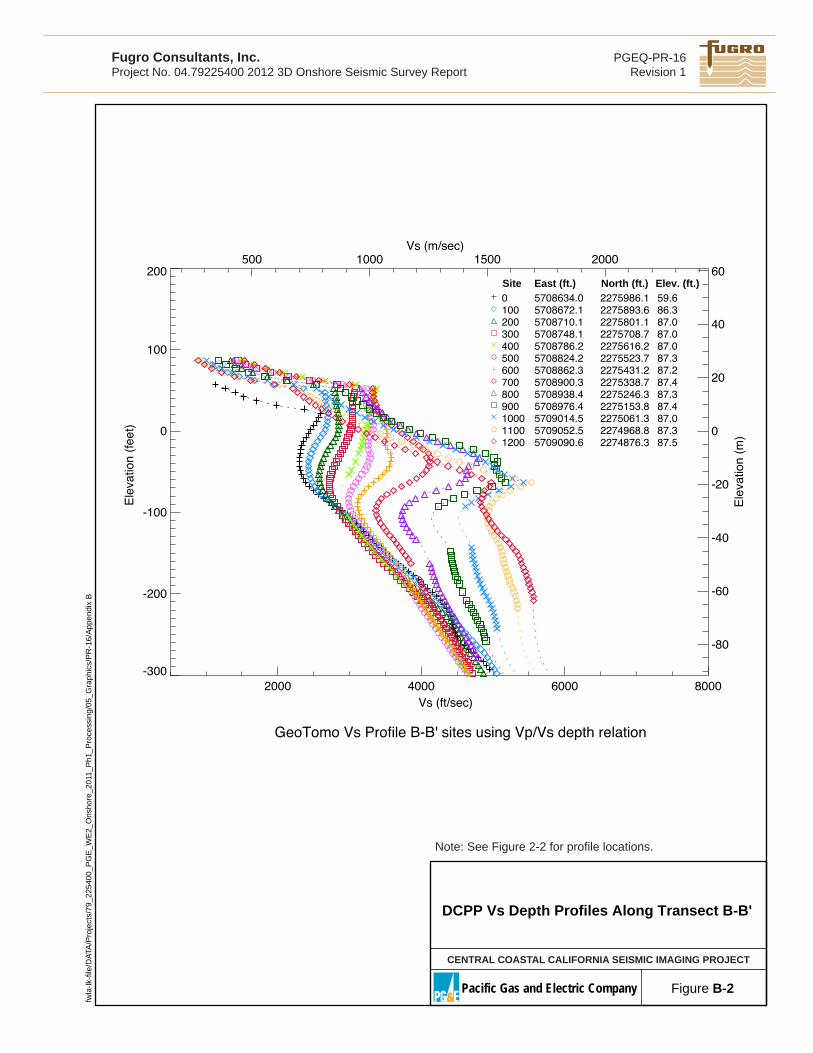
DCPP Vs Depth Profiles Along Transect B-B'
CENTRAL COASTAL CALIFORNIA SEISMIC IMAGING PROJECT
Pacific Gas and Electric Company Figure B-2
PGEQ-PR-16Revision 1
Fugro Consultants, Inc.Project No. 04.79225400 2012 3D Onshore Seismic Survey Report
GeoTomo Vs Profile B-B' sites using Vp/Vs depth relation
2000 4000 6000 8000Vs (ft/sec)
-300
-200
-100
0
100
200
Ele
vatio
n (f
eet)
500 1000 1500 2000Vs (m/sec)
-80
-60
-40
-20
0
20
40
60
Ele
vatio
n (m
)
Site East (ft.) North (ft.) Elev. (ft.)0 5708634.0 2275986.1 59.6100 5708672.1 2275893.6 86.3200 5708710.1 2275801.1 87.0300 5708748.1 2275708.7 87.0400 5708786.2 2275616.2 87.0500 5708824.2 2275523.7 87.3600 5708862.3 2275431.2 87.2700 5708900.3 2275338.7 87.4800 5708938.4 2275246.3 87.3900 5708976.4 2275153.8 87.41000 5709014.5 2275061.3 87.01100 5709052.5 2274968.8 87.31200 5709090.6 2274876.3 87.5
fwla
-lk-fi
le/D
ATA
/Pro
ject
s/79
_225
400_
PG
E_W
E2_
Ons
hore
_201
1_P
h1_P
roce
ssin
g/05
_Gra
phic
s/P
R-1
6/A
ppen
dix
B
Note: See Figure 2-2 for profile locations.
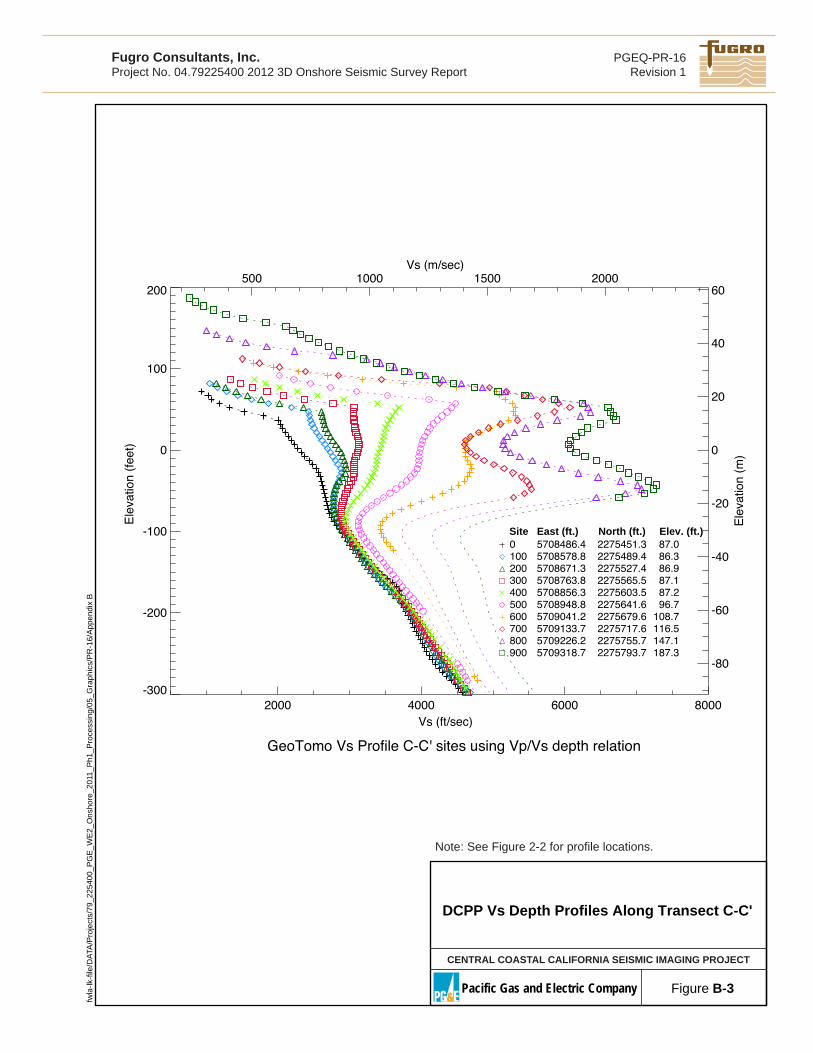
DCPP Vs Depth Profiles Along Transect C-C'
CENTRAL COASTAL CALIFORNIA SEISMIC IMAGING PROJECT
Pacific Gas and Electric Company Figure B-3
PGEQ-PR-16Revision 1
Fugro Consultants, Inc.Project No. 04.79225400 2012 3D Onshore Seismic Survey Report
GeoTomo Vs Profile C-C' sites using Vp/Vs depth relation
2000 4000 6000 8000Vs (ft/sec)
-300
-200
-100
0
100
200
Ele
vatio
n (f
eet)
500 1000 1500 2000Vs (m/sec)
-80
-60
-40
-20
0
20
40
60
Ele
vatio
n (m
)
900 5709318.7 2275793.7 187.3800 5709226.2 2275755.7 147.1700 5709133.7 2275717.6 116.5600 5709041.2 2275679.6 108.7500 5708948.8 2275641.6 96.7400 5708856.3 2275603.5 87.2300 5708763.8 2275565.5 87.1200 5708671.3 2275527.4 86.9100 5708578.8 2275489.4 86.30 5708486.4 2275451.3 87.0Site East (ft.) North (ft.) Elev. (ft.)
fwla
-lk-fi
le/D
ATA
/Pro
ject
s/79
_225
400_
PG
E_W
E2_
Ons
hore
_201
1_P
h1_P
roce
ssin
g/05
_Gra
phic
s/P
R-1
6/A
ppen
dix
B
Note: See Figure 2-2 for profile locations.
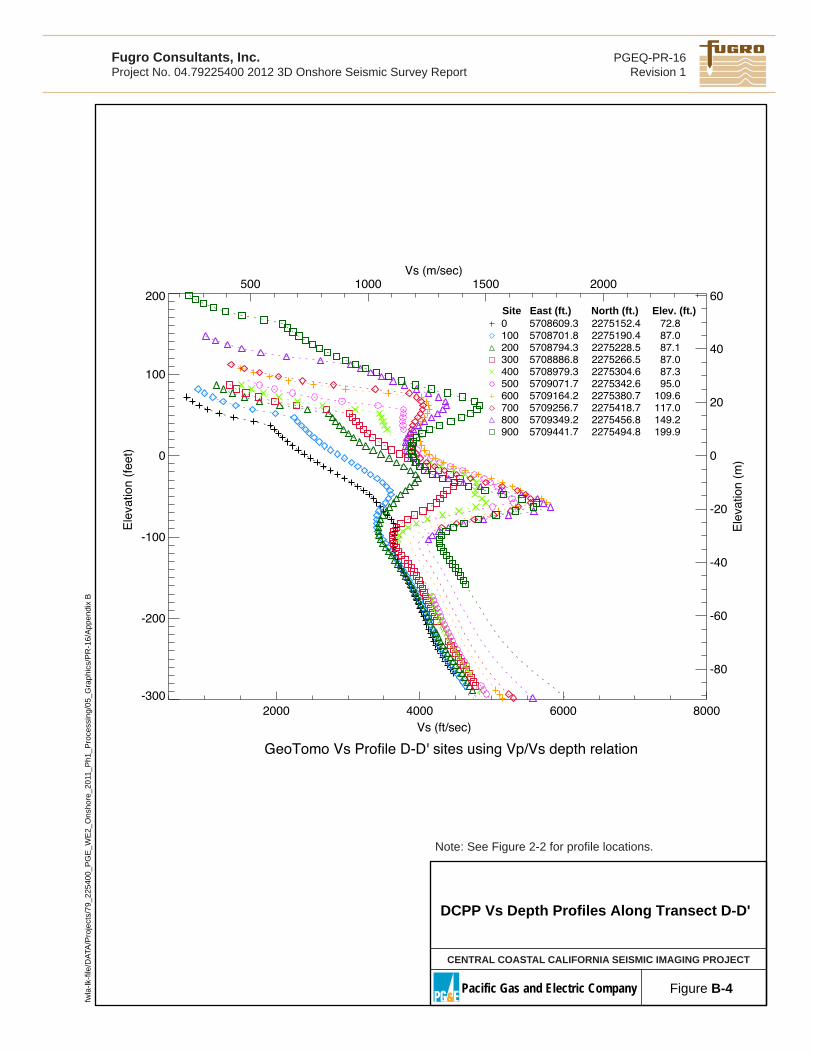
DCPP Vs Depth Profiles Along Transect D-D'
CENTRAL COASTAL CALIFORNIA SEISMIC IMAGING PROJECT
Pacific Gas and Electric Company Figure B-4
PGEQ-PR-16Revision 1
Fugro Consultants, Inc.Project No. 04.79225400 2012 3D Onshore Seismic Survey Report
GeoTomo Vs Profile D-D' sites using Vp/Vs depth relation
2000 4000 6000 8000Vs (ft/sec)
-300
-200
-100
0
100
200
Ele
vatio
n (f
eet)
500 1000 1500 2000Vs (m/sec)
-80
-60
-40
-20
0
20
40
60
Ele
vatio
n (m
)
0 5708609.3 2275152.4 72.8100 5708701.8 2275190.4 87.0200 5708794.3 2275228.5 87.1300 5708886.8 2275266.5 87.0400 5708979.3 2275304.6 87.3500 5709071.7 2275342.6 95.0600 5709164.2 2275380.7 109.6700 5709256.7 2275418.7 117.0800 5709349.2 2275456.8 149.2900 5709441.7 2275494.8 199.9
Site East (ft.) North (ft.) Elev. (ft.)
fwla
-lk-fi
le/D
ATA
/Pro
ject
s/79
_225
400_
PG
E_W
E2_
Ons
hore
_201
1_P
h1_P
roce
ssin
g/05
_Gra
phic
s/P
R-1
6/A
ppen
dix
B
Note: See Figure 2-2 for profile locations.