Embed Size (px)
Citation preview
42
Fuel Loading Pattern Optimization with Constraint on Fuel Assembly Inventory Using Quantum-Inspired Evolutionary Algorithm
M. Rizki Oktavian1, Alexander Agung1, Andang Widi Harto1 1Department of Nuclear Engineering and Engineering Physics, Universitas Gadjah Mada, Yogyakarta, Indonesia
Abstract. Nuclear fuel management was done by optimizing fuel loading pattern in a reactor core. Practically, performing fuel loading pattern optimization was difficult because of its combinatorial problem complexity which needed to be solved. Therefore, Quantum-inspired Evolutionary Algorithm (QEA) which could solve the combinatorial problem faster than conventional method was used. The main purpose of this research was to obtain an optimum fuel loading pattern of KSNP-1000 reactor core without altering fuel assembly inventories. KSNP-1000 core was modeled in SRAC code package using PIJ module for fuel pins and fuel assemblies’ lattices and CITATION module for fuel assemblies’ pattern in a quarter core symmetry. Optimization problem adaptation using QEA was made by presenting 52 fuel assemblies in Q-bit individuals with the length of 8 Q-bits. Q-bits were converted to corresponding bit values and then given weight which would be used as consideration to optimize the pattern. The optimization program was coupled with the SRAC neutronic code to obtain the values of effective multiplication factor (keff) and power peaking factor (PPF). The optimization was calculated based on fitness value which was a function of keff and PPF values with the particular weight factor. Using a rotation gate angle of Δθ=0.02π and a weight factor of w=0,041, fuel loading pattern optimization was done on 360 days burnup level. The optimization resulted in keff and PPF value of 1.11233 and 1.944 respectively. By calculating keff value on various burnup levels for the chosen core loading pattern, reactor cycle length obtained was 659 days with PPF at BOC was 2.19. Compared to the standard KSNP-1000 core which had 560 days of cycle length, the optimized core configuration increased 17.67% in cycle length. Keyword—Optimization; fuel loading pattern; QEA; cycle length; keff; PFF
1. Introduction Nuclear fuel management includes ways and considerations to decide things to do in order to control flux and reactivity of a reactor core and spatial power distribution and burn-up of nuclear fuels. It has purpose primarily to minimize operation cost of a nuclear power plant but fulfilling the operation requirement [1].
Generally, nuclear fuel management can be divided into two parts, out-of-core and in-core. Out-of-core fuel management focuses on questions “What to buy?” and “What to be reinserted to the core?” and multi-cycles planning [2]. On the contrary, in-core fuel management has an objective to decide loading pattern in the core, e.g., fresh fuels, spent fuels and burnable poisons and control rods location [1].
In-core fuel management is a problem need to be kept attention in the uses of nuclear energy. Practically, it is done by optimizing fuel loading pattern in a reactor core.
An optimum condition in the reactor core can be achieved by looking at its cycle length and power distribution.
Optimization in the nuclear reactor core can be quantified by its effective multiplication factor (keff) for certain burnup step. Besides, safety factor must also be considered since optimization may affect the power distribution. For safety reason, PPF or power peaking factor must be used as a constraint in optimizing reactor core. The power peaking factor in the nuclear reactor is defined as the ratio of maximum power to average power in the reactor core. The best PPF is unity, means that all power generation perfectly distributed in the core with exact value.
Practically, fuel loading pattern optimization is difficult to be done because of the excessive numbers of fuel assemblies in a nuclear reactor. In a standard PWR, at least there is more than 1025 combination to try. The combinatorial problem then will be complicated and need a bunch of time if it is done using conventional algorithm [3].
E3S Web of Conferences 42, 01007 (2018) https://doi.org/10.1051/e3sconf/20184201007ASTECHNOVA 2016
© The Authors, published by EDP Sciences. This is an open access article distributed under the terms of the Creative Commons Attribution License 4.0 (http://creativecommons.org/licenses/by/4.0/).
43
Evolutionary Algorithm (EA) is one kind of algorithm used to solve loading pattern (LP) optimization in a nuclear reactor. Basically, EA is an optimization method and stochastic searching tool based on natural biological evolution. Compared to that conventional method, e.g., calculus-based and enumerative strategic, EA is more robust, global and applicable to most of the cases [4], [5].
Along with the EA, quantum computing also shows a great attention in the world as a modern computation method. Quantum computing is a result of an interdisciplinary study of computer science and quantum physics [6]. Because of its strength and fast working ability, a lot of researches and developments happened in quantum mechanics computer since its introduction on the 1980s [5 , [7].
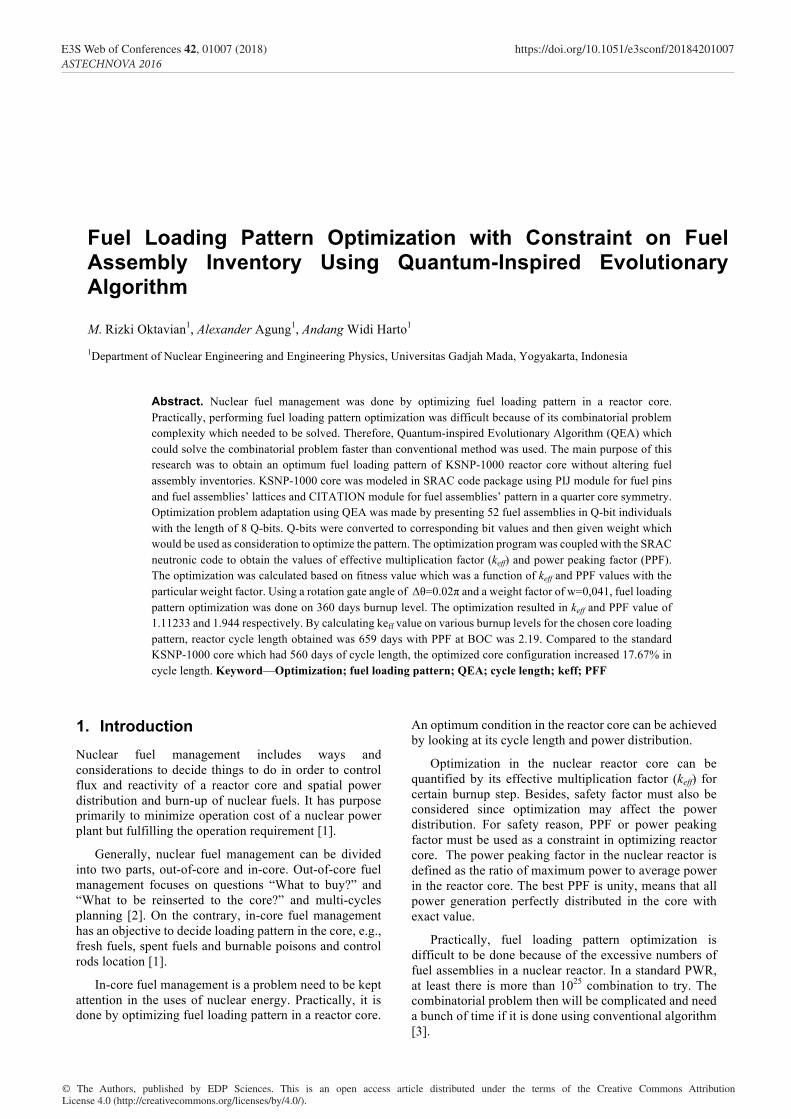
Compared to Genetic Algorithm (GA), a former evolutionary algorithm, Quantum-Inspired Evolutionary Algorithm (QEA) produces better performance with a lesser amount of calculations [3]. However, QEA is not a quantum algorithm, but it is a shape of EA adapted with quantum computing on a digital computer. Adaptation of quantum computing in metaheuristic method of QEA is predicted to afford faster computation and more accurate solution of the combinatorial problem [5]. The explanation of QEA origin can be illustrated in Fig.1.
Fig. 1. QEA illustration on the digital computer [4].
A comparison of GA and QEA methods was conducted by performing both algorithms on Knapsack problems [6]. The experiment resulted that on 100 items, both algorithms showed the same value for every problem. However, on 500 items case, QEA performed better result than GA [6].
QEA method was also successfully performed to optimize Brazilian Pressurized Water Reactor (PWR) nuclear power plant, Angra 1 [1]. The calculation indicated that QEA produced a better result with a lesser amount of evaluations (70,400 evaluation) than classical metaheuristic optimization methods. Moreover, compared with another quantum-inspired method, Quantum Population-Based Incremental Learning (QPBIL), QEA resulted a higher average of boron concentration.
Quantum computing uses the smallest unit to store information, named quantum bit or Q-bit [4]. A Q-bit can be in a state of “1” or “0” or even superposition of both. The State of Q-bit can be described as :
𝛹𝛹 = 𝛼𝛼 0 + 𝛽𝛽 1 (1)
where α and β are complex numbers indicating a probability of a related state. 𝛼𝛼 (, on one hand, expresses a probability that Q-bit will be found in the state of “0” and 𝛽𝛽 (, on the other hand, the express probability of Q-bit to be found in state of “1” [4]. Normalization of both in a unity condition produces:
𝛼𝛼 ( + 𝛽𝛽 ( = 1 (2)
Q-bit can be altered by an operator named quantum gate or Q-gate [4]. Q-gate is a reversible computation operator to make Q-bit update process fulfilling normalization condition as stated on Equation (2). Q-gate used in QEA is stated as follow:
𝑈𝑈 𝛥𝛥𝛥𝛥,cos 𝛥𝛥𝛥𝛥, − sin 𝛥𝛥𝛥𝛥,sin 𝛥𝛥𝛥𝛥, cos 𝛥𝛥𝛥𝛥,
(3)
with θi, i= 1, 2, 3, …, is a rotation angle of each Q-bit to “0” or “1” state based on its sign. Rotation angle increment, Δθi, must be designed to adapt the case. Based on some works, the value of Δθi is recommended in the range of 0,001 to 0,05 [5].
When performing optimization, QEA updates the objective function value each time the higher value found and migrate it to the result. When the migration conducts between individual (a series of Q-bits) in a population (a group of individuals), it is called local migration. When it happens to the population of the same generation (a time step of repetition), it is named global migration.
Basically, the optimization of keff and PPF is a multiobjective problem. We want keff as high as possible while PPF as low as possible, within constraints. However, to simplify the calculation, the multiobjective optimization can be transformed into a single objective optimization problem. This can be done by introducing a fitness variable which connects the parameters involved. In our optimization problem, the fitness function uses PPF as penalty component to compromise the value of keff. Value of fitness as the objective function is stated as follow:
fitness = keff – w x ΔPPF (4)
with
ΔPPF = PPF – PPFstandard (5)
where w is the function’s weight factor. The value of PPFstandard is set to 2, obtained from technical data of KSNP-1000 as reported in the BATAN/KEPCO document in 1997 [9].
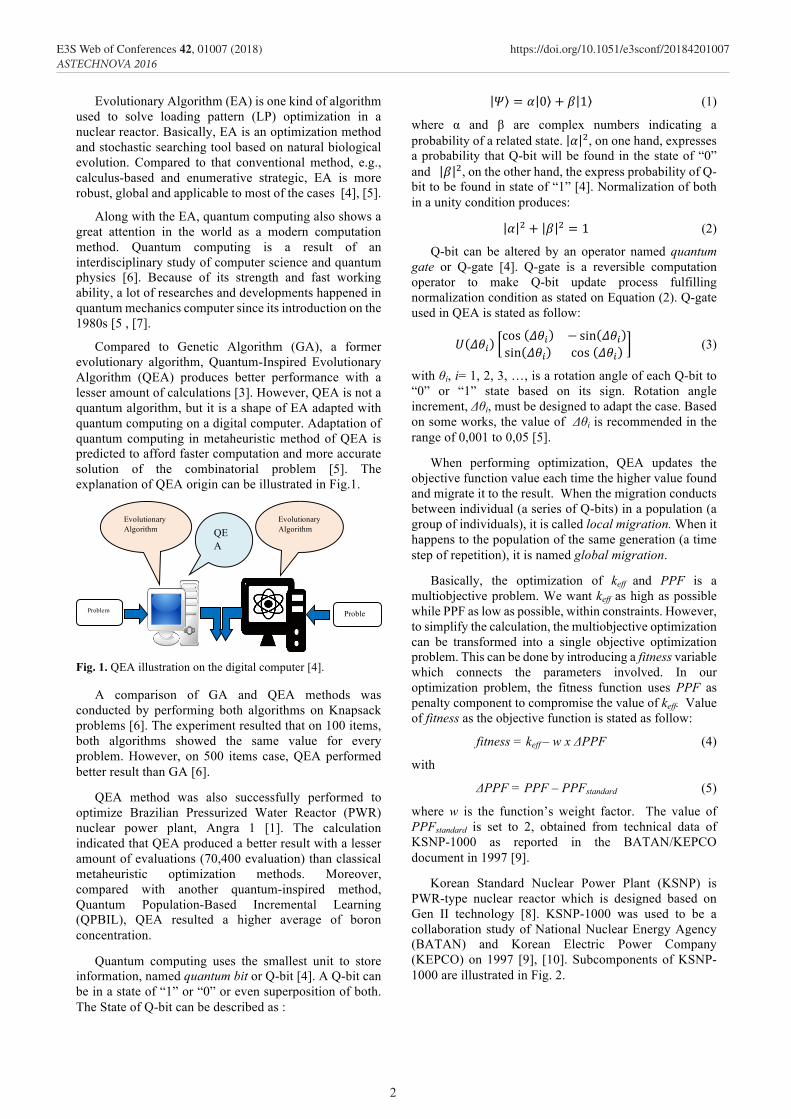
Korean Standard Nuclear Power Plant (KSNP) is PWR-type nuclear reactor which is designed based on Gen II technology [8]. KSNP-1000 was used to be a collaboration study of National Nuclear Energy Agency (BATAN) and Korean Electric Power Company (KEPCO) on 1997 [9], [10]. Subcomponents of KSNP-1000 are illustrated in Fig. 2.
Problem Problem
Evolutionary Algorithm
Evolutionary Algorithm QE
A
2
E3S Web of Conferences 42, 01007 (2018) https://doi.org/10.1051/e3sconf/20184201007ASTECHNOVA 2016
44
Fig. 2. Subcomponents of KSNP-1000.
Neutronic computation on KSNP-1000 fuels was performed using SRAC95 code system [8]. The computation resulted in the conclusion that multiplication factor of KSNP-1000 core is affected by the amount of U235 enrichment proportionally. Based on the same work, the best enrichment of KSNP-1000 fuel is 5% resulted in 47,000 MW-day/ton of burn-up and 1.01140 of keff [8].
KSNP-100 optimization had been conducted using GA method with only three types of fuel rods. They were enriched with 1.5%, 2.5% and 3% of 235U. The numbers of each type of fuel can be altered in each optimization step [9,10]. However, the model used in work was not the based on the standard core of KSNP-1000 in types and numbers of fuel assemblies. Therefore, to get the accurate result of KSNP-1000 optimization, a model based on actual reactor core must be used. Moreover, fixed fuel assemblies have to be considered as well.
Based on those considerations, using QEA method, the optimization performed in purpose to obtain the core configuration of KSNP-1000 which offering longest cycle length and flattest power distribution with a constraint on fixed amount and type of KSNP-1000’s fuel assemblies.
Fig. 3. Fuel assemblies’ homogenization to be used in SRAC.
2. Method
2.1 Standard Model Design
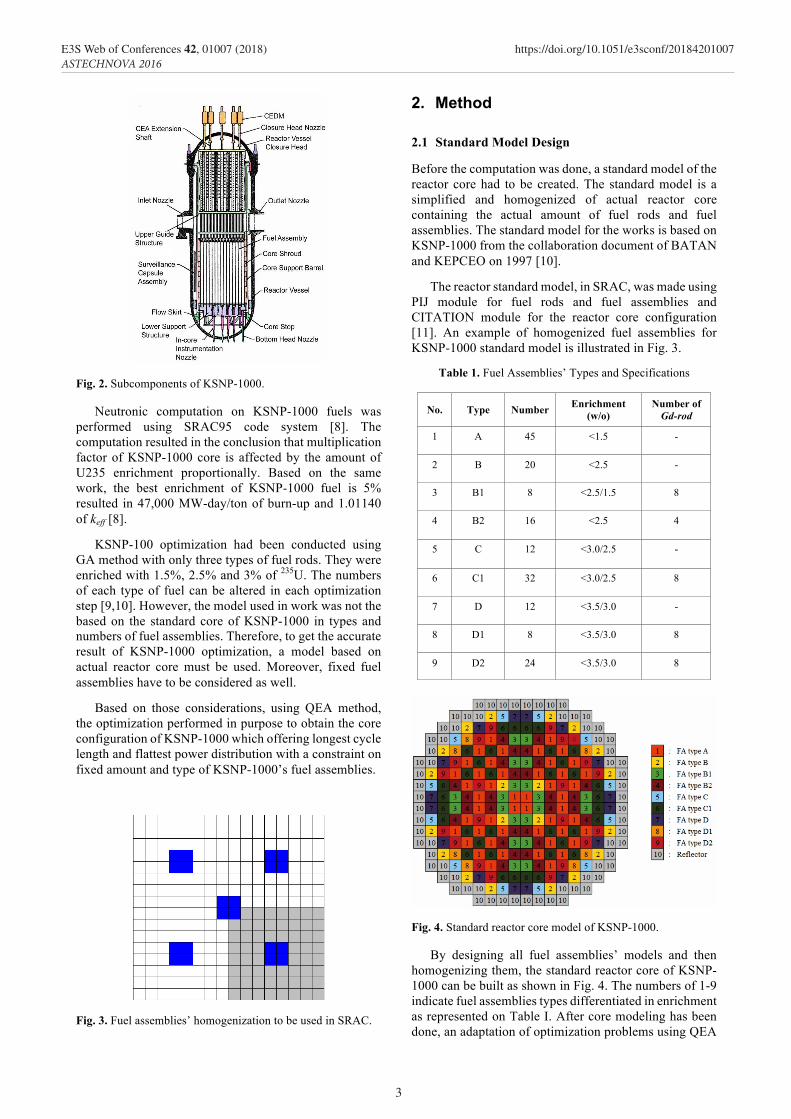
Before the computation was done, a standard model of the reactor core had to be created. The standard model is a simplified and homogenized of actual reactor core containing the actual amount of fuel rods and fuel assemblies. The standard model for the works is based on KSNP-1000 from the collaboration document of BATAN and KEPCEO on 1997 [10].
The reactor standard model, in SRAC, was made using PIJ module for fuel rods and fuel assemblies and CITATION module for the reactor core configuration [11]. An example of homogenized fuel assemblies for KSNP-1000 standard model is illustrated in Fig. 3.
Table 1. Fuel Assemblies’ Types and Specifications
No. Type Number Enrichment (w/o)
Number of Gd-rod
1 A 45 <1.5 -
2 B 20 <2.5 -
3 B1 8 <2.5/1.5 8
4 B2 16 <2.5 4
5 C 12 <3.0/2.5 -
6 C1 32 <3.0/2.5 8
7 D 12 <3.5/3.0 -
8 D1 8 <3.5/3.0 8
9 D2 24 <3.5/3.0 8
Fig. 4. Standard reactor core model of KSNP-1000.
By designing all fuel assemblies’ models and then homogenizing them, the standard reactor core of KSNP-1000 can be built as shown in Fig. 4. The numbers of 1-9 indicate fuel assemblies types differentiated in enrichment as represented on Table I. After core modeling has been done, an adaptation of optimization problems using QEA
3
E3S Web of Conferences 42, 01007 (2018) https://doi.org/10.1051/e3sconf/20184201007ASTECHNOVA 2016
45
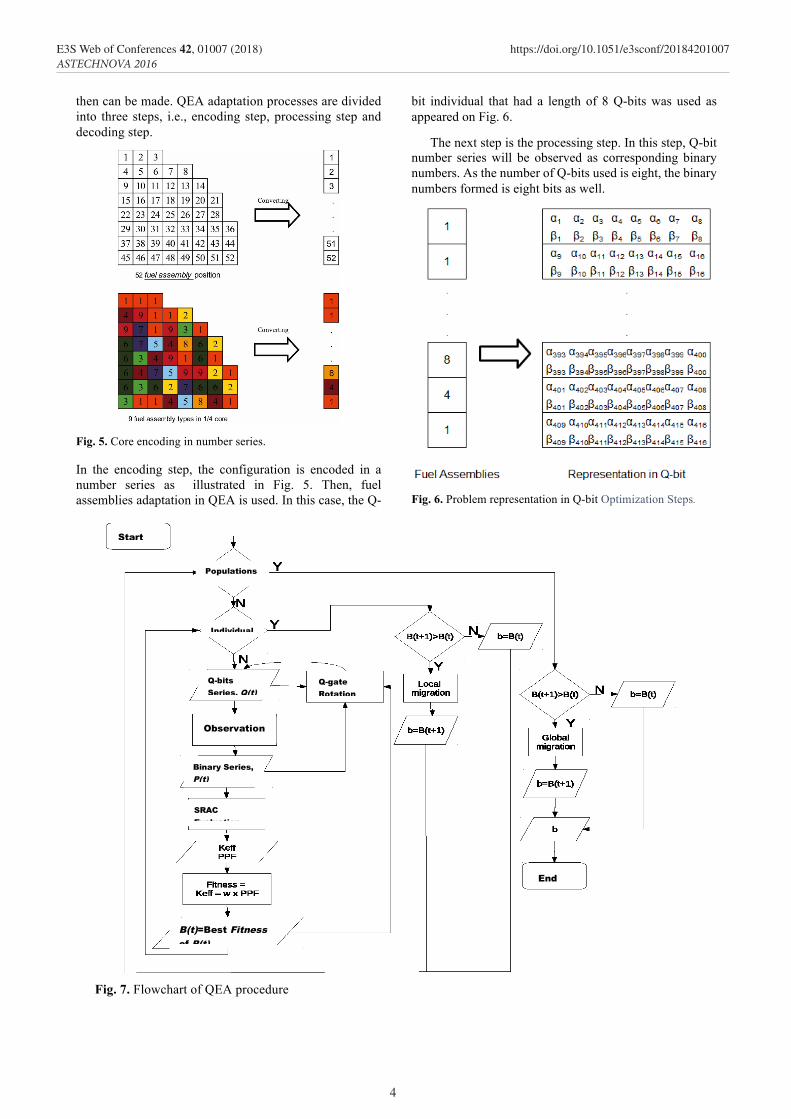
then can be made. QEA adaptation processes are divided into three steps, i.e., encoding step, processing step and decoding step.
Fig. 5. Core encoding in number series.
In the encoding step, the configuration is encoded in a number series as illustrated in Fig. 5. Then, fuel assemblies adaptation in QEA is used. In this case, the Q-
bit individual that had a length of 8 Q-bits was used as appeared on Fig. 6.
The next step is the processing step. In this step, Q-bit number series will be observed as corresponding binary numbers. As the number of Q-bits used is eight, the binary numbers formed is eight bits as well.
Fig. 6. Problem representation in Q-bit Optimization Steps.
Fig. 7. Flowchart of QEA procedure
Start
Populations
SRAC Evaluation
B(t)=Best Fitness of P(t)
Q-bits Series, Q(t)
Binary Series, P(t)
Observation
Individual
Q-gate Rotation
End
4
E3S Web of Conferences 42, 01007 (2018) https://doi.org/10.1051/e3sconf/20184201007ASTECHNOVA 2016
46
A fuel assembly can be represented as a weight value of assembly order, v. The value of v is used as a weight to sort the fuel assemblies’ order.
In a generation, each population’s b value will be compared. If the value is greater, then global migration happens and the b value is replaced by the highest value.
The decoding step process is a reverse of encoding step. In this step, conversion is done from Q-bit series back to fuel assemblies. Firstly, Q-bits pair series is observed to be eight bits binary number series. The binary numbers then are weighted proportionally to certain integers. The flowchart of QEA procedure is illustrated in Fig. 7
3. Result and Discussion
3.1 Determining Rotation Angle, Δθ
In the Δθ value determination to suit the optimation problem, population numbers of 10 and termination parameter, γ0=0.9 were used. The Δθ variation used are 0.01π, 0.02π and 0.05π. The optimization program was run for 30 times, and the best, mean and worst value were searched. Repetition amount of 30 times minimum is suggested to get best, mean and worst value which is statistically fine [5].
Based on Fig. 8, mean fitness evolution ratio can be achieved by each Δθ variation. The highest fitness from Δθ=0.01π is 1.107, obtained after 260 generations. This is a too-large generation to achieve convergence. On the other hand, for Δθ=0.02π, the convergence generation is only 160 and for Δθ=0.05π was far shorter, i.e., 60 generations.
Fig. 8. Evolution of mean fitness for each Δθ variations.
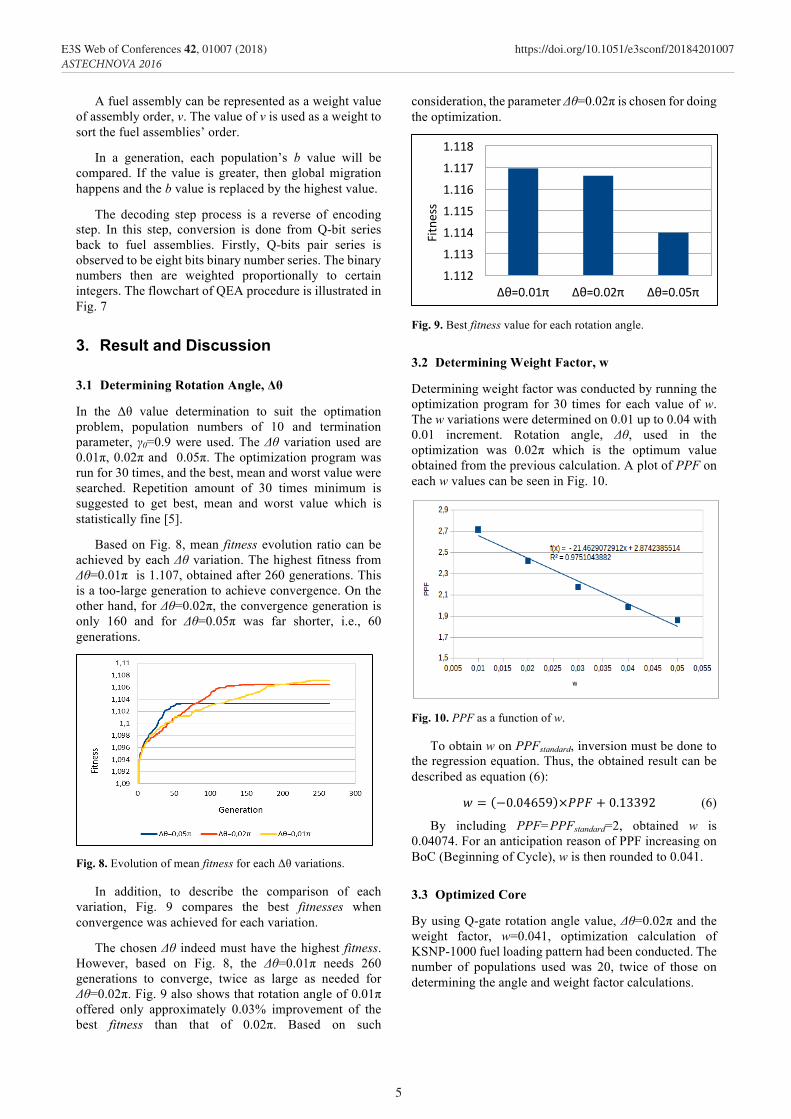
In addition, to describe the comparison of each variation, Fig. 9 compares the best fitnesses when convergence was achieved for each variation.
The chosen Δθ indeed must have the highest fitness. However, based on Fig. 8, the Δθ=0.01π needs 260 generations to converge, twice as large as needed for Δθ=0.02π. Fig. 9 also shows that rotation angle of 0.01π offered only approximately 0.03% improvement of the best fitness than that of 0.02π. Based on such
consideration, the parameter Δθ=0.02π is chosen for doing the optimization.
Fig. 9. Best fitness value for each rotation angle.
3.2 Determining Weight Factor, w
Determining weight factor was conducted by running the optimization program for 30 times for each value of w. The w variations were determined on 0.01 up to 0.04 with 0.01 increment. Rotation angle, Δθ, used in the optimization was 0.02π which is the optimum value obtained from the previous calculation. A plot of PPF on each w values can be seen in Fig. 10.
Fig. 10. PPF as a function of w.
To obtain w on PPFstandard, inversion must be done to the regression equation. Thus, the obtained result can be described as equation (6):
𝑤𝑤 = −0.04659 ×𝑃𝑃𝑃𝑃𝑃𝑃 + 0.13392 (6)
By including PPF=PPFstandard=2, obtained w is 0.04074. For an anticipation reason of PPF increasing on BoC (Beginning of Cycle), w is then rounded to 0.041.
3.3 Optimized Core
By using Q-gate rotation angle value, Δθ=0.02π and the weight factor, w=0.041, optimization calculation of KSNP-1000 fuel loading pattern had been conducted. The number of populations used was 20, twice of those on determining the angle and weight factor calculations.
Δθ=0.01π Δθ=0.02π Δθ=0.05π1.112
1.113
1.114
1.115
1.116
1.117
1.118
Fitness
5
E3S Web of Conferences 42, 01007 (2018) https://doi.org/10.1051/e3sconf/20184201007ASTECHNOVA 2016
47
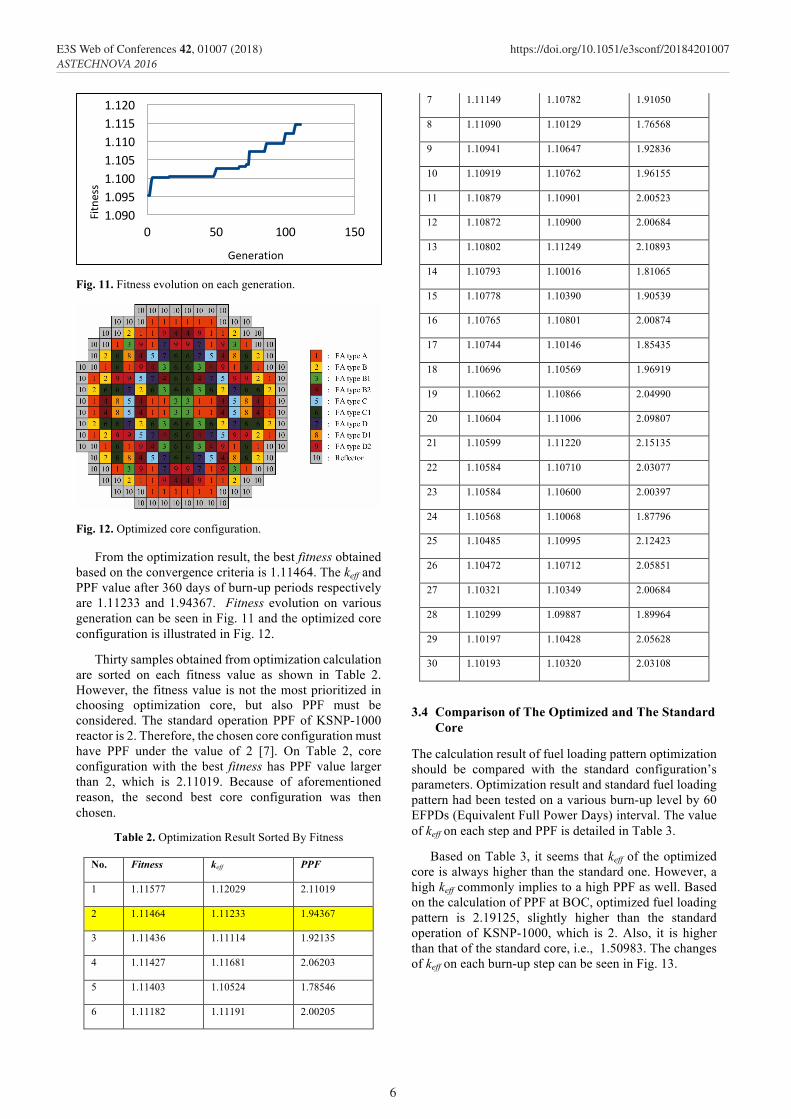
Fig. 11. Fitness evolution on each generation.
Fig. 12. Optimized core configuration.
From the optimization result, the best fitness obtained based on the convergence criteria is 1.11464. The keff and PPF value after 360 days of burn-up periods respectively are 1.11233 and 1.94367. Fitness evolution on various generation can be seen in Fig. 11 and the optimized core configuration is illustrated in Fig. 12.
Thirty samples obtained from optimization calculation are sorted on each fitness value as shown in Table 2. However, the fitness value is not the most prioritized in choosing optimization core, but also PPF must be considered. The standard operation PPF of KSNP-1000 reactor is 2. Therefore, the chosen core configuration must have PPF under the value of 2 [7]. On Table 2, core configuration with the best fitness has PPF value larger than 2, which is 2.11019. Because of aforementioned reason, the second best core configuration was then chosen.
Table 2. Optimization Result Sorted By Fitness
No. Fitness keff PPF
1 1.11577 1.12029 2.11019
2 1.11464 1.11233 1.94367
3 1.11436 1.11114 1.92135
4 1.11427 1.11681 2.06203
5 1.11403 1.10524 1.78546
6 1.11182 1.11191 2.00205
7 1.11149 1.10782 1.91050
8 1.11090 1.10129 1.76568
9 1.10941 1.10647 1.92836
10 1.10919 1.10762 1.96155
11 1.10879 1.10901 2.00523
12 1.10872 1.10900 2.00684
13 1.10802 1.11249 2.10893
14 1.10793 1.10016 1.81065
15 1.10778 1.10390 1.90539
16 1.10765 1.10801 2.00874
17 1.10744 1.10146 1.85435
18 1.10696 1.10569 1.96919
19 1.10662 1.10866 2.04990
20 1.10604 1.11006 2.09807
21 1.10599 1.11220 2.15135
22 1.10584 1.10710 2.03077
23 1.10584 1.10600 2.00397
24 1.10568 1.10068 1.87796
25 1.10485 1.10995 2.12423
26 1.10472 1.10712 2.05851
27 1.10321 1.10349 2.00684
28 1.10299 1.09887 1.89964
29 1.10197 1.10428 2.05628
30 1.10193 1.10320 2.03108
3.4 Comparison of The Optimized and The Standard Core
The calculation result of fuel loading pattern optimization should be compared with the standard configuration’s parameters. Optimization result and standard fuel loading pattern had been tested on a various burn-up level by 60 EFPDs (Equivalent Full Power Days) interval. The value of keff on each step and PPF is detailed in Table 3.
Based on Table 3, it seems that keff of the optimized core is always higher than the standard one. However, a high keff commonly implies to a high PPF as well. Based on the calculation of PPF at BOC, optimized fuel loading pattern is 2.19125, slightly higher than the standard operation of KSNP-1000, which is 2. Also, it is higher than that of the standard core, i.e., 1.50983. The changes of keff on each burn-up step can be seen in Fig. 13.
0 50 100 1501.0901.0951.1001.1051.1101.1151.120
Generation
Fitness
6
E3S Web of Conferences 42, 01007 (2018) https://doi.org/10.1051/e3sconf/20184201007ASTECHNOVA 2016
48
Table 3. Standard and Optimized Core’s Keff and PPF
EFPD Optimized Standard
keff PPF keff PPF
0 1.26905 2.191 1.21210 1.510
60 1.22895 2.004 1.18239 1.447
120 1.21394 1.994 1.16869 1.643
180 1.18718 1.955 1.14202 1.661
240 1.16108 1.961 1.11612 1.666
300 1.13616 1.966 1.09150 1.667
360 1.11233 1.944 1.06808 1.663
420 1.08943 1.980 1.04569 1.659
480 1.06732 1.987 1.02422 1.644
540 1.04590 1.992 1.00538 1.624
600 1.02512 1.995 0.98373 1.598
660 1.00496 1.996 0.96478 1.608
720 0.98540 1.994 0.94568 1.653
Fig. 13. Changes of keff on each burn-up level.
To obtain the cycle length on the standard model, first, inversion on regression function of the standard model must be done to get the burn-up function in keff. The relation between keff and burnup can be written as
𝑏𝑏𝑏𝑏𝑏𝑏𝑏𝑏𝑏𝑏𝑢𝑢 = −2702.7027 ×𝑘𝑘FGG + 3262.67568 (7)
By setting keff equals to 1, then we have the cycle length of the standard configuration of 560 EFPDs.
Using the same way, the optimized core regression function is inverted to have a burn-up function in keff like that of Equation (8).
𝑏𝑏𝑏𝑏𝑏𝑏𝑏𝑏𝑏𝑏𝑢𝑢 = −2564.10256 ×𝑘𝑘FGG + 3223.2564 (8)
Again, by setting keff equals to1, the obtained cycle length of the optimized fuel loading pattern is 659 EFPDs. Relative comparison of cycle length and PPF at BOC for the standard model and the optimized core is shown in Fig. 14.
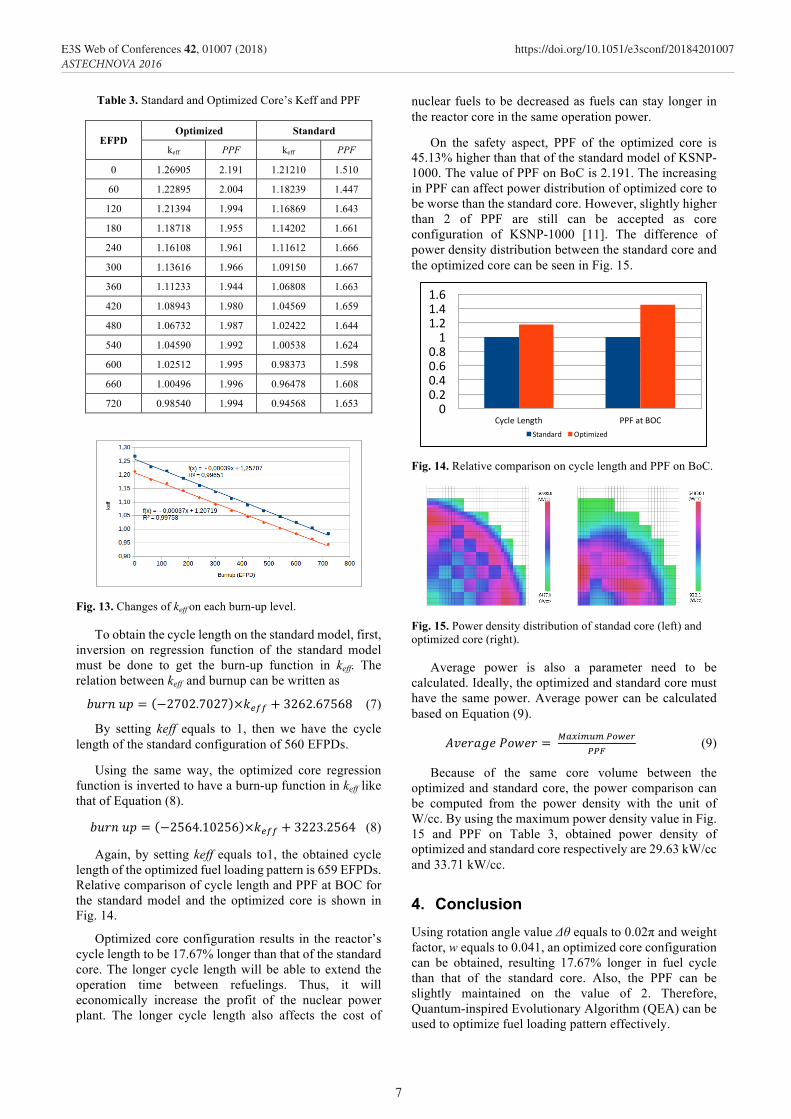
Optimized core configuration results in the reactor’s cycle length to be 17.67% longer than that of the standard core. The longer cycle length will be able to extend the operation time between refuelings. Thus, it will economically increase the profit of the nuclear power plant. The longer cycle length also affects the cost of
nuclear fuels to be decreased as fuels can stay longer in the reactor core in the same operation power.
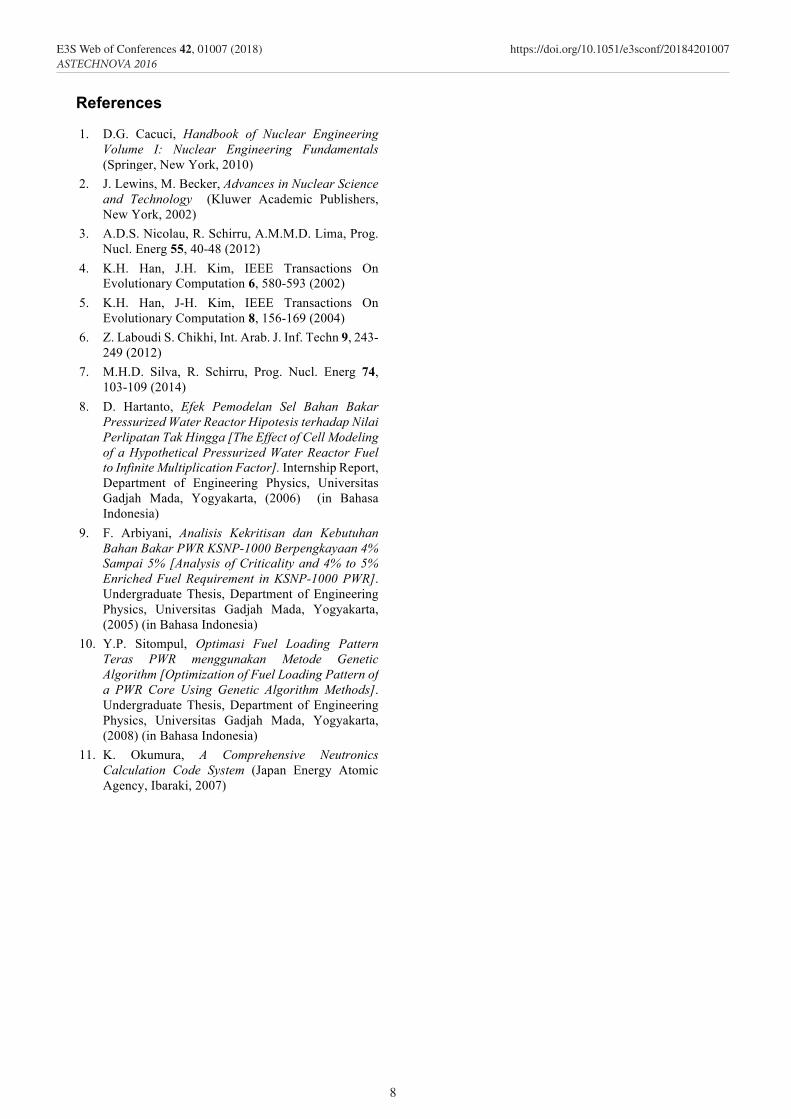
On the safety aspect, PPF of the optimized core is 45.13% higher than that of the standard model of KSNP-1000. The value of PPF on BoC is 2.191. The increasing in PPF can affect power distribution of optimized core to be worse than the standard core. However, slightly higher than 2 of PPF are still can be accepted as core configuration of KSNP-1000 [11]. The difference of power density distribution between the standard core and the optimized core can be seen in Fig. 15.
Fig. 14. Relative comparison on cycle length and PPF on BoC.
Fig. 15. Power density distribution of standad core (left) and optimized core (right).
Average power is also a parameter need to be calculated. Ideally, the optimized and standard core must have the same power. Average power can be calculated based on Equation (9).
𝐴𝐴𝐴𝐴𝐴𝐴𝑏𝑏𝐴𝐴𝐴𝐴𝐴𝐴𝑃𝑃𝑃𝑃𝑃𝑃𝐴𝐴𝑏𝑏 = OPQ,RSRTUVFWTTX
(9)
Because of the same core volume between the optimized and standard core, the power comparison can be computed from the power density with the unit of W/cc. By using the maximum power density value in Fig. 15 and PPF on Table 3, obtained power density of optimized and standard core respectively are 29.63 kW/cc and 33.71 kW/cc.
4. Conclusion Using rotation angle value Δθ equals to 0.02π and weight factor, w equals to 0.041, an optimized core configuration can be obtained, resulting 17.67% longer in fuel cycle than that of the standard core. Also, the PPF can be slightly maintained on the value of 2. Therefore, Quantum-inspired Evolutionary Algorithm (QEA) can be used to optimize fuel loading pattern effectively.
00.20.40.60.81
1.21.41.6
CycleLength PPFatBOCStandard Optimized
7
E3S Web of Conferences 42, 01007 (2018) https://doi.org/10.1051/e3sconf/20184201007ASTECHNOVA 2016
49
References
1. D.G. Cacuci, Handbook of Nuclear Engineering Volume I: Nuclear Engineering Fundamentals (Springer, New York, 2010)
2. J. Lewins, M. Becker, Advances in Nuclear Science and Technology (Kluwer Academic Publishers, New York, 2002)
3. A.D.S. Nicolau, R. Schirru, A.M.M.D. Lima, Prog. Nucl. Energ 55, 40-48 (2012)
4. K.H. Han, J.H. Kim, IEEE Transactions On Evolutionary Computation 6, 580-593 (2002)
5. K.H. Han, J-H. Kim, IEEE Transactions On Evolutionary Computation 8, 156-169 (2004)
6. Z. Laboudi S. Chikhi, Int. Arab. J. Inf. Techn 9, 243-249 (2012)
7. M.H.D. Silva, R. Schirru, Prog. Nucl. Energ 74, 103-109 (2014)
8. D. Hartanto, Efek Pemodelan Sel Bahan Bakar Pressurized Water Reactor Hipotesis terhadap Nilai Perlipatan Tak Hingga [The Effect of Cell Modeling of a Hypothetical Pressurized Water Reactor Fuel to Infinite Multiplication Factor]. Internship Report, Department of Engineering Physics, Universitas Gadjah Mada, Yogyakarta, (2006) (in Bahasa Indonesia)
9. F. Arbiyani, Analisis Kekritisan dan Kebutuhan Bahan Bakar PWR KSNP-1000 Berpengkayaan 4% Sampai 5% [Analysis of Criticality and 4% to 5% Enriched Fuel Requirement in KSNP-1000 PWR]. Undergraduate Thesis, Department of Engineering Physics, Universitas Gadjah Mada, Yogyakarta, (2005) (in Bahasa Indonesia)
10. Y.P. Sitompul, Optimasi Fuel Loading Pattern Teras PWR menggunakan Metode Genetic Algorithm [Optimization of Fuel Loading Pattern of a PWR Core Using Genetic Algorithm Methods]. Undergraduate Thesis, Department of Engineering Physics, Universitas Gadjah Mada, Yogyakarta, (2008) (in Bahasa Indonesia)
11. K. Okumura, A Comprehensive Neutronics Calculation Code System (Japan Energy Atomic Agency, Ibaraki, 2007)
8
E3S Web of Conferences 42, 01007 (2018) https://doi.org/10.1051/e3sconf/20184201007ASTECHNOVA 2016