Embed Size (px)
Citation preview
FUEL CELL APPLIED RESEARCH PROJECT
FINAL REPORT
Reporting Period: November 11, 2003 to March 31, 2005
Lee Richardson, Coordinator, Fuel Cell
September 2006
DOE Award Number: DE- FG26- 03NT42017
NORTHERN ALBERTA INSTITUTE OF TECHNOLOGY 11762 – 106 Street Edmonton, Alberta Canada T5G 2R1

Disclaimer This report was prepared as an account of work sponsored by an agency of the United States Government. Neither the United States Government nor any agency thereof, nor any of their employees, makes any warranty, express or implied, or assumes any legal liability or responsibility for the accuracy, completeness, or usefulness of any information, apparatus product, or process disclosed, or represents that its use would not infringe privately owned rights. Reference herein to any specific commercial product process or service by trade name, trademark, manufacture, or otherwise does not necessarily constitute or imply its endorsement recommendation or favouring by the United States Government or any agency thereof.
2

Abstract Since November 12, 2003, Northern Alberta Institute of Technology has been operating a 200 kW phosphoric acid fuel cell to provide electrical and thermal energy to its campus. The project was made possible by funding from the U.S. Department of Energy as well as by a partnership with the provincial Alberta Energy Research Institute; a private-public partnership, Climate Change Central; the federal Ministry of Western Economic Development; and local natural gas supplier, ATCO Gas. Operation of the fuel cell has contributed to reducing NAIT’s carbon dioxide emissions through its efficient use of natural gas.
3

List of Abbreviations and Acronyms AERI Alberta Energy Research Institute AF Available Factor AH System Available Hours BTU British Thermal Unit CCC Climate Change Central CM Cooling Module CO2 Carbon Dioxide DOE Department of Energy ESD Emergency Shutdown FOH Forced Outage Hours FOR Forced Outage Rate Hr Hour HT High temperature GJ Gigajoules GTI Gas Technology Institute kg Kilogram kW Kilowatt kWe Kilowatt electrical kWt Kilowatt thermal LT Low Temperature MBTU Thousand British Thermal Unit MDSP Master Microprocessor MDT Mean Down Time MTBRFO Mean Time Between Forced Outages MW Megawatt MWhr Megawatt per Hour NAIT Northern Alberta Institute of Technology PAFC Phosphoric Acid Fuel cell PEM Proton Exchange Membrane PH Period Hours POD Period of Demand ppm Parts per million PSD Planned Shut Down RSH Reserve Standby Hours SF Service Factor SH System Operating Service Hours SOF Schedule Outage Factor SOH Scheduled Outage Hours SOFC Solid Oxide Fuel Cell UPS Uninterrupted Power Supply US United States UTC United Technologies Company V Volt
4

VAC Volt Alternating Current VDC Volt Direct Current WED Western Economic Diversification
5
Table of Contents
Title Page 1
Disclaimer 2
Abstract 3
List of Abbreviations and Acronyms 4
Table of Contents 6
List of Graphical Materials 8
Introduction 9
Executive Summary 10
Experimental 12
Results & Discussion
Fuel Cell Operation 14
Electrical Operation 14
Thermal Operation 14
Rated vs. Observed Performance 16
Aging 16
Efficiency 17
Fuel Cell Maintenance 18
Daily Tasks 18
Monthly Tasks 18
Quarterly Tasks 18
Annual Tasks 18
Emergency Shutdowns 19
6

Annual Shutdown 20
Reliability Statistics 20
Cost Parameters 23
Environmental Impact 26
Conclusions 28
Appendices 29
I. Lost Time Hours 29 II. Non-Fuel Operating Expenses for 2004 30 III. Photographs
1. Fuel Cell Installation 31 2. Interpretive Centre 31 3. Thermal Recovery Piping 32 4. Phosphoric Acid Contaminated Exhaust Condenser 32
References 33
Bibliography 33
7

Graphical Materials Graphical Material Page
Fuel Cell Electrical Energy Production 14
Fuel Cell Thermal Energy Production (MWhr) 15
Fuel Cell Average Thermal Power Production (kW) 16
Cell Stack Voltage Degradation 17
Reliability Indices 21
Non-Fuel Operating Expense Totals for 2004 24
Fuel Gas Consumption Data 24
Lost Time Hours (Appendix I) 29
Non-Fuel Operating Expenses for 2004 (Appendix II) 30
8

Introduction The intent of NAIT Fuel Cell Project is to investigate and demonstrate ways of utilising the electrical and heat energy produced by fuel cells and to develop a fuel cell education program. The project will also provide an opportunity for the public to learn interactively about fuel cells and their future impact on society. HISTORY OF PURCHASE On April 1, 2003 the Northern Alberta Institute of Technology (NAIT), ATCO Gas, Western Economic Diversification (WED), Climate Change Central (CCC), and the Alberta Energy Research Institute (AERI) formed a project partnership. The project purpose was to purchase a 200 kW PAFC unit and a 5 kW SOFC unit. The 200 kW fuel cell was purchased from UTC Fuel Cells, a division of United Technologies Ltd. of South Windsor, CT. A 5 kW fuel cell has been purchased from Acumentrics of Westwood, MA. It is scheduled for delivery and commissioning in July 2005. INTERPRETIVE CENTRE An interpretive centre has been built around the 200 kW PAFC and was officially opened in October 2004. It showcases the first high-voltage, commercially operated fuel cell in Canada and is designed to provide the general public with an opportunity for interactive learning about fuel cell technology, environmental impacts, and the fuel cell project. It will also provide a venue for junior high and high school students to acquire direct knowledge of fuel cells in operation. The interpretive centre is designed to provide information through static and interactive displays that will enable students to complete school projects related to environmental and energy issues.
9

Executive Summary The NAIT Fuel Cell Applied Research Project has three main objectives. One is to provide training for NAIT students in fuel cell related courses including general knowledge, operation, and maintenance using the 5 kW fuel cell in the Power Engineering lab. The second objective is to provide information to the general public and school students through an interpretive centre built around the 200 kW fuel cell. The third objective is to involve NAIT in applied research into fuel cells and their application. A 200 kW Phosphoric Acid Fuel Cell (PAFC), a PC25C, has been purchased from UTC Fuel Cells, a Division of United Technologies and has been producing power at or near full load since November 12, 2003. As of March 4, 2005, the fuel cell has supplied 2092 MWhr of electrical energy into the NAIT grid. It has also produced 2323 MWhr of thermal energy of which 1610 MWhr have been captured and used in the NAIT heating system to supply heat to the NAIT pool, domestic hot water system, and boiler feedwater heating. Heat energy of the incoming fuel and electrical and thermal energy produced is continuously monitored and recorded. The gross efficiency of the unit is 73.3% (61.1% net efficiency) with possibilities of increase from greater use of the thermal energy produced. The rate of heat capture has been increasing as systems controls are adjusted and heat loads added. A 5 kW Solid Oxide Fuel Cell (SOFC) has been purchased and will be installed in the Power Engineering lab and used as a tool to enhance student learning for Power Engineering students as well as other technologies such as Electrical Engineering and Mechanical Engineering. The SOFC will be used to test different fuels and compare efficiencies with gas fired boiler/generator units. Delivery of the 5 kW fuel cell is scheduled for October 2005. A proposal has been submitted to purchase smaller fuel cell equipment for a lab course. The SOFC will also be used for applied research purposes. Discussions are currently underway with the federal National Research Council with the view of collaboration between NAIT and private firms to carry out applied research into aspects of fuel cell applications. As well the University of Alberta and University of Calgary have expressed interest in working with NAIT on the SOFC unit. Preliminary discussions have also been opened a Texas based research group that may involve cooperation on research into the application at NAIT. A fuel cell course has been written that will be offered to Power Engineering day program students in the fall of 2005 and to the general public as an evening course. The day program course will include laboratory experiences with the 5 kW SOFC and several 1 kW PEM Nexa™ units. This equipment will afford the students an opportunity to study the effects of a variety of load and operating conditions on fuel cells.
10

An interpretive centre has been built around the 200 kW phosphoric acid fuel cell. The centre employs both static and interactive displays that describe operation of the various components of the fuel cell and discuss environmental issues and solutions. It is open to NAIT students, the public, and High School and Junior High School students. It will be used to enhance student and public awareness of alternative energy systems and the environment. Numerous tours of the facility have been conducted.
11

Experimental The focus of the NAIT Fuel Cell Applied Research Program is fourfold.
• It proposes to use the PC25C fuel cell to demonstrate the capability of fuel cells to provide combined heat and power energy to the facility in a manner that is efficient and results in a reduction in greenhouse gases produced by the facility.
• Since NAIT is an educational institution, the intent is to use the PC25C fuel cell as part of a teaching and learning environment for our students in the Power Engineering and other departments. The fuel cell, along with a 5 kW SOFC machine and smaller units, will form the basis of a fuel cell basics course that will introduce students to fuel cells and their operating characteristics.
As well, the PC25C will also be part of an evening continuing education course that will be available to the public.
• NAIT has built an interpretive centre around the PC25C fuel cell in an effort to engage public interest in alternate energy production methods and encourage awareness of environmental issues. • The program also intends to utilize the 5 kW SOFC to engage in research into fuel cell applications and performance.
DATA COLLECTION SYSTEM An important part of the fuel cell program is the collection of data in order to track the energy usage efficiency. This requires measurement and recording of energy inputs and outputs. Data is collected for periods beginning on the 4th of each month. Heat Energy In The Gas The energy input is natural gas from ATCO Gas Ltd. It is principally methane atapproximately 95.3% and ethane at 1.8%. ATCO Gas supplies the gas at apressure of 300 to 450 kPa and consumption is metered. The pressure is then reduced to 140 kPa and a sample is continuously monitored for its heating value. This allows for continuous calculation of heat energy input to the fuel cell. The pressure is further reduced to 3.6 kPa prior to use in the fuel cell. Electrical Energy Internal Electrical Requirements The fuel cell stack produces 225 kWe (kilowatts electrical) but approximately 25 kWe of auxiliary power is required to operate the unit. This power is used to operate fan and pump motors, valve operators, etc. The fuel cell is independent of grid-supplied electricity.
12

Electrical Energy To Grid The fuel cell reaction produces unregulated direct current electrical energy at approximately 180 VDC. The direct current is regulated and converted to alternating current at 480 VAC within the unit. The voltage is increased to 600 VAC in an external transformer, metered and fed into the NAIT electrical grid. The power meter measures, indicates and records the voltage, amperage, power factor, and phase angles of the power produced. It also indicates a real time calculation of the electrical energy output (megawatt hours) since start-up. Thermal Energy In addition to electrical power, the fuel cell reaction produces thermal energy, which must be continuously removed from the unit. Heat is removed from the unit via a high temperature (HT) heat exchanger, low temperature (LT) heat exchanger, and Cooling Module (CM). Some heat also escapes the fuel cell via the process air vent to the atmosphere. Heat energy flow to the high and low temperature loads and CM is continuously monitored. Thermal meters record and display the temperatures, temperature differences, and flow rates to the loads. They also calculate and totalize energy use and display it as megawatt hours (MWhr) of heating load. Thermal Energy To HT Heating Heat energy collected from the HT heat exchanger is used to pre-heat boiler feedwater. A portion of the boiler feedwater is diverted from its normal flow to the boilers, passed through the HT heat exchanger, and returned heated to the boiler water circuit. Boiler feedwater enters the HT heat exchanger at approximately 66°C and leaves at 82°C. This heat addition to boiler feedwater increases the heating plant efficiency. Thermal Energy To LT Heating Loop The LT heating load consists of swimming pool heating, domestic hot water heating for showers in the pool area, and make up water heating in the heating plant. The LT heat exchanger transfers heat to the LT heating loop glycol/water mixture. This coolant is circulated to three remote heat exchangers that serve the pool, domestic hot water, and make up water. LT heating coolant leaves the fuel cell at approximately 65°C and returns at 52°C. Thermal Energy To CM The CM is a roof top heat exchanger that permits dissipation of heat to the atmosphere in the event of failure or reduction of the heating loads. If the heating loads are not sufficient to remove the heat produced by the fuel cell, flow-regulating valves divert appropriate amounts of the ancillary cooling system water to the CM in order to maintain temperature. Heat expelled by the CM is lost energy and so represents a reduction of thermal efficiency.
13

Results and Discussion FUEL CELL OPERATION The fuel cell first went on line on November 12, 2003 at 13:05 hrs. Since January 4, 2004 the fuel cell has run a total of 9960 hours at 200 kW. This is a full-load availability of 90.8%. Availability of the fuel cell has been at nearly 100% except for a period during June and July when production was reduced due to UPS and microprocessor failure that necessitated the machine being shut down 12 days in June and 14 days in July. Electrical Operation From December 3, 2003, the fuel cell has been at full load (200 kW) 90.75% of the time and except for its shutdown for warranty service has operated at full load for the last five months. As of March 4, 2005, total electrical energy output from the fuel cell has been 2092 MWhr. The average electrical power output of the unit since start-up is 181.5 kW. The fuel cell has been at or nearly at full production during 10 of 15 months of operation.
Fuel Cell Electrical Energy Production
0
50
100
150
200
250
Dec, 2
003
Jan,
2004
Feb, 2
004
Mar, 20
04
Apr, 20
04
May, 2
004
Jun,
2004
Jul, 2
004
Aug, 2
004
Sep, 2
004
Oct, 20
04
Nov, 2
004
Dec, 2
004
Jan,
2005
Feb, 2
005
Electrical Energy Production (MWhr) Average Electrical Power Production (kW)
Thermal Operation The fuel cell has been providing LT heat since November 17, 2003 and HT heat since November 25, 2003. From December 2003 to March 2005, 932 MWhr of HT heat have been produced. Over this period, the average HT heating load was 82.5 kW.
14

As of March 4, 2005, 679 MWhr of LT heat have been produced. The average LT heating load has been 64.1 kW since the fuel cell was started. Since start-up, thermal losses to the CM have totaled 712 MWhr. This is approximately 16% of the total energy output of the fuel cell. These losses vary with NAIT operational circumstances including student occupancy as well as boiler load, etc. Not all heat produced by the fuel cell is captured by the ancillary cooling loop and distributed to the HT, LT, or CM. Some passes out to atmosphere via the process vent. The process vent carries the excess air from the fuel cell stack to the atmosphere. The air contains some water vapor and heat, both of which represent heat lost from the fuel cell. Carbon Dioxide produced from the reformation of natural gas is also vented carrying some heat out with it. Carbon dioxide is produced at approximately 180 kg/MWhr or about 105.5 kg/hr when the machine is at 200 kW.
Fuel Cell Thermal Energy Production (MWhr)
020406080
100120140160180200
Dec, 2
003
Jan,
2004
Feb, 2
004
Mar, 20
04
Apr, 20
04
May, 2
004
Jun,
2004
Jul, 2
004
Aug, 2
004
Sep, 2
004
Oct, 20
04
Nov, 2
004
Dec, 2
004
Jan,
2005
Feb, 2
005
HT Thermal Energy Production LT Thermal Energy Production CM Thermal Losses
15

Fuel Cell Average Thermal Power Production (kW)
0
50
100
150
200
250
300
Dec, 2
003
Jan,
2004
Feb, 2
004
Mar, 20
04
Apr, 20
04
May, 2
004
Jun,
2004
Jul, 2
004
Aug, 2
004
Sep, 2
004
Oct, 20
04
Nov, 2
004
Dec, 2
004
Jan,
2005
Feb, 2
005
Average HT Heat Load Average LT Heat Load Average CM Heat Loss Rate
Rated vs. Observed Performance Electrical power produced by the fuel cell is very close to its rated performance (198.62 kW output to NAIT vs. 200 kW). This difference reflects losses primarily in the 480/600 V transformer. Rated useful thermal output is approximately 264 kW (900,000 Btu/hr) heat recovery at 200 kW electrical output. This heat recovery is divided about equally between the HT and LT loops and varies with unit load. Heat recovery depends on thermodynamic conditions within the unit such as temperature differences between ancillary cooling water and HT and LT loop circulating water. As well, if the unit load is below 200 kWe, the amount of HT thermal energy available will be proportionally less until at half load essentially no HT heat is available. While the fuel cell operating is at 200 kWe, the average heat output rate to the HT and LT loops and CM was approximately 240 kW. This means that thermal recovery was approximately 24 kW below the unit specifications. This, lower than rated heat production, is attributed to lower than expected heat transfer due to lack of heat load and/or less than optimum heat exchange conditions. Primarily this heat loss went to atmosphere via the process vent. Aging Since start-up the cell stack output voltage has degraded from about 178 VDC to about 166.6 VDC. This degradation occurs partly as a result of the shutdowns the unit has experienced and partly due to normal operation and is the result of
16

migration of electrolyte into the porous cell plates. Such migration increases the cell resistance resulting in a lower voltage output. According to UTC, the reduction experienced to date is well within expectations of the unit. Electrolyte migration and consequent voltage reduction is accentuated during shut down periods where the stack is allowed to cool down. During the summer of 2004 the fuel cell was out of operation for about 30 days. The effect on the voltage of the unit is clearly indicated in the graph below at about 5500 hours.
Cell Stack Voltage Degradation VDCTOT vs. LoadTime on PP # 9283
From: 11/10/2003 To: 4/21/2005
145
150
155
160
165
170
175
180
185
130 2130 4130 6130 8130 10130 12130
LoadTime Hrs
VDC
TOT
Efficiency Since start up (until March 04, 2005) the following energy statistics have been obtained:
• Natural gas input (GJ) (per ATCO Gas): 21673.00 • Electrical output (GJ): 7531.20 • HT heat output (GJ): 3355.78 • LT heat output (GJ): 2443.30 • CM output (GJ): 2563.49
The average gross fuel cell efficiency (total outputs/total inputs), since start up, is 73.33%. If the CM losses are removed from the equation, the net efficiency of the unit is 61.51%. This net efficiency is very dependent on thermal energy usage. ___________________________ 1 Data provided by International Fuel Cells a United Technologies Company
17

During summer months there is a drop in LT heat usage at the pool and showers as well as HT heat transfer to boiler feedwater. This efficiency may be compared to other newer and traditional technologies. For example, a natural gas fired combined cycle plant has an overall efficiency of about 50%. A coal fired sub-critical generating plant is about 37% efficient and a diesel plant of less than 30%. Fuel Cell Maintenance Operation of the unit consists of daily routine supervision and monthly, quarterly, and annual maintenance tasks Daily Tasks The Power Plant Operations personnel maintain a detailed and comprehensive log of the fuel cell operation. On a daily basis, they gather data from all energy meters and input the information into an Excel database. They also visually check and verify performance of the fuel cell and operation of the heat recovery systems. As well, they ensure the fuel cell room temperature is maintained between 15°C and 35°C and that the room is secure. The power plant operators indicate that approximately 2 hours per shift are spent on routine supervision of the fuel cell and heating loops. Monthly Tasks Monthly checks include a visual inspection of the fuel cell’s roof top CM and thermal recovery heat exchangers. Thermal and power meter monthly readings are forwarded to ATCO Gas at the beginning of each month. A water quality analysis is regularly performed on the LT closed loop system to the activities centre. Quarterly Tasks The water treatment filter requires quarterly checking and/or cleaning. The process air and cabinet ventilation system air filters require cleaning/replacement or more often as needed. In fact, this has been the case. The air filters have required cleaning/changing several times since start up of the unit. Cooling water pumps require lubrication. The carbon filter and resin beds require replacement whenever the impurity rises above 2 ppm (parts per million). Exhausted resin is transferred out of the bottles and new transferred in. The transfer of resin takes several hours. The bottle exchange is relatively quick using quick-connect fittings. Annual Tasks A fuel cell shut down is required every 8000 hours or annually. Tasks related to the water treatment system include demineraliser resin exchange, water tank and degasifier column cleaning, and water filter cartridge replacement. The process air system requires blower lubrication, replacement of the nitrogen passivation
18

filter, flame sensor and spark plug check, and leak checks on valves and hoses in the system. The ancillary coolant system requires filter cleaning and glycol solution testing and evaluation. The cell stack cooling system requires inlet filter cooling, valve and instrumentation inspection, and coolant pump replacement. The electrical system requires checking of circuit breakers, transfer switch, motor starters, power inverters, and power supply as well as the integrity of wiring. Emergency Shutdowns The PAFC is designed to run continuously. It is particularly sensitive to shutdowns. Shutdowns provide an opportunity for the semi-liquid phosphoric acid electrolyte to migrate into the porous carbon anode and cathode plates. Each shutdown degrades the voltage output of the machine slightly. To date the fuel cell has experienced 14 shutdowns. Eleven have been emergency shutdowns (ESD), two have been maintenance related and one for its annual shutdown. None of the ESD’s has been related to the operation of the cell stack itself. They were principally electrical or electronic in nature and associated with the balance of plant. Some of the problems that have led to ESD’s have been related to improperly programmed thermocouples and valves and a faulty breaker. Other shutdowns resulted from incorrect fan motor rotation on the rooftop CM causing high temperatures in the unit. The sprinkler flow switch and exhaust fan “sail switch” are believed to have caused a number of shut downs. These events occurred during or shortly after the commissioning phase. The fuel cell control module failed to communicate with Connecticut due to a faulty phone modem on November 28. Replacement of the modem necessitated two planned shutdowns. The most significant shutdowns occurred in late June and early July and were related to microprocessor and UPS faults. Delays incurred as a result of trying to determine the exact causes and incorrect parts being sent resulted the most significant outage of the unit to date and significantly reduced the unit’s performance statistics. In five of the six months since the outages of June and July, the fuel cell has performed very well; achieving 100% availability at full load until it was shut down for its annual maintenance. Facility staff, using telephone support provided by the vendor, performed the required maintenance work. The lost time hours and causes are listed in Appendix I.
19

Annual Shutdown The annual shutdown was delayed until February 14, 2005 because of the excellent operation of the unit. Significant repairs included:
• Rebuild the reformer steam control valve • No problems were associated with this equipment however the
work is scheduled as part of the initial annual maintenance • Clean the Exhaust Condenser
• The condenser was very contaminated with phosphoric acid carried over from the cell stack. The condenser was readily cleaned with high-pressure water. UTC expected this carryover. (See photo, Appendix III)
• Rebuild brakes on 4 motor control valves • Preventative maintenance task
• Drain, clean, and refill Tank #450 (Ancillary cooling water storage tank) • Preventative maintenance task
• Replace all air filters • Preventative maintenance task
• Replace resin and carbon filters in the demineraliser • Preventative maintenance task
• Flush the LT cooling loop. • The loop flow sensing element has been giving incorrect
readings and the system was flushed in an attempt to solve the problem
The total time required to complete the annual maintenance was 46 hours. As with ESD’s, the facility staff, using telephone support provided by the vendor, performed the annual maintenance work. The fuel cell was back in service at 1200 hrs on February 18, 2005. Reliability Statistics To determine the reliability statistics, definitions are based on those published by the Gas Technology Institute (GTI) in Des Plains, Illinois. GTI is an independent, not-for-profit technology organization that provides products, program, information and services related to energy and the environment, with a focus on the production, delivery, use, and environmental aspects of natural gas. Definitions: “There are various ways to measure reliability. In power generation systems, key measures of performance are availability and various maintenance-related indices. The following graphic illustrates different reliability categories for a given period of time (e.g., one year). A power generation system is characterized - depending on its operating state to be in one of these conditions.”
20

The chart below provides a visual explanation of the terms used.
Period Hours (PH)
System Availability System Down For Available Hours (AH) Maintenance
System Operating Reserve Scheduled Forced Service Hours (SH) Standby Hours Outage Hrs Outage Hrs (RSH) (SOH) (FOH)
“A number of performance indices can be calculated based on operational and maintenance data”.
Reliability Indices Hours or %
Period Hours, PH 8784 hrs
Scheduled Outage Hours, SOH 47 hrs
Forced Outage Hours, FOH 707 hrs
System Available Hours, AH 8030 hrs
System Operating Service Hours, SH 8030 hrs
Period of Demand, POD 8737 hrs
Availability Factor, AF 91.95%
Forced Outage Rate, FOR 8.1%
Schedule outage Factor, SOF 0.5%
Service Factor, SF 91.4%
Mean Time Between Forced Outages, MTBFO 730 hrs
Mean Down Time, MDT 53.8 hrs
21
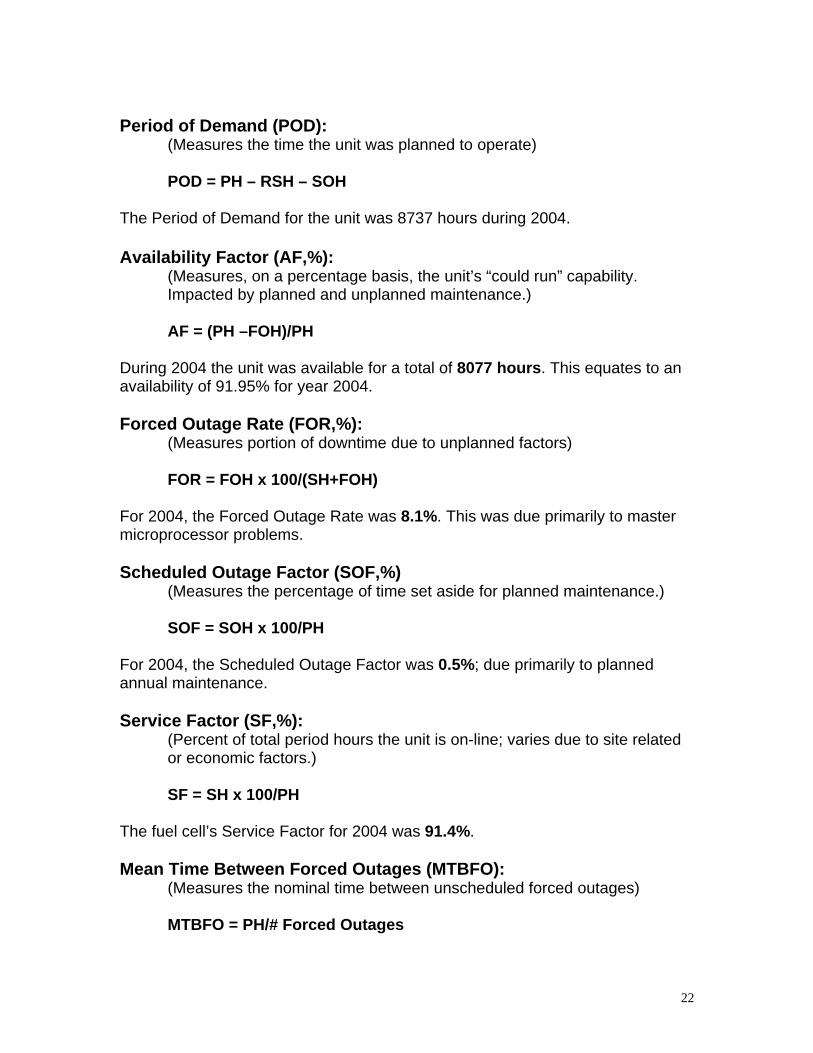
Period of Demand (POD):
(Measures the time the unit was planned to operate)
POD = PH – RSH – SOH The Period of Demand for the unit was 8737 hours during 2004. Availability Factor (AF,%):
(Measures, on a percentage basis, the unit’s “could run” capability. Impacted by planned and unplanned maintenance.)
AF = (PH –FOH)/PH
During 2004 the unit was available for a total of 8077 hours. This equates to an availability of 91.95% for year 2004. Forced Outage Rate (FOR,%):
(Measures portion of downtime due to unplanned factors)
FOR = FOH x 100/(SH+FOH) For 2004, the Forced Outage Rate was 8.1%. This was due primarily to master microprocessor problems. Scheduled Outage Factor (SOF,%)
(Measures the percentage of time set aside for planned maintenance.)
SOF = SOH x 100/PH For 2004, the Scheduled Outage Factor was 0.5%; due primarily to planned annual maintenance. Service Factor (SF,%):
(Percent of total period hours the unit is on-line; varies due to site related or economic factors.)
SF = SH x 100/PH
The fuel cell’s Service Factor for 2004 was 91.4%. Mean Time Between Forced Outages (MTBFO):
(Measures the nominal time between unscheduled forced outages) MTBFO = PH/# Forced Outages
22
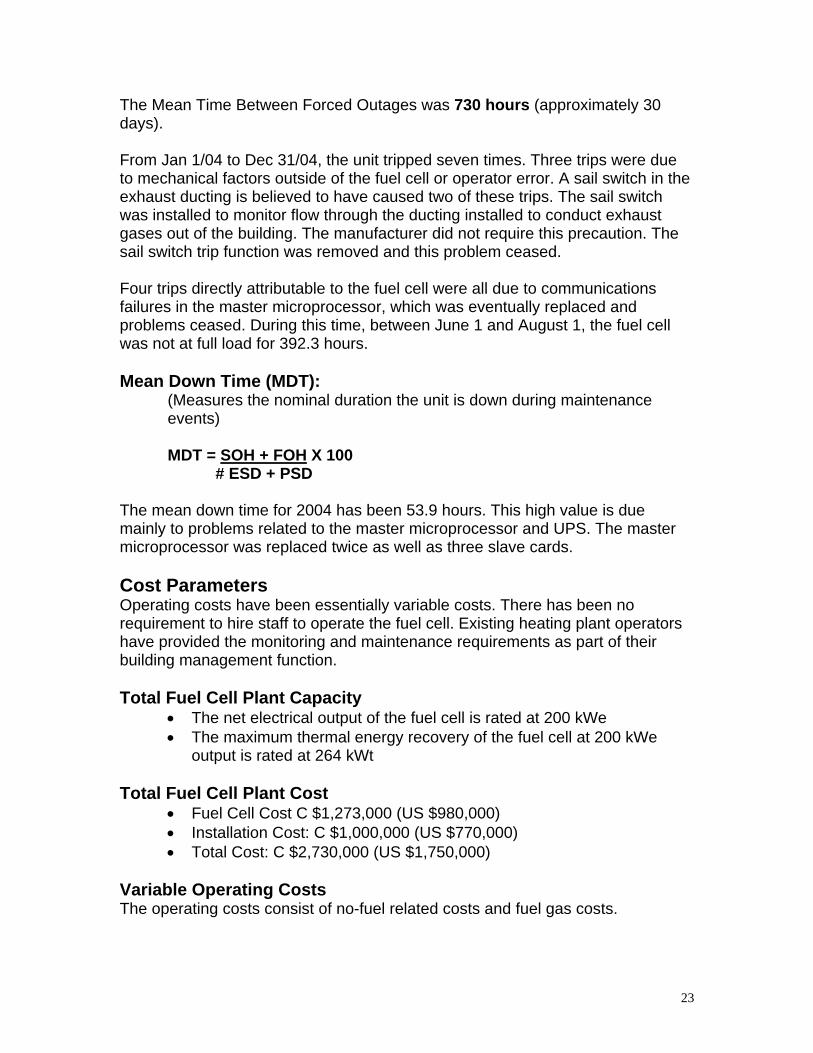
The Mean Time Between Forced Outages was 730 hours (approximately 30 days). From Jan 1/04 to Dec 31/04, the unit tripped seven times. Three trips were due to mechanical factors outside of the fuel cell or operator error. A sail switch in the exhaust ducting is believed to have caused two of these trips. The sail switch was installed to monitor flow through the ducting installed to conduct exhaust gases out of the building. The manufacturer did not require this precaution. The sail switch trip function was removed and this problem ceased. Four trips directly attributable to the fuel cell were all due to communications failures in the master microprocessor, which was eventually replaced and problems ceased. During this time, between June 1 and August 1, the fuel cell was not at full load for 392.3 hours. Mean Down Time (MDT):
(Measures the nominal duration the unit is down during maintenance events) MDT = SOH + FOH X 100
# ESD + PSD The mean down time for 2004 has been 53.9 hours. This high value is due mainly to problems related to the master microprocessor and UPS. The master microprocessor was replaced twice as well as three slave cards. Cost Parameters Operating costs have been essentially variable costs. There has been no requirement to hire staff to operate the fuel cell. Existing heating plant operators have provided the monitoring and maintenance requirements as part of their building management function. Total Fuel Cell Plant Capacity
• The net electrical output of the fuel cell is rated at 200 kWe • The maximum thermal energy recovery of the fuel cell at 200 kWe
output is rated at 264 kWt Total Fuel Cell Plant Cost
• Fuel Cell Cost C $1,273,000 (US $980,000) • Installation Cost: C $1,000,000 (US $770,000) • Total Cost: C $2,730,000 (US $1,750,000)
Variable Operating Costs The operating costs consist of no-fuel related costs and fuel gas costs.
23

Non-Fuel Operating Expenses Totals For 2004 Month CAN$ US$ JAN $2,862.51 $2,200.21 FEB $1,949.90 $1,498.75 MAR $476.23 $366.04 APR $1,936.78 $1,488.67 MAY $140.06 $107.65 JUN $2,342.24 $1,800.31 JUL $1,918.08 $1,474.29 AUG $590.00 $453.49 SEP $1,701.30 $1,307.67 OCT $247.17 $189.98 NOV $1,370.82 $1,053.66 DEC $1,723.00 $1,324.35
Consumables In the agreement, consumables are an expense to ATCO Gas. Generally consumables consist of items and material that are required to carry on normal operation of the fuel cell. Examples of consumables are natural gas, nitrogen and helium gases, filters, and demineraliser resin. Some consumables use occurs as a result of existing conditions. For example, the air quality will govern the frequency of air filter replacement. The resin beds require replacement whenever circulation water concentration reaches 2 ppm. Nitrogen purge gas reserve replenishment is required depending on the number of start ups and shutdowns the unit goes through. As of March 2005, the value of consumables other than natural gas has totaled C $22,933. This is less than 1 cent per kWh of energy produced and used. Itemized non-fuel expenses are given in Appendix II. Fuel Gas Costs
Fuel Gas Consumption Data
Month Consumption
(GJ) Days GJ/Day GJ/hr Cost (CND) JAN 1,482 31 47.8 2.0 $9,602.32FEB 1,455 32 45.5 1.9 $9,405.70MAR 1,263 28 45.1 1.9 $7,383.62APR 1,441 31 46.5 1.9 $8,543.26MAY 1,620 33 49.1 2.0 $10,316.65JUN 1,236 33 37.4 1.6 $11,353.01JUL 543 31 17.5 0.7 $4,289.40AUG 1,330 32 41.6 1.7 $10,597.66SEP 1,426 24 59.4 2.5 $11,287.20OCT 1,660 32 51.9 2.2 $11,028.47NOV 1,543 30 51.4 2.1 $10,531.92DEC 1,437 28 51.3 2.1 $10,092.93
24

In 2005 natural gas prices varied from a low of $5.846 per GJ to a high of $7.966 with an average price of C$7.045/GJ ($5.41/MBTU US$) for the year. For the year 2004, total fuel gas consumption of 16436 GJ cost C $114,432.14, ($87995.96, US$). From start up to March 04/05, the natural gas consumed by the fuel cell has been 21673 GJ. Local Area Electrical Rate
• The average Electrical rate for 2004 was $0.1014/ kWh $C (8.19 cents/kWh, US$).
Heat Rate
• The average heat rate for the fuel cell was 2913.3 BTU thermal/ kWh electrical.
Capacity Factor
• During 2004 the fuel cell operated at full load a total of 7946 hrs. During this time its output was 198.71 kWe. This is a capacity factor of 99.36%.
Energy (Electrical & Thermal) Output
Main Campus Electrical
Consumption (KWhr)
Fuel Cell Electrical Energy
Production (KWh)
Fuel Cell Thermal Energy
Production (KWh)
% Facility Electrical Energy
Produced By Fuel Cell
% Facility Thermal Energy
Produced By Fuel Cell
JAN 2,043,427 147,798 144,744 6.74% 10.76% FEB 2,013,984 137,722 107,840 6.40% 10.87% MAR 2,139,789 144,744 134,000 6.34% 11.53% APR 2,025,753 143,004 127,370 6.59% 11.78% MAY 2,007,004 147,463 110,580 6.84% 11.39% JUN 2,094,836 77,605 54,700 3.57% 5.94% JUL 2,139,415 77,818 58,940 3.51% 6.01% AUG 2,057,038 127,003 116,130 5.82% 10.57% SEP 2,041,312 153,333 130,720 6.99% 12.22% OCT 2,083,793 149,148 131,960 6.68% 11.89% NOV 2,013,138 144,117 134,750 6.68% 12.17% DEC 1,806,831 149,063 159,400 7.62% 14.58% During 2004, the fuel cell provided an average of 6.15% of the main campus electrical load and 10.81% of its thermal load. The fuel cell’s thermal output was divided between high temperature heat recovery and low temperature heat recovery:
• 2880.18 GJ (2729.87 MBTU) of HT heat recovered • 2034.18 GJ (1928.02 MBTU) of LT heat recovered
25

Environmental Impact Reduction of Greenhouse Gases: Operation of the 200 kW fuel cell has produced electrical and heat energy used by NAIT in place of energy that would have been purchased from electrical suppliers or produced by NAIT’s heating plant. For the year 2004, the fuel cell produced approximately:
• 1600 MWhr of electrical energy that was used in the NAIT grid • 365 MWhr of heat energy that was used to heat the NAIT swimming pool
and pool showers as well as to increase the efficiency of the facility’s heating plant.
The fuel cell operates at a net efficiency of approximately 66% - much higher than that of conventional sources of energy. As a result of using less energy, the fuel cell reduces NAIT’s production of greenhouse gases. Had it been supplied from the Alberta electrical grid, 1600 MWhr of imported electrical energy would have required the release 1600 tonnes of carbon dioxide (CO2) when generated in a thermal generating station.2 Heat produced by the fuel cell operation was captured and used instead of heat being supplied by the NAIT Heating Plant. Assuming 80% efficiency for the plant, the 1365 MWhr of fuel cell produced heat is equivalent to 1606 MWhr (or 5780 GJ) of natural gas energy.3 Burning this amount of gas in NAIT’s boilers would have produced approximately 300 tonnes of CO2.4 During 2004 the fuel cell used approximately 16147 GJ of natural gas fuel. This gas (92% methane) is converted to hydrogen in a reformer: a process that produces CO2. Using 16147 GJ of natural gas in the fuel cell produced approximately 800 tonnes of CO2. Therefore, in 2004, by using its fuel cell to supply part of its energy load, NAIT reduced the amount of CO2 produced by 1100 tonnes. Since start-up, the fuel cell has reduced NAIT’s CO2 load by approximately 1650 tonnes. As well, fuel cells do not produce SOx or NOx. Any sulphur contained in the fuel gas is trapped and retained in the desulphuriser vessel before it passes into the reformer. Nitrous Oxides are not formed because the fuel cell reaction does not produce enough heat to promote NOx production. Therefore, the 1965 MWhr of energy used by NAIT came without any contribution to environmental levels of SOx or NOx. 2 ATCO Gas: (1 MWhr of electrical power imported by NAIT from the Alberta Power Grid releases 1 tonne of CO2) 3 1 MWhr of energy = 3.6 GJ of energy 4 ATCO Gas: (1000 GJ of natural gas produces 50 tonnes of CO2)
26

Intangible Environmental Benefits: The project has a strong education focus. Fuel cell training programs for day and night students will be presented at NAIT in the fall of 2005 as part of the Power Engineering Program. The interpretive centre has been established and a program to attract junior high and high school students as well as the general public is being developed. The interpretive centre will increase the public awareness of fuel cells and generate discussion of environmental issues. It will also generate interest in students in fuel cell and environmental technology.
27

Conclusions The PC25C fuel cell plant at NAIT has successfully completed its first full calendar year of operation. In fact it continues to operate successfully. The acquisition, start up, and operation of the fuel cell has been a success. It was commissioned and started with few problems and it continues to perform well. Except for problems with the microprocessor and UPS in June and July of 2004, the unit has performed very well. Not considering this period, the fuel cell has a 97.5% availability. This success is seen in that the fuel cell produces electrical and thermal energy to the facility with greater efficiency than conventional means and so is producing energy to a lower greenhouse gas contribution by an estimated 1100 tonnes of carbon dioxide. It has operated within the parameters given by the vendor and has not imposed excessive operating and maintenance costs. The maintenance required to date has been well within the expertise of the facility staff with phone assistance from the vendor. The project is providing learning opportunities for NAIT students. NAIT students are already using the fuel cell as a learning tool and enthusiastically participated in developing the interpretive centre. The implementation in 2006 of day program and evening program fuel cell related courses will provide an opportunity for NAIT students and the public to study fuel cells and related issues. Acquisition of the 5 kW fuel cell and smaller fuel cell equipment for use in NAIT’s Power Engineering lab will provide its students with an opportunity to get real hands-on experience operating and monitoring fuel cells. As well the project is providing an opportunity for junior and senior high school students as well as the general public to learn about fuel cells and environmental issues by touring the interpretive centre and visiting the fuel cell web site. To date there has been considerable expression of interest by junior and senior high schools in touring the interpretive centre. Since the interpretive centre has opened, NAIT has conducted tours of over 800 participants comprising professional and technical organizations, schools, and the general public. Development of an interpretive centre around the fuel cell demonstrates NAIT’s effort and commitment to increasing public and student knowledge of fuel cells and environmental issues. Fuel cell related courses demonstrate NAIT’s commitment to training in environmental technology. The project is also enabling NAIT to cooperate with other learning institutions and research facilities in increasing knowledge about fuel cell applications.
28

Tables and Appendices I. Lost Time Hours
Lost Time Hour Date Time
Off Time On
Hours Off
(Approx)
Type
Cause
11/12/2003 0710 1305 6 ESD Cooling Fans running Backward 11/19/2003 0530 0740 2.2 ESD U/C relay 11/25/2003 1630 ?
(est.) 3.00
ESD
HT loop TCV setting to high
12/05/2003 1105 1120 0.25 PSD S/D to change modem 12/05/2003 1235 1538 3.0 ESD Inverter high temp (room too hot) 12/19/2003
(est.) 0.50
PSD
Replace Modem
01/10/2004 1325 1425 1.0 ESD PE400 high or Operator Error 03/29/2004 2331 03/30/2004 1246
7.5
ESD
Exhaust Sail Switch
04/02/2004 1030 1112 0.75 ESD Exhaust Sail Switch 06/18/2004 1631 06/30/2004 1335
288.0
ESD
MDSP (Master Microprocessor) & UPS Fault
06/30/2004 1345 07/02/2004 1330
1.00
ESD
MDSP (Master Microprocessor)
07/12/2004 1227 07/13/2004 1422
25.50
ESD
MDSP (Master Microprocessor)
07/13/2004 1906 07/27/2004 1415
369.25
ESD
MDSP (Master Microprocessor)
02/14/2005 1400 02/18/2005 1200
46
PSD
Annual Shutdown
Total SD hrs 753.95; ESD hrs 707.2
29

II: Non-Fuel Operating Expenses
Itemised Non-Fuel Operating Expenses For 2004 Date Vendor Expense Item Cost (CDN)
01/05/2004 UTC Filter $1,233.0001/05/2004 UTC Filter $144.0001/05/2004 UTC Brake $1,068.0001/05/2004 UTC Amplifier $148.0001/05/2004 UTC Filter $156.0001/21/2004 BOC Gases Helium $12.7301/21/2004 BOC Gases Helium $100.7802/10/2004 SAI Resin $1,819.0002/26/2004 BOC Gases Bottle Rental $130.9003/17/2004 BOC Gases Nitrogen $336.1703/30/2004 BOC Gases Bottle Rental $140.0604/01/2004 SAI Resin $1,476.6004/02/2004 BOC Gases Nitrogen $320.1204/29/2004 BOC Gases Bottle Rental $140.0605/28/2004 BOC Gases Bottle Rental $140.0606/23/2004 BOC Gases Nitrogen $336.1706/28/2004 UTC Filter $1,515.0706/29/2004 BOC Gases Nitrogen $320.1206/29/2004 BOC Gases Bottle Rental $170.8807/05/2004 BOC Gases Nitrogen $336.1707/15/2004 BOC Gases Nitrogen $652.5507/29/2004 BOC Gases Nitrogen $636.5007/29/2004 BOC Gases Bottle Rental $292.8608/11/2004 BOC Gases Nitrogen $590.0009/24/2004 SAI Resin $1,701.3010/19/2004 SAI Activated Carbon $247.1711/16/2004 BGE Filters (8) $355.2011/17/2004 BOC Gases 4 Bottles Nitrogen $320.1211/17/2004 BOC Gases Combustion Gas $695.5012/08/2004 UTC C90 Retrofit Kit - 4 $1,132.0012/08/2004 UTC Filter 401 - 4 $32.0012/08/2004 UTC CV-500 Gaskets - 4 $64.0012/08/2004 UTC Steam Valve CV-500 $495.00
30
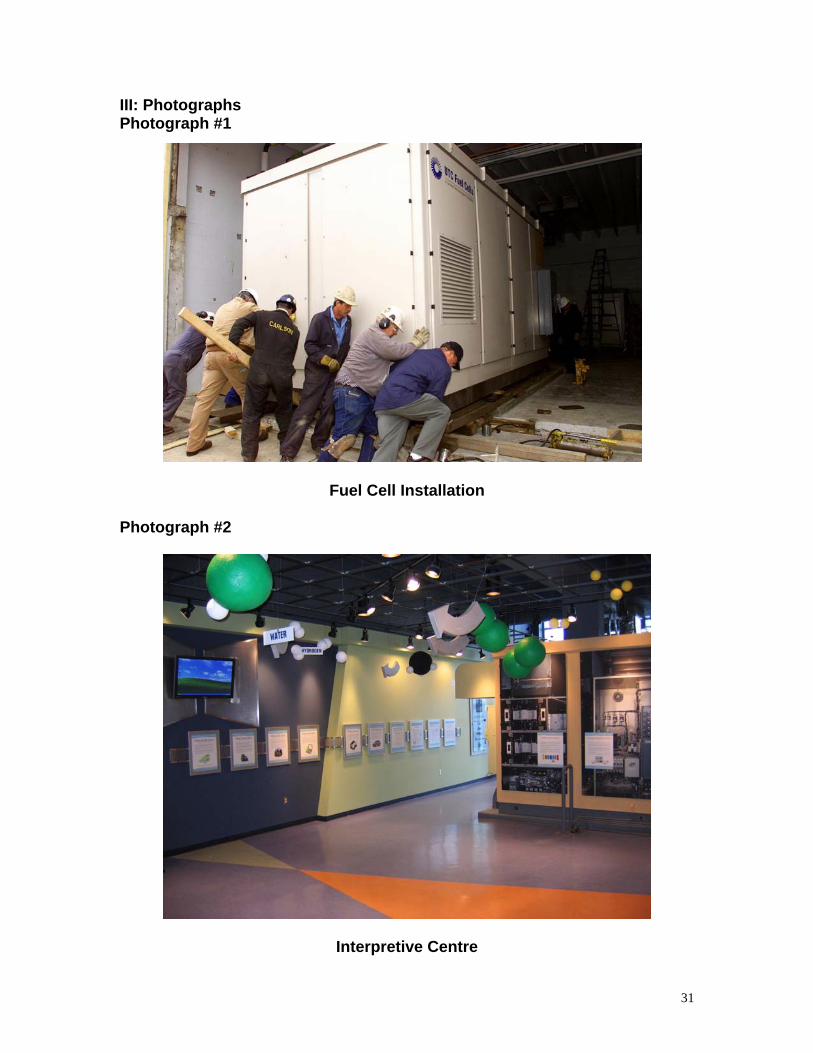
III: Photographs Photograph #1
Fuel Cell Installation
Photograph #2
Interpretive Centre
31

Photograph #3
Thermal Recovery Piping
Photograph #4
Phosphoric Acid Contaminated Exhaust Condenser
32

References None. Bibliography None.
33