Embed Size (px)
Citation preview

1
FSM model for sequential circuits
The mathematical model of a sequential circuit is
called finite-state machine.
FSM is fully characterized by:
S – Finite set of states (‘state’ ~ contents of FFs)
I – Finite set of inputs
O – Finite set of outputs
Mapping of S x I into S (Next – state function)
Mapping of S x I into O (Output function)
FSM model for clocked networks (Mealy-type)
FSMs can be represented in many equivalent forms:
- Transition (state) table, state diagram, circuit diagram etc.
Combinational logic
(functions Z, N)
Memory
Present State
S(ti)
Next State
S(ti+1)
Inputs I(ti) Outputs O(ti)
Clk

2
DESIGN WITH ASM CHARTS
ASM = Algorithmic State Machine
~ Flowchart representation of state graph for
sequential system
Advantages of ASM representation (vs. state
graph):
- Easier to understand the operation of a
system (by inspecting its ASM chart)
- Better suitable for describing systems
with many inputs and outputs
- Provisions for describing both Mealy
and Moore-type systems
- Easier to implement next-state
equations (can read them off directly
from ASM chart)
Limitation: difficult to perform state reduction.

3
ASM NOTATION AND RULES
An ASM chart follows specific conventions and
rules. When these rules are followed, the ASM chart
is equivalent to a state graph (or transition diagram).
Three Components used in ASM:
ASM Notation uses 3 types of ‘boxes’:
(a) The state is represented by a state box, which
may contain an output list (Moore outputs)
(b) Decision box implements conditional branches
(based on the values of input variables)
(c) Conditional output box (for Mealy outputs)

4
ASM BLOCKS
An SM chart consists of SM blocks
Each block describes FSM operation in a given state.
ASM Block ~ state
An SM block has one entrance and one or more exit paths
Example 1
A path from entrance to exit is called a link path
In state S1: Outputs Z1 = Z2 = 1
If X1 = X2 = 0 then Z3 = Z4 = 1 and the machine goes to
next state via path 1

5
Example 2 Equivalent SM blocks
Note: The order in which the inputs are tested may affect
the complexity of ASM chart
Example 3
Equivalent SM charts for a combinational network
Z1 = 1 if A+BC =1 else Z1 = 0

6
Rules for constructing ‘valid’ SM blocks
For every valid combination of input variables
there must be exactly one exit path (because an
exit path must lead to a single next state).
There should be no internal feedback within an
SM block

7
Note: Within a single SM block, several parallel
paths can be ‘active’ at the same time (unlike in a
flowchart for a program in a serial computer)
Note: All of the tests for input variables (within a
block) take place within one clock time.
3 link paths (marked) are
active when
X1 = X2 = 1 and X3 = 0 Equivalent Serial Form:
Only one active link path
between entrance and exit

8
CONVERTING STATE GRAPH INTO ASM
Given the state graph of a sequential machine with a
single input (X) and five outputs, with both Moore
outputs (Za, Zb, Zc) and Mealy outputs (Z1, Z2)
Its equivalent ASM chart is
Note: Moore outputs are placed in the state boxes
Mealy outputs appear in conditional output boxes

9
A timing chart for X = 111000
Note:
- The Moore outputs Za, Zb, Zc change
immediately following the state change
- The Mealy outputs (Z1, Z2) can change after
the state change or an input change
- All outputs have their correct values at the
time of the active clock edge

10
Examples of ASM for sequence detector
Show an ASM chart for the sequence detector:
Z = 1 iff an input sequence ends in 101
(a) Mealy state graph:
S0 = Starting state
Also two or more 0’s received
S1 = Sequence ending in 1 has been
received
S2 = Sequence ending in 10 has been
received
Z X
Clk
S0
0/0
S2 S1
1/1
0/0
0/0 1/0
1/0

11
ASM chart:
Note: Output Z is a conditional output
X
S0
0 1
S1
X 0 1
S2
X
Z
0 1

12
(b) Moore state graph for the same sequence
detector
S0 = Starting state
S1 = Sequence ending in 1
S2 = Sequence ending in 10
S3 = Sequence ending in 101
Present
State
Next State Present
Output(Z) X=0 X=1
S0 S0 S1 0
S1 S2 S1 0
S2 S0 S3 0
S3 S2 S1 1
S3/1 S2/0
S0/0 S1/0 0 1
1
0
1
0 0 1

13
ASM Chart:
Note: Output Z is associated with states
X
S0
0
1
S1
X
0
1
S2
1 X 0
Z S3
X 0
1

14
DERIVATION OF ASM CHARTS
The process is similar to deriving a state diagram
from the word description:
- understand the problem
- define required inputs/outputs
- define states
- construct ASM chart
- test it using example input sequences
Possible ambiguity in
- interpreting word specs
- selecting Moore vs. Mealy implementation

15
Simple Example: Single state (Z) machine.
Construct an SM block that has 3 input variables
(A,B,C), 4 outputs (W,X,Y,Z), and 2 exit paths.
For this block, output Z is always 1(~Moore), and W
is 1 iff A and B are both 1(~Mealy). If C = 1 and A =
0, Y = 1 and exit path 1 is taken. If C = 0 or A = 1,
X=1(~Mealy) and exit path 2 is taken
Z
A 1 0
X
X
C 0 1
Y
B 1 0
W
EXIT 2 EXIT 1

16
Example: ASM Chart for the multiplier control
Recall the problem:
Multiplier control
Final state graph for add-shift control

17
SM chart for Add-Shift control
In S0: When St=1 the registers are loaded.
In S1: test M to determine whether to add or just
shift.
In S2: The Shift signal is generated (since the Add
is always followed by Shift).
In S3: The Done signal is turned on.
SM Chart for Binary Multiplier
NOTE: - M input is tested first (before K)
- Sh implemented as Mealy for M=0 and as Moore for M=1

18
Example ASM chart for Multiplier control
(multiplication of two 4-bit numbers).
State Diagram:

19
An equivalent SM chart

20
Implementation of ASM charts
Similar to realization of sequential networks
using transition diagrams:
Transition diagram / ASM chart
State assignment
Output and next-state equations
FF input logic / PAL equations / etc.
Circuit implementation
But the output and next-state equations can be
derived directly from ASM charts

21
For the example of ASM chart introduced earlier:
Equivalent SM chart
Moore outputs: Za = AB Zb = AB Zc = AB
22
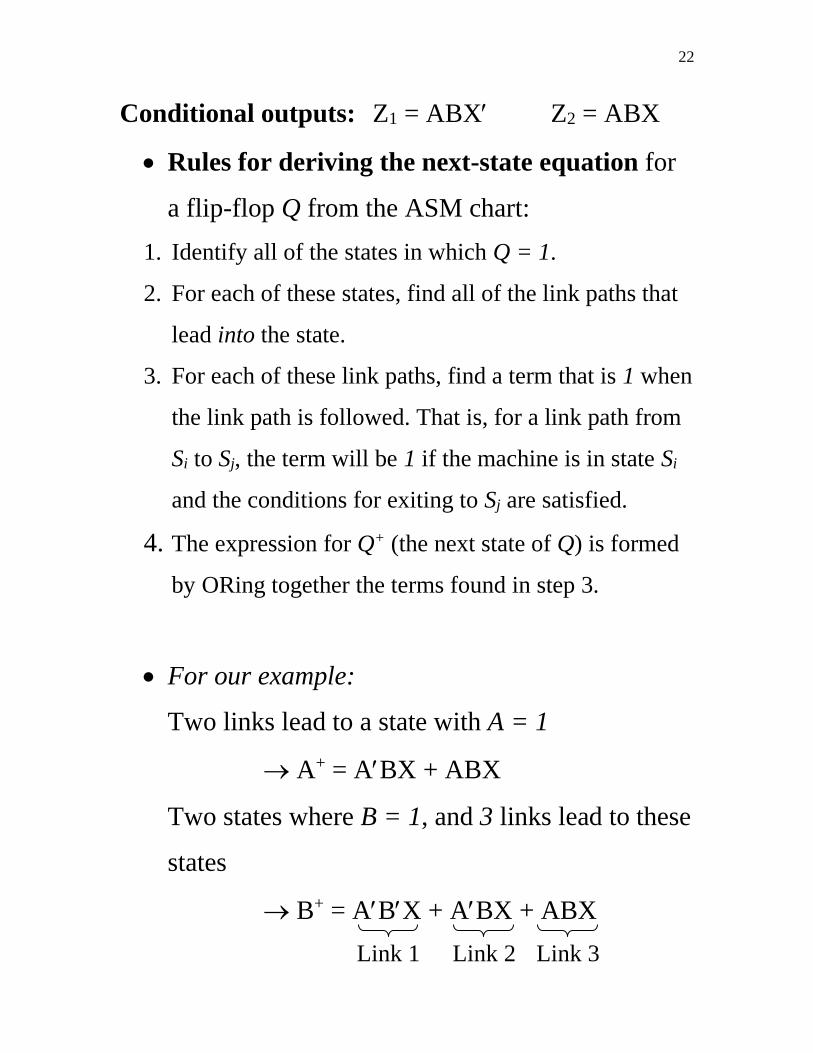
Conditional outputs: Z1 = ABX Z2 = ABX
Rules for deriving the next-state equation for
a flip-flop Q from the ASM chart:
1. Identify all of the states in which Q = 1.
2. For each of these states, find all of the link paths that
lead into the state.
3. For each of these link paths, find a term that is 1 when
the link path is followed. That is, for a link path from
Si to Sj, the term will be 1 if the machine is in state Si
and the conditions for exiting to Sj are satisfied.
4. The expression for Q+ (the next state of Q) is formed
by ORing together the terms found in step 3.
For our example:
Two links lead to a state with A = 1
A+ = ABX + ABX
Two states where B = 1, and 3 links lead to these
states
B+ = ABX + ABX + ABX
Link 1 Link 2 Link 3
23
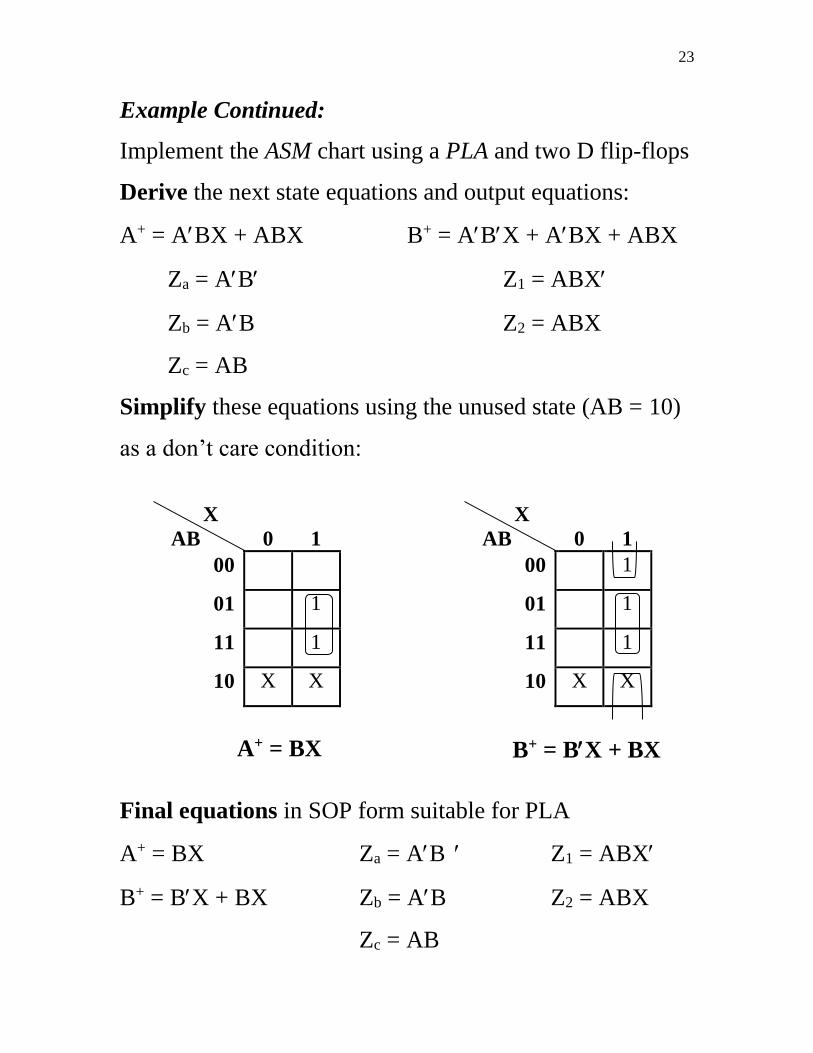
Example Continued:
Implement the ASM chart using a PLA and two D flip-flops
Derive the next state equations and output equations:
A+ = ABX + ABX B+ = ABX + ABX + ABX
Za = AB Z1 = ABX
Zb = AB Z2 = ABX
Zc = AB
Simplify these equations using the unused state (AB = 10)
as a don’t care condition:
Final equations in SOP form suitable for PLA
A+ = BX Za = AB Z1 = ABX
B+ = BX + BX Zb = AB Z2 = ABX
Zc = AB
X
AB
0
1
00
01 1
11 1
10 X X
X
AB
0
1
00 1
01 1
11 1
10 X X
A+ = BX B+ = BX + BX

24
PLA program table:
X A B A+ B+ Za Zb Zc Z1 Z2
1 - 1 1 1 0 0 0 0 0
1 - 0 0 1 0 0 0 0 0
- 0 0 0 0 1 0 0 0 0
- 0 1 0 0 0 1 0 0 0
- 1 1 0 0 0 0 1 0 0
0 1 1 0 0 0 0 0 1 0
1 1 1 0 0 0 0 0 0 1

25
Example:
Realize the following SM chart using a PLA and D flip-
flops that trigger on the falling edge of the clock pulse.
Draw a block diagram and give the PLA table. (Do not
simplify the equations.)
Next State equations and output equations:
A+ = ABX1X3 + ABX1
B+ = ABX1X2 + ABX1X3 + ABX1 + ABX2
Z1 = AB ~ Moore
Z2 = ABX1 + AB
Z3 = ABX1 + ABX1 ~ Mealy

26
A B X1 X2 X3 A+ B+ Z1 Z2 Z3
0 0 1 - 1 1 0 0 0 0
0 1 1 - - 1 0 0 0 0
0 0 0 1 - 0 1 0 0 0
0 0 1 - 0 0 1 0 0 0
0 1 0 - - 0 1 0 0 1
1 0 - 0 - 0 1 0 0 0
0 0 - - - 0 0 1 0 0
0 0 0 - - 0 0 0 1 0
1 0 - - - 0 0 0 1 0
0 0 1 - - 0 0 0 0 1
FF
FF
Z1 Z2 Z3
A+
B+
X1
X2
X3 PLA
A
B