Embed Size (px)
Citation preview

Please Refer to last page for important disclosures and analyst certifications www.jamapunji.pk
Foundation Research|
Equities
PAKISTAN
FSL Steel Universe 2QFY19 Profitability
EPS 2QFY19 YoY QoQ 1HFY19 YoY
MUGHAL 1.43 14% 2% 2.83 15%
ASTL 0.36 -68% -74% 1.74 -2%
ISL 2.09 -23% 8% 4.02 -20%
Investment ratios
MUGHAL 2QFY18 3QFY18 4QFY18 1QFY19 2QFY19
GP Margin 13% 13% 12% 12% 11%
EBITDA Margin 10% 10% 10% 10% 9%
NP Margin 5% 6% 6% 6% 4%
ASTL
GP Margin 19% 21% 13% 15% 10%
EBITDA Margin 16% 18% 11% 13% 8%
NP Margin 9% 10% 13% 7% 2%
ISL
GP Margin 18% 16% 14% 14% 11%
EBITDA Margin 17% 14% 13% 15% 11%
NP Margin 10% 8% 9% 7% 7%
Source: Company Accounts, FSL Research, March 2019
FSL Steel universe V/s KSE-100 Index
Source: Bloomberg, FSL Research, March 2019
0
0.2
0.4
0.6
0.8
1
1.2
Mar-1
8
Ap
r-18
May-1
8
Jun
-18
Jul-1
8
Au
g-18
Sep
-18
Oct-1
8
No
v-18
De
c-18
Jan-1
9
Feb
-19
MUGHAL KSE-100 ISL ASTL
Analyst
Usman Arif [email protected]
+92 21 35612290 Ext 339
Foundation Securities (Pvt)
LtdTuesday, March 5, 2019
Pakistan Steel What’s Brewing! Volumes up & value?
Event
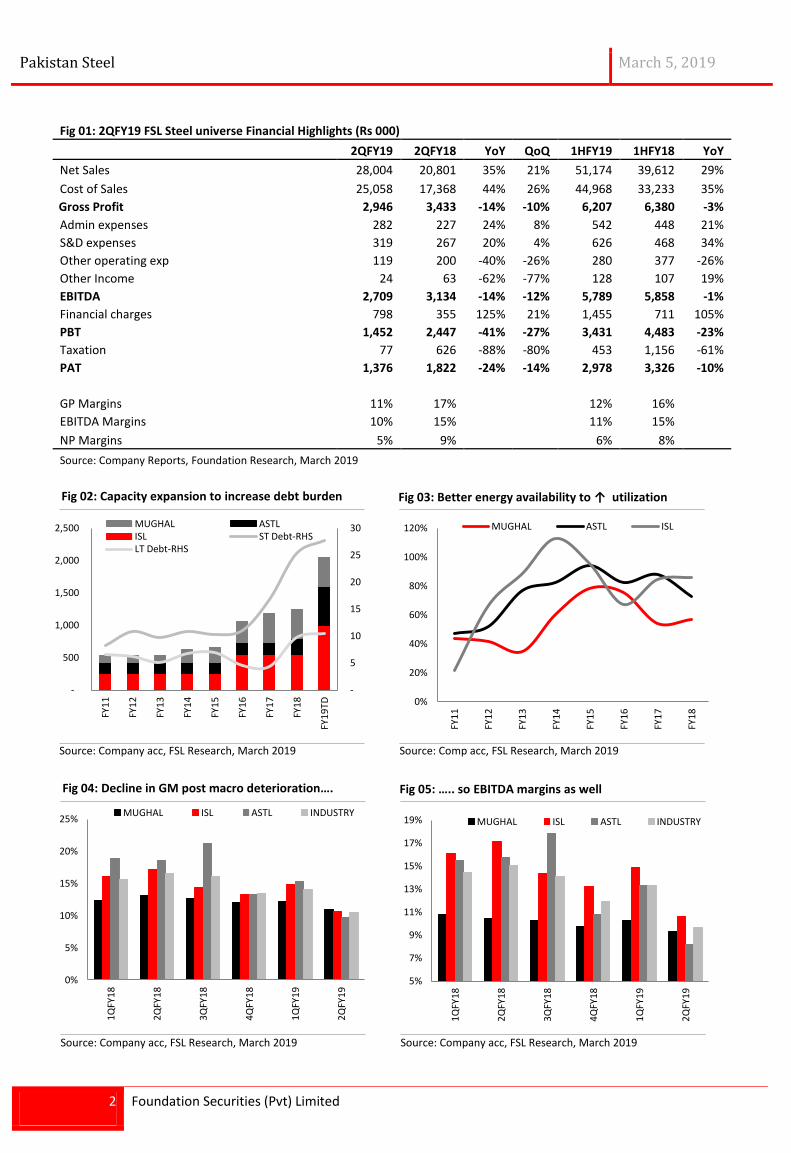
FSL steel universe profitability declined by 24/14% YoY/QoQ in 2QFY19. Decline in earnings is attributable to 1) lagged impact of rupee devaluation on margins, (2) increased competition, (3) higher input cost, (4) increased finance cost and (5) lower PSDP spending. Furthermore, industry effective tax rate declined from 26% to 5% YoY in 2QFY19, without considering impact of tax credits, earnings are down by 41/27% YoY/QoQ in 2QFY19.
ASTL witnessed highest decline in earnings (down by 68% YoY), followed by ISL (down by 23% YoY). While, MUGHAL posted earnings growth of 14% YoY in 2QFY19.
Impact
Higher volumes will take time to translate for Long steel profitability: Long Steel manufacturer’s posted mixed results where ASTL/MUGHAL posted earnings decline/increase of 68/14% YoY in 2QFY19. However, both long steel manufacturers were affected to (1) lower gross margins, (2) higher finance cost, (3) increase in scrap prices (up 28% YoY) and (4) hike in energy cost during the quarter under review.
ASTL decline in earnings is attributable to (1) 9ppt YoY decrease in gross margins, (2) higher finance cost (up 156/35% YoY/QoQ in 2QFY19) due to 450bps hike in policy rate, and (3) multiple one-offs. Furthermore, despite lower public sector spending ASTL was able to post top-line growth of 81/8% YoY/QoQ in 2QFY19 due to higher retention prices (up approx 15% YoY) and increased volumes (up approx 57% YoY) provided by higher production from Dhabeji plant.
Higher retail segment in sales mix and increased sales of MUGHAL supreme (with 72K Psi properties) has allowed MUGHAL to post profitability growth of 14/2% YoY/QoQ in 2QFY19. However, notably company’s margins have declined due to industry wide factors. Furthermore, company’s finance cost is up by 68/29% YoY/QoQ in 2QFY19 due to 15% increase in total debt and higher interest rate. Moreover, in stiff competitive environment MUGHAL was able to post topline growth of 39/34% YoY/QoQ in 2QFY19 due to higher volumes based on increased in-house melting and better prices.
One time Tax credit save the day for Flat steel manufacturer: ISL witnessed decrease/increase in its profitability by 23%/8% YoY/QoQ in 2QFY19. Decrease in profitability is attributable to (1) lower gross margins (↓7ppt YoY), (2) increased competition from importers post trade war and (3) higher finance cost (up 157% YoY in 2QFY19) due to increased interest rate and debt (up 146% to Rs15.6bn). Furthermore, in 2QFY19 ISL booked tax credit available on its new CRC mill commissioned in 4QFY18. However, PBT was down by 47/23% YoY/QoQ in 2QFY19.
Outlook
We have a cautious stance towards the sector given (1) increased competition, (2) further deterioration in macros, (3) lower PSDP spending, and (4) increased regulatory tightening of property market.
Flat steel manufacturers near term earnings growth may remain limited due to increased dumping from other countries after imposition of ADD on China and Ukraine. Furthermore, long steel manufacturer’s margins improvement would remain restricted due to increased focus towards gaining market share of un-graded sector and upcoming new capacities in near future, in our view.
A Fauji Foundation Group Company
REP-095
Pakistan Steel March 5, 2019
2 Foundation Securities (Pvt) Limited
Source: Company acc, FSL Research, March 2019
Fig 02: Capacity expansion to increase debt burden
Source: Comp acc, FSL Research, March 2019
Fig 03: Better energy availability to ↑ utilization
-
5
10
15
20
25
30
-
500
1,000
1,500
2,000
2,500
FY1
1
FY1
2
FY1
3
FY1
4
FY1
5
FY1
6
FY1
7
FY1
8
FY1
9TD
MUGHAL ASTL ISL ST Debt-RHS LT Debt-RHS
0%
20%
40%
60%
80%
100%
120%
FY1
1
FY1
2
FY1
3
FY1
4
FY1
5
FY1
6
FY1
7
FY1
8
MUGHAL ASTL ISL
Source: Company acc, FSL Research, March 2019
Fig 04: Decline in GM post macro deterioration….
Source: Company acc, FSL Research, March 2019
Fig 05: ….. so EBITDA margins as well
0%
5%
10%
15%
20%
25%
1Q
FY1
8
2Q
FY1
8
3Q
FY1
8
4Q
FY1
8
1Q
FY1
9
2Q
FY1
9
MUGHAL ISL ASTL INDUSTRY
5%
7%
9%
11%
13%
15%
17%
19%
1Q
FY1
8
2Q
FY1
8
3Q
FY1
8
4Q
FY1
8
1Q
FY1
9
2Q
FY1
9
MUGHAL ISL ASTL INDUSTRY
Fig 01: 2QFY19 FSL Steel universe Financial Highlights (Rs 000)
2QFY19 2QFY18 YoY QoQ 1HFY19 1HFY18 YoY
Net Sales 28,004 20,801 35% 21% 51,174 39,612 29%
Cost of Sales 25,058 17,368 44% 26% 44,968 33,233 35%
Gross Profit 2,946 3,433 -14% -10% 6,207 6,380 -3%
Admin expenses 282 227 24% 8% 542 448 21%
S&D expenses 319 267 20% 4% 626 468 34%
Other operating exp 119 200 -40% -26% 280 377 -26%
Other Income 24 63 -62% -77% 128 107 19%
EBITDA 2,709 3,134 -14% -12% 5,789 5,858 -1%
Financial charges 798 355 125% 21% 1,455 711 105%
PBT 1,452 2,447 -41% -27% 3,431 4,483 -23%
Taxation 77 626 -88% -80% 453 1,156 -61%
PAT 1,376 1,822 -24% -14% 2,978 3,326 -10%
GP Margins 11% 17%
12% 16% EBITDA Margins 10% 15%
11% 15%
NP Margins 5% 9%
6% 8% Source: Company Reports, Foundation Research, March 2019

Pakistan Steel March 5, 2019
3 Foundation Securities (Pvt) Limited
Source: Company acc, FSL Research, March 2019
Fig 06: Margins stabilize as talks pick momentum
Source: Company acc, FSL Research, March 2019
Fig 07: Increasing scrap prices post Rs depreciation
200
300
400
500
600
700
800
30
40
50
60
70
80
90
100
110
120
Mar
-18
Ap
r-1
8
May
-18
Jun
-18
Jul-
18
Au
g-1
8
Sep
-18
Oct
-18
No
v-1
8
Dec
-18
Jan
-19
Feb
-19
Mar
-19
HRC-CRC margins HRC-LHS CRC-LHS
-
10
20
30
40
50
60
Jan
-16
Ap
r-1
6
Jul-
16
Oct
-16
Jan
-17
Ap
r-1
7
Jul-
17
Oct
-17
Jan
-18
Ap
r-1
8
Jul-
18
Oct
-18
Jan
-19
Scrap Price (Pkr 000/ton)

Pakistan Steel March 5, 2019
4 Foundation Securities (Pvt) Limited
Abbreviations BVPS Book value per share FY Fiscal year EBITDA Earnings before interest tax depreciation and amortization EBIT Earnings before interest and tax EPS Earnings per share EV Enterprise Value HRC Hot Rolled Coil CRC Cold Rolled Coil LT Long term ST Short Term PAT Profit before tax PBT Profit after tax PB Price-to-Book PE Price-to-Earnings PP&E Property, plant and equipment TP Target Price SH Shareholding ROA Return on Asset ROE Return on Equity YoY Year-on-Year Bn Billion Mn Million GP Gross Profit LDCP Last Day Closing Price
Disclaimer: This report has been prepared by FSL. The information and opinions contained herein have been compiled or arrived at based upon information obtained from sources believed to be reliable and in good faith. Such information has not been independently verified and no guaranty, representation or warranty, express or implied is made as to its accuracy, completeness or correctness. All such information and opinions are subject to change without notice. This document is for information purposes only. Descriptions of any company or companies or their securities mentioned herein are not intended to be complete and this document is not, and should not be construed as, an offer, or solicitation of an offer, to buy or sell any securities or other financial instruments. FSL may, to the extent permissible by applicable law or regulation, use the above material, conclusions, research or analysis before such material is disseminated to its customers. Not all customers will receive the material at the same time. FSL, their respective directors, officers, representatives, employees, related persons may have a long or short position in any of the securities or other financial instruments mentioned or issuers described herein at any time and may make a purchase and/or sale, or offer to make a purchase and/or sale of any such securities or other financial instruments from time to time in the open market or otherwise, either as principal or agent. FSL may make markets in securities or other financial instruments described in this publication, in securities of issuers described herein or in securities underlying or related to such securities. FSL may have recently underwritten the securities of an issuer mentioned herein. This document may not be reproduced, distributed or published for any purposes.
Research Dissemination Policy: Foundation Securities (Pvt.) Ltd. endeavors to make all reasonable efforts to disseminate research to all eligible
clients in a timely manner through either physical or electronic distribution such as mail, fax and/or email. Nevertheless, not all clients may receive the material at the same time.
Target price risk disclosures: Any inability to compete successfully in their markets may harm the business. This could be a result of many factors
which may include geographic mix and introduction of improved products or service offerings by competitors. The results of operations may be materially affected by global economic conditions generally, including conditions in financial markets. The company is exposed to market risks, such as changes in interest rates, foreign exchange rates and input prices. From time to time, the company will enter into transactions, including transactions in derivative instruments, to manage certain of these exposures.
Analyst certification: The views expressed in this research accurately reflect the personal views of the analyst(s) about the subject securities or issuers
and no part of the compensation of the analyst(s) was, is, or will be directly or indirectly related to the inclusion of specific recommendations or views in this research. The analyst principally responsible for the preparation of this research receives compensation based on overall revenues of Foundation Securities and has taken reasonable care to achieve and maintain independence and objectivity in making any recommendations.
Recommendations definitions If Expected return >+10% Outperform. Expected return from -10% to +10% Neutral. Expected return <-10% Underperform.
Important disclosures: