Embed Size (px)
Citation preview

RESULTS REVIEW 2QFY19 31 OCT 2018
Divi’s Labs SELL
Terrific, but unsustainable Divi’s Labs (DIVI) reported a blowout quarter, benefitting from a favorable base, currency impact, one time API opportunities and a belated surge of orders post import alert clearance. Revenues grew up 44/29% YoY/QoQ to Rs 12.85bn, EBITDA margin at 40% expanded 887bps, while PAT jumped 92% YoY to Rs 3.98bn. Margin expansion was led by currency benefits and oplev. APAT (Rs 3.45bn) beat our estimates by 20% adjusted for Rs 528mn forex gain. Business momentum is clearly in DIVI’s favour, but the CRAMS business is lumpy. There is a risk in extrapolating this quarter ahead. Moreover, the contribution of low-margin API generics is constantly increasing and has jumped to 58-59% in 2QFY19 (from 56% in 2QFY18). Changing business mix and impending capex of Rs 15bn will make it difficult for DIVI to maintain 40% margin. These factors, coupled with an 11% fall in INR, limit our revenue and earnings CAGR at 17/26% CAGR (FY18-21E) on a favourable base.
At CMP, DIVI is trading at 30x FY19E and 26x FY20E
EPS, ~20% premium to its historical average. There have been times when DIVI has delivered 40% plus RoICs, but it has rarely traded above 25x one year forward P/E. We believe these valuations are rich for a B2B player. Downgrade to SELL with a TP of Rs 1,345 (22x Sep-20E EPS).
Highlights of the quarter Segment insights: (1) API generics contributed 58% to
revenues and grew 46% YoY. (2) Custom synthesis, with 42% contribution, grew 35% YoY. (3) Nutraceuticals sales came in at Rs 1bn, to achieve Rs 4bn in FY19E.
Margin: Gross margins were up 330bps YoY on account of currency depreciation and API pricing impact. On-going expansion and recently completed development at the Nutra unit led to the uptick in employee cost. We have not expanded EBITDA margins over FY19-21E, as we expect incremental capex and growth in API generics to weigh in.
Near-term outlook: The stock has already run up 17% post results announcement, expect fairly limited upside hereon.
Financial Summary (Rs mn) 2QFY19 2QFY18 YoY (%) 1QFY19 QoQ (%) FY18 FY19E FY20E FY21E Net Sales 12,850 8,902 44.3 9,953 29.1 39,128 48,641 55,431 62,669 EBITDA 5,141 2,772 85.5 3,519 46.1 12,617 18,532 21,452 23,877 APAT 3,449 1,962 75.8 2,395 44.0 8,595 13,378 15,171 17,277 Diluted adj. EPS (Rs/sh) 13.0 7.4 75.8 9.0 44.0 32.4 50.4 57.1 65.1 P/E (x) 45.9 29.5 26.0 22.8 RoE (%) 15.2 20.9 20.5 20.3 Source: Company, HDFC sec Inst Research # Consolidated
INDUSTRY PHARMA
CMP (as on 30 Oct 2018) Rs 1,486
Target Price Rs 1,345 Nifty 10,198
Sensex 33,891
KEY STOCK DATA
Bloomberg DIVI IN
No. of Shares (mn) 265
MCap (Rs bn) / ($ mn) 394/5,354
6m avg traded value (Rs mn) 1,180
STOCK PERFORMANCE (%)
52 Week high / low Rs 1,501/860
3M 6M 12M
Absolute (%) 28.5 24.1 70.2
Relative (%) 38.1 27.7 68.3
SHAREHOLDING PATTERN (%)
Promoters 52.0
FIs & Local MFs 17.2
FPIs 17.2
Public & Others 13.7 Source : BSE
Amey Chalke [email protected] +91-22-6171-7321 Eshan Desai [email protected] +91-22-6639-2476
HDFC securities Institutional Research is also available on Bloomberg HSLB <GO> & Thomson Reuters

DIVI’S LABS: RESULTS REVIEW 2QFY19
EBITDA Margin Movement With Rupee Depreciation
Source: Company, HDFC sec Inst Research # Consolidated EBITDA Margin And Impact Of Capex
Source: Company, HDFC sec Inst Research # Consolidated
Historically, 10-14% Rupee depreciation has led to 200-300bps margin expansion, which we believe is already priced in As seen here, EBITDA margins have been under pressure during cycles of intensive capex The exception in FY14 was on account of 10-11% Rupee depreciation
34.0 40.7 43.9 43.0 37.6 36.9 37.9 39.9 37.2 37.3 35.2 32.2 38.1 38.7 38.1
1.1
(12.1)
14.3
3.7
(4.4)
6.0
13.5 11.2
(1.0)
8.3
3.1
(3.7)
10.9
0.7 -
FY 0
7
FY 0
8
FY 0
9
FY 1
0
FY 1
1
FY 1
2
FY 1
3
FY 1
4
FY 1
5
FY 1
6
FY 1
7
FY 1
8
FY 1
9E
FY 2
0E
FY 2
1E
EBITDA Margin (%) Rupee Depreciation (%)
1,468 1,763 970 544
1,583 2,590
3,677 2,431 2,818 2,882
4,194
2,501
8,000
5,500
3,750
34.0
40.7 43.9 43.0
37.6 36.9 37.9 39.9 37.2 37.3 35.2
32.2
38.1 38.7 38.1
FY 0
7
FY 0
8
FY 0
9
FY 1
0
FY 1
1
FY 1
2
FY 1
3
FY 1
4
FY 1
5
FY 1
6
FY 1
7
FY 1
8
FY 1
9E
FY 2
0E
FY 2
1E
Capex (Rs mn) EBITDA Margin (%)
Page | 2

DIVI’S LABS: RESULTS REVIEW 2QFY19
ROIC (%) v/s One year fwd PE multiple for last 10-11 years
Source: Company, HDFC sec Inst Research # Consolidated
Even in years of good RoIC, the company has rarely traded above 25x 1 year forward P/E The exception seen in FY17 is due to unusually low EPS in FY18 which was impacted by import alert The stock is trading at a high multiple of 25.7x at present, which we believe to be unreasonable and is likely to normalize since it is at a significant premium to the 10-year average of ~21x
44.3 42.727.9 32.8 32.9 30.2 31.3 29.4 32.6 28.5 20.4 27.4
29.3
0
5
10
15
20
25
30
35
40
Mar
-08
Mar
-09
Mar
-10
Mar
-11
Mar
-12
Mar
-13
Mar
-14
Mar
-15
Mar
-16
Mar
-17
Mar
-18
Mar
-19
Mar
-20
RoIC (%) 1 yr fwd P/E (x) - LHS PE Average (Oct-08 - Oct-18) - LHS
?
Page | 3

DIVI’S LABS: RESULTS REVIEW 2QFY19
Quarterly Financial Snapshot (Consolidated) Particulars (Rs mn) 2QFY19 2QFY18 YoY (%) 1QFY19 QoQ (%) Net Sales 12,850 8,902 44.3 9,953 29.1 Material Expenses 4,732 3,573 32.4 3,814 24.1 Employee Expenses 1,347 1,048 28.5 1,213 11.0 Other Expenses 1,630 1,509 8.0 1,407 15.8 EBITDA 5,141 2,772 85.5 3,519 46.1 Depreciation 424 339 416 EBIT 4,717 2,433 93.9 3,103 52.0 Other Income 273 230 221 Interest Cost 2 8 6 FX Gains / (Loss) 528 106 267 PBT 5,516 2,761 99.8 3,584 53.9 Tax 1,539 693 923 RPAT 3,977 2,068 92.3 2,662 49.4 EO Items (Adj For Tax) (528) (106) (267) APAT 3,449 1,962 75.8 2,395 44.0 Source: Company, HDFC sec Inst Research Margin Analysis
2QFY19 2QFY18 YoY (bps) 1QFY19 QoQ (bps) Material Expenses % Net Sales 36.8 40.1 (331) 38.3 (150) Employee Expenses % Net Sales 10.5 11.8 (130) 12.2 (171) Other Expenses % Net Sales 12.7 16.9 (427) 14.1 (145) EBITDA Margin (%) 40.0 31.1 887 35.4 466 Tax Rate (%) 27.9 25.1 279 25.7 216 APAT Margin (%) 26.8 22.0 480 24.1 278 Source: Company, HDFC sec Inst Research
Revenues grew ~44% YoY aided by growth across all businesses Gross margin expanded 330bps YoY as a result of favourable currency and API pricing impact Management has guided EBITDA margin to be maintained at 38-40% going head Forex gain for the quarter at Rs 528mn was 4x over previous year
Page | 4

DIVI’S LABS: RESULTS REVIEW 2QFY19
Revenue: Growth Led By Generics Business Gross Margin: Aided By Favourable Currency
Source: Company, HDFC sec Inst Research
Source: Company, HDFC sec Inst Research
EBITDA Margin: Strong Recovery Seen PAT: Showing Tremendous Growth
Source: Company, HDFC sec Inst Research Source: Company, HDFC sec Inst Research
One-time API opportunity and pick up in overall business post import alert clearance were the key factors for revenue jump Despite higher employee spend, improvement in gross margin led to strong EBITDA margin expansion PAT grew 76% YoY when adjusted for forex gain Management has guided for additional capex amounting to Rs 15bn over the next 15 months
10.1 9.6 10.7 8.2 8.9 10.4 10.9 10.0 12.9
3.5 12.0
(3.3)(18.5)
(11.5)
7.8 2.0
21.2
44.3
Q2F
Y17
Q3F
Y17
Q4F
Y17
Q1F
Y18
Q2F
Y18
Q3F
Y18
Q4F
Y18
Q1F
Y19
Q2F
Y19
Revenue (Rs bn) YoY Growth (%)
6.2 6.1 6.5 4.9 5.3 6.3 6.8 6.1 8.1
61.7
63.6
60.5
59.6 59.960.7
62.561.7
63.2
Q2F
Y17
Q3F
Y17
Q4F
Y17
Q1F
Y18
Q2F
Y18
Q3F
Y18
Q4F
Y18
Q1F
Y19
Q2F
Y19
Gross Profit (Rs bn) Gross Margin (%)
2.9 3.8 3.9 2.4 2.8 3.4 3.9 3.5 5.1
29.0
39.536.7
29.8 31.1 33.035.5 35.4
40.0
Q2F
Y17
Q3F
Y17
Q4F
Y17
Q1F
Y18
Q2F
Y18
Q3F
Y18
Q4F
Y18
Q1F
Y19
Q2F
Y19
EBITDA (Rs bn) EBITDA Margin (%)
2.2 2.7 2.6 1.8 2.1 2.2 2.6 2.7 4.0
(24.6)
8.7
(19.5)
(41.5)
(7.6) (16.3)0.9
50.8
92.3
Q2F
Y17
Q3F
Y17
Q4F
Y17
Q1F
Y18
Q2F
Y18
Q3F
Y18
Q4F
Y18
Q1F
Y19
Q2F
Y19
PAT (Rs bn) YoY Growth (%)
Page | 5

DIVI’S LABS: RESULTS REVIEW 2QFY19
Segmental Quarterly Performance (Rs mn) 2QFY19 2QFY18 YoY (%) 1QFY19 QoQ (%) Generics 6,502 4,445 46.3 4,753 36.8 Custom Synthesis 5,269 3,917 34.5 4,280 23.1 Nutraceuticals 1,080 540 100.0 920 17.4 Total 12,850 8,902 44.3 9,953 29.1 Source: HDFC sec Inst Research
Assumptions (Rs mn) FY17 FY18 FY19E FY20E FY21E Generics 20,184 19,332 24,215 28,042 32,249 Growth (%) 7.7 (4.2) 25.3 15.8 15.0 Custom Synthesis 18,478 17,216 20,230 22,408 24,649 Growth (%) 8.5 (6.8) 17.5 10.8 10.0 Nutraceuticals 2,400 2,580 4,000 4,750 5,500 Growth (%) 24.4 7.5 55.0 18.8 15.8 Total 41,063 39,128 48,445 55,201 62,398 Growth (%) 8.9 (4.7) 23.8 13.9 13.0 Source: HDFC sec Inst Research Change In Estimates (Consolidated)
Rs mn Previous New % Chg
FY18 FY19E FY20E FY18 FY19E FY20E FY18 FY19E FY20E Net Sales 39,128 45,700 50,934 39,128 48,641 55,431 0.0 6.4 8.8 EBITDA 12,617 16,772 18,897 12,617 18,532 21,452 0.0 10.5 13.5 APAT 8,595 12,384 14,150 8,595 13,378 15,171 0.0 8.0 7.2 Source: HDFC sec Inst Research
All segments delivered strong growth during the quarter, with the Nutra business doing particularly well We estimate ~24% YoY growth in FY19E owing to favourable currency and uptick post import alert clearance
Page | 6

DIVI’S LABS: RESULTS REVIEW 2QFY19
Peer Set Comparison
Mcap (Rs bn)
CMP (Rs/sh) Reco TP/FV
Adj EPS (Rs/sh) P/E (x) RoE (%) FY18 FY19E FY20E FY21E FY18 FY19E FY20E FY21E FY18 FY19E FY20E FY21E
Sun Pharma 1,347 562 BUY 710 13.0 17.1 24.9 28.5 43.3 32.8 22.6 19.7 8.3 10.4 13.6 13.9 Cipla 491 610 NEU 660 17.6 20.1 25.7 34.5 34.7 30.4 23.8 17.7 10.6 10.8 12.5 14.9 Aurobindo Pharma 451 771 BUY 875 41.4 38.2 56.6 59.8 18.6 20.2 13.6 12.9 23.0 17.6 21.6 18.8 Dr Reddy's Labs 431 2,594 BUY 2,825 59.2 92.1 107.2 149.0 43.8 28.2 24.2 17.4 7.8 11.5 11.9 14.2 Lupin 396 877 BUY 1,160 38.0 28.6 47.4 58.1 23.0 30.7 18.5 15.1 12.7 9.2 14.0 15.2 Divi's Labs 394 1,486 SELL 1,345 32.4 50.4 57.1 65.1 45.9 29.5 26.0 22.8 15.2 20.9 20.5 20.3 Cadila Healthcare 357 348 BUY 470 13.0 17.4 20.5 22.4 26.8 20.1 17.0 15.5 17.0 18.6 18.4 17.3 Torrent Pharma 281 1,660 BUY 1,800 40.1 47.5 71.6 92.1 41.4 35.0 23.2 18.0 15.1 16.3 21.3 23.1 Alkem Laboratories 229 1,919 BUY 2,400 57.6 74.0 97.4 121.1 33.3 25.9 19.7 15.8 14.8 17.0 19.4 20.7 Glenmark 170 604 BUY 800 17.5 28.6 35.9 47.3 34.6 21.1 16.8 12.8 9.4 13.5 14.9 17.0 Alembic Pharma 112 595 NEU 610 21.9 24.2 29.4 38.5 27.2 24.6 20.2 15.4 20.0 18.7 19.2 21.2 Jubilant Life Sciences 104 651 BUY 980 45.5 54.3 63.8 79.2 14.3 12.0 10.2 8.2 19.3 19.3 19.1 19.9 Strides Shasun 37 413 BUY 490 12.7 16.0 25.3 35.8 32.5 25.9 16.3 11.6 2.7 5.7 8.5 11.1 Dishman Carbogen Amcis 37 229 BUY 415 9.6 13.1 17.6 23.2 23.9 17.4 13.0 9.9 3.1 4.1 5.3 6.6 Laurus Labs 36 345 NR 505 15.8 12.9 23.4 32.5 21.8 26.8 14.8 10.6 11.9 8.8 14.3 17.1 Suven Life Sciences 30 236 NR 450 9.7 9.8 11.0 12.5 24.3 24.1 21.5 18.9 17.2 15.2 15.0 15.2 Granules India 25 97 BUY 130 5.2 8.1 10.3 12.2 18.6 11.9 9.4 7.9 12.0 14.9 17.0 17.9 Neuland Labs 7 566 BUY 835 11.0 17.4 57.1 62.2 51.6 32.5 9.9 9.1 2.2 3.5 10.0 12.3 Source: HDFC sec Inst Research
Page | 7
DIVI’S LABS: RESULTS REVIEW 2QFY19
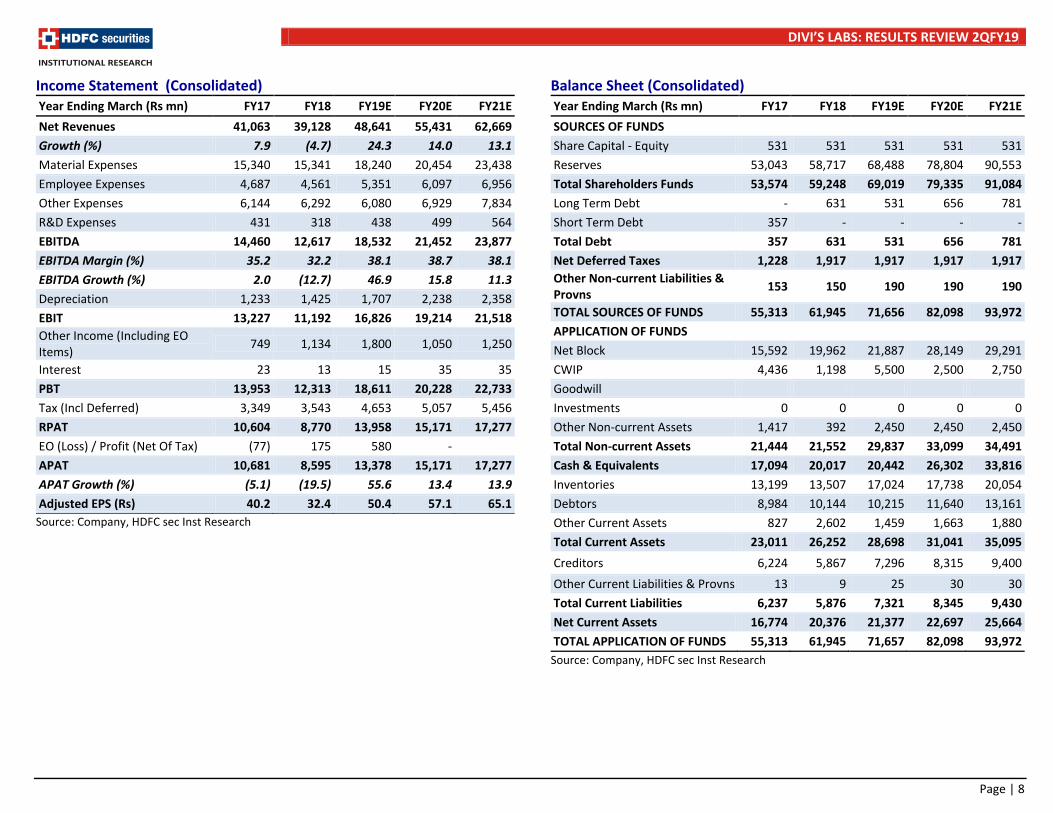
Income Statement (Consolidated) Year Ending March (Rs mn) FY17 FY18 FY19E FY20E FY21E Net Revenues 41,063 39,128 48,641 55,431 62,669 Growth (%) 7.9 (4.7) 24.3 14.0 13.1 Material Expenses 15,340 15,341 18,240 20,454 23,438 Employee Expenses 4,687 4,561 5,351 6,097 6,956 Other Expenses 6,144 6,292 6,080 6,929 7,834 R&D Expenses 431 318 438 499 564 EBITDA 14,460 12,617 18,532 21,452 23,877 EBITDA Margin (%) 35.2 32.2 38.1 38.7 38.1 EBITDA Growth (%) 2.0 (12.7) 46.9 15.8 11.3 Depreciation 1,233 1,425 1,707 2,238 2,358 EBIT 13,227 11,192 16,826 19,214 21,518 Other Income (Including EO Items) 749 1,134 1,800 1,050 1,250
Interest 23 13 15 35 35 PBT 13,953 12,313 18,611 20,228 22,733 Tax (Incl Deferred) 3,349 3,543 4,653 5,057 5,456 RPAT 10,604 8,770 13,958 15,171 17,277 EO (Loss) / Profit (Net Of Tax) (77) 175 580 - APAT 10,681 8,595 13,378 15,171 17,277 APAT Growth (%) (5.1) (19.5) 55.6 13.4 13.9 Adjusted EPS (Rs) 40.2 32.4 50.4 57.1 65.1
Source: Company, HDFC sec Inst Research
Balance Sheet (Consolidated) Year Ending March (Rs mn) FY17 FY18 FY19E FY20E FY21E SOURCES OF FUNDS Share Capital - Equity 531 531 531 531 531 Reserves 53,043 58,717 68,488 78,804 90,553 Total Shareholders Funds 53,574 59,248 69,019 79,335 91,084 Long Term Debt - 631 531 656 781 Short Term Debt 357 - - - - Total Debt 357 631 531 656 781 Net Deferred Taxes 1,228 1,917 1,917 1,917 1,917 Other Non-current Liabilities & Provns 153 150 190 190 190
TOTAL SOURCES OF FUNDS 55,313 61,945 71,656 82,098 93,972 APPLICATION OF FUNDS Net Block 15,592 19,962 21,887 28,149 29,291 CWIP 4,436 1,198 5,500 2,500 2,750 Goodwill Investments 0 0 0 0 0 Other Non-current Assets 1,417 392 2,450 2,450 2,450 Total Non-current Assets 21,444 21,552 29,837 33,099 34,491 Cash & Equivalents 17,094 20,017 20,442 26,302 33,816 Inventories 13,199 13,507 17,024 17,738 20,054 Debtors 8,984 10,144 10,215 11,640 13,161 Other Current Assets 827 2,602 1,459 1,663 1,880 Total Current Assets 23,011 26,252 28,698 31,041 35,095 Creditors 6,224 5,867 7,296 8,315 9,400 Other Current Liabilities & Provns 13 9 25 30 30 Total Current Liabilities 6,237 5,876 7,321 8,345 9,430 Net Current Assets 16,774 20,376 21,377 22,697 25,664 TOTAL APPLICATION OF FUNDS 55,313 61,945 71,657 82,098 93,972
Source: Company, HDFC sec Inst Research
Page | 8
DIVI’S LABS: RESULTS REVIEW 2QFY19
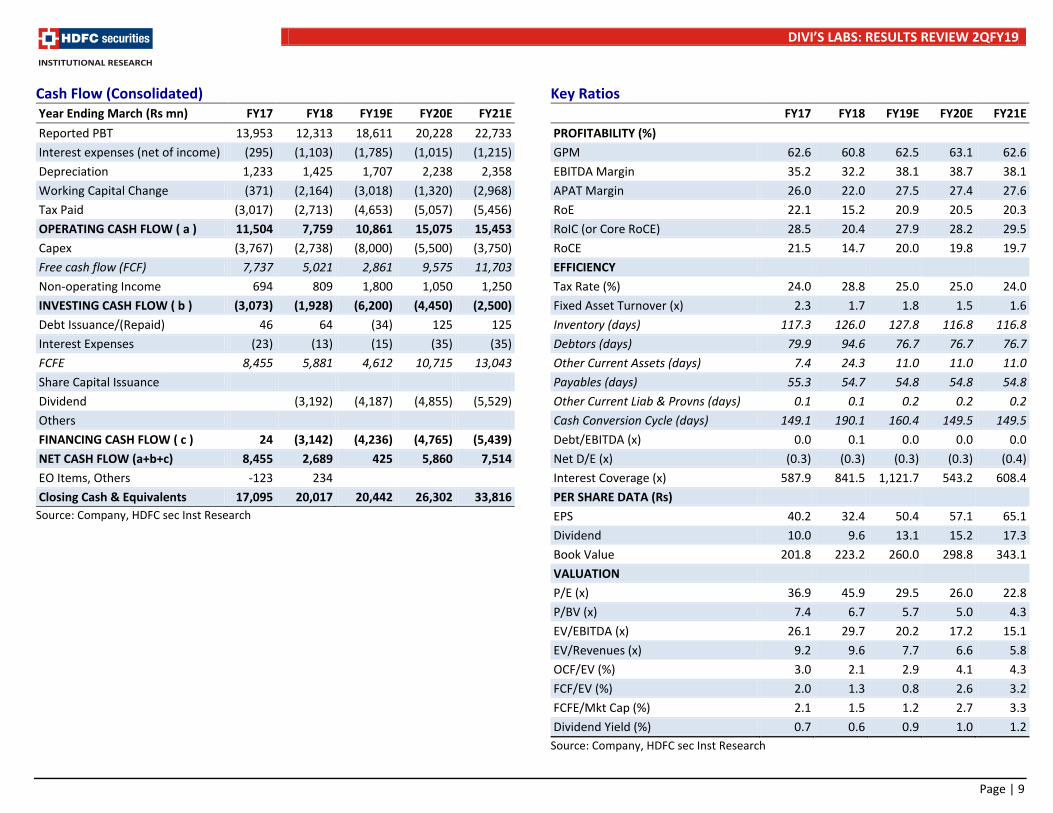
Cash Flow (Consolidated) Year Ending March (Rs mn) FY17 FY18 FY19E FY20E FY21E Reported PBT 13,953 12,313 18,611 20,228 22,733 Interest expenses (net of income) (295) (1,103) (1,785) (1,015) (1,215) Depreciation 1,233 1,425 1,707 2,238 2,358 Working Capital Change (371) (2,164) (3,018) (1,320) (2,968) Tax Paid (3,017) (2,713) (4,653) (5,057) (5,456) OPERATING CASH FLOW ( a ) 11,504 7,759 10,861 15,075 15,453 Capex (3,767) (2,738) (8,000) (5,500) (3,750) Free cash flow (FCF) 7,737 5,021 2,861 9,575 11,703 Non-operating Income 694 809 1,800 1,050 1,250 INVESTING CASH FLOW ( b ) (3,073) (1,928) (6,200) (4,450) (2,500) Debt Issuance/(Repaid) 46 64 (34) 125 125 Interest Expenses (23) (13) (15) (35) (35) FCFE 8,455 5,881 4,612 10,715 13,043 Share Capital Issuance Dividend (3,192) (4,187) (4,855) (5,529) Others FINANCING CASH FLOW ( c ) 24 (3,142) (4,236) (4,765) (5,439) NET CASH FLOW (a+b+c) 8,455 2,689 425 5,860 7,514 EO Items, Others -123 234 Closing Cash & Equivalents 17,095 20,017 20,442 26,302 33,816
Source: Company, HDFC sec Inst Research
Key Ratios
FY17 FY18 FY19E FY20E FY21E PROFITABILITY (%) GPM 62.6 60.8 62.5 63.1 62.6 EBITDA Margin 35.2 32.2 38.1 38.7 38.1 APAT Margin 26.0 22.0 27.5 27.4 27.6 RoE 22.1 15.2 20.9 20.5 20.3 RoIC (or Core RoCE) 28.5 20.4 27.9 28.2 29.5 RoCE 21.5 14.7 20.0 19.8 19.7 EFFICIENCY Tax Rate (%) 24.0 28.8 25.0 25.0 24.0 Fixed Asset Turnover (x) 2.3 1.7 1.8 1.5 1.6 Inventory (days) 117.3 126.0 127.8 116.8 116.8 Debtors (days) 79.9 94.6 76.7 76.7 76.7 Other Current Assets (days) 7.4 24.3 11.0 11.0 11.0 Payables (days) 55.3 54.7 54.8 54.8 54.8 Other Current Liab & Provns (days) 0.1 0.1 0.2 0.2 0.2 Cash Conversion Cycle (days) 149.1 190.1 160.4 149.5 149.5 Debt/EBITDA (x) 0.0 0.1 0.0 0.0 0.0 Net D/E (x) (0.3) (0.3) (0.3) (0.3) (0.4) Interest Coverage (x) 587.9 841.5 1,121.7 543.2 608.4 PER SHARE DATA (Rs) EPS 40.2 32.4 50.4 57.1 65.1 Dividend 10.0 9.6 13.1 15.2 17.3 Book Value 201.8 223.2 260.0 298.8 343.1 VALUATION P/E (x) 36.9 45.9 29.5 26.0 22.8 P/BV (x) 7.4 6.7 5.7 5.0 4.3 EV/EBITDA (x) 26.1 29.7 20.2 17.2 15.1 EV/Revenues (x) 9.2 9.6 7.7 6.6 5.8 OCF/EV (%) 3.0 2.1 2.9 4.1 4.3 FCF/EV (%) 2.0 1.3 0.8 2.6 3.2 FCFE/Mkt Cap (%) 2.1 1.5 1.2 2.7 3.3 Dividend Yield (%) 0.7 0.6 0.9 1.0 1.2
Source: Company, HDFC sec Inst Research
Page | 9

DIVI’S LABS: RESULTS REVIEW 2QFY19
Rating Definitions BUY : Where the stock is expected to deliver more than 10% returns over the next 12 month period NEUTRAL : Where the stock is expected to deliver (-)10% to 10% returns over the next 12 month period SELL : Where the stock is expected to deliver less than (-)10% returns over the next 12 month period
Date CMP Reco Target 10-Oct-17 880 NEU 795 1-Nov-17 883 NEU 700 2-Nov-17 1,073 NEU 1,100 11-Jan-18 1,102 NEU 1,130 29-Jan-18 1,122 NEU 1,100 13-Apr-18 1,121 NEU 1,100 28-May-18 1,149 NEU 1,095 13-Jun-18 1,064 NEU 1,095 10-Jul-18 1,096 NEU 1,095 6-Aug-18 1,208 NEU 1,150 10-Oct-18 1,277 NEU 1,270 31-Oct-18 1,486 SELL 1,345
RECOMMENDATION HISTORY
400
600
800
1,000
1,200
1,400
1,600
Oct
-17
Nov
-17
Dec-
17
Jan-
18
Feb-
18
Mar
-18
Apr-
18
May
-18
Jun-
18
Jul-1
8
Aug-
18
Sep-
18
Oct
-18
Divis TP
Page | 10

DIVI’S LABS: RESULTS REVIEW 2QFY19
Disclosure: We, Amey Chalke, MBA & Eshan Desai, MBA, authors and the names subscribed to this report, hereby certify that all of the views expressed in this research report accurately reflect our views about the subject issuer(s) or securities. HSL has no material adverse disciplinary history as on the date of publication of this report. We also certify that no part of our compensation was, is, or will be directly or indirectly related to the specific recommendation(s) or view(s) in this report. Research Analyst or his/her relative or HDFC Securities Ltd. does not have any financial interest in the subject company. Also Research Analyst or his relative or HDFC Securities Ltd. or its Associate may have beneficial ownership of 1% or more in the subject company at the end of the month immediately preceding the date of publication of the Research Report. Further Research Analyst or his relative or HDFC Securities Ltd. or its associate does not have any material conflict of interest. Any holding in stock –No HDFC Securities Limited (HSL) is a SEBI Registered Research Analyst having registration no. INH000002475. Disclaimer: This report has been prepared by HDFC Securities Ltd and is meant for sole use by the recipient and not for circulation. The information and opinions contained herein have been compiled or arrived at, based upon information obtained in good faith from sources believed to be reliable. Such information has not been independently verified and no guaranty, representation of warranty, express or implied, is made as to its accuracy, completeness or correctness. All such information and opinions are subject to change without notice. This document is for information purposes only. Descriptions of any company or companies or their securities mentioned herein are not intended to be complete and this document is not, and should not be construed as an offer or solicitation of an offer, to buy or sell any securities or other financial instruments. This report is not directed to, or intended for display, downloading, printing, reproducing or for distribution to or use by, any person or entity who is a citizen or resident or located in any locality, state, country or other jurisdiction where such distribution, publication, reproduction, availability or use would be contrary to law or regulation or what would subject HSL or its affiliates to any registration or licensing requirement within such jurisdiction. If this report is inadvertently send or has reached any individual in such country, especially, USA, the same may be ignored and brought to the attention of the sender. This document may not be reproduced, distributed or published for any purposes without prior written approval of HSL. Foreign currencies denominated securities, wherever mentioned, are subject to exchange rate fluctuations, which could have an adverse effect on their value or price, or the income derived from them. In addition, investors in securities such as ADRs, the values of which are influenced by foreign currencies effectively assume currency risk. It should not be considered to be taken as an offer to sell or a solicitation to buy any security. HSL may from time to time solicit from, or perform broking, or other services for, any company mentioned in this mail and/or its attachments. HSL and its affiliated company(ies), their directors and employees may; (a) from time to time, have a long or short position in, and buy or sell the securities of the company(ies) mentioned herein or (b) be engaged in any other transaction involving such securities and earn brokerage or other compensation or act as a market maker in the financial instruments of the company(ies) discussed herein or act as an advisor or lender/borrower to such company(ies) or may have any other potential conflict of interests with respect to any recommendation and other related information and opinions. HSL, its directors, analysts or employees do not take any responsibility, financial or otherwise, of the losses or the damages sustained due to the investments made or any action taken on basis of this report, including but not restricted to, fluctuation in the prices of shares and bonds, changes in the currency rates, diminution in the NAVs, reduction in the dividend or income, etc. HSL and other group companies, its directors, associates, employees may have various positions in any of the stocks, securities and financial instruments dealt in the report, or may make sell or purchase or other deals in these securities from time to time or may deal in other securities of the companies / organizations described in this report. HSL or its associates might have managed or co-managed public offering of securities for the subject company or might have been mandated by the subject company for any other assignment in the past twelve months. HSL or its associates might have received any compensation from the companies mentioned in the report during the period preceding twelve months from t date of this report for services in respect of managing or co-managing public offerings, corporate finance, investment banking or merchant banking, brokerage services or other advisory service in a merger or specific transaction in the normal course of business. HSL or its analysts did not receive any compensation or other benefits from the companies mentioned in the report or third party in connection with preparation of the research report. Accordingly, neither HSL nor Research Analysts have any material conflict of interest at the time of publication of this report. Compensation of our Research Analysts is not based on any specific merchant banking, investment banking or brokerage service transactions. HSL may have issued other reports that are inconsistent with and reach different conclusion from the information presented in this report. Research entity has not been engaged in market making activity for the subject company. Research analyst has not served as an officer, director or employee of the subject company. We have not received any compensation/benefits from the subject company or third party in connection with the Research Report. HDFC securities Limited, I Think Techno Campus, Building - B, "Alpha", Office Floor 8, Near Kanjurmarg Station, Opp. Crompton Greaves, Kanjurmarg (East), Mumbai 400 042 Phone: (022) 3075 3400 Fax: (022) 2496 5066 Compliance Officer: Binkle R. Oza Email: [email protected] Phone: (022) 3045 3600 HDFC Securities Limited, SEBI Reg. No.: NSE-INB/F/E 231109431, BSE-INB/F 011109437, AMFI Reg. No. ARN: 13549, PFRDA Reg. No. POP: 04102015, IRDA Corporate Agent License No.: HDF 2806925/HDF C000222657, SEBI Research Analyst Reg. No.: INH000002475, CIN - U67120MH2000PLC152193 Mutual Funds Investments are subject to market risk. Please read the offer and scheme related documents carefully before investing.
Page | 11

DIVI’S LABS: RESULTS REVIEW 2QFY19
HDFC securities Institutional Equities Unit No. 1602, 16th Floor, Tower A, Peninsula Business Park, Senapati Bapat Marg, Lower Parel, Mumbai - 400 013 Board : +91-22-6171-7330 www.hdfcsec.com
Page | 12