Embed Size (px)
Citation preview
Engineering Applications in Permafrost Areas 487
Frost heave forces on embedded structural units L. DOMASCHUK
Department of Civil Engineering, University of Manitoba, Winnipeg, Canada R3 T2N2
Large-scale model studies of frost heave forces acting on horizontal, vertical, and inclined members embedded in a silt were carried out under frost penetration rates ranging from about 4 to 75 mm per day.
Maximum adfreeze stresses in the range of 150 to 350 kPa under varying rates of frost penetration were measured on steel structural angles embedded vertically in the soil. A limiting value of 350 kPa was attained at a freezing rate of 4 mm per day.
Maximum basal heave pressures in the range of 1900 to 2500 kPa were measured on a short steel structural member placed horizontally on the surface of the soil. No limiting value of basal heave pres- sure was attained under the test conditions used.
Limiting resultant vertical pressures ranging from 350 to 1300 kPa were measured on steel structural members embedded at an inclination of 45 degrees.
A graph of frost heave pressure versus member inclination was prepared on the basis of the study, which should serve as a guide for the design of structural units embedded in frost-susceptible soils.
Des Ctudes de modtrles a grande Cchelle concernant les forces de soultvement par le gel agissant sur des Clements horizontaux, verticaux et inclinks plant& dans du limon, ont kte faites pour des vitesses de pCnCtration du gel allant d’environ 4 mm par jour a 75 mm par jour.
Des contraintes maximales dues a la prise par le gel, allant de 150 kPa a 350 kPa pour diverses vites- ses de penetration du gel, ont CtC mesurkes sur des cornitres d‘acier planties verticalement dans le sol. Une valeur limite de 350 kPa fut obtenue pour une vitesse de congtlation de 4 mm par jour.
Des pressions maximales de soulevement B la base, dans la gamme de 1900 kPa a 2500 kPa, furent mesurkes sur un Climent de charpente en acier court plact horizontalement a la surface du sol. Aucune valeur limite de la pression de soulevement A la base ne fut obtenue dans les conditions d‘essai utilisks.
Des pressions resultantes verticales limites entre 350 kPa et 1300 kPa furent mesurkes sur des 616- ments de charpente en acier plantts a un angle de 45 degrks.
Une courbe de la pression de soultrvement due au gel en fonction de I’angle d’inclinaison de I’eIC- ment fut track a I’aide des resultats de I’ttude, et cette courbe devrait servir de guide pour la concep- tion d’unites structurales plantees dans des sols gklifs. Proc. 4th Can. Permafrost Conf. (1982)
Introduction
Structural units embedded in frost-susceptible soils may be subjected to significant forces associated with the freezing of the soil. The forces are generally m a d fested in one of two ways. If the soil beneath the unit freezes and expands, it exerts an upward pressure on the base of the unit. This pressure is referred to as basal heave pressure and has been investigated by
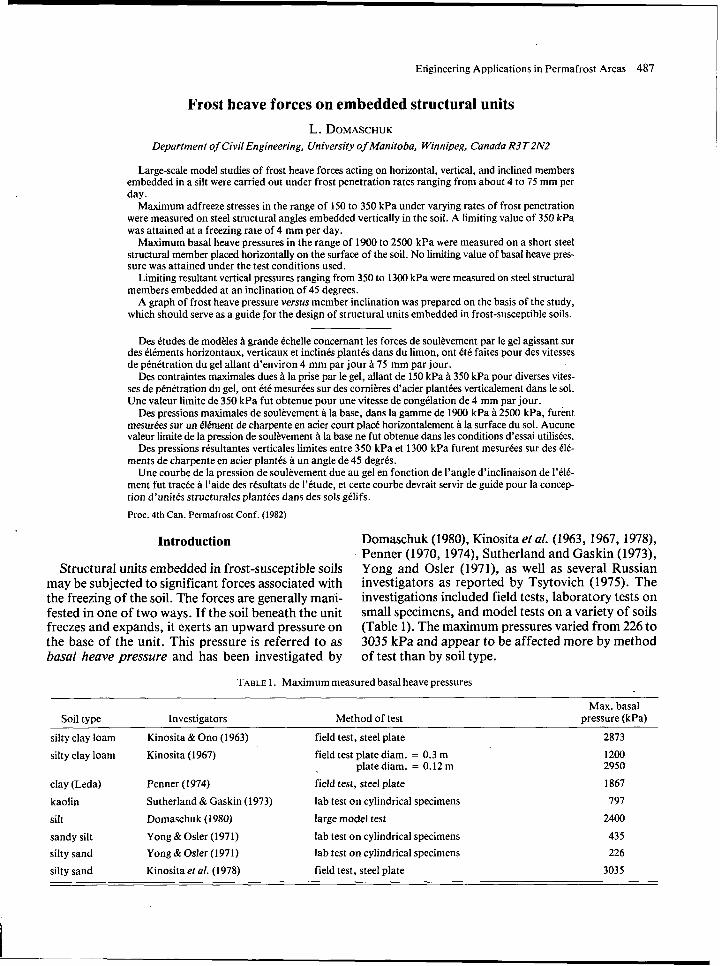
Domaschuk (1980), Kinosita el al. (1963, 1967, 1978), Penner (1970, 1974), Sutherland and Gaskin (1973), Yong and Osler (1971), as well as several Russian investigators as reported by Tsytovich (1975). The investigations included field tests, laboratory tests on small specimens, and model tests on a variety of soils (Table 1). The maximum pressures varied from 226 to 3035 kPa and appear to be affected more by method of test than by soil type.
TABLE 1. Maximum measured basal heave pressures
Max. basal Soil type Investigators Method of test pressure (kPa)
silty clay loam silty clay loam
clay (Leda) kaolin silt sandy silt silty sand silty sand
Kinosita & Ono (1963)
Kinosita (1967)
Penner (1974)
Sutherland & Gaskin (1973)
Domaschuk (1980)
Yong &Osler (1971)
Yong& Osler (1971)
Kinosita et al. (1978)
field test, steel plate field test plate diam. = 0.3 m
field test, steel plate lab test on cylindrical specimens large model test lab test on cylindrical specimens lab test on cylindrical specimens field test, steel plate
plate diam. = 0.12 m
2873
1200 2950
1867
797
2400
435
226
3035
488 4TH CAN. PERMAFROST CONF. (1982)
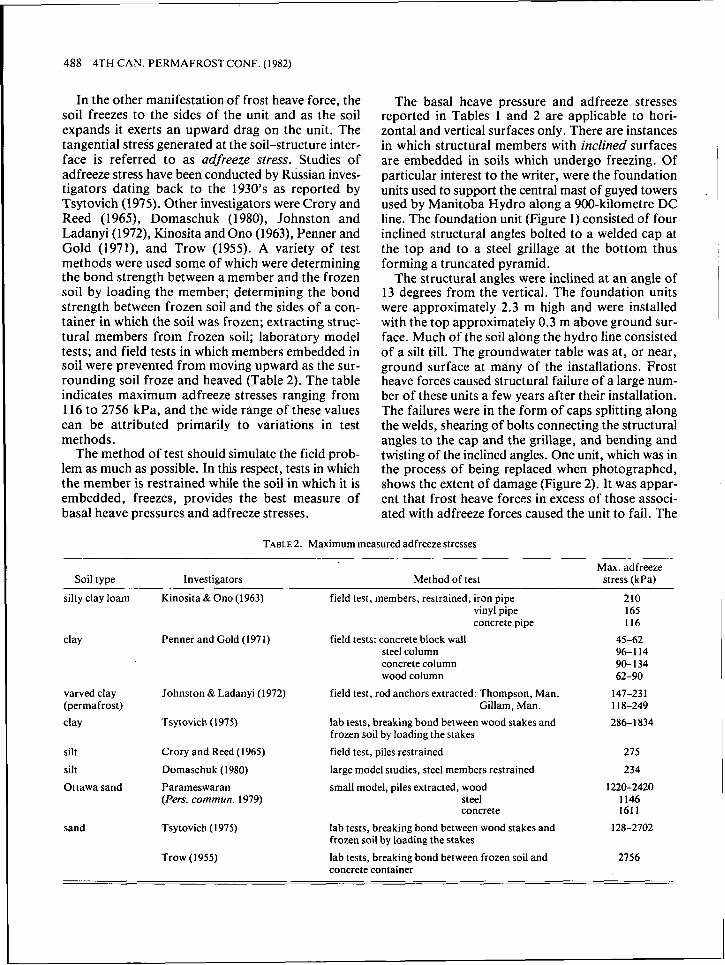
In the other manifestation of frost heave force, the soil freezes to the sides of the unit and as the soil expands it exerts an upward drag on the unit. The tangential stress generated at the soil-structure inter- face is referred to as adfreeze stress. Studies of adfreeze stress have been conducted by Russian inves- tigators dating back to the 1930’s as reported by Tsytovich (1975). Other investigators were Crory and Reed (1965), Domaschuk (1980), Johnston and Ladanyi (1972), Kinosita and Ono (1963), Penner and Gold (1971), and Trow (1955). A variety of test methods were used some of which were determining the bond strength between a member and the frozen soil by loading the member; determining the bond strength between frozen soil and the sides of a con- tainer in which the soil was frozen; extracting strucl tural members from frozen soil; laboratory model tests; and field tests in which members embedded in soil were prevented from moving upward as the sur- rounding soil froze and heaved (Table 2). The table indicates maximum adfreeze stresses ranging from 116 to 2756 kPa, and the wide range of these values can be attributed primarily to variations in test methods.
The method of test should simulate the field prob- lem as much as possible. In this respect, tests in which the member is restrained while the soil in which it is embedded, freezes, provides the best measure of basal heave pressures and adfreeze stresses.
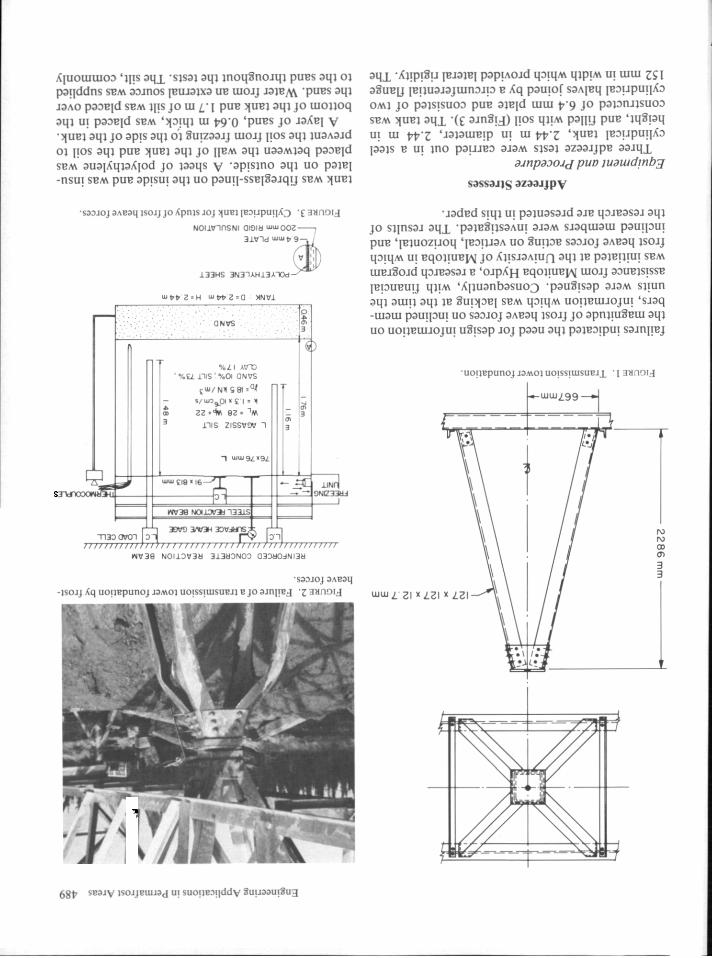
The basal heave pressure and adfreeze stresses reported in Tables 1 and 2 are applicable to hori- zontal and vertical surfaces only. There are instances in which structural members with inclined surfaces are embedded in soils which undergo freezing. Of particular interest to the writer, were the foundation units used to support the central mast of guyed towers used by Manitoba Hydro along a 900-kilometre DC line. The foundation unit (Figure 1) consisted of four inclined structural angles bolted to a welded cap at the top and to a steel grillage at the bottom thus forming a truncated pyramid.
The structural angles were inclined at an angle of 13 degrees from the vertical. The foundation units were approximately 2.3 m high and were installed with the top approximately 0.3 m above ground sur- face. Much of the soil along the hydro line consisted of a silt till. The groundwater table was at, or near, ground surface at many of the installations. Frost heave forces caused structural failure of a large num- ber of these units a few years after their installation. The failures were in the form of caps splitting along the welds, shearing of bolts connecting the structural angles to the cap and the grillage, and bending and twisting of the inclined angles. One unit, which was in the process of being replaced when photographed, shows the extent of damage (Figure 2). It was appar- ent that frost heave forces in excess of those associ- ated with adfreeze forces caused the unit to fail. The
TABLE 2. Maximum measured adfreeze stresses
Soil type Investigators Method of test Max. adfreeze
stress (kPa)
silty clay loam
clay
varved clay (permafrost) clay
silt
silt Ottawa sand
sand
Kinosita & Ono (1963)
Penner and Gold (1971)
Johnston & Ladanyi (1972)
Tspovich (1975)
Crory and Reed (1965)
Domaschuk (1980)
Parameswaran (Pers. commun. 1979)
Tsytovich (1975)
Trow (1955)
field test, members, restrained, iron pipe vinyl pipe concrete pipe
field tests: concrete block wall steel column concrete column wood column
field test, rod anchors extracted: Thompson, Man.
lab tests, breaking bond between wood stakes and frozen soil by loading the stakes field test, piles restrained
large model studies, steel members restrained small model, piles extracted, wood
Gillam, Man.
steel concrete
lab tests, breaking bond between wood stakes and frozen soil by loading the stakes lab tests, breaking bond between frozen soil and concrete container
210 165 116
45-62 96-1 14 90- 134 62-90
147-23 1 1 18-249 286-1834
275
234
1146 I61 1
1220-2420
128-2702
2756
S
1
490 4TH CAN. PERMAFROSTCONF. (1982)
encountered in the soils of the Winnipeg area, and referred to as Agassiz silt, was an ML silt. Some of its properties are listed in Figure 3.
The refrigeration equipment used to freeze the soil, consisted of an evaporator with an electric fan and defrost mounted on the side of the tank, a water- cooled condenser, and a compressor. The capacity of the unit was one-half ton and the lowest air tempera- ture attainable in the tank was - 30°C. The air was blown across the surface of the soil, thus providing unidirectional freezing of the soil.
The adfreeze stress was investigated by measuring the vertical thrust exerted on two steel angles, 76.2 x 76.2 mm, embedded vertically in the soil to depths of 1.16 and 1.40 m. The vertical movement of a steel plate, 305 x 203 mm, with an attached rod, placed on the surface of the soil was used as a measure of the frost heave. Thermocouples mounted at 50.8-mm spacing on a wood strap embedded in the soil were used to monitor soil temperatures.
The tests were conducted using frost penetration rates of approximately 12,25, and 75 mm per day.
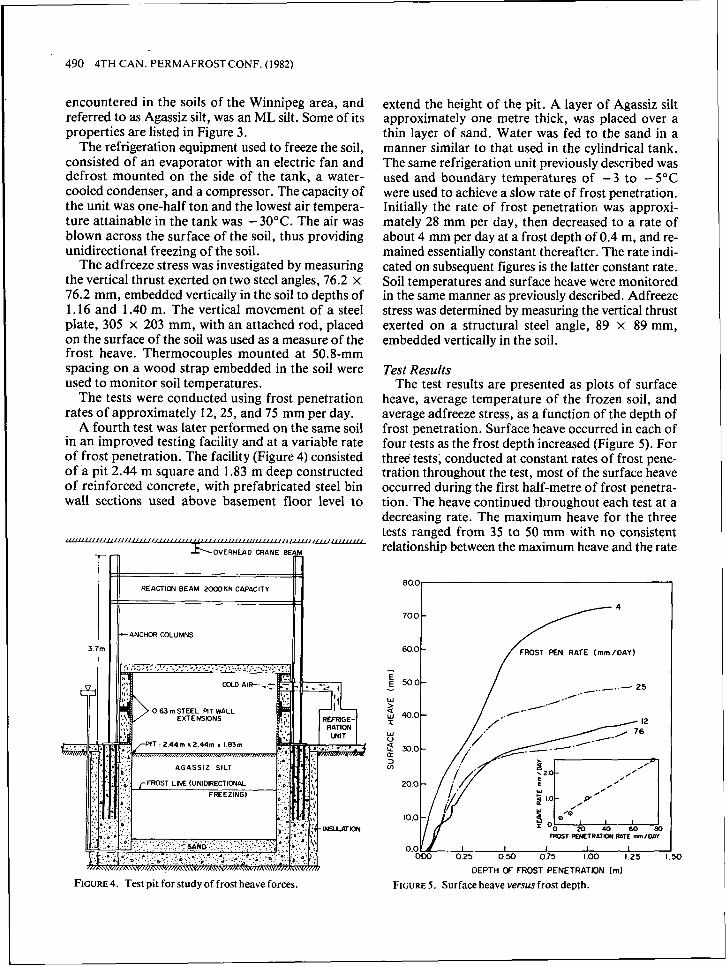
A fourth test was later performed on the same soil in an improved testing facility and at a variable rate of frost penetration. The facility (Figure 4) consisted of .a pit 2.44 m square and 1.83 m deep constructed of reinforced concrete, with prefabricated steel bin wall sections used above basement floor level to
3.7m I &OVERHEAD CRANE E
ANCHOR COLUMNS
0 63 m STEEL RT WALL EXTENSIONS
FIGURE 4. Test pit for study of frost heave forces.
extend the height of the pit. A layer of Agassiz silt approximately one metre thick, was placed over a thin layer of sand. Water was fed to the sand in a manner similar to that used in the cylindrical tank. The same refrigeration unit previously described was used and boundary temperatures of - 3 to - 5°C were used to achieve a slow rate of frost penetration. Initially the rate of frost penetration was approxi- mately 28 mm per day, then decreased to a rate of about 4 mm per day at a frost depth of 0.4 m, and re- mained essentially constant thereafter. The rate indi- cated on subsequent figures is the latter constant rate. Soil temperatures and surface heave were monitored in the same manner as previously described. Adfreeze stress was determined by measuring the vertical thrust exerted on a structural steel angle, 89 x 89 mm, embedded vertically in the soil.
Test Results The test results are presented as plots of surface
heave, average temperature of the frozen soil, and average adfreeze stress, as a function of the depth of frost penetration. Surface heave occurred in each of four tests as the frost depth increased (Figure 5) . For three tests, conducted at constant rates of frost pene- tration throughout the test, most of the surface heave occurred during the first half-metre of frost penetra- tion. The heave continued throughout each test at a decreasing rate. The maximum heave for the three tests ranged from 35 to 50 mm with no consistent relationship between the maximum heave and the rate
50.0 .-. - I - / ____..- 25
/- % I
W > a w 400-
FROST FW&TRATTON RPTE m / D m
OM) 0 2 5 050 075 100 125
a -1 -,- I
DEPTH OF FROST PENETRATON (ml
FIGURE 5. Surface heave versus frost depth.
Engineering Applications in Permafrost Areas 491
of frost penetration. In the fourth test, which had a decreasing rate of frost penetration for the first 0.4 m of frost depth and a very slow rate thereafter, the sur- face heave was much higher. Considering the results of the four tests collectively, the test with the 12 mm/day freezing rate appears to be anomalous. The maximum rate of heave increased with an increase in the rate of frost penetration as indicated in the inset. This supports the finding of Penner (1972).
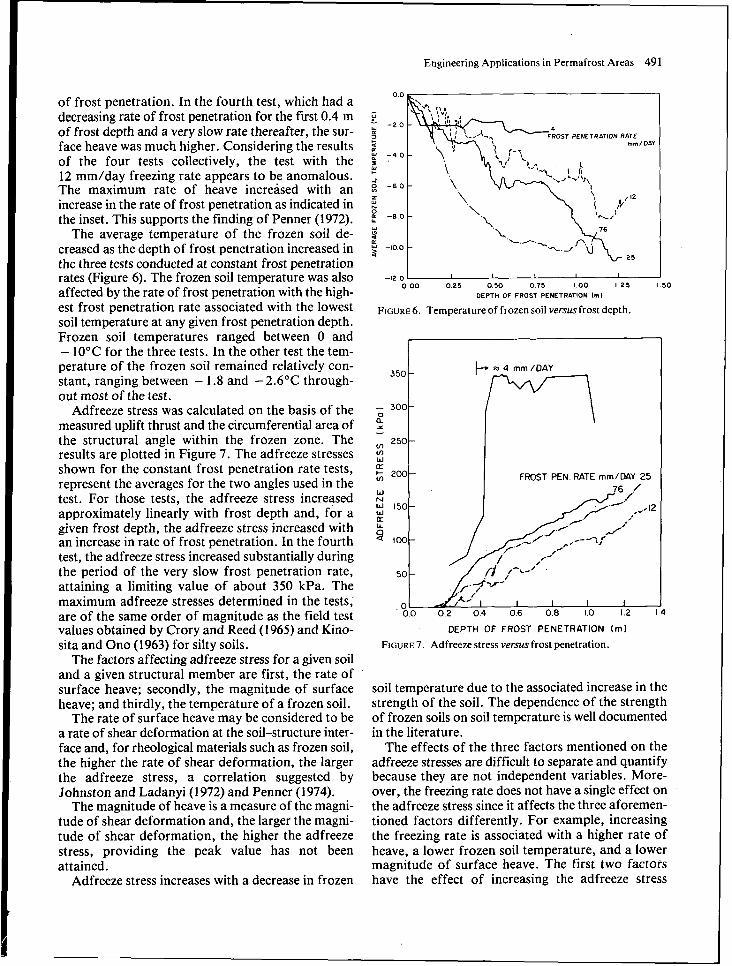
The average temperature of the frozen soil de- creased as the depth of frost penetration increased in the three tests conducted at constant frost penetration rates (Figure 6). The frozen soil temperature was also affected by the rate of frost penetration with the high- est frost penetration rate associated with the lowest soil temperature at any given frost penetration depth. Frozen soil temperatures ranged between 0 and - 10°C for the three tests. In the other test the tem- perature of the frozen soil remained relatively con- stant, ranging between - 1.8 and -2.6"C through- out most of the test.
Adfreeze stress was calculated on the basis of the measured uplift thrust and the circumferential area of the structural angle within the frozen zone. The results are plotted in Figure 7. The adfreeze stresses shown for the constant frost penetration rate tests, represent the averages for the two angles used in the test. For those tests, the adfreeze stress increased approximately linearly with frost depth and, for a given frost depth, the adfreeze stress increased with an increase in rate of frost penetration. In the fourth test, the adfreeze stress increased substantially during the period of the very slow frost penetration rate, attaining a limiting value of about 350 kPa. The maximum adfreeze stresses determined in the tests; are of the same order of magnitude as the field test values obtained by Crory and Reed (1 965) and Kino- sita and Ono (1963) for silty soils.
The factors affecting adfreeze stress for a given soil and a given structural member are first, the rate of surface heave; secondly, the magnitude of surface heave; and thirdly, the temperature of a frozen soil.
The rate of surface heave may be considered to be a rate of shear deformation at the soil-structure inter- face and, for rheological materials such as frozen soil, the higher the rate of shear deformation, the larger the adfreeze stress, a correlation suggested by Johnston and Ladanyi (1 972) and Penner (1 974).
The magnitude of heave is a measure of the magni- tude of shear deformation and, the larger the magni- tude of shear deformation, the higher the adfreeze stress, providing the peak value has not been attained.
Adfreeze stress increases with a decrease in frozen
-12 0 I I I 1 I I I 0 0 0 0 2 5 0 5 0 0 7 5 100 I 2 5 I SO
DEPTH OF FROST PENETRATION Im)
FIGURE 6 . Temperature of frozen soil versusfrost depth.
- 0
1 a - m m W LT t- m
W N W W
L L 0
a
a
+ i FROST PEN. RATE rnrn/EJAY 25
DEPTH OF FROST PENETRATION (rn)
FIGURE 7. Adfreeze stress versus frost penetration.
soil temperature due to the associated increase in the strength of the soil. The dependence of the strength of frozen soils on soil temperature is well documented in the literature.
The effects of the three factors mentioned on the adfreeze stresses are difficult to separate and quantify because they are not independent variables. More- over, the freezing rate does not have a single effect on the adfreeze stress since it affects the three aforemen- tioned factors differently. For example, increasing the freezing rate is associated with a higher rate of heave, a lower frozen soil temperature, and a lower magnitude of surface heave. The first two factors have the effect of increasing the adfreeze stress
492 4TH CAN. PERMAFROSTCONF. (1982)
whereas the third factor has the effect of decreasing the adfreeze stress. Thus, it is difficult to predict what the effect of increasing the rate of frost penetration will have on the adfreeze stress. For these reasons there was no rational pattern to the relative positions of the adfreeze stress curves (see Figure 7).
To attain a limiting value of adfreeze stress, the heave rate must become zero or the temperature of the frozen soil must become constant or increase. In the three constant frost penetration rate tests, as the frost depth increased the heave rate decreased but remained greater than zero, and the temperature of the soil decreased. This accounted for the continued increase in adfreeze stress with frost penetration. In the fourth test, the temperature of the soil and the rate of surface heave became essentially constant with time, and a limiting adfreeze stress for that tempera- ture and rate of heave was attained.
Basal Heave Pressures Equipment and Procedure
Basal heave pressures were investigated concur- rently with the adfreeze stress studies. A short section of a structural member was placed on the surface of the soil and the force required to prevent upward movement of the member was measured. An 813-mm length of a 57 x 15.3 I-beam, was used in the three tests performed at constant rates of frost penetr,ation in the cylindrical tank, and a 914-mm.length of a square tubing, 101.6 x 101.6 mm, was used in the test carried out in the test pit.
Test Results The basal heave pressures computed on the basis of
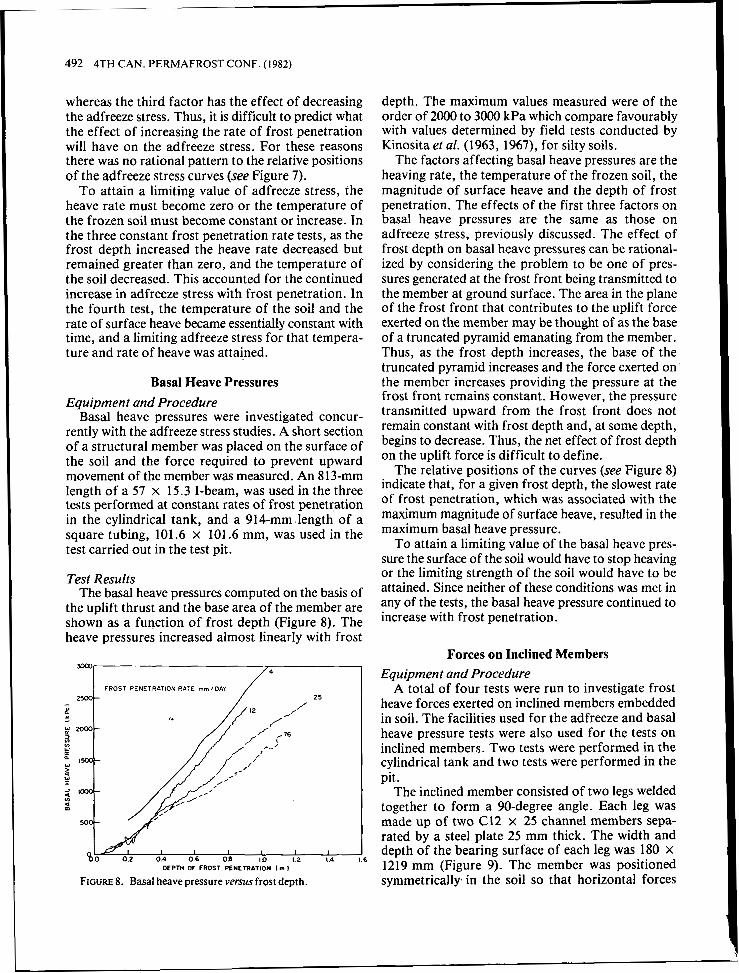
the uplift thrust and the base area of the member are shown as a function of frost depth (Figure 8). The heave pressures increased almost linearly with frost
m r
/4 25 FROST PENETRATION RATE mrn/DAY
FIGURE 8. Basal heave pressure versus frost depth.
depth. The maximum values measured were of the order of 2000 to 3000 kPa which compare favourably with values determined by field tests conducted by Kinosita et al. (1963, 1967), for silty soils.
The factors affecting basal heave pressures are the heaving rate, the temperature of the frozen soil, the magnitude of surface heave and the depth of frost penetration. The effects of the first three factors on basal heave pressures are the same as those on adfreeze stress, previously discussed. The effect of frost depth on basal heave pressures can be rational- ized by considering the problem to be one of pres- sures generated at the frost front being transmitted to the member at ground surface. The area in the plane of the frost front that contributes to the uplift force exerted on the member may be thought of as the base of a truncated pyramid emanating from the member. Thus, as the frost depth increases, the base of the truncated pyramid increases and the force exerted on the member increases providing the pressure at the frost front remains constant. However, the pressure transmitted upward from the frost front does not remain constant with frost depth and, at some depth, begins to decrease. Thus, the net effect of frost depth on the uplift force is difficult to define.
The relative positions of the curves (see Figure 8) indicate that, for a given frost depth, the slowest rate of frost penetration, which was associated with the maximum magnitude of surface heave, resulted in the maximum basal heave pressure.
To attain a limiting value of the basal heave pres- sure the surface of the soil would have to stop heaving or the limiting strength of the soil would have to be attained. Since neither of these conditions was met in any of the tests, the basal heave pressure continued to increase with frost penetration.
Forces on Inclined Members Equipment and Procedure
A total of four tests were run to investigate frost heave forces exerted on inclined members embedded in soil. The facilities used for the adfreeze and basal heave pressure tests were also used for the tests on inclined members. Two tests were performed in the cylindrical tank and two tests were performed in the pit.
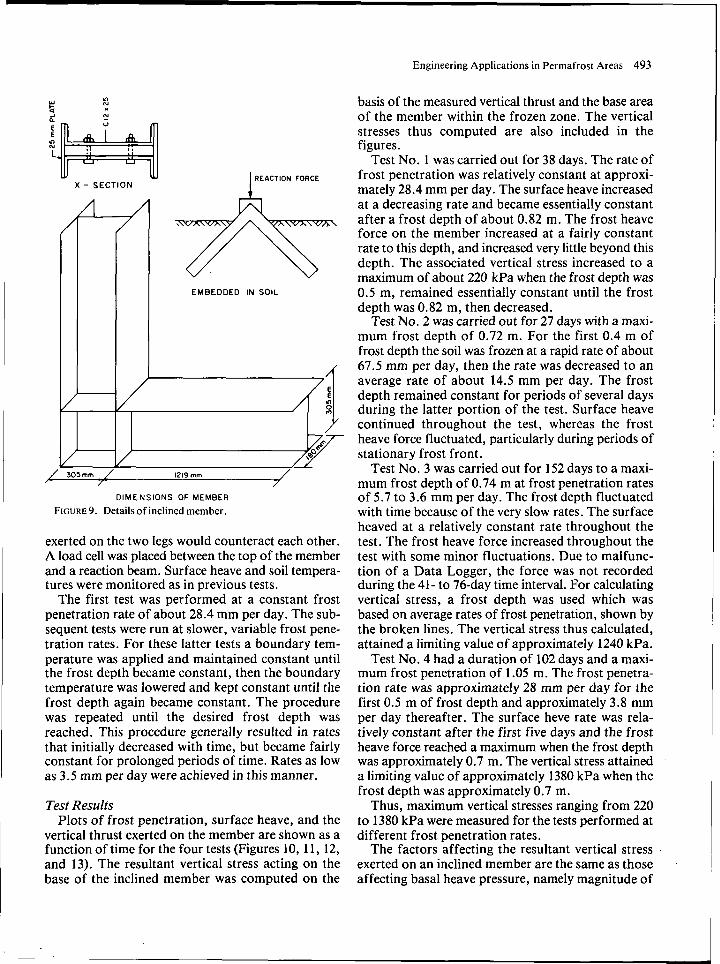
The inclined member consisted of two legs welded together to form a 90-degree angle. Each leg was made up of two C12 x 25 channel members sepa- rated by a steel plate 25 mm thick. The width and depth of the bearing surface of each leg was 180 x 1219 mm (Figure 9). The member was positioned symmetrically in the soil so that horizontal forces
Engineering Applications in Permafrost Areas 493
E 0
X - SECTION
/
REACTION FORCE I
EMBEDDED IN SOIL
305rnm / 1219 mm /
DIMENSIONS OF MEMBER
FIGURE 9. Details of inclined member.
exerted on the two legs would counteract each other. A load cell was placed between the top of the member and a reaction beam. Surface heave and soil tempera- tures were monitored as in previous tests.
The first test was performed at a constant frost penetration rate of about 28.4 mm per day. The sub- sequent tests were run at slower, variable frost pene- tration rates. For these latter tests a boundary tem- perature was applied and maintained constant until the frost depth became constant, then the boundary temperature was lowered and kept constant until the frost depth again became constant. The procedure was repeated until the desired frost depth was reached. This procedure generally resulted in rates that initially decreased with time, but became fairly constant for prolonged periods of time. Rates as low as 3.5 mm per day were achieved in this manner.
Test Results Plots of frost penetration, surface heave, and the
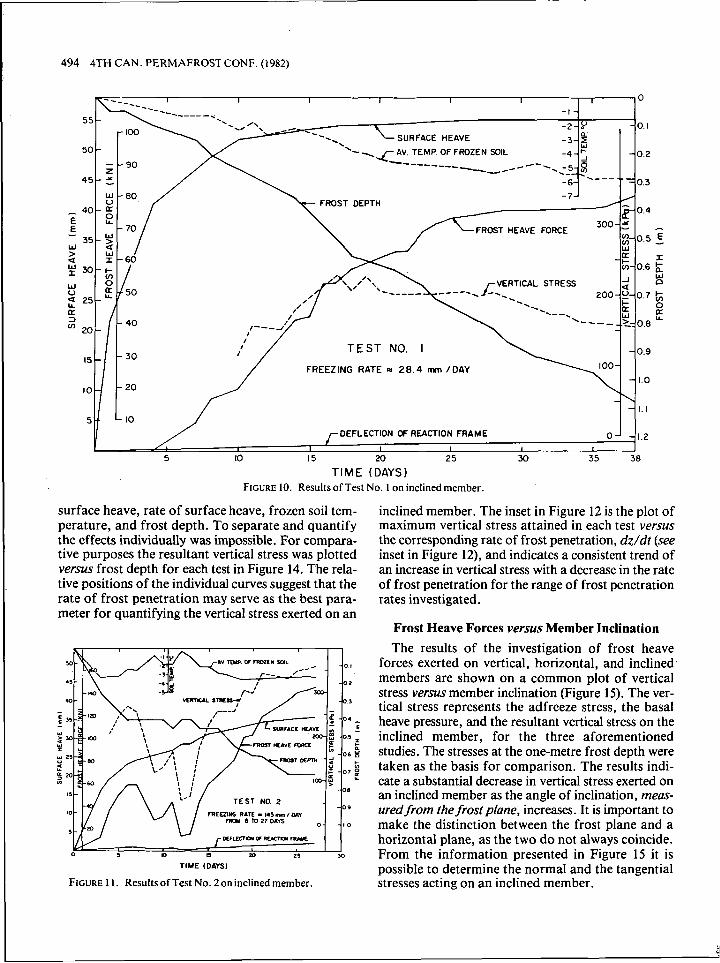
vertical thrust exerted on the member are shown as a function of time for the four tests (Figures 10, 1 1 , 12, and 13). The resultant vertical stress acting on the base of the inclined member was computed on the
basis of the measured vertical thrust and the base area of the member within the frozen zone. The vertical stresses thus computed are also included in the figures.
Test No. 1 was carried out for 38 days. The rate of frost penetration was relatively constant at approxi- mately 28.4 mm per day. The surface heave increased at a decreasing rate and became essentially constant after a frost depth of about 0.82 m. The frost heave force on the member increased at a fairly constant rate to this depth, and increased very little beyond this depth. The associated vertical stress increased to a maximum of about 220 kPa when the frost depth was 0.5 m, remained essentially constant until the frost depth was 0.82 m, then decreased.
Test No. 2 was carried out for 27 days with a maxi- mum frost depth of 0.72 m. For the first 0.4 m of frost depth the soil was frozen at a rapid rate of about 67.5 mm per day, then the rate was decreased to an average rate of about 14.5 mm per day. The frost depth remained constant for periods of several days during the latter portion of the test. Surface heave continued throughout the test, whereas the frost heave force fluctuated, particularly during periods of stationary frost front.
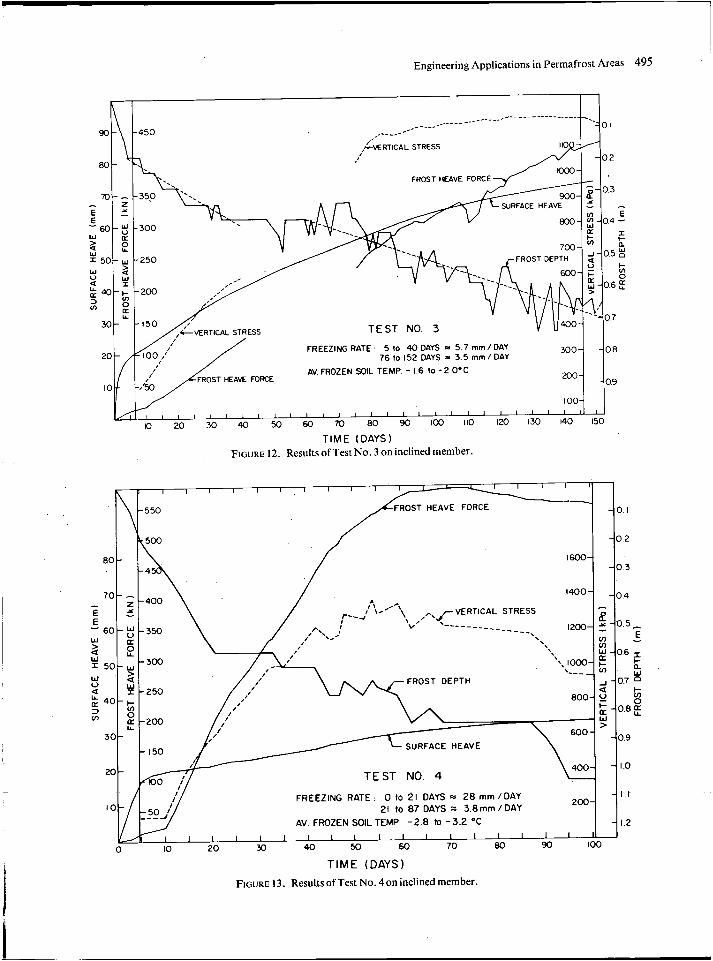
Test No. 3 was carried out for 152 days to a maxi- mum frost depth of 0.74 m at frost penetration rates of 5.7 to 3.6 mm per day. The frost depth fluctuated with time because of the very slow rates. The surface heaved at a relatively constant rate throughout the test. The frost heave force increased throughout the test with some minor fluctuations. Due to malfunc- tion of a Data Logger, the force was not recorded during the 41- to 76-day time interval. For calculating vertical stress, a frost depth was used which was based on average rates of frost penetration, shown by the broken lines. The vertical stress thus calculated, attained a limiting value of approximately 1240 kPa.
Test No. 4 had a duration of 102 days and a maxi- mum frost penetration of 1.05 m. The frost penetra- tion rate was approximately 28 mm per day for the first 0.5 m of frost depth and approximately 3.8 mm per day thereafter. The surface heve rate was rela- tively constant after the first five days and the frost heave force reached a maximum when the frost depth was approximately 0.7 m. The vertical stress attained a limiting value of approximately 1380 kPa when the frost depth was approximately 0.7 m.
Thus, maximum vertical stresses ranging from 220 to 1380 kPa were measured for the tests performed at different frost penetration rates.
The factors affecting the resultant vertical stress exerted on an inclined member are the same as those affecting basal heave pressure, namely magnitude of
494 4TH CAN. PERMAFROST CONF. (1982)
-I - -2- Y 0. I -
a
AV. TEMP OF FROZEN SOIL -4- 2 0 .2 --/-----. -5-si
- 50 - -----___ .- .
- 6- 0.3 --= .--- FROST DEPTH
FROST HEAVE FORCE
W
VERTICAL STRESS
TEST NO. I 0.9 - FREEZING RATE - 28.4 mm /DAY
0- -1.2 DEFLECTION OF REACTION FRAME
5 10 15 20 25 30 35 38
TIME (DAYS) FIGURE 10. Results of Test No. 1 on inclined member.
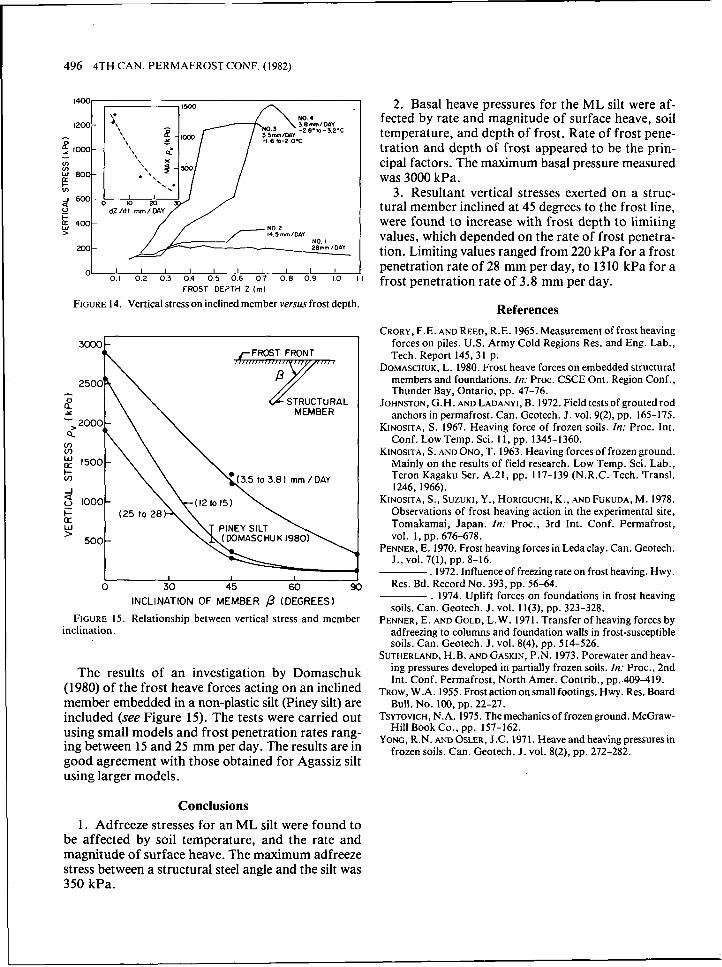
surface heave, rate of surface heave, frozen soil tem- perature, and frost depth. To separate and quantify the effects individually was impossible. For compara- tive purposes the resultant vertical stress was plotted versus frost depth for each test in Figure 14. The rela- tive positions of the individual curves suggest that the rate of frost penetration may serve as the best para- meter for quantifying the vertical stress exerted on an
TIME (DAYS)
FIGURE 1 1. Results of Test No. 2 on inclined member.
inclined member. The inset in Figure 12 is the plot of maximum vertical stress attained in each test versus the corresponding rate of frost penetration, dz/dt (see inset in Figure 12), and indicates a consistent trend of an increase in vertical stress with a decrease in the rate of frost penetration for the range of frost penetration rates investigated.
Frost Heave Forces versus Member Inclination The results of the investigation of frost heave
forces exerted on vertical, horizontal, and inclined. members are shown on a common plot of vertical stress versus member inclination (Figure 15). The ver- tical stress represents the adfreeze stress, the basal heave pressure, and the resultant vertical stress on the inclined member, for the three aforementioned studies. The stresses at the one-metre frost depth were taken as the basis for comparison. The results indi- cate a substantial decrease in vertical stress exerted on an inclined member as the angle of inclination, meas- ured from the frost plane, increases. It is important to make the distinction between the frost plane and a horizontal plane, as the two do not always coincide. From the information presented in Figure 15 it is possible to determine the normal and the tangential stresses acting on an inclined member.
Engineering Applications in Permafrost Areas 495
---_ _ _ - _ _ _ - ~ -___-- --- -01 ,_____. --------
FROST HEAVE FORCE
- 2 € 2 E -60-E -300 W E Z L ? W
5 0 - w - 2 5 0
TEST NO 3
300- -08 FREEZING RATE 5 lo 40 DAYS = 5 7 mm / DAY 7 6 lo I52 DAYS i\ 3 5 mm / DAY
AV FROZEN SOlL TEMP - I 6 lo -2 O'C -09
100- I I I I I 1 I L I I I ' I ' I ' l ' l l l I I I I I I I I I
10 20 30 40 50 €0 70 80 90 100 I10 I20 I30 140 150
T I M E (DAYS) FIGURE 12. Results of Test No. 3 on inclined member.
I "
; E F t 4 0 0
W V a 2 5 0
200 30
I 5 0
'.
12004 9 i" 1000 F
I""s 0.6 I
h SURFACE HEAVE
0.8
I "
TEST NO 4
- I I FREEZING RATE 0 10 21 DAYS 0 28 mm /DAY
AV FROZEN SOIL TEMP - 2 8 to - 3 2 O C - 1 2
200- 21 lo 87 DAYS = 3.8 mm / DAY
1 1 1 1 1 1 1 ' ~ 1 1 " ~ ~ ~ ' ~ 1 - 30 40 50 60 70 80 90 I00 0 10 20
TIME (DAYS) FIGURE 13. ResultsofTest No. 4on inclined member.
496 4TH CAN. PERMAFROSTCONF. (1982)
‘4001 1200 - -
5 1m-
g 800- I
v)
t; J 600- a u
400- >
200-
* ‘ \ - I I
01 0 2 0 3 0 4 0 5 0 6 07 0 8 09 10 1 1 FROST DEPTH Z (rn)
FIGURE 14. Vertical stress on inclined member versus frost depth.
“k r F R O S T FRONT
- 2500h\ B 7 STRUCTURAL
I \ \ MEMBER
(3.5 to 3.8 1 rnm /DAY
(25 to 28 W PINEY SILT >
500
I I I
0 30 45 60 9 INCLINATION OF MEMBER p (DEGREES)
FIGURE 15. Relationship between vertical stress and member inclination.
The results of an investigation by Domaschuk (1980) of the frost heave forces acting on an inclined member embedded in a non-plastic silt (Piney silt) are included (see Figure 15). The tests were carried out using small models and frost penetration rates rang- ing between 15 and 25 mm per day. The results are in good agreement with those obtained for Agassiz silt using larger models.
Conclusions 1. Adfreeze stresses for an ML silt were found to
be affected by soil temperature, and the rate and magnitude of surface heave. The maximum adfreeze stress between a structural steel angle and the silt was 350 kPa.
2. Basal heave pressures for the ML silt were af- fected by rate and magnitude of surface heave, soil temperature, and depth of frost. Rate of frost pene- tration and depth of frost appeared to be the prin- cipal factors. The maximum basal pressure measured was 3000 kPa.
3. Resultant vertical stresses exerted on a struc- tural member inclined at 45 degrees to the frost line, were found to increase with frost depth to limiting values, which depended on the rate of frost penetra- tion. Limiting values ranged from 220 kPa for a frost penetration rate of 28 mm per day, to 13 10 kPa for a frost penetration rate of 3.8 mm per day.
References CRORY, F.E. AND REED, R.E. 1965. Measurement of frost heaving
forces on piles. U.S. Army Cold Regions Res. and Eng. Lab., Tech. Report 145,31 p.
DOMASCHUK, L. 1980. Frost heave forces on embedded structural members and foundations. In: Proc. CSCE Ont. Region Conf., Thunder Bay, Ontario, pp. 47-76.
JOHNSTON, G.H. AND LADANYI, B. 1972. Field tests of grouted rod anchors in permafrost. Can. Geotech. J. vol. 9(2), pp. 165-175.
KINOSITA, S. 1967. Heaving force of frozen soils. In: Proc. Int. Conf. Low Temp. Sci. 11, pp. 1345-1360.
KINOSITA, S. AND ONO, T. 1963. Heaving forces of frozen ground. Mainly on the results of field research, Low Temp. Sci. Lab., Teron Kagaku Ser. A.21, pp. 117-139 (N.R.C. Tech. Transl. 1246, 1966).
KINOSITA, S., SUZUKI, Y .. HORIGUCHI, K., AND FUKUDA, M. 1978. Observations of frost heaving action in the experimental site, Tomakamai, Japan. In: Proc., 3rd Int. Conf. Permafrost,
PENNER, E. 1970. Frost heaving forces in Ledaclay. Can. Geotech.
. 1972. Influence of freezing rate on frost heaving. Hwy. Res. Bd. Record No. 393, pp. 56-64.
. 1974. Uplift forces on foundations in frost heaving soils. Can. Geotech. J. vol. 11(3), pp. 323-328.
PENNER, E. AND GOLD, L.W. 1971. Transfer of heaving forces by adfreezing to columns and foundation walls in frost-susceptible soils. Can. Geotech. J. vol. 8(4), pp. 514-526.
SUTHERLAND, H.B. AND GASKIN, P.N. 1973. Porewater and heav- ing pressures developed in partially frozen soils. In: Proc., 2nd Int. Conf. Permafrost, North Amer. Contrib., pp..409-419.
TROW, W.A. 1955. Frost actiononsmall footings. Hwy. Res. Board Bull. No. 100, pp. 22-27.
TSYTOVICH, N.A. 1975. The mechanics of frozen ground. McGraw- Hill Book Co., pp. 157-162.
YONG, R.N. AND OSLER, J.C. 1971. Heaveand heaving pressures in frozen soils. Can. Geotech. J. vol. 8(2), pp. 272-282.
VOI. 1, pp. 676-678.
J., VOI. 7(1), pp. 8-16.