Embed Size (px)
Citation preview

Jackson Cardiovascular-Renal Meeting 2008
1
FROM GUYTON'S GRAPHIC DIAGRAM TO MULTIMEDIA SIMULATORS FOR
TEACHING PHYSIOLOGY (RESURRECTION OF GUYTON’S CHART FOR EDUCATIONAL PURPOSE)
Jiří Kofránek, Jan Rusz, Marek Matejak
Laboratory of Biocybernetics, Department of Pathophysiology, 1st
Faculty of Medicine, Charles University,
Prague, Czech Republic Summary:
The authors describe an implementation of a classic many ‐times‐copied Guyton's circulatory‐system‐control chart in the Simulink environment. They point out that there were mistakes in the original pictographic chart that were necessary to be corrected before the implementation. The appearance of the model has been preserved in the Simulink similar to the Guyton's graphic chart ‐the scheme layout, the wiring placement, the quantity names and the block numbers are the same. The model behaviour demonstrates the pathogenesis of different pathological states truly enough to be used for teaching of physiological regulatory systems in the biomedical‐engineering‐students education, as well as as a theoretical basis for a multimedia simulator, created in the .NET environment and web ‐accessible for medicine students at Charles university in Prague.
1. Introduction:
Thirty‐six years ago, an especial article appeared in Annual Review of Physiology, Guyton et al. 1972 [4] that surpassed all the traditional papers on physiology of that time. It was introduced by a large diagram in a tip‐in plate (a detail at Fig. 1). The chart full of lines and interconnected elements reminded of an electrical device at first sight. Instead of the vacuum tubes or other electrical components, coupled computational blocks (multipliers, divisors, summators, integrators, and functions) were displayed here symbolising mathematical operations performed on the physiological quantities. The leader bundles between the blocks expressed complicated feedback bindings. The blocks were clustered into eighteen groups, each one representing a particular interconnected physiological subsystem.
Fig. 1: A detail of the large circulatory‐dynamics chart

Jackson Cardiovascular-Renal Meeting 2008
2
2. A web of physiological regulations
In this completely new way, the Guyton's paper described physiological circulatory ‐system regulations and wider context of other organism subsystems ‐kidneys, blood volume and ion balance etc. by a mathematical model. Instead of listing sets of equations, graphical illustration of mathematical relations was employed. This syntax enabled the author to depict the dependencies between particular physiological quantities in the form of interconnected blocks representing mathematical operations.
The definition of the model consisted only of this basic (yet fully illustrative) figure. Comments and justifying of the mathematical formulation were very brief, e. g., "blocks 266 ‐270 compute the influence of the cellular pO2, the autonomous stimulation and the basal oxygene consumption on the real tissue‐oxygene‐consumption rate". This required a high level of concentration (and even certain physiological and mathematical knowledge) from the reader to understand the meaning of the formalised relations between the physiological quantities.
One year later, in 1973, a monograph appeared [5] that explained many of the used approaches more in detail. The Guyton's model was a milestone ‐it was the first large‐scale mathematical description of physiological functions of coupled organism subsystems and launched a brand‐new research area, known as integrative physiology today. The integrative physiology aspires to formalised description of the interconnected physiological regulations, with computer models as the methodical tool. The main activities in this branch are concentrated under the PHYSIOME project (Bassingthwaighte 2000, Hunter et al. 2002) under the auspices of the International Union of Physiological Sciences (www.physiome.org), or the project EUROPHYSIOME for the European Union respectively (www.europhysiome.org).
The Guyton's school kept on evolving the model. In 1983, Thomas Coleman, one of his scholars and colleagues, built a model called "Human" intended mainly for the educational purposes [3]. "Human" allowed simulation of a number of pathological states (cardiac and renal failure, hemorrhagic shock etc.) as well as the influence of some therapeutic interventions (blood transfusion, artificial pulmonary ventilation, dialysis and others). A modern interactive Java implementation of this model can be found at http://venus.skidmore.edu/human.
The latest outcome of Guyton's followers is the Quantitative Human Physiology simulator [8] representing the most complex and most extended model of physiological functions so far. The model has been created as an open‐source Windows‐based project and all its aspects, including over 3000 variables and the mathematical equations describing the physiological processes, have an XML text ‐readable description. The simulator demonstrates human physiology applying whole‐body properties, organs and multi‐organ systems, users can view time‐dependent solutions and interactively alter parameters to investigate new hypotheses. Model can be downloaded from http://physiology.umc.edu/themodelingworkshop/. 3. Implementation and errors in Guyton's chart The Guyton's model and his further modifications were originally implemented in Fortran and later in C++. Today, there are specialised software simulation tools available for its development, tuning and verification. One of them is the Matlab/ Simulink environment by the MathWorks company, supporting successive model assembly ‐the particular components can be joined into the simulation networks by

Jackson Cardiovascular-Renal Meeting 2008
3
computer‐mouse dragging of connecting lines. Simulink computational elements are very alike to those used by Guyton for the formalised expression of physiological relations. The only difference is in their graphic form.
This similarity (and also the last year's 35th anniversary of the idea publishing) has inspired us to resurrect the old classic Guyton's chart and convert it in a functional simulation model [10]. In the Simulink implementation, we have employed switches to turn on and off the particular subsystems and regulatory loops even while running the simulation. We have tried to keep the outer model appearance identical to the original graphic chart ‐the scheme layout, the wiring placement, the quantity names and the block numbers are the same.
Fig. 2: The most significant errors in chart and their correction
The simulatory visualisation of the old diagram was not as easy as expected ‐in the original model, several mistakes were found. Although it does not matter in a figure, if we try to animate it in Simulink then the model collapses as a whole instantly. There were not many of those errors ‐inverse signs, a divisor in place of a multiplier, a mutually interchanged block connection, a missing decimal point in a constant etc. However, they were sufficient for the model not to work. Some of them were evident even with no physiology knowledge ‐it was obvious from the chart that during the run, the values in some integrators would (due to the wrongly applied feedback) steeply increase to the infinite and the model would break down. With some physiological and system‐analysis background and with some effort, all the mistakes could be found eventually (Fig. 3). A detailed description of the errors and the corrections provides Kofránek [10].
Jackson Cardiovascular-Renal Meeting 2008
4
It is interesting, that Guyton’s chart was many times overprinted as a complicated picture in several publications [7] and nobody made an effort to fix these errors. After all, at the time the pictographic chart was created, there had been no convenient drawing tool yet – the picture had originated as a complex schematic figure – and to copy it manually was not so easy. It is not impossible that the authors didn’t even want to correct the errors – who took the pain over analysing the model, easily uncovered the diagrams mistakes – who wanted to just blindly copy, failed.
The Fortran implementation was very typical for this time – because of the scant power of processors, advanced numerical methods were engaged to accelerate the program run that were using a various integration step in different part of the model. A direct conversion of the Fortran source to a Simulink model results in a very confusing code [12].
Our implementation was based on original Guyton’s chart with graphical mistakes fixed. The point was in creating a visual educational tool for the course Physiological regulatory systems. The model enables connecting and disconnecting single loops, analysing individually regulation circuits and their importance in development of particular pathological states. The source code in Simulink of both the corrected original, and much more sophisticated late Guyton’s model is available to download at http://www.physiome.cz/guyton, together with a detailed description and explanation of all the mathematical relations included. As a new simulation framework for design and implementation of simulation models we have chosen modern simulation language Modelica and we are developing original framework ”ModelicaNet” based on Modelica.NET (see http://patf‐biokyb.lf1.cuni.cz/wiki/modelica.net). Implementation of Guyton’s model in Modelica simulation language is available to download at http://www.physiome.cz/guyton
Renal deficiency causing limited salt‐load‐elimination ability leads to an increase of the total extracellular‐fluid volume and consequently of the blood volume after a higher salt and water intake. The hypervolemia incites a cardiac‐output increase and the initial hypertension. Via the baroreflex, the sympathetic activity is reduced which in combination with the vascular stretching effect of the elevated
.
4. Experiments
The aimed resurrection was intended to produce a graphical application displaying all the regulatory connections which would allow to verify the influence of the individual parameters on the progress of pathological conditions. Since the first implementation in 1972, the basic pictographic model has been many times upgraded, however, having brought it to life now give us a unique opportunity to apprehend the circulatory‐dynamics physiology. This can be observed in the following experiments corresponding to those published in Guyton’s first paper in 1972.
4.1. Hypertension in a salt‐loaded, renal‐deficient patient
This was the first and very fundamental experiment revealing the importance of kidneys in blood‐pressure control and their influence of essential‐hypertension development.

Jackson Cardiovascular-Renal Meeting 2008
5
arterial pressure dilates the peripheral blood vessels so that the total peripheral resistance falls below normal.
Fig. 4.1.: Simulation of hypertension in a salt‐loaded, renal‐deficient patient
This shows that all the initial arterial‐pressure increase is caused only by the raised cardiac output and not by a change in total peripheral resistance. But as the regulatory mechanisms try to suppress the tissue hyperperfusion, even the peripheral resistance starts to grow significantly after two days which becomes the factor that eventually maintains the arterial hypertension, whereas the cardiac output is decreasing towards the norm since the day 3 of the process.
The experimental simulation was run for an 8‐days time equivalent (Fig. 4.1.). In the day 1, renal mass was decreased to 30 % of the norm by modifying the REK parameter (percent of normal renal function) of the model. In the day 2, the salt intake was five‐times heightened compared to the norm by setting the NID‐parameter (rate of sodium intake) value to 0.5.
Jackson Cardiovascular-Renal Meeting 2008
6
The results are displayed in the plots in Fig. 3: the initial renal mass reduction affected the monitored variables only slightly, except of a moderate decrease in cardiac output due to simultaneous elevation of total peripheral resistance and depressed urine production. Applying the salt load caused more dramatic effects. The extracellular ‐fluid and blood volume arose wherefore the cardiac output increased considerably and then stabilised, while the total peripheral resistance fell, yet not enough to prevent the arterial ‐pressure augmentation.
By 120 hours of simulation, the cardiac output had stabilised but the peripheral resistance was still rising. As the arterial pressure continued increasing, this demonstrates that it is the peripheral resistance, not the cardiac output, that is responsible for the long‐term arterial hypertension.
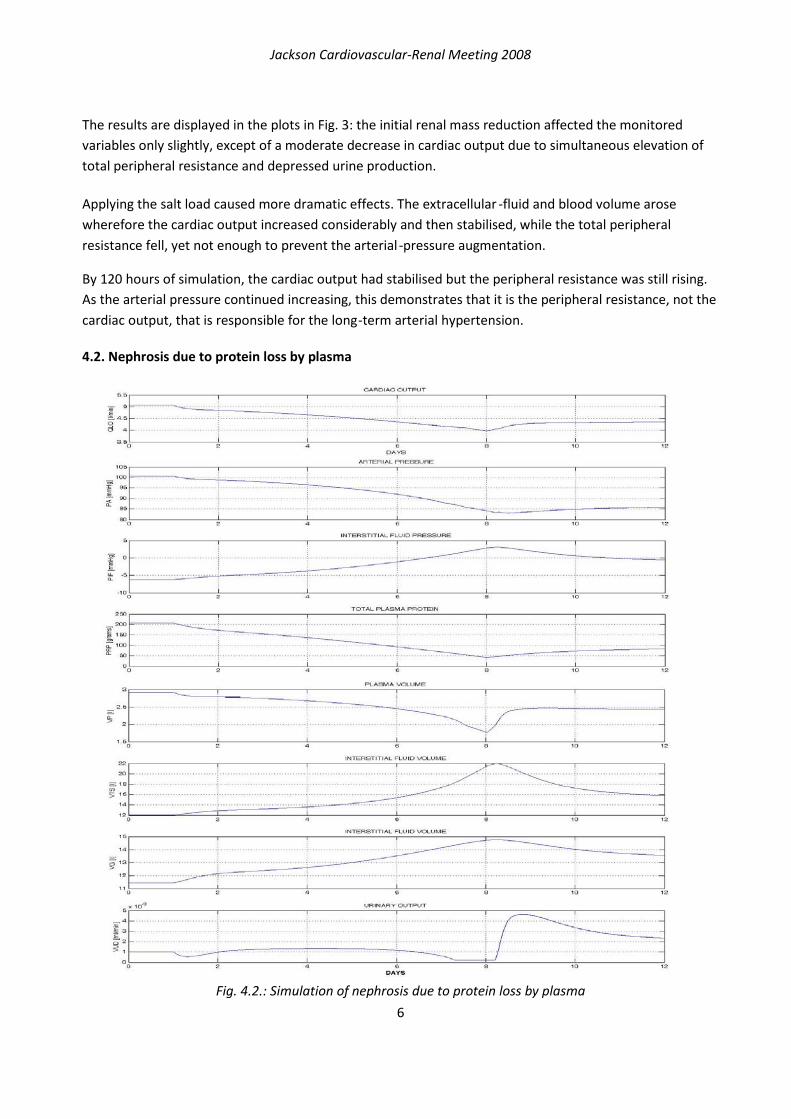
4.2. Nephrosis due to protein loss by plasma
Fig. 4.2.: Simulation of nephrosis due to protein loss by plasma

Jackson Cardiovascular-Renal Meeting 2008
7
Fig. 4.3.: Simulation of circulatory changes during severe muscle exercise
The second experiment illustrates the progress of a nephrotic edema caused by a plasma ‐protein loss. The principal effect of nephrosis consists of urine protein excretion that may not be associated with any significant changes in other renal functions. A deficit of the total plasma protein reduces the oncotic pressure, resulting in a fluid redistribution from the blood to the interstitial compartment and an increase of the (mostly free‐) interstitial‐fluid volume. Another effect is a mild cardiac‐output and arterial‐pressure decrease.
A 12‐days simulation was run (Fig. 4.2.). In the day 1, the plasma‐protein loss was seven‐times multiplied

Jackson Cardiovascular-Renal Meeting 2008
8
by setting the DPO parameter (rate of plasma‐protein loss) to 0.05 g/min. After 7 days, the value was reduced to 0.02 g/min which is still three‐times above the norm.
The initial hypoproteinemia only slightly decreased both arterial pressure and cardiac output but induced a notable restriction of the urinary output. Thus the fluid was being retained in the organism causing the interstitial swelling, although the volume of the free interstitial fluid remained relatively unchanged until the interstitial‐fluid pressure stayed negative. After it reached positive values, an apparent edema occurred with a sharp drop in the arterial pressure. As soon as the renal protein loss returned to the level of possible liver compensation capacity by plasma protein production in the day 8 of the experiment, the edema receded which was accompanied by high diuresis and cardiac‐output adjustment.
4.3. Circulatory changes during severe muscle exercise
Next experiment describes simulation changes of extremely severe exercise.
A 5‐minutes simulation was run (Fig. 4.3.). In the half minute, the exercise activity was sixty times their normal resting level changed by setting the EXC parameter (exercise activity‐ratio to activity at rest) to 60. After 3 minutes exercise was over, the value was set back to 1.
At the onset of exercise, cardiac output and muscle blood flow increased considerably and within seconds. Urinary output fell to its obligatory level while arterial pressure rose moderately. Muscle cell and venous P02 fell rapidly. Muscle metabolic activity showed an instantaneous increase, but then decreased considerably because of the development of a metabolic deficit in the muscles. When exercise was stopped, muscle metabolic activity fell to below normal, but cardiac output, muscle blood flow, and arterial pressure remained elevated for a while as the person was repaying his oxygen debt. 4.4. Atrioventricular fistula
A 8‐days simulation was run (Fig. 4.4.). In the day 1, a fistula, which would double cardiac output was increased 5% normal by setting the FIS parameter (fistula) to 0.05. After 5 days fistula was closed, the value was set back to 0.
Opening the fistula caused an immediate dramatic change in cardiac output, total peripheral resistance, and heart rate. Urinary output decreased to obligatory levels. As the body adapted, extracellular fluid volume and blood volume increased to compensate for the fistula with the result that after a few days arterial pressure, heart rate, and urinary output were near normal levels, while cardiac output doubled and peripheral resistance halved.
When the fistula was closed, dramatic effects again occurred with rapid decrease in cardiac output, rapid increase in peripheral resistance, moderate increase in arterial pressure, and moderate decrease in heart rate. Marked diuresis reduced extracellular fluid volume and blood volume to normal or slightly below. After several days, the patient was nearly normal.

Jackson Cardiovascular-Renal Meeting 2008
9
Fig. 4.4.: Simulation of atrioventicular fistula
5. Conclusion
The implementation of Guyton's model as an interactive control scheme is a helpful educational instrument for our biomedical‐engineering students. However, the intricate web of physiological

Jackson Cardiovascular-Renal Meeting 2008
10
regulatory systems of the chart is hardly intelligible to medics and medicine students who would prefer interactive picture animations of a physiological atlas, extended by plots, diagrams and explaining texts. Therefore this model is only a theoretical basis for an educational web ‐accessible simulator which still represents a long and hard future development that can be partially simplified by using suitable tools [11]. We have started a new educational tool “Atlas of physiology and pathophysiology” (www.physiome.cz/atlas) that combined interactive animation with simulation models in the background of multimedia interactive user interface.
The most valuable advantage of this work lies in the resurrection of the original Guyton's chart, now available for anyone interested. The previously described (and similar) experiments are of fundamental importance for understanding of the pathogenesis of different disorders that is essential both for biomedical engineers, and for medical doctors.
References
[1] Abram SR, Hodnett BL, Summers RL, Coleman TG, Hester RL (2007). Quantitative Circulatory Physiology: An Integrative Mathematical Model of Human Physiology for medical education. Advannced Physiology Education, 31 (2), 202‐210.
[2] Bassingthwaighte JB (2000). Strategies for the Physiome Project. Annals of Biomedical Engeneering, 28, 1043‐1058.
[3] Coleman TG and Randall JE (1983). HUMAN. A comprehensive physiological model. The Physiologist, 26 (1), 15‐21.
[4] Guyton AC, Coleman TA, and Grander HJ (1972). Circulation: Overall Regulation. Ann. Rev. Physiol., 41, 13‐41.
[5] Guyton AC, Jones CE, and Coleman TA (1973). Circulatory Physiology: Cardiac Output and Its Regulation. Philadelphia: WB Saunders Company.
[6] Hunter PJ, Robins P, Noble D (2002). The IUPS Physiome Project. Pflugers Archive ‐European Journal of Physiology, 445, 1‐9.
[7] Hall JE (2004). The pioneering use of system analysis to study cardiac output regulation. Am. J. Physiol. Regul. Integr. Comp. Physiol., 287, R1009‐R10011.
[8] Hester RL, Coleman T, Summers T (2008). A multilevel open source integrative model of human physiology, FASEB J., 22, 756.8.
[9] Kofránek J, Andrlík M, Kripner T, Stodulka P (2005). From Art to Industry: Development of Biomedical Simulators. The IPSI BgD Transactions on Advanced Research 2 (Special Issue on the Research with Elements of Multidisciplinary, Interdisciplinary, and Transdisciplinary: The Best Paper Selection for 2005), 62‐67.
[10] Kofránek J, Rusz J, Matoušek S (2007). Guytons Diagram Brought to Life ‐from Graphic Chart to Simulation Model for Teaching Physiology. In: Technical Computing Prague 2007. Full paper CD‐ROM proceedings. (P. Byron Ed.), Humusoft s.r.o. & Institute of Chemical Technology, Prague, ISBN 978‐80‐78‐658‐6, 1‐13. The paper, incl. the source code, is available online at http://phobos.vscht.cz/konference_matlab/MATLAB07/#k
[11] Stodulka P, Privitzer P, Kofránek J, Tribula M, Vacek O (2007). Development of WEB accessible medical educational simulators. In: Proceedings of the 6th EUROSIM Congress on Modeling and Simulation, Vol. 2. Full Papers (CD). (B. Zupanic, R. Karba, S. Blažič Eds.), University of Ljubljana, ISBN 978‐3‐901608‐32‐2, MO‐3‐P4‐2, 1‐6. The paper is available online at http://patf‐biokyb.lf1.cuni.cz/wiki/_media/clanky/

Jackson Cardiovascular-Renal Meeting 2008
11
[12] Thomas SR, Baconnier P, Fontecave J, Francoise JP, Guillard F, Hannaert P, Hernándes A, La Rolle V, Maziere P, Tahi F, White W (2008). SAPHIR: a physiome core model of body fluid homeostasis and blood pressure regulation. Phil. Trans. R. Soc., 366, 3175‐3197.
[13] Van Vliet BN, Montani JP (2005). Circulation and fluid volume control. In: Integrative Physiology in the Proteomica and Post Genomics Age. Humana Press, ISBN 918‐1‐58829‐3152, 43‐66.
Acknowledgement
This research was supported by aid grant MŠMT 2C06031 and Creative Connections Ltd.
Address of author for correspondence
Jiří Kofránek, M.D., Ph.D. Laboratory Laboratory of Biocybernetics, Dept.of Pathophysiology U nemocnice 5, 128 53 Prague, Czech Republic [email protected]