Embed Size (px)
Citation preview
Frequency Distribution, Cross-Tabulation,
And Hypothesis TestingWeek 08
W. Rofianto, ST, MSi
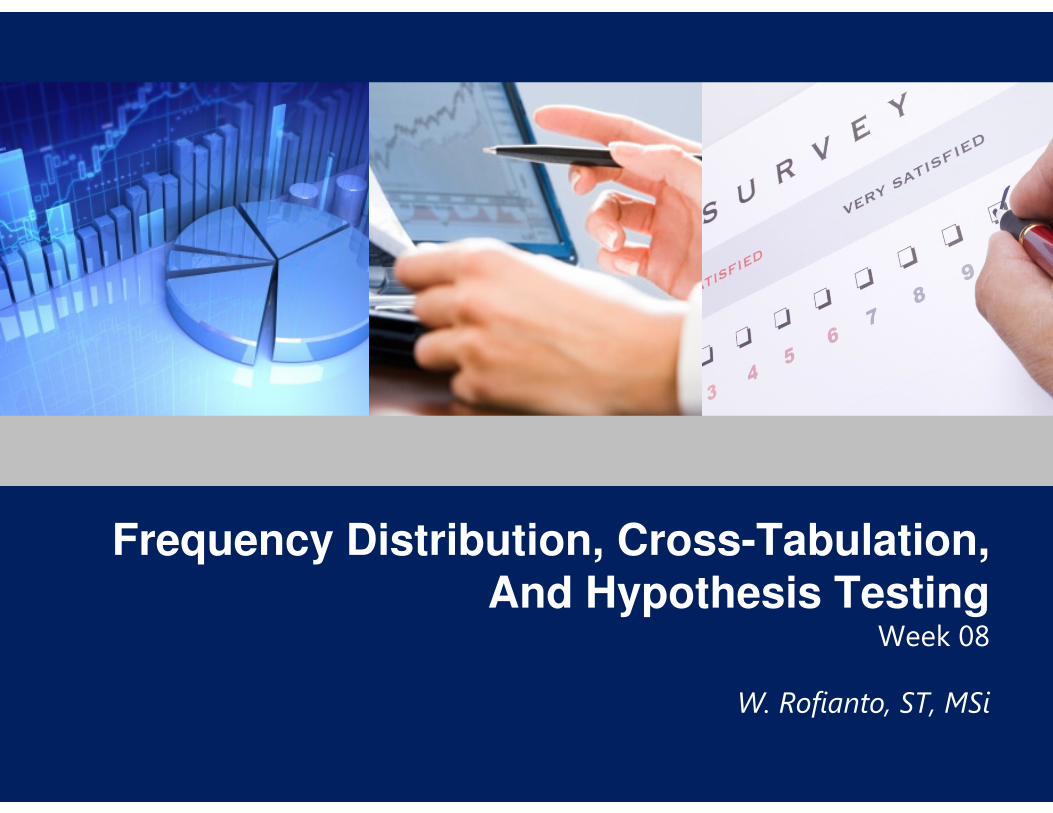
Internet Usage Internet Usage Data (Table A) Data (Table A)
Respondent Sex Familiarity Internet Attitude Toward Usage of InternetNumber Usage Internet Technology Shopping Banking
1 1.00 7.00 14.00 7.00 6.00 1.00 1.002 2.00 2.00 2.00 3.00 3.00 2.00 2.003 2.00 3.00 3.00 4.00 3.00 1.00 2.004 2.00 3.00 3.00 7.00 5.00 1.00 2.00 5 1.00 7.00 13.00 7.00 7.00 1.00 1.006 2.00 4.00 6.00 5.00 4.00 1.00 2.007 2.00 2.00 2.00 4.00 5.00 2.00 2.008 2.00 3.00 6.00 5.00 4.00 2.00 2.009 2.00 3.00 6.00 6.00 4.00 1.00 2.0010 1.00 9.00 15.00 7.00 6.00 1.00 2.0011 2.00 4.00 3.00 4.00 3.00 2.00 2.0012 2.00 5.00 4.00 6.00 4.00 2.00 2.0012 2.00 5.00 4.00 6.00 4.00 2.00 2.0013 1.00 6.00 9.00 6.00 5.00 2.00 1.0014 1.00 6.00 8.00 3.00 2.00 2.00 2.0015 1.00 6.00 5.00 5.00 4.00 1.00 2.0016 2.00 4.00 3.00 4.00 3.00 2.00 2.0017 1.00 6.00 9.00 5.00 3.00 1.00 1.0018 1.00 4.00 4.00 5.00 4.00 1.00 2.0019 1.00 7.00 14.00 6.00 6.00 1.00 1.0020 2.00 6.00 6.00 6.00 4.00 2.00 2.0021 1.00 6.00 9.00 4.00 2.00 2.00 2.0022 1.00 5.00 5.00 5.00 4.00 2.00 1.0023 2.00 3.00 2.00 4.00 2.00 2.00 2.0024 1.00 7.00 15.00 6.00 6.00 1.00 1.0025 2.00 6.00 6.00 5.00 3.00 1.00 2.0026 1.00 6.00 13.00 6.00 6.00 1.00 1.0027 2.00 5.00 4.00 5.00 5.00 1.00 1.0028 2.00 4.00 2.00 3.00 2.00 2.00 2.00 29 1.00 4.00 4.00 5.00 3.00 1.00 2.0030 1.00 3.00 3.00 7.00 5.00 1.00 2.00

Frequency Bar GraphFrequency Bar Graph
7
6
5
Fre
quency
8
2 3 4 5 6 70
4
3
2
1
Fre
quency
Familiarity
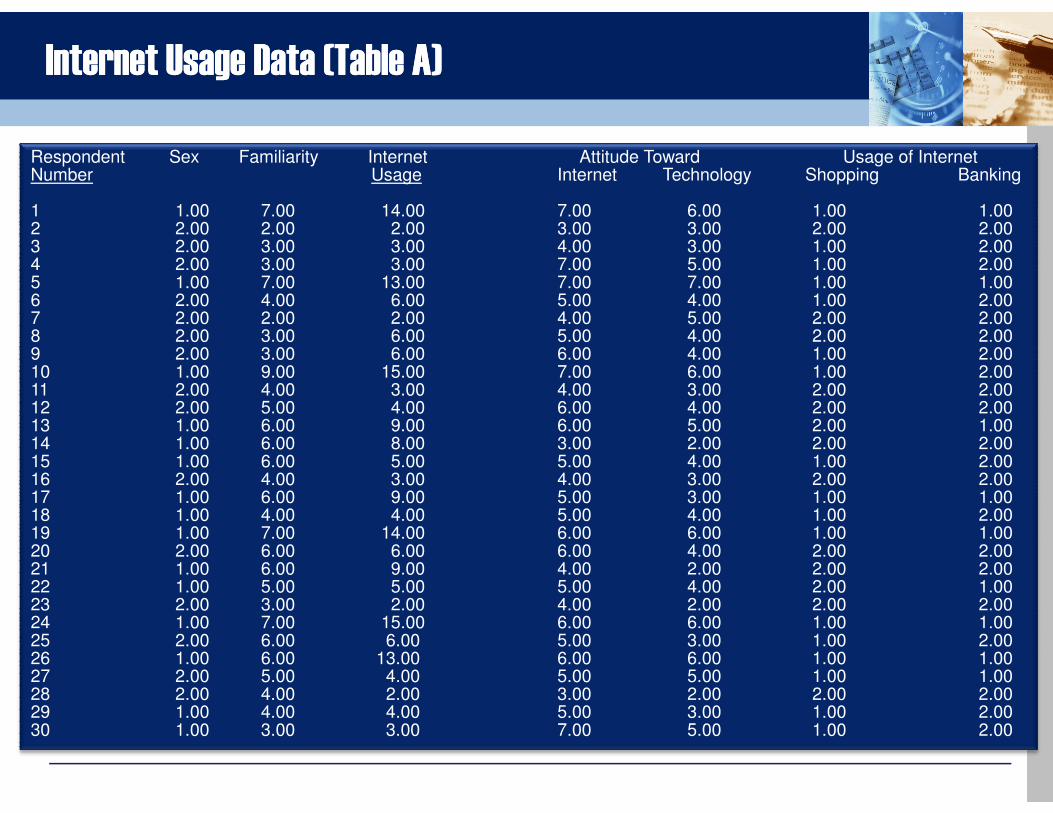
Frequency Distribution & Measures of Location
Mean
Median
Mode
Range
interquartile rangeinterquartile range
Variance
standard deviation
coefficient of variation

Steps Involved in Hypothesis TestingSteps Involved in Hypothesis Testing
Formulate H0 and H1
Select Appropriate Test
Choose Level of Significance
Collect Data and Calculate Test Statistic
Draw Marketing Research Conclusion
Determine Probability Associated with Test
Statistic
Determine Critical Value of Test Statistic TSCR
Determine if TSCR falls into (Non) Rejection
Region
Compare with Level of Significance, α
Reject or Do not Reject H0

A Broad Classification of Hypothesis TestsA Broad Classification of Hypothesis Tests
Tests of Tests of
Hypothesis Tests
Median/ RankingsDistributions ProportionsMeans
Tests of Association
Tests of Differences

CrossCross--Tabulation Gender Tabulation Gender and Internet Usageand Internet Usage
Gender
Row
Internet Usage Male Female Total
Light (1) 5 10 15Light (1) 5 10 15
Heavy (2) 10 5 15
Column Total 15 1 5
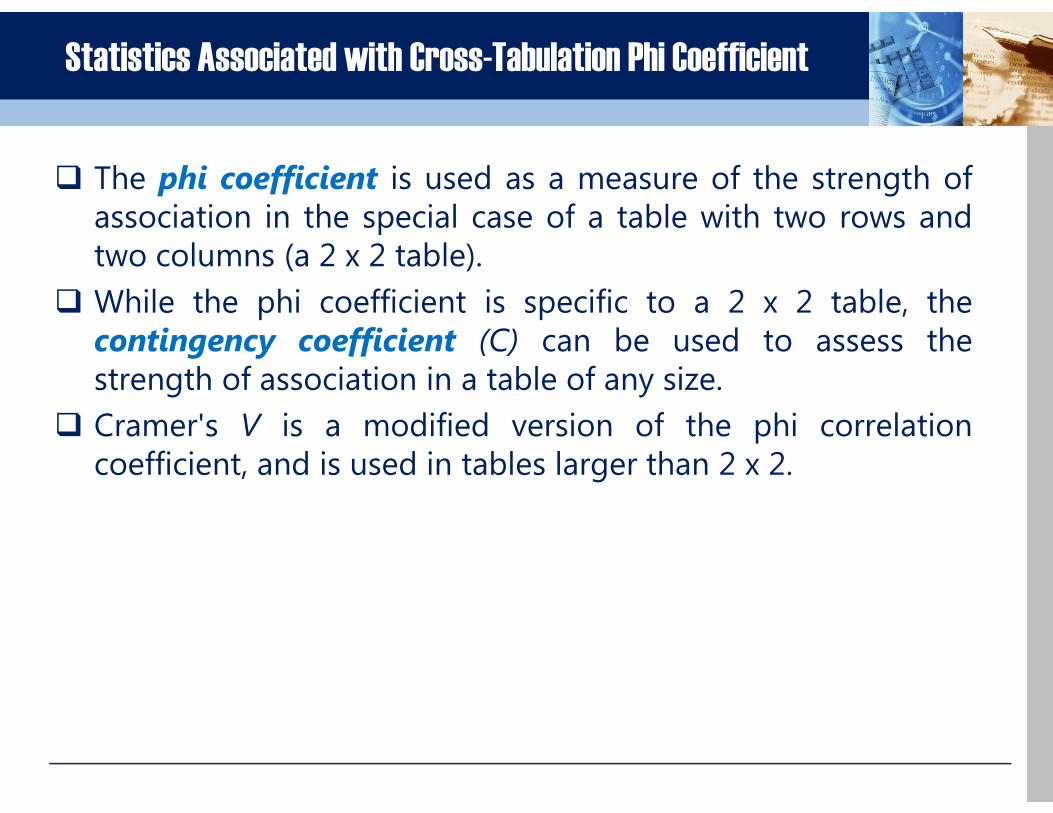
Statistics Associated with Cross-Tabulation Phi Coefficient
� The phi coefficient is used as a measure of the strength ofassociation in the special case of a table with two rows andtwo columns (a 2 x 2 table).
� While the phi coefficient is specific to a 2 x 2 table, thecontingency coefficient (C) can be used to assess thestrength of association in a table of any size.
Cramer's V is a modified version of the phi correlation� Cramer's V is a modified version of the phi correlationcoefficient, and is used in tables larger than 2 x 2.
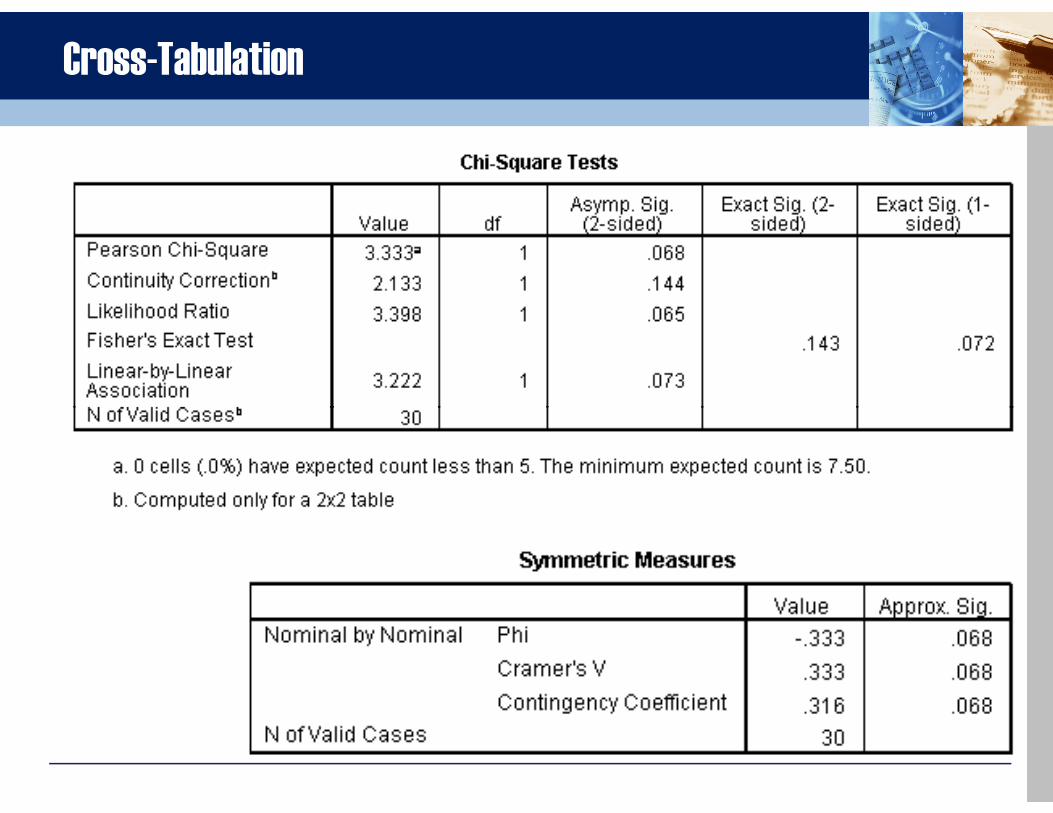
Cross-Tabulation
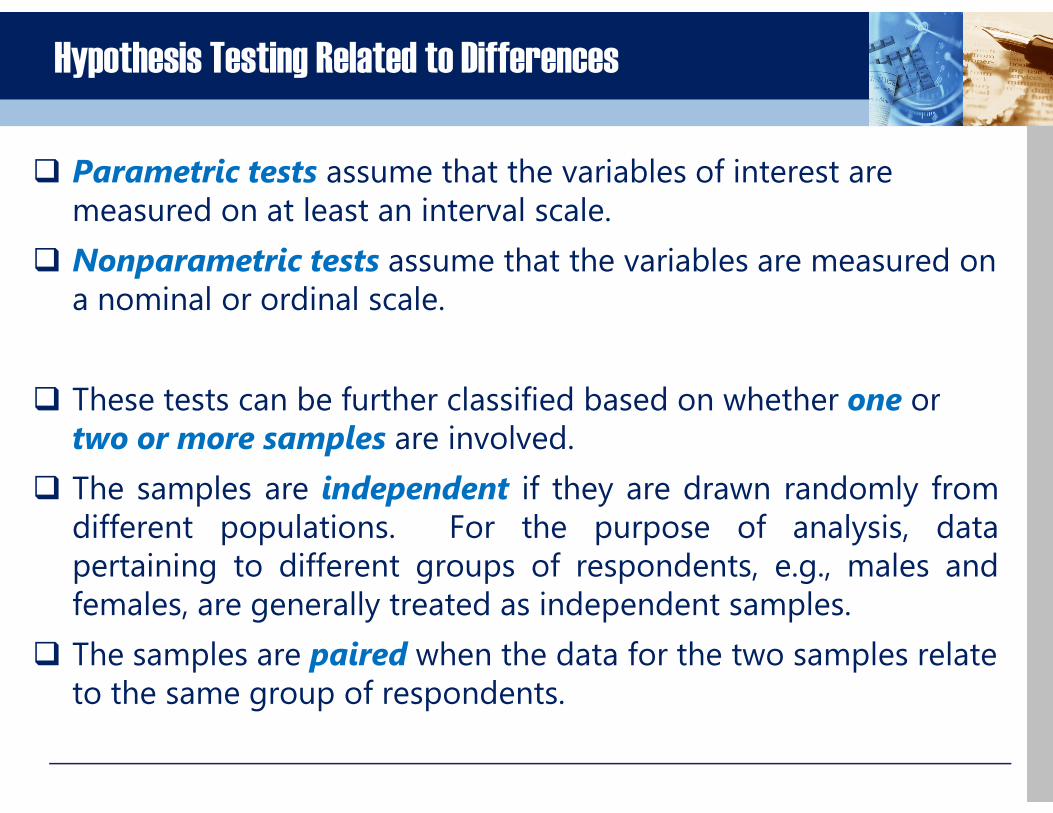
Hypothesis Testing Related to Differences
� Parametric tests assume that the variables of interest are measured on at least an interval scale.
� Nonparametric tests assume that the variables are measured on a nominal or ordinal scale.
� These tests can be further classified based on whether one or� These tests can be further classified based on whether one ortwo or more samples are involved.
� The samples are independent if they are drawn randomly fromdifferent populations. For the purpose of analysis, datapertaining to different groups of respondents, e.g., males andfemales, are generally treated as independent samples.
� The samples are paired when the data for the two samples relate to the same group of respondents.
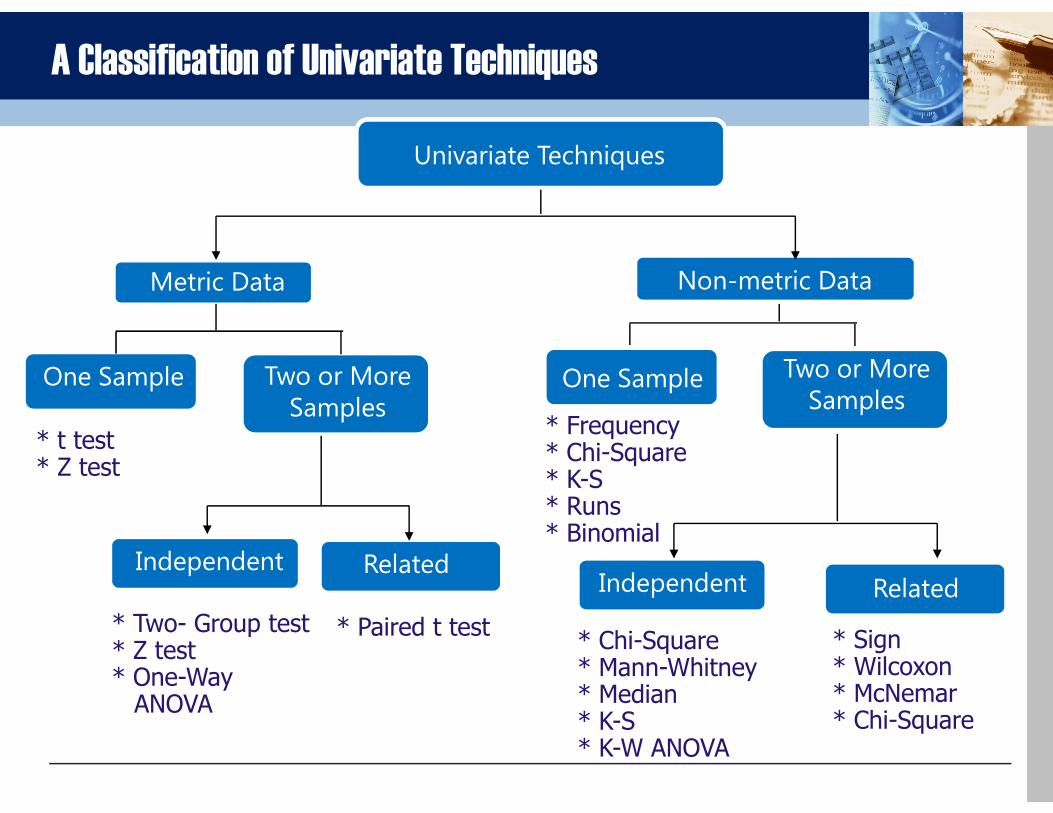
A Classification of Univariate Techniques
Metric Data Non-metric Data
Univariate Techniques
One Sample Two or More Samples
One Sample Two or More Samples
Independent RelatedIndependent Related
* Two- Group test* Z test * One-Way ANOVA
* Paired t test* Chi-Square* Mann-Whitney* Median* K-S* K-W ANOVA
* Sign* Wilcoxon* McNemar* Chi-Square
Samples Samples
* t test* Z test
* Frequency* Chi-Square* K-S* Runs* Binomial
Parametric TestsParametric Tests
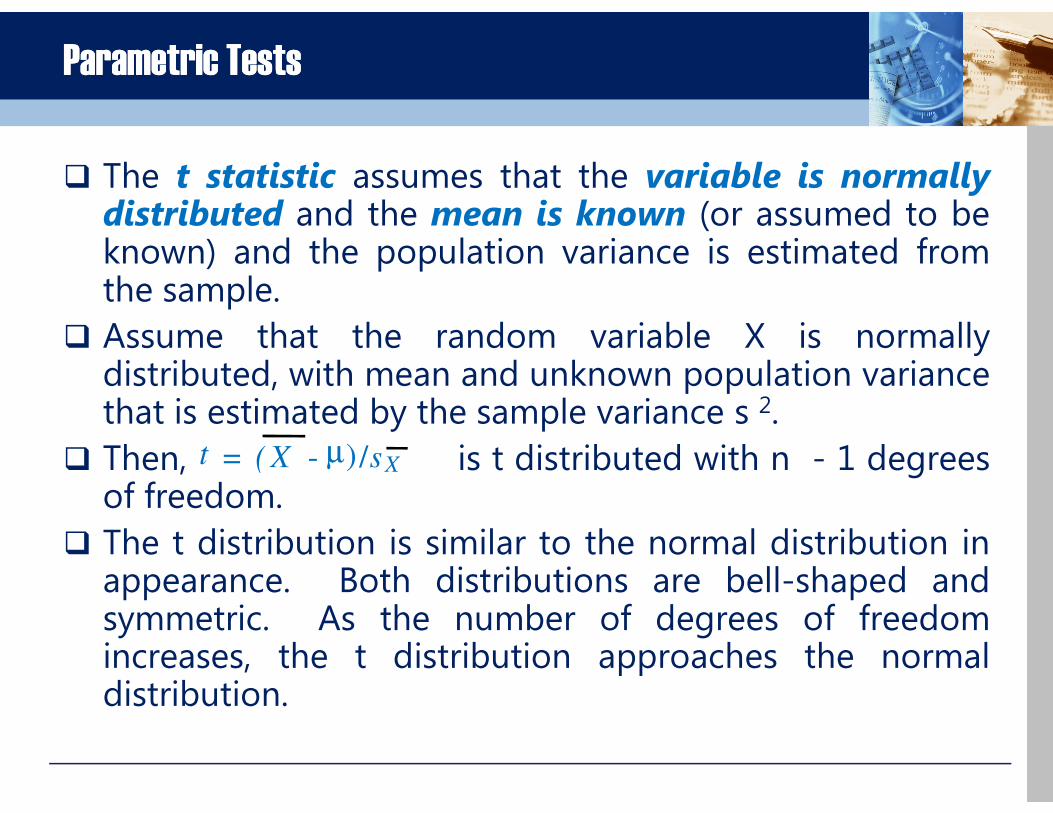
� The t statistic assumes that the variable is normallydistributed and the mean is known (or assumed to beknown) and the population variance is estimated fromthe sample.
� Assume that the random variable X is normallydistributed, with mean and unknown population variancethat is estimated by the sample variance s 2.that is estimated by the sample variance s 2.
� Then, is t distributed with n - 1 degreesof freedom.
� The t distribution is similar to the normal distribution inappearance. Both distributions are bell-shaped andsymmetric. As the number of degrees of freedomincreases, the t distribution approaches the normaldistribution.
t = ( X - µ)/sX
One Sample : t TestOne Sample : t Test
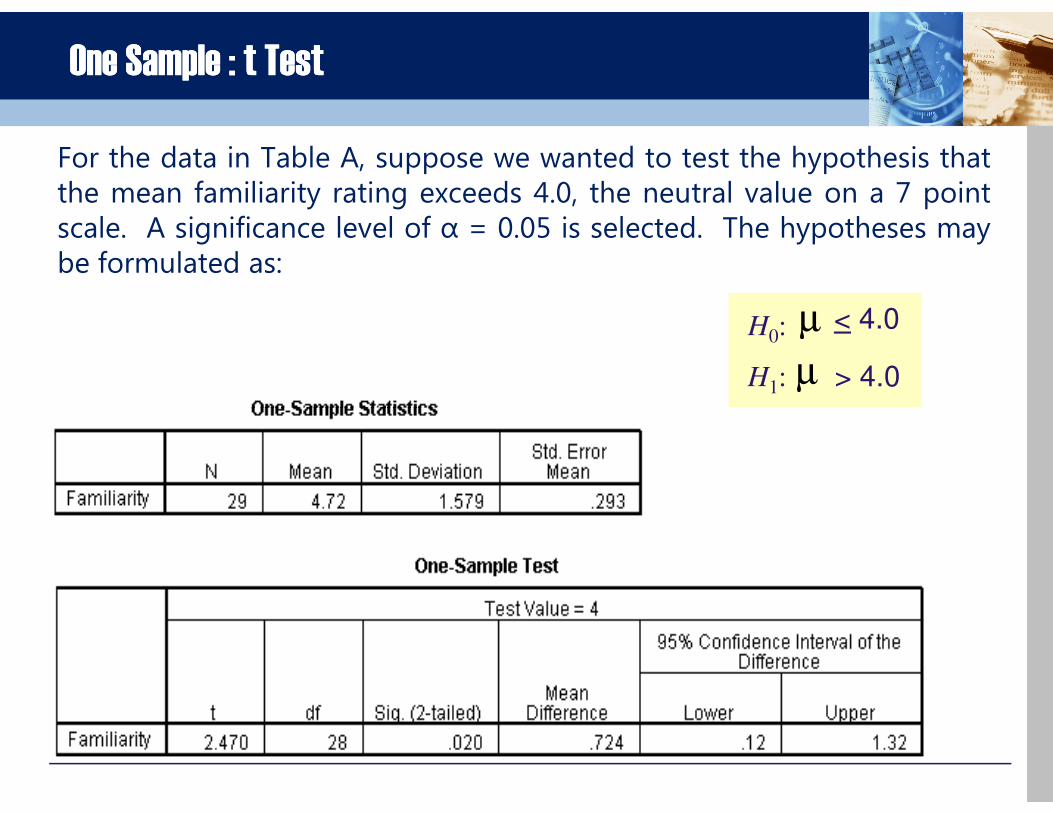
For the data in Table A, suppose we wanted to test the hypothesis thatthe mean familiarity rating exceeds 4.0, the neutral value on a 7 pointscale. A significance level of α = 0.05 is selected. The hypotheses maybe formulated as:
< 4.0H0:
µ > 4.0
µ
H1:
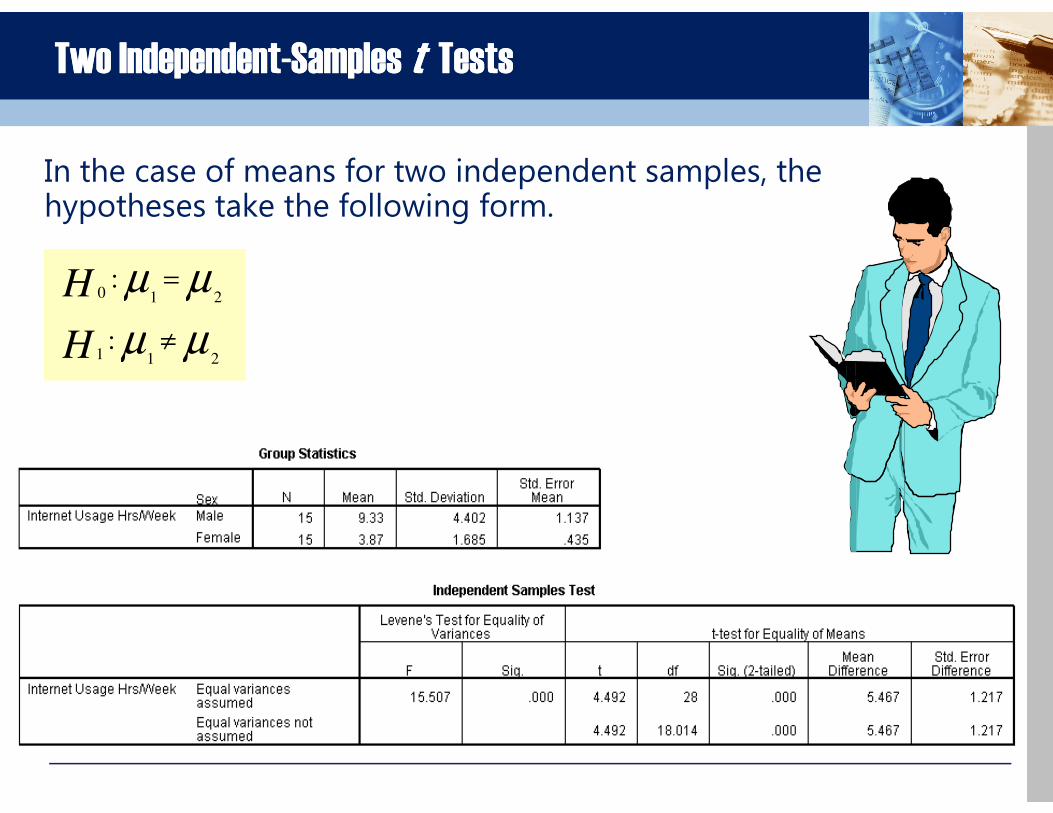
Two IndependentTwo Independent--Samples Samples tt TestsTests
In the case of means for two independent samples, the hypotheses take the following form.
µµ210
: =H
µµ211
: ≠H
-
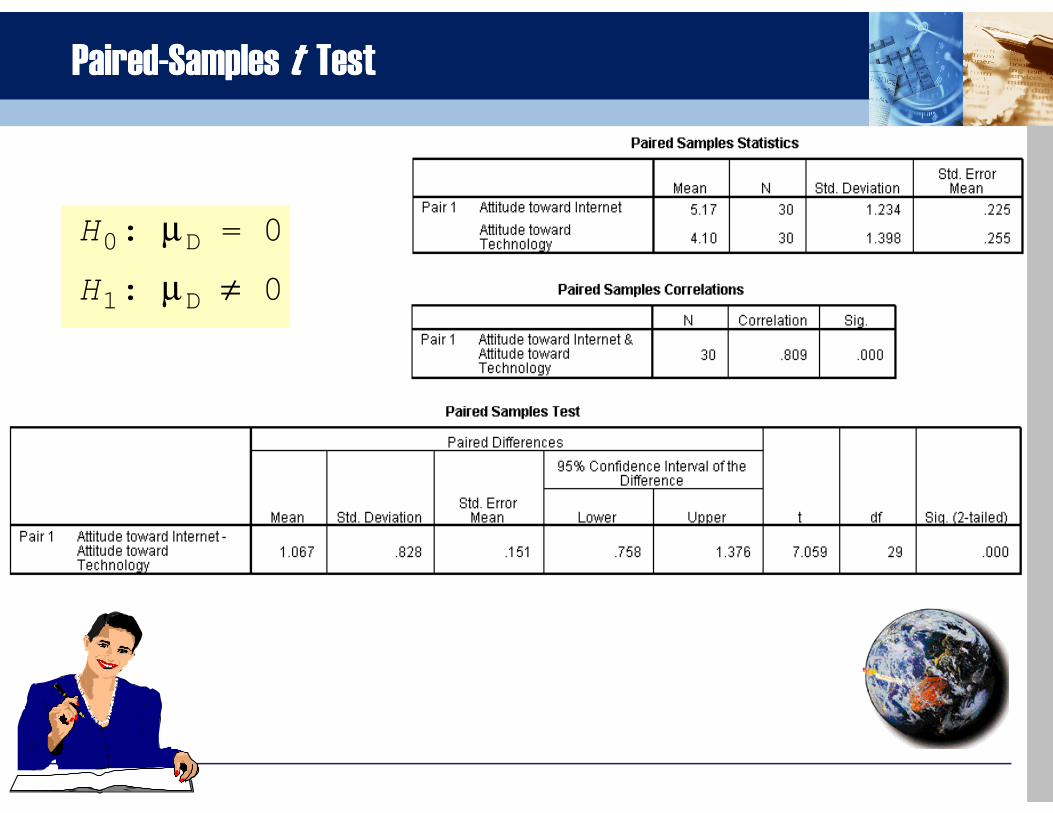
PairedPaired--Samples Samples tt TestTest
H0: µ
D= 0
H1: µ
D≠ 0

KK--S OneS One--Sample Test Sample Test for Normality for Normality of Internet Usageof Internet Usage