Embed Size (px)
Citation preview

Fremont Area Medical Center
2006 @Work Survey Results for
Acute Care Hospital

2
Agenda
• Why Survey?
• The @Work Research and Model
• Results for Acute Care Hospital
• Recommendations and Next Steps

3
Why Survey?
Key Talent
•Increased Productivity
•Increased Patient Satisfaction•Decreased
Turnover
ImprovedPerformance

4
The @Work Research Model

5
Questionnaire
• 10 items that form the WCI
• 2 general questions
• 56 items measuring the Performance Pyramid
• 4 items measuring interest in potential new benefits
• 1 open-ended question
• Demographic variables – Department, Shift, Age, Employment Status, Tenure, and Position

6
Questionnaire
7
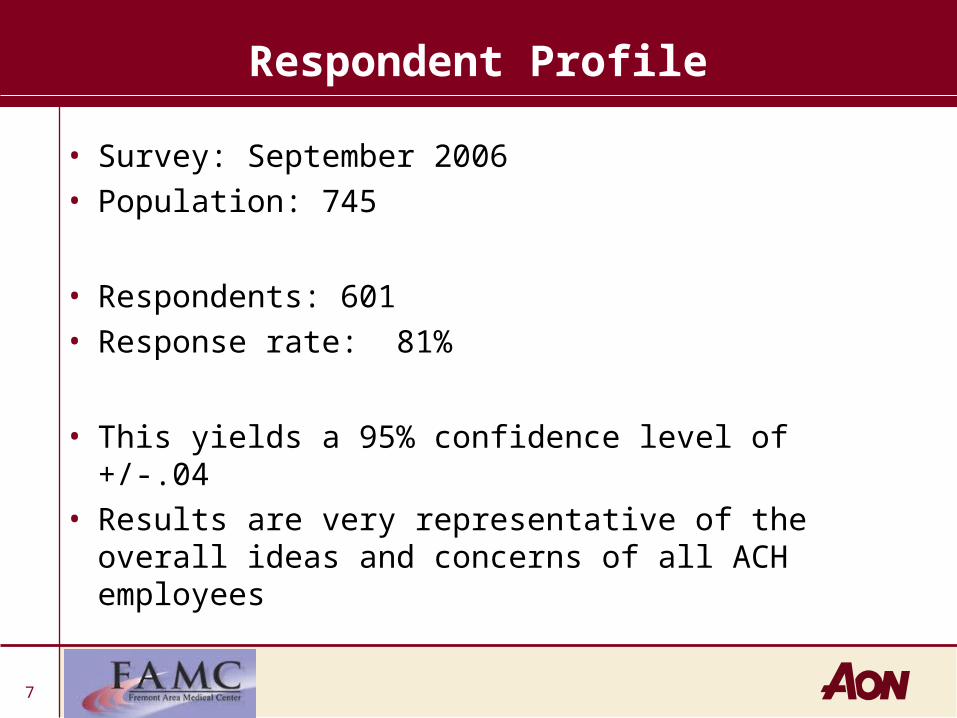
Respondent Profile
• Survey: September 2006• Population: 745
• Respondents: 601• Response rate: 81%
• This yields a 95% confidence level of +/-.04• Results are very representative of the overall
ideas and concerns of all ACH employees

8
Workforce Commitment Index
97.6
93.2
91.0
99.4Healthcare National Norm 2006
Healthcare National Norm 2003
Acute Care Hospital 2006
Acute Care Hospital 2003

9
Workforce Commitment Items
4.414.27
3.503.33
4.324.17
4.63
4.48
3.623.44
4.36
4.19
4.12
3.93
3.983.87
4.063.97
4.074.03
1 2 3 4 5
I share the same values as FAMC
I trust the leadership of FAMC
I feel responsible to help my supervisor besuccessful
I feel responsible to help FAMC be successful
I would stay with FAMC even if offered a similar jobwith slightly higher pay
I intend to stay with FAMC for the next several years
I would recommend FAMC as one of the best placesto work in my community
I would recommend FAMC's services as the bestthat a Customer could experience
The people I work with make personal sacrificeswhen required to help our work group succeed
The people I work with make personal efforts toimprove their skills so that they can make a better
ACH 2006
ACH 2003

10
WCI By ACH Position
88.8
90.0
90.2
90.3
97.4
97.9
105.4
105.7
97.6
93.2
91.0
99.4Healthcare National Norm 2006
Healthcare National Norm 2003
ACH 2006
ACH 2003
Technical
Management
Other Professional
Support/Clerical
Service
Allied Health
Nurse Assistive
Nursing

11
General Questions
1%
4% 12% 54% 29%Acute Care Hospital 2006
Our patients are satisfied with the services they receive
Disagree Somewhat Disagree Neither Agree nor Disagree Somewhat Agree Agree
12
Evaluating the Work Environment
• Performance Charts based on Expectations and Importance Ratings
• Commitment Driver Statistical Analysis
• Comparison to National Benchmarks

13
Performance Charts
Performance Chart
Below Meets Expectations Above
Higher Importance
Items listed in this section are both
below expectations and of high
importance to respondents
IMPROVEMENT OPPORTUNITIES
Items listed in this section both meet expectations and are of high importance to
respondents
SUCCESS AREAS
Items listed in this section are both above
expectations and of high importance to
respondents
STRENGTHS
Less Importance
Items listed in this section are both
below expectations and less important to
respondents
Items listed in this section both meet expectations and
are less important to respondents
Items listed in this section are both above expectations and less
important to respondents

14
Strengths
• FAMC's ability to minimize medical errors and maximize patient safety (SS)
• FAMC’s ability to deliver quality patient care (GRW)• FAMC's efforts to create a safe and secure work
environment for employees (SS)• FAMC's creation of a job environment free from
fear, intimidation, or harassment (SS)• Willingness of co-workers to help one another
during times of heavy workload (WLH)• The satisfaction you receive from the work you do
every day (GRW)• The encouragement and support you receive to
report safety concerns (SS)

15
Improvement Opportunities
• The adequacy of staff to handle the workload at FAMC (GRW)
• The link between your job performance and your compensation (REW)
• The openness & honesty that exists between Administration and employees (AFF)
• Your pay's fairness compared to others in similar jobs within FAMC (REW)
• FAMC's demonstration of the importance of retaining employees (AFF)

16
Driver Analysis• The openness and honesty that exists between the Executive
Management Team and employees (AFF)• FAMC providing job security for people like you (SS)• Your supervisor supporting your needs as a person and not just
as a worker (WLH)• FAMC’s ability to deliver quality patient care (GRW)• FAMC's efforts to build a sense of spirit and pride (AFF)• The adequacy of staff to handle the workload at FAMC as
compared to similar organizations (GRW)• Willingness of coworkers to help one another during times of
heavy workload (WLH)• FAMC's ability to minimize medical errors and maximize
patient safety (SS)• The way new employees are welcomed and treated when they
begin working (AFF)• The direction FAMC is heading (GRW)• FAMC's recognition of the importance of your personal and
family life (WLH)

17
National Comparisons
Workplace PracticeHealthcare
@Work (% meeting or
exceeding expectations)
ACH @Work (% meeting or
exceeding expectations)
Difference HC vs. ACH
Performance appraisal providing an accurate summary of your performance 73.1% 82.3% 9.2%
The opportunities for personal growth provided by doing your job 72.4% 80.2% 7.8%
FAMC's efforts to create a safe and secure work environment for employees 85.8% 92.5% 6.7%
The satisfaction you receive from the work you do every day 85.9% 90.6% 4.7%
FAMC's creation of a job environment free from fear, intimidation, or harassment 77.2% 81.7% 4.6%
FAMC's efforts to build a sense of spirit and pride 80.5% 84.4% 3.9%
Your coworkers supporting your needs as a person and not just as a worker 82.8% 86.0% 3.2%
The link between your job performance and your compensation 61.6% 64.4% 2.9%
FAMC's recognition of the importance of your personal and family life* 75.9% 78.7% 2.7%
Your pay's competitiveness with others in similar jobs at different organizations 60.8% 62.9% 2.1%
The amount of authority your supervisor has to resolve issues* 72.5% 74.5% 2.0%
FAMC's ability to minimize medical errors and maximize patient safety* 89.2% 89.5% 0.3%
18
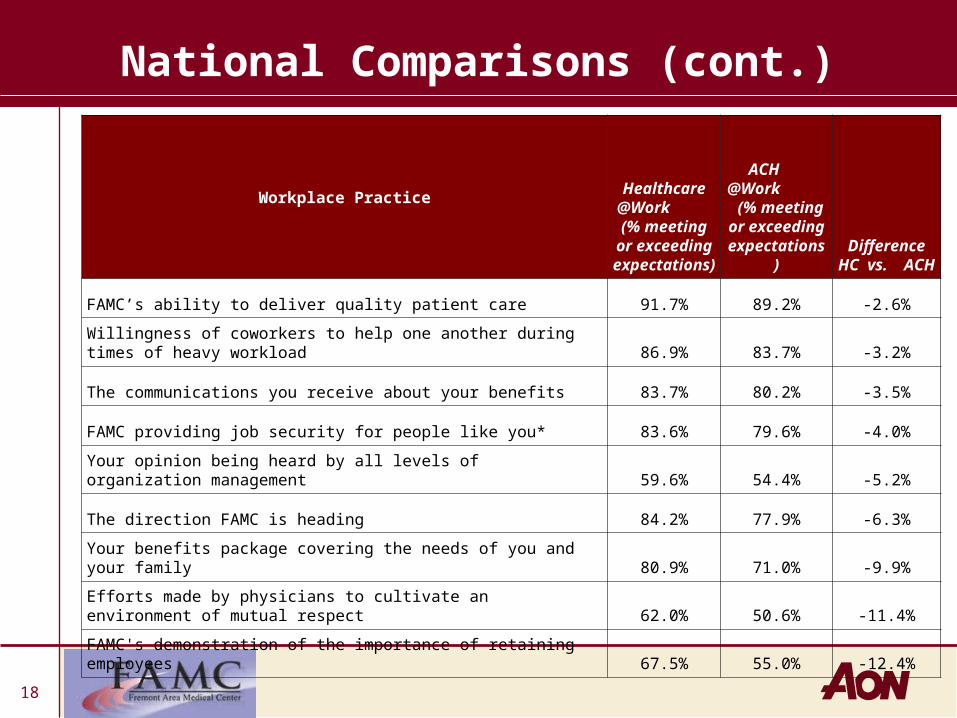
National Comparisons (cont.)
Workplace PracticeHealthcare
@Work (% meeting or
exceeding expectations)
ACH @Work (% meeting or
exceeding expectations)
Difference HC vs. ACH
FAMC’s ability to deliver quality patient care 91.7% 89.2% -2.6%
Willingness of coworkers to help one another during times of heavy workload 86.9% 83.7% -3.2%
The communications you receive about your benefits 83.7% 80.2% -3.5%
FAMC providing job security for people like you* 83.6% 79.6% -4.0%
Your opinion being heard by all levels of organization management 59.6% 54.4% -5.2%
The direction FAMC is heading 84.2% 77.9% -6.3%
Your benefits package covering the needs of you and your family 80.9% 71.0% -9.9%
Efforts made by physicians to cultivate an environment of mutual respect 62.0% 50.6% -11.4%
FAMC's demonstration of the importance of retaining employees 67.5% 55.0% -12.4%

19
Using the Results
1. Identify key issues – for the organization2. Brainstorm solutions and identify champions3. Develop timeline/target date4. Communicate results/action plans to employees5. Direct Divisions/Departments to identify key
local issues and brainstorm solutions6. Implement solutions – macro and micro level7. On target date, communicate status8. Evaluate process9. If necessary, set new timeline10. Identify new issues and begin again