Embed Size (px)
Citation preview
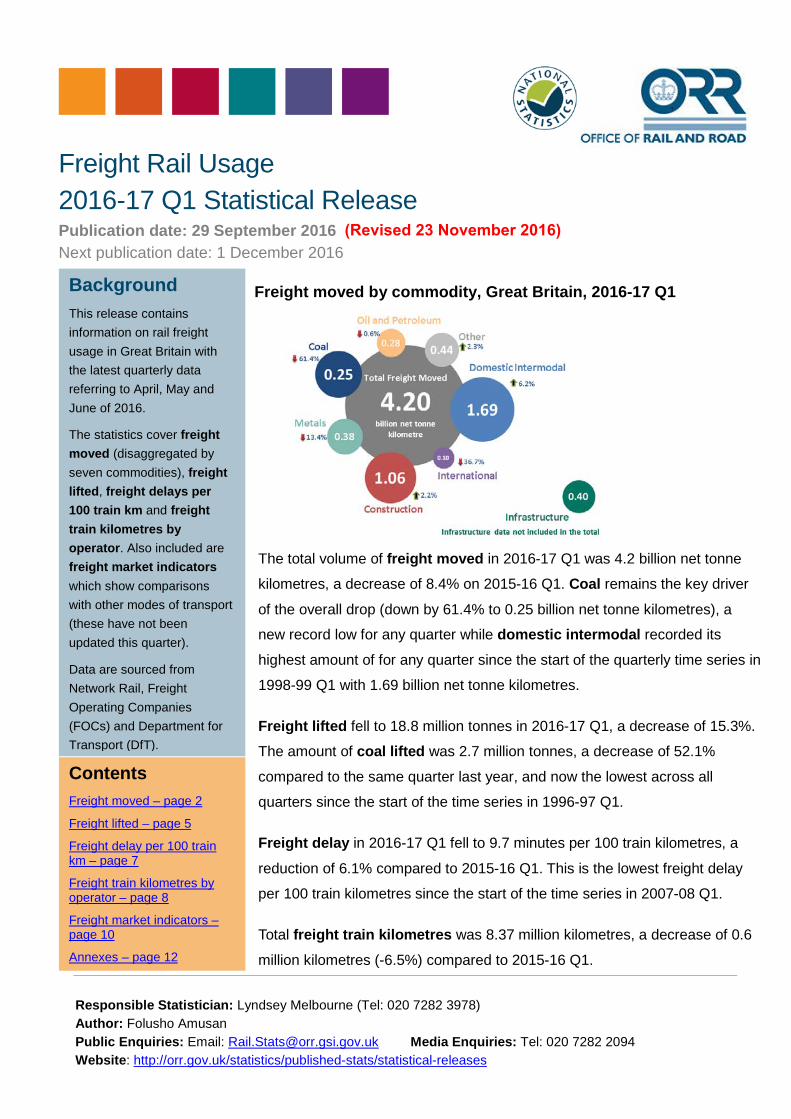
Freight moved by commodity, Great Britain, 2016-17 Q1
The total volume of freight moved in 2016-17 Q1 was 4.2 billion net tonne
kilometres, a decrease of 8.4% on 2015-16 Q1. Coal remains the key driver
of the overall drop (down by 61.4% to 0.25 billion net tonne kilometres), a
new record low for any quarter while domestic intermodal recorded its
highest amount of for any quarter since the start of the quarterly time series in
1998-99 Q1 with 1.69 billion net tonne kilometres.
Freight lifted fell to 18.8 million tonnes in 2016-17 Q1, a decrease of 15.3%.
The amount of coal lifted was 2.7 million tonnes, a decrease of 52.1%
compared to the same quarter last year, and now the lowest across all
quarters since the start of the time series in 1996-97 Q1.
Freight delay in 2016-17 Q1 fell to 9.7 minutes per 100 train kilometres, a
reduction of 6.1% compared to 2015-16 Q1. This is the lowest freight delay
per 100 train kilometres since the start of the time series in 2007-08 Q1.
Total freight train kilometres was 8.37 million kilometres, a decrease of 0.6
million kilometres (-6.5%) compared to 2015-16 Q1.
Freight Rail Usage 2016-17 Q1 Statistical Release Publication date: 29 September 2016 Next publication date: 1 December 2016 Background
This release contains information on rail freight usage in Great Britain with the latest quarterly data referring to April, May and June of 2016.
The statistics cover freight moved (disaggregated by seven commodities), freight lifted, freight delays per 100 train km and freight train kilometres by operator. Also included are freight market indicators which show comparisons with other modes of transport (these have not been updated this quarter).
Data are sourced from Network Rail, Freight Operating Companies (FOCs) and Department for Transport (DfT).
Contents Freight moved – page 2
Freight lifted – page 5
Freight delay per 100 train km – page 7
Freight train kilometres by operator – page 8
Freight market indicators – page 10
Annexes – page 12
Responsible Statistician: Lyndsey Melbourne (Tel: 020 7282 3978) Author: Folusho Amusan Public Enquiries: Email: [email protected] Media Enquiries: Tel: 020 7282 2094 Website: http://orr.gov.uk/statistics/published-stats/statistical-releases
(Revised 23 November 2016)
Freight moved data, measured in net tonne kilometres, shows the amount of freight which is moved on
the railway network, taking into account the weight of the load and the distance carried.
Freight moved is disaggregated by seven commodities which are also summed to provide an overall
total freight moved. The seven commodities by which freight moved is disaggregated are coal, metals,
construction, oil and petroleum, international, domestic intermodal and other.
In addition to the seven commodities listed above the amount of goods used for railway engineering
work is also reported, under the ‘infrastructure’ category. This is not included in the totals published in
the freight moved tables and charts.
1. Freight moved
Annual 2015-16 In 2015-16, the total volume of freight moved was 17.8 billion net tonne kilometres, a decrease of
20.0% on 2014-15. The largest annual decrease in total freight moved (-29.8%) was between
1983-84 and 1984-85 caused by the miners’ strike. Total freight moved grew steadily from 1995-96,
peaking at 22.7 billion net tonne kilometres in 2013-14. For more information, please see the 2015-
16 Q4 statistical release.
Office of Rail and Road 29 September 2016 2016-17 Quarter 1 Statistical Release – Freight Rail Usage 2
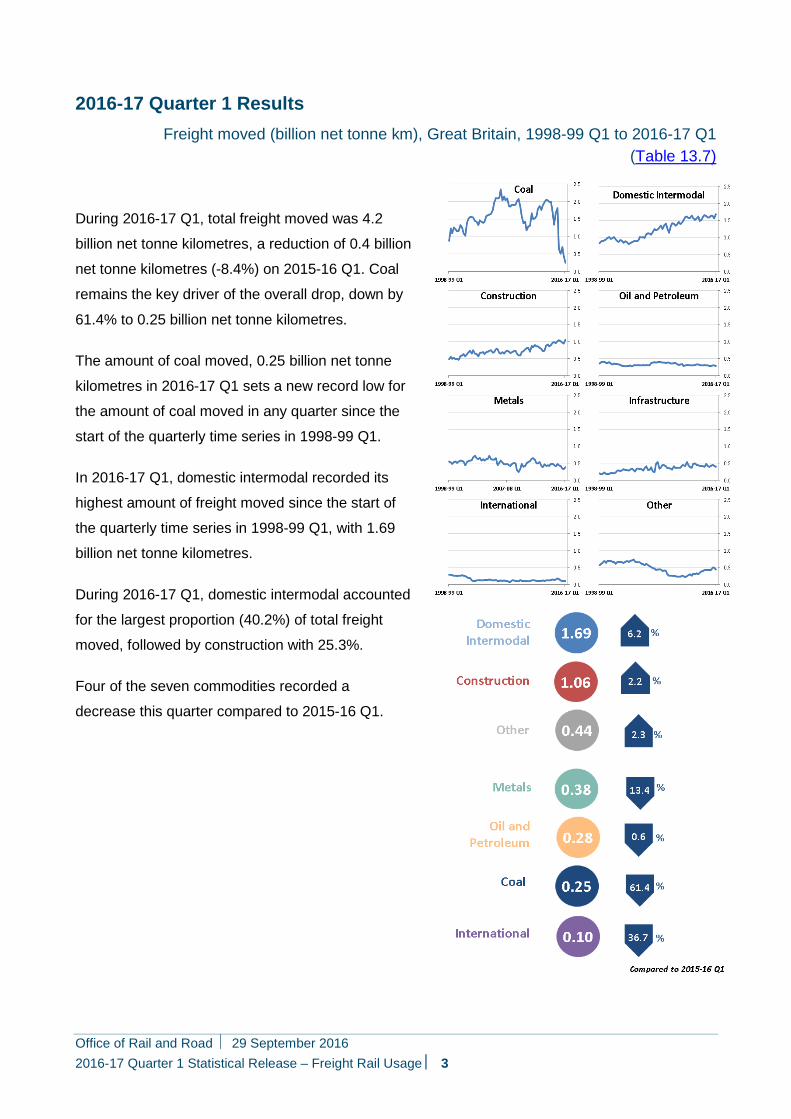
2016-17 Quarter 1 Results Freight moved (billion net tonne km), Great Britain, 1998-99 Q1 to 2016-17 Q1
(Table 13.7)
During 2016-17 Q1, total freight moved was 4.2
billion net tonne kilometres, a reduction of 0.4 billion
net tonne kilometres (-8.4%) on 2015-16 Q1. Coal
remains the key driver of the overall drop, down by
61.4% to 0.25 billion net tonne kilometres.
The amount of coal moved, 0.25 billion net tonne
kilometres in 2016-17 Q1 sets a new record low for
the amount of coal moved in any quarter since the
start of the quarterly time series in 1998-99 Q1.
In 2016-17 Q1, domestic intermodal recorded its
highest amount of freight moved since the start of
the quarterly time series in 1998-99 Q1, with 1.69
billion net tonne kilometres.
During 2016-17 Q1, domestic intermodal accounted
for the largest proportion (40.2%) of total freight
moved, followed by construction with 25.3%.
Four of the seven commodities recorded a
decrease this quarter compared to 2015-16 Q1.
Office of Rail and Road 29 September 2016 2016-17 Quarter 1 Statistical Release – Freight Rail Usage 3
Possible reasons for change in 2016-17 Q1
The closure of coal powered stations by 20251 and restricted use by 2023 means the amount of
coal moved by rail to coal powered stations continues to decrease. The decline of coal has
resulted in freight companies looking at developing their other flows (commodities) and
businesses2.
With the growth (GDP) in the economy3, domestic intermodal freight moved recorded an increase
compared with the same quarter last year.
The GDP4 output shows a fall for construction but this trend is reversed in amount of freight moved
for construction which recorded an increase compared to the same quarter last year. This could be
due to the slight lag between orders for construction rail freight (already signed-off) before the
effect of the slowdown in housing and construction activities5 due to uncertainty leading up to and
immediately after the 23 June Brexit vote fed through.
The data for biomass is included in other category; more biomass is being converted and used in
place of coal part explaining the increase this quarter compared with last year.
Metals recorded a decrease this quarter compared to 2015-16 Q1 because of the continued drop
in global demand for steel and competition from imported steel, resulting in less freight to move
between plants by rail.
The tightened security at Calais (due to the migrant crisis) continues to affect the international
category with less freight moved in the international category compared to 2015-16 Q1.
Quarterly freight moved data are available on the data portal in: Table 13.7
Freight moved disaggregated by commodity type: ORR Data Portal Wizard
1 http://www.bbc.co.uk/news/business-34851718 2 http://www.railmagazine.com/operations/freight/a-positive-attitude-drives-gbrf-forward 3 http://www.bbc.co.uk/news/business-36903164 4http://www.ons.gov.uk/economy/grossdomesticproductgdp/bulletins/grossdomesticproductpreliminaryestimate/aprtojune2016#industry-
analysis (5, industry analysis, construction) 5 http://www.ft.com/fastft/2016/06/02/uk-construction-orders-drop-for-first-time-in-3-years/
Office of Rail and Road 29 September 2016 2016-17 Quarter 1 Statistical Release – Freight Rail Usage 4
Freight lifted is the mass of goods carried on the rail network measured in tonnes, excluding the
weight of the locomotives and wagons. Unlike freight moved it takes no account of the distance
travelled.
Freight lifted information is sourced from the four major FOCs: DB Schenker Rail (formerly EWS),
Freightliner Ltd (formerly the BR container business), Direct Rail Services (DRS) and GB Railfreight.
2. Freight lifted
Annual 2015-16 In 2015-16, the total amount of freight lifted in Great Britain fell to 86.1 million tonnes in 2015-16
from 110.5 million tonnes a year earlier, a fall of 22.1%. Annual freight lifted reached its peak in
1988-89 with 149.5 million tonnes, followed by a fall in each of the next six years. For more
information, please see the 2015-16 Q4 statistical release.
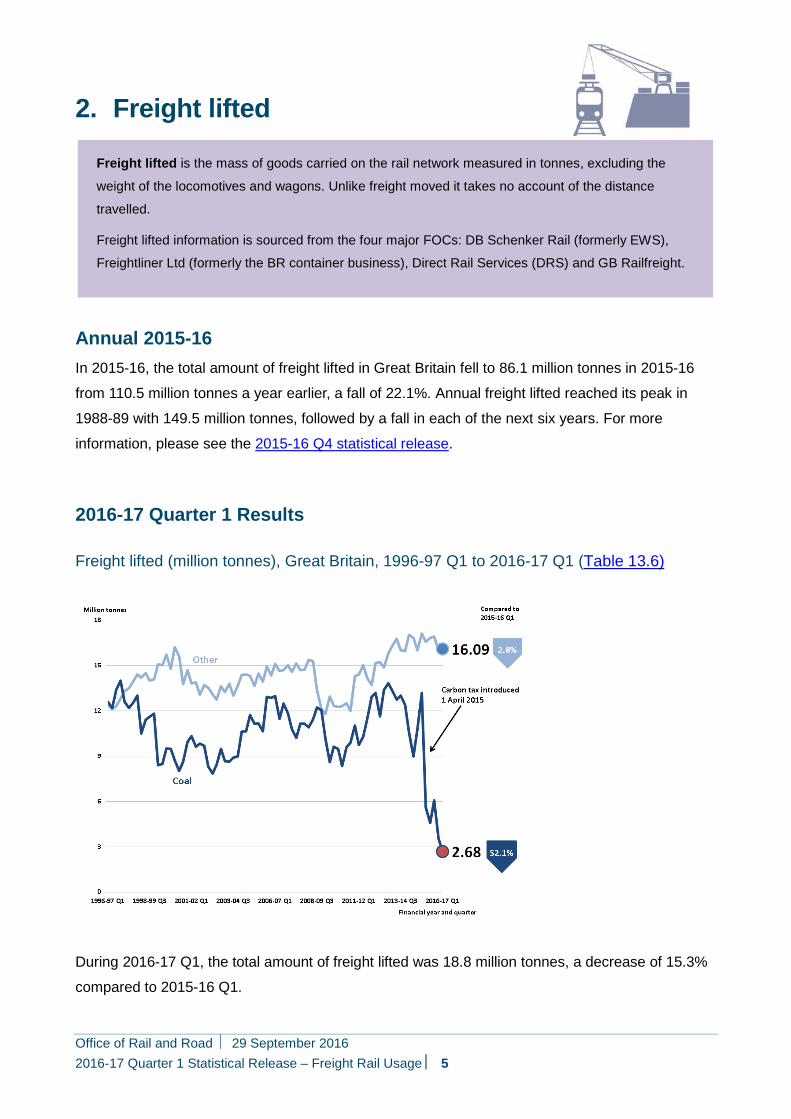
2016-17 Quarter 1 Results
Freight lifted (million tonnes), Great Britain, 1996-97 Q1 to 2016-17 Q1 (Table 13.6)
During 2016-17 Q1, the total amount of freight lifted was 18.8 million tonnes, a decrease of 15.3%
compared to 2015-16 Q1.
Office of Rail and Road 29 September 2016 2016-17 Quarter 1 Statistical Release – Freight Rail Usage 5
In 2016-17 Q1, the amount of coal lifted was 2.7 million tonnes, a decrease of 52.1% compared to
the same quarter last year. This is now the lowest across all quarters since the start of the time
series in 1996-97 Q1.
The amount other freight lifted in 2016-17 Q1 was 16.1 million tonnes, a decrease of 2.8%
compared to 2015-16 Q1.
Quarterly freight lifted data are available on the data portal in: Table 13.6
European comparisons – commentary provided on calendar year data for freight moved and freight
lifted can be found in the 2015-16 Q4 statistical release
Office of Rail and Road 29 September 2016 2016-17 Quarter 1 Statistical Release – Freight Rail Usage 6
Freight delay per 100 train kilometres is a normalised measure of delay experienced by FOCs.
The measure is calculated from the total delay experienced by all GB freight operators divided by their train mileage.
Freight train mileage can fluctuate depending on demand so a normalised measure allows for comparison over time regardless of changing levels of freight traffic on the network.
Freight Delivery Metric (FDM) is another measure of freight train delay. It is based on the percentage of freight trains that arrive at their destination within 15 minutes of their scheduled arrival time. Results and more information can be found in the quarterly Passenger and Freight Rail Performance statistical release.
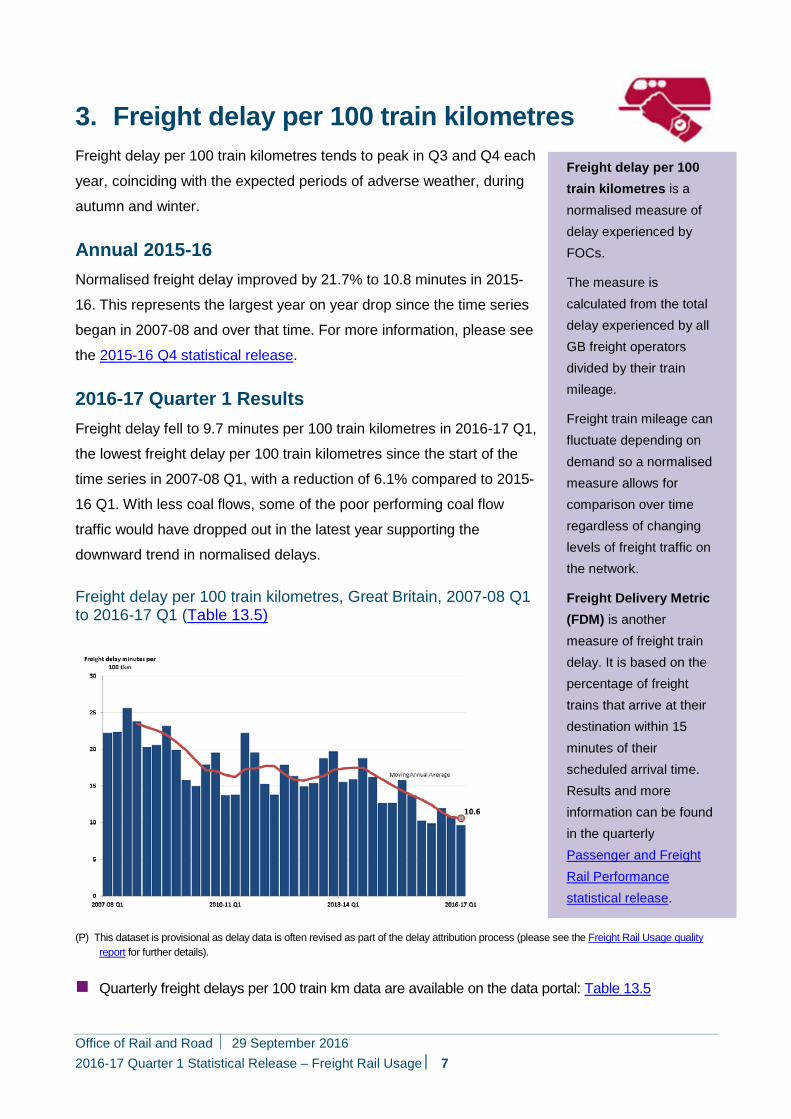
3. Freight delay per 100 train kilometresFreight delay per 100 train kilometres tends to peak in Q3 and Q4 each
year, coinciding with the expected periods of adverse weather, during
autumn and winter.
Annual 2015-16 Normalised freight delay improved by 21.7% to 10.8 minutes in 2015-
16. This represents the largest year on year drop since the time series
began in 2007-08 and over that time. For more information, please see
the 2015-16 Q4 statistical release.
2016-17 Quarter 1 Results Freight delay fell to 9.7 minutes per 100 train kilometres in 2016-17 Q1,
the lowest freight delay per 100 train kilometres since the start of the
time series in 2007-08 Q1, with a reduction of 6.1% compared to 2015-
16 Q1. With less coal flows, some of the poor performing coal flow
traffic would have dropped out in the latest year supporting the
downward trend in normalised delays.
Freight delay per 100 train kilometres, Great Britain, 2007-08 Q1 to 2016-17 Q1 (Table 13.5)
(P) This dataset is provisional as delay data is often revised as part of the delay attribution process (please see the Freight Rail Usage quality report for further details).
Quarterly freight delays per 100 train km data are available on the data portal: Table 13.5
Office of Rail and Road 29 September 2016 2016-17 Quarter 1 Statistical Release – Freight Rail Usage 7
Freight train kilometres is the actual mileage in kilometres operated by FOCs on Network Rail infrastructure
The data is sourced from Network Rail’s Track Access Billing System (TABS) and covers only the mileages charged through TABS.
Competition between freight operators means we would expect a greater level of variation in mileage from year to year than in the passenger market.
Not all freight operators have been in operation throughout the time-series, therefore total year on year comparison should be treated with caution.
Please see the accompanying quality report for more information.
4. Freight train kilometres by operatorFreight train kilometres by operator data cover FOCs on Network Rail
infrastructure and were included for the first time in the 2015-16 Q4
statistical release.
Annual 2015-16 In 2015-16, total freight train kilometres fell to 34.9 million kilometres,
a decrease of 6.1 million kilometres (-14.9%) compared to 2014-15.
This is the lowest amount recorded since the time series began in
2010-11 and is reflective of the fall in freight lifted and freight moved.
For more information, please see the 2015-16 Q4 statistical release.
2016-17 Quarter 1 Results In 2016-17 Q1, total freight train kilometres was 8.37 million
kilometres, a decrease of 0.6 million kilometres (-6.5%) compared to
2015-16 Q1.
Two out of seven operators recorded an increase in 2016-17 Q1
compared to same period last year; Colas Freight with 0.23 million
kilometres (an increase of 20.2%) and Freightliner Intermodal with
2.15 million kilometres (an increase of 0.3%).
Five out of seven operators experienced a decrease in freight train
kilometres compared to 2016-17 Q1; Devon and Cornwall Railways,
Direct Rail Services, DB Cargo UK, Freightliner Heavy Haul and GB
Railfreight.
In 2016-17 Q1, DB Cargo UK accounted for 45.5% of freight train
kilometres, Freightliner Intermodal 25.7% and GB Railfreight 13.9%.
These three operators accounted for over four-fifths of all freight train
kilometres in this quarter.
Office of Rail and Road 29 September 2016 2016-17 Quarter 1 Statistical Release – Freight Rail Usage 8
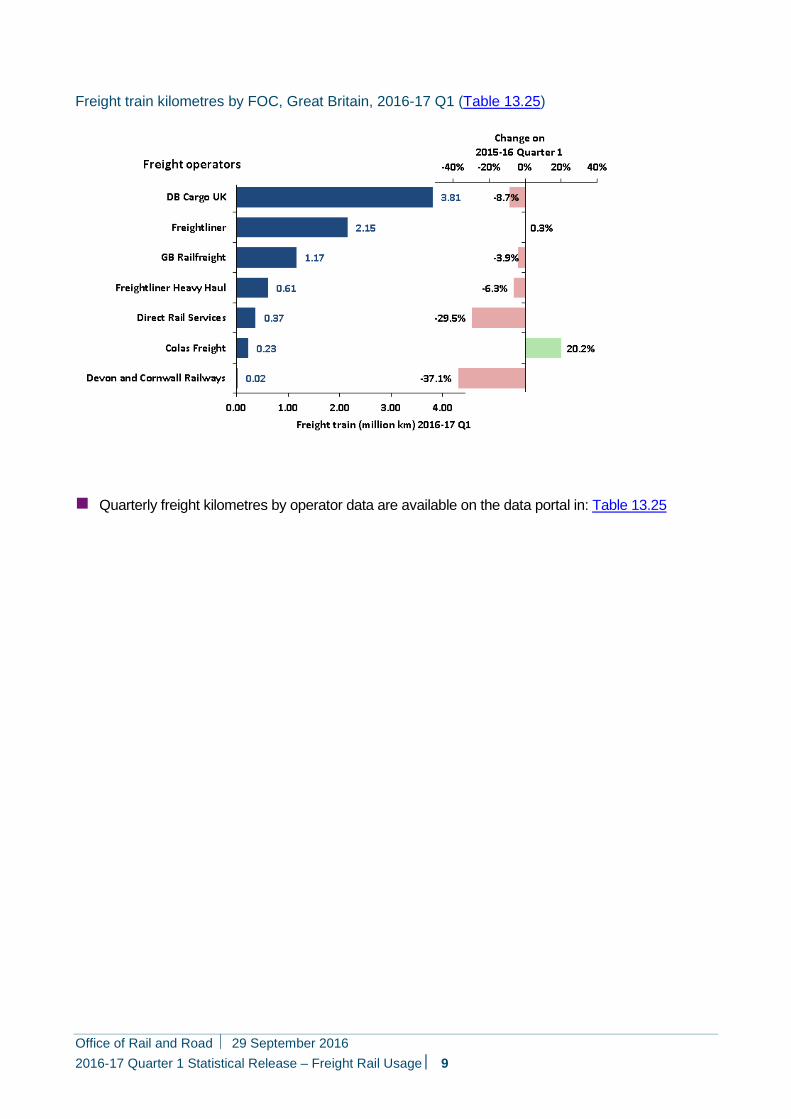
Freight train kilometres by FOC, Great Britain, 2016-17 Q1 (Table 13.25)
Quarterly freight kilometres by operator data are available on the data portal in: Table 13.25
Office of Rail and Road 29 September 2016 2016-17 Quarter 1 Statistical Release – Freight Rail Usage 9
Office of Rail and Road 29 September 2016 2016-17 Quarter 1 Statistical Release – Freight Rail Usage 10
5. Freight market indicatorsFreight market indicators comprise three measures: number of freight train movements on the network (data available up to 2015-16), impact on road haulage (2014-15), and rail market share (calendar year 2014). This section is unchanged from the 2015-16 Q4 statistical release.
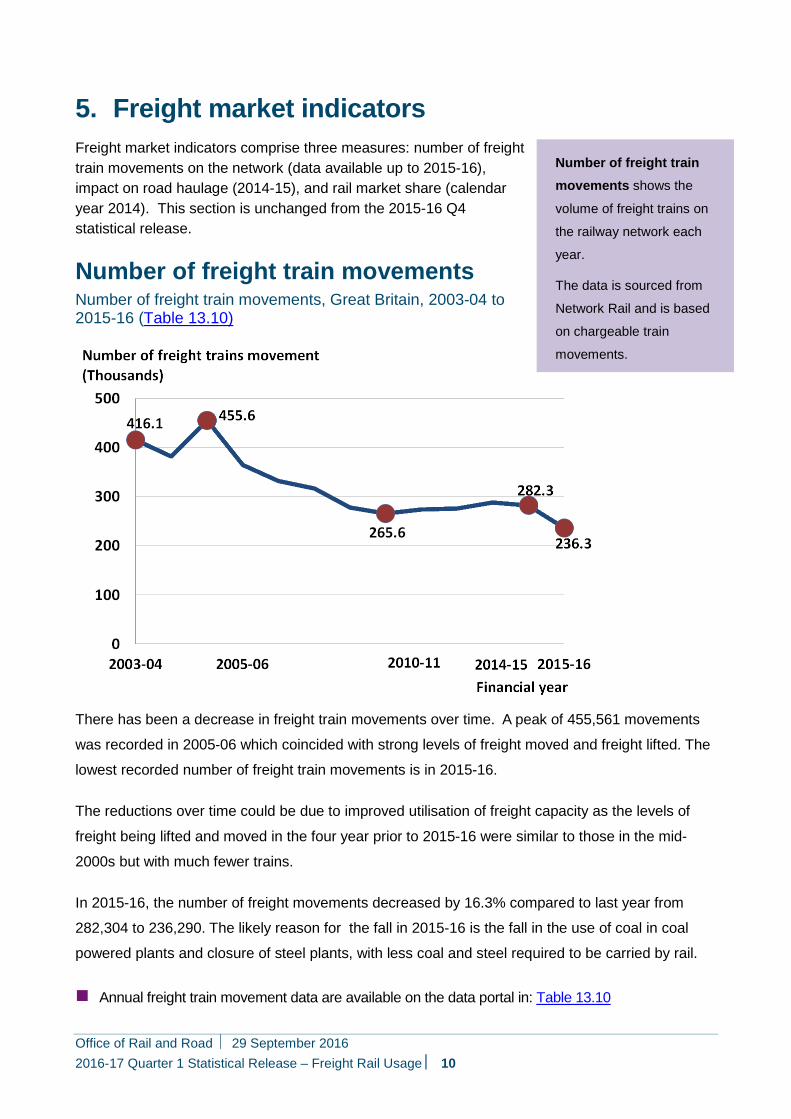
Number of freight train movements Number of freight train movements, Great Britain, 2003-04 to 2015-16 (Table 13.10)
There has been a decrease in freight train movements over time. A peak of 455,561 movements
was recorded in 2005-06 which coincided with strong levels of freight moved and freight lifted. The
lowest recorded number of freight train movements is in 2015-16.
The reductions over time could be due to improved utilisation of freight capacity as the levels of
freight being lifted and moved in the four year prior to 2015-16 were similar to those in the mid-
2000s but with much fewer trains.
In 2015-16, the number of freight movements decreased by 16.3% compared to last year from
282,304 to 236,290. The likely reason for the fall in 2015-16 is the fall in the use of coal in coal
powered plants and closure of steel plants, with less coal and steel required to be carried by rail.
Annual freight train movement data are available on the data portal in: Table 13.10
Number of freight train movements shows the
volume of freight trains on
the railway network each
year.
The data is sourced from
Network Rail and is based
on chargeable train
movements.
Impact on road haulage
consists of two measures;
rail freight lorry kilometres equivalent and avoided lorry journeys.
Rail freight lorry kilometres equivalent measures an
equivalent distance that road
vehicles (HGVs) would need
to have travelled to move the
amounts of freight carried on
rail.
Avoided lorry journeys he
equivalent number of road
vehicle trips necessary to
move the freight.
Rail market share statistics
show the volumes of freight
moved and freight lifted on
different modes of transport;
rail, road, pipeline and water.
Road data is now calculated
based on HGVs only as data
for other vehicle types no
longer available.
Pipeline data is not available
after 2011 therefore it has
been excluded from the
annual totals and the
calculations of market share.
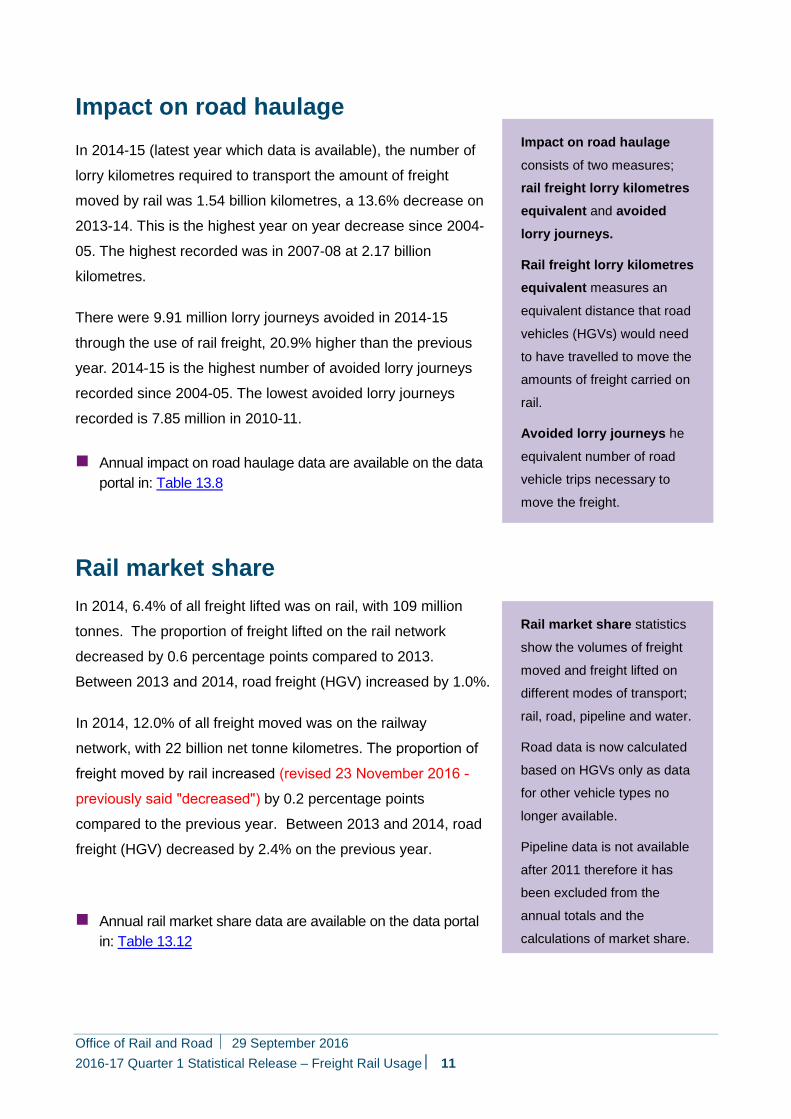
Impact on road haulage In 2014-15 (latest year which data is available), the number of
lorry kilometres required to transport the amount of freight
moved by rail was 1.54 billion kilometres, a 13.6% decrease on
2013-14. This is the highest year on year decrease since 2004-
05. The highest recorded was in 2007-08 at 2.17 billion
kilometres.
There were 9.91 million lorry journeys avoided in 2014-15
through the use of rail freight, 20.9% higher than the previous
year. 2014-15 is the highest number of avoided lorry journeys
recorded since 2004-05. The lowest avoided lorry journeys
recorded is 7.85 million in 2010-11.
Annual impact on road haulage data are available on the dataportal in: Table 13.8
Rail market share In 2014, 6.4% of all freight lifted was on rail, with 109 million
tonnes. The proportion of freight lifted on the rail network
decreased by 0.6 percentage points compared to 2013.
Between 2013 and 2014, road freight (HGV) increased by 1.0%.
In 2014, 12.0% of all freight moved was on the railway
network, with 22 billion net tonne kilometres. The proportion of
freight moved by rail increased (revised 23 November 2016 -
previously said "decreased") by 0.2 percentage points
compared to the previous year. Between 2013 and 2014, road
freight (HGV) decreased by 2.4% on the previous year.
Annual rail market share data are available on the data portalin: Table 13.12
Office of Rail and Road 29 September 2016 2016-17 Quarter 1 Statistical Release – Freight Rail Usage 11
Annex 1 – List of pre-created reports available on the Data Portal All data tables can be accessed on the data portal free of charge. The data portal provides on screen data reports, as well as the facility to download data in Excel format and print the report. We can provide data in csv format on request.
Freight moved
Freight moved – Table 13.7
Freight lifted
Freight lifted – Table 13.6
Freight delay minutes per 100 train kilometres
Normalised freight delay – Table 13.5
Freight train kilometres by operator
Freight train kilometre – Table 13.25
Freight market indicators (annual publications only)
Number of freight train movements – Table 13.10
Impact on rail haulage – Table 13.8
Rail market share – Table 13.12
Further freight usage tables can be created through the Data Portal Wizard.
Revisions: There have been some minor revisions to the previously published dataset. Further details can be found at: Revisions Log.
For more information on data collection and the methodology used to calculate the statistics in this release please see the accompanying Quality Report.
Office of Rail and Road 29 September 2016 2016-17 Quarter 1 Statistical Release – Freight Rail Usage 12
Annex 2 Statistical Releases This publication is part of the statistical releases which cover the majority of reports that were previously released through the Data Portal. The statistical releases consist of four annual and four quarterly themed releases:
Annual:
Rail Finance & Rail Fares Index;
Rail Safety Statistics;
Rail Infrastructure, Assets and Environmental;
Regional Rail Usage.
Quarterly:
Passenger and Freight Rail Performance;
Freight Rail Usage;
Passenger Rail Usage;
Passenger Rail Service Complaints.
A full list of publication dates for the next twelve months can be found in the release
schedule on the ORR website.
Office of Rail and Road 29 September 2016 2016-17 Quarter 1 Statistical Release – Freight Rail Usage 13
National Statistics The United Kingdom Statistics Authority designated these statistics as National Statistics, in accordance with the Statistics and Registration Service Act 2007 and signifying compliance with the Code of Practice for Official Statistics.
National Statistics status means that official statistics meet the highest standards of trustworthiness, quality and public value.
All official statistics should comply with all aspects of the Code of Practice for Official Statistics. They are awarded National Statistics status following an assessment by the Authority’s regulatory arm. The Authority considers whether the statistics meet the highest standards of Code compliance, including the value they add to public decisions and debate.
It is ORR’s responsibility to maintain compliance with the standards expected of National Statistics. If we become concerned about whether these statistics are still meeting the appropriate standards, we will discuss any concerns with the Authority promptly. National Statistics status can be removed at any point when the highest standards are not maintained, and reinstated when standards are restored.
For more details please contact the Statistics Head of Profession Lyndsey Melbourne on 020 7282 3978 or contact [email protected].
The Department for Transport (DfT) also publishes a range of rail statistics which can be found at DfT Rail Statistics. They also publish road freight statistics which can be found at Road freight: domestic and international statistics.
Office of Rail and Road 29 September 2016 2016-17 Quarter 1 Statistical Release – Freight Rail Usage 14
© Crown copyright 2016
This publication is licensed under the terms of the Open Government Licence v3.0 except where otherwise stated. To view this licence, visit nationalarchives.gov.uk/doc/open-government-licence/version/3 or write to the Information Policy Team, The National Archives, Kew, London TW9 4DU, or email: [email protected].
Where we have identified any third party copyright information you will need to obtain permission from the copyright holders concerned.
This publication is available at orr.gov.uk
Any enquiries regarding this publication should be sent to us at orr.gov.uk
Office of Rail and Road 29 September 2016 2016-17 Quarter 1 Statistical Release – Freight Rail Usage 15