Embed Size (px)
Citation preview
Freeport-McMoRan – Chino Mines Company
HANOVER/WHITEWATER CREEK INVESTIGATION UNIT Interim Removal Action Work Plan
May 2018
arcadis.com C:\Users\mbarkley\Desktop\HWC Removal Action\2017 Workplan for NMED\Final 052118\HWCIU_IRAWP_052318.docx
HANOVER/ WHITEWATER
CREEK INVESTIGATION
UNIT
Interim Removal Action Work Plan
Prepared for:
Freeport-McMoRan – Chino Mines Company
Prepared by:
Arcadis U.S., Inc.
11001 W. 120th Avenue
Suite 200
Broomfield
Colorado 80021
Tel 303 544 0043
Fax 720 887 6051
Our Ref.:
B0063543.0018
Date:
May 2018
arcadis.com i
CONTENTS acronyms and Abbreviations ........................................................................................................................ iii
1 introduction .............................................................................................................................................. 1
1.1 Purpose ........................................................................................................................................... 1
1.2 Site Description ............................................................................................................................... 2
1.3 Background ..................................................................................................................................... 2
1.4 Report Organization ........................................................................................................................ 3
2 Previous Investigations ........................................................................................................................... 4
2.1 Background Investigation ............................................................................................................... 4
2.2 HWCIU Remedial Investigation ...................................................................................................... 4
2.3 Ecological IU Remedial Investigation (RI) ...................................................................................... 6
2.4 Sediment Background Investigation ............................................................................................... 7
2.5 Groundhog Mine Site and Small Stockpile Site Interim Removal Action ....................................... 8
2.6 Comprehensive Groundwater Characterization Study ................................................................... 8
2.7 Tin Can Operations (TCO) – Interim Removal Action .................................................................... 9
2.8 Human Health and Ecological Risk .............................................................................................. 10
2.8.1 Human Health .................................................................................................................... 10
2.8.2 Ecological Risk .................................................................................................................. 11
2.9 2006 Sediment Sampling .............................................................................................................. 11
2.10 2007 Sediment Sampling .............................................................................................................. 12
3 Removal action ..................................................................................................................................... 13
3.1 Project Objectives ......................................................................................................................... 13
3.2 August 2017 Visual Inspection ..................................................................................................... 13
3.3 Removal Area Prioritization .......................................................................................................... 14
3.4 Removal Methodology .................................................................................................................. 14
3.4.1 Site Preparation, Implementation and Restoration ........................................................... 15
3.4.2 Best Management Practices ............................................................................................. 17
3.4.2.1 Surface Water Management .................................................................................... 17
3.4.2.2 Sediment and Erosion Control ................................................................................. 17
3.4.2.3 Worker and Residential Protection .......................................................................... 17
arcadis.com ii
3.5 Post Removal Confirmation Sampling .......................................................................................... 18
3.6 Long-Term Use Following Removal ............................................................................................. 20
3.7 Construction Documentation ........................................................................................................ 20
3.8 BMP Monitoring ............................................................................................................................ 20
4 Regulatory review ................................................................................................................................. 21
4.1 NPDES Construction General Permit ........................................................................................... 21
4.2 NMED Dust Permit........................................................................................................................ 21
4.3 Discharge Plan .............................................................................................................................. 21
4.4 Nationwide Permit 38 .................................................................................................................... 21
4.5 Highway and Rail Road Right-of-Way .......................................................................................... 22
5 Project Closeout .................................................................................................................................... 22
6 Refernces .............................................................................................................................................. 22
TABLES Table 1: Constituent Concentration Ranges from the AOC Background Investigation
Table 2: Constituent Concentration Ranges in P1-P3 from Phase 1 RI
Table 3: Constituent Background Concentrations in Reach P1 from the Background Investigation
Table 4: Constituent Background Concentrations in Reach P2 from the Background Investigation
Table 5: Constituent Background Concentrations in Reach P3 from the Background Investigation
Table 6: Summary of 2006 XRF Data Results
Table 7: Summary of 2006 Analytical Laboratory Results
Table 8: Summary of Proposed Removal Areas
Table 9: Summary of 2017 XRF Data Results
FIGURES Figure 1: Site Overview
Figure 2: Areas Identified During Visual Inspection
Figures 3 through 8: Proposed Removal Areas
arcadis.com iii
ACRONYMS AND ABBREVIATIONS AOC Administrative Order on Consent
BGS Below Ground Surface
BMP Best Management Practice
Chino Chino Mines Company
CGCS Comprehensive Groundwater Characterization Study
CGP Construction General Permit
COI Constituent of Interest
COPC Constituent of Potential Concern
CSM Conceptual Site Model
CTE Central Tendency Estimate
ERA Ecological Risk Assessment
H&S Health and Safety
HASP Health and Safety Plan
HWC Hanover/Whitewater Creek
HWCIU Hanover/Whitewater Creek Investigation Unit
IA Interim Action
IEUBK Integrated Exposure Uptake Biokinetic Model
IRAWP Interim Removal Action Work Plan
IU Investigation Unit
NMDOT New Mexico Department of Transportation
NMED New Mexico Environment Department
NMWQCC New Mexico Water Quality Control Commission
NOI Notice of Intent
NPDES National Pollutant Discharge Elimination System
QA/QC Quality Assurance/Quality Control
QAP Quality Assurance Plan
PCA Principle Component Analysis
RAC Remedial Action Criteria
arcadis.com iv
RCP Rock Channel Protection
RI Remedial Investigation
RME Reasonable Maximum Exposure
RPR Resident Project Representative
SOP Standard Operating Procedure
SSL Site-Specific Screening Level
STSIU Smelter Tailings Soil Investigation Unit
SWPPP Storm Water Pollution Prevention Plan
TAL Target Analyte List
TCO Tin Can Plant Operation
USGS United States Geologic Survey
XRF X-ray Fluorescence
arcadis.com 1
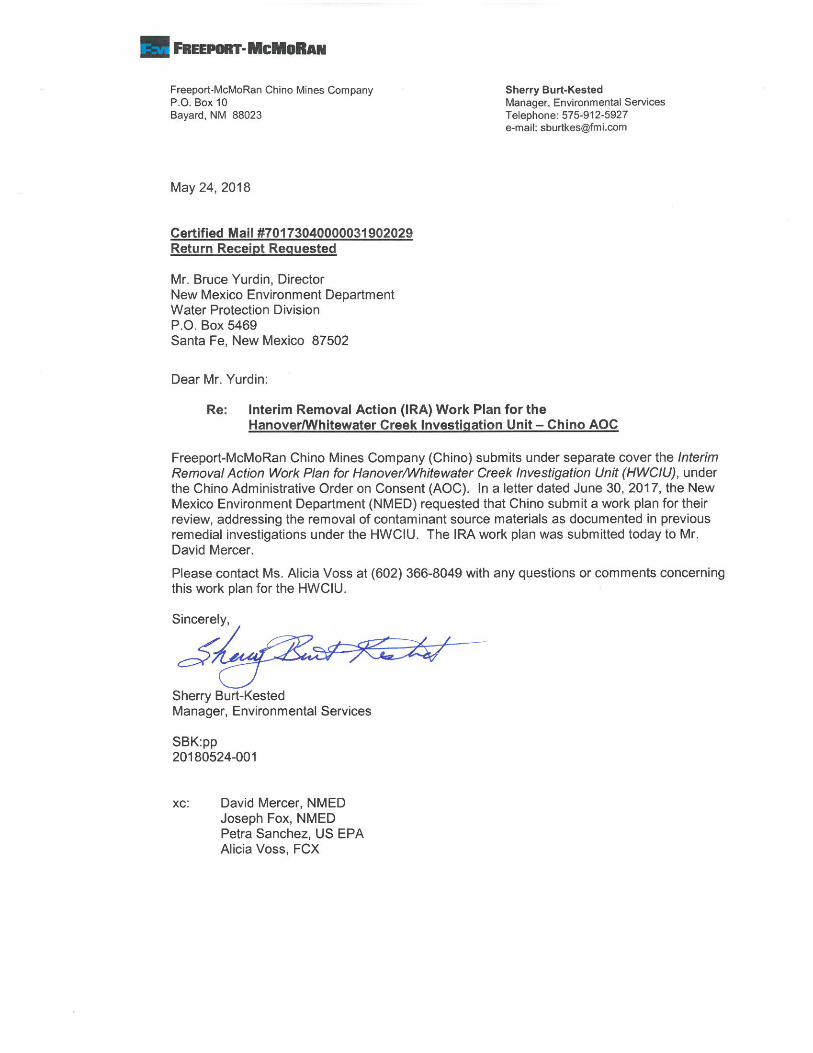
1 INTRODUCTION
This interim removal action work plan (IRAWP) is proposed under the Hanover/Whitewater Creek Investigation Unit (HWCIU) for the Administrative Order on Consent (AOC). On December 23, 1994 Chino Mines Company (Chino) and the New Mexico Environment Department (NMED) entered into an AOC to address the possible environmental impacts within the Investigation Area (IA) due to mining operations, historical releases, and natural sources. The HWCIU is one of six investigation units within the IA. The Phase I Remedial Investigation (RI) prepared by Golder Associates in 2000 indicated that within the HWCIU, physical reaches P1 through P3 comprise the majority of impacted sediment areas (Golder, 2000). This IRAWP presents a proposed interim removal action for the soil/sediment within reaches P2 and P3 (the site) located within the HWCIU (Figure 1).
1.1 Purpose The purpose of the proposed interim removal action (IRA) is:
• To reduce the mass of Contaminants of Potential Concern (COPCs) in soil and sediment withinthe active channel, bar and overbank deposits of HWCIU which could be an ongoing source ofexposure to nearby residents or ecological receptors and
• To improve channel flow conditions by removing hardened physical obstructions left by historic tincan plant operations (TCOs).
This IRAWP presents a design for soil and sediment removal within reaches P2 through P3 of Hanover/Whitewater Creek (HWC) and is based on numerous historic studies that detail the nature and extent of metal impacts in soil and sediment within HWCIU:
• AOC Background Study for the Investigative Area (Chino, 1995)• Phase I Remedial Investigation HWCIU (Golder, 2000),• Phase II Ecological Remedial Investigation HWCIU (ARCADIS JSA, 2001),• Supplemental Technical Memorandum Sediment Background Investigation HWCIU (Golder,
2004),• Interim Action Work Plan HWCIU (BBL, 2006), and• Technical Memorandum Data to Support Ecological Risk Assessment HWCIU (Golder, 2008).
The focus of the IRA, is removal of accessible impacted sediment/soil deposited in the bars, overbanks, active channel (ferricrete only), and TCOs, located in reaches P2 through P3. Reach P1 does not meet the objective of this proposed removal action since the physical reach was not effected by TCOs. Areas with visual ferricrete, as a result of the TCOs, in the active channel are included in this IRAWP, whereas Site-Wide Abatement (SWA) under Discharge Permit 1340 addresses the active channel sediment as part of the subsurface groundwater regulatory overlap with the AOC.
The intent of the AOC is to address impacts due to releases or potential releases of hazardous substances not regulated by discharge permits, thus the AOC contains the following language : “….to avoid duplication of environmental closure activities to the extent that the (AOC) investigation area is subject to existing discharge plans….it is the Parties’ intent that Discharge Plans within the investigation area shall continue to govern the areas described within each such Discharge Plan, including investigation, corrective action, if required, and environmental closure actions…”. The investigations pursuant to the AOC have focused on sediment, surface water, and soil, but generally not groundwater
arcadis.com 2
other than including available groundwater data for risk evaluations, as part of the human health risk assessments. The media of interest under the SWA regulations (i.e., Discharge Permit 1340) are groundwater and surface water. The vadose zone is subject to the abatement regulations because it has the potential to influence groundwater and/or surface water quality. By inference, this includes any saturated sediment or soil (e.g., stream sediments as noted under 20.6.2.4106C2b NMAC), which has the potential to cause groundwater or surface water standards to be exceeded. AOC investigates surface water and/or sediment and soil, data collected primarily to address direct human or other exposure to sediment and/or soil, but useful for SWA purposes as well. The SWA investigation consists of parallel tracks, one for groundwater, and one for the vadose zone and surface water. Surface water specifically in communication with groundwater as found with low or base flow runoff which addresses the active channel. Sediment and soil, whether saturated or unsaturated (i.e., in the vadose zone) are assumed to be subject to the abatement regulations if they have the potential to cause exceedance of groundwater standards and/or surface water criteria.
1.2 Site Description Chino operates the Santa Rita Mines in southeast Grant County, New Mexico. Nearby towns include Hanover, Vanadium, Bayard, North Hurley, and Hurley. The location of the site is shown in Figure 1.
Hanover Creek begins in the Pinos Altos Range at approximately 7,500 to 8,000 feet and flows to the south in a narrow valley for 8 miles at approximately 2.1% slope to the confluence with Whitewater Creek. Whitewater Creek originates near the former Chino precipitation plant and flows west approximately 3,000 feet at a slope of approximately 1.7% to the confluence with Hanover Creek. Downstream of the confluence, HWC flows for 7 miles to the south-southwest through a wide valley towards the town of Hurley.
The topography for the area ranges from mountainous in the north to flat plains in the south. The hillslopes are steep in the north ranging from 10% slope to vertical cliffs and are gentle in the south ranging from zero to three percent slopes. Elevation, steepness, and ruggedness generally decrease from north to south.
Climate data is taken from two meteorological stations operated by Chino: the Santa Rita Station and the Hurley Station. The Santa Rita Meteorological Station is located near the Chino open pit at an elevation of approximately 6,200 feet. The Hurley Meteorological Station is located near the Hurley Smelter at an elevation of 5,700 feet. The average annual precipitation for the Santa Rita and Hurley stations between 1985 and 1999 were 19.18 and 15.69 inches respectively. However, average annual precipitation fluctuates significantly ranging from approximately 6 to 30 inches per year. Approximately half of the annual precipitation occurs in July, August, and September in high-intensity, short-duration rain events. July through September is considered the rainy season for the site. The frost-free period is from late April to mid-October and is approximately 165 to 190 days in duration. Spring and late fall months are generally dry (Golder Associates 1998).
1.3 Background Large scale open pit mining of copper began in 1910 at the current Santa Rita Mine site, but mining has occurred in the area for more than 200 years. The primary mineral extracted from Chino operations is copper, with smaller amounts of molybdenum, gold and silver. Other ore deposits in the area have produced iron, lead, and zinc. The major historical events associated with Chino that have affected the creek system are listed below (Golder Associates 2000).
arcadis.com 3
• Santa Rita Creek, a large tributary to Whitewater Creek that originated in the area of the Chino open pit, was cut off prior to 1948 as the Santa Rita pit grew in size (based on a 1948 United State Geological Survey (USGS) topographic map). Chino constructed Reservoir 4A in Whitewater Creek during the 1980’s to contain runoff from storm events. Previous to this construction, low flow releases and occasional overflows upgradient contributed water with low pH to Whitewater Creek.
• Emplacement of the West Stockpile on the east bank of Hanover Creek began sometime after 1948 (based on the 1948 USGS topographic map). Six containment dams, including interceptor wells, were constructed between 1991 and 1993 along the western edge of the stockpile in order to eliminate runoff and seepage releases to Hanover Creek.
• The Chino precipitation plant at the head of Whitewater Creek operated from the 1930s to 1998. Dam 17 was constructed in 1998 immediately downstream of the precipitation plant and the Ivanhoe concentrator in order to contain a 100-year, 24-hour storm. Dam 17 also captures alluvial seepage flow. Previous to this construction, low flow releases and occasional overflows contributed water with low pH to Whitewater Creek.
• The tailing and concentrate pipelines from the Ivanhoe Concentrator to Hurley and on south to the tailing ponds was constructed in 1982. Prior to this time, ore was shipped by rail to a concentrator at Hurley and no pipeline was necessary. The pipeline runs through Bayard Canyon and along the east side of Whitewater Creek. Prior to improvements to the pipeline corridor, tailing releases prior to the early 2000’s contributed sources of low pH to Whitewater Creek.
• The historic Hurley concentrator was constructed in approximately 1910 and the current Hurley smelter constructed in 1939. Lake One was constructed to the southeast of the Hurley concentrator in 1910 to capture runoff from Whitewater Creek to supply the concentrator operations. Lake One has captured many of the releases from the Chino operation, as well as other upstream operations.
1.4 Report Organization The remaining sections of this IRAWP are organized as follows:
• Section 2 presents previous Site investigations; • Section 3 describes the proposed interim action conceptual design; • Section 4 presents the review of applicable regulatory requirements; • Section 5 describes the project closeout; and • Section 6 identifies references used to prepare this work plan.
arcadis.com 4
2 PREVIOUS INVESTIGATIONS Investigations have been performed within HWCIU by Chino and others. The following sections provide a summary of each of the previous investigations. These investigations provide data for determination of nature and extent of contamination and for determination of human and ecologic risk associated with COPCs within the IU.
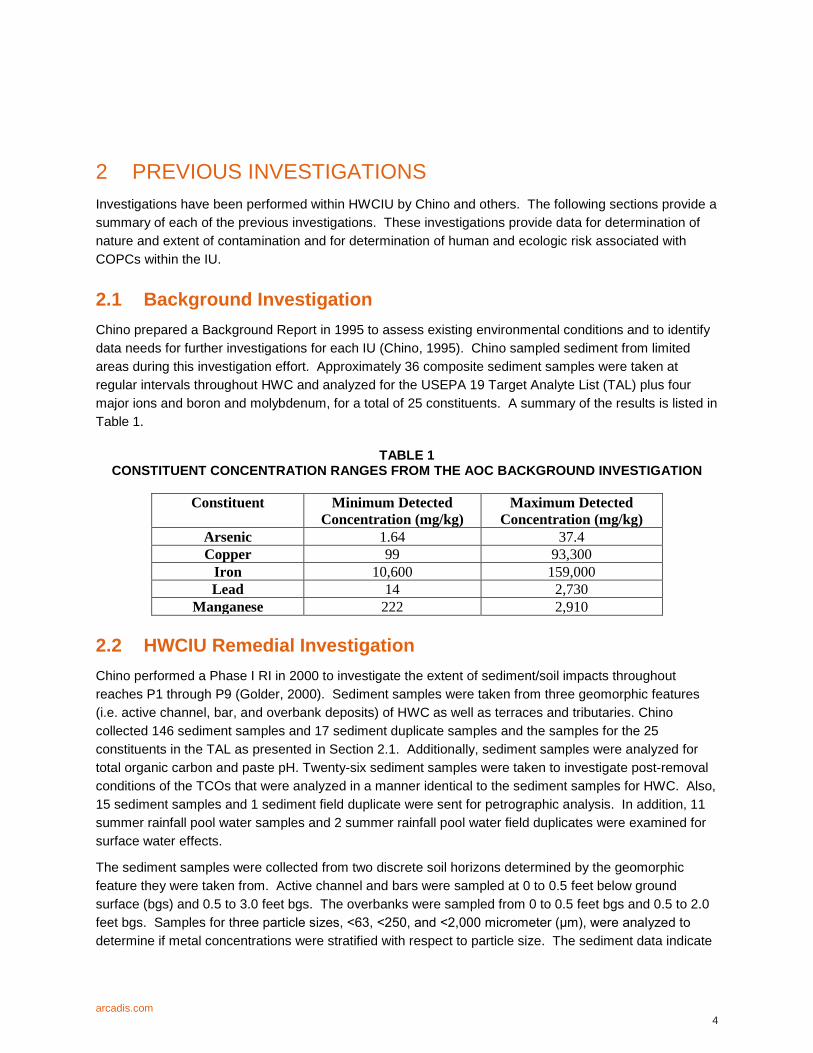
2.1 Background Investigation Chino prepared a Background Report in 1995 to assess existing environmental conditions and to identify data needs for further investigations for each IU (Chino, 1995). Chino sampled sediment from limited areas during this investigation effort. Approximately 36 composite sediment samples were taken at regular intervals throughout HWC and analyzed for the USEPA 19 Target Analyte List (TAL) plus four major ions and boron and molybdenum, for a total of 25 constituents. A summary of the results is listed in Table 1.
TABLE 1 CONSTITUENT CONCENTRATION RANGES FROM THE AOC BACKGROUND INVESTIGATION
Constituent Minimum Detected Concentration (mg/kg)
Maximum Detected Concentration (mg/kg)
Arsenic 1.64 37.4 Copper 99 93,300
Iron 10,600 159,000 Lead 14 2,730
Manganese 222 2,910
2.2 HWCIU Remedial Investigation Chino performed a Phase I RI in 2000 to investigate the extent of sediment/soil impacts throughout reaches P1 through P9 (Golder, 2000). Sediment samples were taken from three geomorphic features (i.e. active channel, bar, and overbank deposits) of HWC as well as terraces and tributaries. Chino collected 146 sediment samples and 17 sediment duplicate samples and the samples for the 25 constituents in the TAL as presented in Section 2.1. Additionally, sediment samples were analyzed for total organic carbon and paste pH. Twenty-six sediment samples were taken to investigate post-removal conditions of the TCOs that were analyzed in a manner identical to the sediment samples for HWC. Also, 15 sediment samples and 1 sediment field duplicate were sent for petrographic analysis. In addition, 11 summer rainfall pool water samples and 2 summer rainfall pool water field duplicates were examined for surface water effects.
The sediment samples were collected from two discrete soil horizons determined by the geomorphic feature they were taken from. Active channel and bars were sampled at 0 to 0.5 feet below ground surface (bgs) and 0.5 to 3.0 feet bgs. The overbanks were sampled from 0 to 0.5 feet bgs and 0.5 to 2.0 feet bgs. Samples for three particle sizes, <63, <250, and <2,000 micrometer (μm), were analyzed to determine if metal concentrations were stratified with respect to particle size. The sediment data indicate
arcadis.com 5
that all 21 trace metals were detected at least once in reaches P1 through P3. Results of the investigation can be summarized as follows:
• Metals concentrations in sediment were generally higher in the smaller size fractions. However, the relationship between particle size and metal concentration was not linear and was more appropriately approximated by a power, exponential, or logarithmic curve (Phase 1 RI Tables 4.2-1 through 4.2-5, 4.2-10, and 4.2-13; Phase 1 RI Plates 1, 2, 3, and 4 (Golder, 2000)).
• Metals concentrations in the active channel and the bars were generally similar in the two depth intervals sampled. Metals concentrations in the post-removal TCOs showed the least change in concentration with depth. Concentration differences were most significant in the overbank samples, however were not consistent for all metals (i.e. highest concentration for individual metals occurring in either the shallow or deep samples).
• Metals concentrations varied less within a geomorphic feature than between features. • The number of metals showing trends of decreasing concentration with distance increased with
the distance under consideration. • Bayard Canyon and Bolton Draw both had a diluting influence for most metals in Whitewater
Creek. • The bars generally contained the highest concentrations of metals, however, arsenic, copper,
lead, and zinc were found in highest concentrations in the shallow overbanks (Sample locations included on Phase 1 RI Plates 1, 2, 3, and 4 (Golder, 2000)).
The Phase 1 RI report provided data in order to further define the Conceptual Site Model (CSM) and to provide information for a quantitative human-health risk assessment. A technique called Principal Component Analysis (PCA) was used to determine the source of the metals that may be of concern and to understand the relationships between metals, their concentrations, and geomorphic units at the site. The PCA evaluated metals originating from a particular source (i.e. the ore body) for a spatial pattern or trend of concentrations. The Phase 1 RI Report suggested two groupings of metals:
• PCA Group 1 – arsenic, cadmium, cobalt, copper, iron, manganese, molybdenum, lead, and zinc. • PCA Group 2 – aluminum, arsenic, boron, chromium, iron, molybdenum, lead, antimony,
selenium, and vanadium.
These groups have some inherent overlap. PCA Group 1 represents the mineralized source group. PCA Group 2 represents compounds that are a result of common geochemical behavior. The PCA groupings assisted in development of the CSM in that the data trends seen provided insight as to which metals found in HWC were likely as a result of mining operations as opposed to those metals likely to be naturally occurring at the site.
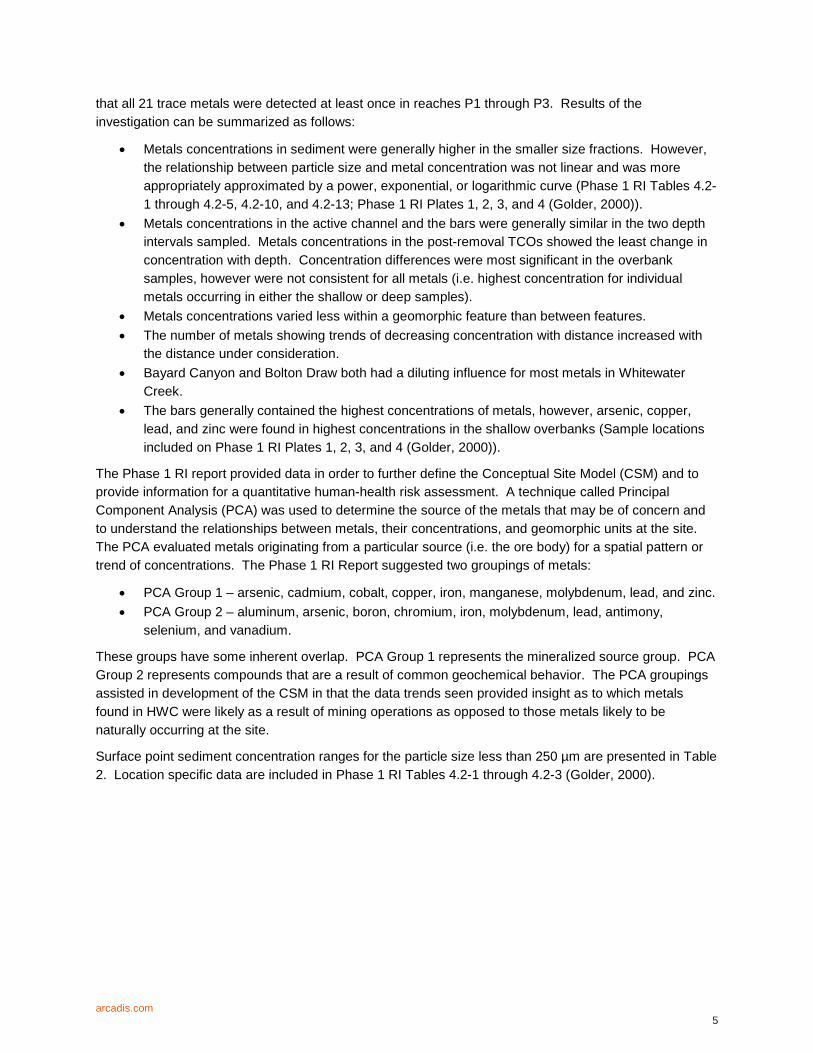
Surface point sediment concentration ranges for the particle size less than 250 µm are presented in Table 2. Location specific data are included in Phase 1 RI Tables 4.2-1 through 4.2-3 (Golder, 2000).
arcadis.com 6
TABLE 2 CONSTITUENT CONCENTRATION RANGES FOR REACHES P1-P3 FROM THE PHASE 1 RI
Constituent Minimum Concentration
(mg/kg) Maximum Concentration
(mg/kg) Arsenic 0.151 15 Copper 99.7 3,250
Iron 10,204 97,400 Lead 11.1 722
Manganese 147 4,300
2.3 Ecological IU Remedial Investigation (RI) A Phase II Ecological Remedial Investigation (EcoRI) was conducted to address potential ecological risk associated with former and current operations at the site (ARCADIS JSA, 2001). The Ecological IU encompasses all the IUs designated by the AOC and is characterized by complex geology, topography, variable climate, and ecology. Because of the landscape scale and complexity of the Ecological IU, the CSM was separated into two distinct components for discussion purposes: (1) the upland, and (2) the ephemeral drainage. The ephemeral drainage portion of the Ecological IU (Ephemeral Drainage Investigation Area, (IA)) corresponds somewhat to the area of interest for this proposed HWC Interim Action. The Ephemeral Drainage IA included HWCIU, Martin Canyon, Lampbright Draw, Bolton Draw, Lucky Bill Canyon, and Bayard Canyon, as well as unnamed tributaries.
Six samples (ERA-22, ERA-28, ERA-29, ERA-32, and ERA-33) were collected along HWCIU during the Phase II Ecological IU RI (EcoRI Figure 3-3, (ARCADIS JSA, 2001)) and there were no specific sampling locations selected to represent reference conditions; however, samples from Lampbright Draw were used as a point of departure for comparison purposes. Soil samples were collected from the 0 to 6 inch depth interval from overbank at all sampling locations and screened to the less than 2,000 um particle size fraction. The primary results from this investigation include the following:
• Copper, manganese, and mercury soil concentrations are elevated at a number of locations as compared to Lampbright Draw, a non-mineralized ephemeral drainage sampling location selected as a point of comparison, and risk based benchmarks. Boron, cadmium, lead, selenium, and zinc are elevated above the Lampbright Draw dataset in Hanover and Whitewater Creek, Bayard Canyon, and Groundhog Mine site area (EcoRI Tables 4-111 through 4-130 (ARCADIS JSA, 2001)). Of the remaining metals, only manganese at ERA22, ERA29, and ERA32, and mercury at ERA32 were elevated. ERA32 is located adjacent to the Groundhog stockpile and, as expected, has a unique pattern of metals occurrence that is not representative of the rest of HWCIU. Subsequently, these samples were compared to HWCIU sediment background (Golder, 2004) and arsenic, copper, iron, lead, manganese, and zinc were elevated above background concentrations.
• In general, the ERA overbank data was consistent with data for the less than 2,000-micron particle size fraction for the Phase I HWCIU RI overbanks. Sample ERA22, ERA27, ERA28, and ERA29 are located on overbanks within Physical Reaches 1, 3, and 8 (EcoRI Figure 3-3 (ARCADIS JSA, 2001)). Since a total of 146 samples were collected and analyzed for the Phase
arcadis.com 7
I HWCIU RI (Golder, 2000), the Phase II EcoRI samples only represent a small subset of the data for Hanover and Whitewater Creeks.
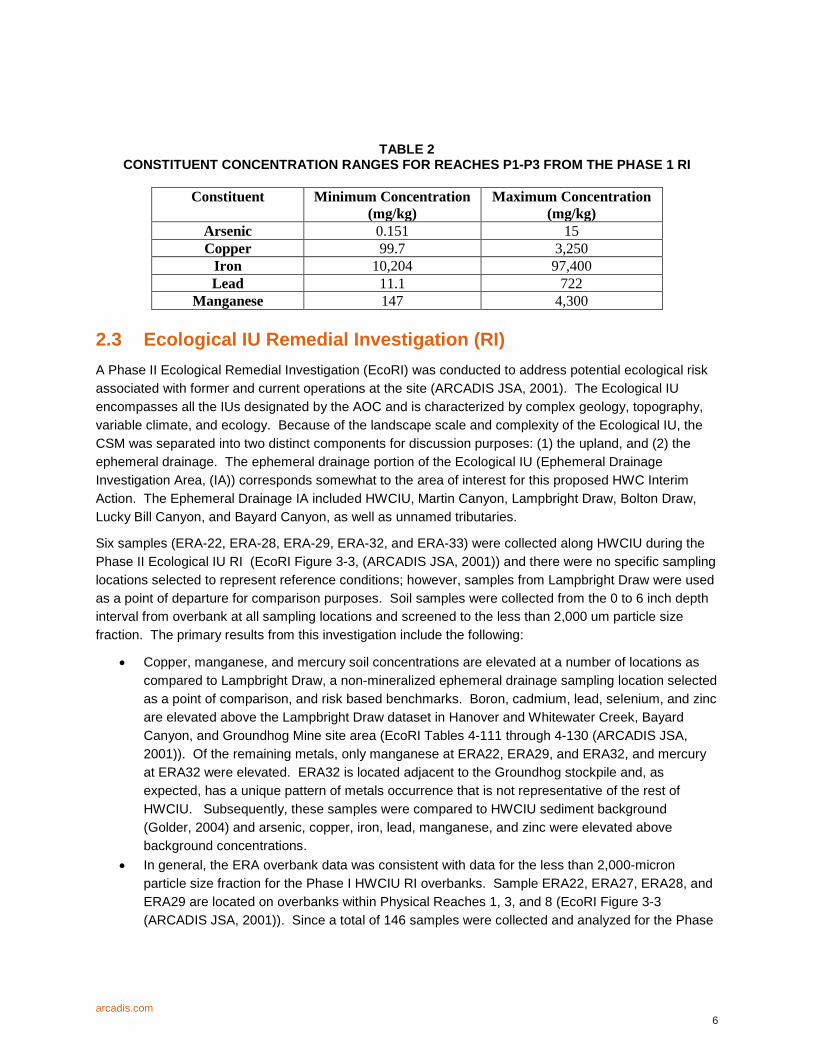
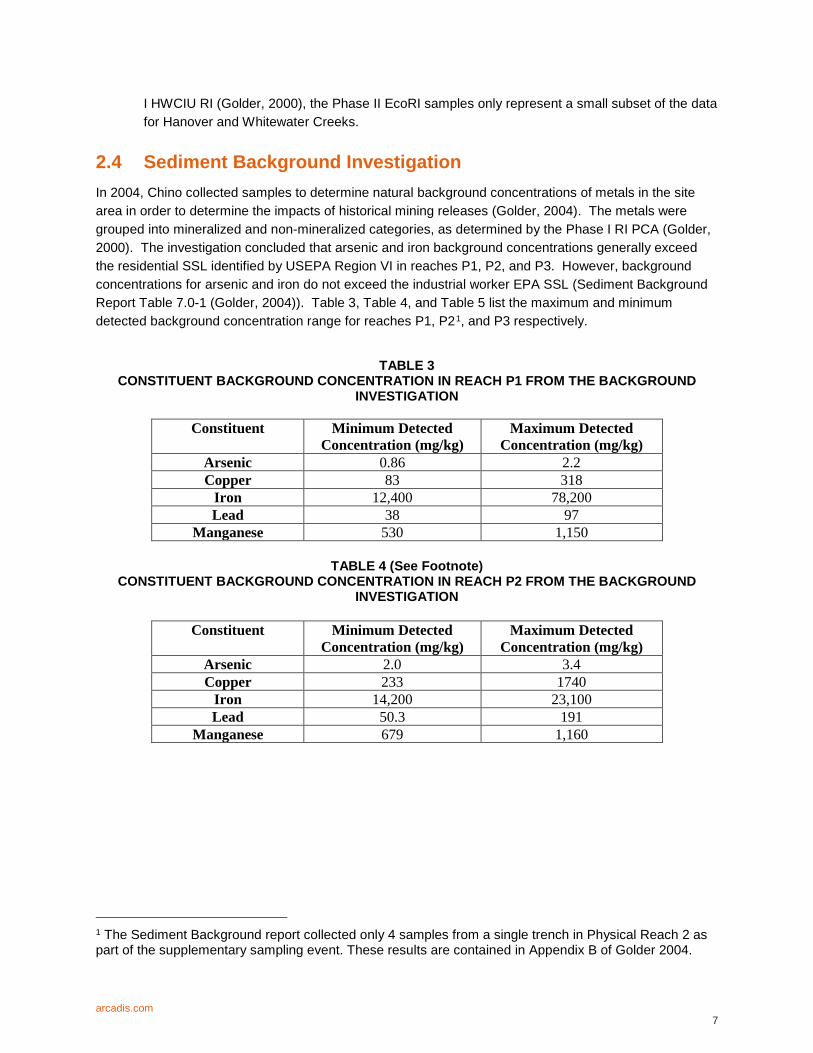
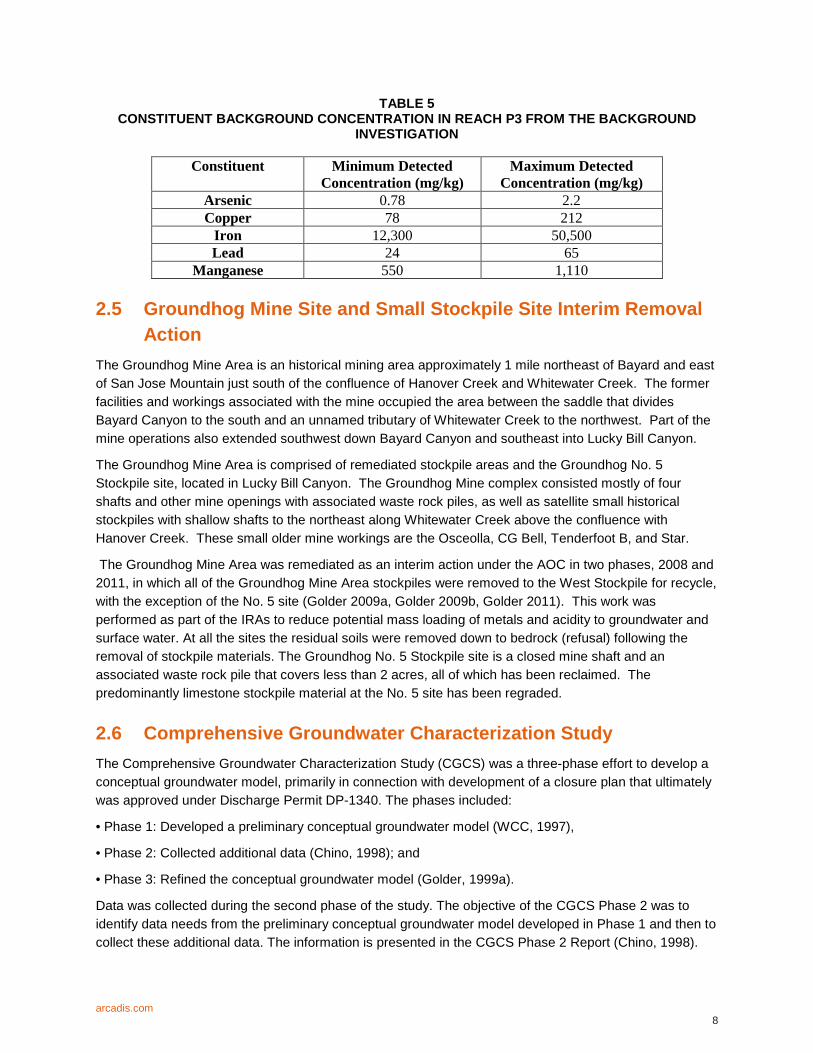
2.4 Sediment Background Investigation In 2004, Chino collected samples to determine natural background concentrations of metals in the site area in order to determine the impacts of historical mining releases (Golder, 2004). The metals were grouped into mineralized and non-mineralized categories, as determined by the Phase I RI PCA (Golder, 2000). The investigation concluded that arsenic and iron background concentrations generally exceed the residential SSL identified by USEPA Region VI in reaches P1, P2, and P3. However, background concentrations for arsenic and iron do not exceed the industrial worker EPA SSL (Sediment Background Report Table 7.0-1 (Golder, 2004)). Table 3, Table 4, and Table 5 list the maximum and minimum detected background concentration range for reaches P1, P21, and P3 respectively.
TABLE 3
CONSTITUENT BACKGROUND CONCENTRATION IN REACH P1 FROM THE BACKGROUND INVESTIGATION
Constituent Minimum Detected
Concentration (mg/kg) Maximum Detected
Concentration (mg/kg) Arsenic 0.86 2.2 Copper 83 318
Iron 12,400 78,200 Lead 38 97
Manganese 530 1,150
TABLE 4 (See Footnote) CONSTITUENT BACKGROUND CONCENTRATION IN REACH P2 FROM THE BACKGROUND
INVESTIGATION
Constituent Minimum Detected Concentration (mg/kg)
Maximum Detected Concentration (mg/kg)
Arsenic 2.0 3.4 Copper 233 1740
Iron 14,200 23,100 Lead 50.3 191
Manganese 679 1,160
1 The Sediment Background report collected only 4 samples from a single trench in Physical Reach 2 as part of the supplementary sampling event. These results are contained in Appendix B of Golder 2004.
arcadis.com 8
TABLE 5 CONSTITUENT BACKGROUND CONCENTRATION IN REACH P3 FROM THE BACKGROUND
INVESTIGATION
Constituent Minimum Detected Concentration (mg/kg)
Maximum Detected Concentration (mg/kg)
Arsenic 0.78 2.2 Copper 78 212
Iron 12,300 50,500 Lead 24 65
Manganese 550 1,110
2.5 Groundhog Mine Site and Small Stockpile Site Interim Removal Action
The Groundhog Mine Area is an historical mining area approximately 1 mile northeast of Bayard and east of San Jose Mountain just south of the confluence of Hanover Creek and Whitewater Creek. The former facilities and workings associated with the mine occupied the area between the saddle that divides Bayard Canyon to the south and an unnamed tributary of Whitewater Creek to the northwest. Part of the mine operations also extended southwest down Bayard Canyon and southeast into Lucky Bill Canyon.
The Groundhog Mine Area is comprised of remediated stockpile areas and the Groundhog No. 5 Stockpile site, located in Lucky Bill Canyon. The Groundhog Mine complex consisted mostly of four shafts and other mine openings with associated waste rock piles, as well as satellite small historical stockpiles with shallow shafts to the northeast along Whitewater Creek above the confluence with Hanover Creek. These small older mine workings are the Osceolla, CG Bell, Tenderfoot B, and Star.
The Groundhog Mine Area was remediated as an interim action under the AOC in two phases, 2008 and 2011, in which all of the Groundhog Mine Area stockpiles were removed to the West Stockpile for recycle, with the exception of the No. 5 site (Golder 2009a, Golder 2009b, Golder 2011). This work was performed as part of the IRAs to reduce potential mass loading of metals and acidity to groundwater and surface water. At all the sites the residual soils were removed down to bedrock (refusal) following the removal of stockpile materials. The Groundhog No. 5 Stockpile site is a closed mine shaft and an associated waste rock pile that covers less than 2 acres, all of which has been reclaimed. The predominantly limestone stockpile material at the No. 5 site has been regraded.
2.6 Comprehensive Groundwater Characterization Study The Comprehensive Groundwater Characterization Study (CGCS) was a three-phase effort to develop a conceptual groundwater model, primarily in connection with development of a closure plan that ultimately was approved under Discharge Permit DP-1340. The phases included:
• Phase 1: Developed a preliminary conceptual groundwater model (WCC, 1997),
• Phase 2: Collected additional data (Chino, 1998); and
• Phase 3: Refined the conceptual groundwater model (Golder, 1999a).
Data was collected during the second phase of the study. The objective of the CGCS Phase 2 was to identify data needs from the preliminary conceptual groundwater model developed in Phase 1 and then to collect these additional data. The information is presented in the CGCS Phase 2 Report (Chino, 1998).
arcadis.com 9
Phase 2 CGCS field activities relevant to the HWCIU consisted of: 1) sampling five small stockpiles along the banks of Whitewater Creek upstream of the confluence with Hanover Creek; and 2) installing and sampling five groundwater monitoring wells. Field work was conducted in June and July 1998. The five stockpiles sampled within the HWCIU were:
• Osceolla
• CG Bell
• Tenderfoot A (recently relocated to the Chino West Stockpile)
• Tenderfoot B
• Star Rock
One composite sample was collected from each of the Osceolla, CG Bell, Tenderfoot A, and Tenderfoot B stockpiles. Because of its larger size, four samples were collected from the Star Rock stockpile. All samples were analyzed for total metals. The list of constituents includes all the trace metals and major ions specified for the HWCIU plus chloride, fluoride, and sulfate.
Five groundwater monitoring wells were installed within the HWCIU:
• CGCS-1D and 1S (i.e., deep and shallow nested wells at the same location)
• CGCS-2
• CGCS-3
• CGCS-11
One sample was collected from each monitoring well and analyzed for dissolved constituents. The list of constituents includes all the trace metals and major ions specified for the HWCIUs plus pH, carbonate, bicarbonate, TDS, chloride, fluoride, nitrate, and sulfate. Field parameters (i.e., pH, electrical conductivity, and temperature) were measured at the time of sampling.
Groundwater from monitoring wells CGCS-1D and CGCS-1S did not exceed New Mexico Water Quality Control Commission (NMWQCC) standards (NMWQCC, 1996). Groundwater from monitoring wells CGCS-2 and CGCS-11 exceeded NMWQCC standards for TDS and sulfate. Groundwater from monitoring well CGCS-3 exceeded NMWQCC standards for pH, TDS, sulfate, Al, Cd, Co, Mn, Pb, and Zn. These data were used to refine the CGCS conceptual groundwater model during Phase 3. As discussed above, the primary purpose of this study was to assist in the development of source control and closure measures for purposes of Chino’s various discharge permits. Considerable uncertainty may be introduced if these data are used in a human health risk assessment because they may not be representative of regional groundwater that may be used for drinking or irrigation, may not be located at current or future exposure points, and represent filtered groundwater rather than unfiltered groundwater.
The conceptual groundwater model developed during Phase 1 and refined during Phase 2 is summarized for the area of Exposure Reach 1. Hydrogeology, recharge and discharge, and groundwater quality as discussed. A more detailed description of the conceptual model is presented in the CGCS Phase 3 Report (Golder, 1999).
2.7 Tin Can Operations (TCO) – Interim Removal Action A completion report for the 1999 TCO Interim Removal Action was provided in Appendix K in the Phase 1 HWCIU RI (Golder, 2000). TCOs were small-scale precipitation plants operated by private individuals to
arcadis.com 10
produce copper concentrate by exchange of iron from scrap metal and tin cans for copper in low-flow releases in Whitewater Creek. The low-flow releases primarily originated from the former precipitation plant for Chino, but may also have included fluids from shaft dewatering and stockpile seepage from a variety of Chino and non-Chino sources. The remnants of 24 TCOs were identified along Whitewater Creek from the precipitation plant to Lake One, a distance of approximately 7 miles, although flooding over time may have washed out more (Phase 1 RI Appendix K and Plates 1, 2, and 3, Golder, 2000). TCOs probably operated from the 1960s, when the Chino precipitation plant reportedly began operations, to the late 1970s or early 1980s, when improved operational practices eliminated the low-flow releases. The Chino precipitation plant was decommissioned in 1998.
Selected TCOs were sampled as part of the AOC Background Report (Chino, 1995). Results indicated high concentrations of some constituents. Based on these results, Chino voluntarily pursued an interim remedial action.
Chino began voluntary removal of the TCOs in September 1999 and completed the project in February 2000. The TCOs and associated sediments or soils were removed down to the level of the adjacent active channel, or refusal (e.g., bedrock), whichever came first. The lateral extent for removal was based on visual characteristics of the TCO sediment, which was typically stained red compared to surrounding soils. Twenty-three of the 24 identified TCOs were remediated during the voluntary removal (Phase 1 RI Appendix K Table 4.0-1, Golder, 2000).
2.8 Human Health and Ecological Risk
2.8.1 Human Health NMED issued a Technical Memorandum: Risk-Based Analysis of Phase I Data for the Hanover/Whitewater Investigation Unit in June 2004 (Neptune, 2004). A finalized human health risk assessment was prepared by NMED and provided to Chino in 2008. The conclusions from the human health risk assessment are as follows:
• Contaminants of concern include arsenic, cadmium, chromium, copper, iron, lead, manganese and zinc.
• Risk estimates were calculated for the recreational, trespasser and off-site residential scenario but not for an on-site resident (because there was deemed a lack of overbank samples to estimate exposure point concentrations).
• Cancer risk estimates for the off-site residential, trespasser, and recreational scenarios were generally near or below 1x10⁻⁶ for the central tendency estimate (CTE) and between 2x10⁻⁵ and 5x10⁻⁵ using reasonable maximum exposure (RME) assumptions. Cancer risks were wholly related to arsenic and, for the off-site residential and recreational scenarios, predominantly associated with ingestion of foodstuffs.
• Hazard quotient estimates were generally below 1.0 for the CTE assumptions. Using RME assumptions, hazard quotients for copper, iron and zinc exceeded 1.0 in the adult recreational/ranching scenario in parts of Exposure Reach 1 and, for copper and iron, in lower Whitewater Creek. In the off-site residential scenario, hazard quotients exceeded 1.0 only for the child receptor in P1 and P3. However, hazard quotients associated with background metals concentrations in soil also approach or exceed 1.0 for iron and zinc in the off-site residential and recreational/ranching scenarios in Exposure Reach 1. As with cancer risk, exposure related to potentially unacceptable hazard were largely driven by foodstuff ingestion.
arcadis.com 11
• The EPA’s Integrated Exposure Uptake Biokinetic Model (IEUBK) was used to conduct an assessment of the potential consequences of lead exposure for those scenarios for which exposure point concentrations were calculated. A threshold of a 5% probability of exceeding a blood lead level of 10 ug/dL was used to determine whether potential blood lead levels were of potential concern. This threshold was generally exceeded under both CTE and RME conditions for the off-site residential scenario in Exposure Reach 1. In Exposure Reach 3, the criterion was exceeded only under RME conditions, but lead concentrations in this area may be largely consistent with background levels. The blood lead criterion was not exceeded for the recreational/ranching scenario. Exposures were largely driven by foodstuffs.
2.8.2 Ecological Risk NMED issued a Revised Ecological Risk Assessment (ERA) in April 2015. The revised ecological risk conclusions are as follows:
• Cadmium, copper, lead and zinc in the vegetative overbanks were the focus of the ERA. • Elevated concentrations of lead and zinc appear related to sources in Hanover Creek reach
extending from the confluence with Whitewater Creek upstream and the Groundhog Mine area. There are only two individual sample locations that exceed the lowest observed effects level for avian receptors.
• Copper is the primary source of risk in areas downstream of Bayard on Whitewater Creek. There are areas of elevated copper with depressed pH downstream to Lake One. Negotiated avian copper criteria from the Smelter Tailings Soils IU were used to evaluate copper risk. There were no exceedances of the remedial action criteria for copper in the HWCIU when evaluated using STSIU methodology.
• Cadmium, copper and zinc were identified as potential risk drivers to aquatic receptors along HWCIU. The Revised ERA concluded that aquatic habitat in these areas is highly limited to ephemeral flows in some sections and the presence of rainfall pools in others and, without persistent aquatic habitat, aquatic life is limited to invertebrate species that breed in water, and potentially breeding and larval amphibians.
2.9 2006 Sediment Sampling
Sediment sampling activities were completed in 2006 to refine the nature and extent of metals concentrations in sediment and to calibrate X-ray fluorescence (XRF) for field screening for incorporation into the proposed BBL 2006 IRA Workplan. In order to get expedite results, XRF technology was used to screen sediment samples for the purposes of high concentration removal delineation. The XRF sampling was performed to delineate constituents of interests (COIs) within the distinct geomorphic units. Initial samples were selected based on previous sampling data. Initial XRF locations were placed by geomorphic unit such that the data collected would bound previous investigation detections. Eight metals identified as COIs based on NMED’s Phase 1 Baseline Human Health Risk Assessment (Neptune 2006) were arsenic, cadmium, chromium, copper, iron, lead, manganese, and zinc. For this study, five COIs (arsenic, copper, iron, lead, and manganese) were selected by Chino. Since cadmium, chromium, and zinc generally co-occur with that of iron and lead, they were not selected for this study. In early 2006, 132 sediment samples from 125 locations in Hanover Creek and 359 sediment samples from 333 locations in Whitewater Creek were collected. See BBL 2006 IRA Workplan Figures 2, 3, and 4 for locations. Thirty of these locations were sampled at two depth intervals (0 to 0.5 foot and 1.5 to 2 feet), and the remaining
arcadis.com 12
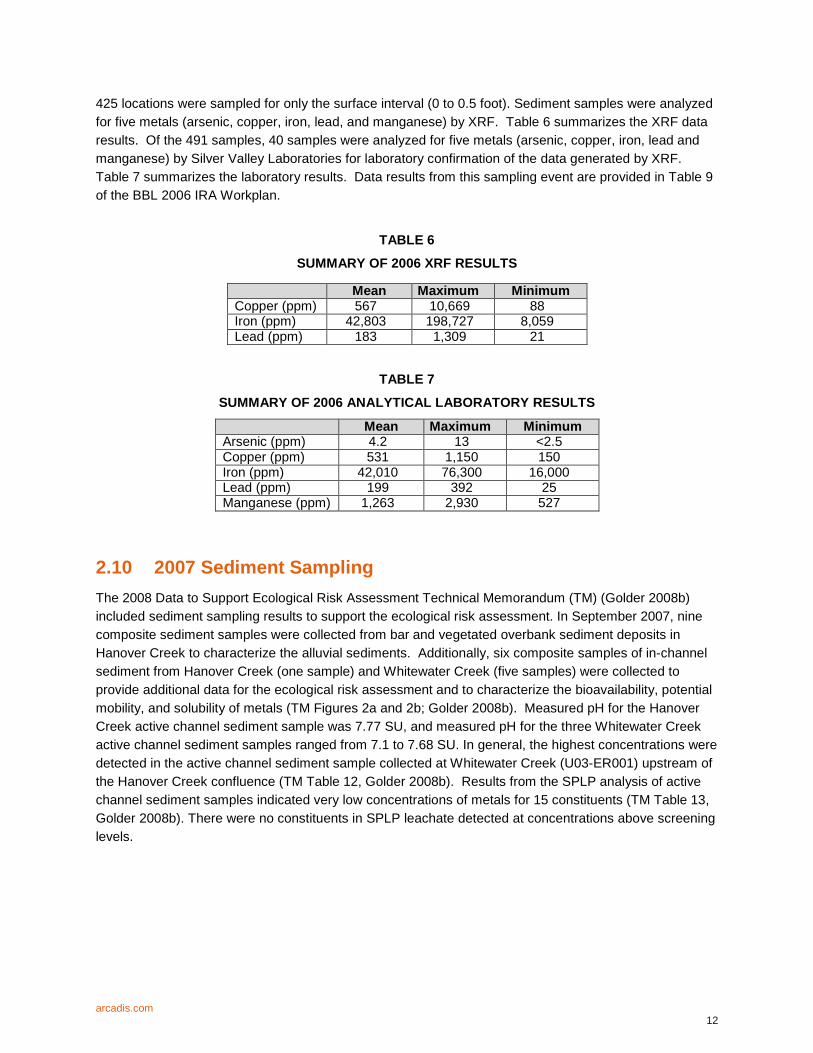
425 locations were sampled for only the surface interval (0 to 0.5 foot). Sediment samples were analyzed for five metals (arsenic, copper, iron, lead, and manganese) by XRF. Table 6 summarizes the XRF data results. Of the 491 samples, 40 samples were analyzed for five metals (arsenic, copper, iron, lead and manganese) by Silver Valley Laboratories for laboratory confirmation of the data generated by XRF. Table 7 summarizes the laboratory results. Data results from this sampling event are provided in Table 9 of the BBL 2006 IRA Workplan.
TABLE 6
SUMMARY OF 2006 XRF RESULTS
Mean Maximum Minimum Copper (ppm) 567 10,669 88 Iron (ppm) 42,803 198,727 8,059 Lead (ppm) 183 1,309 21
TABLE 7
SUMMARY OF 2006 ANALYTICAL LABORATORY RESULTS
Mean Maximum Minimum Arsenic (ppm) 4.2 13 <2.5
Copper (ppm) 531 1,150 150 Iron (ppm) 42,010 76,300 16,000 Lead (ppm) 199 392 25 Manganese (ppm) 1,263 2,930 527
2.10 2007 Sediment Sampling The 2008 Data to Support Ecological Risk Assessment Technical Memorandum (TM) (Golder 2008b) included sediment sampling results to support the ecological risk assessment. In September 2007, nine composite sediment samples were collected from bar and vegetated overbank sediment deposits in Hanover Creek to characterize the alluvial sediments. Additionally, six composite samples of in-channel sediment from Hanover Creek (one sample) and Whitewater Creek (five samples) were collected to provide additional data for the ecological risk assessment and to characterize the bioavailability, potential mobility, and solubility of metals (TM Figures 2a and 2b; Golder 2008b). Measured pH for the Hanover Creek active channel sediment sample was 7.77 SU, and measured pH for the three Whitewater Creek active channel sediment samples ranged from 7.1 to 7.68 SU. In general, the highest concentrations were detected in the active channel sediment sample collected at Whitewater Creek (U03-ER001) upstream of the Hanover Creek confluence (TM Table 12, Golder 2008b). Results from the SPLP analysis of active channel sediment samples indicated very low concentrations of metals for 15 constituents (TM Table 13, Golder 2008b). There were no constituents in SPLP leachate detected at concentrations above screening levels.
arcadis.com 13
3 REMOVAL ACTION
3.1 Project Objectives The purpose of the proposed interim removal action (IRA) is:
• To reduce the mass of Contaminants of Potential Concern (COPCs) in soil and sediment within the active channel, bar and overbank deposits of HWCIU which could be an ongoing source of exposure to nearby residents or ecological receptors; and
• To improve channel flow conditions by removing hardened physical obstructions left by TCOs.
Project objectives will be achieved by removing soil and sediment within or adjacent to HWC that is either visually-impacted, obviously stained, or otherwise contributing to the mass of COPCs within HWC system as identified in the RI. Post-excavation soil and sediment sampling will be conducted where material has been removed and confirmation sampling will be conducted at historic sample locations that are not removed to document current conditions.
Eight metals were identified as COPCs based on NMED’s Human Health Risk Assessment (Neptune, 2008), NMED’s Revised Ecological Risk Assessment (Formation, 2015), and the STSIU Remedial Action Criteria (RAC) (NMED, 2011): arsenic, cadmium, chromium, copper, iron, lead, manganese and zinc. For this interim removal action, Chino is evaluating and prioritizing areas through historic mapping of higher concentration areas and visual evaluation. Confirmation samples collected in removal areas and any newly collected sample data will be reviewed for the identification of data gaps which may result in additional data collection in order to provide a more current data set with which to inform a residual risk assessment. Data gap analysis will be included as part of the IRA Completion Report.
3.2 August 2017 Visual Inspection Between August 21 and 23, 2017, Arcadis, NMED, and Chino performed a visual inspection of HWC to document existing conditions and reevaluate areas with historical exceedances of site COPCs. The 2017 visual inspection was intended to confirm and revise impacted areas identified in the 2006 BBL IRA Workplan. The visual inspection consisted of identifying of impacted areas, describing impacts, measuring approximate dimensions, taking photographs, and collecting limited samples for x-ray fluorescence (XRF) testing. Visual impacts were identified based on one or more of the following characteristics:
• Presence of ferricrete (the visually-obtrusive nature of the material is a driver for removal, relative to community acceptance and public perception),
• Lack of vegetation, which may indicate COPC mass,
• Discoloration or staining, which may be indicative of deposition of COPCs,
• Evaluation and verification of historic transects that were evaluated in 2006 to represent typical cross sections for different creek properties such as bedrock, rail, split channel, and weir. Transects are shown as red lines on Figures 3 through 7, BBL 2006 IRA Workplan,
• Rock piles,
• Evidence of a former tin can operation.
arcadis.com 14
The visual inspection confirmed 19 impacted areas that were identified during previous investigations, and identified 87 impacted areas not previously mapped (Figures 2a and 2b). Individual impacted areas ranged in size from approximately 65 to 90,000 square feet. Impacts were characterized based on their location, as follows:
• Active Channel: Low-lying portions of the HWC that convey water during normal flow conditions.
• Bar: Accumulated materials within the active channel that have deposited during historical fluctuation of flow conditions.
• Overbank: Soil and/or sediment located adjacent to the active channel that may flood during high streamflow events.
In addition to visual impacts, areas where historical data indicated elevated site COPCs were also identified and prioritized, giving higher weighting to data points that overlap with a visual impact as identified above (Table 8). Targeted XRF sampling was conducted during the 2017 Field Assessment to help evaluate changes in the surface sediments within HWC and to confirm natural attenuation (Table 9). The natural attenuation locations sampled in the 2017 XRF evaluation are shown on Figures 3 through 8.
3.3 Removal Area Prioritization Following completion of the visual inspection of HWC, impacted areas were evaluated and prioritized for removal. Prioritization was performed by grouping visual impacts into 12 removal groups based on expected mass removal and relative proximity (Table 8). Removal groups were then ranked based on overall benefit for effort as well as accounting for overall size, accessibility, and HWC geomorphology and hydraulics. Individual impacted areas were also sorted within each removal group based on the same criteria. Table 8 summarizes removal groups and impacted area characteristics.
Impacted areas were evaluated for removal based on the following criteria:
• Size greater than 0.1 acre. Impacts smaller than 0.1 acre are considered to have lesser impact to the mass flux of COPCs in the HWC system. Smaller impacted areas will likely naturally attenuate over time and were not identified for removal.
• Reasonable access for locations with limited COPC information. The majority of impacted areas are relatively easy to access with standard construction equipment. Only four impacted areas greater than 0.1 acre are considered to have difficult accessibility.
• Low to moderate streamflow hydraulics. Impacted areas located within portions of the creek that do not experience high hydrodynamic forces were identified for removal. Based on the hydrodynamic conditions, surficial locations with high streamflow hydraulics will likely naturally recovery over time.
The 43 identified removal areas are listed in Table 8 and shown on Figures 3 through 8. Historic HWC sampling locations are shown in the Phase 1 HWCIU RI Plates 1 through 6 (Golder, 2000) and BBL 2006 IRA Workplan Figures B1, B2, and B3. The proposed interim action will remove approximately 24 acres of soil, sediment, and ferricrete within or adjacent to HWC.
3.4 Removal Methodology This interim removal action addresses bars, overbanks, TCOs, and active channel ferricrete, excluding active channel sediments which will be addressed under Site-Wide Abatement (DP-1340). Figures 3 through 8 include the proposed excavation areas.
arcadis.com 15
Based on mineralogy described in the Phase I RI Report (Golder, 2000), the metal COPCs in this IU are resistant to weathering and dissolution. Additionally, limited stratification of metals within the subsurface is observed. The primary mechanism for transport and subsequent exposure would be through scour of the creek bed causing erosion of impacted sediments. Therefore, the interim removal action will excavate sediment to a depth determined based on the required backfill depth from the hydrologic modelling for the 100-year/24-hour storm event (USACE, 2001; USACE, 2002; USGS, 2000; and Chang, Howard H. 1988), backfill with rock, and provide appropriate sediment and erosion control measures for reaches P2 and P3. Sediment and erosion control measures, taking into consideration the scour properties of the existing channel, will address potential risks associated with impacts that may be left in place following implementation of this interim action. Erosion control measures may include selection of a well-graded distribution of hard armour (e.g., rip-rap) for the bars and some portions of the overbanks, and will be documented in the Completion Report. The removal areas are not continuous; therefore, the removal action will be focused areas of visual impact and/or elevated historic sample COPC concentrations. Table 8 summarizes the extents and minimum removal depths for visually impacted areas recommended for removal. Friable ferricrete within the active channel will be excavated to underlying sediment, or until competent ferricrete is encountered. Friable ferricrete within the overbank will be excavated to the maximum depth of 2 feet.
During construction, areas where bedrock is encountered shallower than the target removal depth will be documented in the field, and the excavation will be considered complete at that depth. Actual removal extents may vary based on the presence of bedrock or confirmatory XRF sampling.
3.4.1 Site Preparation, Implementation and Restoration As stated above, it is anticipated that targeted soil and sediment removal will be conducted based on the results of field assessments of geomorphology and topography; however, the removal will follow the methodology outlined in this section. Sequence of excavation will be determined by the contractor to minimize costs and increase efficiency. Excavated sediments will be direct-loaded and hauled to and placed on the West Stockpile, east of the drainage divide in compliance with Chino Discharge Permit 526 (DP-526). If site conditions prevent direct material loading, stockpiles will be placed over lined storage areas and covered to reduce wind erosion of excavated material. Temporary, lined sediment staging areas will be placed on the uplands, owned and maintained by Chino, adjacent to the creek at locations determined necessary by the contractor. These areas will allow for continuous excavation while the trucks deliver the excavated sediments to the West Stockpile. Each temporary staging area will be sized proportionally to the amount of sediment and soil to be handled in that area. Final decisions on temporary staging areas (necessity and location) will be made by the contractor in cooperation with Chino and the Resident Project Representative (RPR).
The remedial action described in this IRAWP involves excavation of select sediment and soil from the active channel, bars, and overbanks. Removal activities will target areas with existing visual impacts based on the criteria established in Section 2. Table 8 summarizes the extents and minimum removal depths for visually impacted areas recommended for removal. Figures 3 through 8 show the locations and approximate dimensions of removal areas. Removal will be accomplished with heavy equipment operating in or adjacent to HWC.
Friable ferricrete within the active channel will be excavated to underlying sediment, or until competent ferricrete is encountered. Friable ferricrete within the overbank will be excavated to the minimum depth, as discussed below, or until competent ferricrete is encountered.
arcadis.com 16
Minimum removal depths were developed for removal areas based on the following considerations:
• Classification of area (e.g. active channel, bars, and overbanks)
• Type of impact (e.g., former tin can operation, ferricrete, lack of vegetation, staining, historical metals exceedance)
• Location Hydrodynamics and backfill requirements
During construction, areas where bedrock is encountered shallower than the target removal depth will be documented in the field, and the excavation will be considered complete at that depth. Actual removal depths may vary based on the presence of bedrock or post-excavation XRF scanning. After the Contractor excavates to the removal limits, the field engineer will collect sidewall samples for XRF scanning. One sidewall sample will be collected per 250 linear feet of sidewall, or a minimum of 4 samples, whichever is greater. The field engineer may direct the Contractor to perform additional excavation based on additional visual impacts within the excavation or the XRF data to the extent that the additional removal is reasonable and practicable. In situation where a given removal area significantly exceeds the expected extraction volume, the field engineer may limit the excavation and perform additional characterization to include in the data gap analysis. This process will continue until the field engineer indicates the excavation limits are considered complete.
Upon completion of the excavations, the field engineer will collect final post-excavation soil samples. Five percent (1 in 20) of samples collected for XRF screening will be submitted for laboratory confirmation. Laboratory samples will be submitted under chain-of-custody to ACZ Laboratory for the following analysis:
• Arsenic via United States Environmental Protection Agency (USEPA) method 6020
• Cadmium via USEPA method 6010
• Chromium via USEPA method 6010
• Copper via USEPA method 6010
• Iron via USEPA method 6010
• Lead via USEPA method 6020
• Manganese via USEPA method 6010
• Zinc via USEPA method 6010
• pH via USEPA method 9045C
Sample results will be used to document post-removal conditions.
Hard armor will be imported and placed in the excavation areas. Prior to material placement, samples will be collected from the armor and analyzed for TAL metals by an offsite laboratory. Analytical methods will be documented in the Completion Report.
Hydraulic calculations will be performed to select the appropriate scour protection rock sizing and documented in the Completion Report (USACE. 1994). Scour depth calculations would be performed based on rainy season flow characteristics within the reaches.
Final use and restoration of the excavated areas is described in more detail in Section 3.5 below. However, as discussed above, the interim action addresses point bars, overbank, TCO and isolated
arcadis.com 17
ferricrete and does not address active channel; therefore, full-scale stream restoration is not appropriate at this time.
3.4.2 Best Management Practices Best Management Practices (BMPs) include those measures taken to limit sedimentation and erosion within the work areas, as well as measures taken to reduce dust emissions to both site workers and nearby residents. BMPs selected for this project are described in the following sections.
3.4.2.1 Surface Water Management
Since the rainy season at this IU is limited to approximately three summer months, the construction season is assumed to be during the dry months. The rainy season is a limiting factor to successful implementation; however, since the rainy season is short in this arid environment, scheduling should not be problematic.
This hydrologic system can be described as an arid yet flashy system. High intensity short duration storm events can be expected throughout the rainy season. Due to the flashy nature of the system and the soil type present in and around the channels (sand and silt), erosion is significant during rain events. This workplan incorporates sediment and erosion control measures to manage the high intensity storm events. The rock channel protection will be designed to reduce the velocity of the ephemeral stream flow within the channel, keeping within the total flow capacity of the remediated stream channel.
Scheduling will be one of the BMPs utilized to reduce sedimentation and erosion during construction. If implementation occurs within any portion of the rainy season, temporary surface water diversions will be evaluated and designed to maintain low to no flow conditions within the working areas of the reaches.
3.4.2.2 Sediment and Erosion Control
Silt fence will serve as the primary method of upland erosion control. Silt fence will be placed around the excavation area to limit material from moving from the upland areas into the creek during construction. Silt fence will consist of a geotextile material buried a minimum 6 inches below grade. The geotextile will be attached to wooden posts, which will be driven into the ground at a maximum of 8-foot intervals for support.
Additionally, one or more water trucks will be utilized, as necessary during excavation and soil movement activities to reduce wind erosion and dust generation during these activities. Haul areas will be wetted periodically to reduce fugitive dust along the designated haul routes.
Temporary, lined sediment staging areas will be placed on upland areas adjacent to the creek where direct loading of sediments is not feasible. These areas will be used to allow for continuous excavation while the trucks deliver the excavated sediments to the West Stockpile. Each temporary staging area will be sized proportionally to the amount of sediment and soil to be handled in that area and place on areas owned by Chino.
3.4.2.3 Worker and Residential Protection
The “Investigation Area Health and Safety Plan” (HASP) was developed for Chino in January 1997 to address and mitigate potential worker exposure during sampling and other site investigation-related activities (Chino, 1997). Levels of personnel protective equipment and monitoring during activities will be
arcadis.com 18
determined based on the 1997 HASP. A site-specific HASP will be developed by the contractor prior to implementation of this IRAWP.
The following are general requirements for monitoring during field activities.
All parties involved in the HWCIU IRAWP will complete activities in accordance with the 1997 HASP and the site-specific HASP. Chino will assign a project Health &Safety (H&S) Officer for this activity, responsible for oversight of the H&S program.
The relevant issues applicable to property owners and residents will be communicated in a clear and effective manner prior to implementation of this workplan.
• Dust Suppression – The field crews will apply water to excavation, ground, and surfaces during excavation activities to reduce visible dust emissions. Depending on site conditions, the contractor may need to utilize water trucks with hoses to apply water to areas inaccessible to rear-mounted watering devices.
3.5 Post Removal Confirmation Sampling At completion of a removal area, XRF samples will be collected from the sidewalls and bottom of the excavation. One sidewall sample will be collected per 250 linear feet of sidewall, or a minimum of 4 samples, whichever is greater. One bottom sample will be collected for every 1/4 acre of excavation, or a minimum of one per area. The XRF data will be used to document post-removal conditions and will be reported in the Completion Report.
One sample in every 20 XRF samples (5%) will be collected as a field quality assurance (QA) sample and sent to ACZ Laboratory for the following analysis:
• Arsenic – EPA 6020 • Cadmium – EPA 6010 • Chromium – EPA 6010 • Copper – EPA 6010 • Iron – EPA 6010 • Lead – EPA 6020 • Manganese – EPA 6010 • Zinc – EPA 6010 • pH – EPA 9045C
The laboratory results will be used to develop a correlation factor for field sampled XRF results. EPA method 6200 presents a method for determining the quality of in situ testing obtained by XRF. This method for determining quality of in situ testing also applies to intrusive testing with minimal sample preparation. The method is summarized below:
• Plot the XRF data on the y-axis and the laboratory data on the x-axis for the selected QA/QC samples.
• Determine the linear relationship of the data (y=mx).
• Specify the correction factor (m) for the XRF data.
• Determine the correlation factor (R2).
XRF and confirmation laboratory sampling will be conducted in accordance with the policy, functional activities, and quality assurance/quality control (QA/QC) protocols, which are specifically stated in the RI
arcadis.com 19
Quality Assurance Plan (QAP) (Chino, 1997). The QAP defines how site-wide QA/QC activities will be implemented during field sampling events. The objective of the QAP is to ensure that data are of adequate quality for its intended use. SOPs have been developed as part of the QAP and are incorporated by reference in this work plan. SOPs will be included in the Completion Report.
Field Sampling Methods
The following method will be used to collect soil samples for XRF analysis:
1. Equipment that will come in contact with the soil sample should be cleaned according to Field Equipment Cleaning-Decontamination SOP-6.
2. Use a decontaminated spade, spoon, or scoop to collect a sample over the required interval (0 to 2-inches below grade or at the surface of the excavated area).
3. Use a ruler (or other measurement device) to verify that the sample is collected to the correct depth and record the bottom depth from the ground surface.
4. Sample will be sieved and then analyzed by XRF. 5. Backfill sample holes to grade with native material or other suitable material. 6. Decontaminate field equipment before proceeding to the subsequent sample location.
The following general SOPs will be utilized during this field program.
• Field Document Control (SOP-1) – Outlines the numbering scheme for field and laboratory samples. SOP-1 also presents procedures for recording information that is relevant to field operations.
• Field Logbook and Field Sample Data Sheets (SOP-2) – Identifies minimum entries to be included in field logbook or field sample data sheets. Includes procedures for taking photographs and labeling them.
• Field Quality Control (SOP-3) – Describes field QC measures and QC samples, including sample preparation and collection frequency.
• Sample Custody Procedures (SOP-4) – Establishes Chain-of-Custody procedures to be followed during field sample collection and transfer to the laboratory. Included are examples of a sample label, field sample data sheets, and a Chain-of-Custody record.
• Packaging and Shipping of Environmental Sample Containers (SOP-5) – Lists procedures for preparation and shipment of field samples sent to the analytical laboratory. Included is an example of a custody seal to be attached to each shipment.
• Decontamination of Equipment Used to Sample Soil and Water (SOP-6) – Presents the decontamination requirements for non-disposable sampling equipment. Included is a list of recommended equipment to be used for decontamination. Disposable equipment will be used to the extent possible to reduce opportunities for cross-contamination and decrease the level of effort for decontamination. For reusable field equipment, decontamination is required to prevent cross-contamination of samples from different sampling locations.
• Requesting Environmental Laboratory Services (SOP-7) – ACZ Laboratory of Steamboat Springs, Colorado will be contracted by Chino to provide laboratory services for the Interim Removal Action. Provided in this SOP is a form for requesting analyses, including number of samples, proposed schedule and designated contact.
• Sampling, Preservation and Containerization (SOP-14) - This SOP describes the techniques and quality control measures used to sample, prepare, and handle soil and sediment subject to the specified analyses.
arcadis.com 20
• Surface Soil Sampling (SOP-22) – This SOP describes the process and techniques to sample surface soil for analytical analysis.
• X-Ray Fluorescence On-Site Measurement (SOP-23) – This SOP provides insights and applicability of XRF sampling for the AOC. The XRF instrument should be calibrated based on manufactures specifications.
• Sediment, Evaporative, and Precipitate Sampling (SOP-24) - This SOP describes the process and techniques to sample sediment, evaporites, and precipitates for analytical analysis.
3.6 Long-Term Use Following Removal Visual monitoring for erosion will occur after significant storm events during the first year following completion of the remedy. It is assumed that the armor placed during remedy may move as a result of natural hydrodynamics. If detrimental erosion has occurred that reduces the effectiveness of the remedy, additional improvements will be evaluated for effectiveness during the dry season. Otherwise, the remedy is designed to work with the natural stream geomorphology and may infill with sediment, or may shift slightly over time.
Whitewater Creek is a hydraulically dynamic system. Post-removal restoration of the creek relies on the natural sediment transport processes active in the channel to restore the preconstruction geomorphology. The durable backfill is designed to reduce scour against the anticipated flow conditions and will move naturally with the system over time. As part of the natural restoration of the creek, soil and sediment will settle and fill the interstitial spaces of the durable backfill. This natural infilling will provide the substrate to support the revegetation of the creek. Previous site observations have noted rapid growth of vegetation on Whitewater Creek bars and overbanks, and revegetation is expected to occur relatively quickly. Revegetation is not permitted below the ordinary high-water elevation within the creek, as regulated under the Nationwide Permit 38.
3.7 Construction Documentation The Completion Report will be prepared and submitted to NMED following site work. The following information will be documented during field implementation and included in the Completion Report:
• Documentation of construction methods and sequencing, • Documentation of total copper for stockpiled materials, • Interim and Completed grades, • Photo documentation, • Post-excavation and confirmation sample locations and results, • Final volume and extent of excavation.
The Completion Report will be prepared and submitted for NMED review and approval within 90 days of completion of field activities.
3.8 BMP Monitoring Sediment BMP monitoring will be conducted to determine the effectiveness of sediment and erosion controls. Should any of these controls fail and cause substantial adverse loss of backfill, maintenance will be performed. The monitoring program will consist of visual inspection and photographs of the restored areas following any major storm events during the first year. The inspection should be conducted during
arcadis.com 21
a dry period to facilitate access. The inspector(s) will observe whether significant movement of armor stone or reduction in armor stone thickness has occurred. If locations are noted where significant reduction in armor stone thickness has occurred, the actual thickness of the armor stone layer will be measured. Chino will then take appropriate corrective actions to achieve protection.
4 REGULATORY REVIEW Activities associated with the interim removal action described in Section 3 must comply with regulatory and permit requirements governing the HWCIU. These include the National Pollutant Discharge Elimination System (NPDES) Construction General Permit (CGP) (which includes preparation of a Storm Water Pollution Prevention Plan (SWPPP), NMED dust permits, Nationwide Permit 38, and coordination with New Mexico Department of Transportation (NMDOT) and the rail road for excavation in or near their right-of-ways. Also, a temporary permit amendment to Discharge Plan 526 to allow excavated materials to be placed on the West Stockpile has been prepared. General requirements of these permits are described in the following sections.
4.1 NPDES Construction General Permit The NPDES-CGP is required for all construction projects that disturb one or more acres of land and applies to activities such as soil disturbances, clearing, grading, and excavation. Site activities must comply with the SWPPP (NMR050000) and Best Management Plan developed by Chino.
4.2 NMED Dust Permit Chino will apply requirements under NMED Title 5 PO66R2 and New Source Review NSR98M8 permits for the potential dust emissions resulting from the construction in HWCIU and haulage of material to the West Stockpile along Lake One Haul Road.
4.3 Discharge Plan Chino is in the process of filing for a temporary permit modification for the Discharge Plan 526 to allow deposition of excavated materials onto the West Stockpile proposed in this IRAWP.
4.4 Nationwide Permit 38 The Nationwide Permit 38 (cleanup of Hazardous and toxic waste) is a type of general permit designed to authorize certain activities that have minimal individual and cumulative adverse effects on the aquatic environment and generally comply with the related laws cited in 33 CFR 320.3. Nationwide Permit 38 allows for specific activities required to effect the containment, stabilization, or removal of hazardous or toxic waste materials that are performed, ordered, or sponsored by a government agency. Chino submitted a Nationwide Permit 38 for Hanover/Whitewater creek to the U.S. Army Corps of Engineers on December 19, 2017 outlining the potential effects of the interim removal action on Waters of the U.S., Threatened and Endangered Species, and Historic Properties and Cultural Resources (WestLand Resources, 2017). U.S. Army Corps of Engineers issued a Notice of Verification providing the permit to Chino on January 25, 2018.
arcadis.com 22
4.5 Highway and Rail Road Right-of-Way Chino will coordinate working in or near the right-of-way for the highway with the NMDOT and with the rail line operator for access near the existing rail road. Excavation areas may be adjusted following discussions with NMDOT and the rail line operator based on right of way distances and access agreements.
5 PROJECT CLOSEOUT Chino and the contractor aim to complete the interim removal action after the 2018 monsoon season. Within 120 days of completing the removal action, Chino will provide NMED with a Completion Report. The Completion Report will include the XRF and confirmation sample locations and results with data gap analysis, number of removal locations, total volumes associated with those removal locations, approximate total mass removed, final placement of removed material on West Stockpile, and the as-builts for all removal locations. Chino will monitor remedied areas as described in the above Section 3.4.
6 REFERNCES Arcadis. 2001. Administrative Order on Consent Phase II RI Report for the Ecological IU. Revised. August 27, 2001. Prepared for Freeport-McMoRan Chino Mines Company, Vanadium, New Mexico
arcadis.com 23
BBL. 2006. Interim Action Work Plan. Hanover/Whitewater Creek IU. Prepared for Freeport-McMoRan Chino Mines Company, Hurley, New Mexico. December.
Chang, Howard H. 1988. Fluvial Process in River Engineering. Malabar, FL: Krieger.
Chino. 1995. Administrative Order on Consent, Investigation Area, Remedial Investigation Background Report, Chino Mines Company, Prepared by Chino Mines Company, Hurley, New Mexico, October 5.
Chino, 1997. Administrative Order on Consent, Investigation Area Health and Safety Plan, Chino Mines Investigation Area. Prepared by Chino Mines Company. January 1997.
Chino. 1998. Comprehensive Groundwater Characterization Study, Phase 2 Report, Chino Mines Company, Hurley, New Mexico, August.
Chino. 2004. Technical memorandum: Hanover/Whitewater Creek Investigation Unit – Human Health Risk Assessment. Submitted to NMED. April 8, 2004.
Daniel B. Stephens & Associates, Inc. 1995. Reconnaissance Survey of the Drainage Channel Downstream of Dam 15.
Formation Environmental. 2015. Ecological Risk Assessment for the Hanover/Whitewater Creeks Investigation Unit. Prepared for New Mexico Environment Department. April 2015.
Golder Associates (Golder), 1998. An Assessment of Soil in the Chino Mine Proposed Action Area. Prepared for Chino Mines Company. May 1998.
Golder, 2000. Administrative Order on Consent. Phase 1 Remedial Investigation Report. Hanover and Whitewater Creeks Investigation Units. Prepared for Chino Mines Company. May 2000.
Golder, 2004a. Supplemental Technical Memorandum Sediment Background Investigation. Hanover and Whitewater Creeks Investigation Units. Prepared for Chino Mines Company. April 2004.
Golder, 2004b. Administrative Order on Consent. Phase I Remedial Investigation Proposal. Hanover and Whitewater Creeks Investigation Units. Prepared for Chino Mines Company. December 2004.
Golder, 2008. Administrative Order on Consent. Technical Memorandum Data to Support Ecological Risk Assessment. Hanover and Whitewater Creeks Investigation Units. Prepared for Chino Mines Company. April 2008.
Golder. 2009a. Completion report interim remedial action Groundhog Mine Stockpile Hanover and Whitewater Creeks investigation unit. Prepared for Chino Mines Company. June 2009.
Golder. 2009b. Completion report interim remedial action Osceolla, CG Bell, and Tenderfoot B Stockpiles Hanover and Whitewater Creeks investigation unit. Prepared for Chino Mines Company. October 2009.
Golder. 2011. Technical Memorandum RE: Groundhog mine site completion report addendum – Pipeline removal, sampling, and reclamation. August 2011.
Gradient, 2008. Human Health Risk Assessment. Smelter/Tailings Soils Investigation Unit, Hurley, New Mexico, Gradient Corporation (prepared for New Mexico Environment Department), Cambridge, MA.
Neptune and Company, Inc. 2004. Technical Memorandum: Results of Hanover/Whitewater Creek Phae I Risk-Based Analysis, prepared for NMED, Santa Fe, NM by Neptune and Company, Inc. Los Alamos, NM. May.
arcadis.com 24
Neptune and Company, Inc. 2006. Phase 1 Baseline Human Health Risk Assessment. Hanover and Whitewater Creek Investigation Units. prepared for NMED, Santa Fe, NM by Neptune and Company, Inc. Los Alamos, NM. June.
Neptune and Company, Inc. 2008. Human Health Risk Assessment. Hanover and Whitewater Creek Investigation Units. prepared for NMED, Santa Fe, NM by Neptune and Company, Inc. Los Alamos, NM. April.
NewFields. 2008. Ecological Risk Assessment for the Hanover/Whitewater Creeks Investigation Unit. Prepared for New Mexico Environment Department. November 2008.
New Mexico Environment Department (NMED). 2011. Letter to Mr. Ned Hall from Mr. Bill Olsen Regarding Resolution of Information Dispute Resolution. March 3.
New Mexico Water Quality Control Commission (NMWQCC). 1996. New Mexico Water Quality Control Commission Regulations. Santa Fe, NM, December 1.
USGS. 2000. The National Flood-Frequency Program – Methods for Estimating Flood Magnitude and Frequency in Rural Areas in New Mexico. USGS Fact Sheet 055-00.
USACE. 2001. HEC-HMS, Hydrologic Modeling System Technical Reference Manual.
USACE. 2002. HEC-RAS, River Analysis System Hydraulic Reference Manual. Version 3.1. Report Number CPD-69. November.
USACE. 1994. Hydraulic Design of Flood Control Channels EM 1110-2-1601, Department of the Army, Washington, DC, 1994.
Woodward-Clyde Consultants (WCC). 1997. Comprehensive Groundwater Characterization Study, Phase I. Chino Mines, Hurley, New Mexico, April.

TABLES
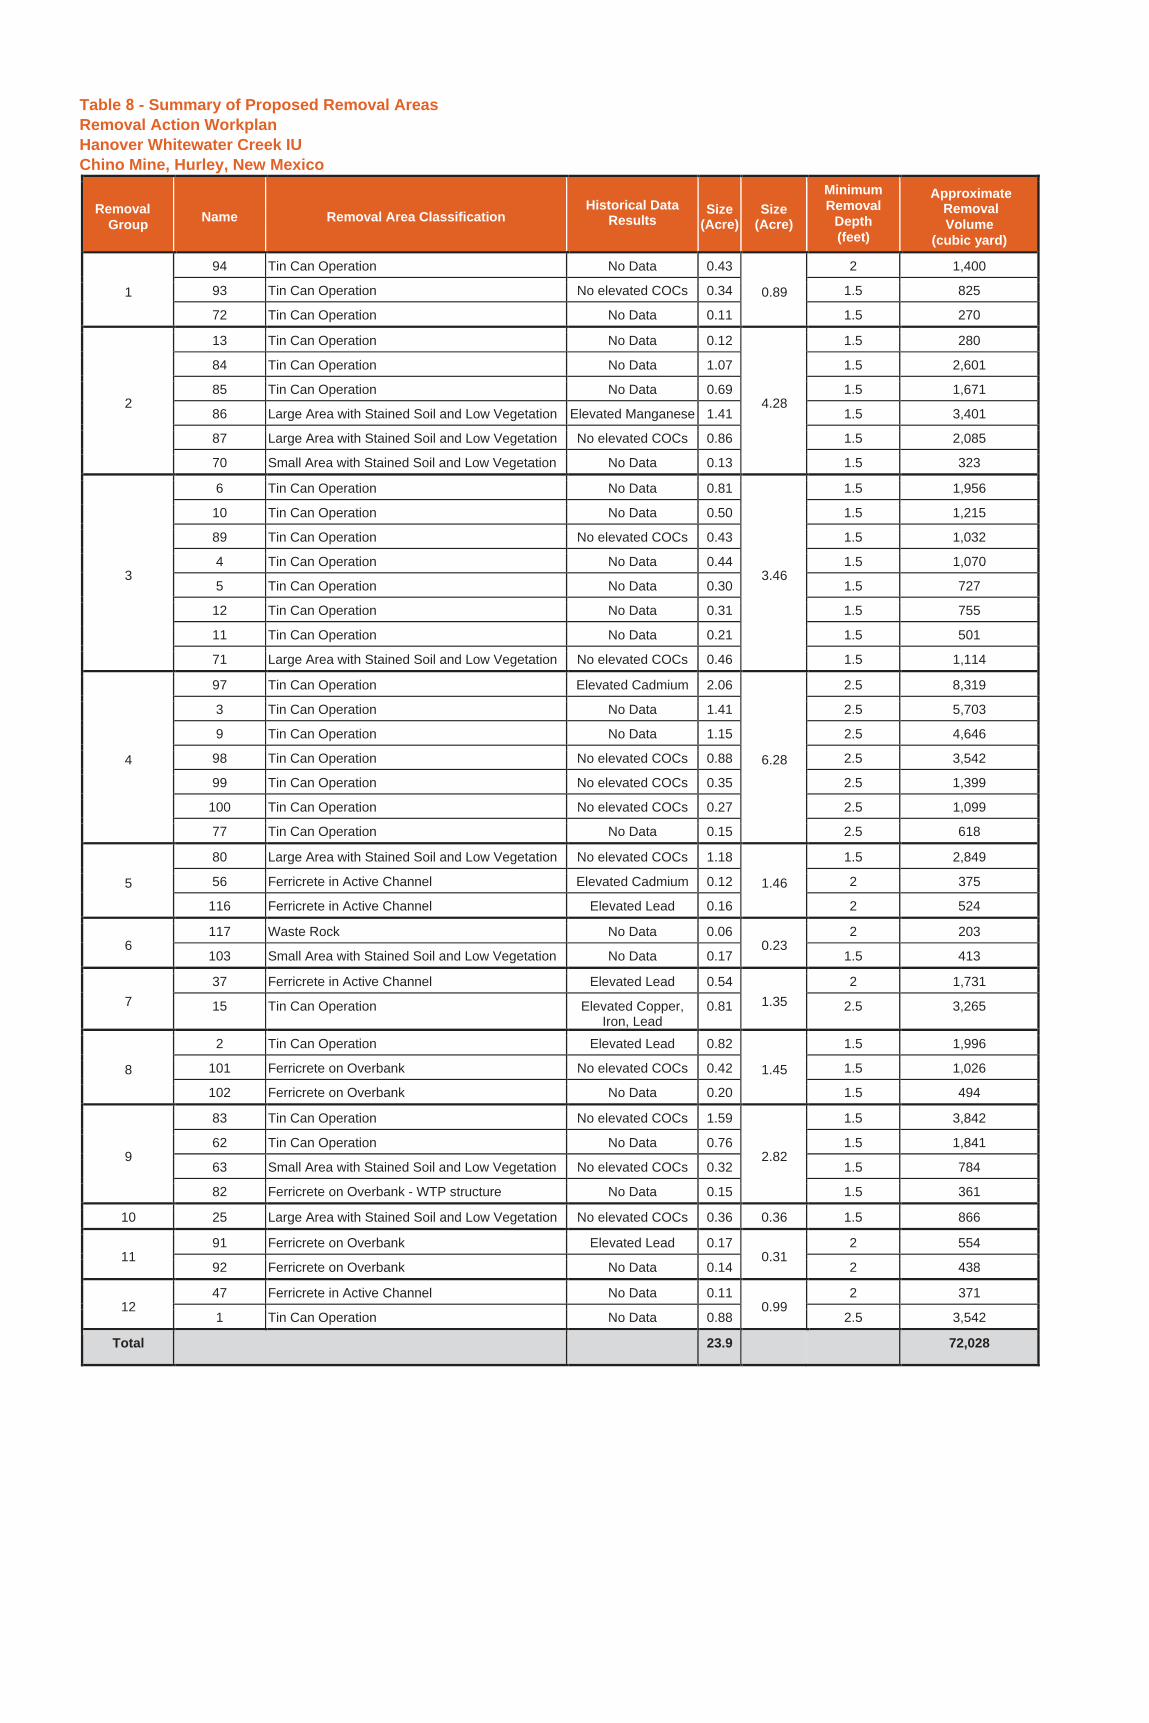
Table 8 - Summary of Proposed Removal Areas Removal Action Workplan Hanover Whitewater Creek IU Chino Mine, Hurley, New Mexico
Removal Group Name Removal Area Classification
Historical Data Results
Size (Acre)
Size (Acre)
Minimum Removal
Depth (feet)
Approximate Removal Volume
(cubic yard)
1
94 Tin Can Operation No Data 0.43 0.89
2 1,400 93 Tin Can Operation No elevated COCs 0.34 1.5 825 72 Tin Can Operation No Data 0.11 1.5 270
2
13 Tin Can Operation No Data 0.12
4.28
1.5 280 84 Tin Can Operation No Data 1.07 1.5 2,601 85 Tin Can Operation No Data 0.69 1.5 1,671 86 Large Area with Stained Soil and Low Vegetation Elevated Manganese 1.41 1.5 3,401 87 Large Area with Stained Soil and Low Vegetation No elevated COCs 0.86 1.5 2,085 70 Small Area with Stained Soil and Low Vegetation No Data 0.13 1.5 323
3
6 Tin Can Operation No Data 0.81
3.46
1.5 1,956 10 Tin Can Operation No Data 0.50 1.5 1,215 89 Tin Can Operation No elevated COCs 0.43 1.5 1,032 4 Tin Can Operation No Data 0.44 1.5 1,070 5 Tin Can Operation No Data 0.30 1.5 727 12 Tin Can Operation No Data 0.31 1.5 755 11 Tin Can Operation No Data 0.21 1.5 501 71 Large Area with Stained Soil and Low Vegetation No elevated COCs 0.46 1.5 1,114
4
97 Tin Can Operation Elevated Cadmium 2.06
6.28
2.5 8,319 3 Tin Can Operation No Data 1.41 2.5 5,703 9 Tin Can Operation No Data 1.15 2.5 4,646 98 Tin Can Operation No elevated COCs 0.88 2.5 3,542 99 Tin Can Operation No elevated COCs 0.35 2.5 1,399
100 Tin Can Operation No elevated COCs 0.27 2.5 1,099 77 Tin Can Operation No Data 0.15 2.5 618
5
80 Large Area with Stained Soil and Low Vegetation No elevated COCs 1.18 1.46
1.5 2,849 56 Ferricrete in Active Channel Elevated Cadmium 0.12 2 375
116 Ferricrete in Active Channel Elevated Lead 0.16 2 524
6117 Waste Rock No Data 0.06
0.232 203
103 Small Area with Stained Soil and Low Vegetation No Data 0.17 1.5 413
737 Ferricrete in Active Channel Elevated Lead 0.54
1.352 1,731
15 Tin Can Operation Elevated Copper, Iron, Lead
0.81 2.5 3,265
8
2 Tin Can Operation Elevated Lead 0.82 1.45
1.5 1,996 101 Ferricrete on Overbank No elevated COCs 0.42 1.5 1,026 102 Ferricrete on Overbank No Data 0.20 1.5 494
9
83 Tin Can Operation No elevated COCs 1.59
2.82
1.5 3,842 62 Tin Can Operation No Data 0.76 1.5 1,841 63 Small Area with Stained Soil and Low Vegetation No elevated COCs 0.32 1.5 784 82 Ferricrete on Overbank - WTP structure No Data 0.15 1.5 361
10 25 Large Area with Stained Soil and Low Vegetation No elevated COCs 0.36 0.36 1.5 866
1191 Ferricrete on Overbank Elevated Lead 0.17
0.312 554
92 Ferricrete on Overbank No Data 0.14 2 438
1247 Ferricrete in Active Channel No Data 0.11
0.992 371
1 Tin Can Operation No Data 0.88 2.5 3,542 Total 23.9 72,028
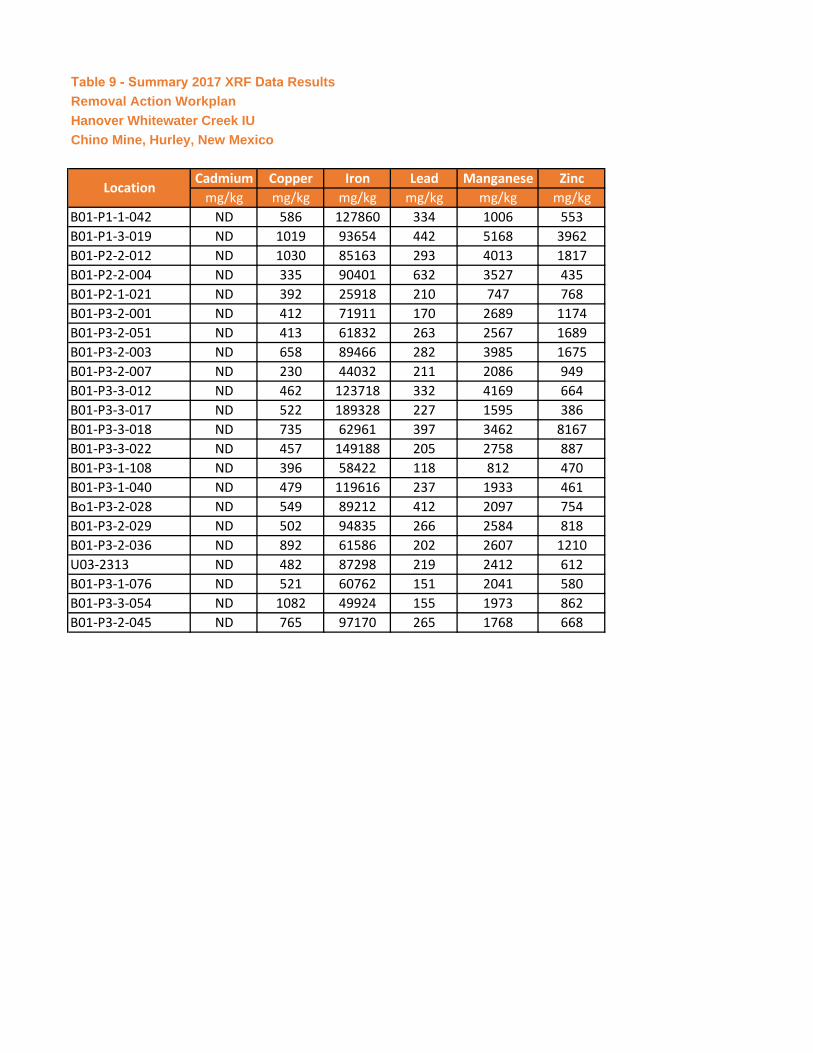
Table 9 - Summary 2017 XRF Data Results Removal Action Workplan Hanover Whitewater Creek IU Chino Mine, Hurley, New Mexico
Cadmium Copper Iron Lead Manganese Zincmg/kg mg/kg mg/kg mg/kg mg/kg mg/kg
B01-P1-1-042 ND 586 127860 334 1006 553B01-P1-3-019 ND 1019 93654 442 5168 3962B01-P2-2-012 ND 1030 85163 293 4013 1817B01-P2-2-004 ND 335 90401 632 3527 435B01-P2-1-021 ND 392 25918 210 747 768B01-P3-2-001 ND 412 71911 170 2689 1174B01-P3-2-051 ND 413 61832 263 2567 1689B01-P3-2-003 ND 658 89466 282 3985 1675B01-P3-2-007 ND 230 44032 211 2086 949B01-P3-3-012 ND 462 123718 332 4169 664B01-P3-3-017 ND 522 189328 227 1595 386B01-P3-3-018 ND 735 62961 397 3462 8167B01-P3-3-022 ND 457 149188 205 2758 887B01-P3-1-108 ND 396 58422 118 812 470B01-P3-1-040 ND 479 119616 237 1933 461Bo1-P3-2-028 ND 549 89212 412 2097 754B01-P3-2-029 ND 502 94835 266 2584 818B01-P3-2-036 ND 892 61586 202 2607 1210U03-2313 ND 482 87298 219 2412 612B01-P3-1-076 ND 521 60762 151 2041 580B01-P3-3-054 ND 1082 49924 155 1973 862B01-P3-2-045 ND 765 97170 265 1768 668
Location

FIGURES
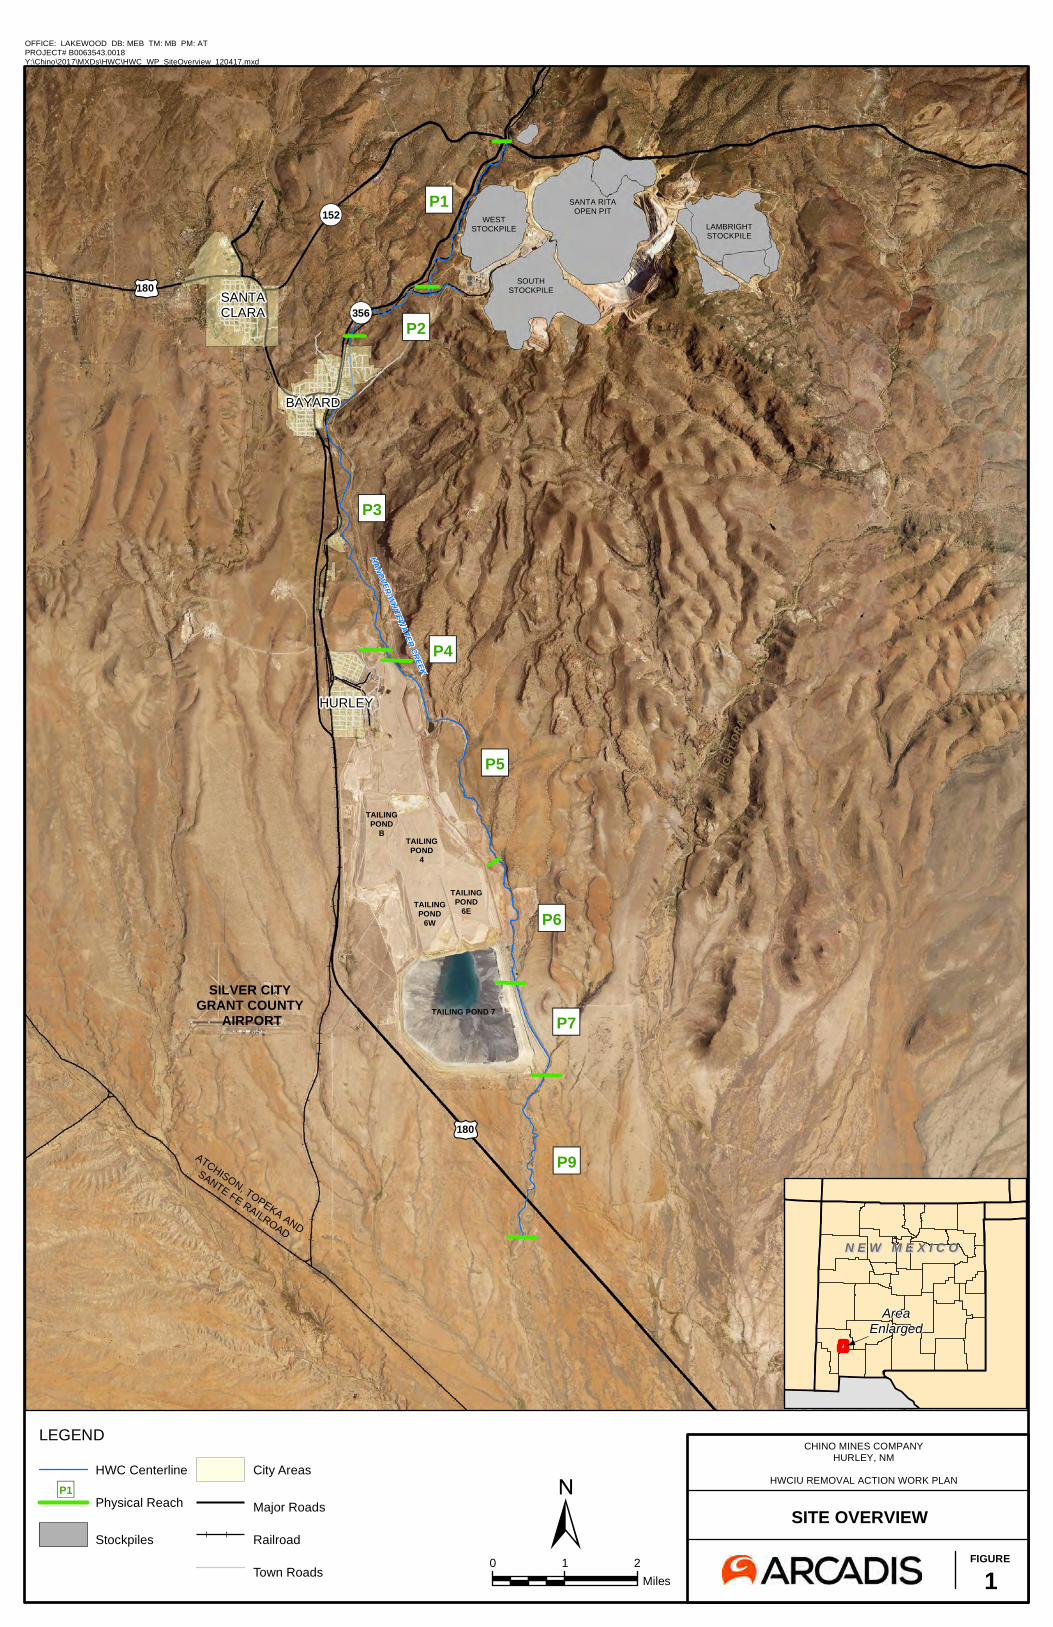
SANTA CLARA
HURLEY
TAILINGPOND
6W
TAILINGPOND
6E
TAILINGPOND
4
TAILINGPOND
B
TAILING POND 7
SOUTHSTOCKPILE
WESTSTOCKPILE
SANTA RITAOPEN PIT
LAMBRIGHTSTOCKPILE
HANOVER-WHITEWATER CREEK
LAMP
BRIG
HT DR
AW
SILVER CITY GRANT COUNTY
AIRPORT
£¤180
ATCHISON, TOPEKA AND
SANTE FE RAILROAD
BAYARD
!(356
!(152
£¤180
OFFICE: LAKEWOOD DB: MEB TM: MB PM: ATPROJECT# B0063543.0018Y:\Chino\2017\MXDs\HWC\HWC_WP_SiteOverview_120417.mxd
0 1 2Miles
SITE OVERVIEWFIGURE
1±
N E W M E X I C ON E W M E X I C O
AreaEnlarged
LEGEND
HWC Centerline
Physical Reach
Stockpiles
City Areas
Major Roads
Railroad
Town Roads
CHINO MINES COMPANYHURLEY, NM
HWCIU REMOVAL ACTION WORK PLAN
")P1
")P2
")P3
")P4
")P5
")P6
")P7
")P9
")P1
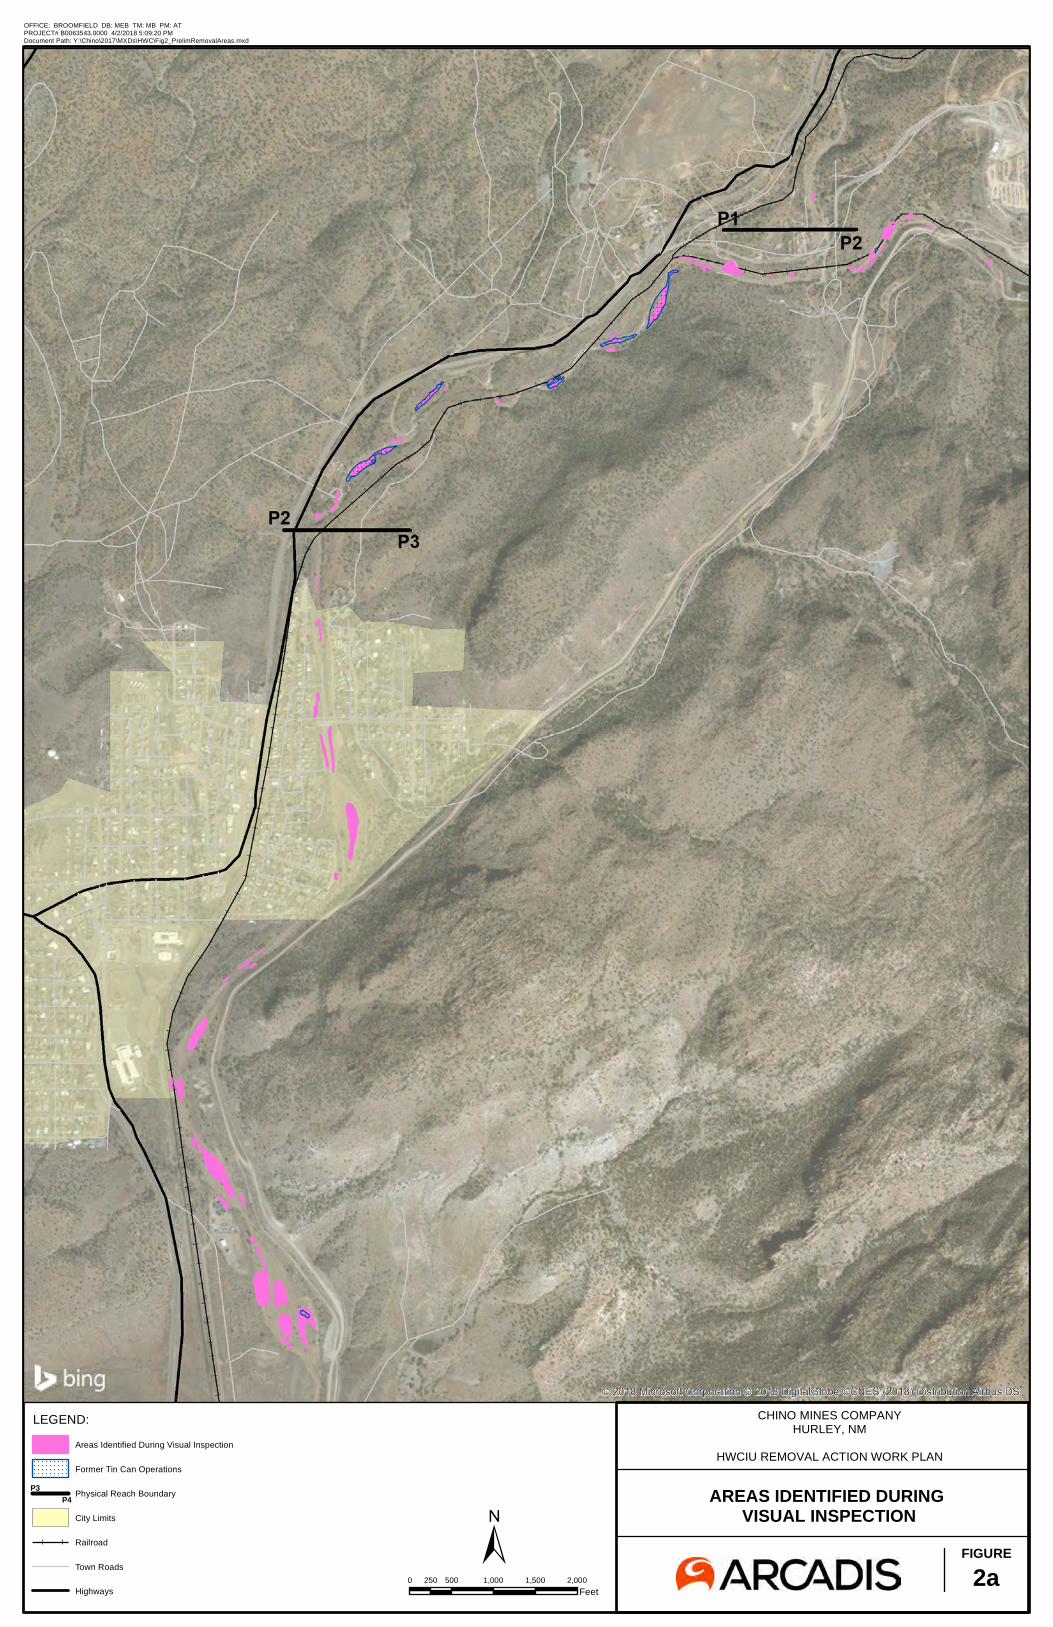
LEGEND:
FIGURE2a±
0 500 1,000 1,500 2,000250Feet
OFFICE: BROOMFIELD DB: MEB TM: MB PM: ATPROJECT# B0063543.0000 4/2/2018 5:09:20 PMDocument Path: Y:\Chino\2017\MXDs\HWC\Fig2_PrelimRemovalAreas.mxd
Areas Identified During Visual Inspection
Former Tin Can Operations
Physical Reach Boundary
City Limits
Railroad
Town Roads
Highways
CHINO MINES COMPANYHURLEY, NM
HWCIU REMOVAL ACTION WORK PLAN
AREAS IDENTIFIED DURING VISUAL INSPECTION
P3P4
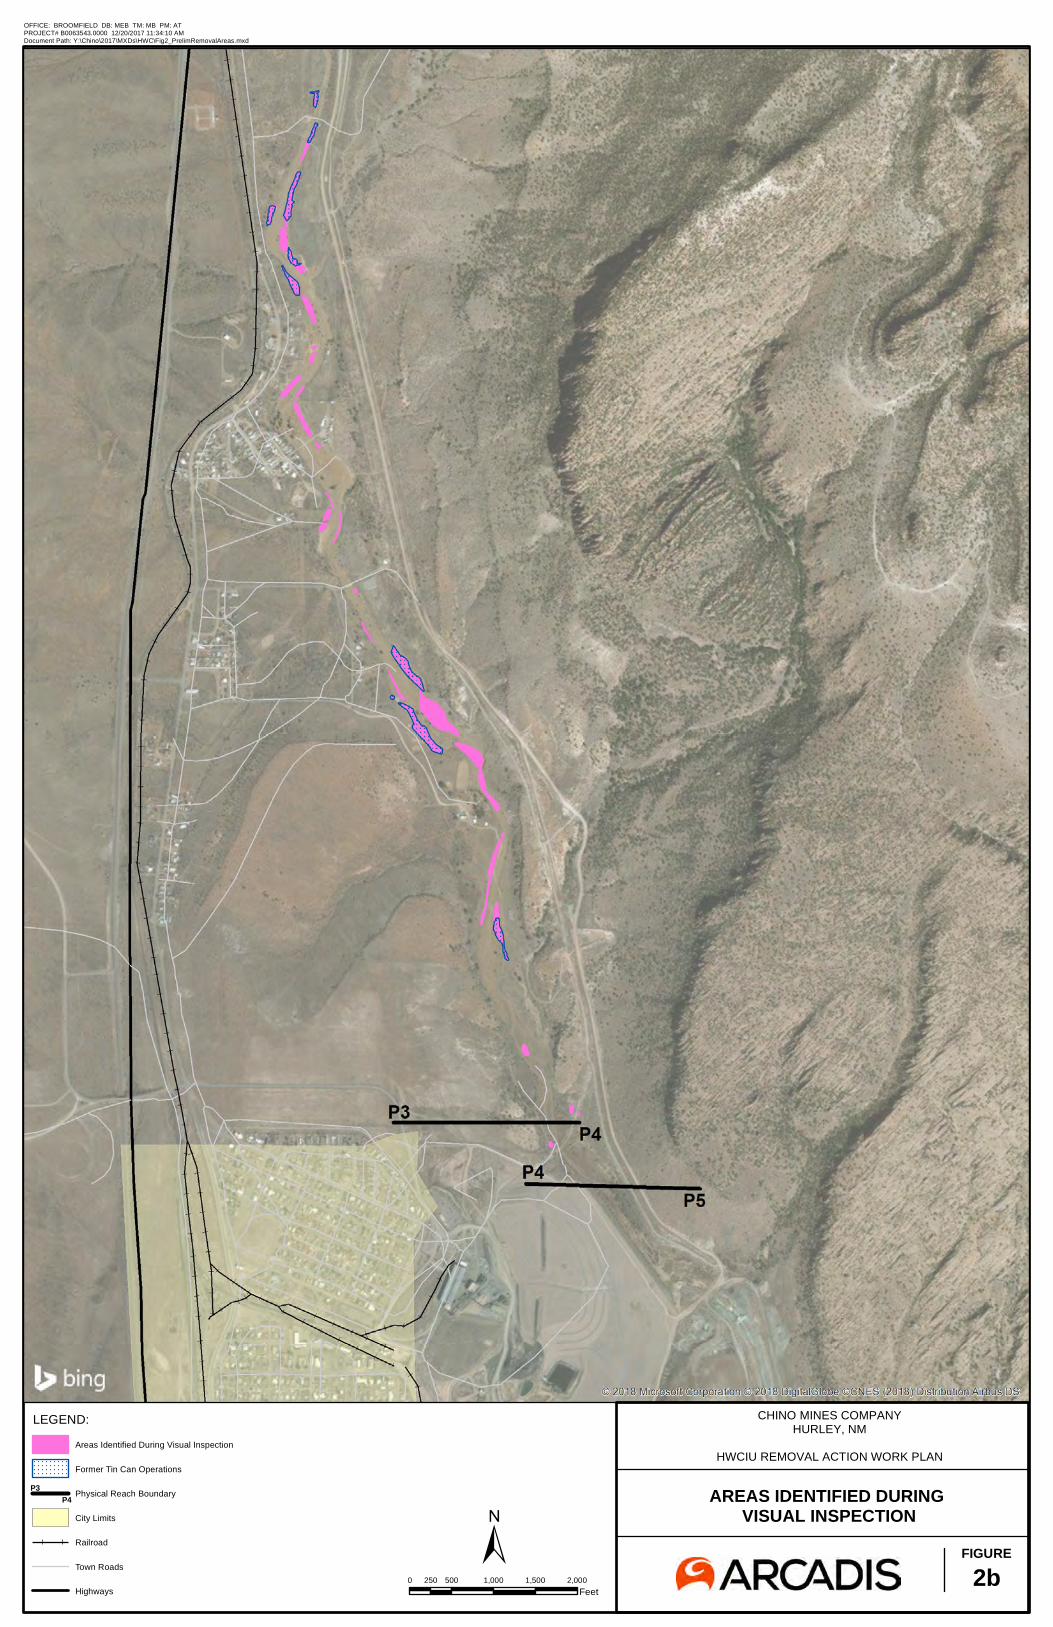
LEGEND:
FIGURE2b±
0 500 1,000 1,500 2,000250Feet
OFFICE: BROOMFIELD DB: MEB TM: MB PM: ATPROJECT# B0063543.0000 12/20/2017 11:34:10 AMDocument Path: Y:\Chino\2017\MXDs\HWC\Fig2_PrelimRemovalAreas.mxd
Areas Identified During Visual Inspection
Former Tin Can Operations
Physical Reach Boundary
City Limits
Railroad
Town Roads
Highways
CHINO MINES COMPANYHURLEY, NM
HWCIU REMOVAL ACTION WORK PLAN
AREAS IDENTIFIED DURING VISUAL INSPECTION
P3P4
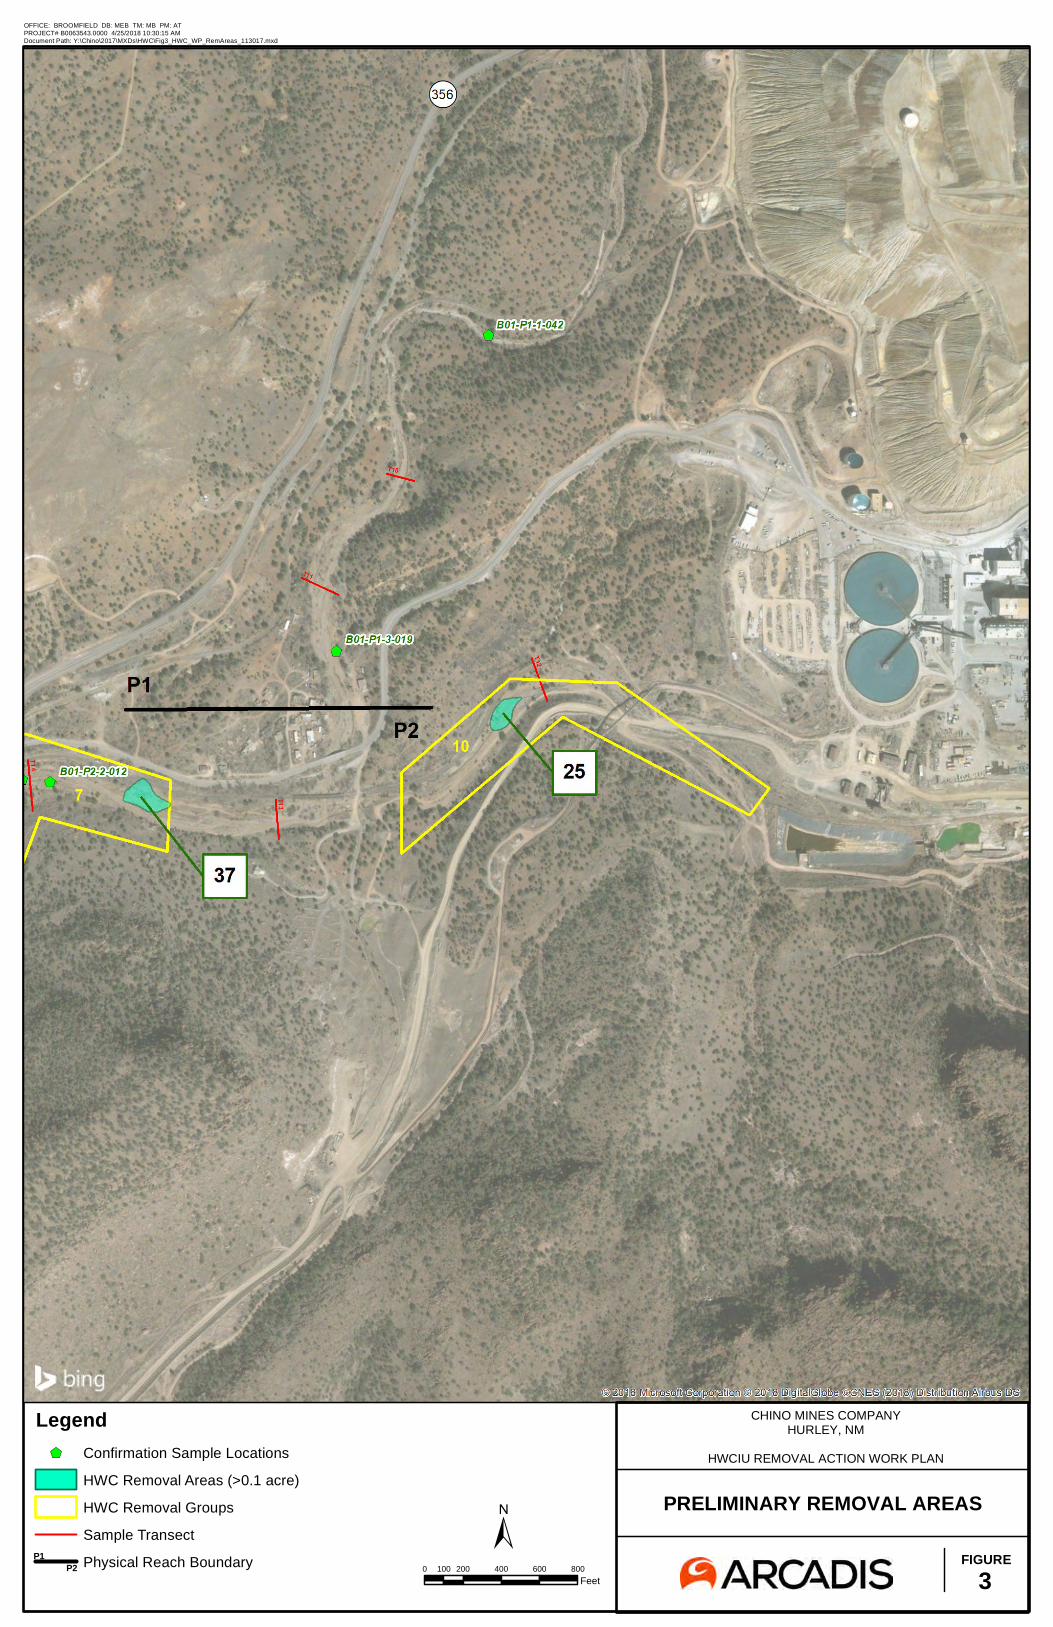
CHINO MINES COMPANYHURLEY, NM
HWCIU REMOVAL ACTION WORK PLAN
PRELIMINARY REMOVAL AREAS
FIGURE3
±0 200 400 600 800100
Feet
OFFICE: BROOMFIELD DB: MEB TM: MB PM: ATPROJECT# B0063543.0000 4/25/2018 10:30:15 AMDocument Path: Y:\Chino\2017\MXDs\HWC\Fig3_HWC_WP_RemAreas_113017.mxd
Legend$+ Confirmation Sample Locations
HWC Removal Areas (>0.1 acre)
HWC Removal Groups
Sample Transect
Physical Reach BoundaryP1P2
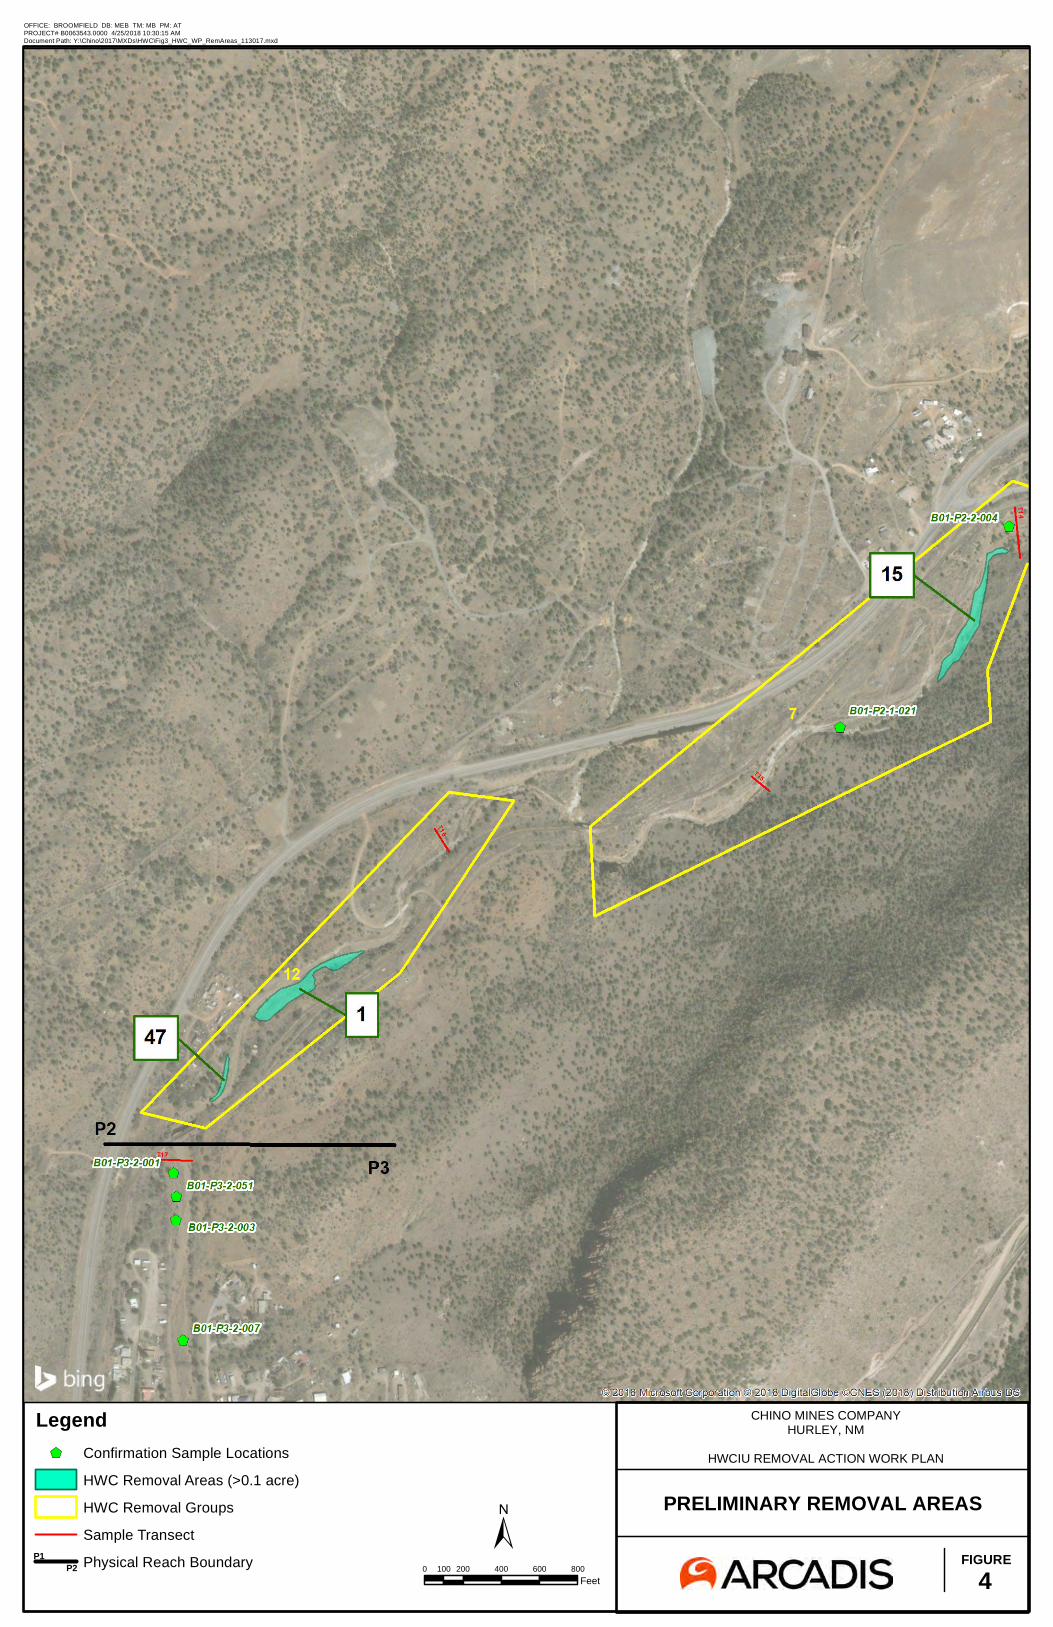
CHINO MINES COMPANYHURLEY, NM
HWCIU REMOVAL ACTION WORK PLAN
PRELIMINARY REMOVAL AREAS
FIGURE4
±0 200 400 600 800100
Feet
OFFICE: BROOMFIELD DB: MEB TM: MB PM: ATPROJECT# B0063543.0000 4/25/2018 10:30:15 AMDocument Path: Y:\Chino\2017\MXDs\HWC\Fig3_HWC_WP_RemAreas_113017.mxd
Legend$+ Confirmation Sample Locations
HWC Removal Areas (>0.1 acre)
HWC Removal Groups
Sample Transect
Physical Reach BoundaryP1P2
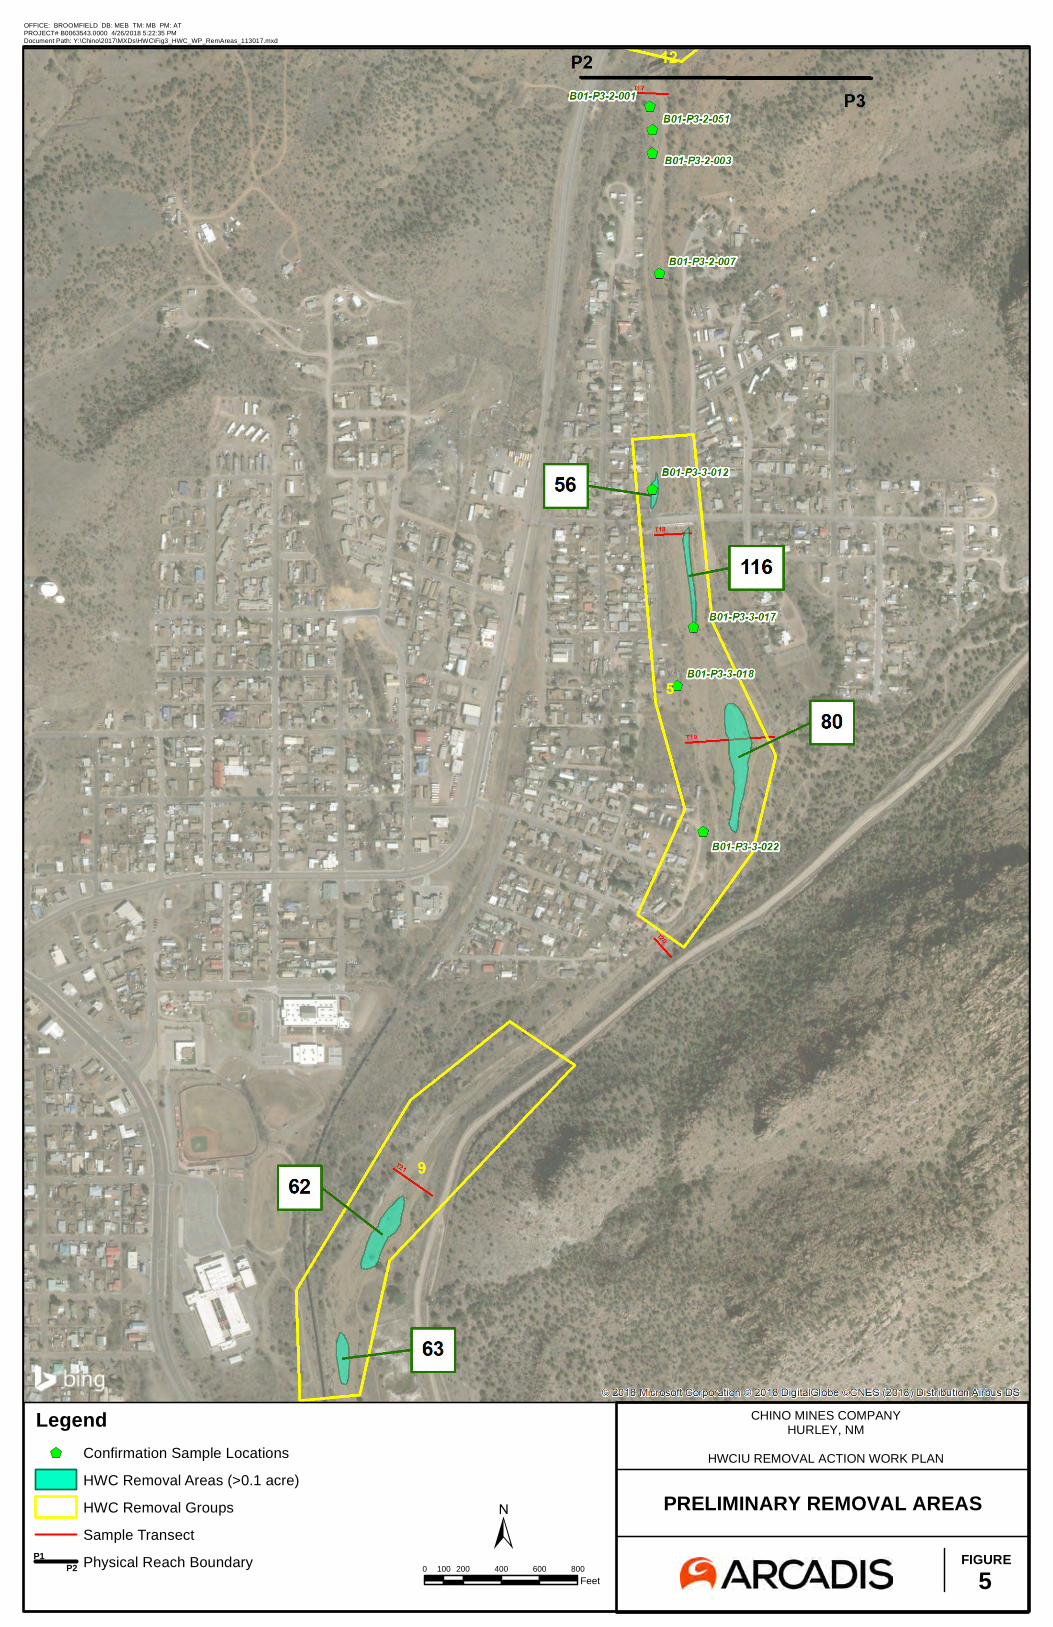
CHINO MINES COMPANYHURLEY, NM
HWCIU REMOVAL ACTION WORK PLAN
PRELIMINARY REMOVAL AREAS
FIGURE5
±0 200 400 600 800100
Feet
OFFICE: BROOMFIELD DB: MEB TM: MB PM: ATPROJECT# B0063543.0000 4/26/2018 5:22:35 PMDocument Path: Y:\Chino\2017\MXDs\HWC\Fig3_HWC_WP_RemAreas_113017.mxd
Legend$+ Confirmation Sample Locations
HWC Removal Areas (>0.1 acre)
HWC Removal Groups
Sample Transect
Physical Reach BoundaryP1P2
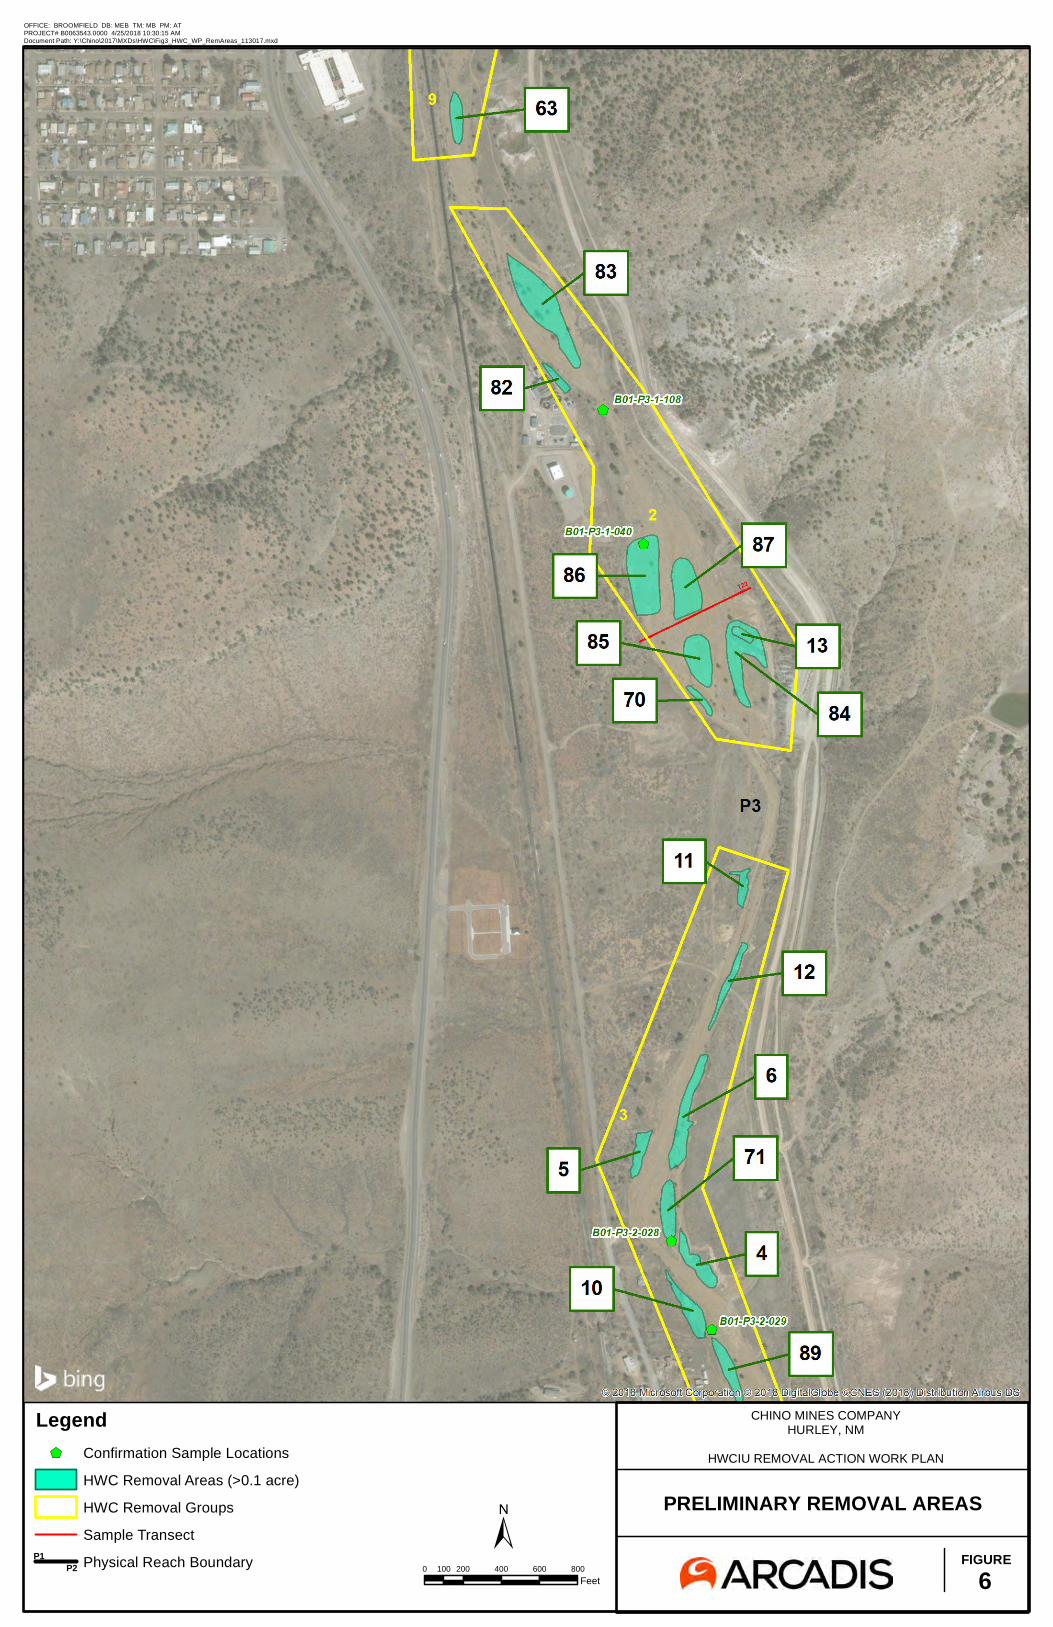
CHINO MINES COMPANYHURLEY, NM
HWCIU REMOVAL ACTION WORK PLAN
PRELIMINARY REMOVAL AREAS
FIGURE6
±0 200 400 600 800100
Feet
OFFICE: BROOMFIELD DB: MEB TM: MB PM: ATPROJECT# B0063543.0000 4/25/2018 10:30:15 AMDocument Path: Y:\Chino\2017\MXDs\HWC\Fig3_HWC_WP_RemAreas_113017.mxd
Legend$+ Confirmation Sample Locations
HWC Removal Areas (>0.1 acre)
HWC Removal Groups
Sample Transect
Physical Reach BoundaryP1P2
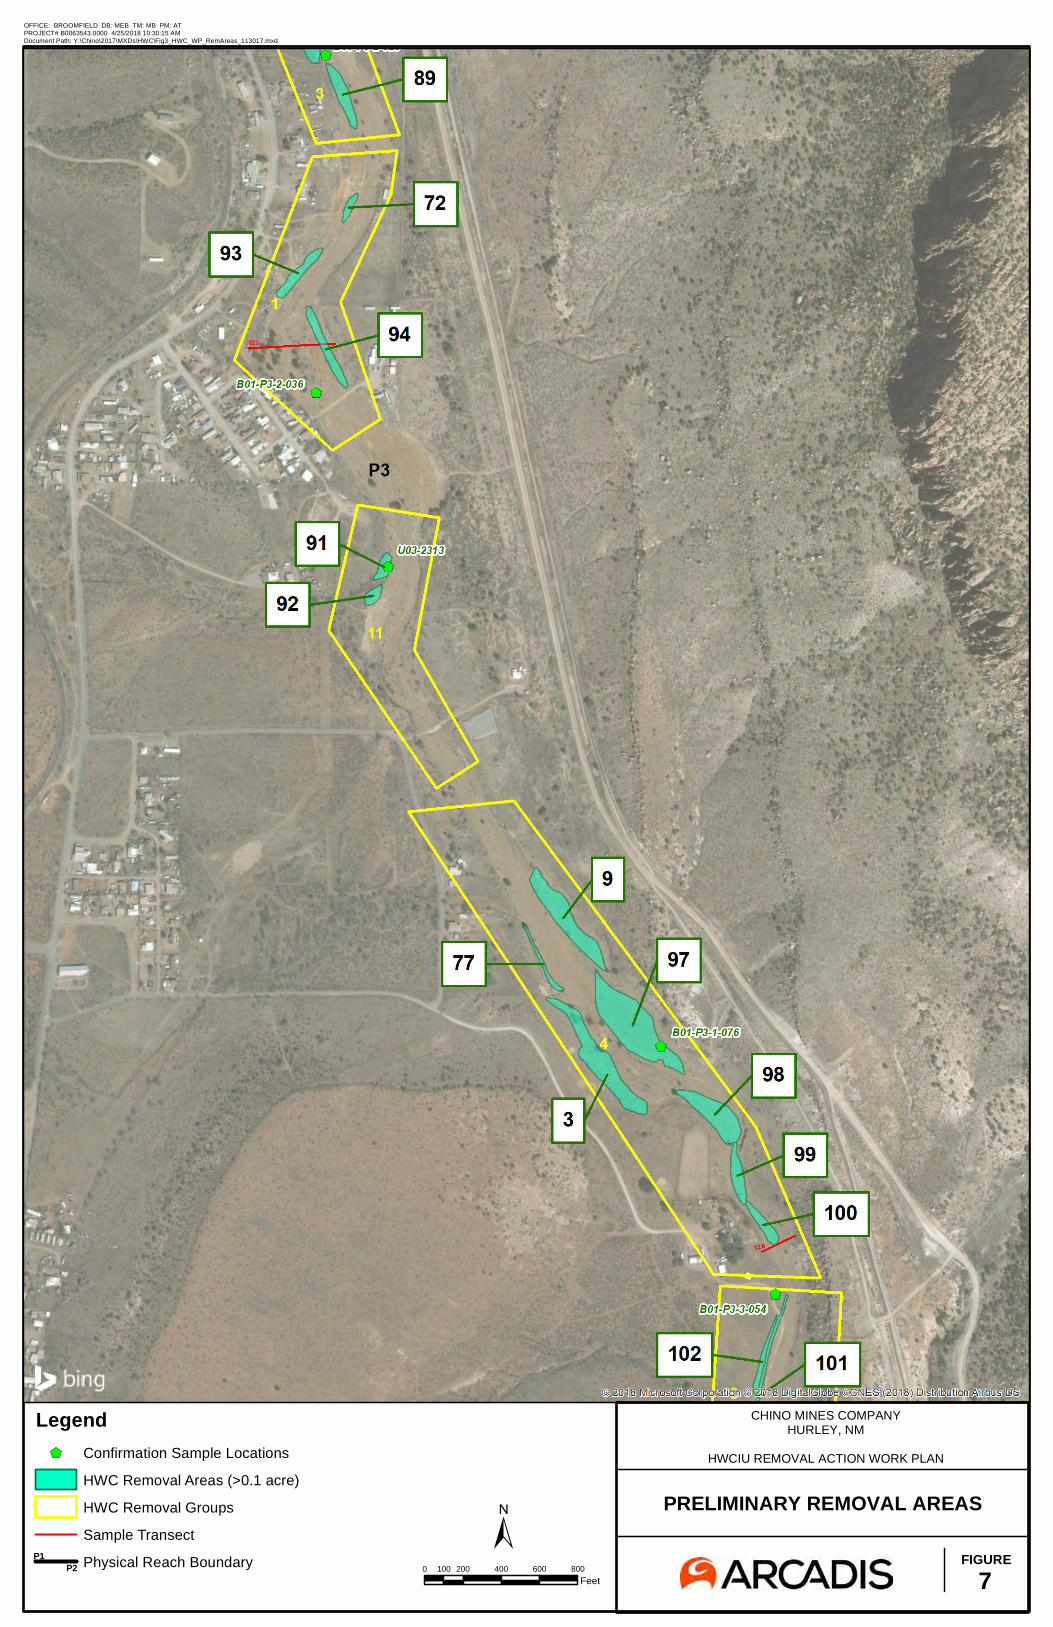
CHINO MINES COMPANYHURLEY, NM
HWCIU REMOVAL ACTION WORK PLAN
PRELIMINARY REMOVAL AREAS
FIGURE7
±0 200 400 600 800100
Feet
OFFICE: BROOMFIELD DB: MEB TM: MB PM: ATPROJECT# B0063543.0000 4/25/2018 10:30:15 AMDocument Path: Y:\Chino\2017\MXDs\HWC\Fig3_HWC_WP_RemAreas_113017.mxd
Legend$+ Confirmation Sample Locations
HWC Removal Areas (>0.1 acre)
HWC Removal Groups
Sample Transect
Physical Reach BoundaryP1P2
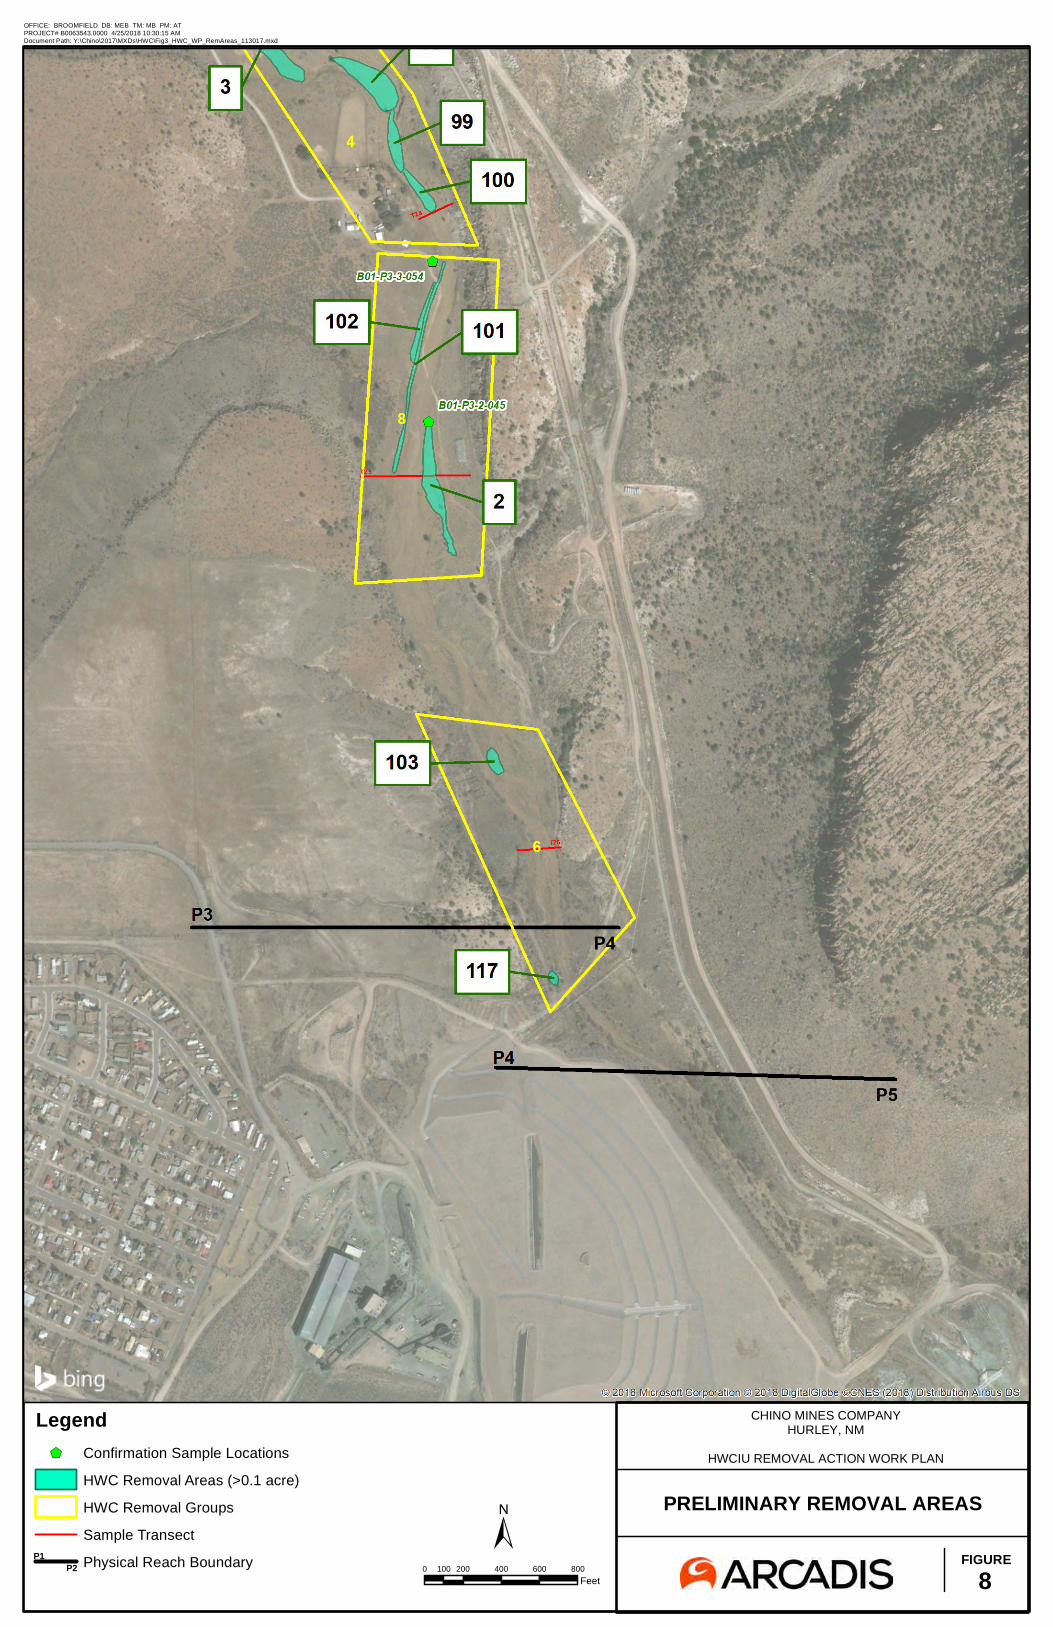
CHINO MINES COMPANYHURLEY, NM
HWCIU REMOVAL ACTION WORK PLAN
PRELIMINARY REMOVAL AREAS
FIGURE8
±0 200 400 600 800100
Feet
OFFICE: BROOMFIELD DB: MEB TM: MB PM: ATPROJECT# B0063543.0000 4/25/2018 10:30:15 AMDocument Path: Y:\Chino\2017\MXDs\HWC\Fig3_HWC_WP_RemAreas_113017.mxd
Legend$+ Confirmation Sample Locations
HWC Removal Areas (>0.1 acre)
HWC Removal Groups
Sample Transect
Physical Reach BoundaryP1P2

Arcadis U.S., Inc.
11001 W. 120th Avenue
Suite 200
Broomfield, Colorado 80021
Tel 303 544 0043
Fax 720 887 6051
www.arcadis.com