Embed Size (px)
Citation preview
Agenda
• Industry Overview• Teck• Freeport-McMoran• BHP Billiton
Copper
• An Internationally traded commodity• Prices:
– Volatile– Cyclical– Determined by the major metals exchanges
• New York Mercantile Exchange (COMEX)• London Metals Exchange (LME)• Shanghai Futures Exchange (SHFE0
copper
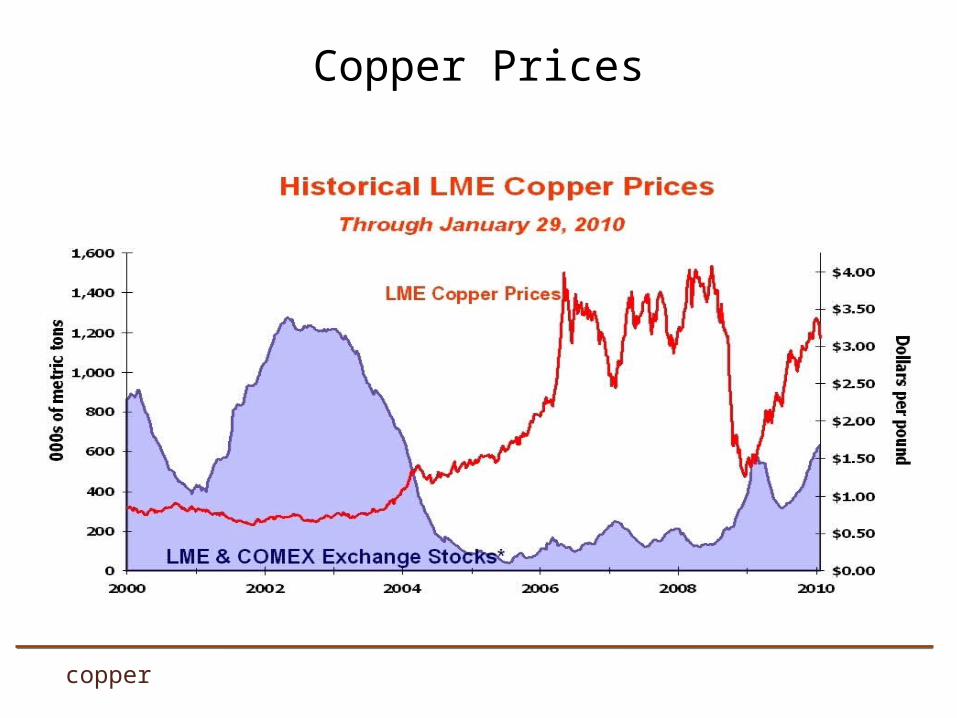
Copper Prices
copper
Copper prices• Prices: Largest yearly increase on record in 2009
– Increased 153%• US$1.32/lb at the end of 2008 on the LME • US$3.33/lb at the end of 2009 on the LME
– Average Price for 2009 = US$2.34 • Down US$0.83
– Average Price for 2008 = US$3.17
• Currently– Prices are trading approximately 42% higher than
in 2009 average prices
copper
Copper Demand
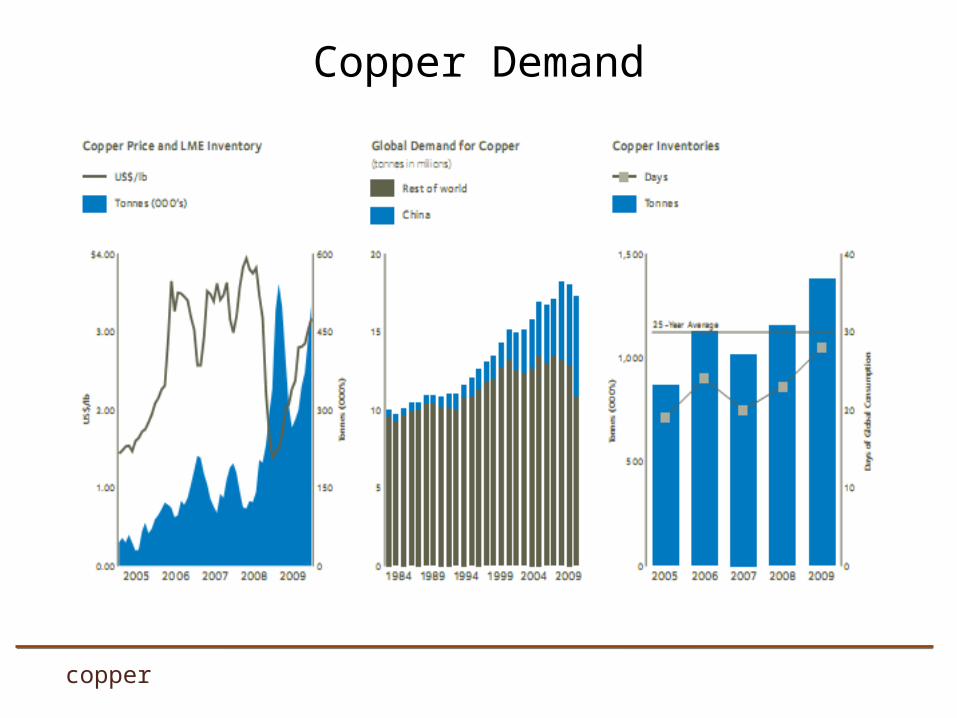
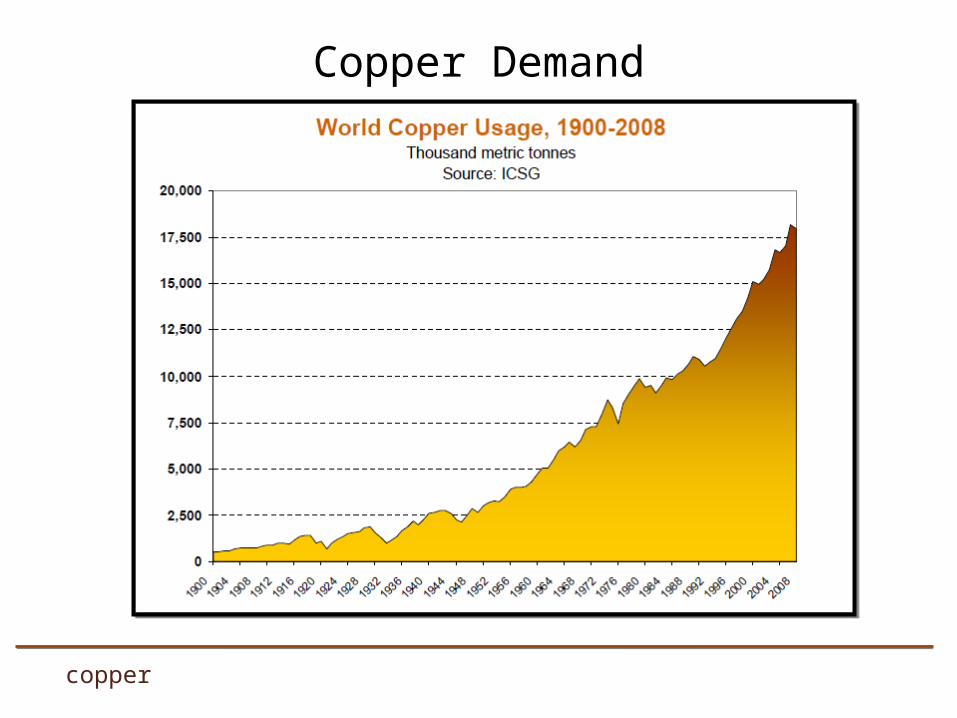
• Copper demand exceeded 18 million tonnes in 2009– Reflects the rate of underlying world economic growth, particularly in
industrial production and construction
• Global copper consumption fell by 1.3% in 2009– North America: Demand down 9%– Europe: Demand down 12%– Germany: Demand down 12%– France: Demand down 9%– China: Demand up 42%
copper
Copper Demand
• Factors affecting demand– Global Economic Conditions
• Instability Decreases Demand (US. and Europe)
– Industrialization• Increases consumption (China and India)• Copper imports by China advanced to a record in 2009,
driving global prices up 140 percent.
copper
Copper Demand
copper
Copper Demand
copper
Copper Demand
copper
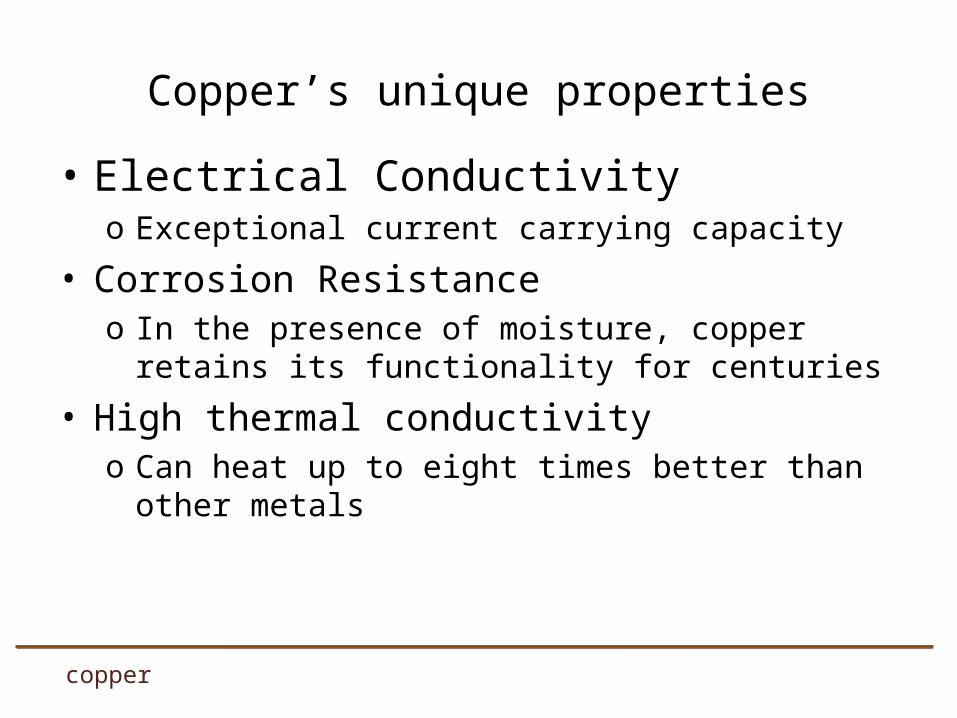
Copper’s unique properties
• Electrical Conductivityo Exceptional current carrying capacity
• Corrosion Resistanceo In the presence of moisture, copper retains its
functionality for centuries
• High thermal conductivityo Can heat up to eight times better than other metals
copper
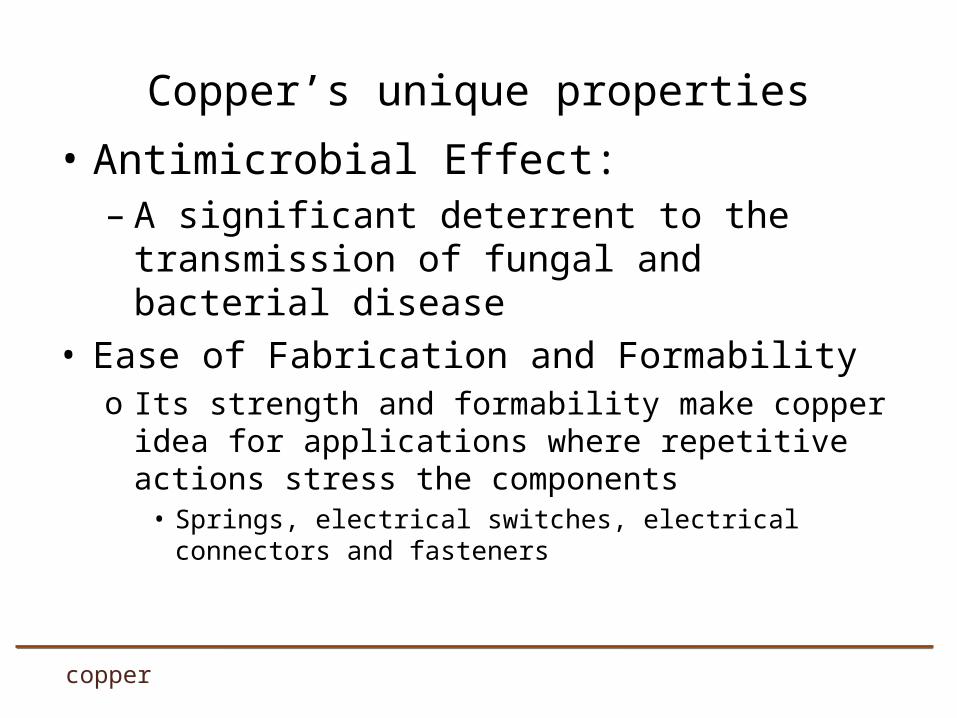
• Antimicrobial Effect:– A significant deterrent to the transmission of
fungal and bacterial disease• Ease of Fabrication and Formability
o Its strength and formability make copper idea for applications where repetitive actions stress the components
• Springs, electrical switches, electrical connectors and fasteners
copper
Copper’s unique properties
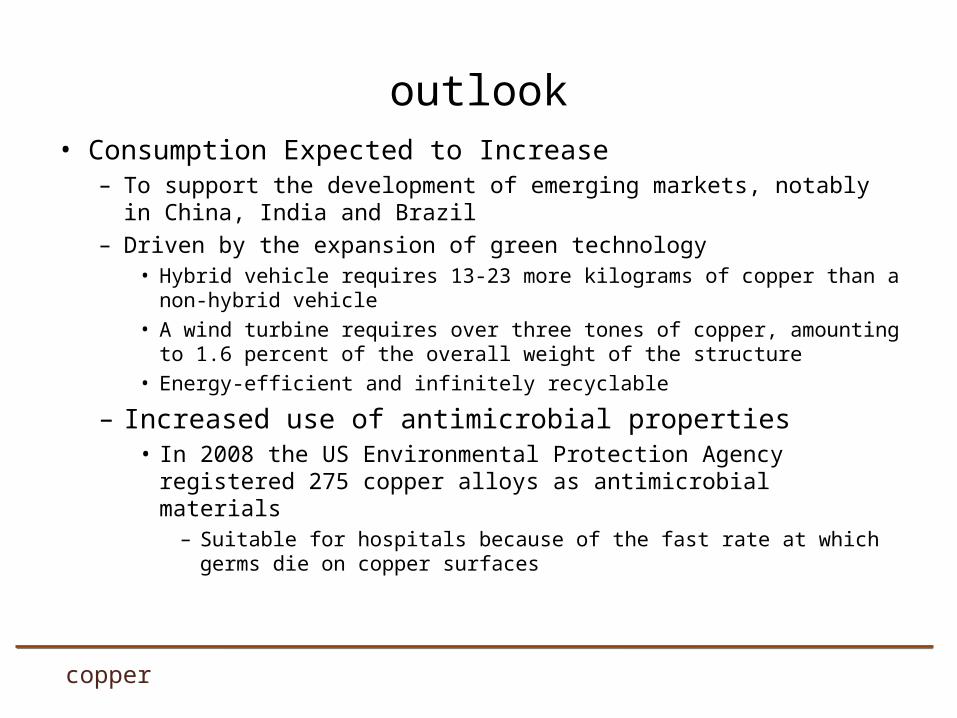
• Consumption Expected to Increase– To support the development of emerging markets, notably in China,
India and Brazil– Driven by the expansion of green technology
• Hybrid vehicle requires 13-23 more kilograms of copper than a non-hybrid vehicle
• A wind turbine requires over three tones of copper, amounting to 1.6 percent of the overall weight of the structure
• Energy-efficient and infinitely recyclable
– Increased use of antimicrobial properties• In 2008 the US Environmental Protection Agency registered 275
copper alloys as antimicrobial materials– Suitable for hospitals because of the fast rate at which germs die on
copper surfaces
copper
outlook
copper
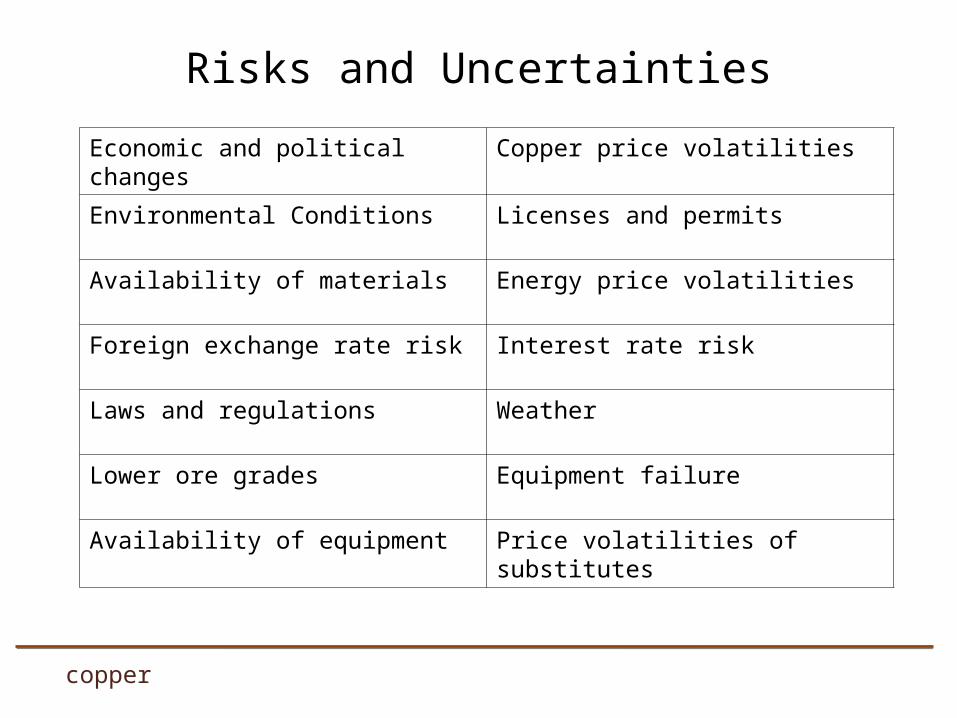
Risks and Uncertainties
Economic and political changes Copper price volatilities
Environmental Conditions Licenses and permits
Availability of materials Energy price volatilities
Foreign exchange rate risk Interest rate risk
Laws and regulations Weather
Lower ore grades Equipment failure
Availability of equipment Price volatilities of substitutes
Potential Hedging strategies
• Energy Prices• Copper Prices• Exchange Rates• Interest Rates
copper
coal
• The world’s most abundant and widely distributed fossil fuel• Was the most important source of the the world’s primary
energy until it was taken over by oil in the late 1960s• 70% of the total world coal production is consumed for
electricity generation• Uses:
– Electricity generation– Steel production– Cement manufacturing– As a liquid fuel
coal
Coal
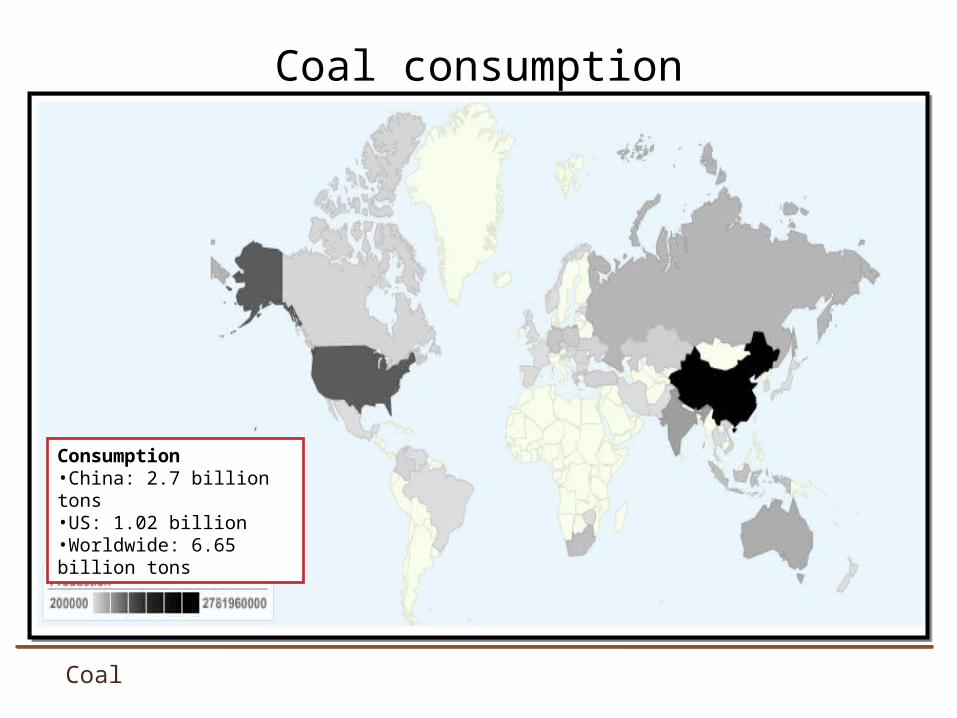
Consumption•China: 2.7 billion tons•US: 1.02 billion•Worldwide: 6.65 billion tons
Coal consumption
Coal consumption
• Since 2000, global coal consumption has grown faster than any other fuel
• Consumption in 2009:o Around 5.8 billion tonnes of hard coalo Around 953 million tonnes of brown coal
• The biggest market for coal is in Asiao Currently accounts for 56% of global coal consumption
coal
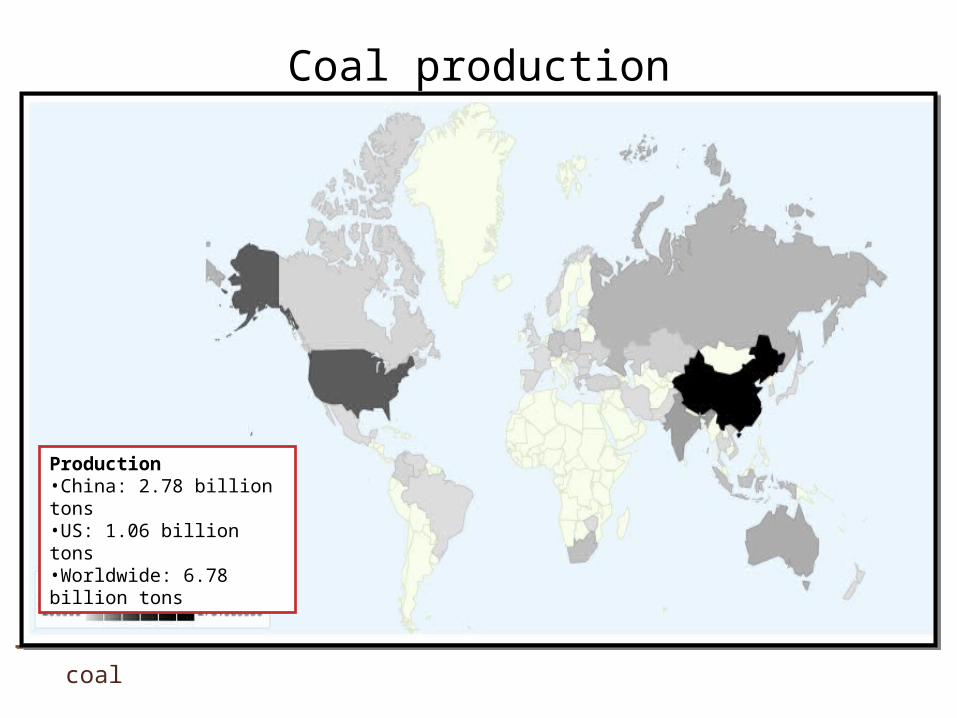
Coal production
coal
Production•China: 2.78 billion tons•US: 1.06 billion tons•Worldwide: 6.78 billion tons
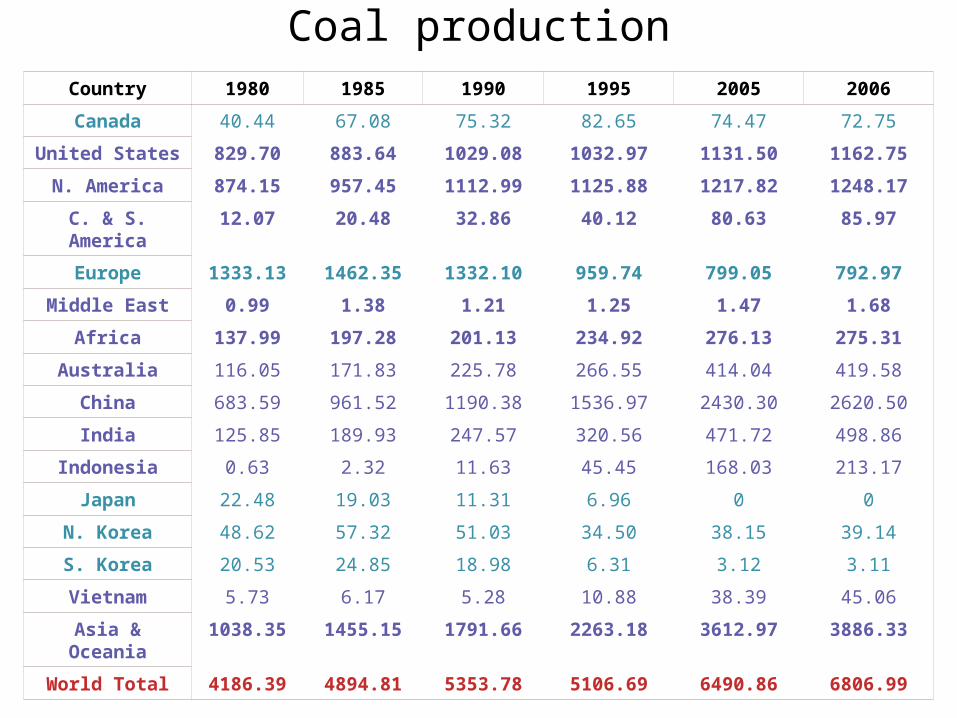
Coal productionCountry 1980 1985 1990 1995 2005 2006
Canada 40.44 67.08 75.32 82.65 74.47 72.75
United States 829.70 883.64 1029.08 1032.97 1131.50 1162.75
N. America 874.15 957.45 1112.99 1125.88 1217.82 1248.17
C. & S. America
12.07 20.48 32.86 40.12 80.63 85.97
Europe 1333.13 1462.35 1332.10 959.74 799.05 792.97
Middle East 0.99 1.38 1.21 1.25 1.47 1.68
Africa 137.99 197.28 201.13 234.92 276.13 275.31
Australia 116.05 171.83 225.78 266.55 414.04 419.58
China 683.59 961.52 1190.38 1536.97 2430.30 2620.50
India 125.85 189.93 247.57 320.56 471.72 498.86
Indonesia 0.63 2.32 11.63 45.45 168.03 213.17
Japan 22.48 19.03 11.31 6.96 0 0
N. Korea 48.62 57.32 51.03 34.50 38.15 39.14
S. Korea 20.53 24.85 18.98 6.31 3.12 3.11
Vietnam 5.73 6.17 5.28 10.88 38.39 45.06
Asia & Oceania
1038.35 1455.15 1791.66 2263.18 3612.97 3886.33
World Total 4186.39 4894.81 5353.78 5106.69 6490.86 6806.99
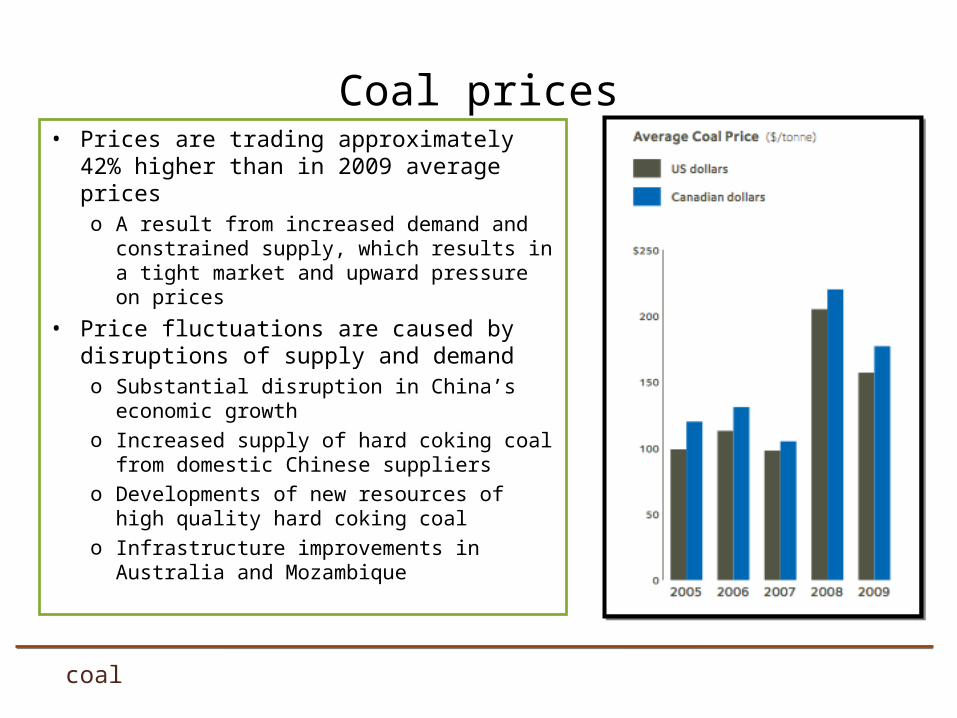
Coal prices• Prices are trading approximately 42%
higher than in 2009 average priceso A result from increased demand and
constrained supply, which results in a tight market and upward pressure on prices
• Price fluctuations are caused by disruptions of supply and demando Substantial disruption in China’s economic
growtho Increased supply of hard coking coal from
domestic Chinese supplierso Developments of new resources of high
quality hard coking coalo Infrastructure improvements in Australia
and Mozambique
coal
• 2010 is expected to be a year of transition as the global economy recovers from the recessiono Indicators are showing signs of strength
• Demand for metallurgical coal snapped back dramatically compared to 2009 and is continuing to growo Asian economies are recovering rapidly and are importing
metallurgical coal at a fast pace
• Demand for thermal coal is also on the rise due to:o A colder winter in the USo Higher natural gas priceso Improved economy
• Demand is expected to rebound further
copper
outlook
coal
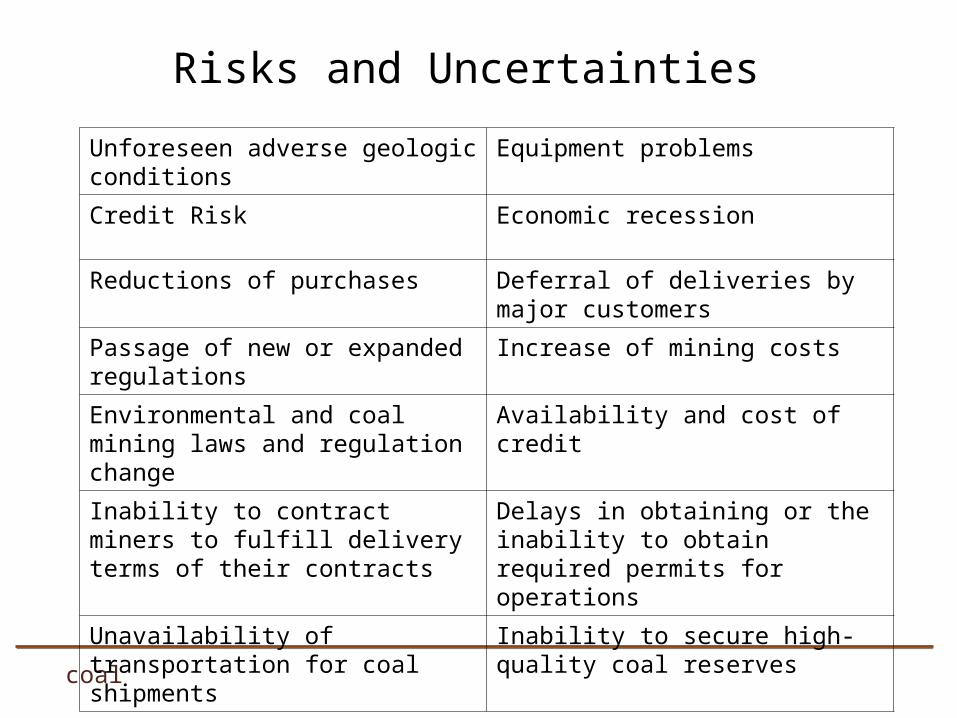
Risks and Uncertainties
Unforeseen adverse geologic conditions
Equipment problems
Credit Risk Economic recession
Reductions of purchases Deferral of deliveries by major customers
Passage of new or expanded regulations
Increase of mining costs
Environmental and coal mining laws and regulation change
Availability and cost of credit
Inability to contract miners to fulfill delivery terms of their contracts
Delays in obtaining or the inability to obtain required permits for operations
Unavailability of transportation for coal shipments
Inability to secure high-quality coal reserves
zinc
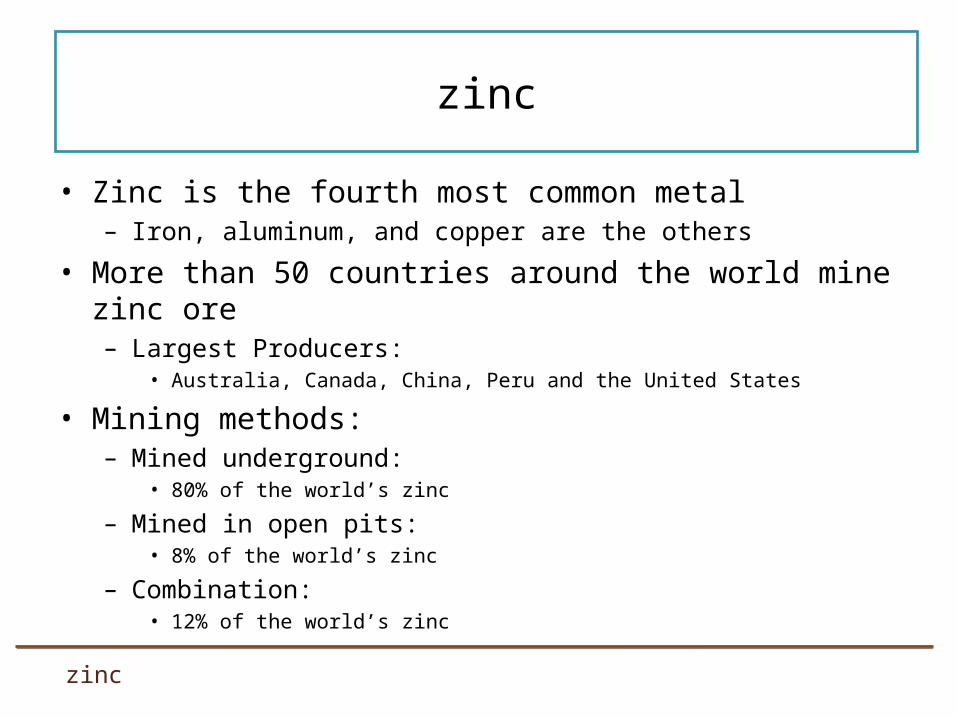
• Zinc is the fourth most common metal – Iron, aluminum, and copper are the others
• More than 50 countries around the world mine zinc ore– Largest Producers:
• Australia, Canada, China, Peru and the United States
• Mining methods:– Mined underground:
• 80% of the world’s zinc
– Mined in open pits: • 8% of the world’s zinc
– Combination: • 12% of the world’s zinc
zinc
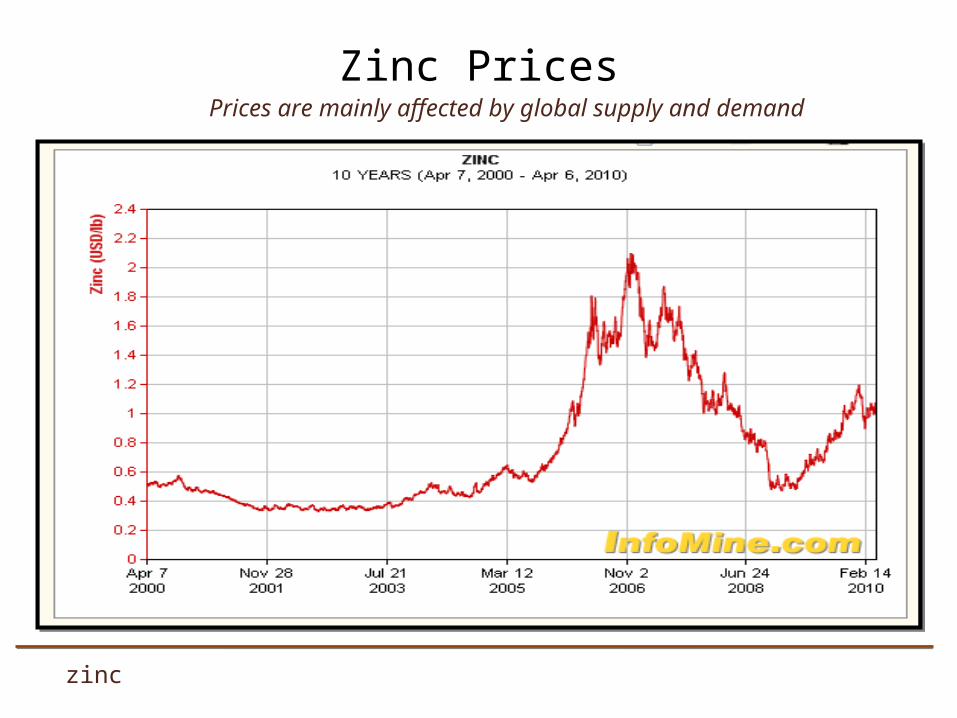
Zinc Prices
zinc
Prices are mainly affected by global supply and demand
zinc
- Market prices are affected by many variables including:- Regional supply and demand- Political and economic conditions- Inflation expectations- Speculative activities- Production costs in major producing regions
- Since March 2009 to the end of the year, the price of zinc more than doubled
- LME stocks increased on 42%
Zinc prices
Zinc Demand
zinc
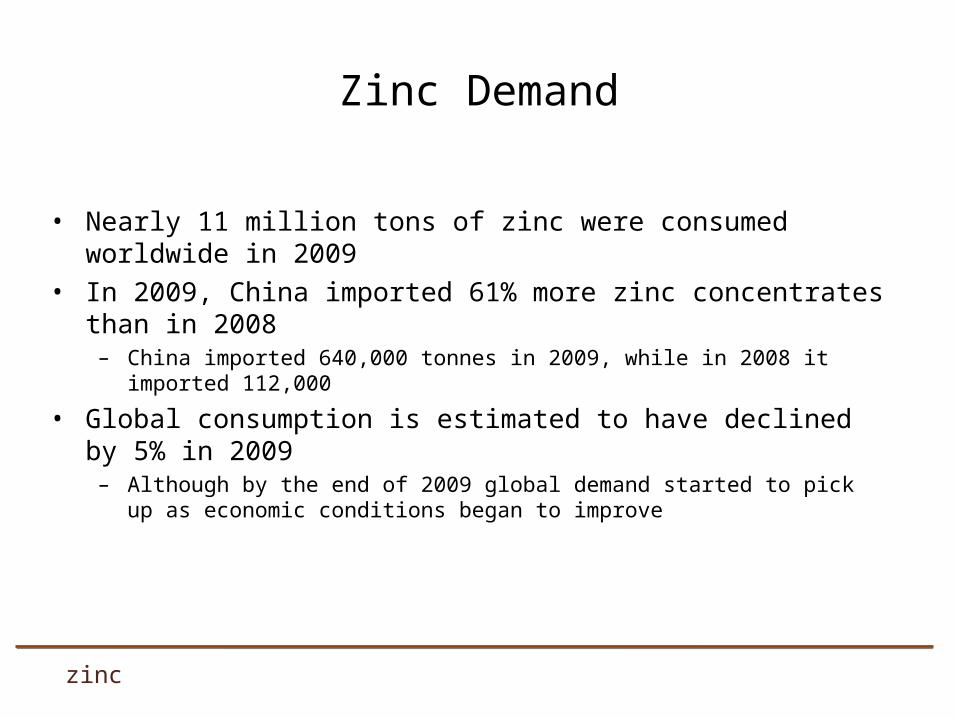
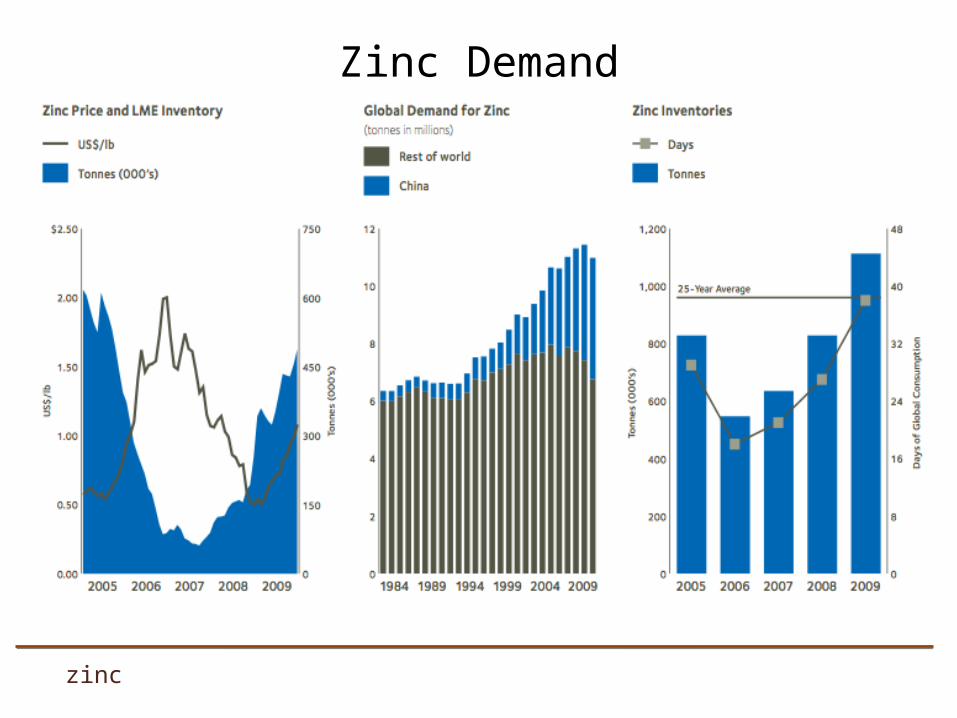
• Nearly 11 million tons of zinc were consumed worldwide in 2009• In 2009, China imported 61% more zinc concentrates than in 2008
– China imported 640,000 tonnes in 2009, while in 2008 it imported 112,000
• Global consumption is estimated to have declined by 5% in 2009– Although by the end of 2009 global demand started to pick up as economic conditions
began to improve
Zinc Demand
zinc
Zinc Demand
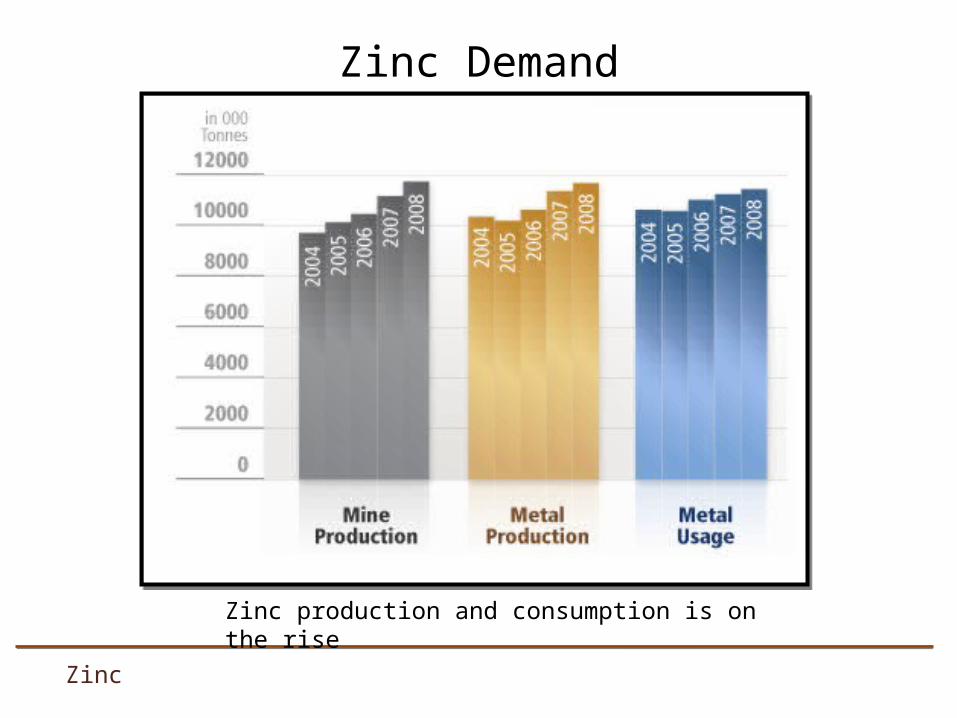
Zinc
Zinc production and consumption is on the rise
Zinc’s unique properties
• High Strength• Formability• Light weight• Corrosion Resistance• Aesthetics• Recyclability• Low Cost
zinc
Zinc Demand
zinc
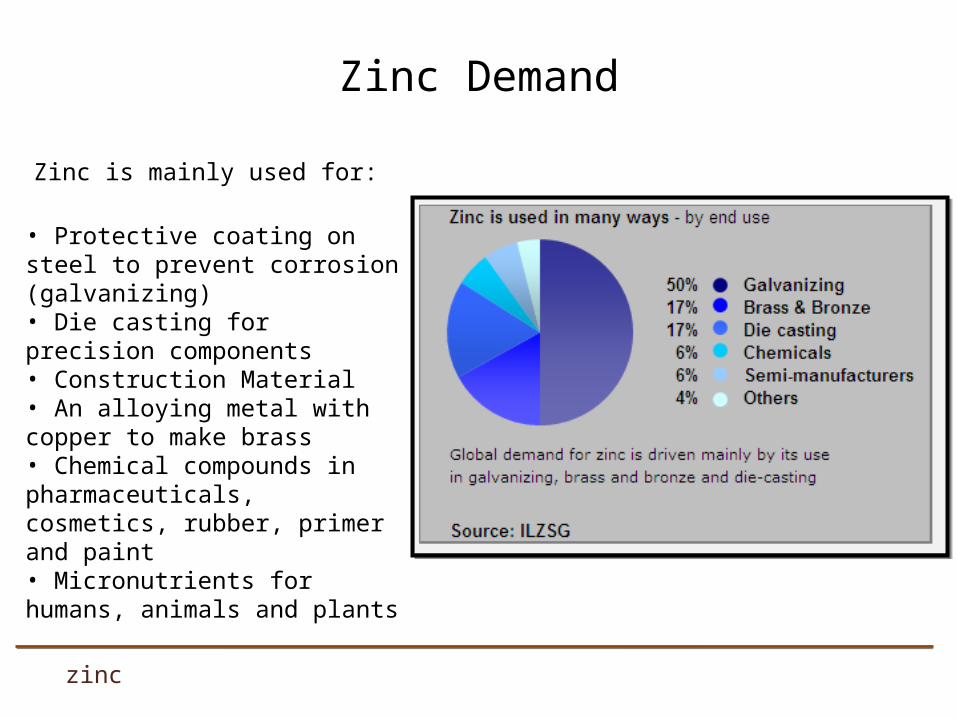
• Protective coating on steel to prevent corrosion (galvanizing)• Die casting for precision components• Construction Material• An alloying metal with copper to make brass• Chemical compounds in pharmaceuticals, cosmetics, rubber, primer and paint• Micronutrients for humans, animals and plants
Zinc is mainly used for:
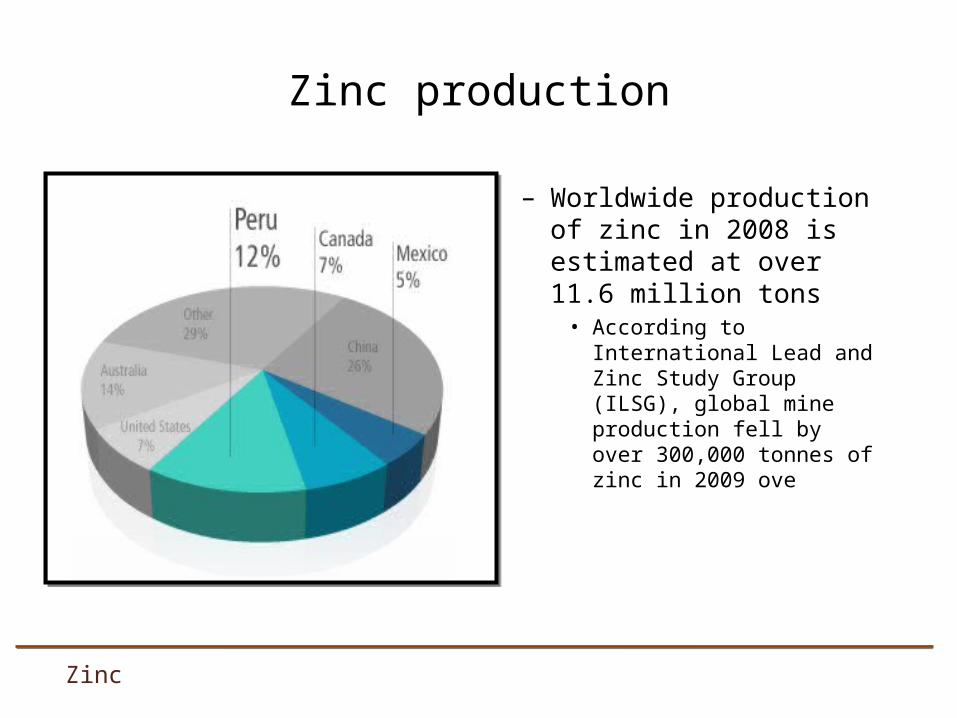
– Worldwide production of zinc in 2008 is estimated at over 11.6 million tons
• According to International Lead and Zinc Study Group (ILSG), global mine production fell by over 300,000 tonnes of zinc in 2009 ove
Zinc
Zinc production
– In 2010, it is estimated that zinc metal demand will increase above trend growth, particularly in industries such as construction, automotive and transport
• Restocking of inventories will occur
– Mine production and ultimately refined production is expected to increase at a greater rate than demand for 2010
Zinc
outlook
Zinc
Potential risks
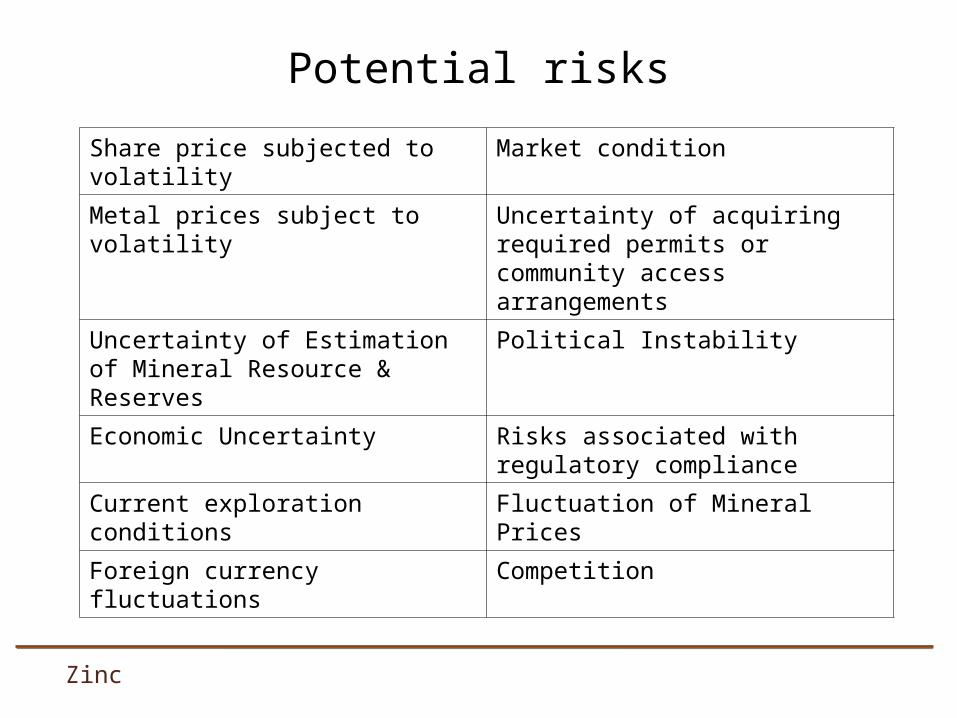
Share price subjected to volatility Market condition
Metal prices subject to volatility Uncertainty of acquiring required permits or community access arrangements
Uncertainty of Estimation of Mineral Resource & Reserves
Political Instability
Economic Uncertainty Risks associated with regulatory compliance
Current exploration conditions Fluctuation of Mineral Prices
Foreign currency fluctuations Competition
Ticker: TCK
About teck
• Canada’s largest diversified mining, mineral processing and metallurgical company
• Headquartered in Vancouver, Canada• Produce copper, metallurgical coal and
zinc, molybdenum and specialty metals, with several oil sands development
• 13 mines in Canada, the USA, Chile and Peru
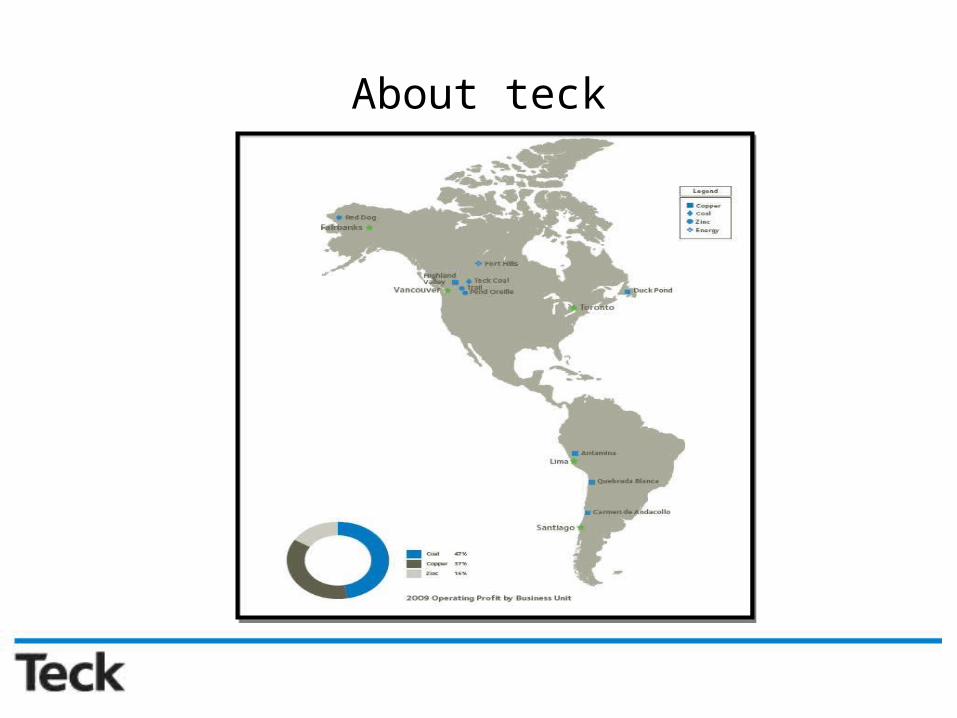
About teck
About teck
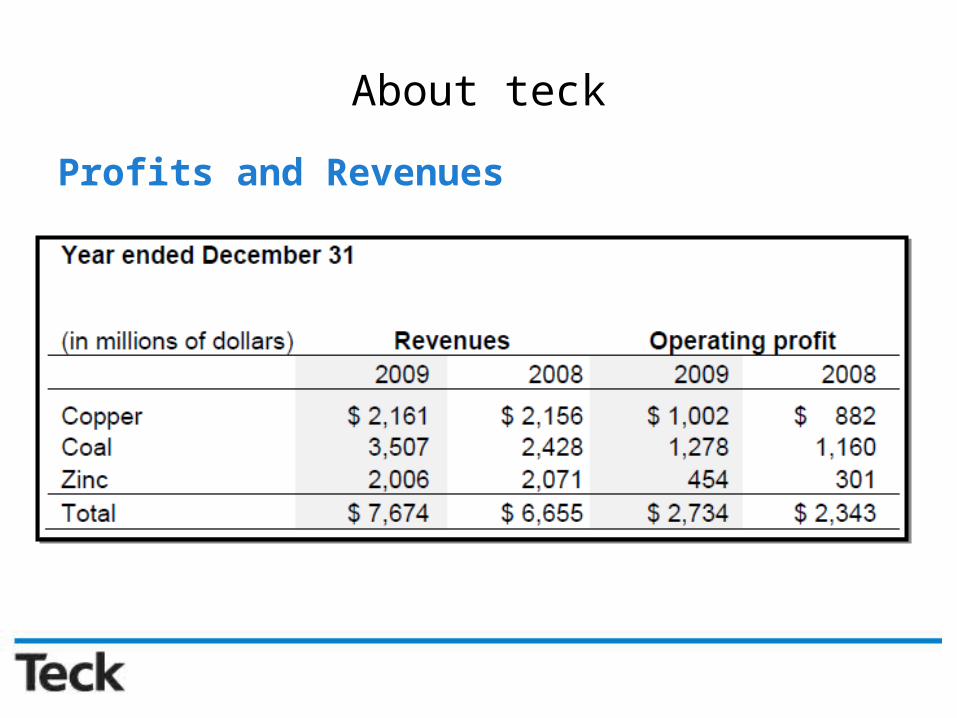
Profits and Revenues• Copper: produced 313,000 tonnes, 40% of profits and 31% of
revenue.• Coal: production reached 23 million tonnes, share of
production was 14 million tonnes. 35% of revenue and 42% of profits
• Zinc: 663,000 tonnes of zinc in concentrate and 270,000 tonnes of refined zinc. 30% of revenue and 15% of profits
About teck
Profits and Revenues
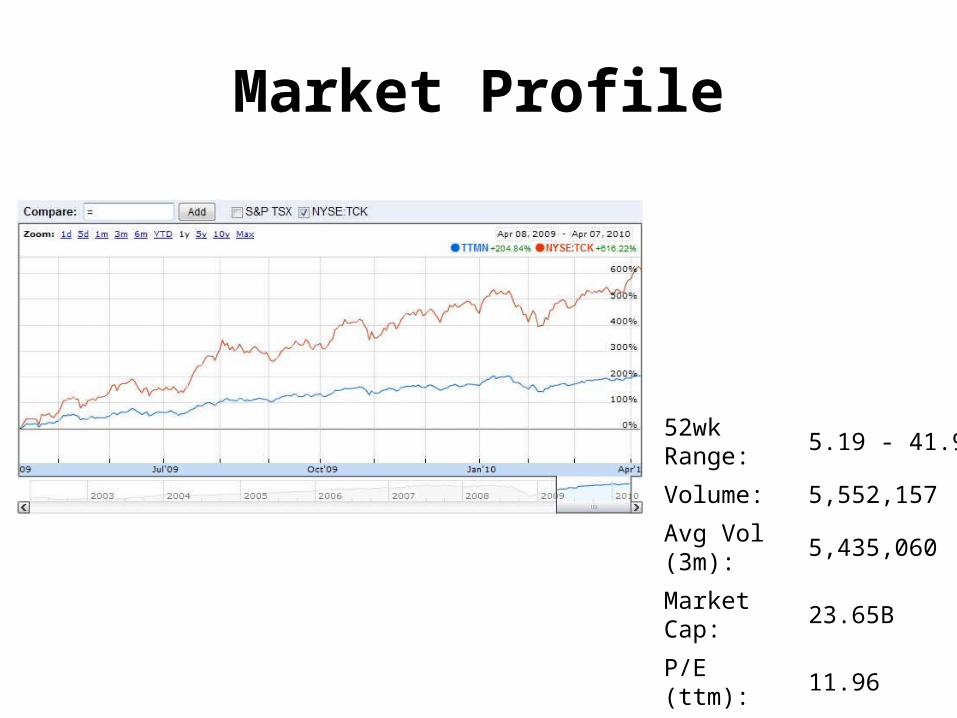
Market Profile
52wk Range: 5.19 - 41.90
Volume: 5,552,157
Avg Vol (3m): 5,435,060
Market Cap: 23.65B
P/E (ttm): 11.96
EPS (ttm): 3.36
Risk Exposures
• Liquidity• Foreign exchange• Interest rates • Commodity price• Credit risk• Capital market• Do not have practice of trading derivatives
Financial Instruments
• Cash and cash equivalents are designated as held for trading.• Temporary investments are designated as available-for-sale• Investments in Marketable Securities• Short-Term Debt and Long-Term Debt• Derivative Instruments: embedded • Certain derivative investments may qualify for hedge
accounting.
Financial Instruments
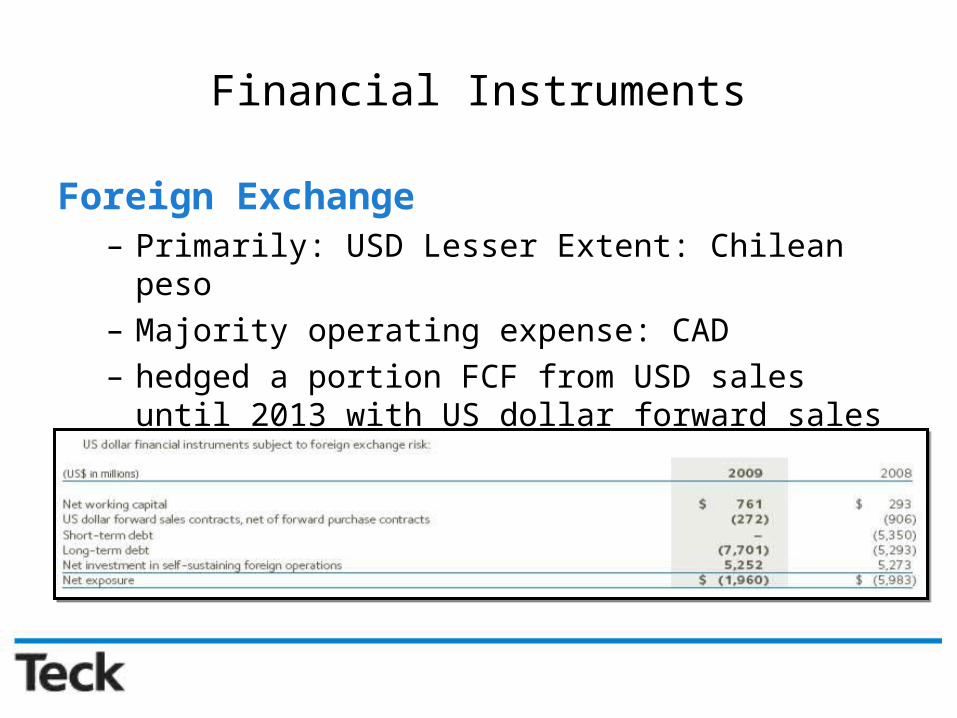
Foreign Exchange– Primarily: USD Lesser Extent: Chilean peso– Majority operating expense: CAD– hedged a portion FCF from USD sales until 2013 with US
dollar forward sales contracts
Financial Instruments
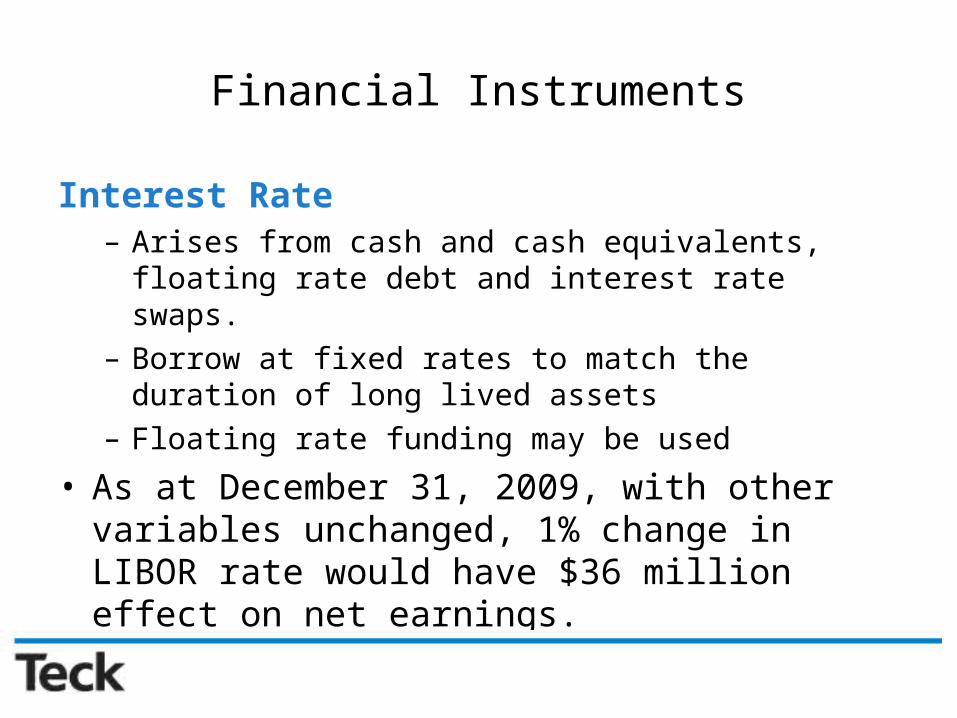
Interest Rate– Arises from cash and cash equivalents, floating rate debt
and interest rate swaps.– Borrow at fixed rates to match the duration of long lived
assets– Floating rate funding may be used
• As at December 31, 2009, with other variables unchanged, 1% change in LIBOR rate would have $36 million effect on net earnings.
Financial Instruments
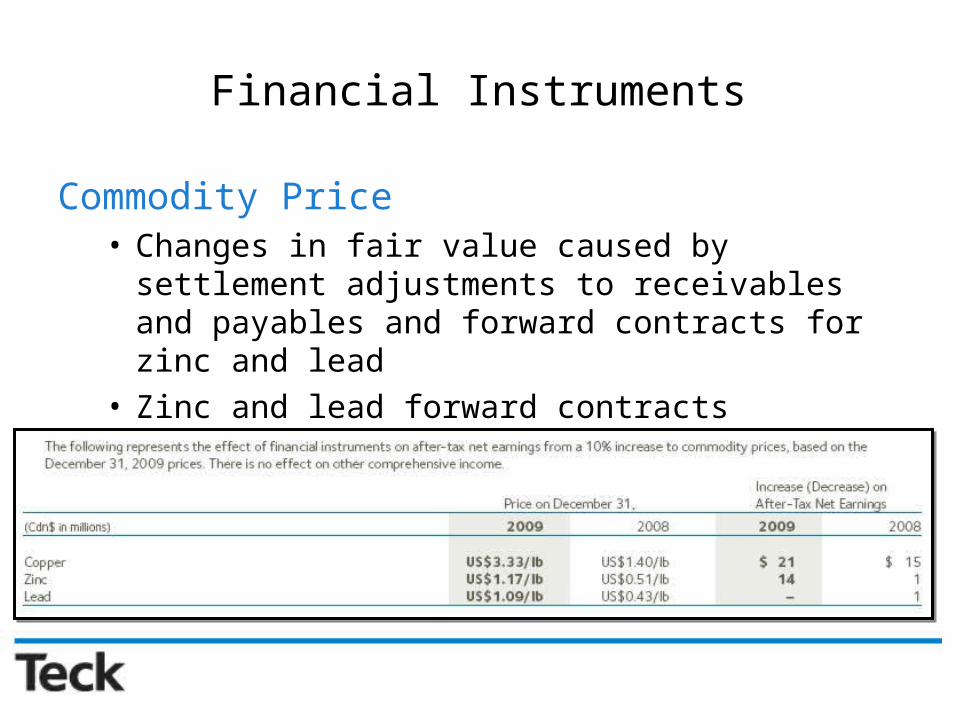
Commodity Price• Changes in fair value caused by settlement adjustments to
receivables and payables and forward contracts for zinc and lead
• Zinc and lead forward contracts outstanding
Financial Instruments
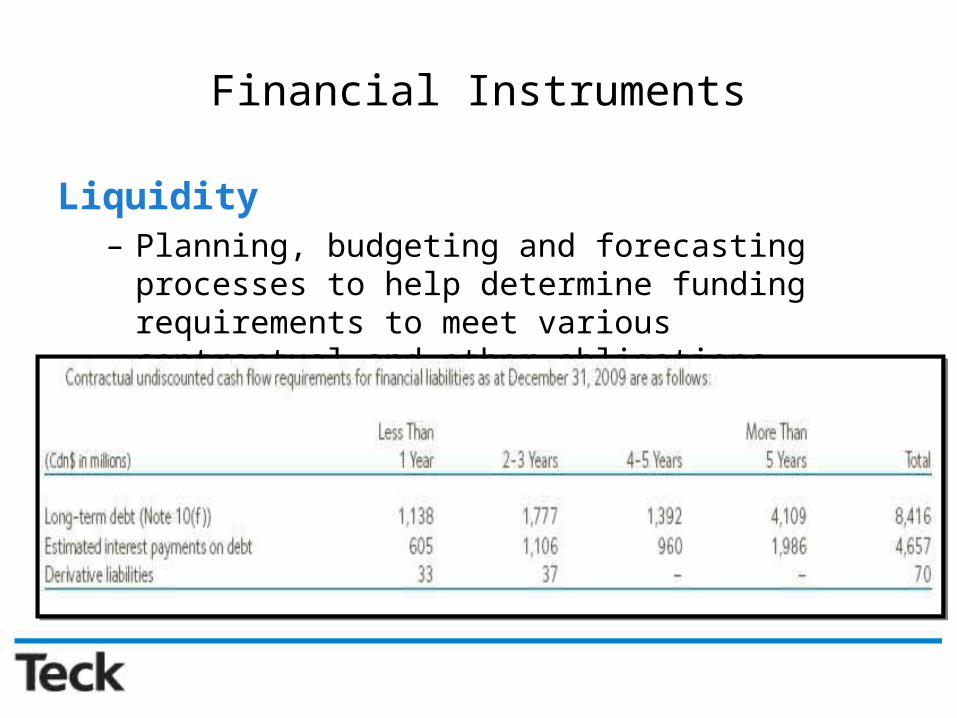
Liquidity– Planning, budgeting and forecasting processes to help
determine funding requirements to meet various contractual and other obligations.
Financial Instruments
Credit Risk• Arises from the non-performance by counterparties of
contractual financial obligations• Manage credit risk for trade and other receivables through
established credit monitoring activities• Maximum exposure: carrying value of our cash and cash
equivalents, receivables and derivative assets
Financial Instruments
Derivatives and Hedges• Cash Flow Hedges
o At December 31, 2009, US dollar forward sales contracts with a notional amount of $284 million remained outstanding. Matures varying 2010-2013
• Economic Hedge Contractso As at December 31, 2009, the 114 million pounds of zinc forward
purchase contracts were offsetting positions to the 114 million pounds of zinc forward sales contracts
• Do not apply hedge accounting to the commodity forward sales contracts
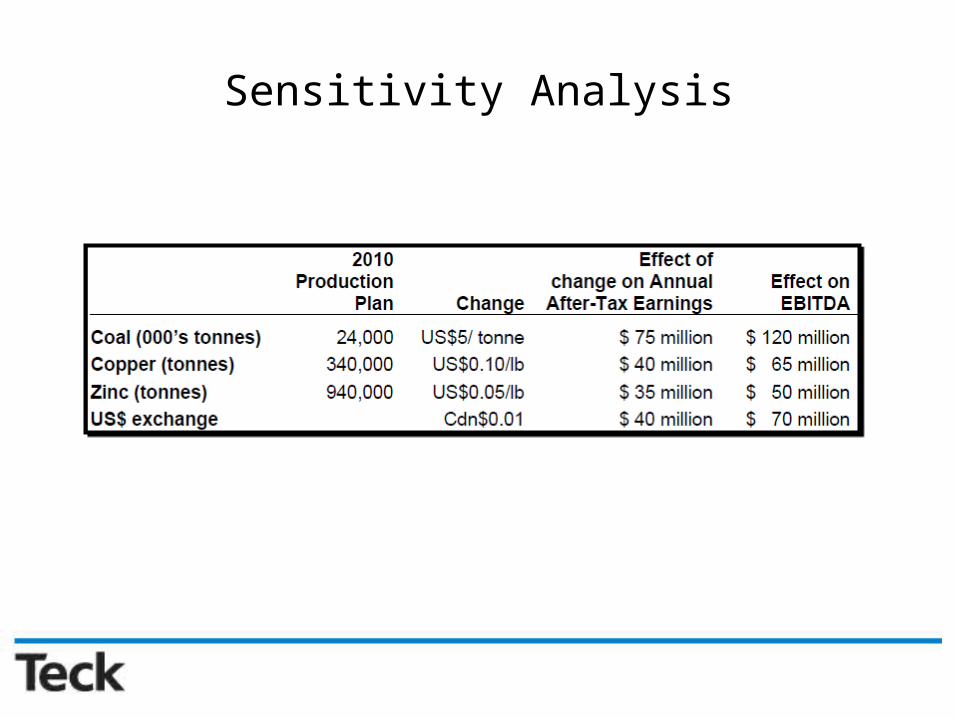
Sensitivity Analysis
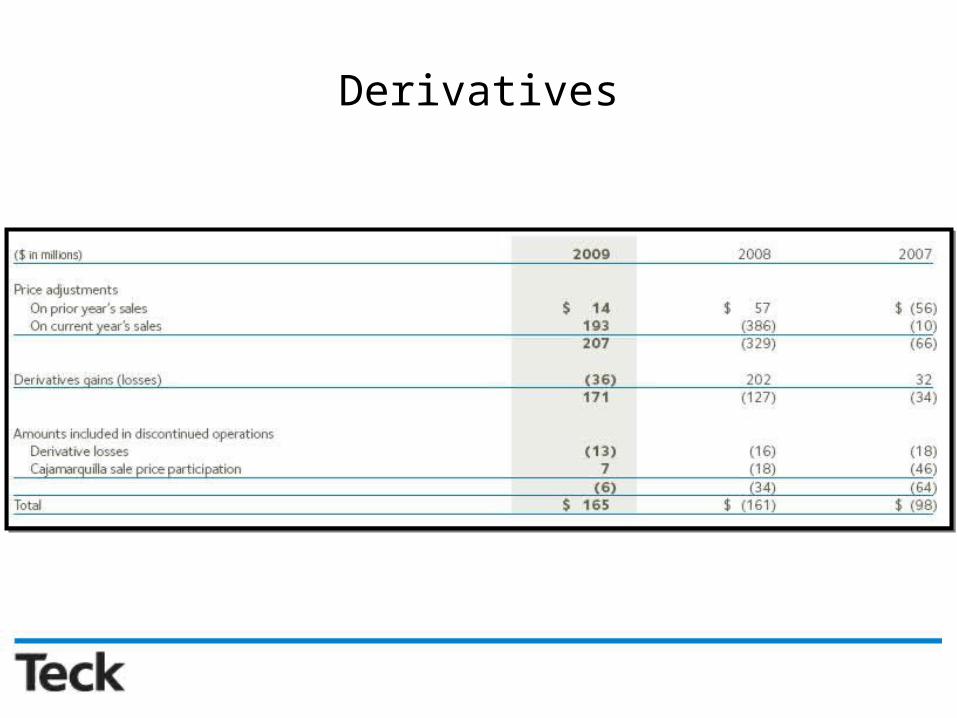
Derivatives
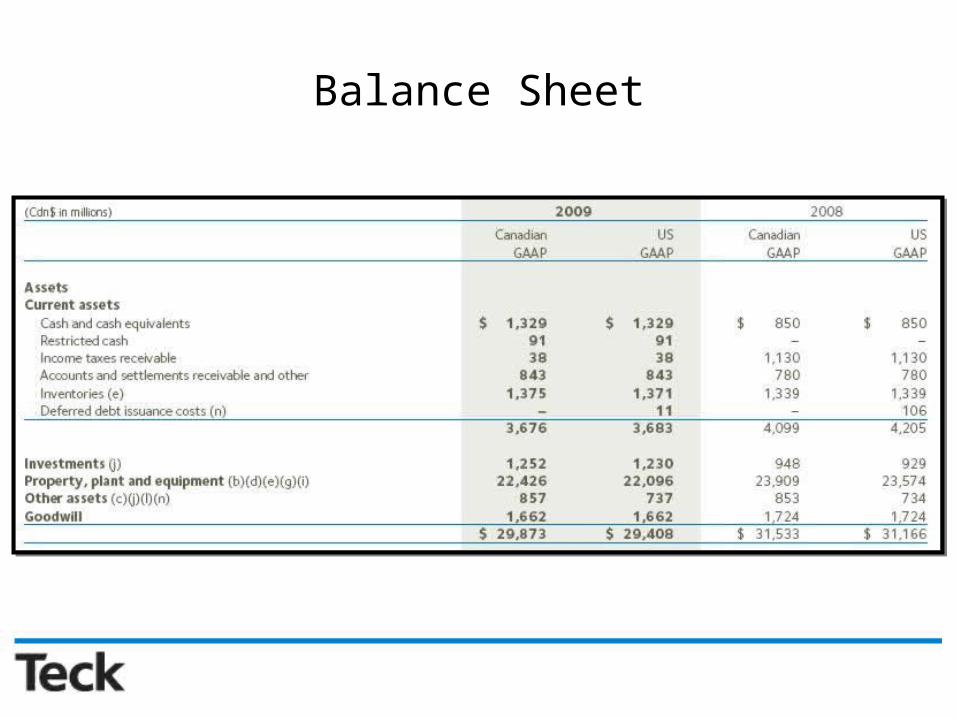
Balance Sheet
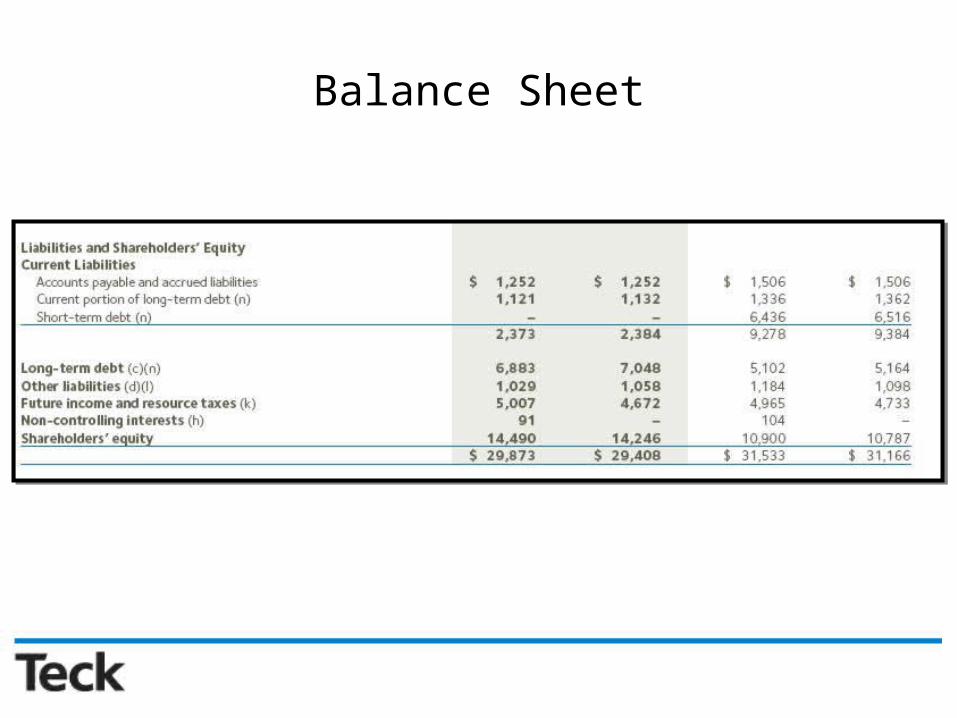
Balance Sheet
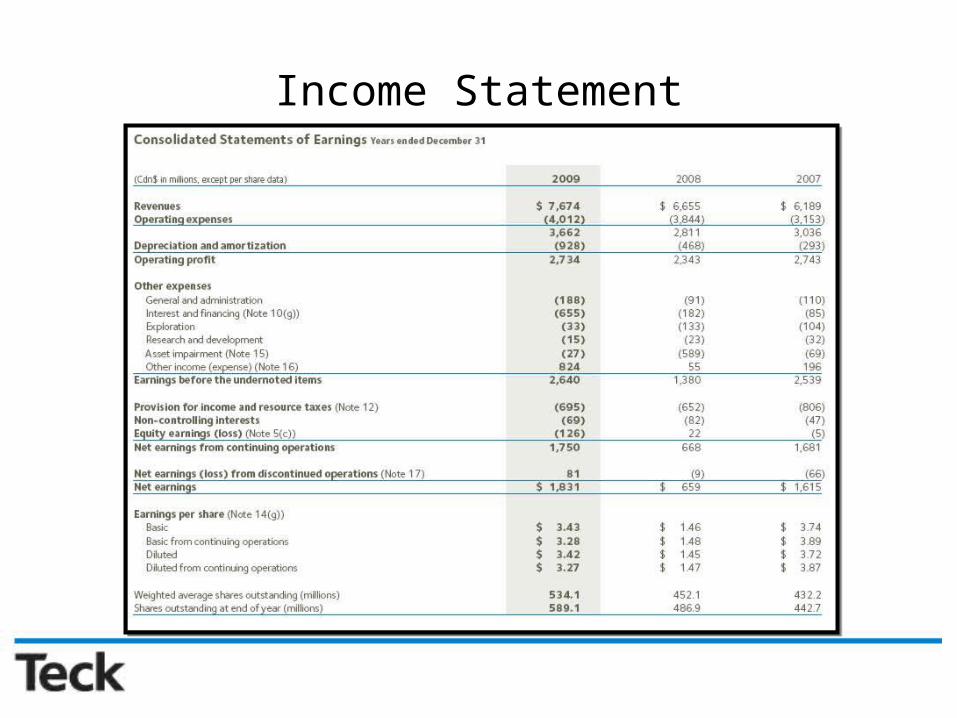
Income Statement
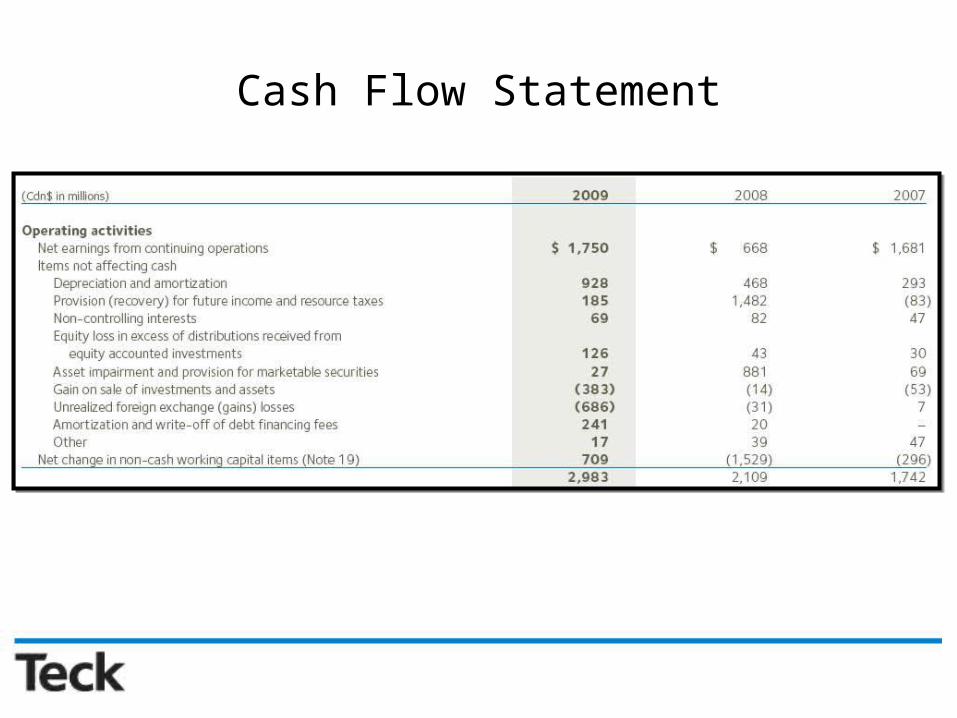
Cash Flow Statement
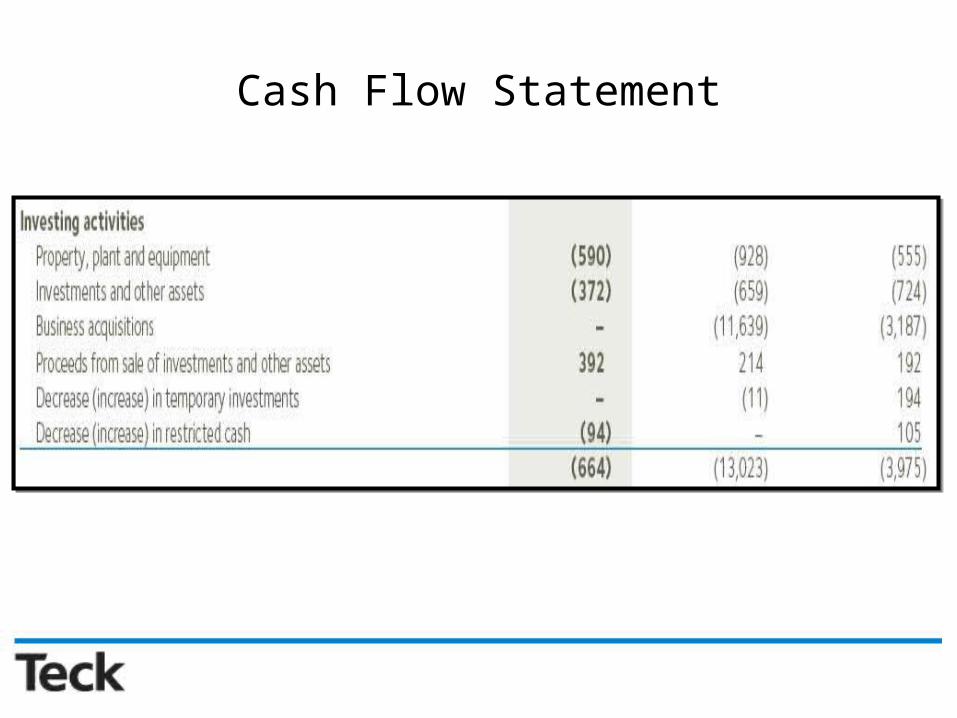
Cash Flow Statement
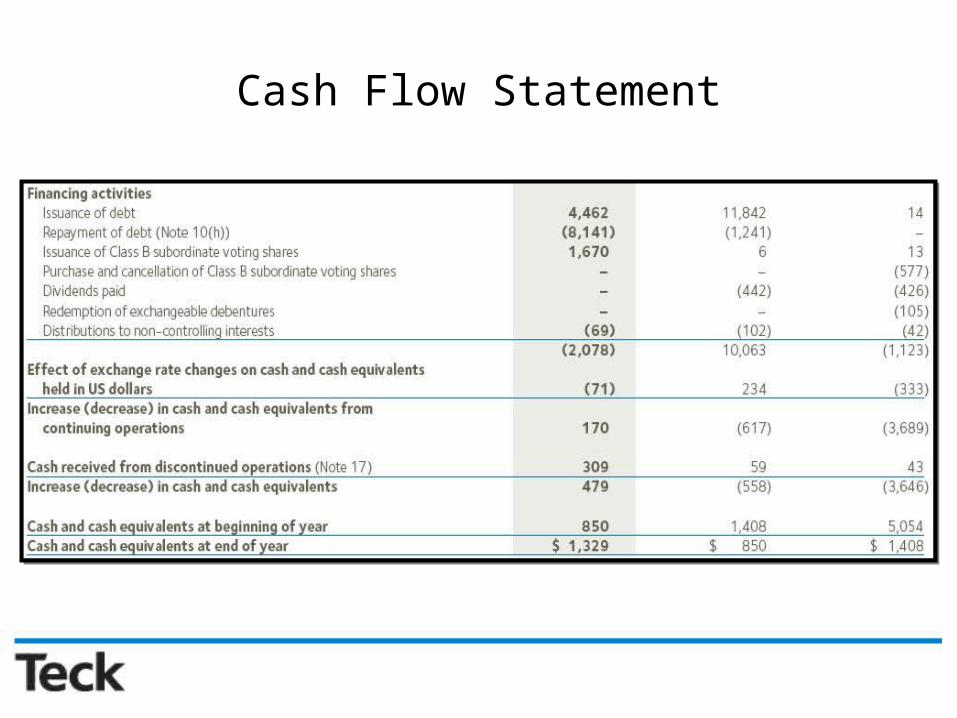
Cash Flow Statement
FREEPORT-MCMORANCOPPER & GOLD
Ticker: FCX
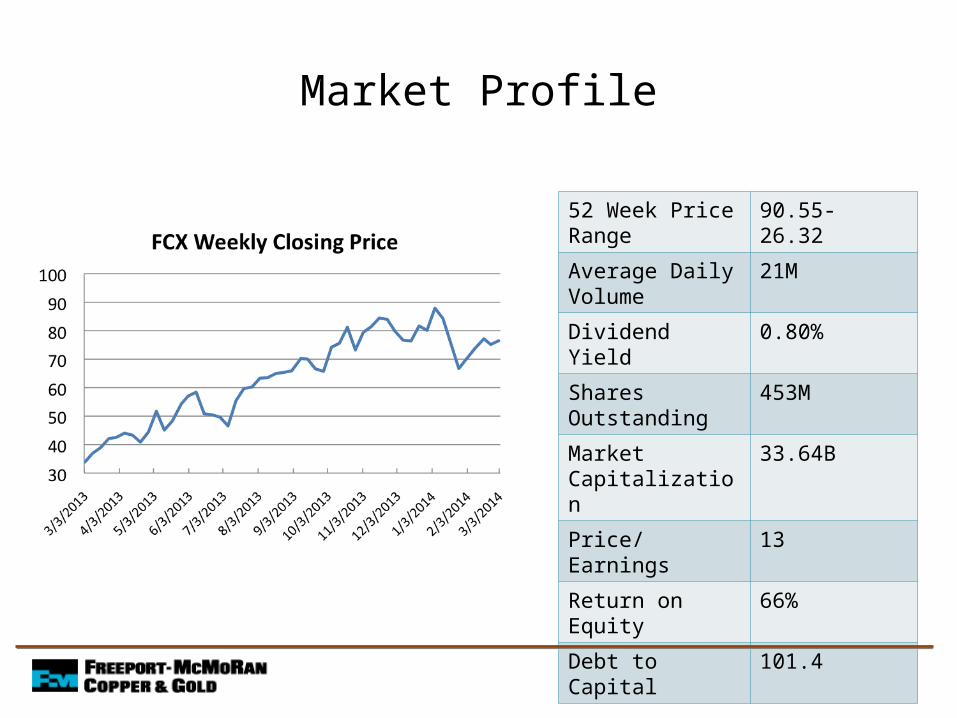
Market Profile
52 Week Price Range
90.55- 26.32
Average Daily Volume
21M
Dividend Yield 0.80%
Shares Outstanding 453M
Market Capitalization
33.64B
Price/Earnings 13
Return on Equity 66%
Debt to Capital 101.4
About Freeport-McMoRan
• World’s largest copper company • Produce copper, gold and molybdenum• Operations in North and South America, Africa and
Indonesia • Grasberg, Indonesia has largest gold and copper
mines in the world
Acquisition
• March 21, 2008 acquired Phelps Dodge• Helped solidify FCX’s copper position• Mines in North and South America and the Tenke
Fungurume minerals district in DRC Congo• Acquired Phelps Dodge’s customers and commodity
contracts
Reserves
• Recoverable and probable reservesoCopper: 104.2B poundsoGold: 37.2M ouncesoMolybdenum: 2.59B pounds
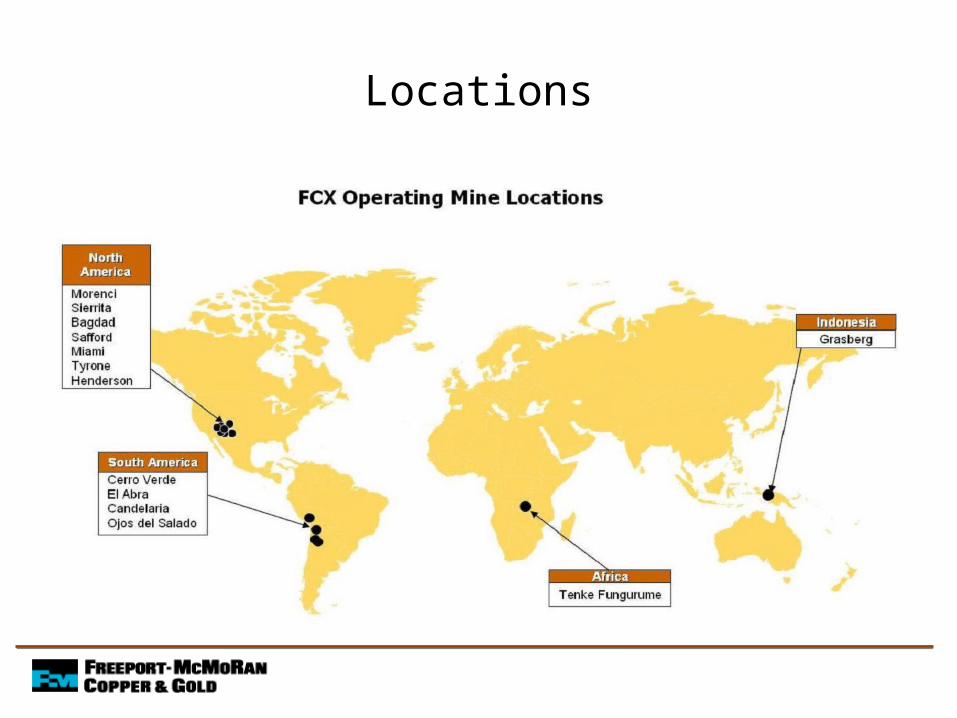
Locations
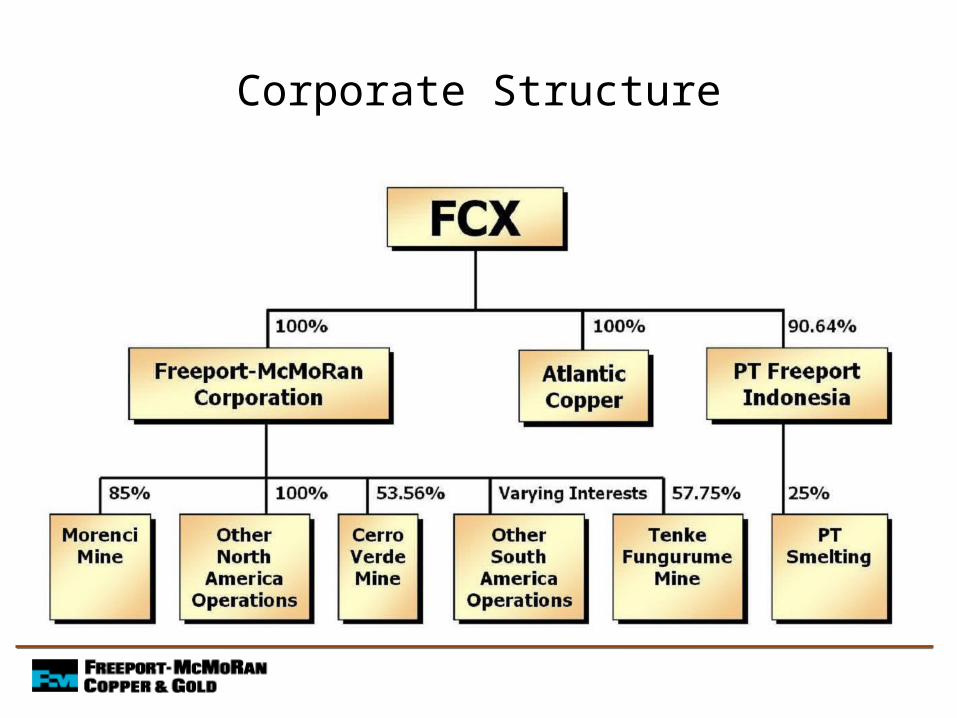
Corporate Structure
Key Products
• Copper Concentrate• Copper Cathode• Continuous Cast Copper Rod
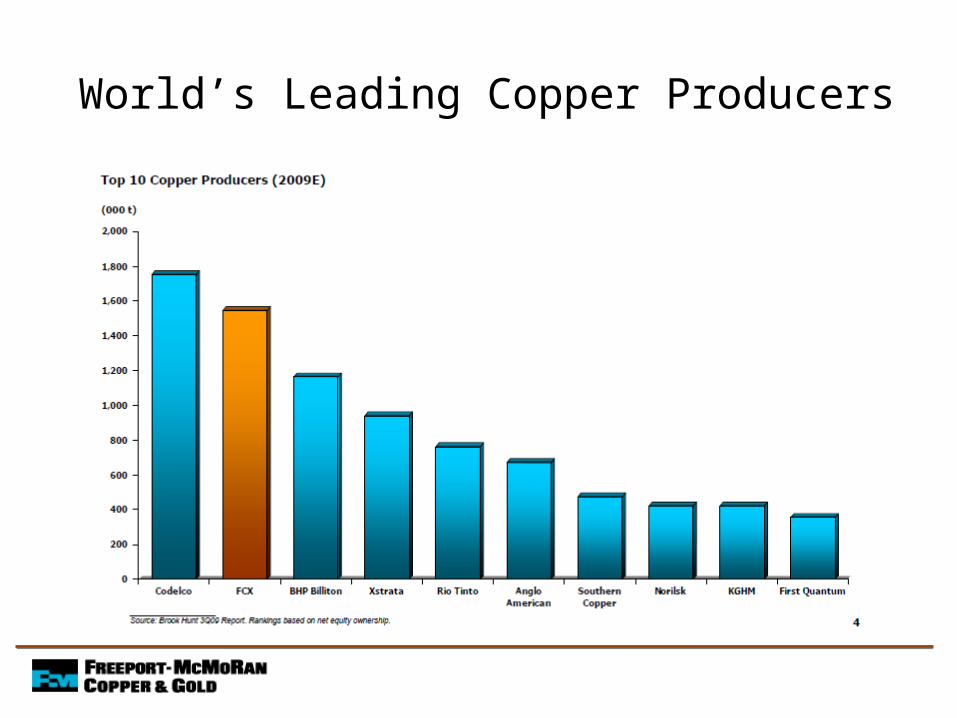
World’s Leading Copper Producers
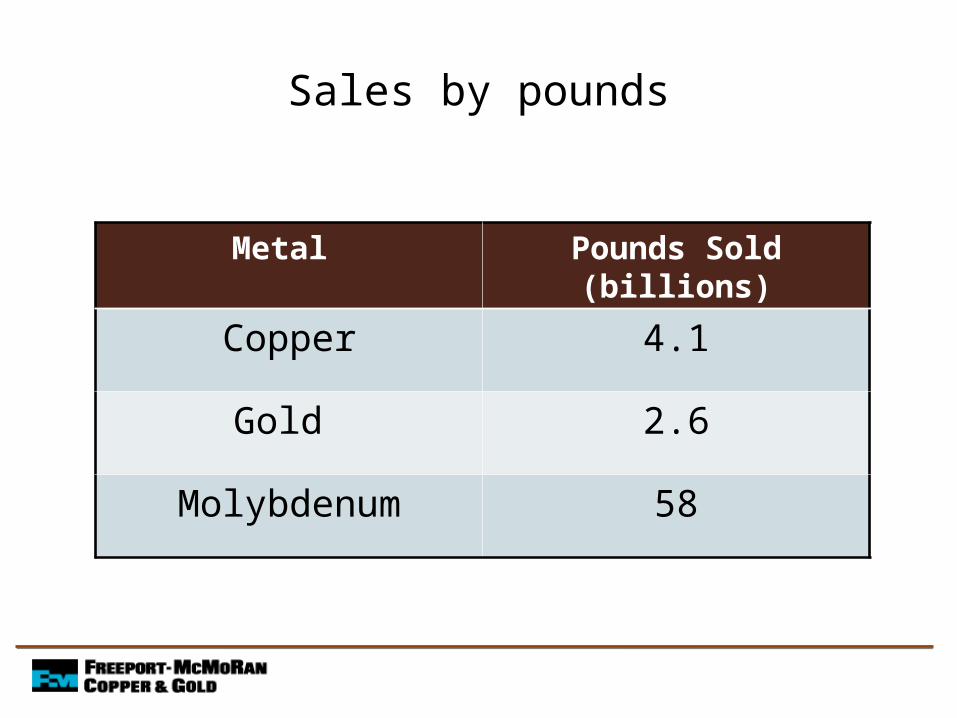
Sales by pounds
Metal Pounds Sold (billions)
Copper 4.1
Gold 2.6
Molybdenum 58
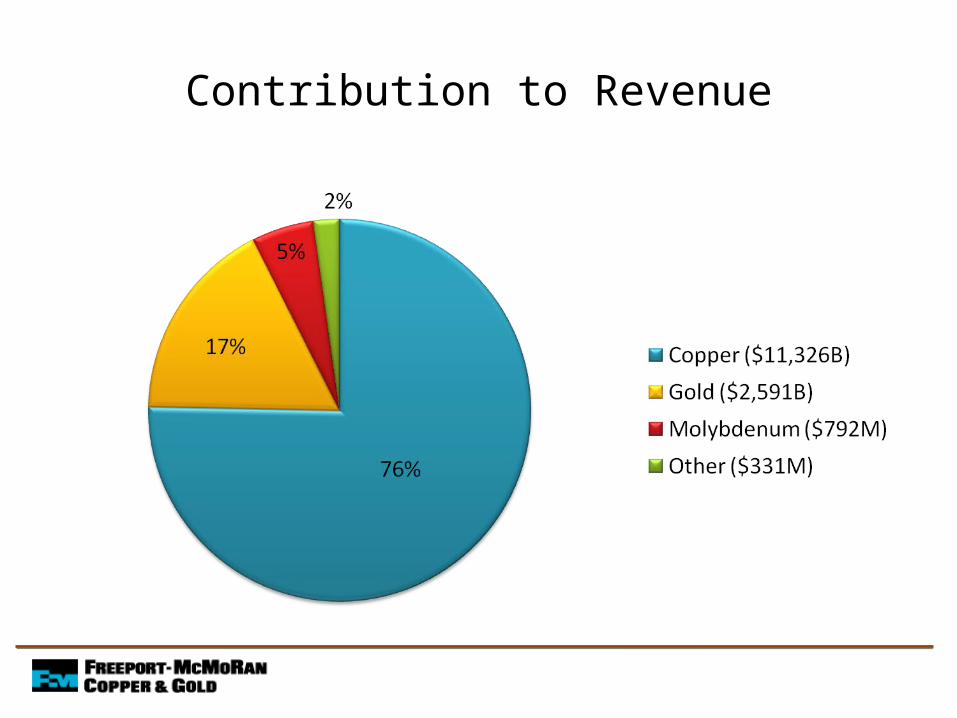
Contribution to Revenue
Risk Exposures
• Market prices for copper, gold and molybdenum
• Foreign exchange• Interest rates
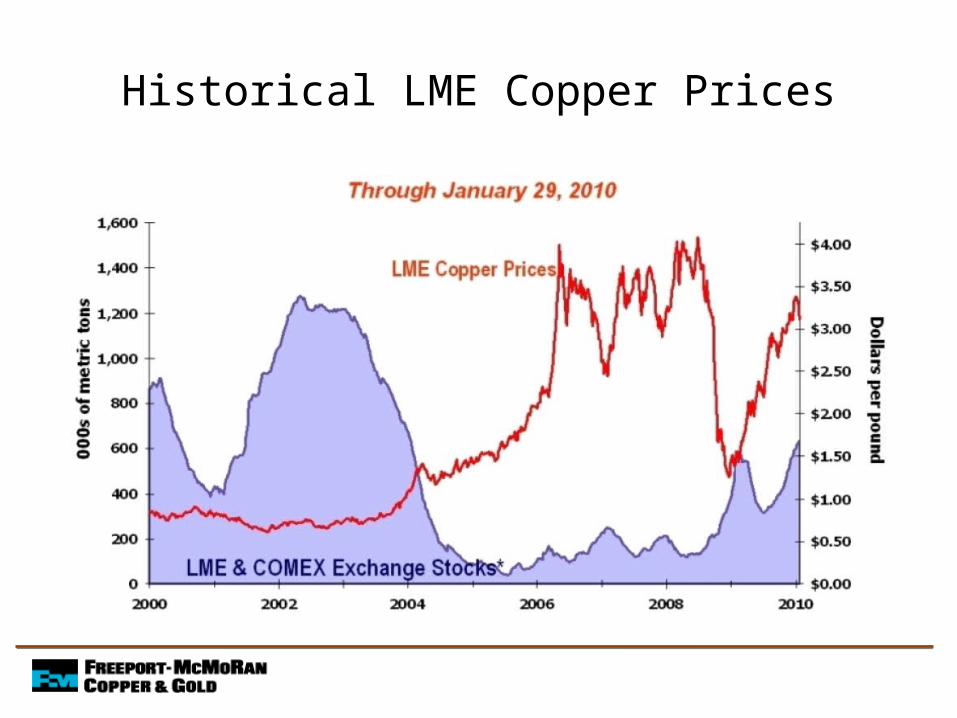
Historical LME Copper Prices
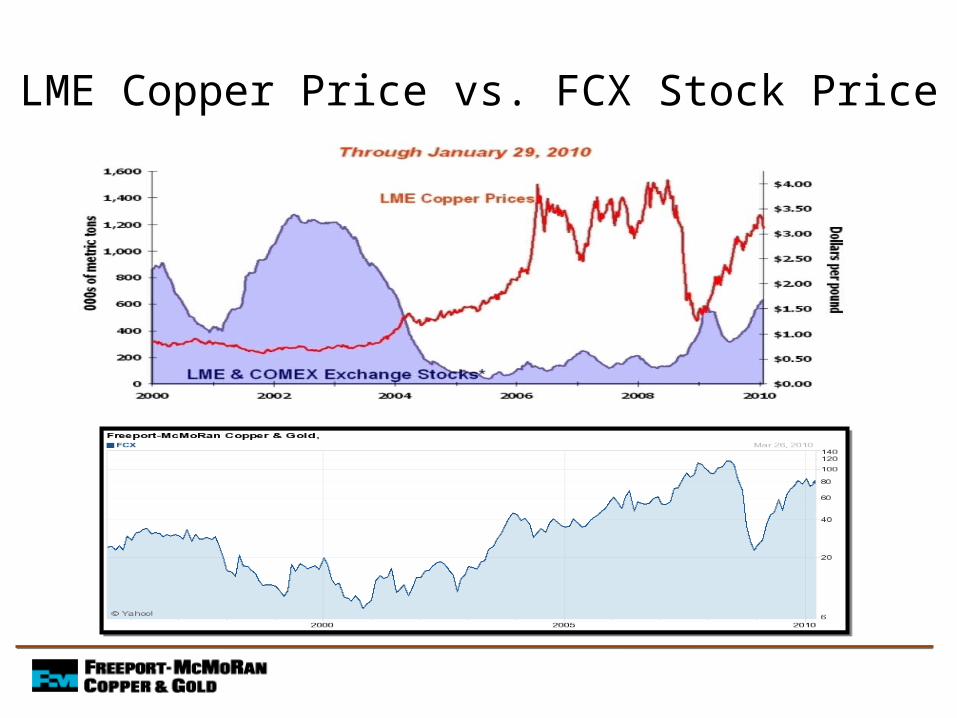
LME Copper Price vs. FCX Stock Price
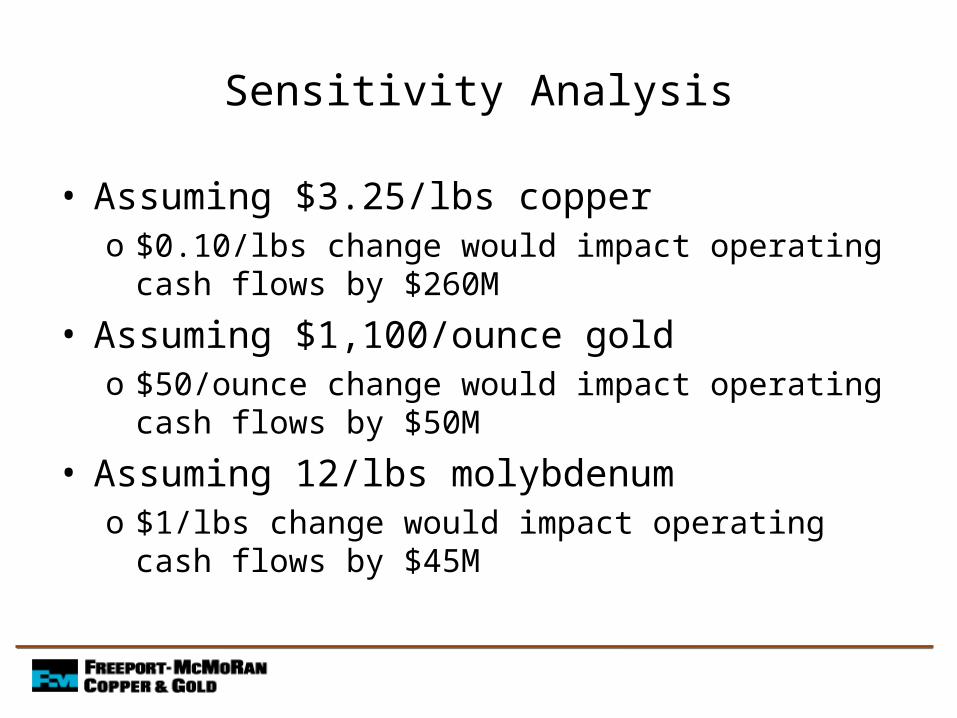
Sensitivity Analysis
• Assuming $3.25/lbs coppero $0.10/lbs change would impact operating cash flows by
$260M
• Assuming $1,100/ounce goldo $50/ounce change would impact operating cash flows by
$50M
• Assuming 12/lbs molybdenumo $1/lbs change would impact operating cash flows by $45M
Financial Instruments
“FCX does not purchase, hold or sell derivative financial instruments…”
• No price protection programs as of Dec 31/2009 and 2008
• Current positions as a result of Phelps Dodge (FMC) acquisition
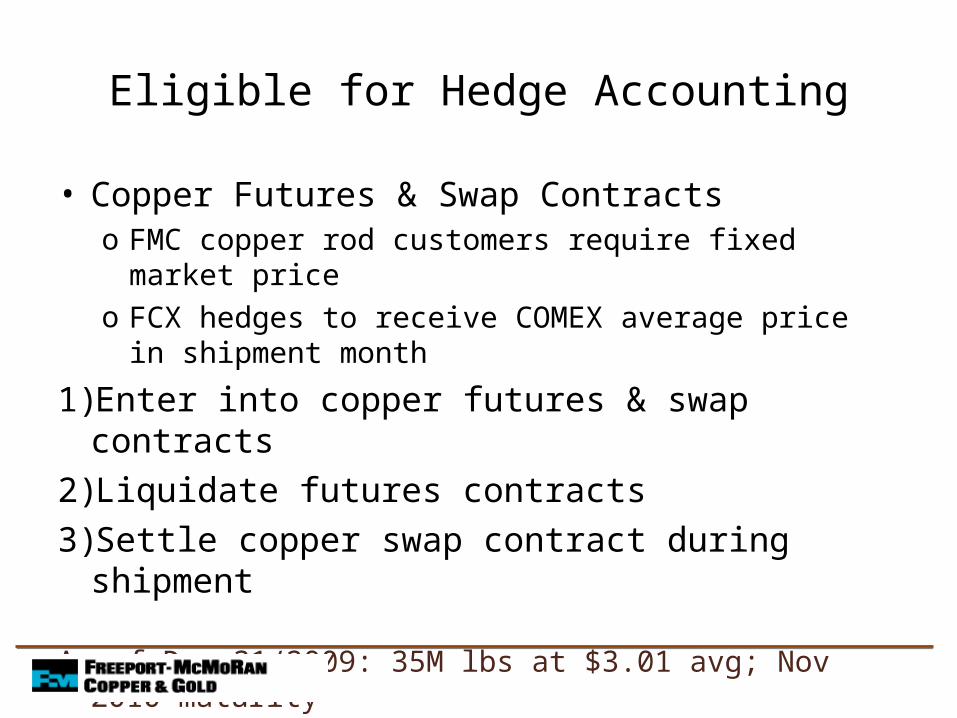
Eligible for Hedge Accounting
• Copper Futures & Swap Contractso FMC copper rod customers require fixed market priceo FCX hedges to receive COMEX average price in shipment
month
1) Enter into copper futures & swap contracts2) Liquidate futures contracts3) Settle copper swap contract during shipment
As of Dec 31/2009: 35M lbs at $3.01 avg; Nov 2010 maturity
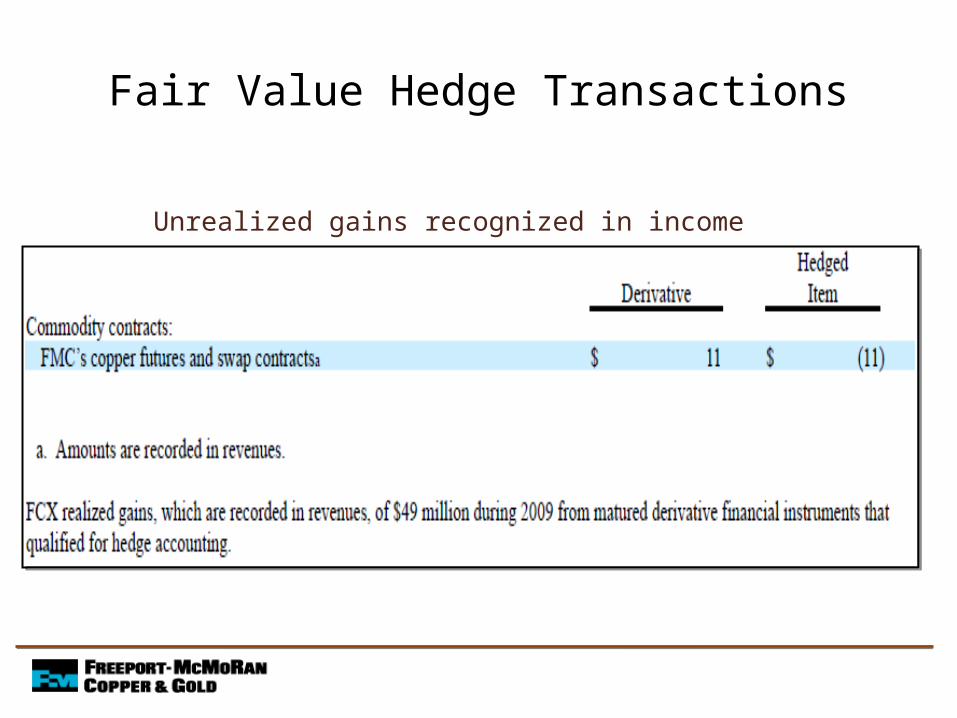
Fair Value Hedge Transactions
Unrealized gains recognized in income
Financial InstrumentsIneligible for Hedge Accounting
• Embedded Derivatives• Copper Forward Contracts• Atlantic Copper• Copper Futures & Swap Contracts• FMC Copper Collars
o Price protection
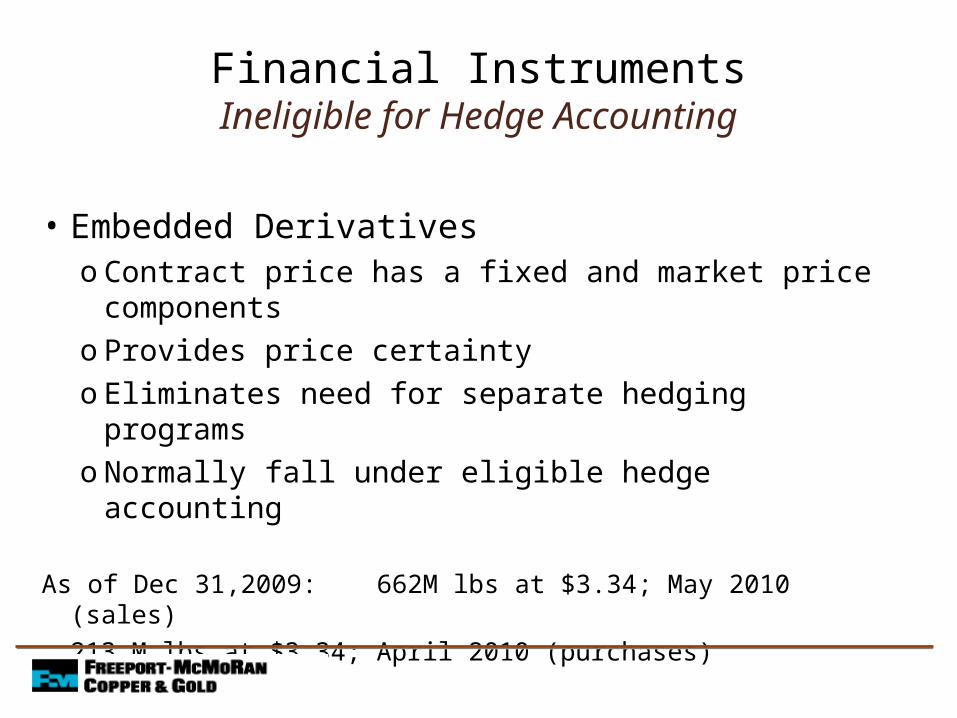
• Embedded Derivativeso Contract price has a fixed and market price
componentso Provides price certaintyo Eliminates need for separate hedging programso Normally fall under eligible hedge accounting
As of Dec 31,2009: 662M lbs at $3.34; May 2010 (sales)213 M lbs at $3.34; April 2010
(purchases)
Financial InstrumentsIneligible for Hedge Accounting
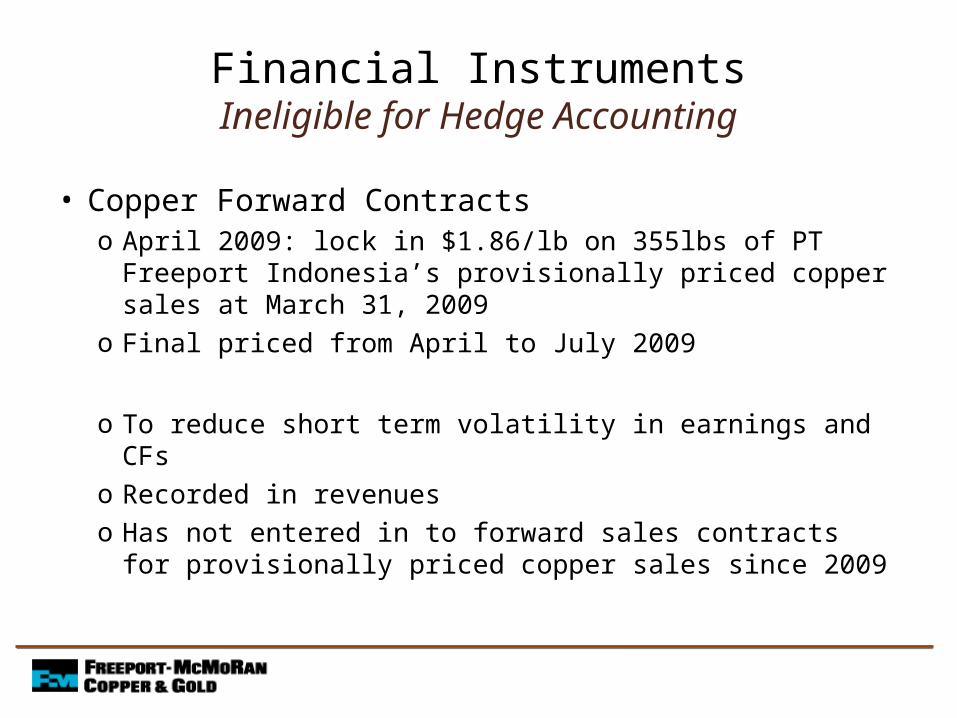
• Copper Forward Contractso April 2009: lock in $1.86/lb on 355lbs of PT Freeport
Indonesia’s provisionally priced copper sales at March 31, 2009
o Final priced from April to July 2009
o To reduce short term volatility in earnings and CFso Recorded in revenueso Has not entered in to forward sales contracts for
provisionally priced copper sales since 2009
Financial InstrumentsIneligible for Hedge Accounting
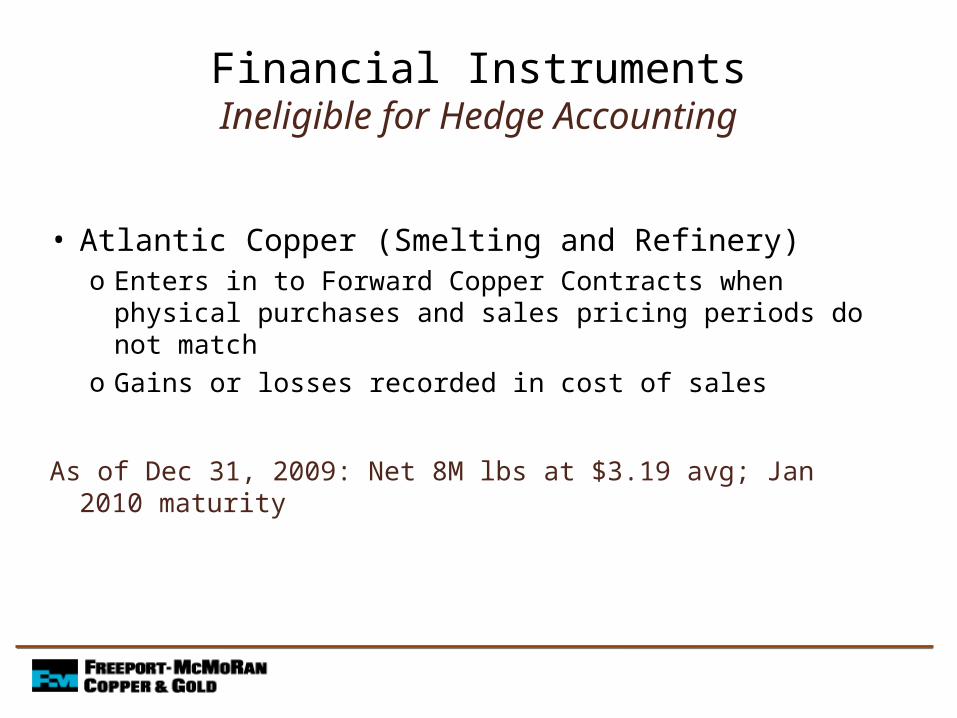
• Atlantic Copper (Smelting and Refinery)o Enters in to Forward Copper Contracts when physical
purchases and sales pricing periods do not matcho Gains or losses recorded in cost of sales
As of Dec 31, 2009: Net 8M lbs at $3.19 avg; Jan 2010 maturity
Financial InstrumentsIneligible for Hedge Accounting
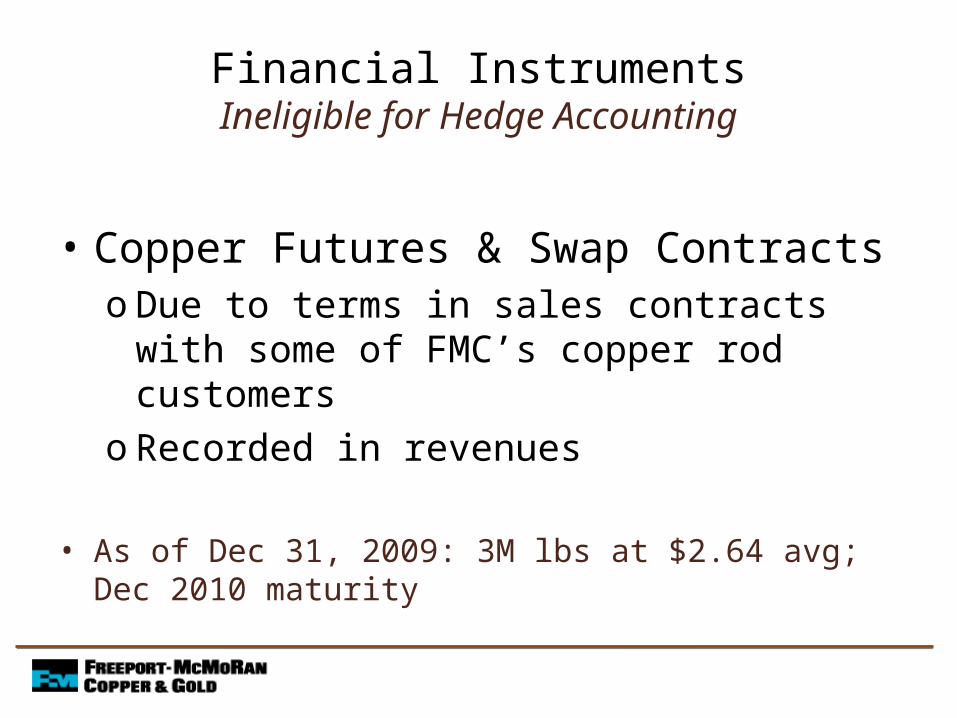
• Copper Futures & Swap Contracts o Due to terms in sales contracts with some of
FMC’s copper rod customerso Recorded in revenues
• As of Dec 31, 2009: 3M lbs at $2.64 avg; Dec 2010 maturity
Financial InstrumentsIneligible for Hedge Accounting
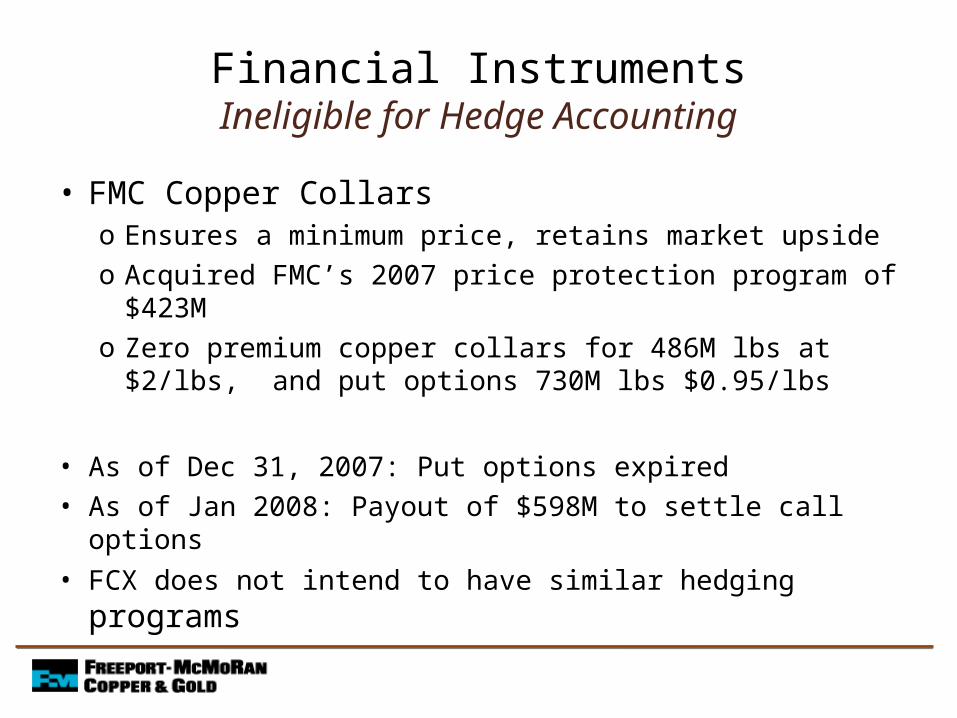
• FMC Copper Collarso Ensures a minimum price, retains market upsideo Acquired FMC’s 2007 price protection program of $423Mo Zero premium copper collars for 486M lbs at $2/lbs, and
put options 730M lbs $0.95/lbs
• As of Dec 31, 2007: Put options expired• As of Jan 2008: Payout of $598M to settle call options
• FCX does not intend to have similar hedging programs
Financial InstrumentsIneligible for Hedge Accounting
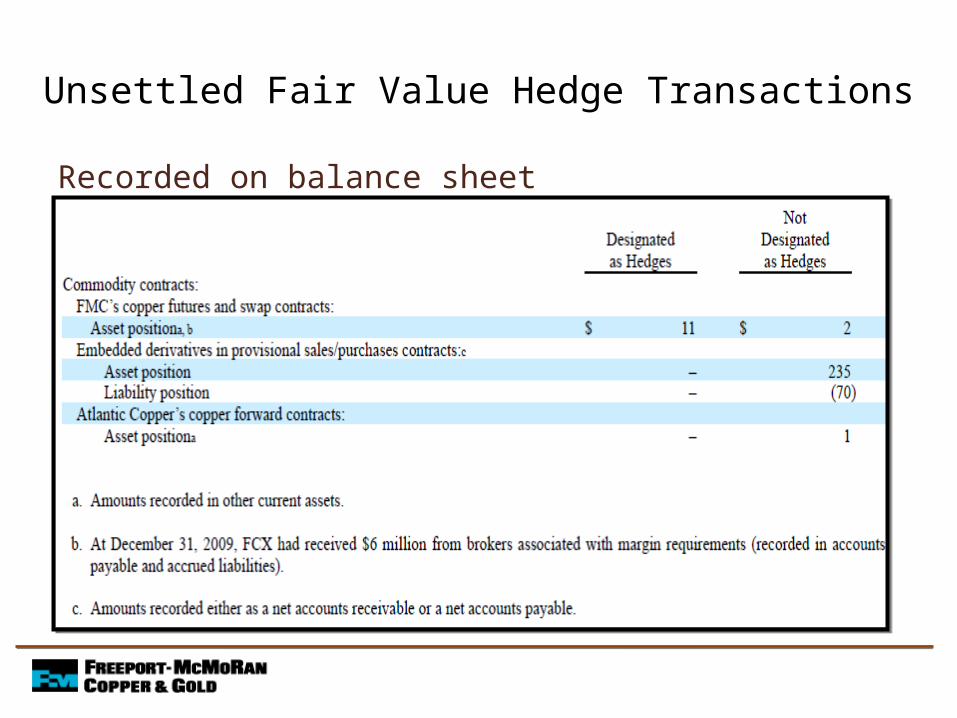
Unsettled Fair Value Hedge Transactions
Recorded on balance sheet
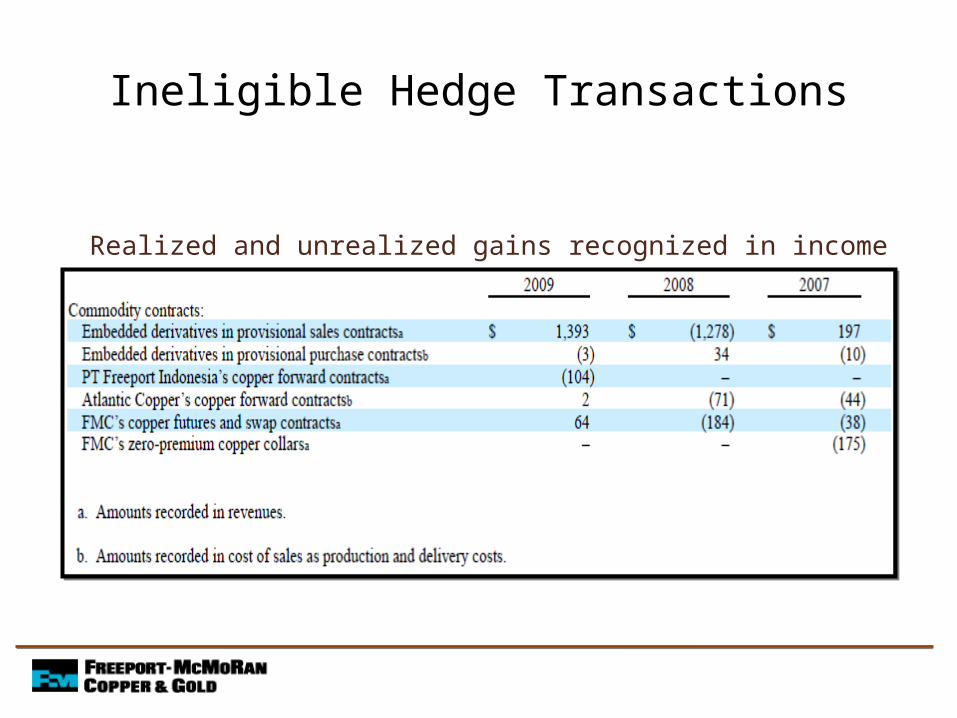
Ineligible Hedge Transactions
Realized and unrealized gains recognized in income
Financial Instruments
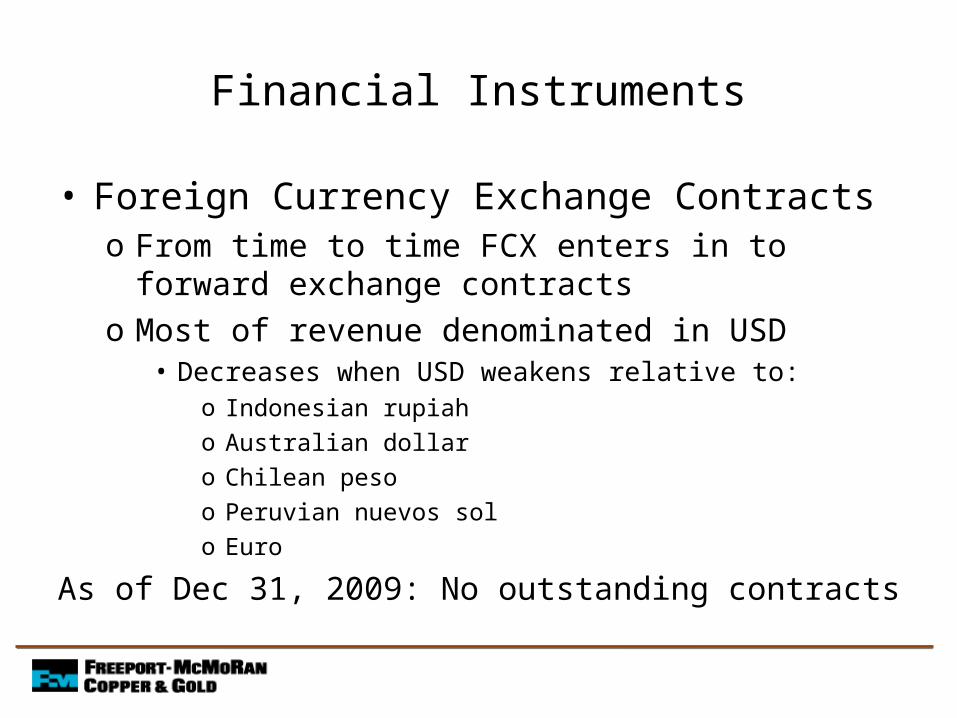
• Foreign Currency Exchange Contractso From time to time FCX enters in to forward exchange
contractso Most of revenue denominated in USD
• Decreases when USD weakens relative to:o Indonesian rupiaho Australian dollaro Chilean pesoo Peruvian nuevos solo Euro
As of Dec 31, 2009: No outstanding contracts
Financial Instruments
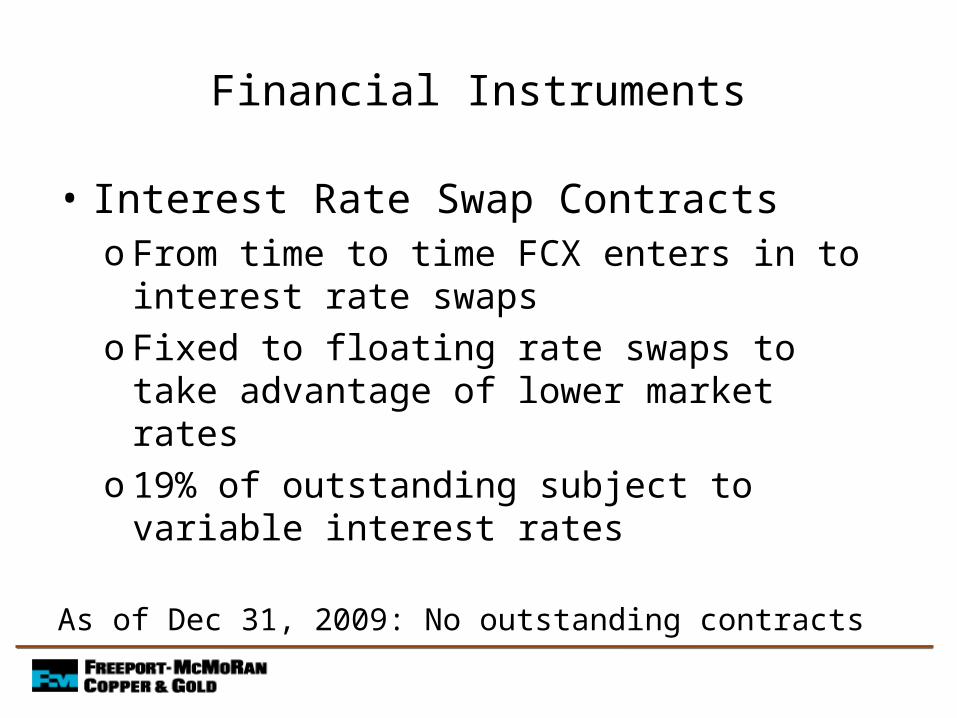
• Interest Rate Swap Contractso From time to time FCX enters in to interest rate
swapso Fixed to floating rate swaps to take advantage of
lower market rateso 19% of outstanding subject to variable interest
rates
As of Dec 31, 2009: No outstanding contracts
Stock-Based Compensation
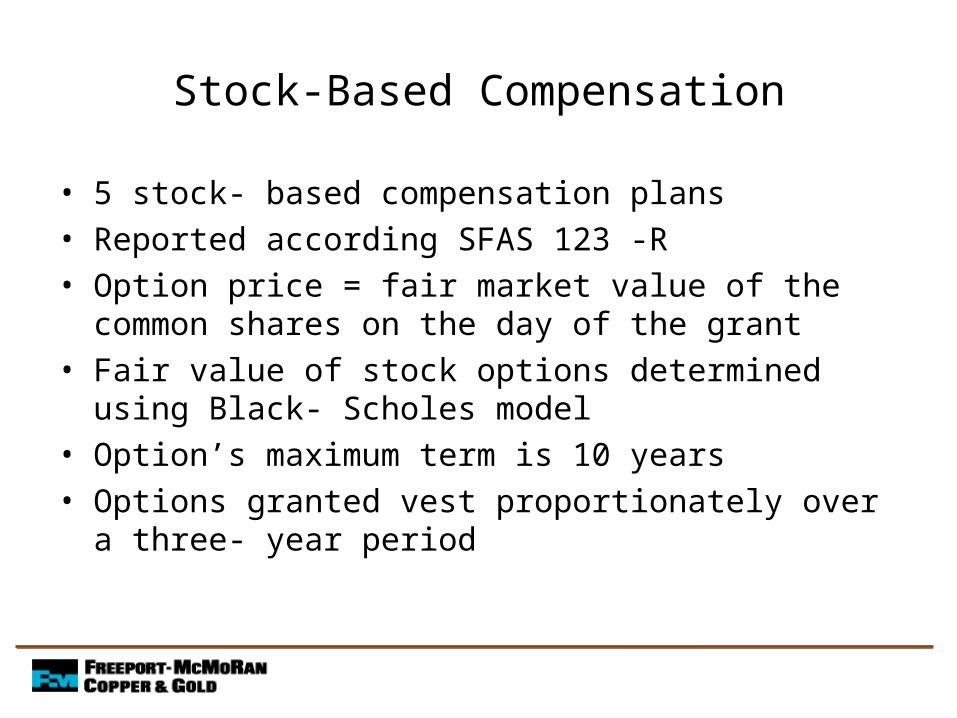
• 5 stock- based compensation plans• Reported according SFAS 123 -R• Option price = fair market value of the common shares on the
day of the grant• Fair value of stock options determined using Black- Scholes
model• Option’s maximum term is 10 years• Options granted vest proportionately over a three- year
period
Stock-Based Compensation
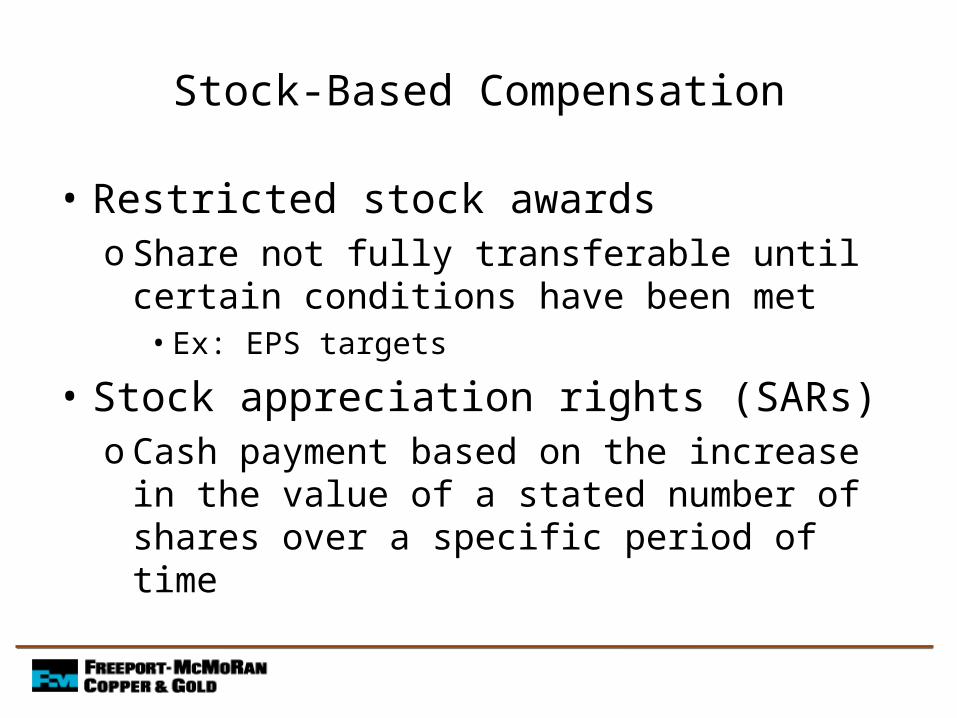
• Restricted stock awardso Share not fully transferable until certain
conditions have been met• Ex: EPS targets
• Stock appreciation rights (SARs) o Cash payment based on the increase in the value
of a stated number of shares over a specific period of time
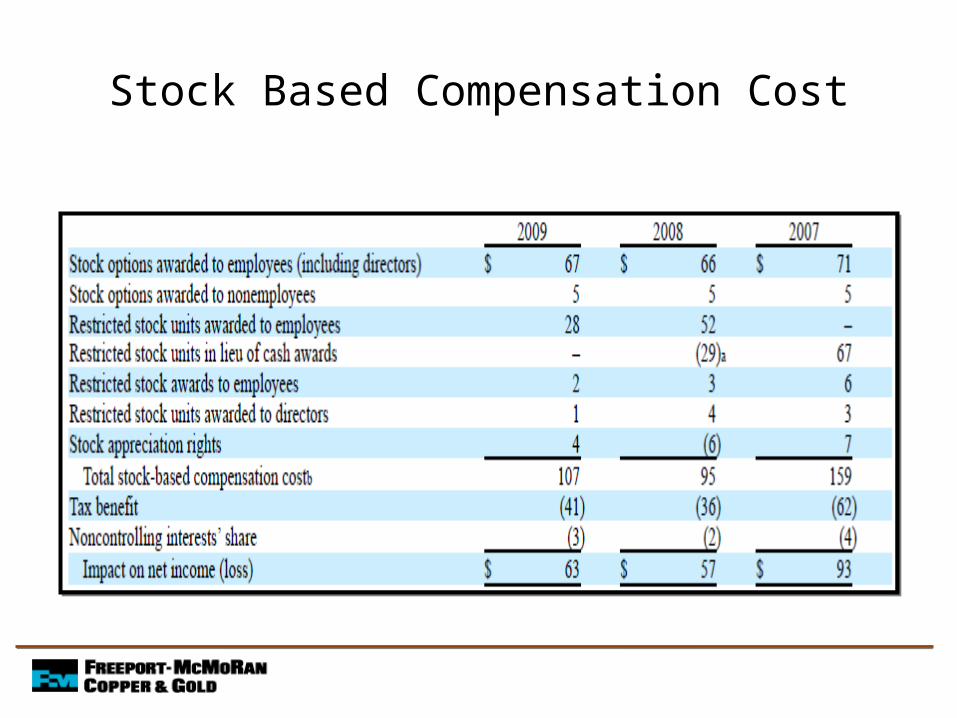
Stock Based Compensation Cost
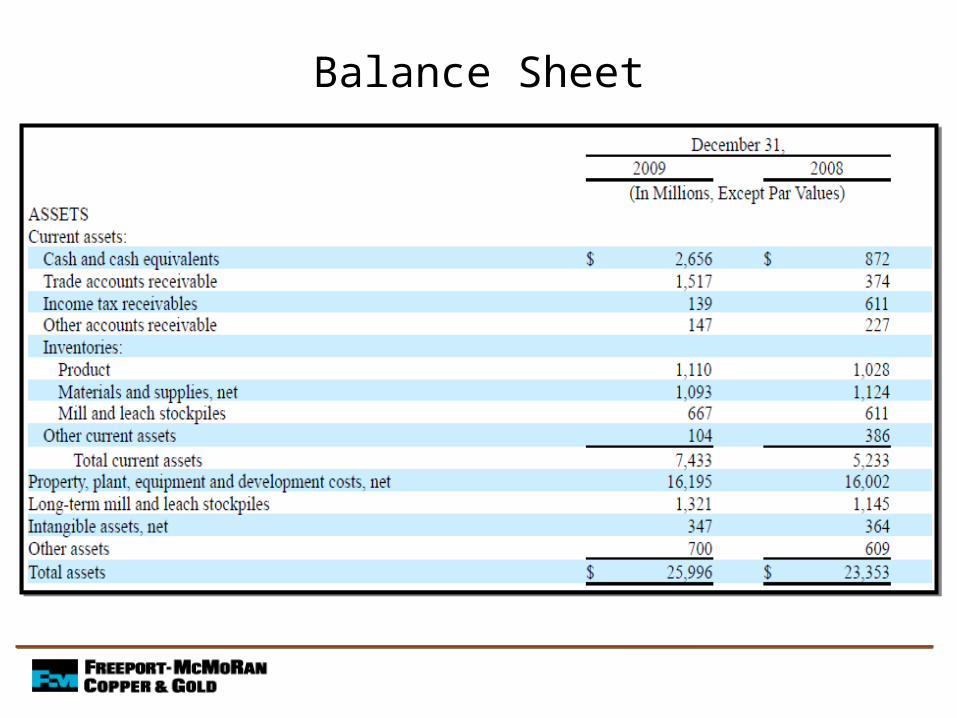
Balance Sheet
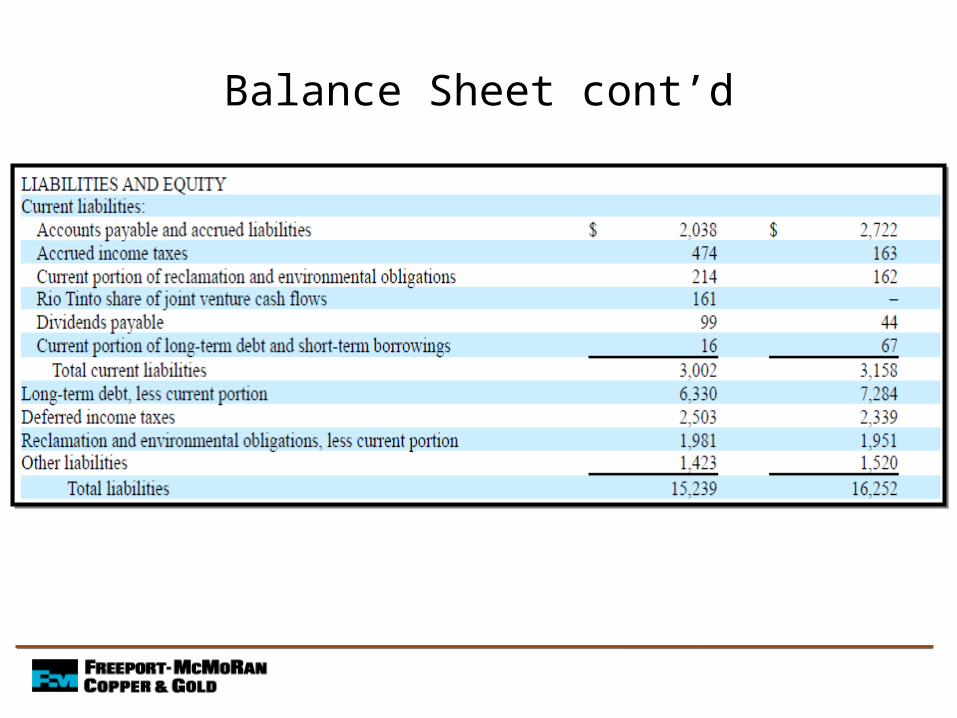
Balance Sheet cont’d
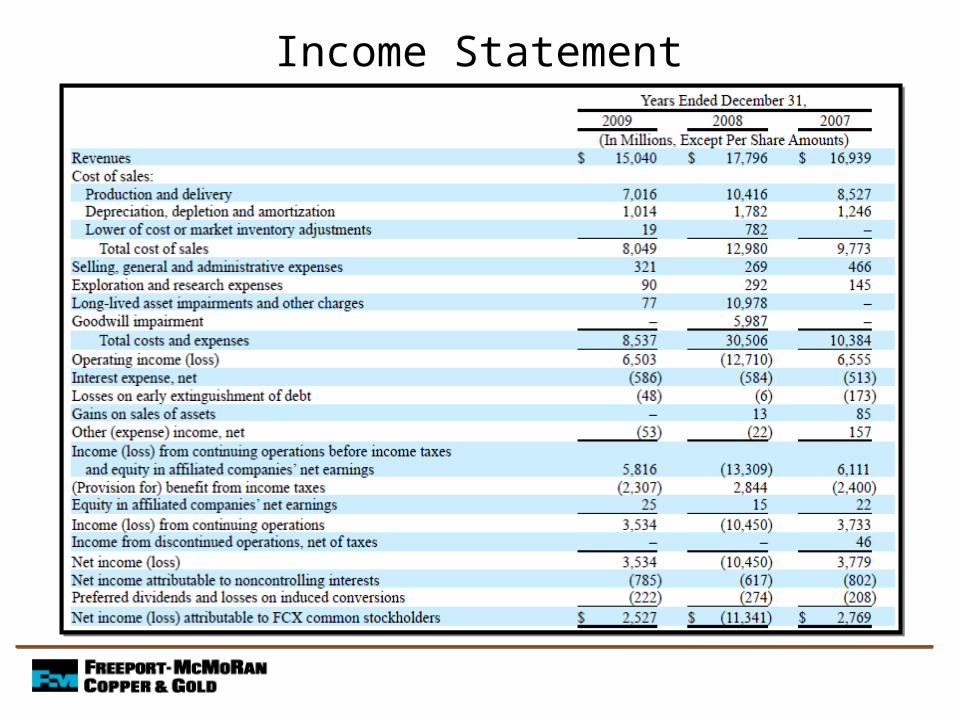
Income Statement
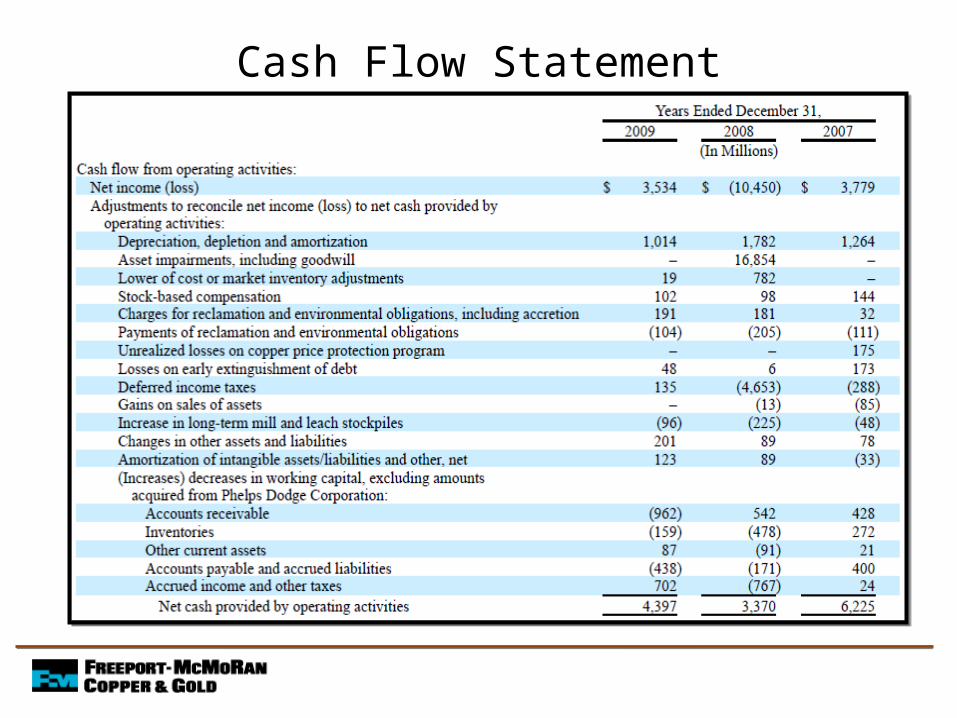
Cash Flow Statement
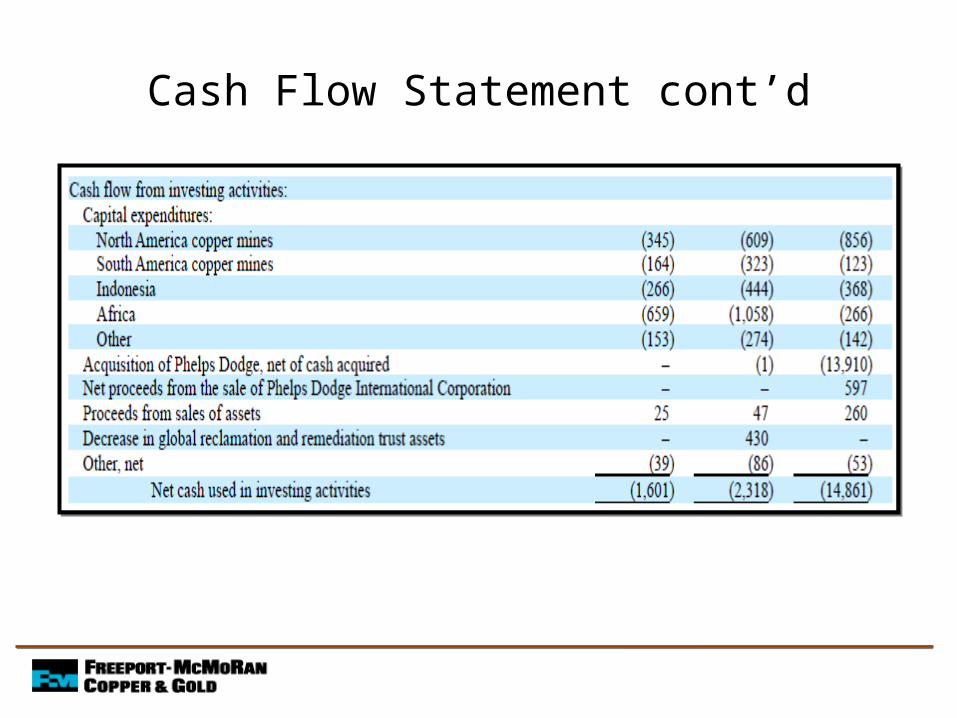
Cash Flow Statement cont’d
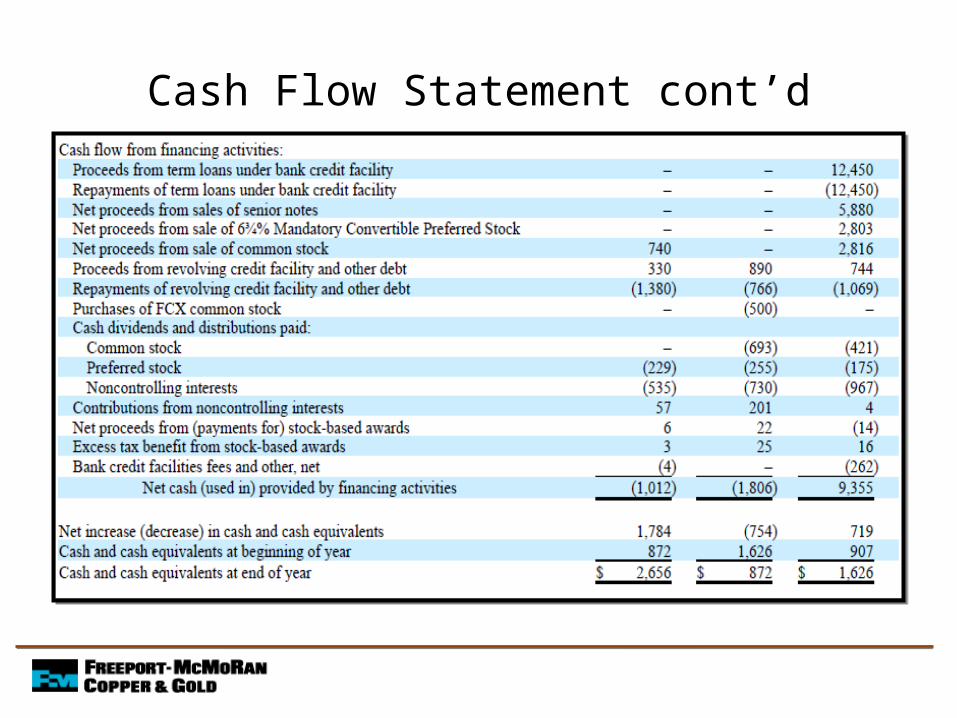
Cash Flow Statement cont’d
About
• It formed from a merger between BHP and Billiton• The world’s largest diversified natural resources
company. • We have 40,990 employees and 58,000 contractors
working in more than 100 operations in over 25 countries.
• The world’s third largest producer of copper, and a leading producer of lead and zinc.
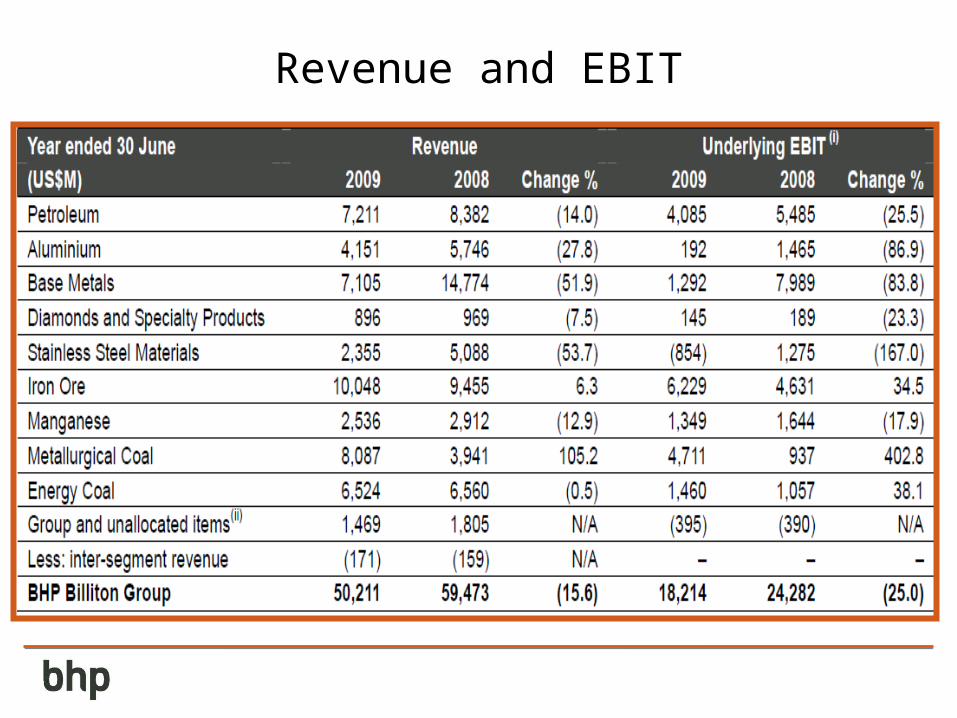
Revenue and EBIT
Risk Factors
• Commodity prices fluctuations• Currency exchange rate• Reserves • Chinese demand • Government actions and political events• Environmental impacts
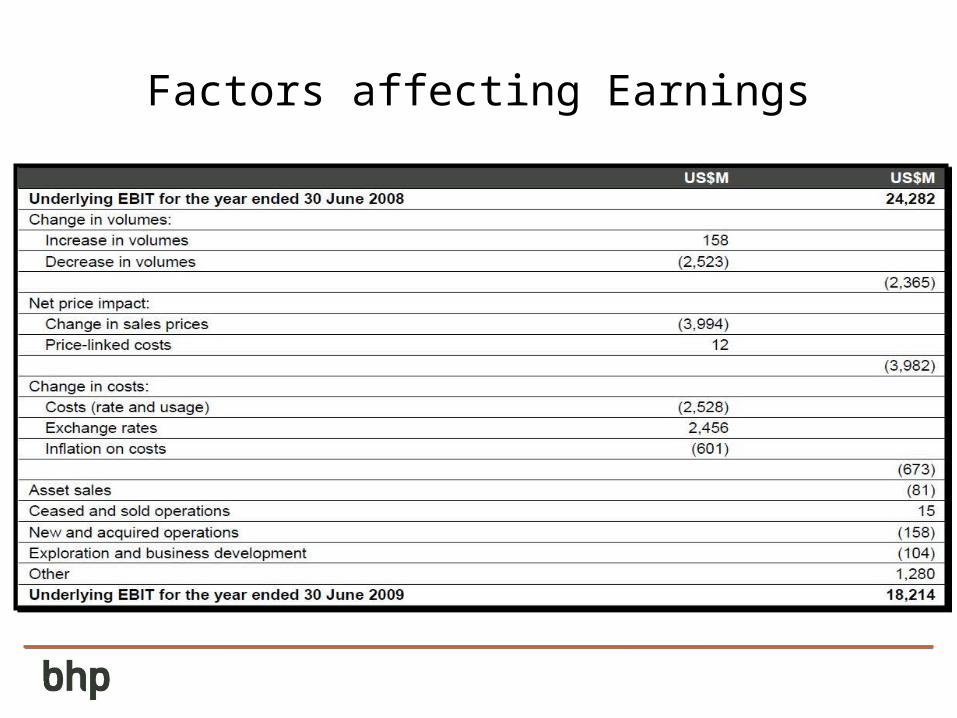
Factors affecting Earnings
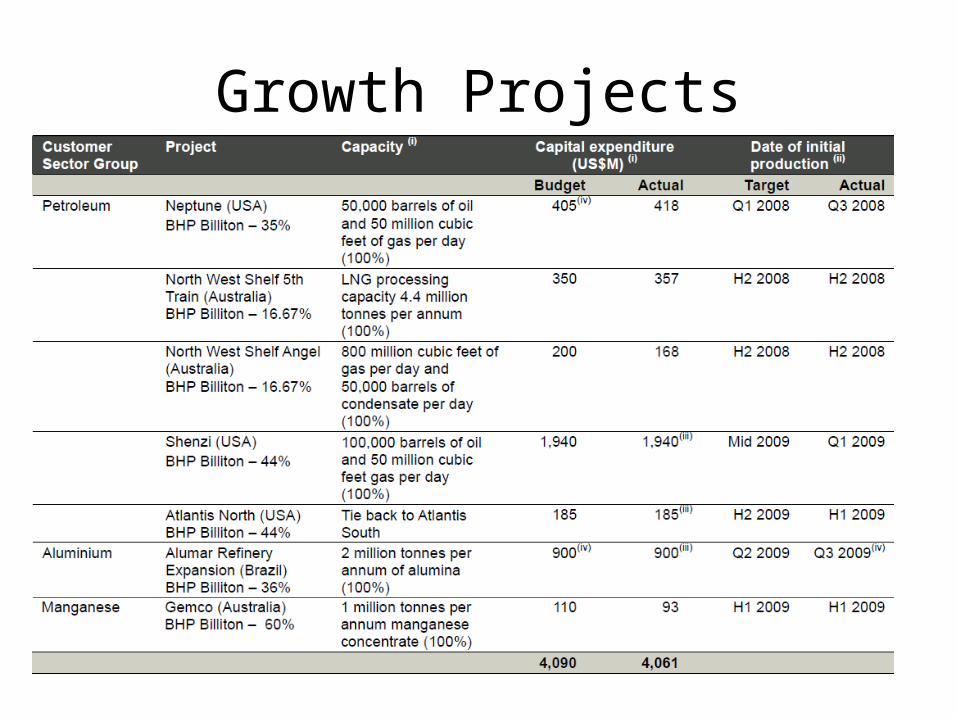
Growth Projects
Risk Exposure
• Liquidity risk
• Credit risk
• Market risk (Currency risk, interest rate risk)
• Fair value
Liquidity Risk
• Arises from the possibility that it may not be able to settle or meet its obligations as they fall due.
• Strong liquidity position with US$8.4 billion of cash on hand, and is supported by the solid A credit rating.
Credit risk
• Arises from the non-performance by counterparties of their contractual financial obligations towards the Company.
• The BHP Billiton Group maintains group-wide procedures covering the application for credit approvals, granting and renewal of counterparty limits and daily monitoring of exposures against these limits.
• The maximum exposure to credit risk is limited to the total carrying value of relevant financial assets on the balance sheet as at the reporting date.
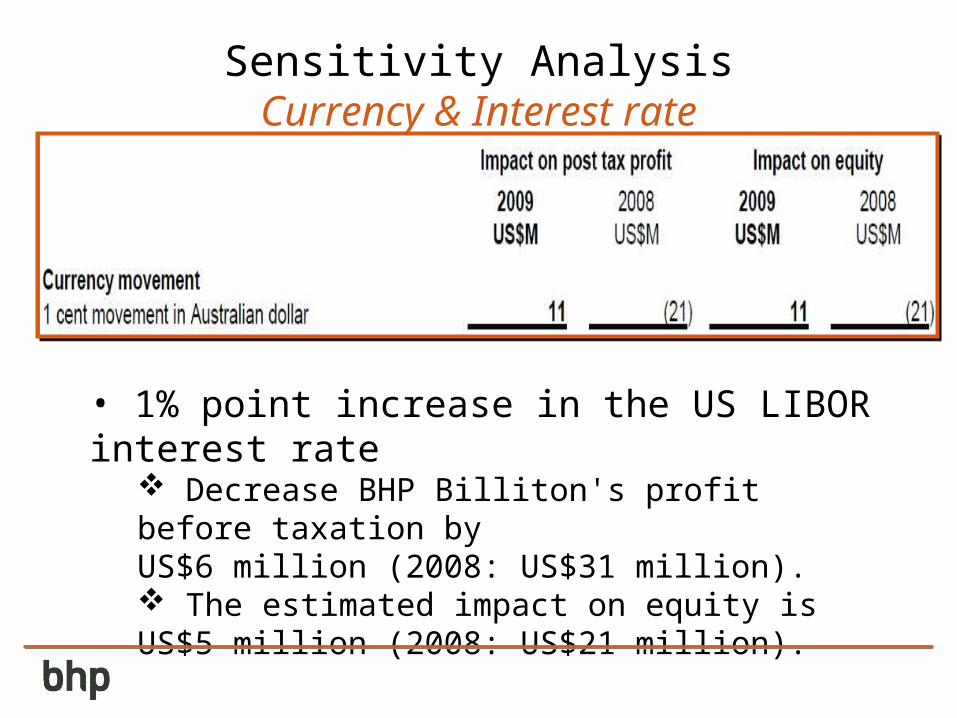
Sensitivity AnalysisCurrency & Interest rate
• 1% point increase in the US LIBOR interest rate
Decrease BHP Billiton's profit before taxation by US$6 million (2008: US$31 million). The estimated impact on equity is US$5 million (2008: US$21 million).
Financial Instruments eligible for Hedge Accounting
• Interest rate swaps held for hedging purposes are generally accounted for as fair value hedges
• Forward exchange contracts held for hedging purposes are generally accounted for as cash flow hedges.
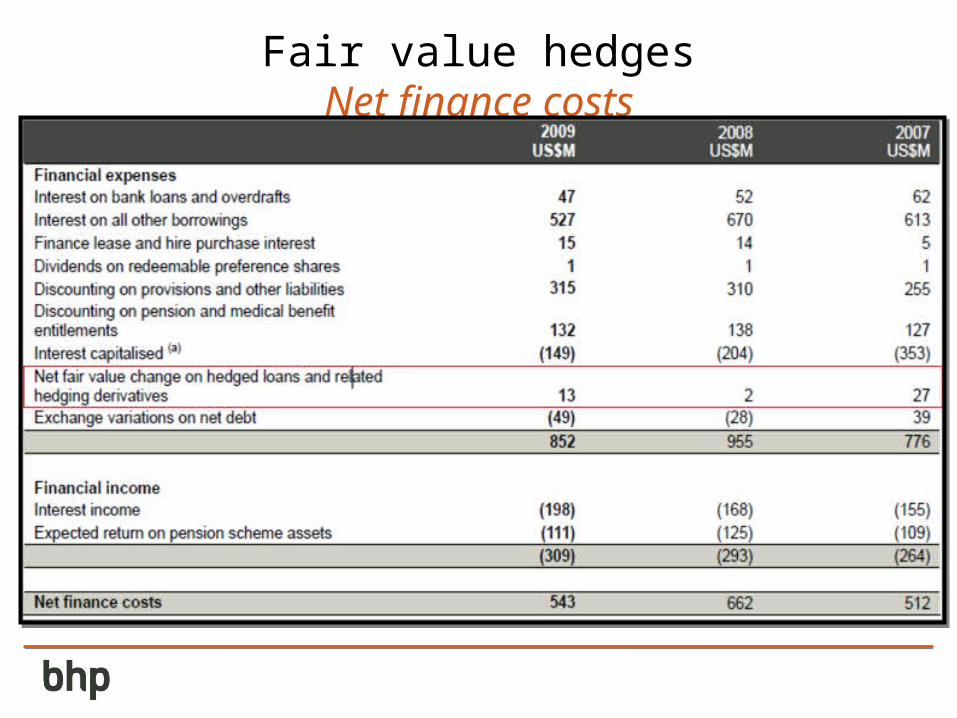
Fair value hedgesNet finance costs
Cash Flow hedges
• The effective portion of changes in the fair value of derivatives as cash flow hedges is recognized in equity.
• The gain or loss relating to the ineffective portion is recognized in the income statement.
• When the hedged item affects profit or loss, amounts in equity are recycled in the income statement.
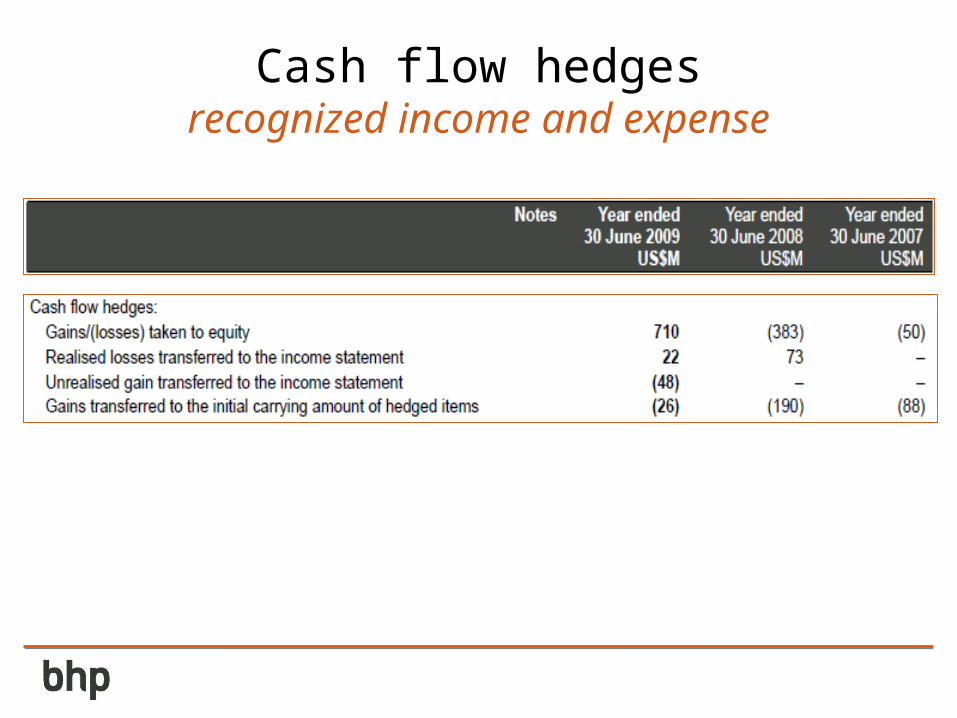
Cash flow hedgesrecognized income and expense
Financial instrumentsIneligible for Hedge Accounting
Available for sale and trading investments
- They measure at fair value- Gains and losses on the remeasurement of trading
investments are recognized in the income statement- Gains and losses on the remeasurement of available for sale
investments are recognized in equity, and in the income statement when realized by sale or redemption
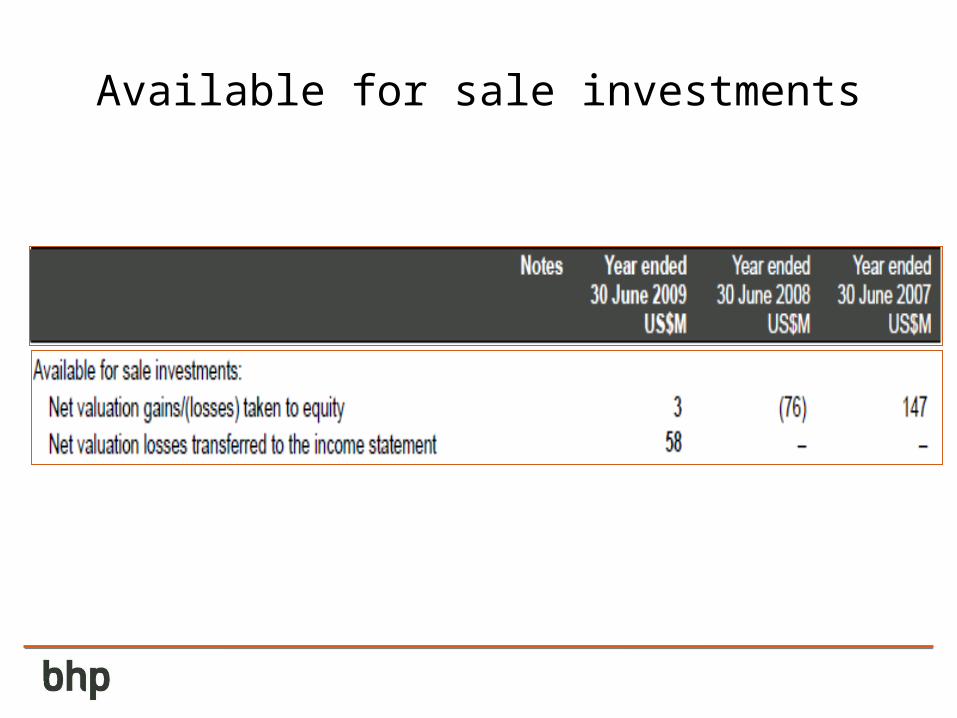
Available for sale investments
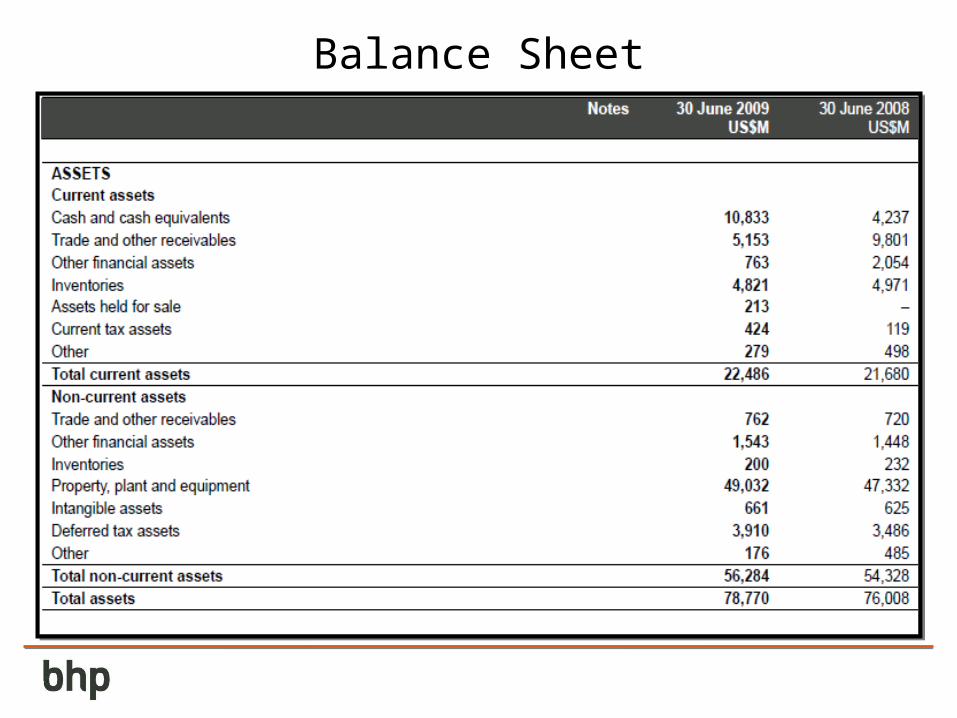
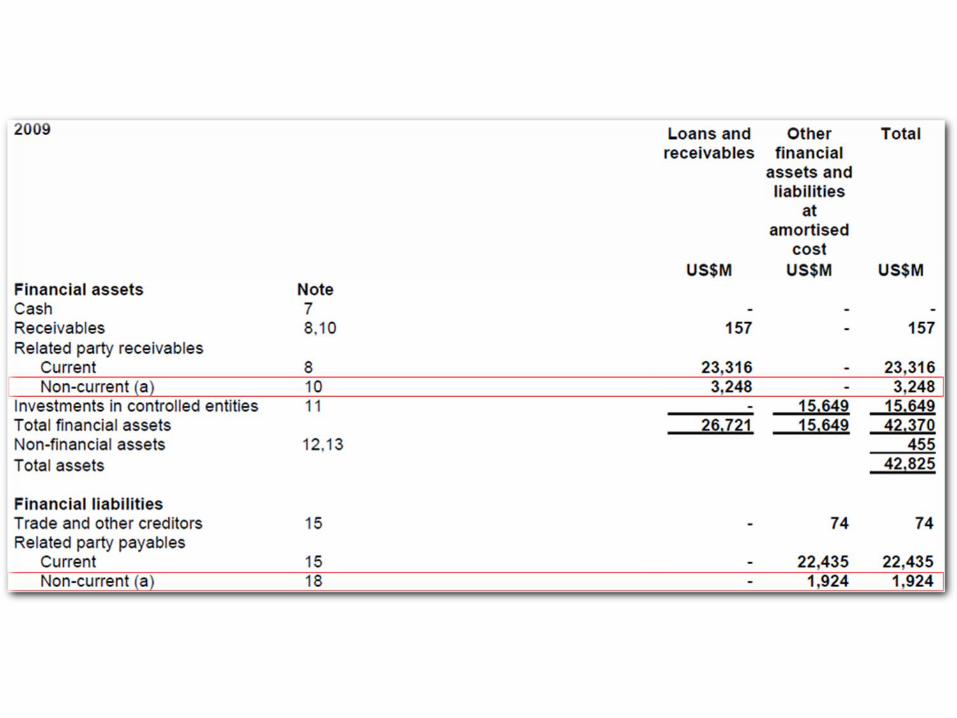
Balance Sheet
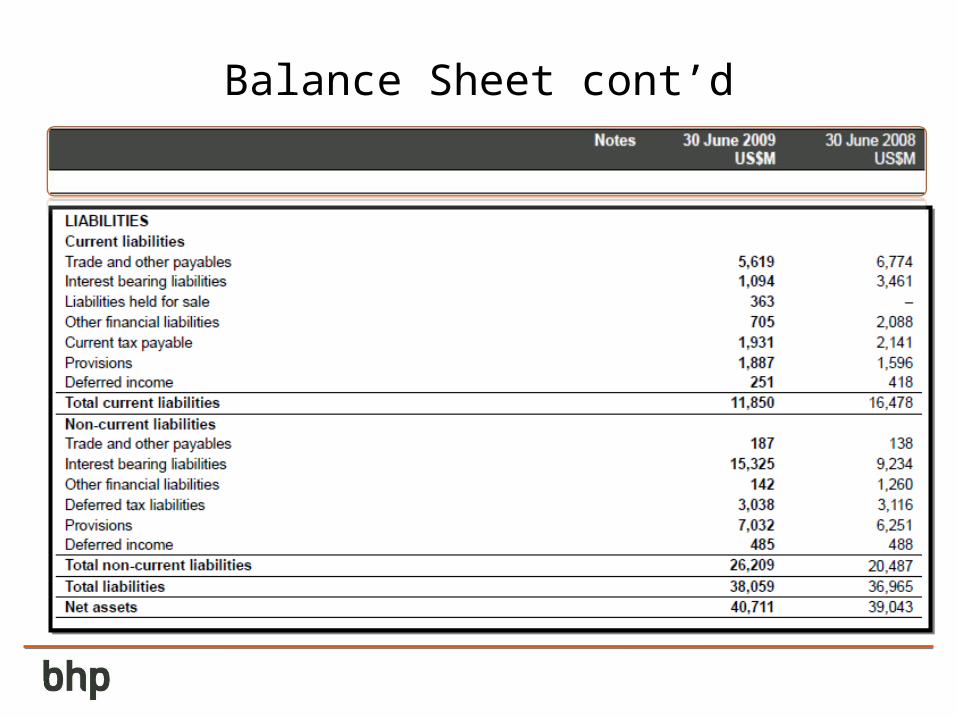
Balance Sheet cont’d
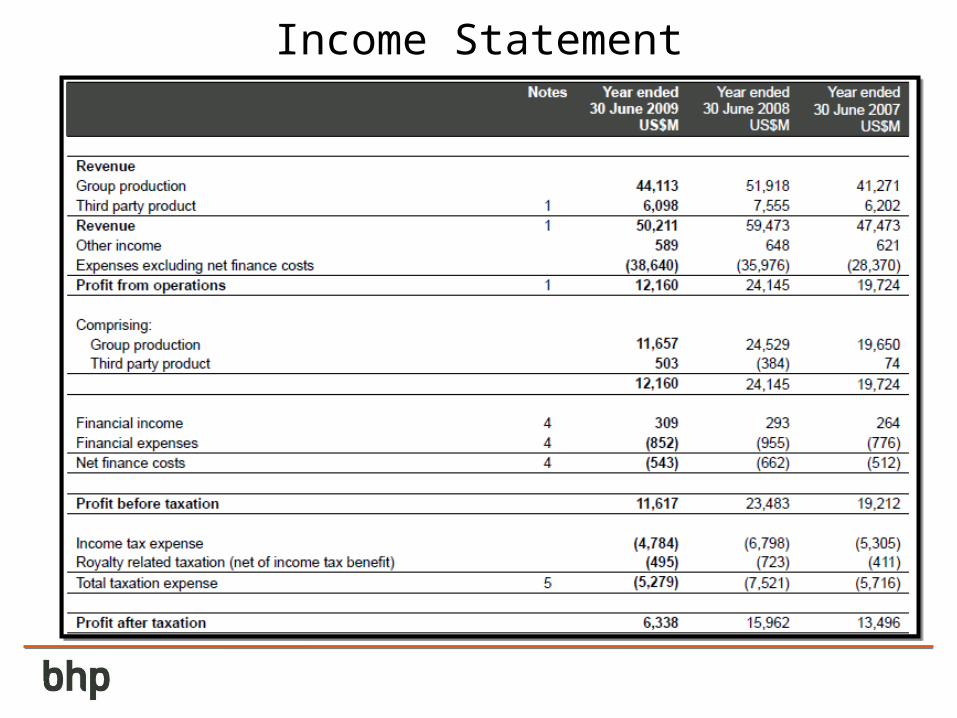
Income Statement
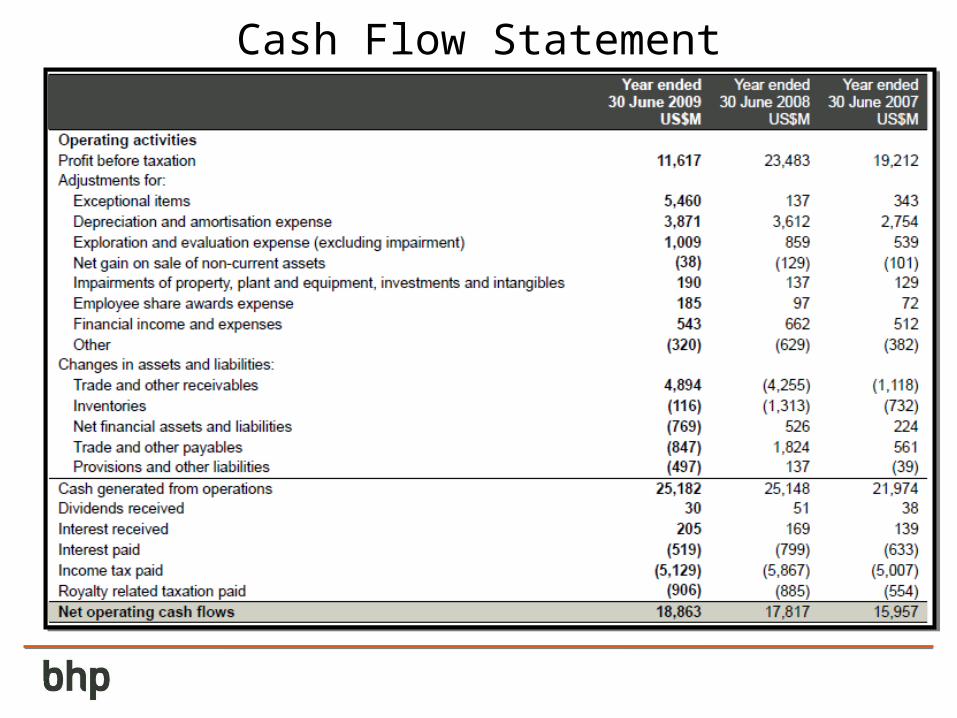
Cash Flow Statement
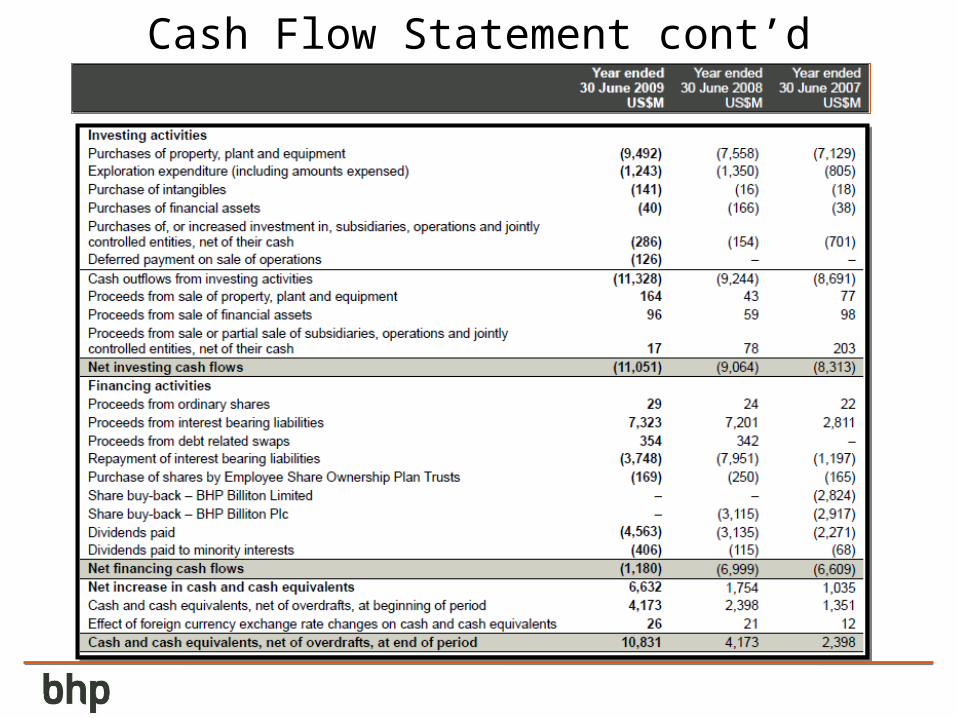
Cash Flow Statement cont’d
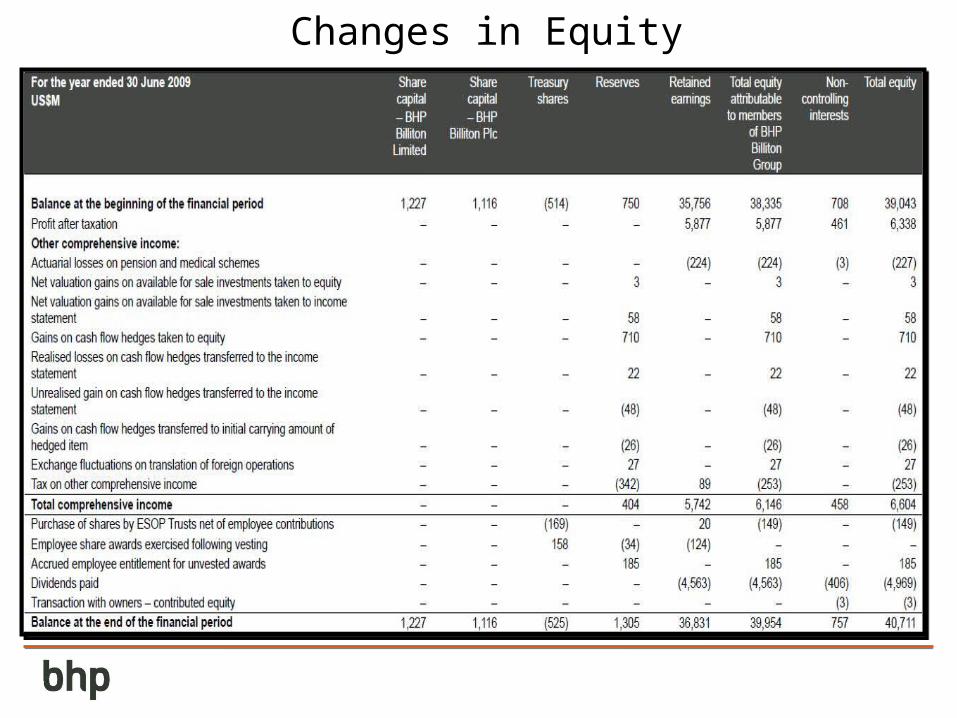
Changes in Equity

QUESTIONS??