Embed Size (px)
Citation preview

Electrochimica Acta, 2003, Volume 48, Issue 9, Pages 1193-1210.
ISSN: 0013-4686
DOI: 10.1016/S0013-4686(02)00828-9
© 2003 Elsevier Science Ltd. All rights reserved.
http://www.sciencedirect.com/science/article/B6TG0-47TWXK6-5/2/6578b9e305630eb8703b80b216e7e58f
http://www.elsevier.com/wps/find/journaldescription.cws_home/205/description#description
Transitions between pitting and intergranular corrosion in AA2024
Weilong Zhang, G.S. Frankel Fontana Corrosion Center, Department of Materials Science and Engineering, The Ohio State University
Abstract
The pitting and intergranular corrosion (IGC) behavior of various tempers of AA2024 was investigated in 1
M NaCl. The breakdown potentials associated with pitting or IGC were determined. The breakdown potentials were
found to be almost independent of sample orientation for any given temper. Artificial aging had a strong effect on
polarization behavior and localized corrosion morphology. The anodic polarization curves of AA2024 in the
solution heat treated and water-quenched condition, T3, and T3+ tempers exhibited two breakdown potentials,
whereas overaged AA2024-T8, T8+ , and solutionized and furnace cooled AA2024 exhibited only one breakdown
potential. When two breakdown potentials were observed, the more active one was found to be related to the
transient dissolution of S phase Al2CuMg particles leading to pitting while the noble one was thought to result
primarily from initiation and growth of IGC. The breakdown potentials decreased with increasing aging time at
190°C, and only one breakdown potential was measured for T8 and T8+ tempers. Unlike the T3 temper, no sharp
IGC was found for these tempers. Selected granular attack from breakdown of the copper-depleted matrix was
believed to be the cause for localized corrosion in the T8 and T8+ tempers. The effect of nitrate and sulfate ions on
the localized corrosion behavior was also studied.
1. Introduction
Pitting and intergranular attack, including exfoliation, are two common forms of
localized corrosion in high strength Al alloys such as AA2024-T3 in chloride-containing aqueous
environments. Pits and intergranular corrosion (IGC) can be potential sites for initiation of
cracks, resulting in catastrophic failure by stress corrosion cracking or corrosion fatigue. A
mechanistic understanding of pitting and IGC susceptibility in Al alloys and quantification of
their growth kinetics, therefore, are of scientific interest and technological importance.
The problem of pitting and IGC susceptibility in high strength Al alloys has been studied
for many years. In principle, both pitting and IGC result from a local breakdown of the passive
film that forms on the surface, but the exact mechanism of the breakdown is still not clear.
Attack that occurs at intermetallic particles, or in the matrix of a grain is called pitting, whereas
attack restricted to grain boundary (GB) regions is called IGC. From an electrochemical point of
view, both pitting and IGC processes seem to be very similar in nature. For example, chloride
ions have been reported to be necessary for both pitting and IGC in Al alloys [1]. The growth of
pits and IGC is believed to depend on potential [2]. As pits grow into the microstructure, they
can develop into IGC or exfoliation (a form of IGC found in wrought Al alloys), which can
penetrate deeply into the microstructure [3, 4]. To some extent, IGC can be regarded as a special
kind of pitting corrosion occurring preferentially at the grain boundaries for Al alloys since the
mechanism of IGC was found to be of the same nature as the process of pitting [1,2,5-8].
However, differences clearly exist between pitting and IGC. For example, artificial aging is
thought to minimize IGC susceptibility, but may not necessarily improve pitting resistance [2, 9,
10]. Furthermore, the growth kinetics for IGC may be different than for pitting.
Many questions regarding the nature of pitting and IGC in Al alloys are still unclear.
Little is known about the transition between pitting and IGC and the factors responsible for this
transition process. Another unresolved issue is how artificial aging affects the susceptibility of
alloys to pitting and IGC. In this paper, the pitting and IGC behavior of AA2024 in different
tempers was studied in 1 M NaCl. The effect of nitrate and sulfate ions on the localized corrosion
behavior was also studied. The purpose of this work was to identify the electrochemical factors
that govern the susceptibility to IGC and control the transition from pits to IGC, and determine
how artificial aging, solution environment, and anodic potential affect IGC initiation and growth
from a micro structural point of view.
2. Experimental
Most specimens were prepared from commercial 1.9 cm thick AA2024-T3 plate stock. A
few samples were taken from commercial 0.2 mm thick AA2024-T3 sheet material. For the plate
material, samples with three different orientations, i.e. longitudinal (L), long transverse (LT) and
short transverse (ST) sections were prepared using a band saw or diamond saw. The T3+, T8,
and T8+ tempers were produced by artificially aging AA2024-T3 slices, previously cut from the
plate, at 190°C in an air furnace for 2.5 h, 12 h, and 36 h, followed by air cooling, respectively.
Solution heat treated (SHT) AA2024 samples were also prepared from the as-received AA2024-
T3 plate and sheet materials. The solution heat treatment was conducted in an air furnace at
492°C for 1 h, followed by either water quenching or furnace cooling. The effect of artificial
aging on the mechanical properties was determined using microhardness measurements. All
samples for electrochemical experiments were ground mechanically and polished through a
series of silicon carbide (SiC) papers (up to 800 grit) in ethanol. No water was used during
polishing in order to minimize corrosion. After polishing, the samples were degreased with
ethanol before attachment to the bottom of an acrylic cell by pressing against a teflon knife-edge
O-ring to expose an area of about 1 cm2 for the experiments. The solution for most experiments
was 1 M NaCl. For a few experiments, a certain amount of nitrate or sulfate was added.
Anodic potentiodynamic polarization experiments were performed in deaerated 1.0 M
NaCl to determine the breakdown potentials of various tempers (SHT, T3, T3+, T8 and T8+) of
AA2024 as a function of sample orientation relative to the rolling direction. The solution was Ar-
deaerated for at least 24 h before the polarization experiment, and was continuously purged with
Ar during the measurement. Each sample was exposed to the solution for 35 min prior to the start
of the measurement, and then potentiodynamically polarized from -30 mV below the open circuit
potential to a potential above the breakdown potentials at 0.1 mV s-1
. No IR compensation or
correction was made during polarization measurement. The breakdown potentials were taken as
the points in the anodic polarization curve at which the current increased sharply. Cyclic
polarization and potentiostatic polarization experiments were also performed to examine the type
of localized corrosion and repassivation behavior of pitting and IGC in Ar-deaerated pure
chloride and nitrate containing chloride solutions.
The microstructures of AA2024-T3 and T8 were characterized using optical
metallography, scanning electron microscopy (Philips XL30 FEG-SEM) and transmission
electron microscopy (Philips CM200 TEM). Samples with the three different orientations (ST, L,
and LT) were polished to 1 µm diamond paste, followed by etching in Keller’s reagent for about
30 to 50 s. Foils for transmission electron microscope (TEM) examination were prepared by
electropolishing in a twin-jet electropolishing apparatus using a 30% nitric acid in methanol at -
30 to -50 °C.
3. Results and discussion
3.1. Micro structure of AA2024
Fig. 1 shows optical micrographs of microstructures in the AA2024 plate and sheet. All
tempers (SHT, T3, T3+, T8 and T8+) of the AA2024 plate have a typical elongated pancake-
shaped grain structure. Grains were elongated in both the longitudinal and long transverse
directions. This directionality of elongated grain structure is particularly important in regard to
localized corrosion growth kinetics, which are discussed in another paper [11]. The average grain
dimensions for AA2024-T3 plate at the 1/4 T section were approximately 50 µm in the short
transverse (ST) direction, 2000 µm in the longitudinal (L) direction, and 300 µm in the long
transverse (LT) direction. Grains were a little more elongated at the midsection of the plate. In
contrast, the 0.2 mm thick AA2024-T3 sheet exhibited a completely recrystallized structure, as
evidenced by an almost equiaxed grain structure along three alloy directions with an average
grain size of 30-50 µm (Fig. 1(c)).
Fig. 1. Microstructure of three orthogonal sections of (a) 1.9 cm thick AA2024-T3 plate, (b) AA2024-T8, (c) 0.2
mm thick AA2024-T3 sheet.
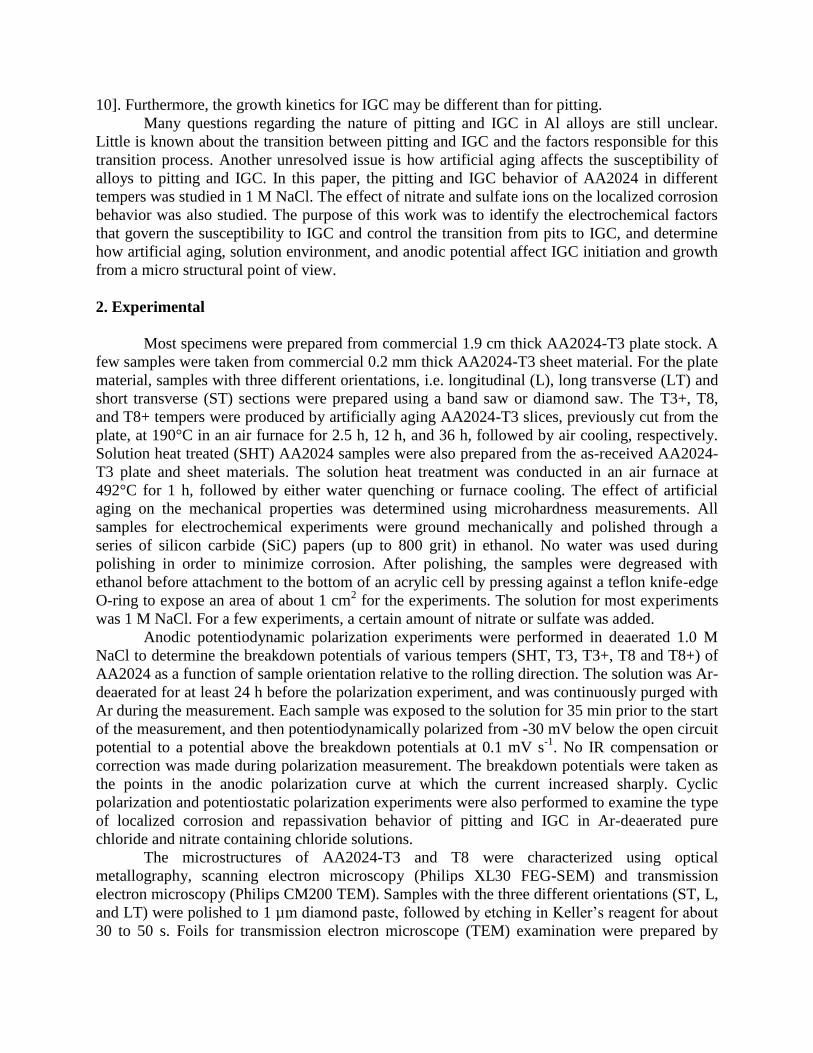
In naturally aged AA2024-T3, it is believed that the matrix contains homogeneous
coherent precipitates, denoted as GP zones, as well as fine hardening precipitates (S'Al2CuMg)
[10,12]. Fig. 2 are typical TEM micrographs from the 1.9 cm thick plate showing the high
density of plate shaped hardening precipitates (S'Al2CuMg) in AA2024-T3. In addition, scattered
through the matrix are a lot of large and rod shaped particles containing Al, Mn, and Cu
(possibly Al20Mn3Cu2). There was little evidence for the existence of precipitate-free zones
(PFZ) along the grain boundaries in T3 temper although the formation of PFZ adjacent to the
grain boundaries during quenching has been reported [10]. However, many rod shaped
precipitate particles can be seen in GB regions, Fig. 2(b). They all had a similar shape, but were
identified by EDS as having different compositions: very close to Al2Cu (very little Mg),
Al2CuMg or Al20Mn3Cu2 with no Mg. Occasionally, Al-Cu-Mn-Fe particles were also found at
the grain boundaries. It is believed that the rod shaped precipitate particles containing Mn and Cu
form during solidification, not from aging, whereas others precipitate during natural aging [13].
The Mn and Cu-rich particles are thought to pin grain boundaries, thus retarding
recrystallization, and resulting in the retention of the elongated grain structure [13].
Fig. 2. Transmission electron micrographs of AA2024-T3 plate material showing (a) plate-like S' (Al2CuMg)
precipitates, (b) rod-like precipitates in matrix and grain boundaries.
Microstructural changes that occur during solution heat treatment and artificial aging
create corresponding changes in mechanical properties and corrosion behavior. The detailed
microstructural changes can be quite complicated, including particle dissolution, particle
coarsening, precipitation, changes in dislocation distribution and density, as well as changes of
composition and structure in subgrain and grain boundaries. In general, artificial aging will not
have much effect on the coarse constituent particles. The rod-like dispersoids, once formed,
usually resist either dissolution or coarsening as well [13]. However, GP zones and the fine
hardening precipitates (S'Al2CuMg) will change with aging. Solution heat treatment will dissolve
these hardening precipitates. The blocky Fe, Mn-rich and coarse Al-Cu-Mg constituent particles
are also not soluble at solution treatment temperature. It is generally believed that artificial aging
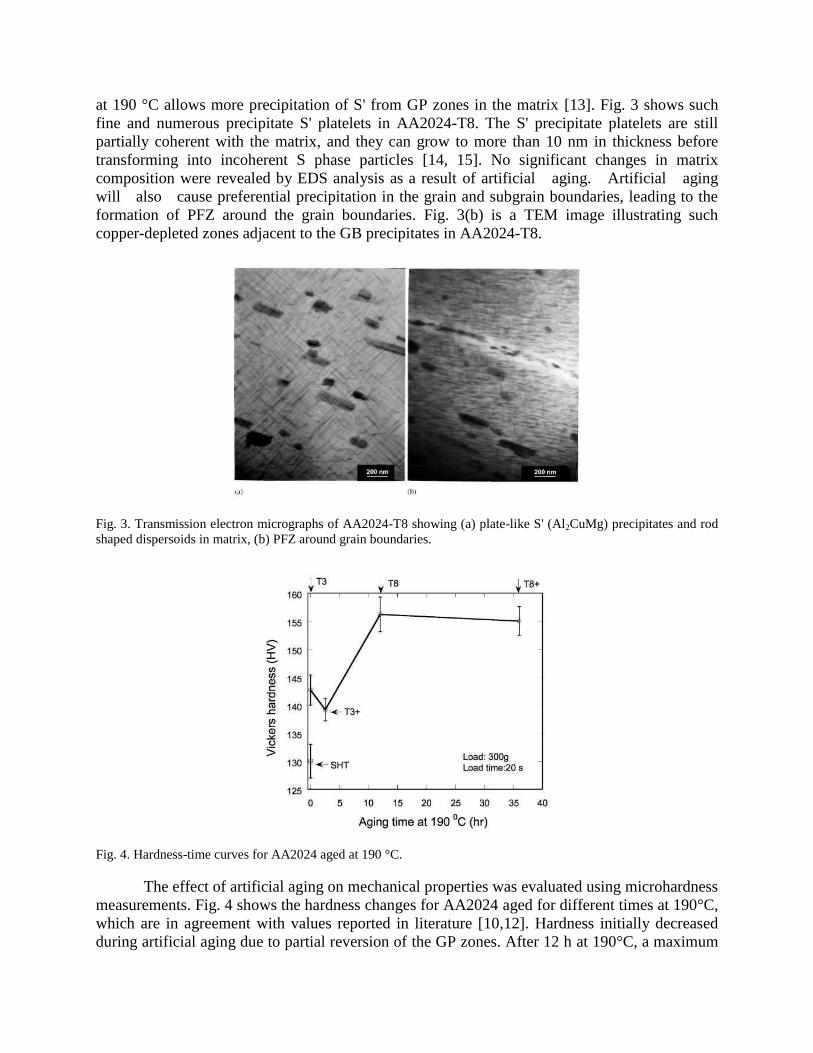
at 190 °C allows more precipitation of S' from GP zones in the matrix [13]. Fig. 3 shows such
fine and numerous precipitate S' platelets in AA2024-T8. The S' precipitate platelets are still
partially coherent with the matrix, and they can grow to more than 10 nm in thickness before
transforming into incoherent S phase particles [14, 15]. No significant changes in matrix
composition were revealed by EDS analysis as a result of artificial aging. Artificial aging
will also cause preferential precipitation in the grain and subgrain boundaries, leading to the
formation of PFZ around the grain boundaries. Fig. 3(b) is a TEM image illustrating such
copper-depleted zones adjacent to the GB precipitates in AA2024-T8.
Fig. 3. Transmission electron micrographs of AA2024-T8 showing (a) plate-like S' (Al2CuMg) precipitates and rod
shaped dispersoids in matrix, (b) PFZ around grain boundaries.
Fig. 4. Hardness-time curves for AA2024 aged at 190 °C.
The effect of artificial aging on mechanical properties was evaluated using microhardness
measurements. Fig. 4 shows the hardness changes for AA2024 aged for different times at 190°C,
which are in agreement with values reported in literature [10,12]. Hardness initially decreased
during artificial aging due to partial reversion of the GP zones. After 12 h at 190°C, a maximum

in hardness was reached when the alloy contained a critical dispersion of GP zones and S'
precipitates in the matrix. The over aged T8+ alloy showed a slight decrease in hardness because
more incoherent S particles transformed from S' precipitates.
As mentioned above, the AA2024-T3 sheet had a recrystallized equiaxed grain structure
and the plate had an elongated grain structure. Interestingly, fine sub-grain structure was also
observed in the etched section of overaged AA2024-T8 plate, Fig. 5. Generally, a fine sub-grain
structure is the result of a re-crystallization process (partially or fully) during alloy metallurgical
and thermal processing [13]. However, recrystallization seems unlikely at the artificial aging
temperature (190°C). One alternative explanation is that artificial aging altered the subgrain
boundary structure or composition so that they were revealed by chemical etching. The existence
of PFZ adjacent to the grain boundaries as revealed by TEM observation on T8 temper also
supports this view. From the above discussion, it is clear that artificial aging at 190°C changes
the grain and GB composition, and microstructure of AA2024 alloys.
3.2. Polarization curves
Potentiodynamic polarization experiments were performed on ST, L, and LT samples in
deaerated 1 M NaCl to test the influence of sample orientation. Fig. 6 shows that the current
increases sharply above the first breakdown potential E1 However, instead of increasing
monotonically with increasing potential, the current reaches a maximum at a potential labeled Ec
and then decreases by as much as a factor of 10. Above a second breakdown potential, E2, the
current increases again. The two breakdown potentials are almost independent of the sample
orientation and potential scan rate. The more active one, E1, occurs at about -670 to -700 mV
SCE, and the more noble one, E2, occurs at about -590 to -610 mV SCE. Ec was in the range of -
630 to -650 mV SCE. This current maximum is a reproducible feature of the potentiodynamic
polarization curves for the three alloy directions of AA2024-T3.
Fig. 5. Optical micrographs of LT sections of (a) AA2024-T3 and (b) T8 showing pancake-shaped grain structure,

and fine sub-grain structure in T8 temper alloy.

Fig. 6. Anodic polarization curves for AA2024-T3 in Ar-deaerated 1 M NaCl at a scan rate of 0. 1 mV s
-1.
Two breakdown potentials have been reported for aged Al-4% Cu [1,8], AA7075-T6
[16,17], AA2017, AA2024 [6], and AA2024-T3 [18]. In aged Al-4% Cu, Galvele and DeMicheli
[1] found that first breakdown potential was associated with the dissolution of the Cu-depleted
zone along the GB (i.e. IGC), and the noble one corresponded with pitting of the grain bodies.
Sugimoto et al. [8] claimed the same mechanism for two breakdown potentials in aged Al-4% Cu
alloys. Maitra and English [16, 17] proposed a similar mechanism for two breakdown potentials
observed for AA7075-T6 in deaerated 3.5% NaCl solution. In addition, they found a much larger
difference between these two breakdown potentials in a mixture of chloride, nitrate, and sulfate
solutions as compared with that in pure chloride solutions. In Al-Cu-Mg alloys (AA2017 and
AA2024) alloys, Urushino and Sugimoto [6] concluded that two breakdown potentials
corresponded to pitting at the grain boundaries and the grain matrix, respectively. More recently,
Guillaumin and Mankowski [18] proposed a slightly different view, arguing that the first
breakdown potential of AA2024-T3 was related to the dissolution of coarse intermetallic
Al2CuMg particles, while the second breakdown potential corresponded to the matrix breakdown
potential. It will be shown below that our experimental results for AA2024-T3 are in agreement
with the earlier study by Guillaumin and Mankowski [18] regarding the first breakdown
potential, but suggest that the second breakdown potential results from initiation and growth of
IGC. It should be pointed out that a two-breakdown potential polarization curve is a summation
of current from two different localized dissolution processes. Even though we find that the
second breakdown potential results primarily from IGC growth, IGC can initiate below the
second breakdown potential. At lower potentials, the current associated with IGC is masked by
the larger current associated with the transient S phase dissolution. So it should not be assumed
that IGC is not possible below the second breakdown potential determined potentiodynamically.

3.3. Types of corrosion
Fig. 7. Optical micrographs of the exposed surfaces of AA2024-T3 (ST) samples potentiostatically polarized, (a) at -
690 mV SCE for 12 h, (b) at -670 mV SCE for 2 h, (c) at -660 mV SCE for 20 h, and (d) cross section of the sample
polarized at -600 mV SCE for 20 h in Ar-deaerated 1 M NaCl solutions.
Table 1
Summary of observations obtained from potentiostatic polarization and metallographic examination experiments

The presence of two breakdown potentials in the anodic polarization curves is an
important feature of localized corrosion of AA2024-T3 in chloride solution. Generally speaking,
a breakdown potential corresponds to the dissolution potential of a metallurgical phase [16]. So
two breakdown potentials indicates that there are two phases in the AA2024-T3 microstructure,
with different dissolution potentials, responsible for two different forms of localized corrosion.
The reason for the current peak, i.e. the decrease in current with increasing potential above Ec,
must also be explained. In order to determine the causes responsible for each of the breakdown
potentials in the polarization curves of AA2024-T3, potentiostatic polarization experiments were
performed. Samples were first potentiodynamically polarized at 0.1 mV s-1
from open circuit
potential to a final potential between the first breakdown potential (E1) and the second
breakdown potential (E2), and then held at the final potential for certain times. The exposed
surfaces of the samples were subsequently examined by optical microscopy and SEM to
determine corrosion morphology. In addition, some samples were metallographically cross-
sectioned for further information. Table 1 summarizes the observations made from the
potentiostatic experiments and metallography. No IGC was observed at the first breakdown
potential for the T3 temper. Fig. 7 shows the exposed surfaces of the samples after polarization
to 690 mV SCE (held for 12 h), 670 mV SCE (held for 2 h), and -660 mV SCE (held for 20 h),
which are above E1 but below Ec, the potential associated with the current maximum. The initial
attack was found to be associated with the intermetallic particles at the sample surface. Fig. 8
shows SEM images of a sample potentiodynamically polarized to 660 mV SCE, and then held
for 20 h. EDS analysis indicated that attacked Al-Cu-Mg particles (particles marked A-C in Fig.
8(a) and (b)) contained Cl and O, but almost no Mg. No IGC was found on either the exposed
surface or cross section, but a large number of small pits was found on the exposed surface, Fig.
8(c). These pits were so shallow that it was hard to locate them in the cross section, Fig. 7(d).
These results suggest that both matrix and GB regions remained unattacked around the first
breakdown potential.
The corrosion morphology changed as the potential increased above the transition
potential, Ec. IGC was still not observed after 5 h at -645 mV SCE (which is about Ec), Fig. 9(a),
but IGC did occur after 20 h at -645 mV SCE, Fig. 9(b), indicating that IGC can initiate below E2
but an induction period for IGC formation may exist. After 5 h at -590 mV SCE, which is just
above E2, IG attack was observed on both the exposed surface and the cross section, Fig. 9(c). At
potentials above the second breakdown potential, E2, much less time was needed for IGC to
initiate and grow into the microstructure. Fig. 10 shows the exposed surface morphology of a
sample that was potentiodynamically polarized to -560 mV and then removed from solution.
This potential is well above the second breakdown potential, and IG attack appeared in addition
to pits on the surface. These observations are evidence for assigning pitting corrosion to E1, and
IGC to E2.
The current density versus time curves obtained during the potentiostatic polarization
experiments show different behavior for the T3 temper samples held at different potentials. Figs.
11 and 12 show the current density transients for the samples held at -690, -670, -660, -645, and -
590 mV SCE. At the potentials below the second breakdown potential, the current density
increased initially because of the onset of pitting, but then decreased almost one order of
magnitude within minutes. The final current density depended on the applied potential. For long
exposure, such as 20 h at -660 mV SCE, the final current density was still on the order of several
µA cm-2
, a little higher than the passive current density. Recall that Fig. 7 showed the presence
of numerous small pits after 20 h at -660 mV SCE. This suggests that there exits a kind of

pitting, probably due to intermetallic particles such as (Al2CuMg) or surface defects, which
initiates quickly but grows very slowly in the potential range from E1 to Ec. It is possible that the
pits are simply dissolved out S phase particles that do not lead to stable pit growth. This behavior
is a kind of metastable pit growth. At -590 mV SCE, which is just above E2, however, the current
density showed totally different behavior. There was no initial peak in current density. Instead,
the current density increased slowly with time until a very high value was reached.
Fig. 9. Metallographic cross sections of AA2024-T3 (ST) potentiostatically polarized at (a) -645 mV SCE for 5 h,
(b) -645 mV SCE for 20 h, (c) -590 mV SCE for 5 h, (d) exposed surface of the sample polarized at -590 mV SCE
for 5 h in Ar-deaerated 1 M NaCl solutions.
Fig. 10. Optical micrographs of the exposed surface of T3 (ST) sample potentiodynamically polarized to -560 mV
SCE in Ar-deaerated 1 M NaCl solution.
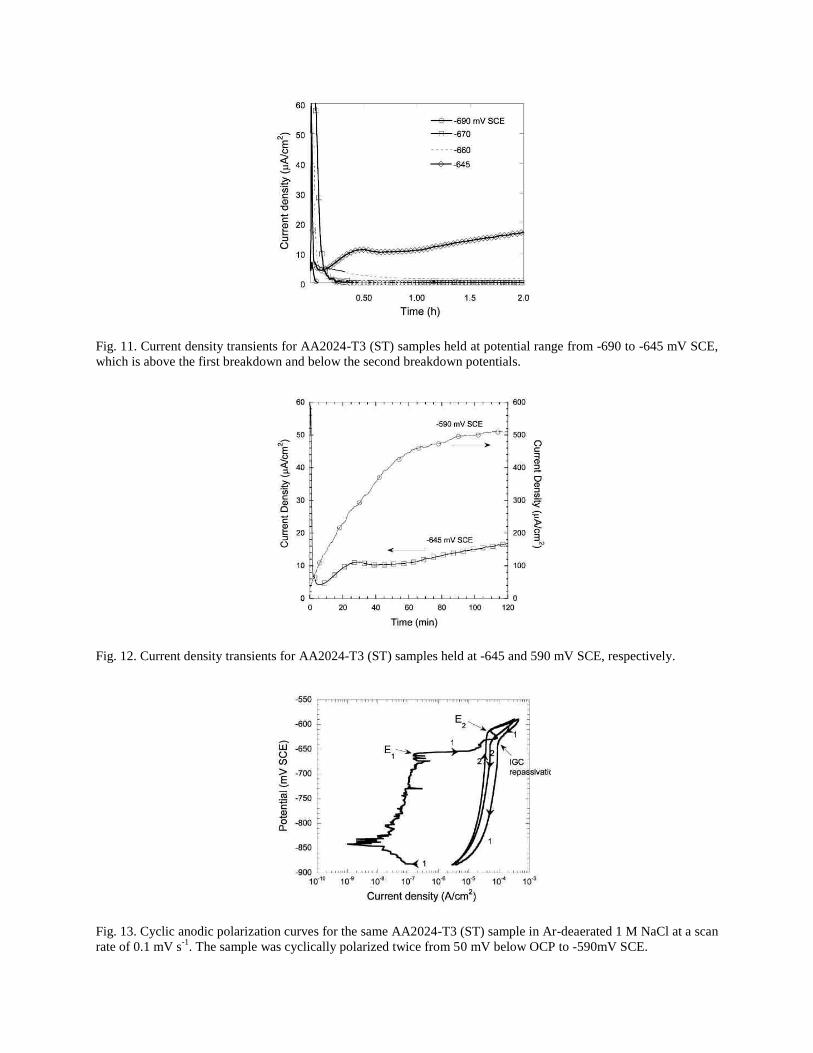
Fig. 11. Current density transients for AA2024-T3 (ST) samples held at potential range from -690 to -645 mV SCE,
which is above the first breakdown and below the second breakdown potentials.
Fig. 12. Current density transients for AA2024-T3 (ST) samples held at -645 and 590 mV SCE, respectively.
Fig. 13. Cyclic anodic polarization curves for the same AA2024-T3 (ST) sample in Ar-deaerated 1 M NaCl at a scan
rate of 0.1 mV s-1
. The sample was cyclically polarized twice from 50 mV below OCP to -590mV SCE.

The behavior of the current density with time under potentiostatic polarization was
consistent with the observation of a current maximum in the potentiodynamic polarization
curves. Pits formed at the first breakdown potential, not IGC as reported in the literature [1, 16].
These pits might be metastable, in that they form from the transient dissolution of S phase
particles and then stop growing, or they might continue to grow very slowly. Like pitting, IGC
has an incubation stage during its initiation. At the second breakdown potential, E2, IGC initiated
and grew very rapidly. Corrosion morphology that can be termed pitting is also evident at the
higher potentials, suggesting that the metastable dissolution of S phase particles can lead to
stable pits if the potential is further increased.
Fig. 13 shows cyclic anodic polarization curves obtained on the same AA2024-T3
sample. The sample was first scanned from 50 mV below the OCP to -590 mV SCE, back to the
starting potential, and then scanned again through the same potential cycle. The first breakdown
potential was not observed in the second scan; the single breakdown potential in the second scan
is close to E2 from the first scan. Clear determination of the breakdown potential in the second
scan is complicated by the fact that the background current was higher. This higher current might
result from an increase in the passive current density associated with a local increase in pH, or it
might be associated with a low level of continued localized attack as described as below.
Regardless, the absence of the first breakdown potential during the rescan is further evidence that
E1 is associated with a transient process such as S phase dissolution, and not from a process that
should be repeatable, such as IGC or matrix pitting.
Cyclic polarization experiments, followed by potentiostatic polarization, were used to
examine the repassivation of localized corrosion during the reverse scan. Samples were first
potentiodynamically polarized from the open circuit potential to -520 mV SCE, which is well
above E2, and then scanned in the reverse direction to -620, -660, or -800 mV. The samples were
either removed or held at the final potentials for 20 h, and then metallographically cross
sectioned to determine corrosion morphology. Fig. 14 shows some typical metallographic cross
sections of those samples. It is clear that IG attack depth decreased with decreasing potential on
the reverse scan, which suggests that IGC growth was not sustained when the potential was
decreased to a certain value (repassivation potential for IGC). The attack morphology is more
like pitting at -660 and 800 mV SCE, which is consistent with measured lower net anodic current
densities during the potentiostatic experiments, Fig. 15. Comparison of samples held at 660 mV
SCE for 0 and 20 h indicates that a low level of pitting corrosion may have continued. This
suggests that pitting repassivates at a lower potential than IGC, but an explanation for this
behavior is not clear.
It is generally accepted that IGC in high strength Al-Cu and Al-Cu-Mg alloys is
associated with precipitates in grain boundaries [1, 19]. Recent work by Ramgopal et al. [20]
provides an explanation for the sharp IG attack. The solute depleted zones (SDZ) near the GB
are considered to be the site for local attack, but Cu-rich S phase particles at the GB are also
attacked. These particles have been shown to release Cu [21]. Deposition of Cu on the grain
faces lining the GB crevice would protect those faces from attack. Also, they provide a cathodic
site that would consume current generated by IGC at the attack front. Since most of the current
would not escape from the GB crevice, the dissolution rate of the front would not be strongly
dependent on external applied potential. This also explains the independence of IGC growth
kinetics on potential, which is discussed in another paper [11].

Fig. 14. Metallographic cross sections of T3 samples potentiodynamically polarized to -620 on reverse scan and held
the potential for 20 h, (b) to -660 and held the potential for 20 h, (c) to -800 mV SCE and held the potential for 20 h
in deaerated 1 M NaCl, (d) cyclic polarization curve showing the potentials for the potentiostatic experiments.
Fig. 15. The measured net current densities as a function of time for the potentiostatic experiment at -620, -660, and
-800 mV SCE, respectively.

Fig. 16. Anodic polarization curves for various tempers of AA2024 (ST) in Ar-deaerated 1 M NaCl at a scan rate of
0.1 mV s-1
.
3.4. Effect of artificial aging
The breakdown potentials were measured for aged AA2024 in three directions relative to
the rolling direction after solution heat treatment and artificial aging. Fig. 16 shows some typical
anodic polarization curves for various tempers of AA2024 (ST) samples obtained in 1 M NaCl at
a scan rate of 0.1 mV s-1
. The measured breakdown potentials are summarized in Tables 2 and 3.
The reported values are the average of at least three separate experiments. As can seen from Fig.
16, artificially aging AA2024-T3 at 190 °C resulted in significant changes in the anodic
polarization curves. The breakdown potentials decreased with increasing aging time. AA2024-
T3, T3+ and water-quenched SHT alloys exhibited two breakdown potentials, while only one
breakdown potential was found for T8, T8+ , and furnace-cooled AA2024-SHT alloys. Muller
and Galvele [2] reported that aging Al-4% Cu could produce a decrease of more than 100 mV in
the breakdown potential as a result of formation of Al2Cu intermetallic particles and depletion of
copper from the matrix. In the case of AA2024, it is expected that aging allows more
precipitation of fine intermetallic particles such as S phase from matrix, leaving a copper-
impoverished matrix and forming copper-depleted zones along the subgrain and grain
boundaries, both of which can decrease the breakdown potentials of the alloys. However, as
described above, it is believed that E1 and the corresponding current peak associated with Ec are
a result of transient dissolution of large constituent S phase particles. This was proven for the T3
temper, and it is not expected that aging will affect the composition or behavior of these large
constituent particles, or that fine newly precipitated S phase particles have a lower breakdown
potential. The metallographic evidence presented below indicates that copper depletion of the
matrix with aging causes a reduction in the matrix breakdown leading to selected granular attack
at low potentials for T8 and T8+ tempers. It is expected that transient dissolution of large
constituent S phase particles would still occur in the overaged tempers. However, the current
associated with this behavior might be buried under the current associated with the selective
matrix dissolution.

Fig. 17 shows cross sections and the exposed surface for T8 ST orientated samples after
potentiostatic polarization at -740 mV for 2 h, -700 mV for 12 h and -675 mV SCE for 3 h,
respectively. As seen from exposed surface SEM image, Fig. 17(a), the initial attack on the ST
section is scalloped in appearance as a result of dissolution of select grains. The evidence for
selective grain phase dissolution is much clearer from the cross sections, Fig. 17(b-d). The form
of localized corrosion is neither S phase particle dissolution nor intergranular attack as the case
of T3 temper. S phase particles did not dissolve at this potential as indicated by EDS analysis of
S phase particle composition, Fig. 18(b). At -660 mV SCE, which is well above the T8
breakdown potential, the initial attack appears to be pit-like, Fig. 19(a), but after 2 h of exposure,
severe dissolution of selected grains occurs as indicated from the exposed surface and the cross
section, Fig. 19(b,c). There is a little inter-granular attack, but the intergranular attack does not
propagate deeply into the microstructure. Further evidence for the selected granular attack can be
seen in cross sections of L oriented T8 samples exposed at open circuit (~ -740 mV SCE) for
15.9 h in oxygenated 1 M NaCl solution, Fig. 20(a). As-polished and etched cross sections show
that the relatively wide and directional attack results from dissolution of individual elongated
grains in the L orientation. The selected granular attack does not spread across the grain
boundaries, but only propagates along the elongated grain direction, which is a totally different
mechanism from that of T3, where attack initiated at grain boundaries and remained sharp at the
grain boundaries. At a much higher potential such as -580 mV SCE, more grains were attacked,
Fig. 20(b).
Table 2
Influence of orientation and potential scan-rate on breakdown potentials for AA2024-T3 and T8
Table 3
Breakdown potentials for various tempered AA2024 (ST) alloys in Ar deaerated 1 M NaCl at scan rate 0.1 mV s-1
The selective grain attack seen on the T8 temper is consistent with the observation of
decreased susceptibility to IGC with artificial aging [22]. The change in the form of attack can be
explained by a decrease in Cu content of matrix phase with aging, which makes the grain more
susceptible to breakdown than the GB or SDZ. However, it is interesting that the attack stays
within single grains and does not spread to adjoining grains to become an isotropic hemispherical

pit. It is possible that the less susceptible GB is protected by Cu deposition in the same fashion as
was suggested above for the grain face during sharp IGC of T3 temper.
The two breakdown potentials appeared again after solution heat treatment and water
quenching of the T8 temper, which further suggests the single breakdown potential that is found
in the polarization curve for the T8 temper is not associated with dissolution of newly
precipitated S phases, but from a process that is reversible by heat treatment such as matrix
dissolution.
The current densities obtained during the potentiostatic experiments were very different
for T8 samples than for T3 samples held around the first breakdown potential, Fig. 21. The
current densities increased gradually with time, reaching high values that depended on the
applied potential. This is similar to that found for T3 samples potentiostatically polarized around
the second breakdown potential, Fig. 12. However, unlike T3 temper, no sharp IGC was
observed in T8 samples polarized above the breakdown potential. The selected grain attack in the
T8 temper suggests that artificial aging produces Cu-depleted matrix and enhance the nobility of
GB regions, reducing the IGC susceptibility in AA2024-T8.
Fig. 17. (a) SEM image showing exposed surface and metallographic cross sections of ST orientated T8 samples
potentiostatically polarized at, (b) -740 mV SCE for 2 h, (c) -700 mV SCE for 12 h, and (d) -675 mV SCE for 3 h in
Ar-deaerated 1 M NaCl solutions.

Fig. 18. SEM images (a), and (b) showing exposed surface of T8 sample potentiodynamically polarized to -740 mV
SCE and followed by potentiostatic experiment at -740 mV SCE for 2 h, (c) EDS for undissolved Al-Cu-Mg
particles.
As mentioned earlier, the AA2024-T3 alloy in sheet form had a different grain structure
than the AA2024-T3 plate alloy. Artificial aging also resulted in the same effect on the
polarization curves of the AA2024-T3 sheet material.

Fig. 19. Optical micrographs showing exposed surface of T8 sample, (a) potentiodynamically polarized to -660 mV,
(b) further held at -660 mV SCE for 2 h, (c) cross section.
3.5. Effect of nitrate and sulfate additions
The effect of nitrate and sulfate addition on localized corrosion behavior was also studied
since it was reported that, in addition to chloride ions, a relatively large amounts of nitrate and
sulfate presented in real lap joints taken from airplanes [23]. It is generally accepted that nitrates

can inhibit the pitting corrosion of Al and Al alloys in chloride solutions [24, 25]. On the other
hand, sulfate is reported to have little effect on pitting of Al alloys unless it is present at a very
high concentration [24]. Fig. 22 compares cyclic polarization curves for AA2024-T3 ST samples
in 1 M NaCl, 1 M NaCl + 0.2 M NaNO3, and 1 M NaCl + 0.5 M Na2SO4. The polarization
curves for L and LT samples are similar to these of ST samples. It was found that both OCP and
breakdown potential increased with increasing nitrate concentration. The nitrate addition also
changed the polarization behavior of AA2024-T3 on the reverse scan, which suggests that the
nitrate may affect the repassivation behavior of localized corrosion. In contrast, the high
concentration sulfate addition produced little difference in anodic polarization behavior except
that only one breakdown potential was found. The polarization curve on the reverse scan
appeared to be unchanged.
Fig. 20. Cross sections of L orientated T8 samples exposed at (a) open circuit ( ~ -740 mV SCE for15.9 h, and (b) -
580 mV SCE for 5.5 h in oxygenated 1 M NaCl solutions.

Potentiostatic experiments were performed to further examine the type of corrosion on
the reverse scan in nitrate containing chloride solutions. Again, samples were
potentiodynamically polarized to a high value of -400 mV SCE, and then the scan was reversed.
Fig. 23 shows that much deeper IGC attack was observed for the sample held at -630 mV SCE
for 20 h than for the samples given the same cyclic polarization treatment but without the
subsequent potentiostatic polarization. This suggests that IGC can still grow at -630 mV SCE.
There was not much difference in corrosion morphology between the samples held at -600 and -
630 mV SCE for 20 h after the cyclic polarization. Both were primarily IGC and
exfoliation with a similar depth into the microstructure. However, the measured net current
densities exhibited totally different behavior, Fig. 24. The larger amount of anodic charge
obtained at -600 mV SCE did not lead to deep and heavy IG attack, which suggests that the
measured current density may not represent well the metal anodic dissolution kinetics under
those conditions. It is possible that the local cathodic reaction greatly affects the net current
measurement under potentiostatic conditions in nitrate containing chloride solutions.
Fig. 21. Current density transients with time for AA2024-T8 at different potentials.
Fig. 22. Cyclic polarization curves for AA2024-T3 (ST) in deaerated 1.0 M NaCl, 1 M NaCl + 0.2 M NaNO3, and 1
M NaCl + 0.5 M Na2SO4 solutions.
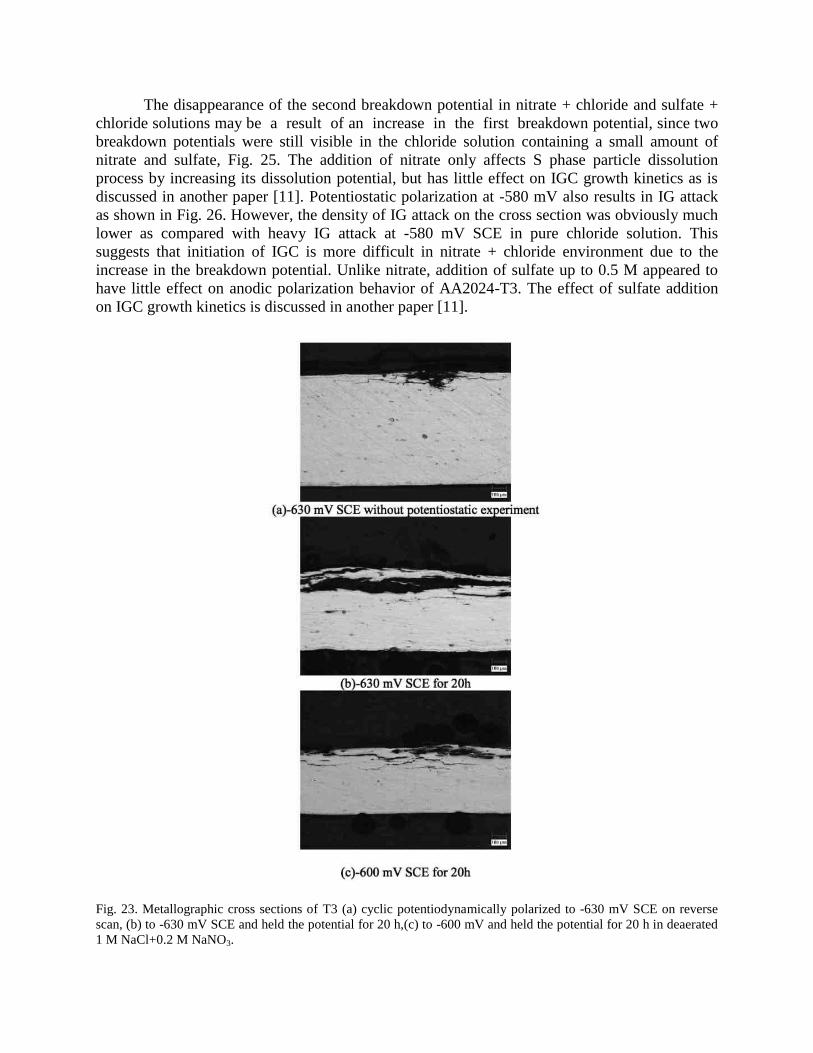
The disappearance of the second breakdown potential in nitrate + chloride and sulfate +
chloride solutions may be a result of an increase in the first breakdown potential, since two
breakdown potentials were still visible in the chloride solution containing a small amount of
nitrate and sulfate, Fig. 25. The addition of nitrate only affects S phase particle dissolution
process by increasing its dissolution potential, but has little effect on IGC growth kinetics as is
discussed in another paper [11]. Potentiostatic polarization at -580 mV also results in IG attack
as shown in Fig. 26. However, the density of IG attack on the cross section was obviously much
lower as compared with heavy IG attack at -580 mV SCE in pure chloride solution. This
suggests that initiation of IGC is more difficult in nitrate + chloride environment due to the
increase in the breakdown potential. Unlike nitrate, addition of sulfate up to 0.5 M appeared to
have little effect on anodic polarization behavior of AA2024-T3. The effect of sulfate addition
on IGC growth kinetics is discussed in another paper [11].
Fig. 23. Metallographic cross sections of T3 (a) cyclic potentiodynamically polarized to -630 mV SCE on reverse
scan, (b) to -630 mV SCE and held the potential for 20 h,(c) to -600 mV and held the potential for 20 h in deaerated
1 M NaCl+0.2 M NaNO3.

Fig. 24. Current density as a function of time for AA2024-T3 (ST) samples held at -600 and -630 mV SCE on
reverse scan in deaerated 1 M NaCl + 0.2 M NaNO3.
Fig. 25. Cyclic polarization curves for AA2024-T3 in deaerated 1.0 M NaCl with nitrate and sulfate additions.
4. Summary
Polarization experiments and metallographic examinations of various tempers of AA2024
were performed, and the following observations were made.

Fig. 26. SEM picture showing IGC of AA2024-T3 (L) potentiostatically polarized at -580 mV for 20 h in deaerated
1 M NaCl + 0.2 M NaNO3.
1) The anodic polarization curves of AA2024 in the solution heat treated and water-quenched
condition, T3, and T3+ tempers exhibited two breakdown potentials. The breakdown
potentials were found to be independent of sample orientation for any given temper. When
two breakdown potentials were observed, the more active one was related to transient
dissolution of S phase intermetallic particle while the noble one was a result of initiation and
growth of IGC.
2) Artificial aging had a strong effect on polarization curves and localized corrosion
morphology of AA2024. AA2024-T8, T8+, and solutionized and furnace cooled AA2024
exhibited only one breakdown potential. Unlike T3 temper, no sharp IGC was found in the
T8 temper. Selected grain attack resulting from breakdown of copper-depleted matrix phase
was believed to be the cause for localized corrosion in the T8 and T8+ tempers.
3) A corrosion morphology transition between pitting and intergranular attack was found at
critical potentials on the upward or reverse scans in T3 temper. IGC only initiated and grew
at high potentials while pitting dominated at low potentials. Like pitting, there may exist an
induction period for IGC to initiate. IGC repassivated at a much higher potential than pits.
4) Addition of nitrate to chloride increased the first breakdown potential for S phase dissolution,
and changed the repassivation behavior of AA2024-T3. In contrast, sulfate addition appeared
to have little influence on the anodic polarization and localized corrosion behavior.
5) TEM observations did not provide much evidence that Cu-depleted zones were present at the
grain boundaries of AA2023-T3. However, the Cu-depleted zones were observed in the
overaged T8 temper. Artificial aging resulted in more precipitation of intermetallic particles
from the matrix and formation of Cu-depleted matrix phase, which greatly changed the
localized corrosion of AA2024.
6) AA2024-T3 plate and sheet alloys exhibited different grain structures, but both had similar
localized corrosion characteristics.
Acknowledgements
This work was supported by the United States Air Force Office of Scientific Research
through Grant No. F49620-99-1-0103. The authors are grateful to Dr. R. Buchheit for valuable
discussion.

References
[1] J.R. Galvele, S.M. De Micheli, Corros. Sci. 10 (1970) 795.
[2] I.L. Muller, J.R. Galvele, Corros. Sci. 17 (1977) 179.
[3] M. Posada, L.E. Murr, R.M. Arrowood, Microstruct. Sci. 25 (1997) 131.
[4] G.H. Koch, Corrosion 99, paper No.516, NACE, Houston, TX, 1999.
[5] R.G. Buchheit, J.P. Moran, G.E. Stoner, Corrosion 46 (1990) 610.
[6] K. Orushino, K. Sugimoto, Corros. Sci. 19 (1979) 225.
[7] A. Garner, D. Tromans, Corrosion 35 (1979) 55.
[8] K. Sugimoto, K. Hoshino, M. Kageyama, S. Kageyama, Y. Sawada, Corros. Sci. 15 (1975) 709.
[9] M.J. Robinson, N.C. Jackson, Br. Corros. J. 34 (1999) 45.
[10] M.O. Speidel, M.V. Hyatt, in: M.G. Fontana, R.W. Staehle (Eds.), Advances in Corrosion Science and
Technology, vol. 2, Plenum Press, New York, 1972, p. 115.
[11] W. Zhang, G.S. Frankel, J. Electrochem. Soc. 149 (2002) B510.
[12] J.E. Hatch, Al: Properties and Physical Metallurgy, American Society for Metals, Metals Park, OH, 1984.
[13] I.J. Polmer, Light Alloys: Metallurgy of the Light Metals, Wiley, New York, 1996.
[14] D.A. Hardwick, M. Taheri, A.W. Thompson, I.M. Bernstein, Metall. Trans. A 13A (1982) 235.
[15] J.M. Silcock, J. Inst. Met. 89 (1960) 203.
[16] S. Maitra, G.C. English, Mettall. Trans. A 12A (1981) 535.
[17] S. Maitra, G.C. English, Metall. Trans. A 13A (1982) 161.
[18] V. Guillaumin, G. Mankowski, Corros. Sci. 41 (1999) 421.
[19] D.O. Sprowls, R.H. Brown, in: R.W. Staehle, A.J. Forty, D.V. Rooyen (Eds.), Fundamental Aspects of Stress
Corrosion Cracking, vols. NACE-1, NACE, Houston,TX, 1967, p. 466.
[20] T. Ramgopal, P. Leblanc, G.S. Frankel, unpublished work.
[21] R.G. Buchheit, R.P. Grant, P.F. Hlava, B. Mckenzie, G.L. Zender, J. Electrochem. Soc. 144 (1997) 2621.
[22] M.O. Speidel, M.V. Hyatt, in: M.G. Fontana, R.W. Staehle (Eds.), Advances in Corrosion Science &
Technology, vol. 2, Plenum Press, New York, NY, 1972, p. 115.
[23] M.E. Inmam, R.G. Kelly, S.A. Willard, R.S. Piascik, Proceedings of the FAA-NACE Symposium on Continued
Airworthiness of Aircraft Structures, paper No.9, Atlanta,GA, 1996.
[24] J.R. Galvele, S.M.D. Micheli, I.L. Muller, S.B.D. Wexler, I.L. Alanis, in: R.W. Staehle, B.F. Brown, J. Kruger,
A. Agrawal (Eds.), Localized Corrosion, vols. NACE-3, The Electrochemical Society, Pennington, NJ, 1974, p.
580.
[25] H. Bohni, H.H. Uhlig, J. Electrochem. Soc. 116 (1969) 906.


![1210 INDEX []. 1210.pdf · 1210 INDEX PAGE Manufactures of Quebe c 577, ... — rates in Canada 166, 193-4 ... Acts administere bd y 1177](https://img.pdfslide.us/doc/110x75/5af8ec8c7f8b9a5f588d6f03/1210-index-1210pdf1210-index-page-manufactures-of-quebe-c-577-rates.jpg)