Embed Size (px)
Citation preview
Fowler, USD #225
i
• Budget General Information (characteristics of district)
• Supplemental Information for Tables in Summary of Expenditures
• KSDE Website Information Available
• Summary of Expenditures (Sumexpen.xls)
1
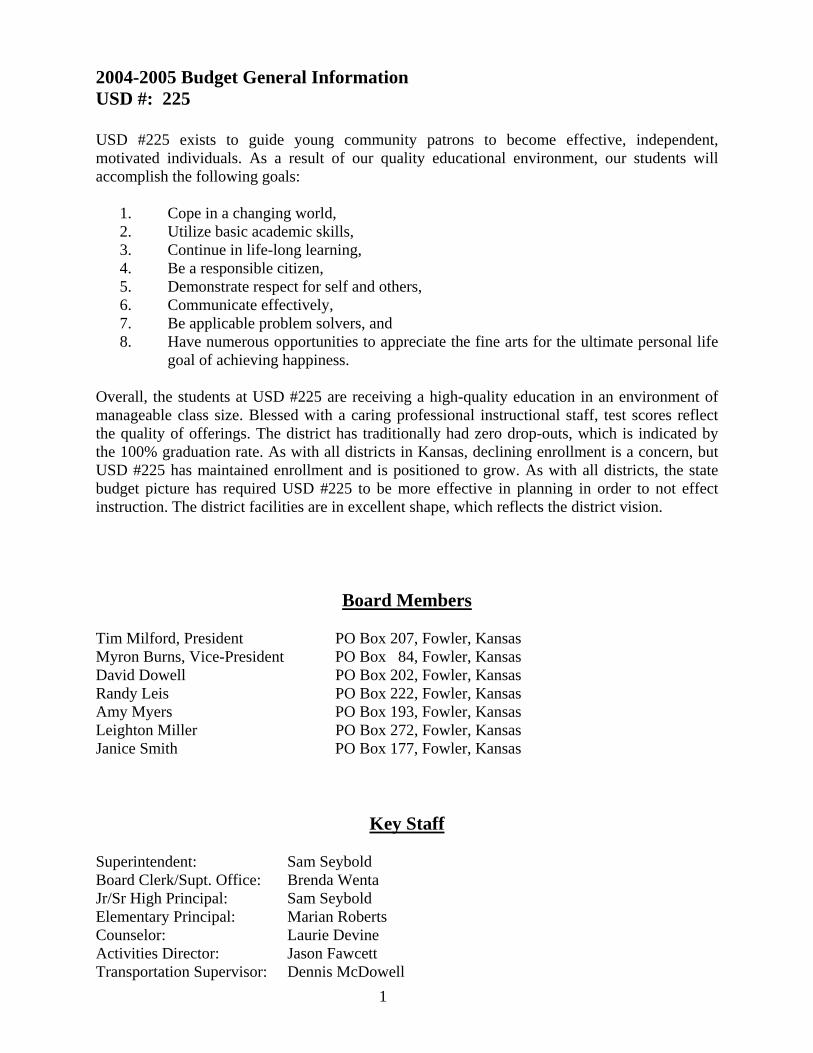
2004-2005 Budget General Information USD #: 225 USD #225 exists to guide young community patrons to become effective, independent, motivated individuals. As a result of our quality educational environment, our students will accomplish the following goals:
1. Cope in a changing world, 2. Utilize basic academic skills, 3. Continue in life-long learning, 4. Be a responsible citizen, 5. Demonstrate respect for self and others, 6. Communicate effectively, 7. Be applicable problem solvers, and 8. Have numerous opportunities to appreciate the fine arts for the ultimate personal life
goal of achieving happiness.
Overall, the students at USD #225 are receiving a high-quality education in an environment of manageable class size. Blessed with a caring professional instructional staff, test scores reflect the quality of offerings. The district has traditionally had zero drop-outs, which is indicated by the 100% graduation rate. As with all districts in Kansas, declining enrollment is a concern, but USD #225 has maintained enrollment and is positioned to grow. As with all districts, the state budget picture has required USD #225 to be more effective in planning in order to not effect instruction. The district facilities are in excellent shape, which reflects the district vision.
Board Members Tim Milford, President PO Box 207, Fowler, Kansas Myron Burns, Vice-President PO Box 84, Fowler, Kansas David Dowell PO Box 202, Fowler, Kansas Randy Leis PO Box 222, Fowler, Kansas Amy Myers PO Box 193, Fowler, Kansas Leighton Miller PO Box 272, Fowler, Kansas Janice Smith PO Box 177, Fowler, Kansas
Key Staff Superintendent: Sam Seybold Board Clerk/Supt. Office: Brenda Wenta Jr/Sr High Principal: Sam Seybold Elementary Principal: Marian Roberts Counselor: Laurie Devine Activities Director: Jason Fawcett Transportation Supervisor: Dennis McDowell
2
District Accomplishments and Challenges Accomplishments: Fowler’s graduation rate is traditionally 100%. Very few districts in Kansas report as high. Five (5) of our grade levels attained the Standard of Excellence. The North Central Accreditation Association made a site visit to the District in the spring of 2004 and once again, granted full accreditation status to the District. The District recently upgraded all computer labs. Challenges: As with most districts in Kansas, one of our main challenges is to continue offering quality instruction within the parameters of the state budget. The rising cost of health care and attracting staff to a rural community will remain a challenge
3
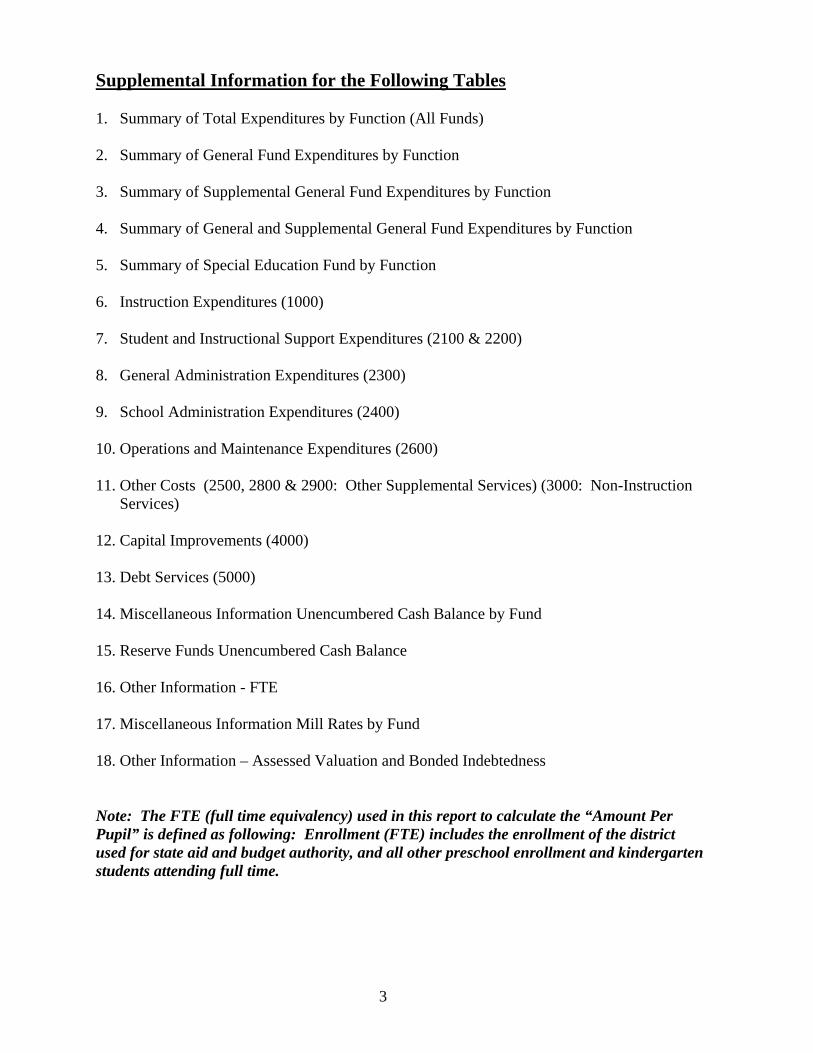
Supplemental Information for the Following Tables 1. Summary of Total Expenditures by Function (All Funds) 2. Summary of General Fund Expenditures by Function 3. Summary of Supplemental General Fund Expenditures by Function 4. Summary of General and Supplemental General Fund Expenditures by Function 5. Summary of Special Education Fund by Function 6. Instruction Expenditures (1000) 7. Student and Instructional Support Expenditures (2100 & 2200) 8. General Administration Expenditures (2300) 9. School Administration Expenditures (2400) 10. Operations and Maintenance Expenditures (2600) 11. Other Costs (2500, 2800 & 2900: Other Supplemental Services) (3000: Non-Instruction
Services) 12. Capital Improvements (4000) 13. Debt Services (5000) 14. Miscellaneous Information Unencumbered Cash Balance by Fund 15. Reserve Funds Unencumbered Cash Balance 16. Other Information - FTE 17. Miscellaneous Information Mill Rates by Fund 18. Other Information – Assessed Valuation and Bonded Indebtedness Note: The FTE (full time equivalency) used in this report to calculate the “Amount Per Pupil” is defined as following: Enrollment (FTE) includes the enrollment of the district used for state aid and budget authority, and all other preschool enrollment and kindergarten students attending full time.
4
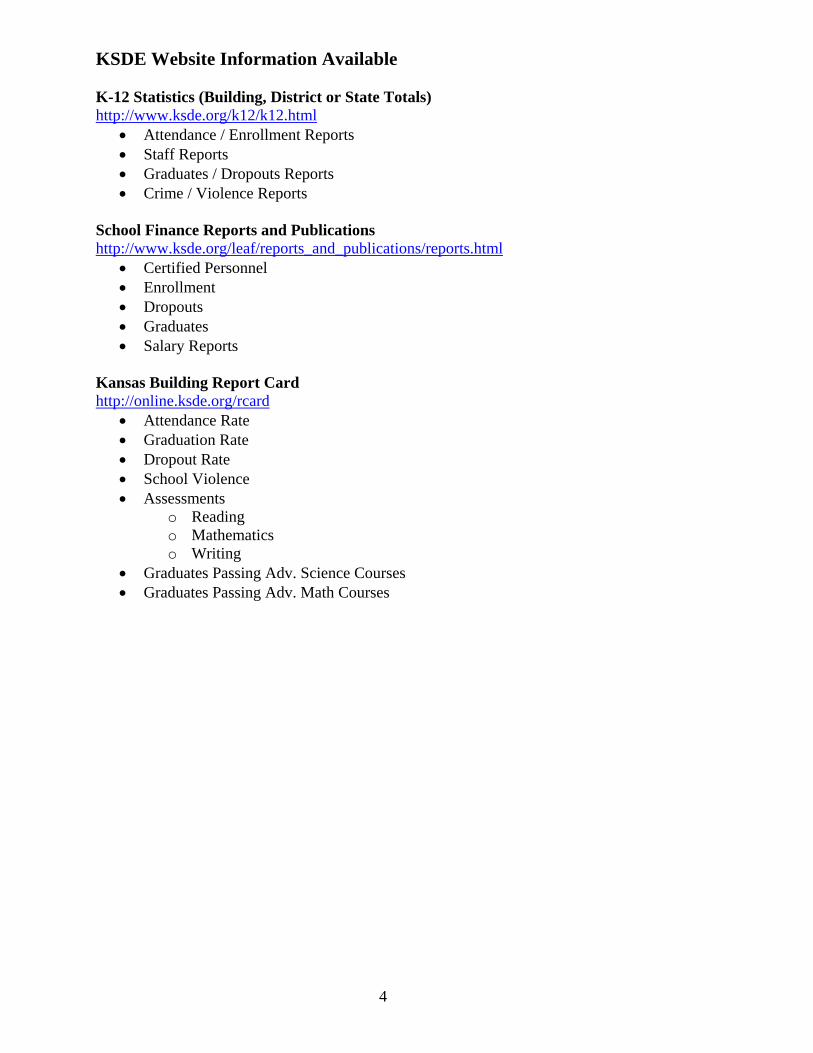
KSDE Website Information Available K-12 Statistics (Building, District or State Totals) http://www.ksde.org/k12/k12.html
• Attendance / Enrollment Reports • Staff Reports • Graduates / Dropouts Reports • Crime / Violence Reports
School Finance Reports and Publications http://www.ksde.org/leaf/reports_and_publications/reports.html
• Certified Personnel • Enrollment • Dropouts • Graduates • Salary Reports
Kansas Building Report Card http://online.ksde.org/rcard
• Attendance Rate • Graduation Rate • Dropout Rate • School Violence • Assessments
o Reading o Mathematics o Writing
• Graduates Passing Adv. Science Courses • Graduates Passing Adv. Math Courses
USD# 225
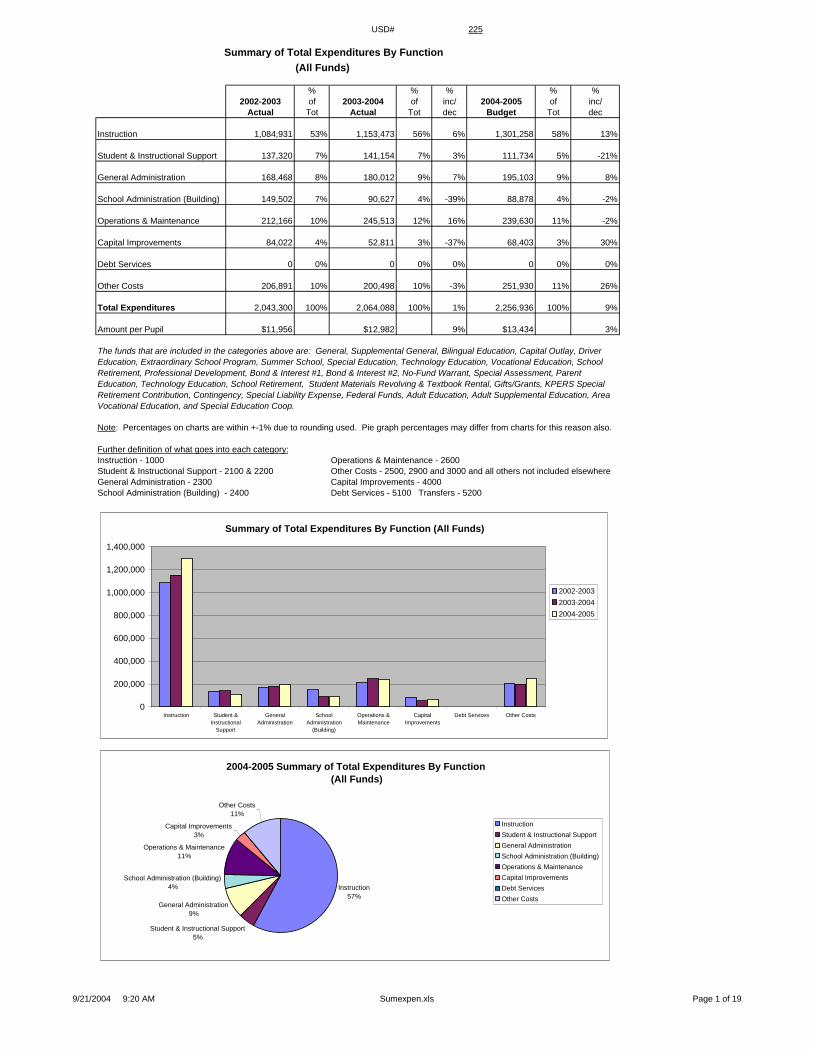
Summary of Total Expenditures By Function(All Funds)
% % % % %2002-2003 of 2003-2004 of inc/ 2004-2005 of inc/
Actual Tot Actual Tot dec Budget Tot dec
Instruction 1,084,931 53% 1,153,473 56% 6% 1,301,258 58% 13%
Student & Instructional Support 137,320 7% 141,154 7% 3% 111,734 5% -21%
General Administration 168,468 8% 180,012 9% 7% 195,103 9% 8%
School Administration (Building) 149,502 7% 90,627 4% -39% 88,878 4% -2%
Operations & Maintenance 212,166 10% 245,513 12% 16% 239,630 11% -2%
Capital Improvements 84,022 4% 52,811 3% -37% 68,403 3% 30%
Debt Services 0 0% 0 0% 0% 0 0% 0%
Other Costs 206,891 10% 200,498 10% -3% 251,930 11% 26%
Total Expenditures 2,043,300 100% 2,064,088 100% 1% 2,256,936 100% 9%
Amount per Pupil $11,956 $12,982 9% $13,434 3%
Note: Percentages on charts are within +-1% due to rounding used. Pie graph percentages may differ from charts for this reason also.
Further definition of what goes into each category:Instruction - 1000 Operations & Maintenance - 2600Student & Instructional Support - 2100 & 2200 Other Costs - 2500, 2900 and 3000 and all others not included elsewhereGeneral Administration - 2300 Capital Improvements - 4000School Administration (Building) - 2400 Debt Services - 5100 Transfers - 5200
The funds that are included in the categories above are: General, Supplemental General, Bilingual Education, Capital Outlay, Driver Education, Extraordinary School Program, Summer School, Special Education, Technology Education, Vocational Education, School Retirement, Professional Development, Bond & Interest #1, Bond & Interest #2, No-Fund Warrant, Special Assessment, Parent Education, Technology Education, School Retirement, Student Materials Revolving & Textbook Rental, Gifts/Grants, KPERS Special Retirement Contribution, Contingency, Special Liability Expense, Federal Funds, Adult Education, Adult Supplemental Education, Area Vocational Education, and Special Education Coop.
Summary of Total Expenditures By Function (All Funds)
0
200,000
400,000
600,000
800,000
1,000,000
1,200,000
1,400,000
Instruction Student &Instructional
Support
GeneralAdministration
SchoolAdministration
(Building)
Operations &Maintenance
CapitalImprovements
Debt Services Other Costs
2002-20032003-20042004-2005
2004-2005 Summary of Total Expenditures By Function (All Funds)
Instruction57%
Student & Instructional Support5%
General Administration9%
School Administration (Building)4%
Operations & Maintenance11%
Capital Improvements3%
Other Costs11%
InstructionStudent & Instructional SupportGeneral AdministrationSchool Administration (Building)Operations & MaintenanceCapital ImprovementsDebt ServicesOther Costs
9/21/2004 9:20 AM Sumexpen.xls Page 1 of 19
USD# 225
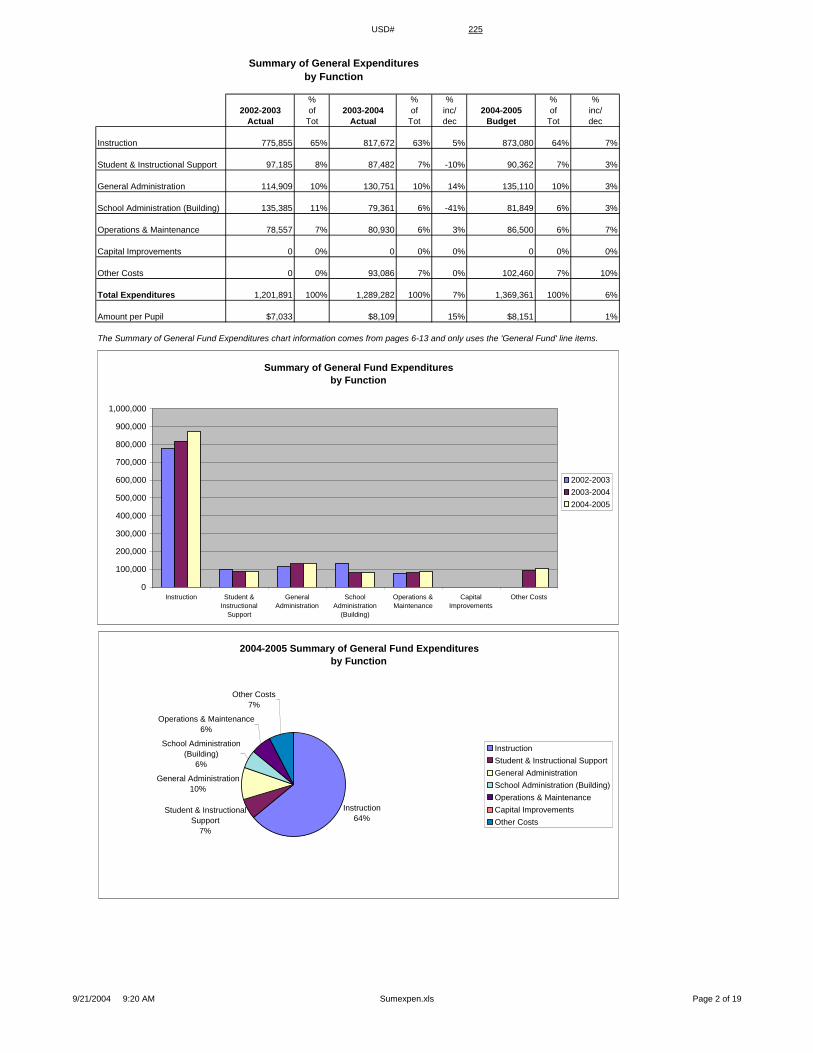
Summary of General Expendituresby Function
% % % % %2002-2003 of 2003-2004 of inc/ 2004-2005 of inc/
Actual Tot Actual Tot dec Budget Tot dec
Instruction 775,855 65% 817,672 63% 5% 873,080 64% 7%
Student & Instructional Support 97,185 8% 87,482 7% -10% 90,362 7% 3%
General Administration 114,909 10% 130,751 10% 14% 135,110 10% 3%
School Administration (Building) 135,385 11% 79,361 6% -41% 81,849 6% 3%
Operations & Maintenance 78,557 7% 80,930 6% 3% 86,500 6% 7%
Capital Improvements 0 0% 0 0% 0% 0 0% 0%
Other Costs 0 0% 93,086 7% 0% 102,460 7% 10%
Total Expenditures 1,201,891 100% 1,289,282 100% 7% 1,369,361 100% 6%
Amount per Pupil $7,033 $8,109 15% $8,151 1%
The Summary of General Fund Expenditures chart information comes from pages 6-13 and only uses the 'General Fund' line items.
Summary of General Fund Expendituresby Function
0
100,000
200,000
300,000
400,000
500,000
600,000
700,000
800,000
900,000
1,000,000
Instruction Student &Instructional
Support
GeneralAdministration
SchoolAdministration
(Building)
Operations &Maintenance
CapitalImprovements
Other Costs
2002-20032003-20042004-2005
2004-2005 Summary of General Fund Expendituresby Function
Instruction64%
Student & Instructional Support
7%
General Administration10%
School Administration (Building)
6%
Operations & Maintenance6%
Other Costs7%
InstructionStudent & Instructional SupportGeneral AdministrationSchool Administration (Building)Operations & MaintenanceCapital ImprovementsOther Costs
9/21/2004 9:20 AM Sumexpen.xls Page 2 of 19
USD# 225
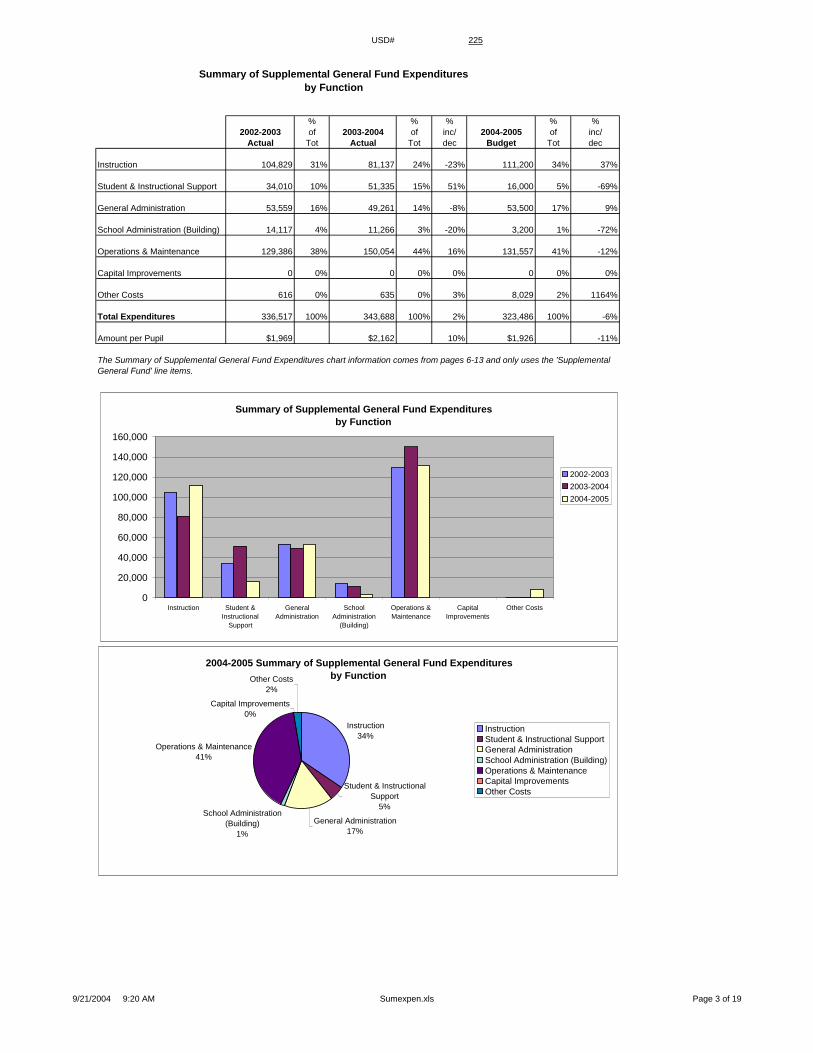
Summary of Supplemental General Fund Expendituresby Function
% % % % %2002-2003 of 2003-2004 of inc/ 2004-2005 of inc/
Actual Tot Actual Tot dec Budget Tot dec
Instruction 104,829 31% 81,137 24% -23% 111,200 34% 37%
Student & Instructional Support 34,010 10% 51,335 15% 51% 16,000 5% -69%
General Administration 53,559 16% 49,261 14% -8% 53,500 17% 9%
School Administration (Building) 14,117 4% 11,266 3% -20% 3,200 1% -72%
Operations & Maintenance 129,386 38% 150,054 44% 16% 131,557 41% -12%
Capital Improvements 0 0% 0 0% 0% 0 0% 0%
Other Costs 616 0% 635 0% 3% 8,029 2% 1164%
Total Expenditures 336,517 100% 343,688 100% 2% 323,486 100% -6%
Amount per Pupil $1,969 $2,162 10% $1,926 -11%
The Summary of Supplemental General Fund Expenditures chart information comes from pages 6-13 and only uses the 'Supplemental General Fund' line items.
2004-2005 Summary of Supplemental General Fund Expendituresby Function
Instruction34%
Student & Instructional Support
5%
General Administration17%
School Administration (Building)
1%
Operations & Maintenance41%
Capital Improvements0%
Other Costs2%
InstructionStudent & Instructional SupportGeneral AdministrationSchool Administration (Building)Operations & MaintenanceCapital ImprovementsOther Costs
Summary of Supplemental General Fund Expendituresby Function
0
20,000
40,000
60,000
80,000
100,000
120,000
140,000
160,000
Instruction Student &Instructional
Support
GeneralAdministration
SchoolAdministration
(Building)
Operations &Maintenance
CapitalImprovements
Other Costs
2002-20032003-20042004-2005
9/21/2004 9:20 AM Sumexpen.xls Page 3 of 19
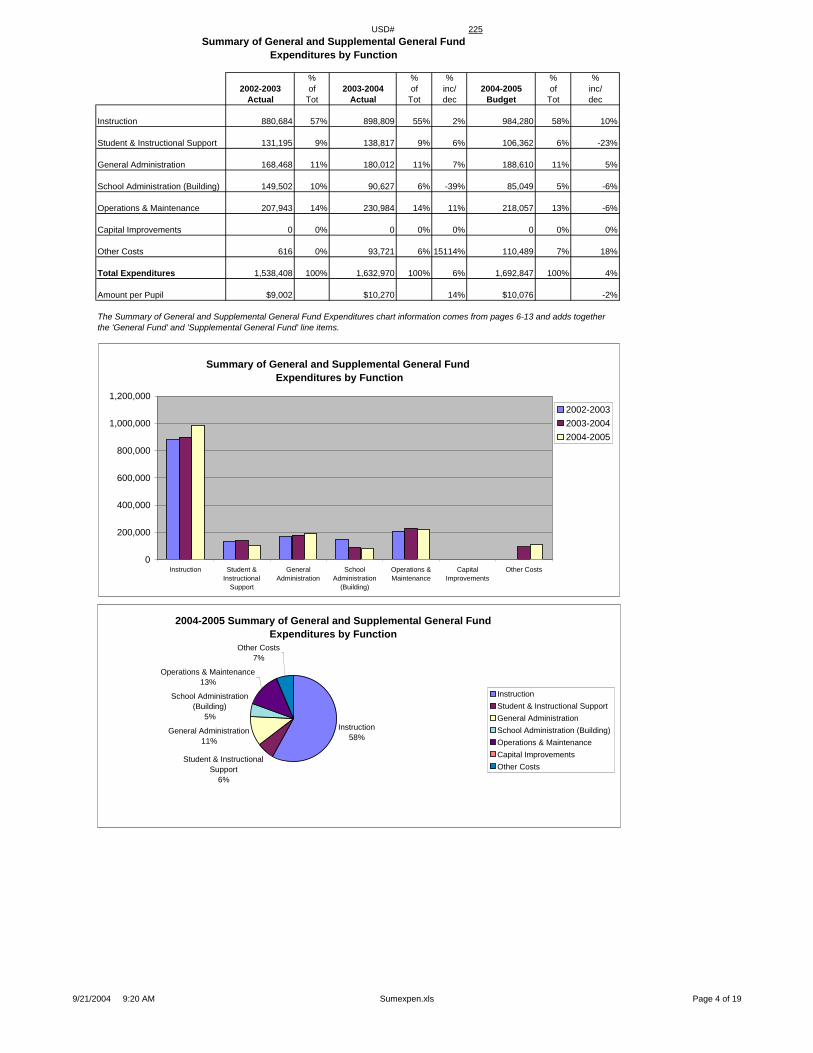
USD# 225Summary of General and Supplemental General Fund
Expenditures by Function
% % % % %2002-2003 of 2003-2004 of inc/ 2004-2005 of inc/
Actual Tot Actual Tot dec Budget Tot dec
Instruction 880,684 57% 898,809 55% 2% 984,280 58% 10%
Student & Instructional Support 131,195 9% 138,817 9% 6% 106,362 6% -23%
General Administration 168,468 11% 180,012 11% 7% 188,610 11% 5%
School Administration (Building) 149,502 10% 90,627 6% -39% 85,049 5% -6%
Operations & Maintenance 207,943 14% 230,984 14% 11% 218,057 13% -6%
Capital Improvements 0 0% 0 0% 0% 0 0% 0%
Other Costs 616 0% 93,721 6% 15114% 110,489 7% 18%
Total Expenditures 1,538,408 100% 1,632,970 100% 6% 1,692,847 100% 4%
Amount per Pupil $9,002 $10,270 14% $10,076 -2%
The Summary of General and Supplemental General Fund Expenditures chart information comes from pages 6-13 and adds togetherthe 'General Fund' and 'Supplemental General Fund' line items.
Summary of General and Supplemental General Fund Expenditures by Function
0
200,000
400,000
600,000
800,000
1,000,000
1,200,000
Instruction Student &Instructional
Support
GeneralAdministration
SchoolAdministration
(Building)
Operations &Maintenance
CapitalImprovements
Other Costs
2002-20032003-20042004-2005
2004-2005 Summary of General and Supplemental General Fund Expenditures by Function
Instruction58%
Student & Instructional Support
6%
General Administration11%
School Administration (Building)
5%
Operations & Maintenance13%
Other Costs7%
InstructionStudent & Instructional SupportGeneral AdministrationSchool Administration (Building)Operations & MaintenanceCapital ImprovementsOther Costs
9/21/2004 9:20 AM Sumexpen.xls Page 4 of 19
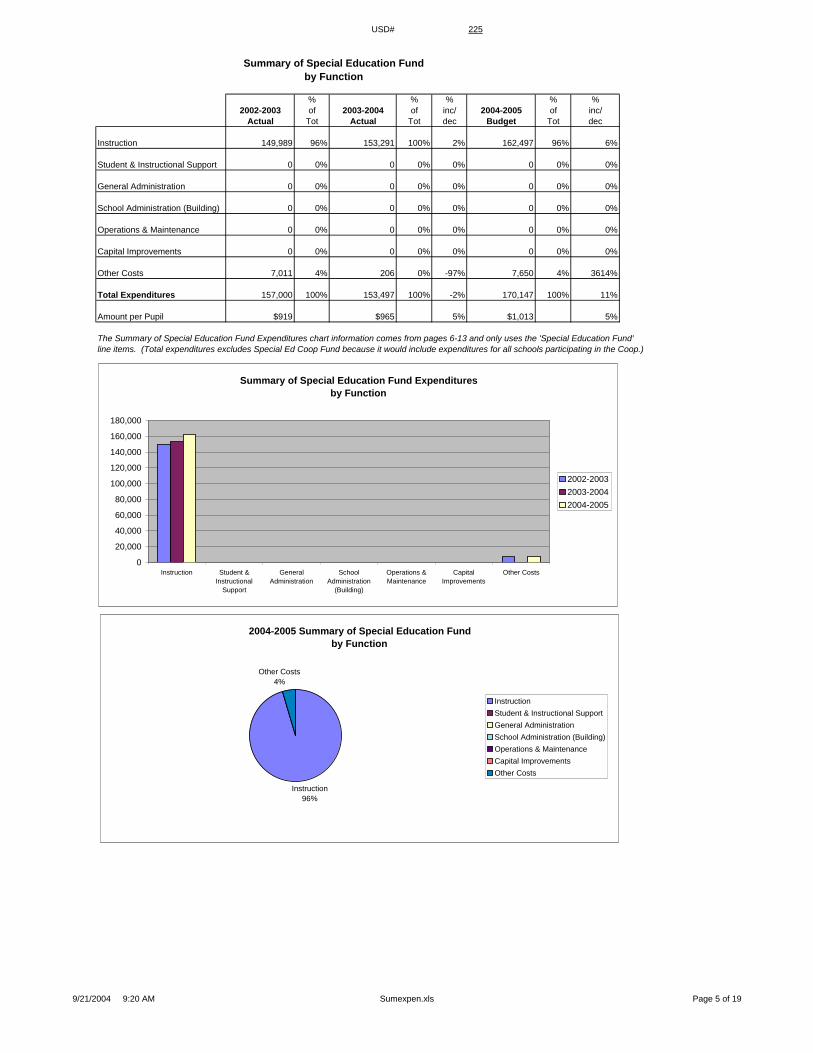
USD# 225
Summary of Special Education Fundby Function
% % % % %2002-2003 of 2003-2004 of inc/ 2004-2005 of inc/
Actual Tot Actual Tot dec Budget Tot dec
Instruction 149,989 96% 153,291 100% 2% 162,497 96% 6%
Student & Instructional Support 0 0% 0 0% 0% 0 0% 0%
General Administration 0 0% 0 0% 0% 0 0% 0%
School Administration (Building) 0 0% 0 0% 0% 0 0% 0%
Operations & Maintenance 0 0% 0 0% 0% 0 0% 0%
Capital Improvements 0 0% 0 0% 0% 0 0% 0%
Other Costs 7,011 4% 206 0% -97% 7,650 4% 3614%
Total Expenditures 157,000 100% 153,497 100% -2% 170,147 100% 11%
Amount per Pupil $919 $965 5% $1,013 5%
The Summary of Special Education Fund Expenditures chart information comes from pages 6-13 and only uses the 'Special Education Fund'line items. (Total expenditures excludes Special Ed Coop Fund because it would include expenditures for all schools participating in the Coop.)
Summary of Special Education Fund Expendituresby Function
0
20,000
40,000
60,000
80,000
100,000
120,000
140,000
160,000
180,000
Instruction Student &Instructional
Support
GeneralAdministration
SchoolAdministration
(Building)
Operations &Maintenance
CapitalImprovements
Other Costs
2002-20032003-20042004-2005
2004-2005 Summary of Special Education Fundby Function
Instruction96%
Other Costs4%
InstructionStudent & Instructional SupportGeneral AdministrationSchool Administration (Building)Operations & MaintenanceCapital ImprovementsOther Costs
9/21/2004 9:20 AM Sumexpen.xls Page 5 of 19
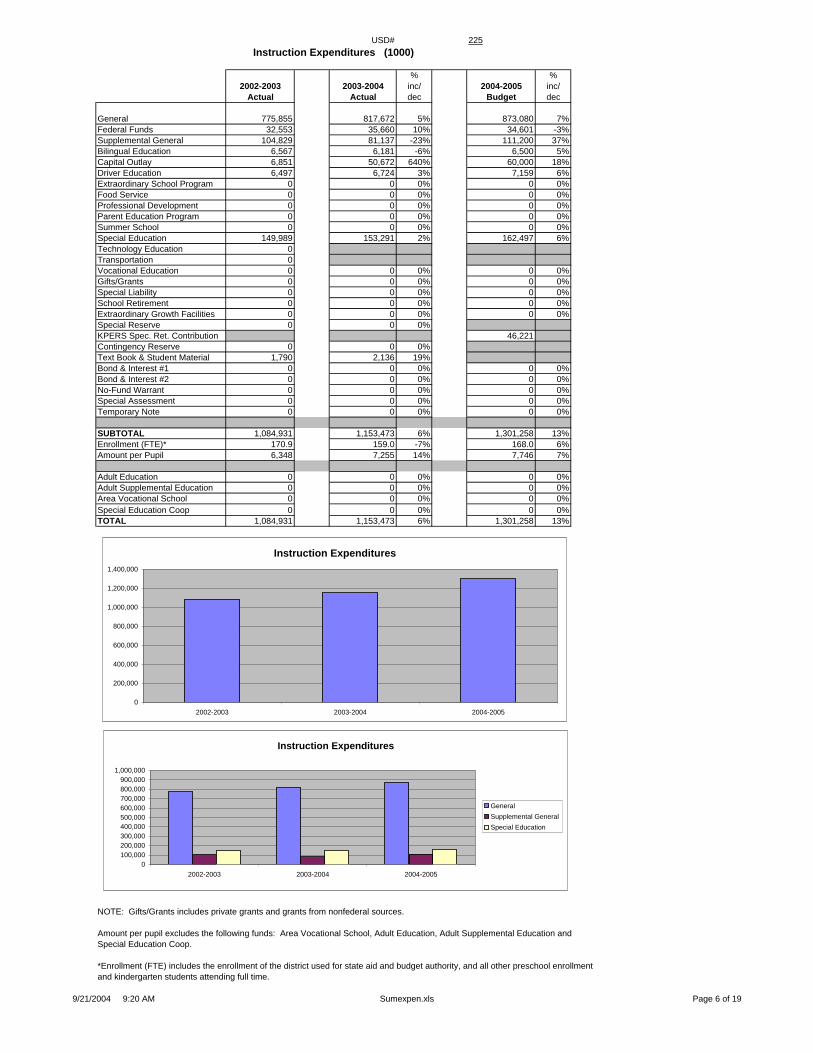
USD# 225Instruction Expenditures (1000)
% %2002-2003 2003-2004 inc/ 2004-2005 inc/
Actual Actual dec Budget dec
General 775,855 817,672 5% 873,080 7%Federal Funds 32,553 35,660 10% 34,601 -3%Supplemental General 104,829 81,137 -23% 111,200 37%Bilingual Education 6,567 6,181 -6% 6,500 5%Capital Outlay 6,851 50,672 640% 60,000 18%Driver Education 6,497 6,724 3% 7,159 6%Extraordinary School Program 0 0 0% 0 0%Food Service 0 0 0% 0 0%Professional Development 0 0 0% 0 0%Parent Education Program 0 0 0% 0 0%Summer School 0 0 0% 0 0%Special Education 149,989 153,291 2% 162,497 6%Technology Education 0Transportation 0Vocational Education 0 0 0% 0 0%Gifts/Grants 0 0 0% 0 0%Special Liability 0 0 0% 0 0%School Retirement 0 0 0% 0 0%Extraordinary Growth Facilities 0 0 0% 0 0%Special Reserve 0 0 0%KPERS Spec. Ret. Contribution 46,221Contingency Reserve 0 0 0%Text Book & Student Material 1,790 2,136 19%Bond & Interest #1 0 0 0% 0 0%Bond & Interest #2 0 0 0% 0 0%No-Fund Warrant 0 0 0% 0 0%Special Assessment 0 0 0% 0 0%Temporary Note 0 0 0% 0 0%
SUBTOTAL 1,084,931 1,153,473 6% 1,301,258 13%Enrollment (FTE)* 170.9 159.0 -7% 168.0 6%Amount per Pupil 6,348 7,255 14% 7,746 7%
Adult Education 0 0 0% 0 0%Adult Supplemental Education 0 0 0% 0 0%Area Vocational School 0 0 0% 0 0%Special Education Coop 0 0 0% 0 0%TOTAL 1,084,931 1,153,473 6% 1,301,258 13%
NOTE: Gifts/Grants includes private grants and grants from nonfederal sources.
Amount per pupil excludes the following funds: Area Vocational School, Adult Education, Adult Supplemental Education andSpecial Education Coop.
*Enrollment (FTE) includes the enrollment of the district used for state aid and budget authority, and all other preschool enrollmentand kindergarten students attending full time.
Instruction Expenditures
0
200,000
400,000
600,000
800,000
1,000,000
1,200,000
1,400,000
2002-2003 2003-2004 2004-2005
Instruction Expenditures
0100,000200,000300,000400,000500,000600,000700,000800,000900,000
1,000,000
2002-2003 2003-2004 2004-2005
General Supplemental GeneralSpecial Education
9/21/2004 9:20 AM Sumexpen.xls Page 6 of 19
USD# 225
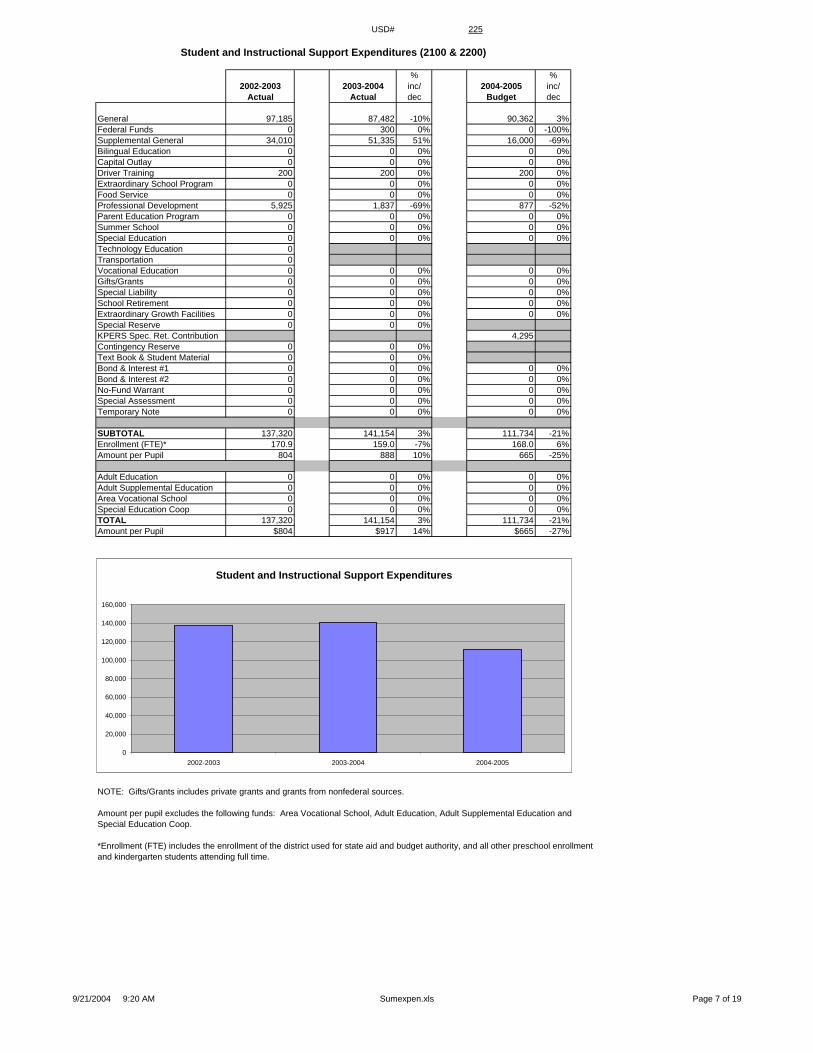
Student and Instructional Support Expenditures (2100 & 2200)
% %2002-2003 2003-2004 inc/ 2004-2005 inc/
Actual Actual dec Budget dec
General 97,185 87,482 -10% 90,362 3%Federal Funds 0 300 0% 0 -100%Supplemental General 34,010 51,335 51% 16,000 -69%Bilingual Education 0 0 0% 0 0%Capital Outlay 0 0 0% 0 0%Driver Training 200 200 0% 200 0%Extraordinary School Program 0 0 0% 0 0%Food Service 0 0 0% 0 0%Professional Development 5,925 1,837 -69% 877 -52%Parent Education Program 0 0 0% 0 0%Summer School 0 0 0% 0 0%Special Education 0 0 0% 0 0%Technology Education 0Transportation 0Vocational Education 0 0 0% 0 0%Gifts/Grants 0 0 0% 0 0%Special Liability 0 0 0% 0 0%School Retirement 0 0 0% 0 0%Extraordinary Growth Facilities 0 0 0% 0 0%Special Reserve 0 0 0%KPERS Spec. Ret. Contribution 4,295Contingency Reserve 0 0 0%Text Book & Student Material 0 0 0%Bond & Interest #1 0 0 0% 0 0%Bond & Interest #2 0 0 0% 0 0%No-Fund Warrant 0 0 0% 0 0%Special Assessment 0 0 0% 0 0%Temporary Note 0 0 0% 0 0%
SUBTOTAL 137,320 141,154 3% 111,734 -21%Enrollment (FTE)* 170.9 159.0 -7% 168.0 6%Amount per Pupil 804 888 10% 665 -25%
Adult Education 0 0 0% 0 0%Adult Supplemental Education 0 0 0% 0 0%Area Vocational School 0 0 0% 0 0%Special Education Coop 0 0 0% 0 0%TOTAL 137,320 141,154 3% 111,734 -21%Amount per Pupil $804 $917 14% $665 -27%
NOTE: Gifts/Grants includes private grants and grants from nonfederal sources.
Amount per pupil excludes the following funds: Area Vocational School, Adult Education, Adult Supplemental Education andSpecial Education Coop.
*Enrollment (FTE) includes the enrollment of the district used for state aid and budget authority, and all other preschool enrollmentand kindergarten students attending full time.
Student and Instructional Support Expenditures
0
20,000
40,000
60,000
80,000
100,000
120,000
140,000
160,000
2002-2003 2003-2004 2004-2005
9/21/2004 9:20 AM Sumexpen.xls Page 7 of 19
USD# 225
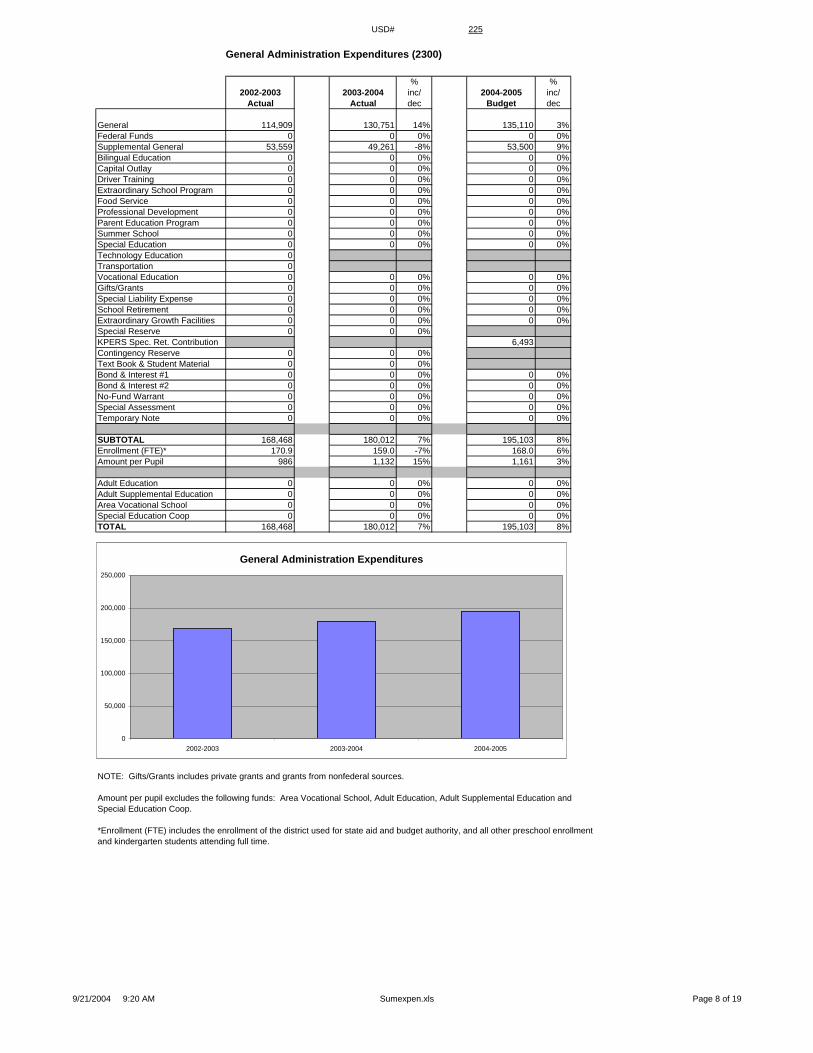
General Administration Expenditures (2300)
% %2002-2003 2003-2004 inc/ 2004-2005 inc/
Actual Actual dec Budget dec
General 114,909 130,751 14% 135,110 3%Federal Funds 0 0 0% 0 0%Supplemental General 53,559 49,261 -8% 53,500 9%Bilingual Education 0 0 0% 0 0%Capital Outlay 0 0 0% 0 0%Driver Training 0 0 0% 0 0%Extraordinary School Program 0 0 0% 0 0%Food Service 0 0 0% 0 0%Professional Development 0 0 0% 0 0%Parent Education Program 0 0 0% 0 0%Summer School 0 0 0% 0 0%Special Education 0 0 0% 0 0%Technology Education 0Transportation 0Vocational Education 0 0 0% 0 0%Gifts/Grants 0 0 0% 0 0%Special Liability Expense 0 0 0% 0 0%School Retirement 0 0 0% 0 0%Extraordinary Growth Facilities 0 0 0% 0 0%Special Reserve 0 0 0%KPERS Spec. Ret. Contribution 6,493Contingency Reserve 0 0 0%Text Book & Student Material 0 0 0%Bond & Interest #1 0 0 0% 0 0%Bond & Interest #2 0 0 0% 0 0%No-Fund Warrant 0 0 0% 0 0%Special Assessment 0 0 0% 0 0%Temporary Note 0 0 0% 0 0%
SUBTOTAL 168,468 180,012 7% 195,103 8%Enrollment (FTE)* 170.9 159.0 -7% 168.0 6%Amount per Pupil 986 1,132 15% 1,161 3%
Adult Education 0 0 0% 0 0%Adult Supplemental Education 0 0 0% 0 0%Area Vocational School 0 0 0% 0 0%Special Education Coop 0 0 0% 0 0%TOTAL 168,468 180,012 7% 195,103 8%
NOTE: Gifts/Grants includes private grants and grants from nonfederal sources.
Amount per pupil excludes the following funds: Area Vocational School, Adult Education, Adult Supplemental Education andSpecial Education Coop.
*Enrollment (FTE) includes the enrollment of the district used for state aid and budget authority, and all other preschool enrollmentand kindergarten students attending full time.
General Administration Expenditures
0
50,000
100,000
150,000
200,000
250,000
2002-2003 2003-2004 2004-2005
9/21/2004 9:20 AM Sumexpen.xls Page 8 of 19
USD# 225
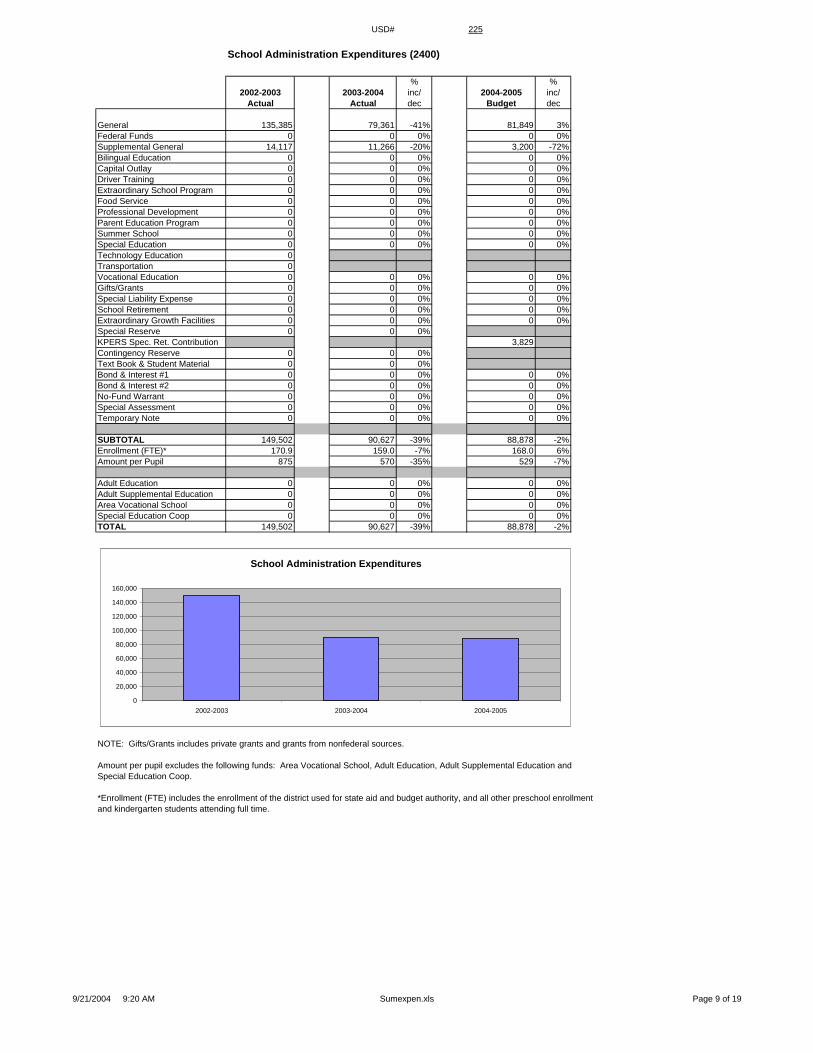
School Administration Expenditures (2400)
% %2002-2003 2003-2004 inc/ 2004-2005 inc/
Actual Actual dec Budget dec
General 135,385 79,361 -41% 81,849 3%Federal Funds 0 0 0% 0 0%Supplemental General 14,117 11,266 -20% 3,200 -72%Bilingual Education 0 0 0% 0 0%Capital Outlay 0 0 0% 0 0%Driver Training 0 0 0% 0 0%Extraordinary School Program 0 0 0% 0 0%Food Service 0 0 0% 0 0%Professional Development 0 0 0% 0 0%Parent Education Program 0 0 0% 0 0%Summer School 0 0 0% 0 0%Special Education 0 0 0% 0 0%Technology Education 0Transportation 0Vocational Education 0 0 0% 0 0%Gifts/Grants 0 0 0% 0 0%Special Liability Expense 0 0 0% 0 0%School Retirement 0 0 0% 0 0%Extraordinary Growth Facilities 0 0 0% 0 0%Special Reserve 0 0 0%KPERS Spec. Ret. Contribution 3,829Contingency Reserve 0 0 0%Text Book & Student Material 0 0 0%Bond & Interest #1 0 0 0% 0 0%Bond & Interest #2 0 0 0% 0 0%No-Fund Warrant 0 0 0% 0 0%Special Assessment 0 0 0% 0 0%Temporary Note 0 0 0% 0 0%
SUBTOTAL 149,502 90,627 -39% 88,878 -2%Enrollment (FTE)* 170.9 159.0 -7% 168.0 6%Amount per Pupil 875 570 -35% 529 -7%
Adult Education 0 0 0% 0 0%Adult Supplemental Education 0 0 0% 0 0%Area Vocational School 0 0 0% 0 0%Special Education Coop 0 0 0% 0 0%TOTAL 149,502 90,627 -39% 88,878 -2%
NOTE: Gifts/Grants includes private grants and grants from nonfederal sources.
Amount per pupil excludes the following funds: Area Vocational School, Adult Education, Adult Supplemental Education andSpecial Education Coop.
*Enrollment (FTE) includes the enrollment of the district used for state aid and budget authority, and all other preschool enrollmentand kindergarten students attending full time.
School Administration Expenditures
0
20,000
40,000
60,000
80,000
100,000
120,000
140,000
160,000
2002-2003 2003-2004 2004-2005
9/21/2004 9:20 AM Sumexpen.xls Page 9 of 19
USD# 225
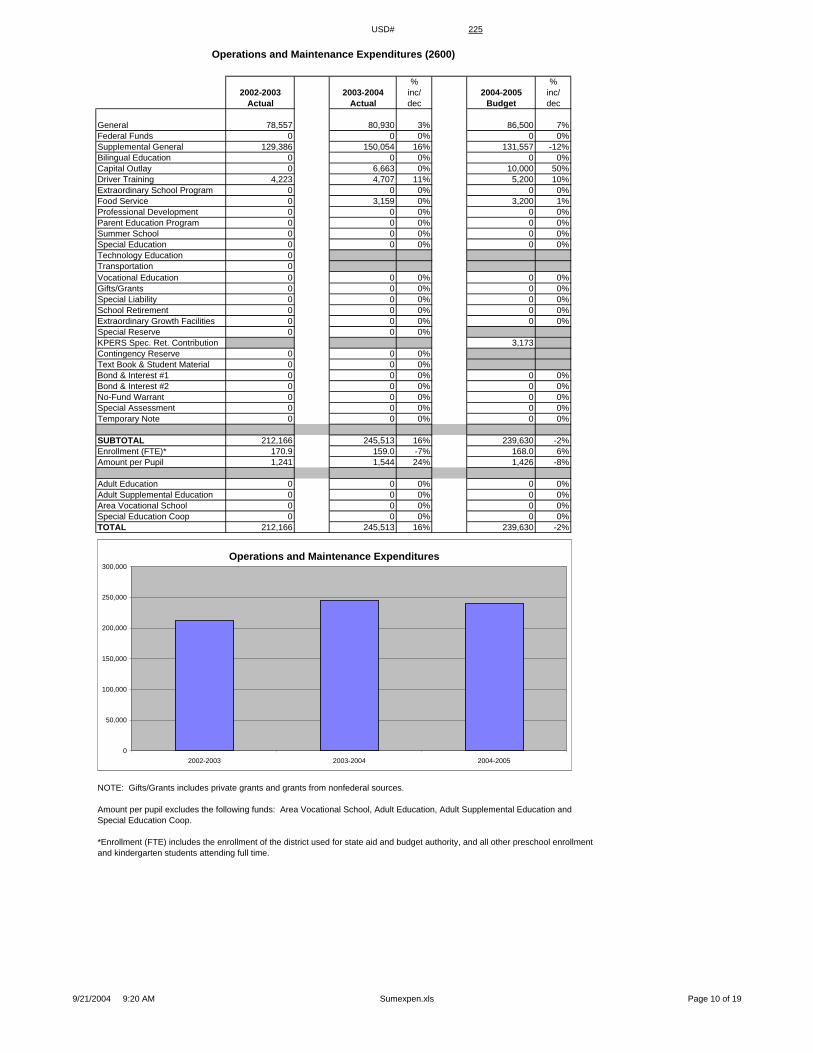
Operations and Maintenance Expenditures (2600)
% %2002-2003 2003-2004 inc/ 2004-2005 inc/
Actual Actual dec Budget dec
General 78,557 80,930 3% 86,500 7%Federal Funds 0 0 0% 0 0%Supplemental General 129,386 150,054 16% 131,557 -12%Bilingual Education 0 0 0% 0 0%Capital Outlay 0 6,663 0% 10,000 50%Driver Training 4,223 4,707 11% 5,200 10%Extraordinary School Program 0 0 0% 0 0%Food Service 0 3,159 0% 3,200 1%Professional Development 0 0 0% 0 0%Parent Education Program 0 0 0% 0 0%Summer School 0 0 0% 0 0%Special Education 0 0 0% 0 0%Technology Education 0Transportation 0Vocational Education 0 0 0% 0 0%Gifts/Grants 0 0 0% 0 0%Special Liability 0 0 0% 0 0%School Retirement 0 0 0% 0 0%Extraordinary Growth Facilities 0 0 0% 0 0%Special Reserve 0 0 0%KPERS Spec. Ret. Contribution 3,173Contingency Reserve 0 0 0%Text Book & Student Material 0 0 0%Bond & Interest #1 0 0 0% 0 0%Bond & Interest #2 0 0 0% 0 0%No-Fund Warrant 0 0 0% 0 0%Special Assessment 0 0 0% 0 0%Temporary Note 0 0 0% 0 0%
SUBTOTAL 212,166 245,513 16% 239,630 -2%Enrollment (FTE)* 170.9 159.0 -7% 168.0 6%Amount per Pupil 1,241 1,544 24% 1,426 -8%
Adult Education 0 0 0% 0 0%Adult Supplemental Education 0 0 0% 0 0%Area Vocational School 0 0 0% 0 0%Special Education Coop 0 0 0% 0 0%TOTAL 212,166 245,513 16% 239,630 -2%
NOTE: Gifts/Grants includes private grants and grants from nonfederal sources.
Amount per pupil excludes the following funds: Area Vocational School, Adult Education, Adult Supplemental Education andSpecial Education Coop.
*Enrollment (FTE) includes the enrollment of the district used for state aid and budget authority, and all other preschool enrollmentand kindergarten students attending full time.
Operations and Maintenance Expenditures
0
50,000
100,000
150,000
200,000
250,000
300,000
2002-2003 2003-2004 2004-2005
9/21/2004 9:20 AM Sumexpen.xls Page 10 of 19
USD# 225
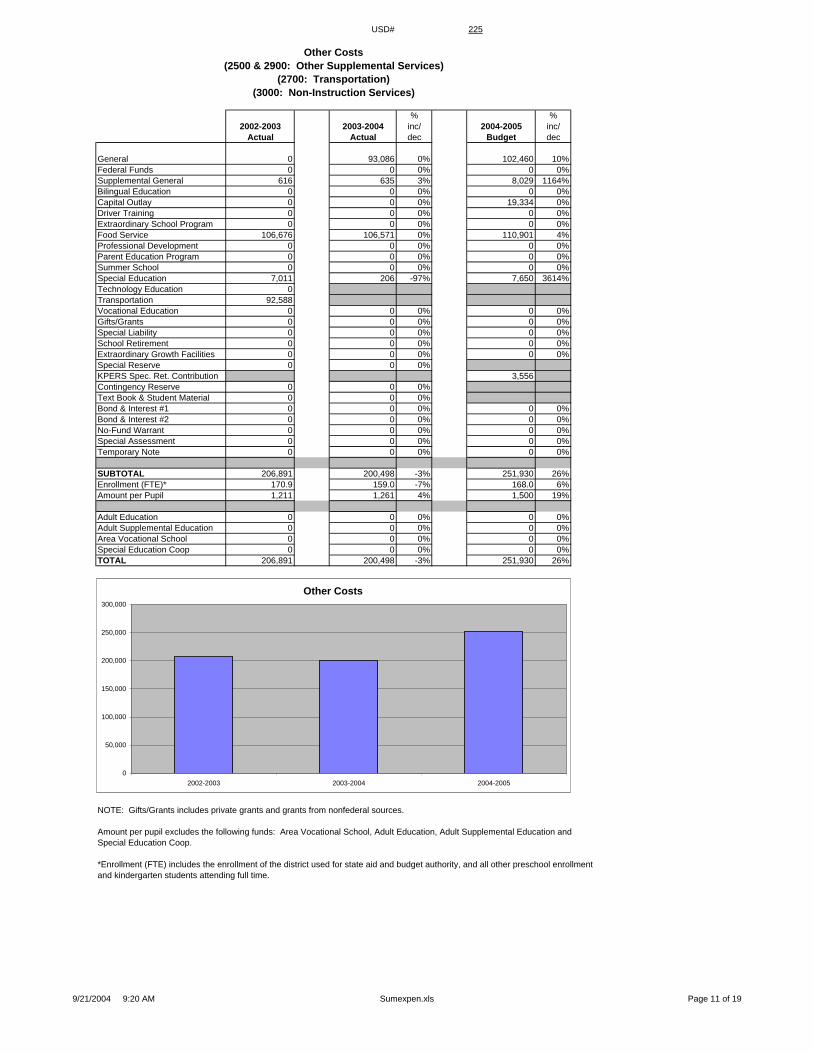
Other Costs(2500 & 2900: Other Supplemental Services)
(2700: Transportation)(3000: Non-Instruction Services)
% %2002-2003 2003-2004 inc/ 2004-2005 inc/
Actual Actual dec Budget dec
General 0 93,086 0% 102,460 10%Federal Funds 0 0 0% 0 0%Supplemental General 616 635 3% 8,029 1164%Bilingual Education 0 0 0% 0 0%Capital Outlay 0 0 0% 19,334 0%Driver Training 0 0 0% 0 0%Extraordinary School Program 0 0 0% 0 0%Food Service 106,676 106,571 0% 110,901 4%Professional Development 0 0 0% 0 0%Parent Education Program 0 0 0% 0 0%Summer School 0 0 0% 0 0%Special Education 7,011 206 -97% 7,650 3614%Technology Education 0Transportation 92,588Vocational Education 0 0 0% 0 0%Gifts/Grants 0 0 0% 0 0%Special Liability 0 0 0% 0 0%School Retirement 0 0 0% 0 0%Extraordinary Growth Facilities 0 0 0% 0 0%Special Reserve 0 0 0%KPERS Spec. Ret. Contribution 3,556Contingency Reserve 0 0 0%Text Book & Student Material 0 0 0%Bond & Interest #1 0 0 0% 0 0%Bond & Interest #2 0 0 0% 0 0%No-Fund Warrant 0 0 0% 0 0%Special Assessment 0 0 0% 0 0%Temporary Note 0 0 0% 0 0%
SUBTOTAL 206,891 200,498 -3% 251,930 26%Enrollment (FTE)* 170.9 159.0 -7% 168.0 6%Amount per Pupil 1,211 1,261 4% 1,500 19%
Adult Education 0 0 0% 0 0%Adult Supplemental Education 0 0 0% 0 0%Area Vocational School 0 0 0% 0 0%Special Education Coop 0 0 0% 0 0%TOTAL 206,891 200,498 -3% 251,930 26%
NOTE: Gifts/Grants includes private grants and grants from nonfederal sources.
Amount per pupil excludes the following funds: Area Vocational School, Adult Education, Adult Supplemental Education andSpecial Education Coop.
*Enrollment (FTE) includes the enrollment of the district used for state aid and budget authority, and all other preschool enrollmentand kindergarten students attending full time.
Other Costs
0
50,000
100,000
150,000
200,000
250,000
300,000
2002-2003 2003-2004 2004-2005
9/21/2004 9:20 AM Sumexpen.xls Page 11 of 19
USD# 225
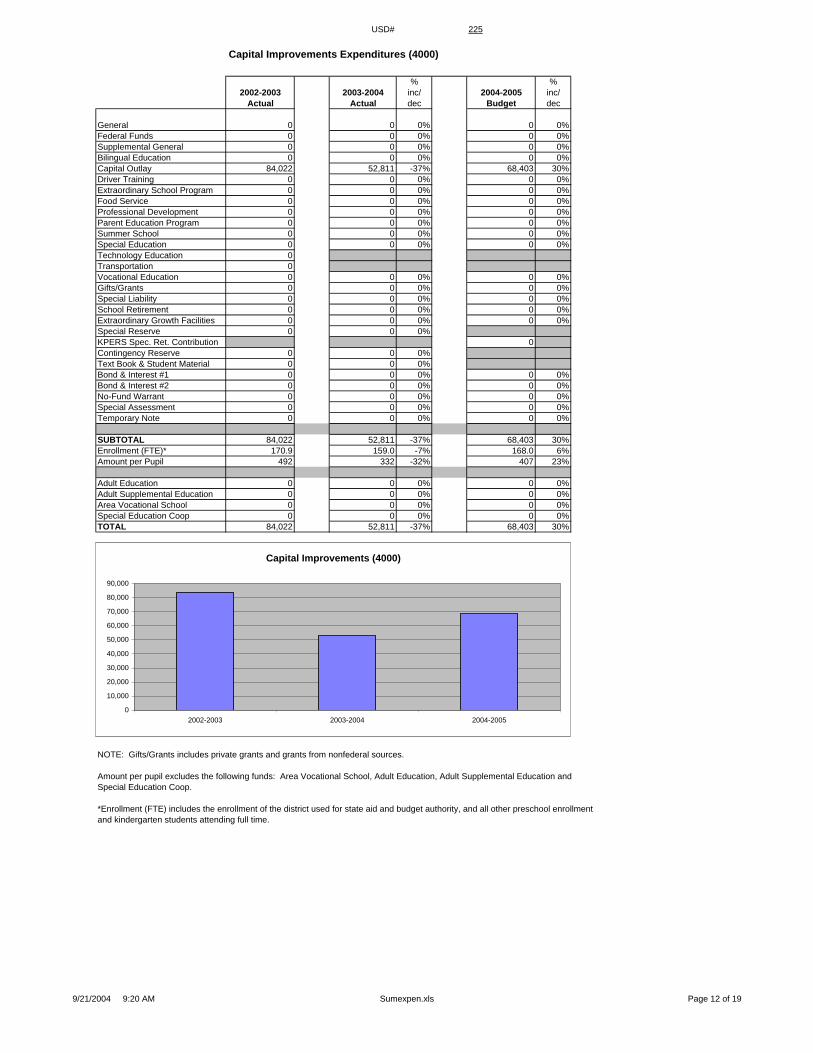
Capital Improvements Expenditures (4000)
% %2002-2003 2003-2004 inc/ 2004-2005 inc/
Actual Actual dec Budget dec
General 0 0 0% 0 0%Federal Funds 0 0 0% 0 0%Supplemental General 0 0 0% 0 0%Bilingual Education 0 0 0% 0 0%Capital Outlay 84,022 52,811 -37% 68,403 30%Driver Training 0 0 0% 0 0%Extraordinary School Program 0 0 0% 0 0%Food Service 0 0 0% 0 0%Professional Development 0 0 0% 0 0%Parent Education Program 0 0 0% 0 0%Summer School 0 0 0% 0 0%Special Education 0 0 0% 0 0%Technology Education 0Transportation 0Vocational Education 0 0 0% 0 0%Gifts/Grants 0 0 0% 0 0%Special Liability 0 0 0% 0 0%School Retirement 0 0 0% 0 0%Extraordinary Growth Facilities 0 0 0% 0 0%Special Reserve 0 0 0%KPERS Spec. Ret. Contribution 0Contingency Reserve 0 0 0%Text Book & Student Material 0 0 0%Bond & Interest #1 0 0 0% 0 0%Bond & Interest #2 0 0 0% 0 0%No-Fund Warrant 0 0 0% 0 0%Special Assessment 0 0 0% 0 0%Temporary Note 0 0 0% 0 0%
SUBTOTAL 84,022 52,811 -37% 68,403 30%Enrollment (FTE)* 170.9 159.0 -7% 168.0 6%Amount per Pupil 492 332 -32% 407 23%
Adult Education 0 0 0% 0 0%Adult Supplemental Education 0 0 0% 0 0%Area Vocational School 0 0 0% 0 0%Special Education Coop 0 0 0% 0 0%TOTAL 84,022 52,811 -37% 68,403 30%
NOTE: Gifts/Grants includes private grants and grants from nonfederal sources.
Amount per pupil excludes the following funds: Area Vocational School, Adult Education, Adult Supplemental Education andSpecial Education Coop.
*Enrollment (FTE) includes the enrollment of the district used for state aid and budget authority, and all other preschool enrollmentand kindergarten students attending full time.
Capital Improvements (4000)
0
10,000
20,000
30,000
40,000
50,000
60,000
70,000
80,000
90,000
2002-2003 2003-2004 2004-2005
9/21/2004 9:20 AM Sumexpen.xls Page 12 of 19
USD# 225
Debt Services Expenditures (5100)
% %2002-2003 2003-2004 inc/ 2004-2005 inc/
Actual Actual dec Budget dec
General 0 0 0% 0 0%Federal Funds 0 0 0% 0 0%Supplemental General 0 0 0% 0 0%Bilingual Education 0 0 0% 0 0%Capital Outlay 0 0 0% 0 0%Driver Training 0 0 0% 0 0%Extraordinary School Program 0 0 0% 0 0%Food Service 0 0 0% 0 0%Professional Development 0 0 0% 0 0%Parent Education Program 0 0 0% 0 0%Summer School 0 0 0% 0 0%Special Education 0 0 0% 0 0%Technology Education 0Transportation 0Vocational Education 0 0 0% 0 0%Gifts/Grants 0 0 0% 0 0%Special Liability 0 0 0% 0 0%School Retirement 0 0 0% 0 0%Extraordinary Growth Facilities 0 0 0% 0 0%Special Reserve 0 0 0%KPERS Spec. Ret. Contribution 0Contingency Reserve 0 0 0%Text Book & Student Material 0 0 0%Bond & Interest #1 0 0 0% 0 0%Bond & Interest #2 0 0 0% 0 0%No-Fund Warrant 0 0 0% 0 0%Special Assessment 0 0 0% 0 0%Temporary Note 0 0 0% 0 0%
SUBTOTAL 0 0 0% 0 0%Enrollment (FTE)* 170.9 159.0 -7% 168.0 6%Amount per Pupil 0 0 0% 0 0%
Adult Education 0 0 0% 0 0%Adult Supplemental Education 0 0 0% 0 0%Area Vocational School 0 0 0% 0 0%Special Education Coop 0 0 0% 0 0%TOTAL 0 0 0% 0 0%
NOTE: Gifts/Grants includes private grants and grants from nonfederal sources.
Amount per pupil excludes the following funds: Area Vocational School, Adult Education, Adult Supplemental Education andSpecial Education Coop.
*Enrollment (FTE) includes the enrollment of the district used for state aid and budget authority, and all other preschool enrollmentand kindergarten students attending full time.
Debt Services (5100)
00000111111
2002-2003 2003-2004 2004-2005
9/21/2004 9:20 AM Sumexpen.xls Page 13 of 19

USD# 225
Transfers (5200)
% %2002-2003 2003-2004 inc/ 2004-2005 inc/
Actual Actual dec Budget dec
General 271,071 185,611 -32% 102,828 -45%Federal Funds 0 0 0% 0 0%Supplemental General 30,240 8,000 -74% 44,561 457%Bilingual Education 0 0 0% 0 0%Capital Outlay 0Driver Training 0 0 0% 0 0%Extraordinary School Program 0 0 0% 0 0%Food Service 0 0 0% 0 0%Professional Development 0 0 0% 0 0%Parent Education Program 0 0 0% 0 0%Summer School 0 0 0% 0 0%Special Education 0 0 0% 0 0%Technology Education 0Transportation 0Vocational Education 0 0 0% 0 0%Gifts/Grants 0 0 0% 0 0%Special Liability 0 0 0% 0 0%School Retirement 0 0 0% 0 0%Extraordinary Growth Facilities 0 0 0% 0 0%Special Reserve 0 0 0%KPERS Spec. Ret. Contribution 0Contingency Reserve 0 0 0%Text Book & Student Material 0 0 0%Bond & Interest #1 0 0 0% 0 0%Bond & Interest #2 0 0 0% 0 0%No-Fund Warrant 0 0 0% 0 0%Special Assessment 0 0 0% 0 0%Temporary Note 0 0 0% 0 0%
SUBTOTAL 301,311 193,611 -36% 147,389 -24%Enrollment (FTE)* 170.9 159.0 -7% 168.0 6%Amount per Pupil 1,763 1,218 -31% 877 -28%
Adult Education 0 0 0% 0 0%Adult Supplemental Education 0 0 0% 0 0%Area Vocational School 0 0 0% 0 0%Special Education Coop 0 0 0% 0 0%TOTAL 301,311 193,611 -36% 147,389 -24%
NOTE: Gifts/Grants includes private grants and grants from nonfederal sources.
Amount per pupil excludes the following funds: Area Vocational School, Adult Education, Adult Supplemental Education andSpecial Education Coop.
*Enrollment (FTE) includes the enrollment of the district used for state aid and budget authority, and all other preschool enrollmentand kindergarten students attending full time.
Transfers (5200)
0
50,000
100,000
150,000
200,000
250,000
300,000
350,000
2002-2003 2003-2004 2004-2005
9/21/2004 9:20 AM Sumexpen.xls Page 14 of 19
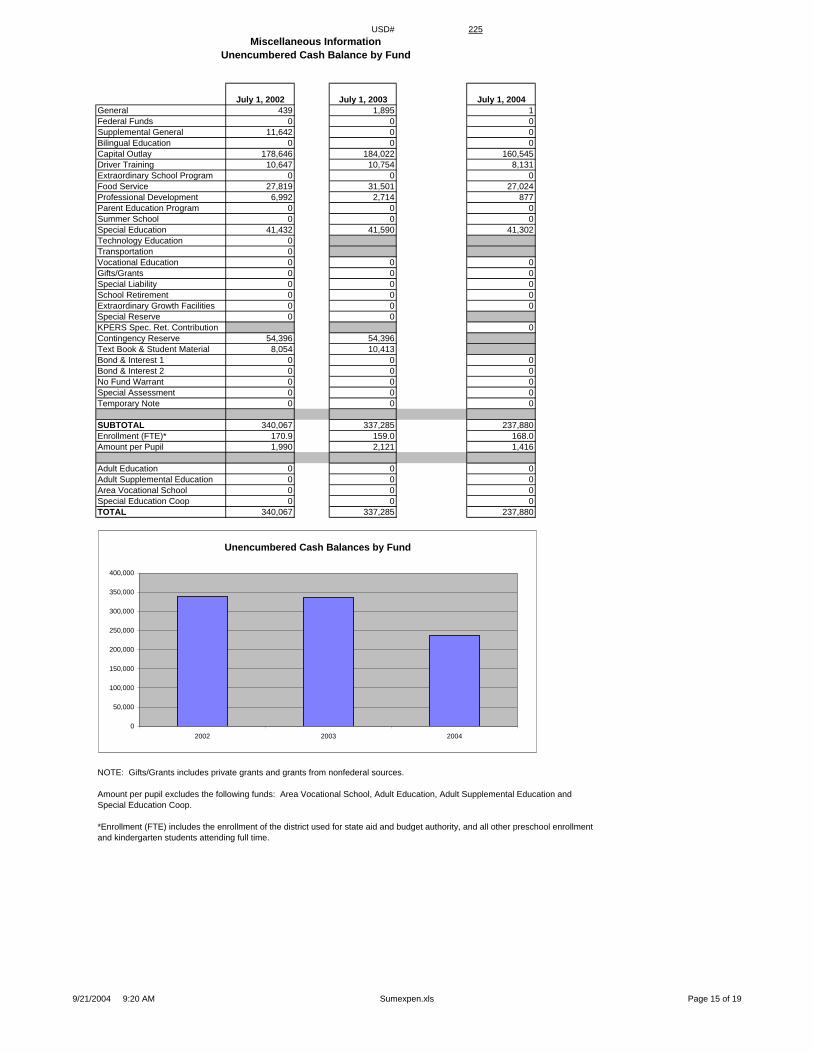
USD# 225Miscellaneous Information
Unencumbered Cash Balance by Fund
July 1, 2002 July 1, 2003 July 1, 2004General 439 1,895 1Federal Funds 0 0 0Supplemental General 11,642 0 0Bilingual Education 0 0 0Capital Outlay 178,646 184,022 160,545Driver Training 10,647 10,754 8,131Extraordinary School Program 0 0 0Food Service 27,819 31,501 27,024Professional Development 6,992 2,714 877Parent Education Program 0 0 0Summer School 0 0 0Special Education 41,432 41,590 41,302Technology Education 0Transportation 0Vocational Education 0 0 0Gifts/Grants 0 0 0Special Liability 0 0 0School Retirement 0 0 0Extraordinary Growth Facilities 0 0 0Special Reserve 0 0KPERS Spec. Ret. Contribution 0Contingency Reserve 54,396 54,396Text Book & Student Material 8,054 10,413Bond & Interest 1 0 0 0Bond & Interest 2 0 0 0No Fund Warrant 0 0 0Special Assessment 0 0 0Temporary Note 0 0 0
SUBTOTAL 340,067 337,285 237,880Enrollment (FTE)* 170.9 159.0 168.0Amount per Pupil 1,990 2,121 1,416
Adult Education 0 0 0Adult Supplemental Education 0 0 0Area Vocational School 0 0 0Special Education Coop 0 0 0TOTAL 340,067 337,285 237,880
NOTE: Gifts/Grants includes private grants and grants from nonfederal sources.
Amount per pupil excludes the following funds: Area Vocational School, Adult Education, Adult Supplemental Education andSpecial Education Coop.
*Enrollment (FTE) includes the enrollment of the district used for state aid and budget authority, and all other preschool enrollmentand kindergarten students attending full time.
Unencumbered Cash Balances by Fund
0
50,000
100,000
150,000
200,000
250,000
300,000
350,000
400,000
2002 2003 2004
9/21/2004 9:20 AM Sumexpen.xls Page 15 of 19
USD# 225
Reserve FundsUnencumbered Cash Balance
July 1, 2002 July 1, 2003Special Reserve 0 0TOTAL OTHER 0 0Amount per Pupil $0 $0
*School districts are authorized by law to self insure rather than purchase insurance for the following categories: Worker's Comp,Health Insurance, Life Insurance, Property and Casualty (Risk Management) and Disability Income Insurance. Monies are placedin the Self Insured Fund to pay for claims which may arise from the categories listed above.
Unencumbered Cash Balances by Fund (Reserve Funds Only)
0
0
0
0
0
1
1
1
1
1
1
2002 2003
9/21/2004 9:20 AM Sumexpen.xls Page 16 of 19
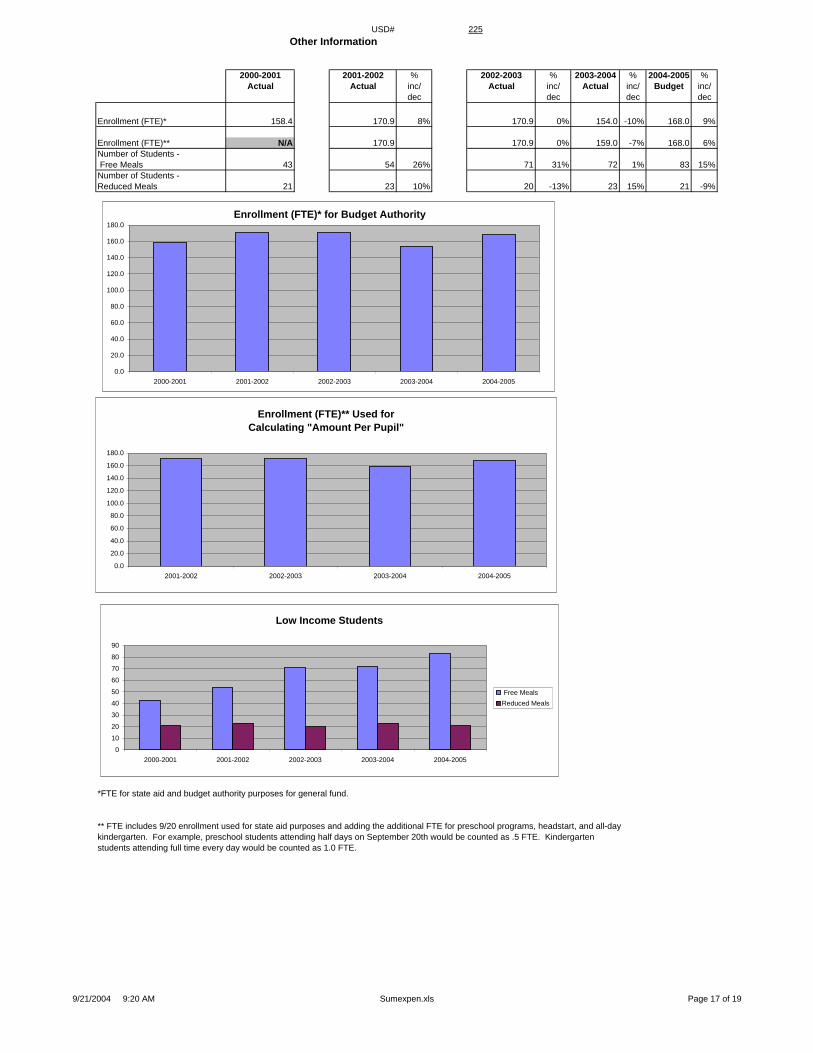
USD# 225Other Information
2000-2001 2001-2002 % 2002-2003 % 2003-2004 % 2004-2005 %Actual Actual inc/ Actual inc/ Actual inc/ Budget inc/
dec dec dec dec
Enrollment (FTE)* 158.4 170.9 8% 170.9 0% 154.0 -10% 168.0 9%
Enrollment (FTE)** N/A 170.9 170.9 0% 159.0 -7% 168.0 6%Number of Students - Free Meals 43 54 26% 71 31% 72 1% 83 15%Number of Students - Reduced Meals 21 23 10% 20 -13% 23 15% 21 -9%
*FTE for state aid and budget authority purposes for general fund.
** FTE includes 9/20 enrollment used for state aid purposes and adding the additional FTE for preschool programs, headstart, and all-daykindergarten. For example, preschool students attending half days on September 20th would be counted as .5 FTE. Kindergartenstudents attending full time every day would be counted as 1.0 FTE.
Enrollment (FTE)* for Budget Authority
0.0
20.0
40.0
60.0
80.0
100.0
120.0
140.0
160.0
180.0
2000-2001 2001-2002 2002-2003 2003-2004 2004-2005
Low Income Students
0
10
20
30
40
50
60
70
80
90
2000-2001 2001-2002 2002-2003 2003-2004 2004-2005
Free MealsReduced Meals
Enrollment (FTE)** Used for Calculating "Amount Per Pupil"
0.0
20.0
40.0
60.0
80.0
100.0
120.0
140.0
160.0
180.0
2001-2002 2002-2003 2003-2004 2004-2005
9/21/2004 9:20 AM Sumexpen.xls Page 17 of 19
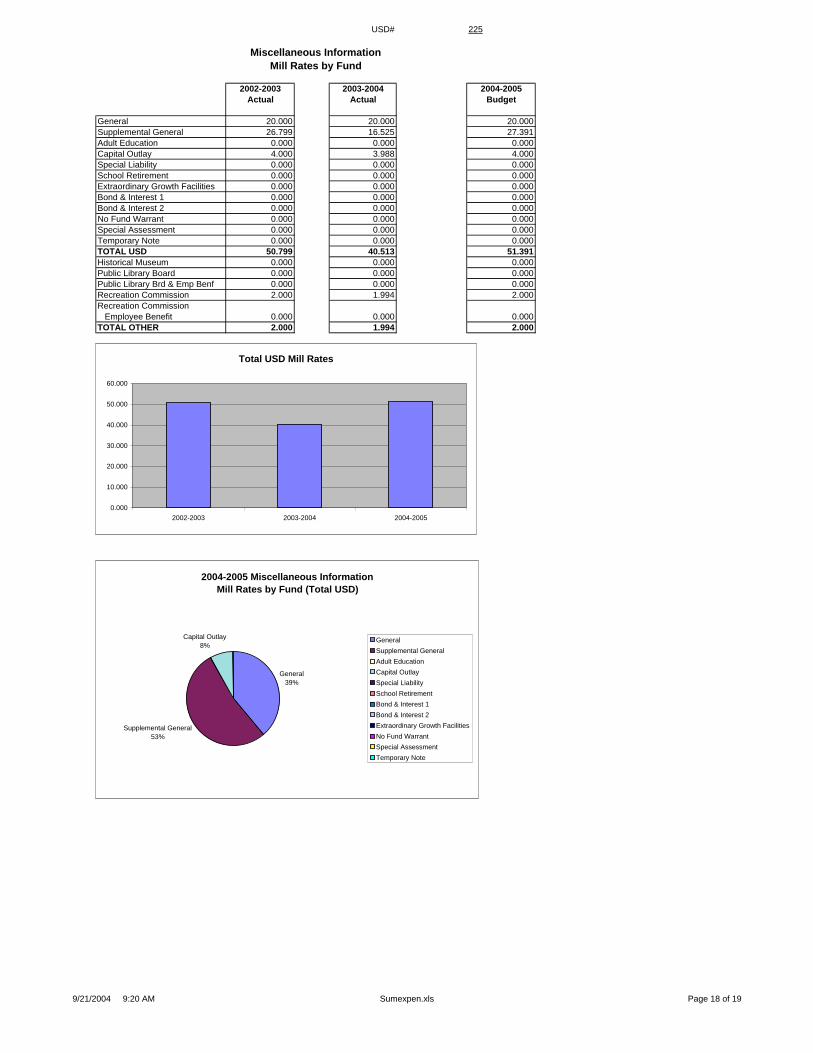
USD# 225
Miscellaneous InformationMill Rates by Fund
2002-2003 2003-2004 2004-2005Actual Actual Budget
General 20.000 20.000 20.000Supplemental General 26.799 16.525 27.391Adult Education 0.000 0.000 0.000Capital Outlay 4.000 3.988 4.000Special Liability 0.000 0.000 0.000School Retirement 0.000 0.000 0.000Extraordinary Growth Facilities 0.000 0.000 0.000Bond & Interest 1 0.000 0.000 0.000Bond & Interest 2 0.000 0.000 0.000No Fund Warrant 0.000 0.000 0.000Special Assessment 0.000 0.000 0.000Temporary Note 0.000 0.000 0.000TOTAL USD 50.799 40.513 51.391Historical Museum 0.000 0.000 0.000Public Library Board 0.000 0.000 0.000Public Library Brd & Emp Benf 0.000 0.000 0.000Recreation Commission 2.000 1.994 2.000Recreation Commission Employee Benefit 0.000 0.000 0.000TOTAL OTHER 2.000 1.994 2.000
2004-2005 Miscellaneous InformationMill Rates by Fund (Total USD)
General39%
Supplemental General53%
Capital Outlay8%
GeneralSupplemental GeneralAdult EducationCapital OutlaySpecial LiabilitySchool RetirementBond & Interest 1Bond & Interest 2Extraordinary Growth FacilitiesNo Fund WarrantSpecial AssessmentTemporary Note
Total USD Mill Rates
0.000
10.000
20.000
30.000
40.000
50.000
60.000
2002-2003 2003-2004 2004-2005
9/21/2004 9:20 AM Sumexpen.xls Page 18 of 19
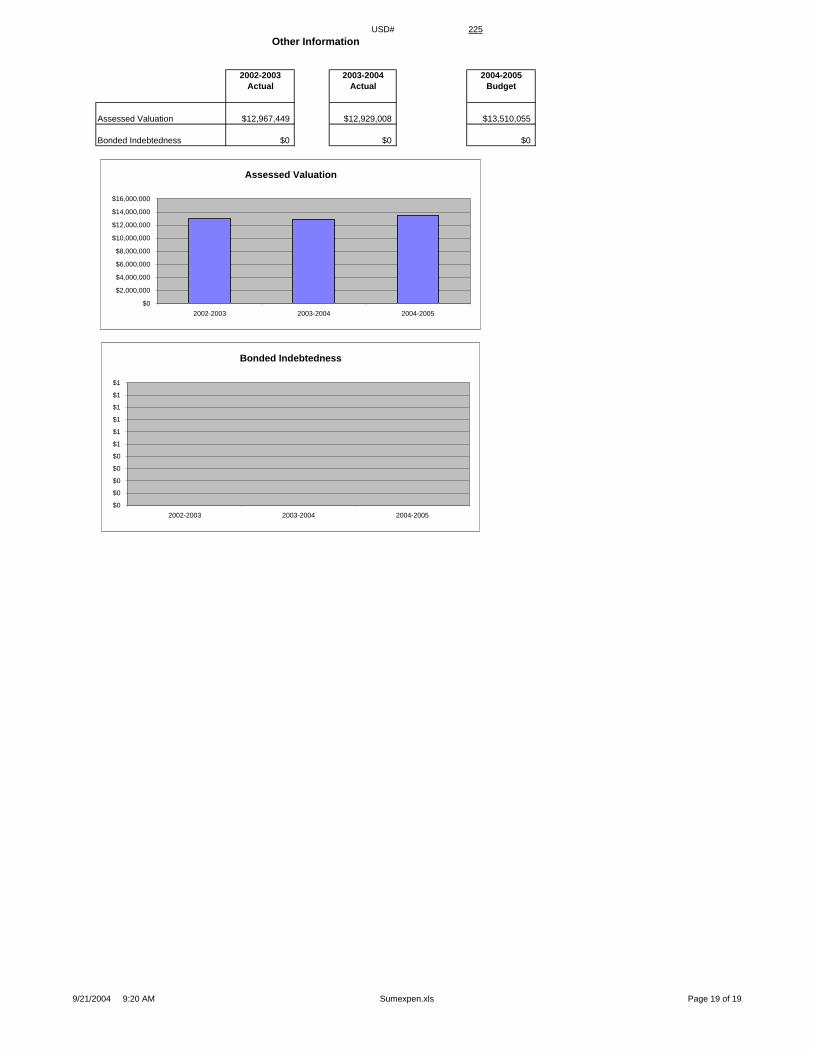
USD# 225Other Information
2002-2003 2003-2004 2004-2005Actual Actual Budget
Assessed Valuation $12,967,449 $12,929,008 $13,510,055
Bonded Indebtedness $0 $0 $0
Assessed Valuation
$0
$2,000,000
$4,000,000
$6,000,000
$8,000,000
$10,000,000
$12,000,000
$14,000,000
$16,000,000
2002-2003 2003-2004 2004-2005
Bonded Indebtedness
$0
$0
$0
$0
$0
$1
$1
$1
$1
$1
$1
2002-2003 2003-2004 2004-2005
9/21/2004 9:20 AM Sumexpen.xls Page 19 of 19