Embed Size (px)
Citation preview
PROFILE INFORMATION 2015-16
USD 269 Palco
School Finance Kansas State Department of Education Landon State Office Building 900 SW Jackson Street, Suite 356 Topeka, Kansas 66612-1212 www.ksde.org

i
• Budget General Information (characteristics of district)
• Supplemental Information for Tables in Summary of Expenditures
• KSDE Website Information Available
• Summary of Expenditures (Sumexpen.xlsx)
1
2015-16 Budget General Information USD #: 269
.Introduction
Palco USD #269 is a small, rural district located in Rooks County, KS, about 45 miles northwest of Hays. It is comprised of three (3) small towns, Damar, Palco and Zurich. There are several active businesses in the district as well as church options for Catholics and some Protestant denominations. The public schools, as in most small communities, remain the hub of activity for the district’s residents. The student count for USD #269 this year is 115, Pre-K-12. Our district is fortunate to have the McKenna Youth Center, built in 2013, which is located in Palco. It provides exercise equipment, a very nice playground in the city park area, table games, and a complete 70-seat digital movie theater. It gets used every day and, while primarily concentrating on the youth of our district, adults use the facility, too.
Board Members
Dana Pieper, President Nicole Gosselin, Member 400 DD Road P.O. Box 43 Palco, KSA 67657 Damar, KS 67632 [email protected] [email protected] 785.737.6096 (C) 785.727.3761 (C)
Peggy Axelson, Vice-President Sharon McLaughlin, Member 500 Birch Ave. 403 Main St. Palco, KS 67657 Zurich, KS 67663 [email protected] [email protected] 785.434.6388 (C) 785.737.6101 (C)
Tom Benoit, Member Melanie Pywell, Member P.O. Box 132 104 East 2nd Damar, KS 67632 Palco, KS 67657 [email protected] [email protected] 785.737.3874 (C) 785.737.8191 (C)
Larry Desbien, Member 140 Q Road Damar, KS 67632 [email protected] 785.839.8038 (C)
Key Staff Superintendent: Larry M. Lysell
Business Office Staff: Karen Bouchey, Clerk of the Board of Education
Other Key Contacts: Roger Morris, Jr./Sr. High School Principal Mandi Dobson, Assistant Administrator (Elementary)
2
The District’s Accomplishments and Challenges
Accomplishments: Overall test scores in most areas have been in the average range compared to state and national statistics. Our graduation rate is exceptional at 100% for the last several years. The bulk of our graduating seniors matriculate into college, but this last year was an exception. Of our small class of four (4) students, two (2) went on to university level and two (2) went to work for their fathers in very successful local businesses. USD #269 students are heavily involved in every aspect of the communities’ activities. Outside the school day probably the largest group is the area 4-H club, but there are many other groups, church and otherwise, that provide positive things for our students to do. We are a very innovative district and have maintained efficiency through staff cuts over the last few years. We share our superintendent with another very small district and have reduced then combined several teaching positions, also. Through this trial, we have continued to provide a quality education to the students at every level. Like so many small districts, we have a dedicated and highly qualified staff that has a genuine interest in and love for our students! Challenges: The aforementioned efficiencies have not been without difficulty, criticism, and, frankly, considerable heartache. We continue, though, to offer a full Pre-K-12 music program in both band and vocal, and continue a full-time vocational-agriculture schedule. We do have one part-time instructor that we felt we needed to add back after reducing the full-time position, but that is working well. Declining enrollment has plagued the district off and on for several years. Three years ago we saw an increase of fourteen (14) students; the next year we saw a decline of eleven (11) students, and this year saw an increase of ten (10) students. This “yo-yo” effect makes financial planning very difficult. We reduced expenses $150,000 this year off an approximately $1,250,000 budget, a huge percentage cut! Our district’s valuation dropped over 45% because of the current situation with the oil industry. We reduced the amount of Supplemental General Fund money that we were authorized by over $70,000 this year to keep the mill levy at a relatively reasonable increase of three point seven (3.7). It would have been over nine (9) mills had we not reduced this amount. Of course, that meant that we have that much less money on which to operate in a year when we really wanted to replace cash loss from last year.
Recruiting teachers (and administrators, when those positions become available) is an ongoing problem for us and most small districts, especially in Western Kansas. When the current superintendent was hired, there were no other experienced administrators available, and districts such as ours, with its ongoing financial and enrollment concerns, function better with someone who knows what she/he is doing. As mentioned, we have a complete, licensed staff this year, but were just plain fortunate to be in this position! Our health care costs have stabilized because we are “grandfathered” under an older set of rules with Blue Cross/Blue Shield. We experienced a slight reduction for this school year—our staff is very conscious of this and we have an outstanding health record. We share high school and junior high football with a neighboring district which is an inconvenience because of the shale/gravel road we each must travel thirty (30) miles one way. We will have to begin sharing all the other sports soon, too. Many districts in our area are engaging in 6-Man football competitions because they have no ability to share with a neighbor without
3
changing the larger school’s classification with the Activities Association, which most larger schools are loathe to do. These factors are no one’s fault other than the population in Western Kansas is dropping for whatever reason. Finally, it must be said here that if the school finance formula were fully funded, which we clearly feel it is not, our district would be able to operate successfully for many years yet. The problem in USD #269 will be less about financial resources and more about maintaining student count for participation in activities.
4
Supplemental Information for the Following Tables 1. Summary of Total Expenditures by Function (All Funds) 2. Summary of General Fund Expenditures by Function 3. Summary of Supplemental General Fund Expenditures by Function 4. Summary of General and Supplemental General Fund Expenditures by Function 5. Summary of Special Education Fund by Function 6. Instruction Expenditures (1000) 7. Student Support Expenditures (2100)
8. Instructional Support Expenditures (2200) 9. General Administration Expenditures (2300) 10. School Administration Expenditures (2400)
11. Central Services Expenditures (2500) 12. Operations and Maintenance Expenditures (2600)
13. Transportation Expenditures (2700) 14. Other Support Services Expenditures (2900)
15. Food Service Expenditures (3100)
16. Community Services Operations (3300) 17. Capital Improvements (4000) 18. Debt Services (5100)
19. Miscellaneous Information – Transfers (5200) 20. Miscellaneous Information Unencumbered Cash Balance by Fund 21. Reserve Funds Unencumbered Cash Balance 22. Other Information – Enrollment Information 23. Miscellaneous Information Mill Rates by Fund 24. Other Information – Assessed Valuation and Bonded Indebtedness
5
Note: The FTE (full time equivalency) used in this report to calculate the “Amount Per Pupil” is defined as follows: Enrollment (FTE) includes the current year enrollment on September 20, February 20, 4 yr old at-risk, and virtual. It does not include non-funded preschool or full-day kindergarten not on an IEP.
6
KSDE Website Information Available K-12 Statistics (Building, District or State Totals) website below: http://svapp15586.ksde.org/k12/k12.aspx
• Attendance / Enrollment Reports • Staff Reports • Graduates / Dropouts Reports • Crime / Violence Reports
School Finance Reports and Publications website below: http://www.ksde.org/Agency/FiscalandAdministrativeServices/SchoolFinance/ReportsandPublications.aspx
• Assessed Valuation • Cash Balances • Headcount Enrollment • Mill Levies • Personnel (Certified/Non-Certified) • Salary Reports
Kansas Building Report Card website below: http://svapp15586.ksde.org/rcard/
• Attendance Rate • Graduation Rate • Dropout Rate • School Violence • Assessments
o Reading o Mathematics o Writing
• Graduates Passing Adv. Science Courses • Graduates Passing Adv. Math Courses
USD# 269
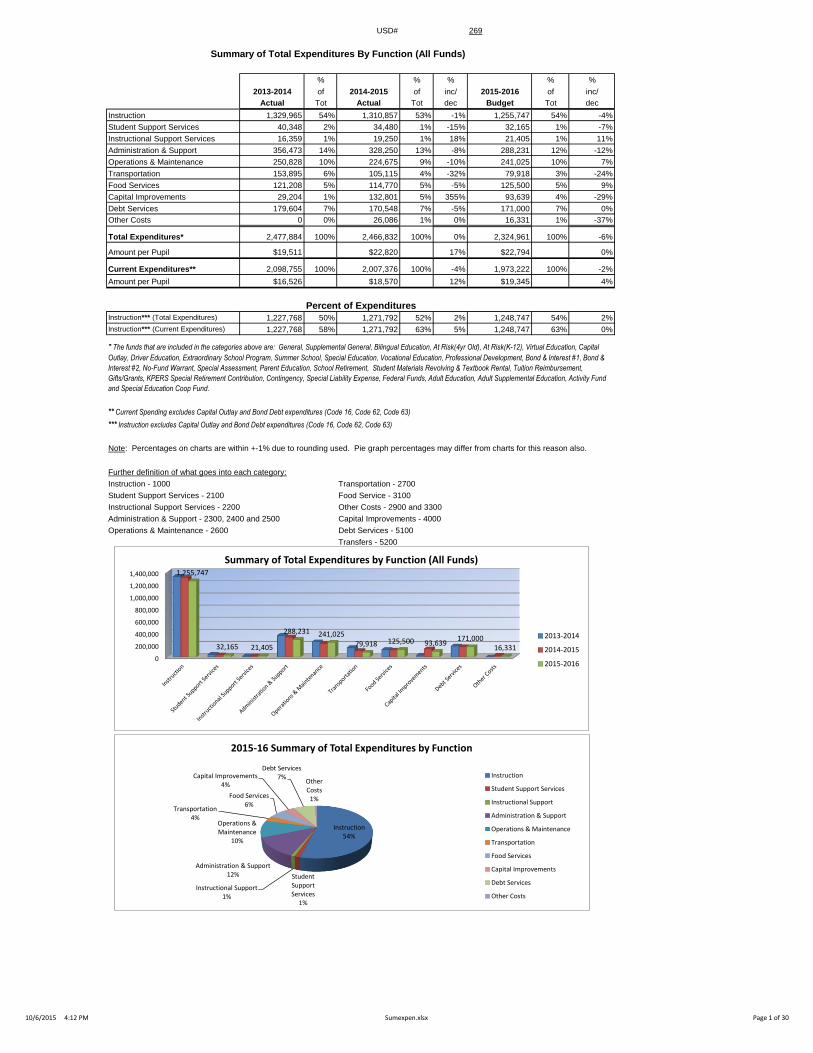
Summary of Total Expenditures By Function (All Funds)
% % % % %
2013-2014 of 2014-2015 of inc/ 2015-2016 of inc/
Actual Tot Actual Tot dec Budget Tot dec
Instruction 1,329,965 54% 1,310,857 53% -1% 1,255,747 54% -4%
Student Support Services 40,348 2% 34,480 1% -15% 32,165 1% -7%
Instructional Support Services 16,359 1% 19,250 1% 18% 21,405 1% 11%
Administration & Support 356,473 14% 328,250 13% -8% 288,231 12% -12%
Operations & Maintenance 250,828 10% 224,675 9% -10% 241,025 10% 7%
Transportation 153,895 6% 105,115 4% -32% 79,918 3% -24%
Food Services 121,208 5% 114,770 5% -5% 125,500 5% 9%
Capital Improvements 29,204 1% 132,801 5% 355% 93,639 4% -29%
Debt Services 179,604 7% 170,548 7% -5% 171,000 7% 0%
Other Costs 0 0% 26,086 1% 0% 16,331 1% -37%
Total Expenditures* 2,477,884 100% 2,466,832 100% 0% 2,324,961 100% -6%
Amount per Pupil $19,511 $22,820 17% $22,794 0%
Current Expenditures** 2,098,755 100% 2,007,376 100% -4% 1,973,222 100% -2%
Amount per Pupil $16,526 $18,570 12% $19,345 4%
Instruction*** (Total Expenditures) 1,227,768 50% 1,271,792 52% 2% 1,248,747 54% 2%
Instruction*** (Current Expenditures) 1,227,768 58% 1,271,792 63% 5% 1,248,747 63% 0%
Note: Percentages on charts are within +-1% due to rounding used. Pie graph percentages may differ from charts for this reason also.
Further definition of what goes into each category:
Instruction - 1000 Transportation - 2700
Student Support Services - 2100 Food Service - 3100
Instructional Support Services - 2200 Other Costs - 2900 and 3300
Administration & Support - 2300, 2400 and 2500 Capital Improvements - 4000
Operations & Maintenance - 2600 Debt Services - 5100
Transfers - 5200
Percent of Expenditures
* The funds that are included in the categories above are: General, Supplemental General, Bilingual Education, At Risk(4yr Old), At Risk(K-12), Virtual Education, Capital
Outlay, Driver Education, Extraordinary School Program, Summer School, Special Education, Vocational Education, Professional Development, Bond & Interest #1, Bond &
Interest #2, No-Fund Warrant, Special Assessment, Parent Education, School Retirement, Student Materials Revolving & Textbook Rental, Tuition Reimbursement,
Gifts/Grants, KPERS Special Retirement Contribution, Contingency, Special Liability Expense, Federal Funds, Adult Education, Adult Supplemental Education, Activity Fund
and Special Education Coop Fund.
*** Instruction excludes Capital Outlay and Bond Debt expenditures (Code 16, Code 62, Code 63)
** Current Spending excludes Capital Outlay and Bond Debt expenditures (Code 16, Code 62, Code 63)
0
200,000
400,000
600,000
800,000
1,000,000
1,200,000
1,400,000 1,255,747
32,165 21,405
288,231 241,025 79,918 125,500 93,639
171,000 16,331
Summary of Total Expenditures by Function (All Funds)
2013-2014
2014-2015
2015-2016
Instruction 54%
Student Support Services
1%
Instructional Support 1%
Administration & Support 12%
Operations & Maintenance
10%
Transportation 4%
Food Services 6%
Capital Improvements 4%
Debt Services 7%
Other Costs
1%
2015-16 Summary of Total Expenditures by Function
Instruction
Student Support Services
Instructional Support
Administration & Support
Operations & Maintenance
Transportation
Food Services
Capital Improvements
Debt Services
Other Costs
10/6/2015 4:12 PM Sumexpen.xlsx Page 1 of 30
USD# 269
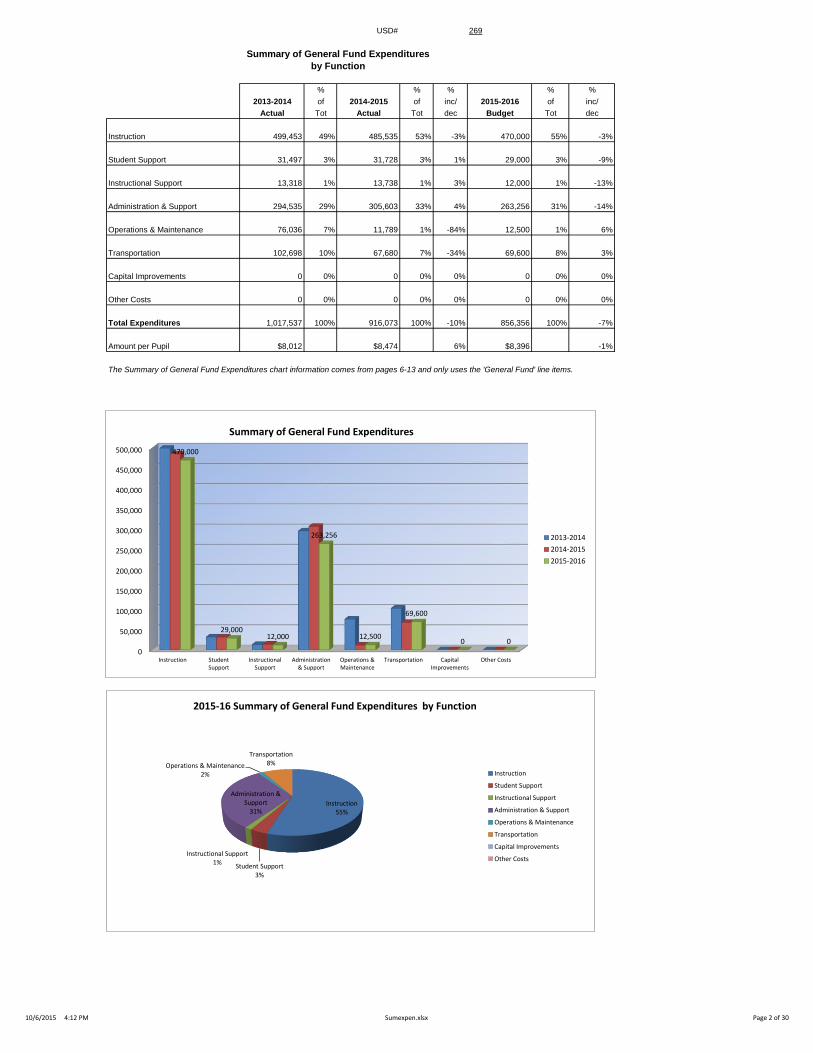
Summary of General Fund Expenditures
by Function
% % % % %
2013-2014 of 2014-2015 of inc/ 2015-2016 of inc/
Actual Tot Actual Tot dec Budget Tot dec
Instruction 499,453 49% 485,535 53% -3% 470,000 55% -3%
Student Support 31,497 3% 31,728 3% 1% 29,000 3% -9%
Instructional Support 13,318 1% 13,738 1% 3% 12,000 1% -13%
Administration & Support 294,535 29% 305,603 33% 4% 263,256 31% -14%
Operations & Maintenance 76,036 7% 11,789 1% -84% 12,500 1% 6%
Transportation 102,698 10% 67,680 7% -34% 69,600 8% 3%
Capital Improvements 0 0% 0 0% 0% 0 0% 0%
Other Costs 0 0% 0 0% 0% 0 0% 0%
Total Expenditures 1,017,537 100% 916,073 100% -10% 856,356 100% -7%
Amount per Pupil $8,012 $8,474 6% $8,396 -1%
The Summary of General Fund Expenditures chart information comes from pages 6-13 and only uses the 'General Fund' line items.
0
50,000
100,000
150,000
200,000
250,000
300,000
350,000
400,000
450,000
500,000
Instruction StudentSupport
InstructionalSupport
Administration& Support
Operations &Maintenance
Transportation CapitalImprovements
Other Costs
470,000
29,000 12,000
263,256
12,500
69,600
0 0
Summary of General Fund Expenditures
2013-2014
2014-2015
2015-2016
Instruction 55%
Student Support 3%
Instructional Support 1%
Administration & Support
31%
Operations & Maintenance 2%
Transportation 8%
2015-16 Summary of General Fund Expenditures by Function
Instruction
Student Support
Instructional Support
Administration & Support
Operations & Maintenance
Transportation
Capital Improvements
Other Costs
10/6/2015 4:12 PM Sumexpen.xlsx Page 2 of 30
USD# 269
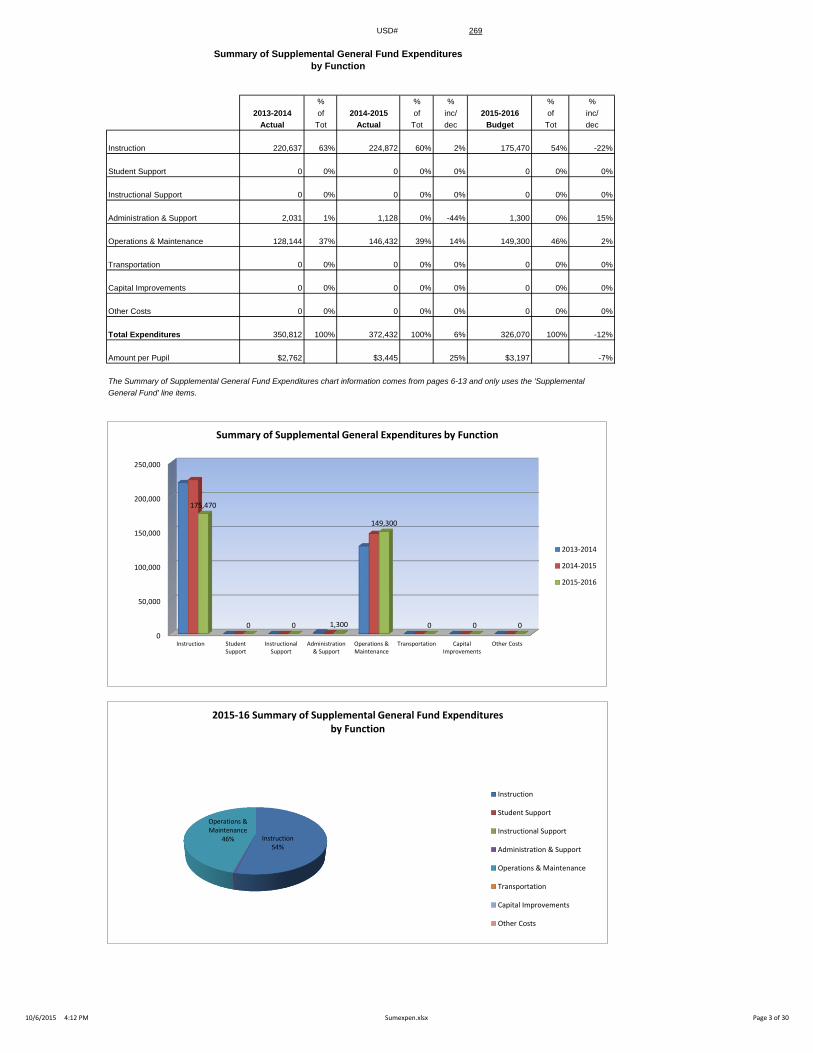
Summary of Supplemental General Fund Expenditures
by Function
% % % % %
2013-2014 of 2014-2015 of inc/ 2015-2016 of inc/
Actual Tot Actual Tot dec Budget Tot dec
Instruction 220,637 63% 224,872 60% 2% 175,470 54% -22%
Student Support 0 0% 0 0% 0% 0 0% 0%
Instructional Support 0 0% 0 0% 0% 0 0% 0%
Administration & Support 2,031 1% 1,128 0% -44% 1,300 0% 15%
Operations & Maintenance 128,144 37% 146,432 39% 14% 149,300 46% 2%
Transportation 0 0% 0 0% 0% 0 0% 0%
Capital Improvements 0 0% 0 0% 0% 0 0% 0%
Other Costs 0 0% 0 0% 0% 0 0% 0%
Total Expenditures 350,812 100% 372,432 100% 6% 326,070 100% -12%
Amount per Pupil $2,762 $3,445 25% $3,197 -7%
The Summary of Supplemental General Fund Expenditures chart information comes from pages 6-13 and only uses the 'Supplemental
General Fund' line items.
0
50,000
100,000
150,000
200,000
250,000
Instruction StudentSupport
InstructionalSupport
Administration& Support
Operations &Maintenance
Transportation CapitalImprovements
Other Costs
175,470
0 0 1,300
149,300
0 0 0
Summary of Supplemental General Expenditures by Function
2013-2014
2014-2015
2015-2016
Instruction 54%
Operations & Maintenance
46%
2015-16 Summary of Supplemental General Fund Expenditures by Function
Instruction
Student Support
Instructional Support
Administration & Support
Operations & Maintenance
Transportation
Capital Improvements
Other Costs
10/6/2015 4:12 PM Sumexpen.xlsx Page 3 of 30
USD# 269
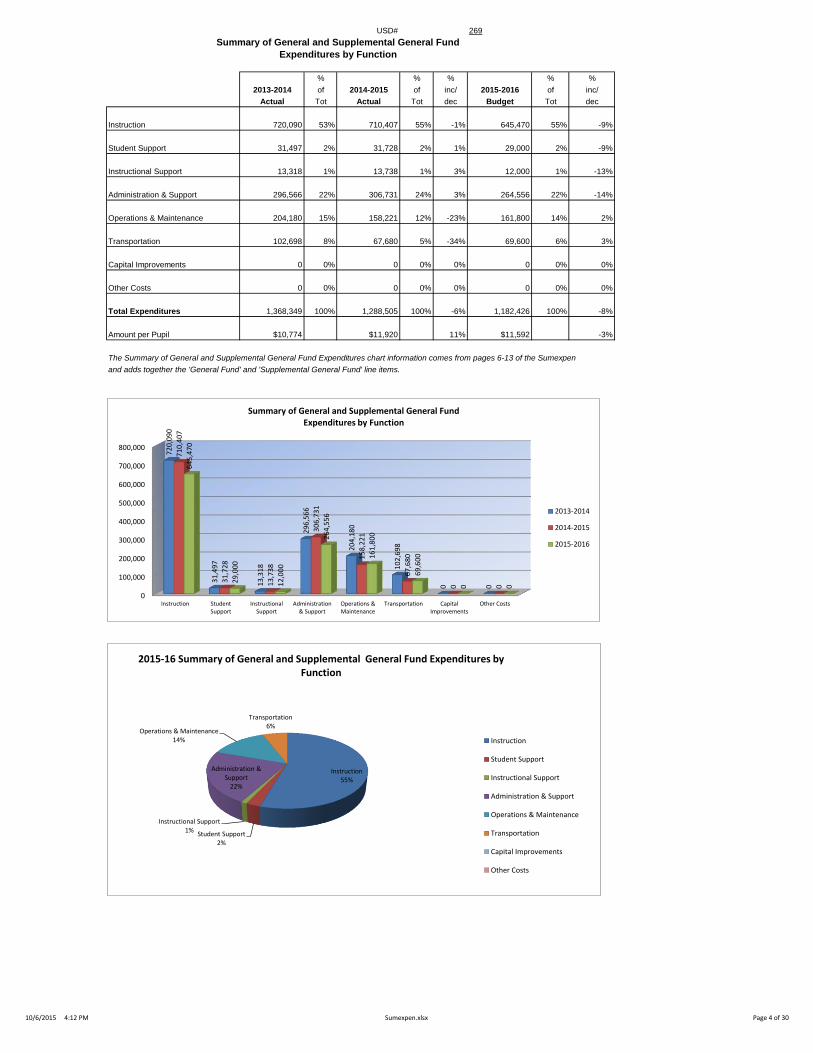
Summary of General and Supplemental General Fund
Expenditures by Function
% % % % %
2013-2014 of 2014-2015 of inc/ 2015-2016 of inc/
Actual Tot Actual Tot dec Budget Tot dec
Instruction 720,090 53% 710,407 55% -1% 645,470 55% -9%
Student Support 31,497 2% 31,728 2% 1% 29,000 2% -9%
Instructional Support 13,318 1% 13,738 1% 3% 12,000 1% -13%
Administration & Support 296,566 22% 306,731 24% 3% 264,556 22% -14%
Operations & Maintenance 204,180 15% 158,221 12% -23% 161,800 14% 2%
Transportation 102,698 8% 67,680 5% -34% 69,600 6% 3%
Capital Improvements 0 0% 0 0% 0% 0 0% 0%
Other Costs 0 0% 0 0% 0% 0 0% 0%
Total Expenditures 1,368,349 100% 1,288,505 100% -6% 1,182,426 100% -8%
Amount per Pupil $10,774 $11,920 11% $11,592 -3%
The Summary of General and Supplemental General Fund Expenditures chart information comes from pages 6-13 of the Sumexpen
and adds together the 'General Fund' and 'Supplemental General Fund' line items.
0
100,000
200,000
300,000
400,000
500,000
600,000
700,000
800,000
Instruction StudentSupport
InstructionalSupport
Administration& Support
Operations &Maintenance
Transportation CapitalImprovements
Other Costs
72
0,0
90
31
,49
7
13
,31
8
29
6,5
66
20
4,1
80
10
2,6
98
0
0
71
0,4
07
31
,72
8
13
,73
8
30
6,7
31
15
8,2
21
67
,68
0
0
0
64
5,4
70
29
,00
0
12
,00
0
26
4,5
56
16
1,8
00
69
,60
0
0
0
Summary of General and Supplemental General Fund Expenditures by Function
2013-2014
2014-2015
2015-2016
Instruction 55%
Student Support 2%
Instructional Support 1%
Administration & Support
22%
Operations & Maintenance 14%
Transportation 6%
2015-16 Summary of General and Supplemental General Fund Expenditures by Function
Instruction
Student Support
Instructional Support
Administration & Support
Operations & Maintenance
Transportation
Capital Improvements
Other Costs
10/6/2015 4:12 PM Sumexpen.xlsx Page 4 of 30
USD# 269
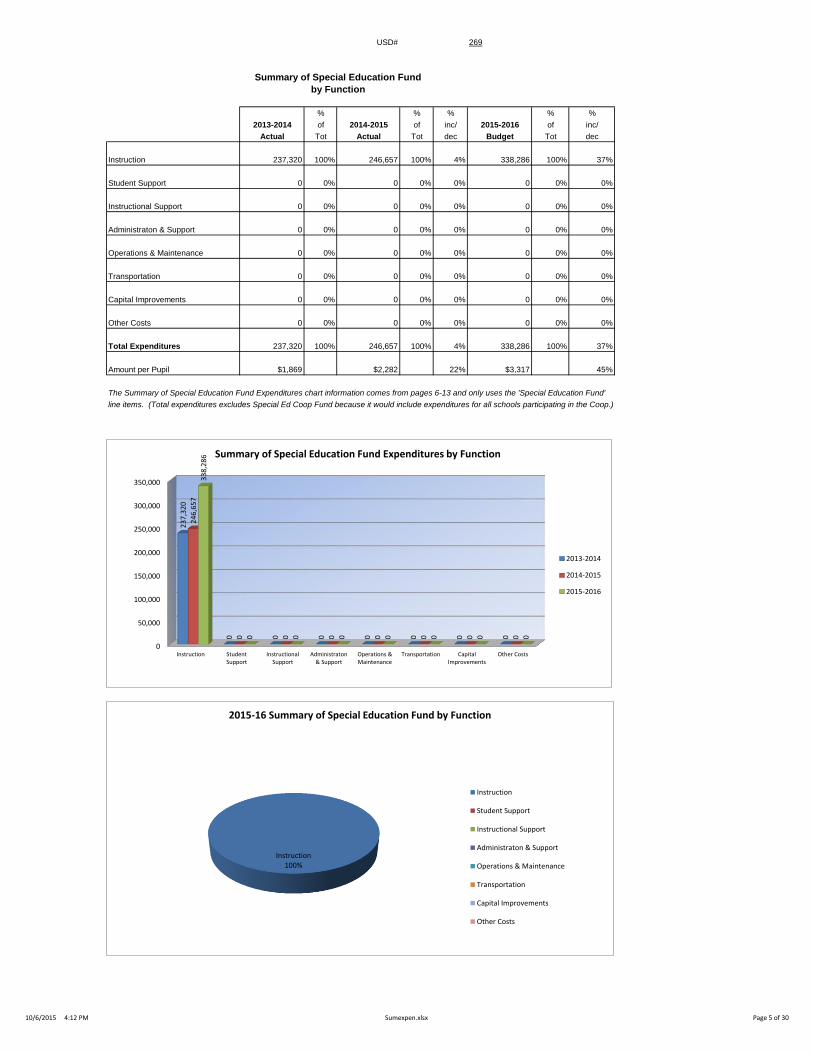
Summary of Special Education Fund
by Function
% % % % %
2013-2014 of 2014-2015 of inc/ 2015-2016 of inc/
Actual Tot Actual Tot dec Budget Tot dec
Instruction 237,320 100% 246,657 100% 4% 338,286 100% 37%
Student Support 0 0% 0 0% 0% 0 0% 0%
Instructional Support 0 0% 0 0% 0% 0 0% 0%
Administraton & Support 0 0% 0 0% 0% 0 0% 0%
Operations & Maintenance 0 0% 0 0% 0% 0 0% 0%
Transportation 0 0% 0 0% 0% 0 0% 0%
Capital Improvements 0 0% 0 0% 0% 0 0% 0%
Other Costs 0 0% 0 0% 0% 0 0% 0%
Total Expenditures 237,320 100% 246,657 100% 4% 338,286 100% 37%
Amount per Pupil $1,869 $2,282 22% $3,317 45%
The Summary of Special Education Fund Expenditures chart information comes from pages 6-13 and only uses the 'Special Education Fund'
line items. (Total expenditures excludes Special Ed Coop Fund because it would include expenditures for all schools participating in the Coop.)
0
50,000
100,000
150,000
200,000
250,000
300,000
350,000
Instruction StudentSupport
InstructionalSupport
Administraton& Support
Operations &Maintenance
Transportation CapitalImprovements
Other Costs
23
7,3
20
0
0
0
0
0
0
0
24
6,6
57
0
0
0
0
0
0
0
33
8,2
86
0
0
0
0
0
0
0
Summary of Special Education Fund Expenditures by Function
2013-2014
2014-2015
2015-2016
Instruction 100%
2015-16 Summary of Special Education Fund by Function
Instruction
Student Support
Instructional Support
Administraton & Support
Operations & Maintenance
Transportation
Capital Improvements
Other Costs
10/6/2015 4:12 PM Sumexpen.xlsx Page 5 of 30
USD# 269
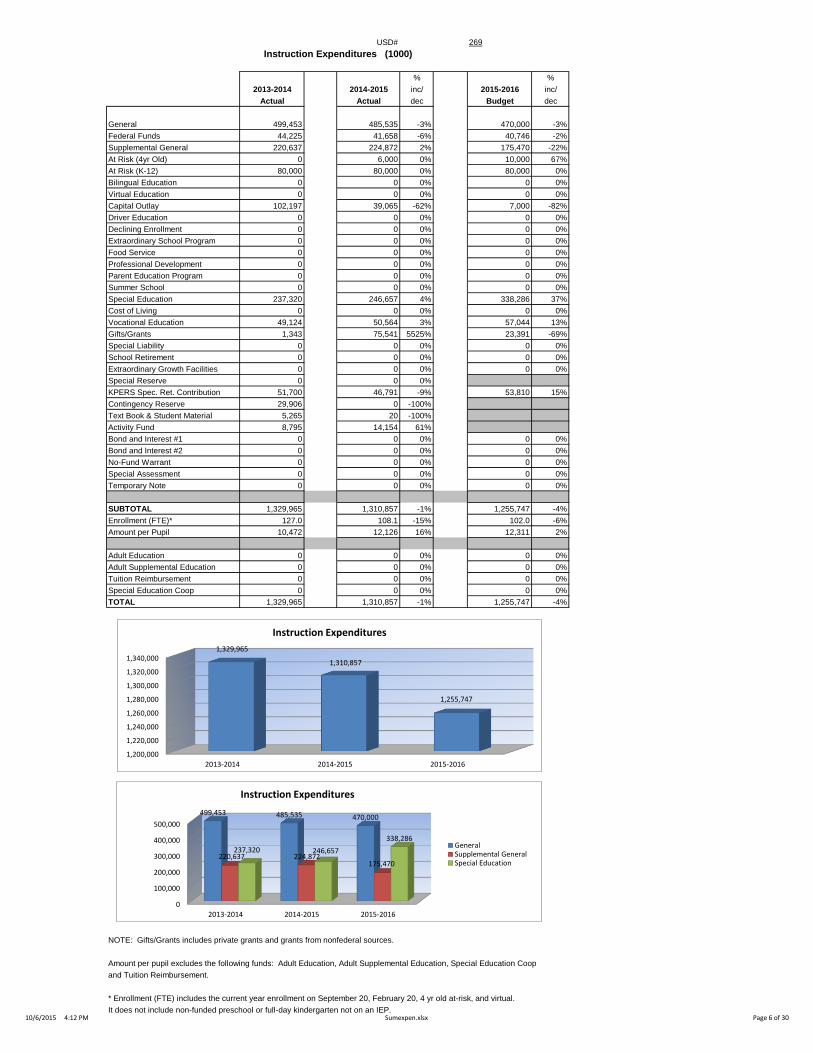
Instruction Expenditures (1000)
% %
2013-2014 2014-2015 inc/ 2015-2016 inc/
Actual Actual dec Budget dec
General 499,453 485,535 -3% 470,000 -3%
Federal Funds 44,225 41,658 -6% 40,746 -2%
Supplemental General 220,637 224,872 2% 175,470 -22%
At Risk (4yr Old) 0 6,000 0% 10,000 67%
At Risk (K-12) 80,000 80,000 0% 80,000 0%
Bilingual Education 0 0 0% 0 0%
Virtual Education 0 0 0% 0 0%
Capital Outlay 102,197 39,065 -62% 7,000 -82%
Driver Education 0 0 0% 0 0%
Declining Enrollment 0 0 0% 0 0%
Extraordinary School Program 0 0 0% 0 0%
Food Service 0 0 0% 0 0%
Professional Development 0 0 0% 0 0%
Parent Education Program 0 0 0% 0 0%
Summer School 0 0 0% 0 0%
Special Education 237,320 246,657 4% 338,286 37%
Cost of Living 0 0 0% 0 0%
Vocational Education 49,124 50,564 3% 57,044 13%
Gifts/Grants 1,343 75,541 5525% 23,391 -69%
Special Liability 0 0 0% 0 0%
School Retirement 0 0 0% 0 0%
Extraordinary Growth Facilities 0 0 0% 0 0%
Special Reserve 0 0 0%
KPERS Spec. Ret. Contribution 51,700 46,791 -9% 53,810 15%
Contingency Reserve 29,906 0 -100%
Text Book & Student Material 5,265 20 -100%
Activity Fund 8,795 14,154 61%
Bond and Interest #1 0 0 0% 0 0%
Bond and Interest #2 0 0 0% 0 0%
No-Fund Warrant 0 0 0% 0 0%
Special Assessment 0 0 0% 0 0%
Temporary Note 0 0 0% 0 0%
SUBTOTAL 1,329,965 1,310,857 -1% 1,255,747 -4%
Enrollment (FTE)* 127.0 108.1 -15% 102.0 -6%
Amount per Pupil 10,472 12,126 16% 12,311 2%
Adult Education 0 0 0% 0 0%
Adult Supplemental Education 0 0 0% 0 0%
Tuition Reimbursement 0 0 0% 0 0%
Special Education Coop 0 0 0% 0 0%
TOTAL 1,329,965 1,310,857 -1% 1,255,747 -4%
NOTE: Gifts/Grants includes private grants and grants from nonfederal sources.
Amount per pupil excludes the following funds: Adult Education, Adult Supplemental Education, Special Education Coop
and Tuition Reimbursement.
* Enrollment (FTE) includes the current year enrollment on September 20, February 20, 4 yr old at-risk, and virtual.
It does not include non-funded preschool or full-day kindergarten not on an IEP.
0
100,000
200,000
300,000
400,000
500,000
2013-2014 2014-2015 2015-2016
499,453 485,535 470,000
220,637 224,872 175,470
237,320 246,657
338,286
Instruction Expenditures
GeneralSupplemental GeneralSpecial Education
1,200,000
1,220,000
1,240,000
1,260,000
1,280,000
1,300,000
1,320,000
1,340,000
2013-2014 2014-2015 2015-2016
1,329,965
1,310,857
1,255,747
Instruction Expenditures
10/6/2015 4:12 PM Sumexpen.xlsx Page 6 of 30
USD# 269
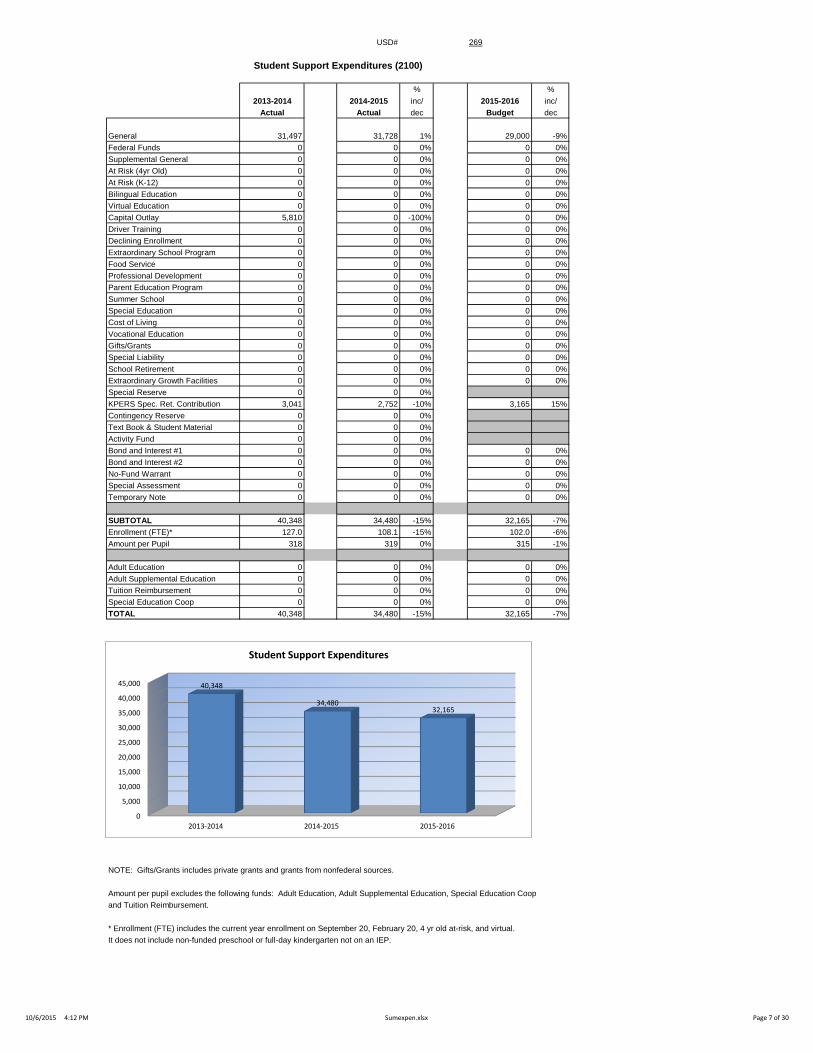
Student Support Expenditures (2100)
% %
2013-2014 2014-2015 inc/ 2015-2016 inc/
Actual Actual dec Budget dec
General 31,497 31,728 1% 29,000 -9%
Federal Funds 0 0 0% 0 0%
Supplemental General 0 0 0% 0 0%
At Risk (4yr Old) 0 0 0% 0 0%
At Risk (K-12) 0 0 0% 0 0%
Bilingual Education 0 0 0% 0 0%
Virtual Education 0 0 0% 0 0%
Capital Outlay 5,810 0 -100% 0 0%
Driver Training 0 0 0% 0 0%
Declining Enrollment 0 0 0% 0 0%
Extraordinary School Program 0 0 0% 0 0%
Food Service 0 0 0% 0 0%
Professional Development 0 0 0% 0 0%
Parent Education Program 0 0 0% 0 0%
Summer School 0 0 0% 0 0%
Special Education 0 0 0% 0 0%
Cost of Living 0 0 0% 0 0%
Vocational Education 0 0 0% 0 0%
Gifts/Grants 0 0 0% 0 0%
Special Liability 0 0 0% 0 0%
School Retirement 0 0 0% 0 0%
Extraordinary Growth Facilities 0 0 0% 0 0%
Special Reserve 0 0 0%
KPERS Spec. Ret. Contribution 3,041 2,752 -10% 3,165 15%
Contingency Reserve 0 0 0%
Text Book & Student Material 0 0 0%
Activity Fund 0 0 0%
Bond and Interest #1 0 0 0% 0 0%
Bond and Interest #2 0 0 0% 0 0%
No-Fund Warrant 0 0 0% 0 0%
Special Assessment 0 0 0% 0 0%
Temporary Note 0 0 0% 0 0%
SUBTOTAL 40,348 34,480 -15% 32,165 -7%
Enrollment (FTE)* 127.0 108.1 -15% 102.0 -6%
Amount per Pupil 318 319 0% 315 -1%
Adult Education 0 0 0% 0 0%
Adult Supplemental Education 0 0 0% 0 0%
Tuition Reimbursement 0 0 0% 0 0%
Special Education Coop 0 0 0% 0 0%
TOTAL 40,348 34,480 -15% 32,165 -7%
NOTE: Gifts/Grants includes private grants and grants from nonfederal sources.
Amount per pupil excludes the following funds: Adult Education, Adult Supplemental Education, Special Education Coop
and Tuition Reimbursement.
* Enrollment (FTE) includes the current year enrollment on September 20, February 20, 4 yr old at-risk, and virtual.
It does not include non-funded preschool or full-day kindergarten not on an IEP.
0
5,000
10,000
15,000
20,000
25,000
30,000
35,000
40,000
45,000
2013-2014 2014-2015 2015-2016
40,348
34,480 32,165
Student Support Expenditures
10/6/2015 4:12 PM Sumexpen.xlsx Page 7 of 30
USD# 269
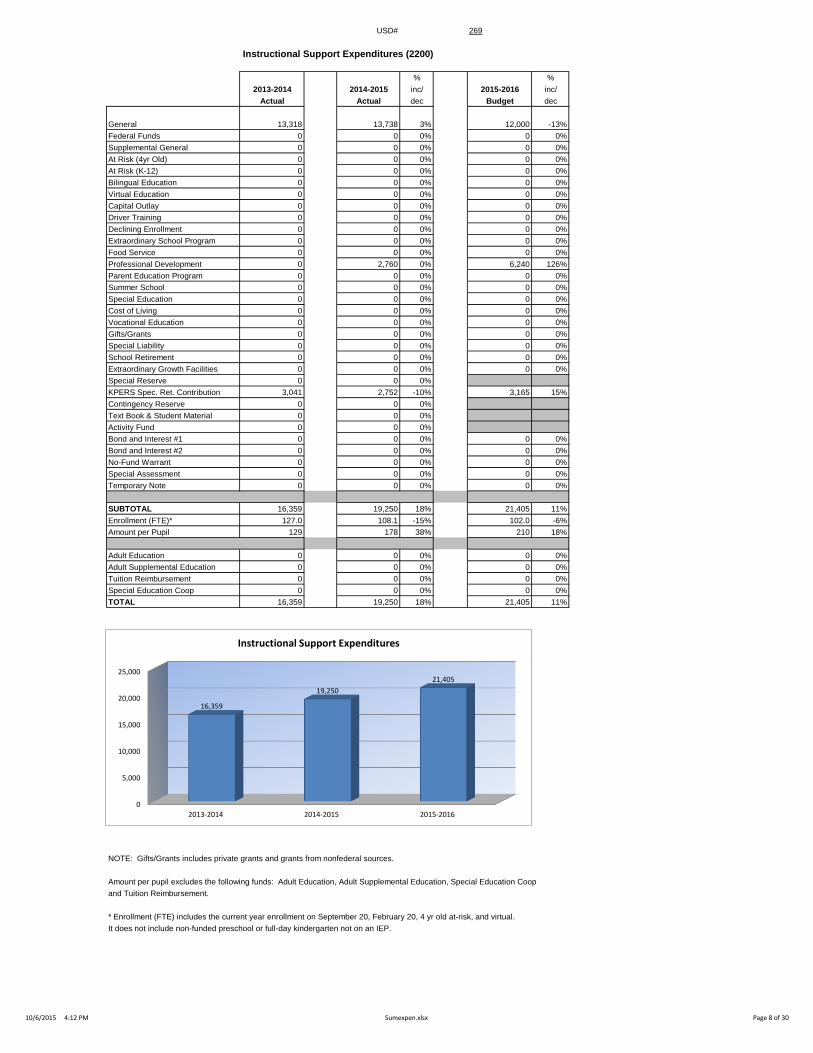
Instructional Support Expenditures (2200)
% %
2013-2014 2014-2015 inc/ 2015-2016 inc/
Actual Actual dec Budget dec
General 13,318 13,738 3% 12,000 -13%
Federal Funds 0 0 0% 0 0%
Supplemental General 0 0 0% 0 0%
At Risk (4yr Old) 0 0 0% 0 0%
At Risk (K-12) 0 0 0% 0 0%
Bilingual Education 0 0 0% 0 0%
Virtual Education 0 0 0% 0 0%
Capital Outlay 0 0 0% 0 0%
Driver Training 0 0 0% 0 0%
Declining Enrollment 0 0 0% 0 0%
Extraordinary School Program 0 0 0% 0 0%
Food Service 0 0 0% 0 0%
Professional Development 0 2,760 0% 6,240 126%
Parent Education Program 0 0 0% 0 0%
Summer School 0 0 0% 0 0%
Special Education 0 0 0% 0 0%
Cost of Living 0 0 0% 0 0%
Vocational Education 0 0 0% 0 0%
Gifts/Grants 0 0 0% 0 0%
Special Liability 0 0 0% 0 0%
School Retirement 0 0 0% 0 0%
Extraordinary Growth Facilities 0 0 0% 0 0%
Special Reserve 0 0 0%
KPERS Spec. Ret. Contribution 3,041 2,752 -10% 3,165 15%
Contingency Reserve 0 0 0%
Text Book & Student Material 0 0 0%
Activity Fund 0 0 0%
Bond and Interest #1 0 0 0% 0 0%
Bond and Interest #2 0 0 0% 0 0%
No-Fund Warrant 0 0 0% 0 0%
Special Assessment 0 0 0% 0 0%
Temporary Note 0 0 0% 0 0%
SUBTOTAL 16,359 19,250 18% 21,405 11%
Enrollment (FTE)* 127.0 108.1 -15% 102.0 -6%
Amount per Pupil 129 178 38% 210 18%
Adult Education 0 0 0% 0 0%
Adult Supplemental Education 0 0 0% 0 0%
Tuition Reimbursement 0 0 0% 0 0%
Special Education Coop 0 0 0% 0 0%
TOTAL 16,359 19,250 18% 21,405 11%
NOTE: Gifts/Grants includes private grants and grants from nonfederal sources.
Amount per pupil excludes the following funds: Adult Education, Adult Supplemental Education, Special Education Coop
and Tuition Reimbursement.
* Enrollment (FTE) includes the current year enrollment on September 20, February 20, 4 yr old at-risk, and virtual.
It does not include non-funded preschool or full-day kindergarten not on an IEP.
0
5,000
10,000
15,000
20,000
25,000
2013-2014 2014-2015 2015-2016
16,359
19,250
21,405
Instructional Support Expenditures
10/6/2015 4:12 PM Sumexpen.xlsx Page 8 of 30

USD# 269
General Administration Expenditures (2300)
% %
2013-2014 2014-2015 inc/ 2015-2016 inc/
Actual Actual dec Budget dec
General 134,557 153,637 14% 145,256 -5%
Federal Funds 0 0 0% 0 0%
Supplemental General 2,031 1,128 -44% 1,300 15%
At Risk (4yr Old) 0 0 0% 0 0%
At Risk (K-12) 0 0 0% 0 0%
Bilingual Education 0 0 0% 0 0%
Virtual Education 0 0 0% 0 0%
Capital Outlay 0 0 0% 0 0%
Driver Training 0 0 0% 0 0%
Declining Enrollment 0 0 0% 0 0%
Extraordinary School Program 0 0 0% 0 0%
Food Service 0 0 0% 0 0%
Professional Development 0 0 0% 0 0%
Parent Education Program 0 0 0% 0 0%
Summer School 0 0 0% 0 0%
Special Education 0 0 0% 0 0%
Cost of Living 0 0 0% 0 0%
Vocational Education 0 0 0% 0 0%
Gifts/Grants 0 0 0% 0 0%
Special Liability Expense 0 0 0% 0 0%
School Retirement 0 0 0% 0 0%
Extraordinary Growth Facilities 0 0 0% 0 0%
Special Reserve 0 0 0%
KPERS Spec. Ret. Contribution 3,162 2,752 -13% 3,165 15%
Contingency Reserve 30,611 0 -100%
Text Book & Student Material 0 0 0%
Activity Fund 0 0 0%
Bond and Interest #1 0 0 0% 0 0%
Bond and Interest #2 0 0 0% 0 0%
No-Fund Warrant 0 0 0% 0 0%
Special Assessment 0 0 0% 0 0%
Temporary Note 0 0 0% 0 0%
SUBTOTAL 170,361 157,517 -8% 149,721 -5%
Enrollment (FTE)* 127.0 108.1 -15% 102.0 -6%
Amount per Pupil 1,341 1,457 9% 1,468 1%
Adult Education 0 0 0% 0 0%
Adult Supplemental Education 0 0 0% 0 0%
Tuition Reimbursement 0 0 0% 0 0%
Special Education Coop 0 0 0% 0 0%
TOTAL 170,361 157,517 -8% 149,721 -5%
NOTE: Gifts/Grants includes private grants and grants from nonfederal sources.
Amount per pupil excludes the following funds: Adult Education, Adult Supplemental Education, Special Education Coop
and Tuition Reimbursement.
* Enrollment (FTE) includes the current year enrollment on September 20, February 20, 4 yr old at-risk, and virtual.
It does not include non-funded preschool or full-day kindergarten not on an IEP.
135,000
140,000
145,000
150,000
155,000
160,000
165,000
170,000
175,000
2013-2014 2014-2015 2015-2016
170,361
157,517
149,721
General Administration Expenditures
10/6/2015 4:12 PM Sumexpen.xlsx Page 9 of 30
USD# 269
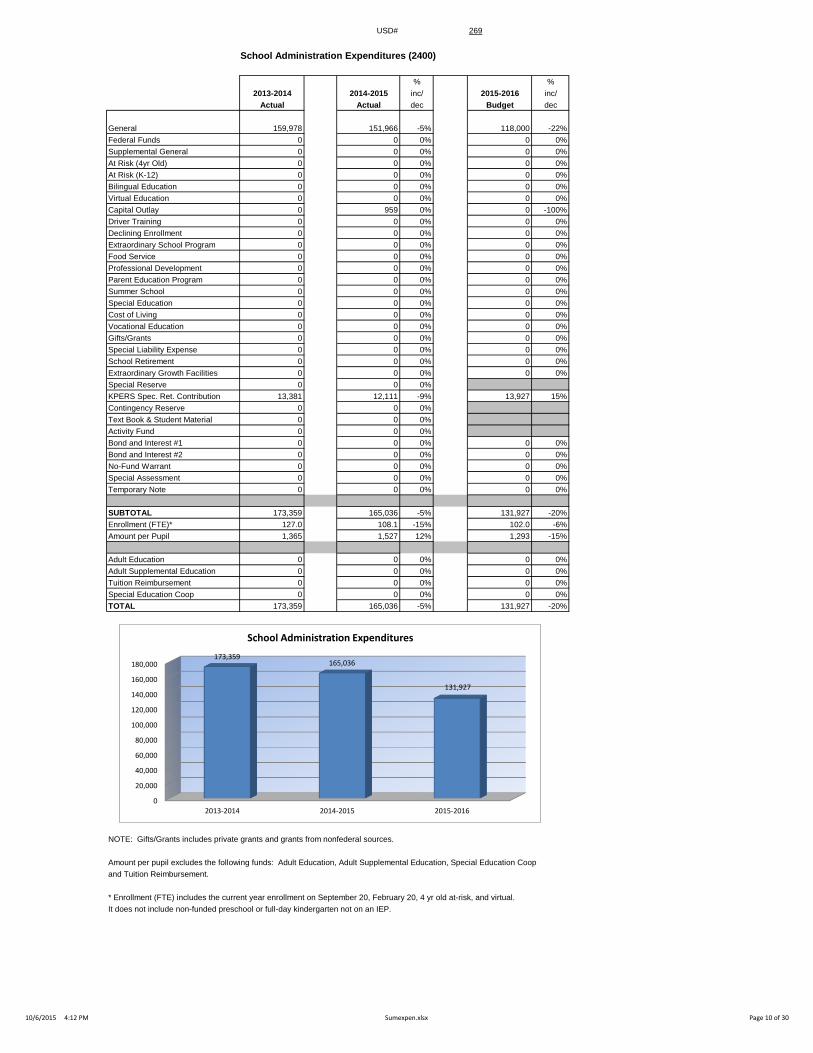
School Administration Expenditures (2400)
% %
2013-2014 2014-2015 inc/ 2015-2016 inc/
Actual Actual dec Budget dec
General 159,978 151,966 -5% 118,000 -22%
Federal Funds 0 0 0% 0 0%
Supplemental General 0 0 0% 0 0%
At Risk (4yr Old) 0 0 0% 0 0%
At Risk (K-12) 0 0 0% 0 0%
Bilingual Education 0 0 0% 0 0%
Virtual Education 0 0 0% 0 0%
Capital Outlay 0 959 0% 0 -100%
Driver Training 0 0 0% 0 0%
Declining Enrollment 0 0 0% 0 0%
Extraordinary School Program 0 0 0% 0 0%
Food Service 0 0 0% 0 0%
Professional Development 0 0 0% 0 0%
Parent Education Program 0 0 0% 0 0%
Summer School 0 0 0% 0 0%
Special Education 0 0 0% 0 0%
Cost of Living 0 0 0% 0 0%
Vocational Education 0 0 0% 0 0%
Gifts/Grants 0 0 0% 0 0%
Special Liability Expense 0 0 0% 0 0%
School Retirement 0 0 0% 0 0%
Extraordinary Growth Facilities 0 0 0% 0 0%
Special Reserve 0 0 0%
KPERS Spec. Ret. Contribution 13,381 12,111 -9% 13,927 15%
Contingency Reserve 0 0 0%
Text Book & Student Material 0 0 0%
Activity Fund 0 0 0%
Bond and Interest #1 0 0 0% 0 0%
Bond and Interest #2 0 0 0% 0 0%
No-Fund Warrant 0 0 0% 0 0%
Special Assessment 0 0 0% 0 0%
Temporary Note 0 0 0% 0 0%
SUBTOTAL 173,359 165,036 -5% 131,927 -20%
Enrollment (FTE)* 127.0 108.1 -15% 102.0 -6%
Amount per Pupil 1,365 1,527 12% 1,293 -15%
Adult Education 0 0 0% 0 0%
Adult Supplemental Education 0 0 0% 0 0%
Tuition Reimbursement 0 0 0% 0 0%
Special Education Coop 0 0 0% 0 0%
TOTAL 173,359 165,036 -5% 131,927 -20%
NOTE: Gifts/Grants includes private grants and grants from nonfederal sources.
Amount per pupil excludes the following funds: Adult Education, Adult Supplemental Education, Special Education Coop
and Tuition Reimbursement.
* Enrollment (FTE) includes the current year enrollment on September 20, February 20, 4 yr old at-risk, and virtual.
It does not include non-funded preschool or full-day kindergarten not on an IEP.
0
20,000
40,000
60,000
80,000
100,000
120,000
140,000
160,000
180,000
2013-2014 2014-2015 2015-2016
173,359 165,036
131,927
School Administration Expenditures
10/6/2015 4:12 PM Sumexpen.xlsx Page 10 of 30
USD# 269
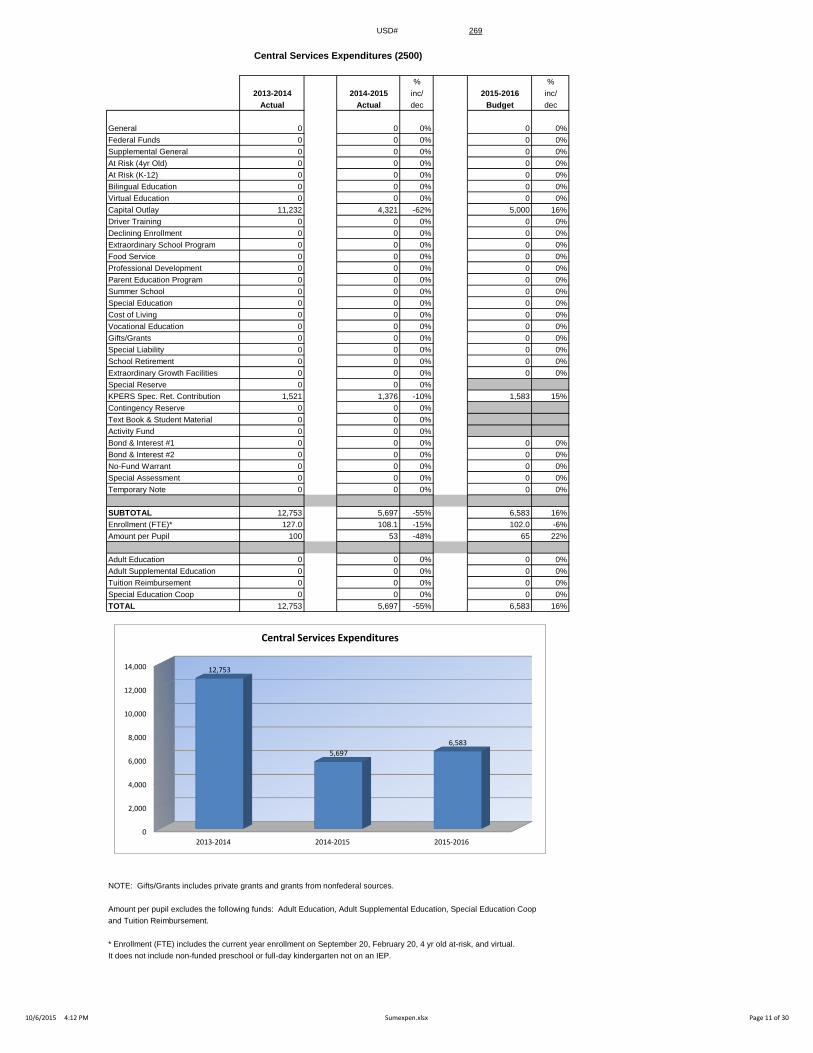
Central Services Expenditures (2500)
% %
2013-2014 2014-2015 inc/ 2015-2016 inc/
Actual Actual dec Budget dec
General 0 0 0% 0 0%
Federal Funds 0 0 0% 0 0%
Supplemental General 0 0 0% 0 0%
At Risk (4yr Old) 0 0 0% 0 0%
At Risk (K-12) 0 0 0% 0 0%
Bilingual Education 0 0 0% 0 0%
Virtual Education 0 0 0% 0 0%
Capital Outlay 11,232 4,321 -62% 5,000 16%
Driver Training 0 0 0% 0 0%
Declining Enrollment 0 0 0% 0 0%
Extraordinary School Program 0 0 0% 0 0%
Food Service 0 0 0% 0 0%
Professional Development 0 0 0% 0 0%
Parent Education Program 0 0 0% 0 0%
Summer School 0 0 0% 0 0%
Special Education 0 0 0% 0 0%
Cost of Living 0 0 0% 0 0%
Vocational Education 0 0 0% 0 0%
Gifts/Grants 0 0 0% 0 0%
Special Liability 0 0 0% 0 0%
School Retirement 0 0 0% 0 0%
Extraordinary Growth Facilities 0 0 0% 0 0%
Special Reserve 0 0 0%
KPERS Spec. Ret. Contribution 1,521 1,376 -10% 1,583 15%
Contingency Reserve 0 0 0%
Text Book & Student Material 0 0 0%
Activity Fund 0 0 0%
Bond & Interest #1 0 0 0% 0 0%
Bond & Interest #2 0 0 0% 0 0%
No-Fund Warrant 0 0 0% 0 0%
Special Assessment 0 0 0% 0 0%
Temporary Note 0 0 0% 0 0%
SUBTOTAL 12,753 5,697 -55% 6,583 16%
Enrollment (FTE)* 127.0 108.1 -15% 102.0 -6%
Amount per Pupil 100 53 -48% 65 22%
Adult Education 0 0 0% 0 0%
Adult Supplemental Education 0 0 0% 0 0%
Tuition Reimbursement 0 0 0% 0 0%
Special Education Coop 0 0 0% 0 0%
TOTAL 12,753 5,697 -55% 6,583 16%
NOTE: Gifts/Grants includes private grants and grants from nonfederal sources.
Amount per pupil excludes the following funds: Adult Education, Adult Supplemental Education, Special Education Coop
and Tuition Reimbursement.
* Enrollment (FTE) includes the current year enrollment on September 20, February 20, 4 yr old at-risk, and virtual.
It does not include non-funded preschool or full-day kindergarten not on an IEP.
0
2,000
4,000
6,000
8,000
10,000
12,000
14,000
2013-2014 2014-2015 2015-2016
12,753
5,697
6,583
Central Services Expenditures
10/6/2015 4:12 PM Sumexpen.xlsx Page 11 of 30
USD# 269
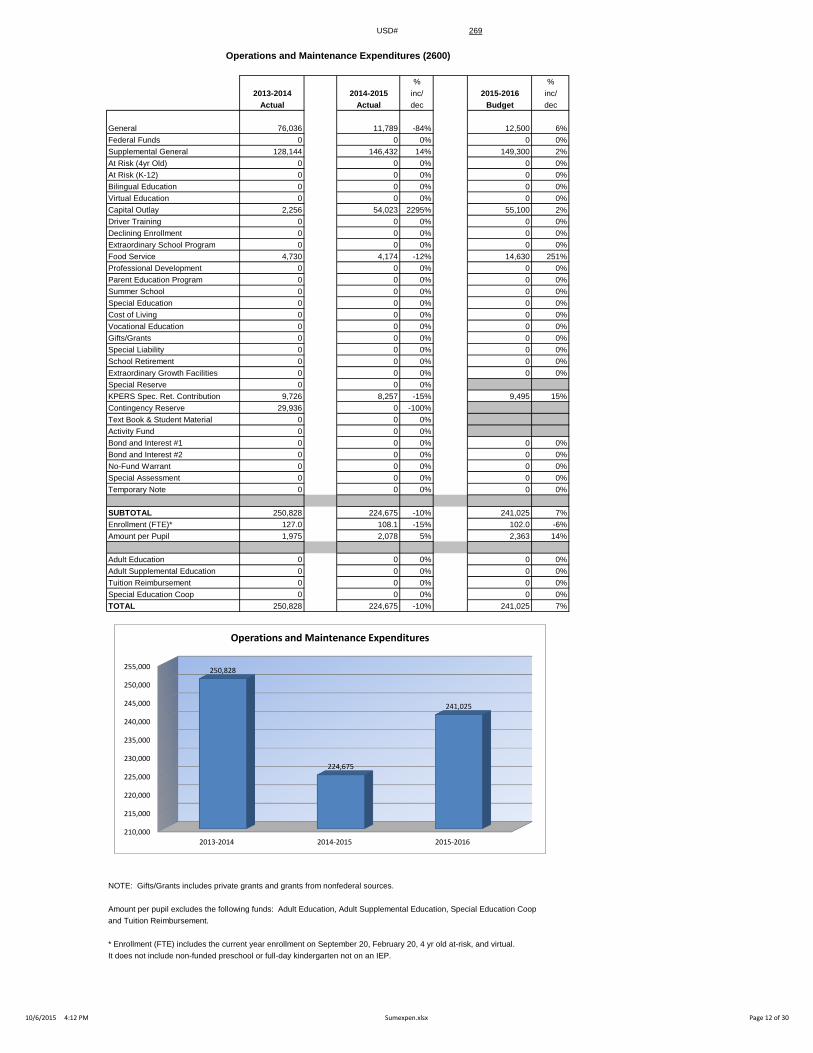
Operations and Maintenance Expenditures (2600)
% %
2013-2014 2014-2015 inc/ 2015-2016 inc/
Actual Actual dec Budget dec
General 76,036 11,789 -84% 12,500 6%
Federal Funds 0 0 0% 0 0%
Supplemental General 128,144 146,432 14% 149,300 2%
At Risk (4yr Old) 0 0 0% 0 0%
At Risk (K-12) 0 0 0% 0 0%
Bilingual Education 0 0 0% 0 0%
Virtual Education 0 0 0% 0 0%
Capital Outlay 2,256 54,023 2295% 55,100 2%
Driver Training 0 0 0% 0 0%
Declining Enrollment 0 0 0% 0 0%
Extraordinary School Program 0 0 0% 0 0%
Food Service 4,730 4,174 -12% 14,630 251%
Professional Development 0 0 0% 0 0%
Parent Education Program 0 0 0% 0 0%
Summer School 0 0 0% 0 0%
Special Education 0 0 0% 0 0%
Cost of Living 0 0 0% 0 0%
Vocational Education 0 0 0% 0 0%
Gifts/Grants 0 0 0% 0 0%
Special Liability 0 0 0% 0 0%
School Retirement 0 0 0% 0 0%
Extraordinary Growth Facilities 0 0 0% 0 0%
Special Reserve 0 0 0%
KPERS Spec. Ret. Contribution 9,726 8,257 -15% 9,495 15%
Contingency Reserve 29,936 0 -100%
Text Book & Student Material 0 0 0%
Activity Fund 0 0 0%
Bond and Interest #1 0 0 0% 0 0%
Bond and Interest #2 0 0 0% 0 0%
No-Fund Warrant 0 0 0% 0 0%
Special Assessment 0 0 0% 0 0%
Temporary Note 0 0 0% 0 0%
SUBTOTAL 250,828 224,675 -10% 241,025 7%
Enrollment (FTE)* 127.0 108.1 -15% 102.0 -6%
Amount per Pupil 1,975 2,078 5% 2,363 14%
Adult Education 0 0 0% 0 0%
Adult Supplemental Education 0 0 0% 0 0%
Tuition Reimbursement 0 0 0% 0 0%
Special Education Coop 0 0 0% 0 0%
TOTAL 250,828 224,675 -10% 241,025 7%
NOTE: Gifts/Grants includes private grants and grants from nonfederal sources.
Amount per pupil excludes the following funds: Adult Education, Adult Supplemental Education, Special Education Coop
and Tuition Reimbursement.
* Enrollment (FTE) includes the current year enrollment on September 20, February 20, 4 yr old at-risk, and virtual.
It does not include non-funded preschool or full-day kindergarten not on an IEP.
210,000
215,000
220,000
225,000
230,000
235,000
240,000
245,000
250,000
255,000
2013-2014 2014-2015 2015-2016
250,828
224,675
241,025
Operations and Maintenance Expenditures
10/6/2015 4:12 PM Sumexpen.xlsx Page 12 of 30
USD# 269
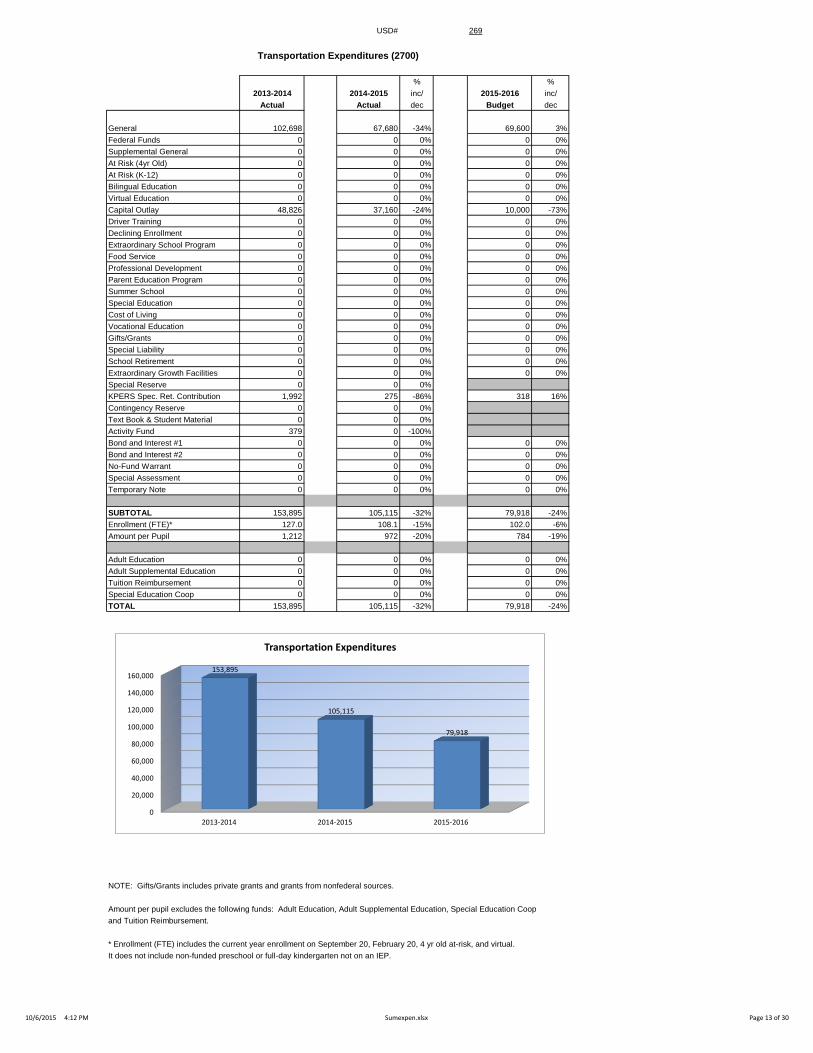
Transportation Expenditures (2700)
% %
2013-2014 2014-2015 inc/ 2015-2016 inc/
Actual Actual dec Budget dec
General 102,698 67,680 -34% 69,600 3%
Federal Funds 0 0 0% 0 0%
Supplemental General 0 0 0% 0 0%
At Risk (4yr Old) 0 0 0% 0 0%
At Risk (K-12) 0 0 0% 0 0%
Bilingual Education 0 0 0% 0 0%
Virtual Education 0 0 0% 0 0%
Capital Outlay 48,826 37,160 -24% 10,000 -73%
Driver Training 0 0 0% 0 0%
Declining Enrollment 0 0 0% 0 0%
Extraordinary School Program 0 0 0% 0 0%
Food Service 0 0 0% 0 0%
Professional Development 0 0 0% 0 0%
Parent Education Program 0 0 0% 0 0%
Summer School 0 0 0% 0 0%
Special Education 0 0 0% 0 0%
Cost of Living 0 0 0% 0 0%
Vocational Education 0 0 0% 0 0%
Gifts/Grants 0 0 0% 0 0%
Special Liability 0 0 0% 0 0%
School Retirement 0 0 0% 0 0%
Extraordinary Growth Facilities 0 0 0% 0 0%
Special Reserve 0 0 0%
KPERS Spec. Ret. Contribution 1,992 275 -86% 318 16%
Contingency Reserve 0 0 0%
Text Book & Student Material 0 0 0%
Activity Fund 379 0 -100%
Bond and Interest #1 0 0 0% 0 0%
Bond and Interest #2 0 0 0% 0 0%
No-Fund Warrant 0 0 0% 0 0%
Special Assessment 0 0 0% 0 0%
Temporary Note 0 0 0% 0 0%
SUBTOTAL 153,895 105,115 -32% 79,918 -24%
Enrollment (FTE)* 127.0 108.1 -15% 102.0 -6%
Amount per Pupil 1,212 972 -20% 784 -19%
Adult Education 0 0 0% 0 0%
Adult Supplemental Education 0 0 0% 0 0%
Tuition Reimbursement 0 0 0% 0 0%
Special Education Coop 0 0 0% 0 0%
TOTAL 153,895 105,115 -32% 79,918 -24%
NOTE: Gifts/Grants includes private grants and grants from nonfederal sources.
Amount per pupil excludes the following funds: Adult Education, Adult Supplemental Education, Special Education Coop
and Tuition Reimbursement.
* Enrollment (FTE) includes the current year enrollment on September 20, February 20, 4 yr old at-risk, and virtual.
It does not include non-funded preschool or full-day kindergarten not on an IEP.
0
20,000
40,000
60,000
80,000
100,000
120,000
140,000
160,000
2013-2014 2014-2015 2015-2016
153,895
105,115
79,918
Transportation Expenditures
10/6/2015 4:12 PM Sumexpen.xlsx Page 13 of 30
USD# 269
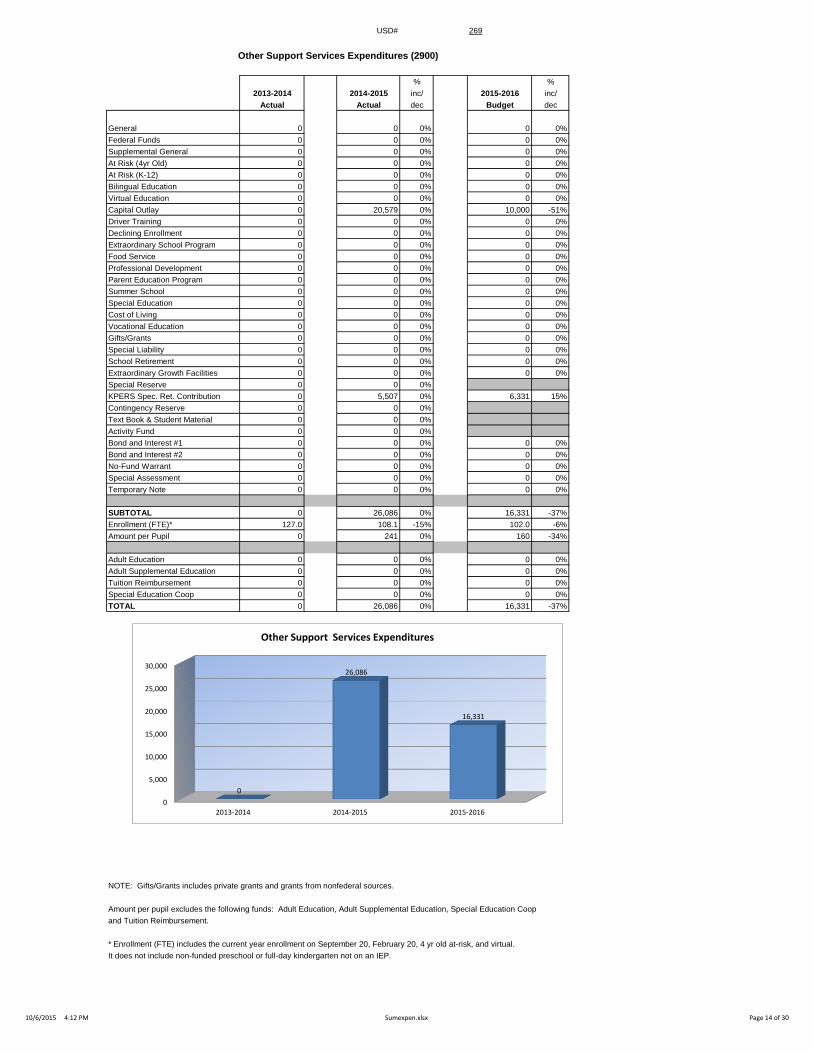
Other Support Services Expenditures (2900)
% %
2013-2014 2014-2015 inc/ 2015-2016 inc/
Actual Actual dec Budget dec
General 0 0 0% 0 0%
Federal Funds 0 0 0% 0 0%
Supplemental General 0 0 0% 0 0%
At Risk (4yr Old) 0 0 0% 0 0%
At Risk (K-12) 0 0 0% 0 0%
Bilingual Education 0 0 0% 0 0%
Virtual Education 0 0 0% 0 0%
Capital Outlay 0 20,579 0% 10,000 -51%
Driver Training 0 0 0% 0 0%
Declining Enrollment 0 0 0% 0 0%
Extraordinary School Program 0 0 0% 0 0%
Food Service 0 0 0% 0 0%
Professional Development 0 0 0% 0 0%
Parent Education Program 0 0 0% 0 0%
Summer School 0 0 0% 0 0%
Special Education 0 0 0% 0 0%
Cost of Living 0 0 0% 0 0%
Vocational Education 0 0 0% 0 0%
Gifts/Grants 0 0 0% 0 0%
Special Liability 0 0 0% 0 0%
School Retirement 0 0 0% 0 0%
Extraordinary Growth Facilities 0 0 0% 0 0%
Special Reserve 0 0 0%
KPERS Spec. Ret. Contribution 0 5,507 0% 6,331 15%
Contingency Reserve 0 0 0%
Text Book & Student Material 0 0 0%
Activity Fund 0 0 0%
Bond and Interest #1 0 0 0% 0 0%
Bond and Interest #2 0 0 0% 0 0%
No-Fund Warrant 0 0 0% 0 0%
Special Assessment 0 0 0% 0 0%
Temporary Note 0 0 0% 0 0%
SUBTOTAL 0 26,086 0% 16,331 -37%
Enrollment (FTE)* 127.0 108.1 -15% 102.0 -6%
Amount per Pupil 0 241 0% 160 -34%
Adult Education 0 0 0% 0 0%
Adult Supplemental Education 0 0 0% 0 0%
Tuition Reimbursement 0 0 0% 0 0%
Special Education Coop 0 0 0% 0 0%
TOTAL 0 26,086 0% 16,331 -37%
NOTE: Gifts/Grants includes private grants and grants from nonfederal sources.
Amount per pupil excludes the following funds: Adult Education, Adult Supplemental Education, Special Education Coop
and Tuition Reimbursement.
* Enrollment (FTE) includes the current year enrollment on September 20, February 20, 4 yr old at-risk, and virtual.
It does not include non-funded preschool or full-day kindergarten not on an IEP.
0
5,000
10,000
15,000
20,000
25,000
30,000
2013-2014 2014-2015 2015-2016
0
26,086
16,331
Other Support Services Expenditures
10/6/2015 4:12 PM Sumexpen.xlsx Page 14 of 30
USD# 269
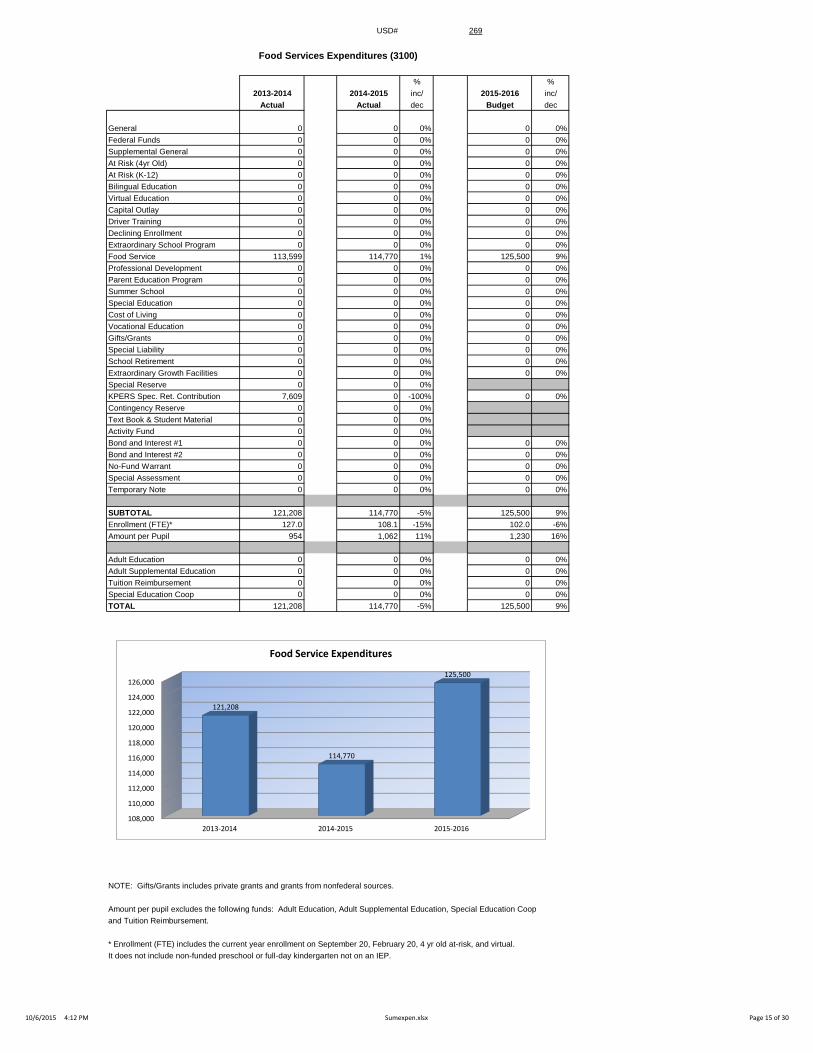
Food Services Expenditures (3100)
% %
2013-2014 2014-2015 inc/ 2015-2016 inc/
Actual Actual dec Budget dec
General 0 0 0% 0 0%
Federal Funds 0 0 0% 0 0%
Supplemental General 0 0 0% 0 0%
At Risk (4yr Old) 0 0 0% 0 0%
At Risk (K-12) 0 0 0% 0 0%
Bilingual Education 0 0 0% 0 0%
Virtual Education 0 0 0% 0 0%
Capital Outlay 0 0 0% 0 0%
Driver Training 0 0 0% 0 0%
Declining Enrollment 0 0 0% 0 0%
Extraordinary School Program 0 0 0% 0 0%
Food Service 113,599 114,770 1% 125,500 9%
Professional Development 0 0 0% 0 0%
Parent Education Program 0 0 0% 0 0%
Summer School 0 0 0% 0 0%
Special Education 0 0 0% 0 0%
Cost of Living 0 0 0% 0 0%
Vocational Education 0 0 0% 0 0%
Gifts/Grants 0 0 0% 0 0%
Special Liability 0 0 0% 0 0%
School Retirement 0 0 0% 0 0%
Extraordinary Growth Facilities 0 0 0% 0 0%
Special Reserve 0 0 0%
KPERS Spec. Ret. Contribution 7,609 0 -100% 0 0%
Contingency Reserve 0 0 0%
Text Book & Student Material 0 0 0%
Activity Fund 0 0 0%
Bond and Interest #1 0 0 0% 0 0%
Bond and Interest #2 0 0 0% 0 0%
No-Fund Warrant 0 0 0% 0 0%
Special Assessment 0 0 0% 0 0%
Temporary Note 0 0 0% 0 0%
SUBTOTAL 121,208 114,770 -5% 125,500 9%
Enrollment (FTE)* 127.0 108.1 -15% 102.0 -6%
Amount per Pupil 954 1,062 11% 1,230 16%
Adult Education 0 0 0% 0 0%
Adult Supplemental Education 0 0 0% 0 0%
Tuition Reimbursement 0 0 0% 0 0%
Special Education Coop 0 0 0% 0 0%
TOTAL 121,208 114,770 -5% 125,500 9%
NOTE: Gifts/Grants includes private grants and grants from nonfederal sources.
Amount per pupil excludes the following funds: Adult Education, Adult Supplemental Education, Special Education Coop
and Tuition Reimbursement.
* Enrollment (FTE) includes the current year enrollment on September 20, February 20, 4 yr old at-risk, and virtual.
It does not include non-funded preschool or full-day kindergarten not on an IEP.
108,000
110,000
112,000
114,000
116,000
118,000
120,000
122,000
124,000
126,000
2013-2014 2014-2015 2015-2016
121,208
114,770
125,500
Food Service Expenditures
10/6/2015 4:12 PM Sumexpen.xlsx Page 15 of 30
USD# 269
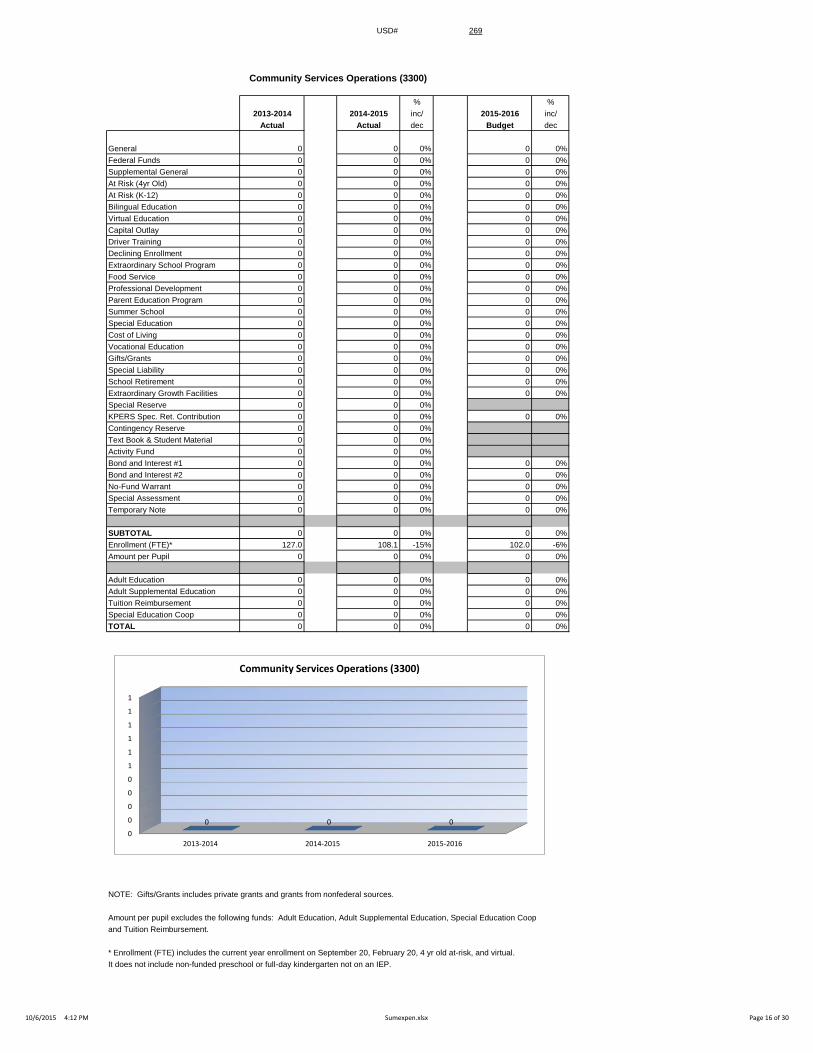
Community Services Operations (3300)
% %
2013-2014 2014-2015 inc/ 2015-2016 inc/
Actual Actual dec Budget dec
General 0 0 0% 0 0%
Federal Funds 0 0 0% 0 0%
Supplemental General 0 0 0% 0 0%
At Risk (4yr Old) 0 0 0% 0 0%
At Risk (K-12) 0 0 0% 0 0%
Bilingual Education 0 0 0% 0 0%
Virtual Education 0 0 0% 0 0%
Capital Outlay 0 0 0% 0 0%
Driver Training 0 0 0% 0 0%
Declining Enrollment 0 0 0% 0 0%
Extraordinary School Program 0 0 0% 0 0%
Food Service 0 0 0% 0 0%
Professional Development 0 0 0% 0 0%
Parent Education Program 0 0 0% 0 0%
Summer School 0 0 0% 0 0%
Special Education 0 0 0% 0 0%
Cost of Living 0 0 0% 0 0%
Vocational Education 0 0 0% 0 0%
Gifts/Grants 0 0 0% 0 0%
Special Liability 0 0 0% 0 0%
School Retirement 0 0 0% 0 0%
Extraordinary Growth Facilities 0 0 0% 0 0%
Special Reserve 0 0 0%
KPERS Spec. Ret. Contribution 0 0 0% 0 0%
Contingency Reserve 0 0 0%
Text Book & Student Material 0 0 0%
Activity Fund 0 0 0%
Bond and Interest #1 0 0 0% 0 0%
Bond and Interest #2 0 0 0% 0 0%
No-Fund Warrant 0 0 0% 0 0%
Special Assessment 0 0 0% 0 0%
Temporary Note 0 0 0% 0 0%
SUBTOTAL 0 0 0% 0 0%
Enrollment (FTE)* 127.0 108.1 -15% 102.0 -6%
Amount per Pupil 0 0 0% 0 0%
Adult Education 0 0 0% 0 0%
Adult Supplemental Education 0 0 0% 0 0%
Tuition Reimbursement 0 0 0% 0 0%
Special Education Coop 0 0 0% 0 0%
TOTAL 0 0 0% 0 0%
NOTE: Gifts/Grants includes private grants and grants from nonfederal sources.
Amount per pupil excludes the following funds: Adult Education, Adult Supplemental Education, Special Education Coop
and Tuition Reimbursement.
* Enrollment (FTE) includes the current year enrollment on September 20, February 20, 4 yr old at-risk, and virtual.
It does not include non-funded preschool or full-day kindergarten not on an IEP.
0
0
0
0
0
1
1
1
1
1
1
2013-2014 2014-2015 2015-2016
0 0 0
Community Services Operations (3300)
10/6/2015 4:12 PM Sumexpen.xlsx Page 16 of 30
USD# 269
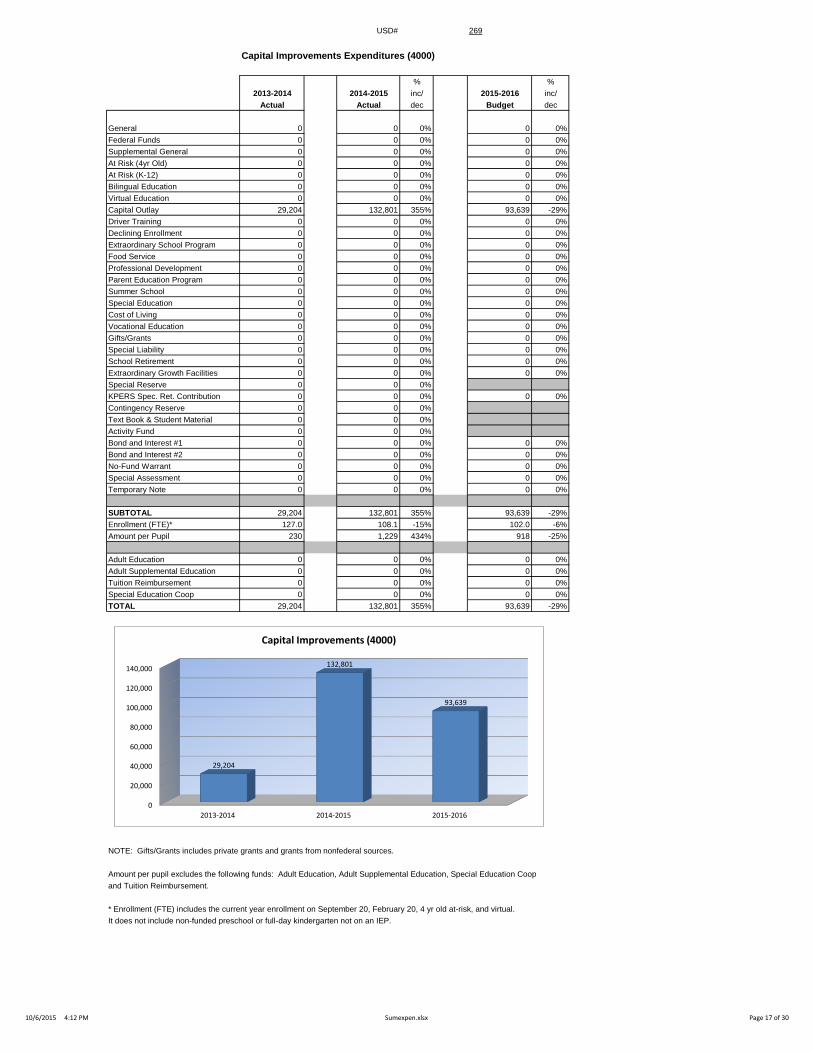
Capital Improvements Expenditures (4000)
% %
2013-2014 2014-2015 inc/ 2015-2016 inc/
Actual Actual dec Budget dec
General 0 0 0% 0 0%
Federal Funds 0 0 0% 0 0%
Supplemental General 0 0 0% 0 0%
At Risk (4yr Old) 0 0 0% 0 0%
At Risk (K-12) 0 0 0% 0 0%
Bilingual Education 0 0 0% 0 0%
Virtual Education 0 0 0% 0 0%
Capital Outlay 29,204 132,801 355% 93,639 -29%
Driver Training 0 0 0% 0 0%
Declining Enrollment 0 0 0% 0 0%
Extraordinary School Program 0 0 0% 0 0%
Food Service 0 0 0% 0 0%
Professional Development 0 0 0% 0 0%
Parent Education Program 0 0 0% 0 0%
Summer School 0 0 0% 0 0%
Special Education 0 0 0% 0 0%
Cost of Living 0 0 0% 0 0%
Vocational Education 0 0 0% 0 0%
Gifts/Grants 0 0 0% 0 0%
Special Liability 0 0 0% 0 0%
School Retirement 0 0 0% 0 0%
Extraordinary Growth Facilities 0 0 0% 0 0%
Special Reserve 0 0 0%
KPERS Spec. Ret. Contribution 0 0 0% 0 0%
Contingency Reserve 0 0 0%
Text Book & Student Material 0 0 0%
Activity Fund 0 0 0%
Bond and Interest #1 0 0 0% 0 0%
Bond and Interest #2 0 0 0% 0 0%
No-Fund Warrant 0 0 0% 0 0%
Special Assessment 0 0 0% 0 0%
Temporary Note 0 0 0% 0 0%
SUBTOTAL 29,204 132,801 355% 93,639 -29%
Enrollment (FTE)* 127.0 108.1 -15% 102.0 -6%
Amount per Pupil 230 1,229 434% 918 -25%
Adult Education 0 0 0% 0 0%
Adult Supplemental Education 0 0 0% 0 0%
Tuition Reimbursement 0 0 0% 0 0%
Special Education Coop 0 0 0% 0 0%
TOTAL 29,204 132,801 355% 93,639 -29%
NOTE: Gifts/Grants includes private grants and grants from nonfederal sources.
Amount per pupil excludes the following funds: Adult Education, Adult Supplemental Education, Special Education Coop
and Tuition Reimbursement.
* Enrollment (FTE) includes the current year enrollment on September 20, February 20, 4 yr old at-risk, and virtual.
It does not include non-funded preschool or full-day kindergarten not on an IEP.
0
20,000
40,000
60,000
80,000
100,000
120,000
140,000
2013-2014 2014-2015 2015-2016
29,204
132,801
93,639
Capital Improvements (4000)
10/6/2015 4:12 PM Sumexpen.xlsx Page 17 of 30
USD# 269
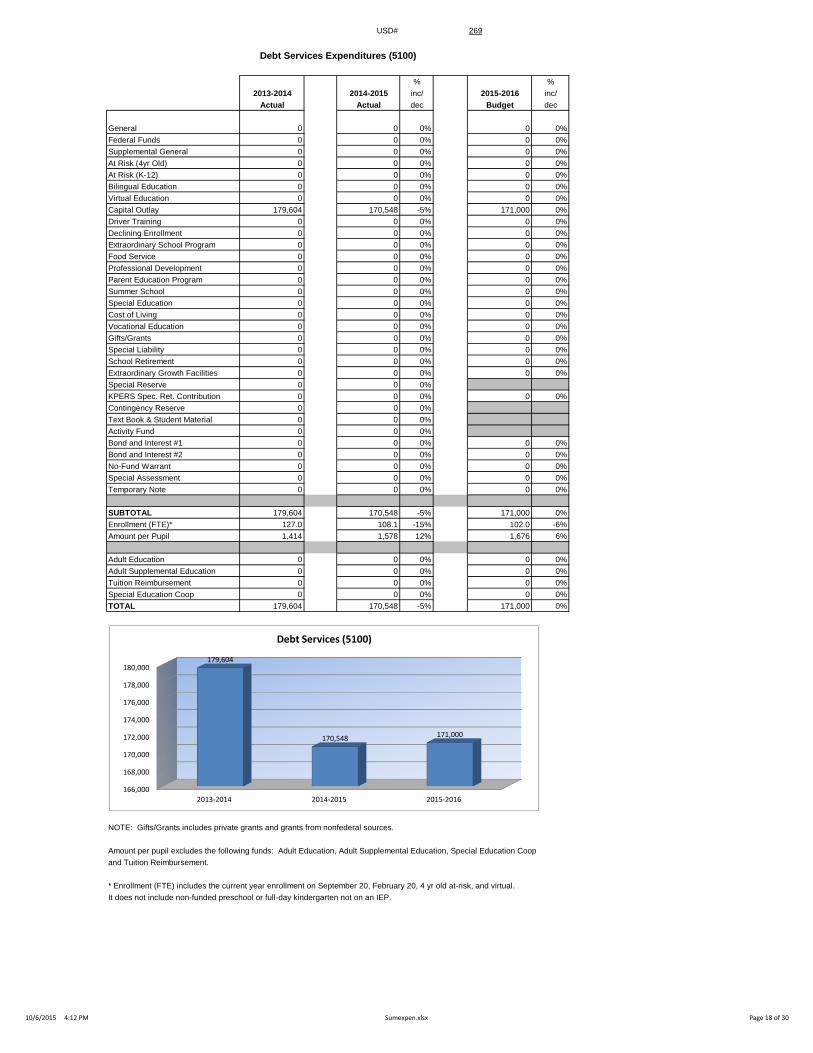
Debt Services Expenditures (5100)
% %
2013-2014 2014-2015 inc/ 2015-2016 inc/
Actual Actual dec Budget dec
General 0 0 0% 0 0%
Federal Funds 0 0 0% 0 0%
Supplemental General 0 0 0% 0 0%
At Risk (4yr Old) 0 0 0% 0 0%
At Risk (K-12) 0 0 0% 0 0%
Bilingual Education 0 0 0% 0 0%
Virtual Education 0 0 0% 0 0%
Capital Outlay 179,604 170,548 -5% 171,000 0%
Driver Training 0 0 0% 0 0%
Declining Enrollment 0 0 0% 0 0%
Extraordinary School Program 0 0 0% 0 0%
Food Service 0 0 0% 0 0%
Professional Development 0 0 0% 0 0%
Parent Education Program 0 0 0% 0 0%
Summer School 0 0 0% 0 0%
Special Education 0 0 0% 0 0%
Cost of Living 0 0 0% 0 0%
Vocational Education 0 0 0% 0 0%
Gifts/Grants 0 0 0% 0 0%
Special Liability 0 0 0% 0 0%
School Retirement 0 0 0% 0 0%
Extraordinary Growth Facilities 0 0 0% 0 0%
Special Reserve 0 0 0%
KPERS Spec. Ret. Contribution 0 0 0% 0 0%
Contingency Reserve 0 0 0%
Text Book & Student Material 0 0 0%
Activity Fund 0 0 0%
Bond and Interest #1 0 0 0% 0 0%
Bond and Interest #2 0 0 0% 0 0%
No-Fund Warrant 0 0 0% 0 0%
Special Assessment 0 0 0% 0 0%
Temporary Note 0 0 0% 0 0%
SUBTOTAL 179,604 170,548 -5% 171,000 0%
Enrollment (FTE)* 127.0 108.1 -15% 102.0 -6%
Amount per Pupil 1,414 1,578 12% 1,676 6%
Adult Education 0 0 0% 0 0%
Adult Supplemental Education 0 0 0% 0 0%
Tuition Reimbursement 0 0 0% 0 0%
Special Education Coop 0 0 0% 0 0%
TOTAL 179,604 170,548 -5% 171,000 0%
NOTE: Gifts/Grants includes private grants and grants from nonfederal sources.
Amount per pupil excludes the following funds: Adult Education, Adult Supplemental Education, Special Education Coop
and Tuition Reimbursement.
* Enrollment (FTE) includes the current year enrollment on September 20, February 20, 4 yr old at-risk, and virtual.
It does not include non-funded preschool or full-day kindergarten not on an IEP.
166,000
168,000
170,000
172,000
174,000
176,000
178,000
180,000
2013-2014 2014-2015 2015-2016
179,604
170,548 171,000
Debt Services (5100)
10/6/2015 4:12 PM Sumexpen.xlsx Page 18 of 30
USD# 269
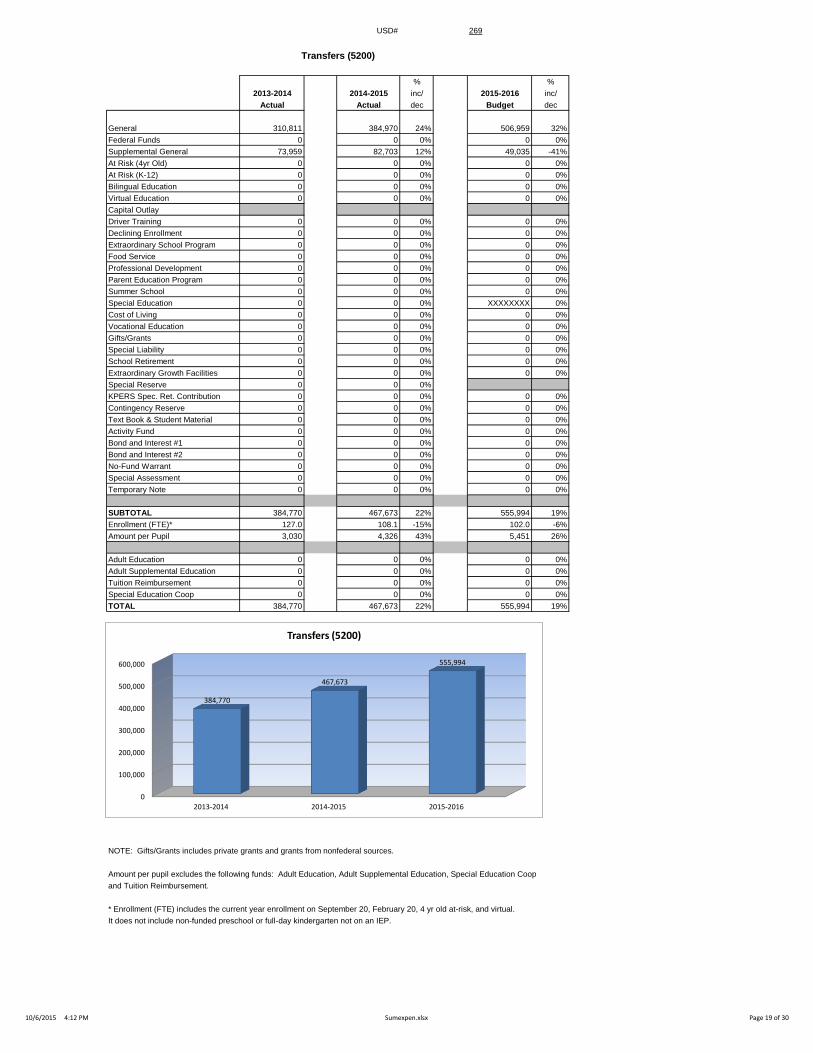
Transfers (5200)
% %
2013-2014 2014-2015 inc/ 2015-2016 inc/
Actual Actual dec Budget dec
General 310,811 384,970 24% 506,959 32%
Federal Funds 0 0 0% 0 0%
Supplemental General 73,959 82,703 12% 49,035 -41%
At Risk (4yr Old) 0 0 0% 0 0%
At Risk (K-12) 0 0 0% 0 0%
Bilingual Education 0 0 0% 0 0%
Virtual Education 0 0 0% 0 0%
Capital Outlay
Driver Training 0 0 0% 0 0%
Declining Enrollment 0 0 0% 0 0%
Extraordinary School Program 0 0 0% 0 0%
Food Service 0 0 0% 0 0%
Professional Development 0 0 0% 0 0%
Parent Education Program 0 0 0% 0 0%
Summer School 0 0 0% 0 0%
Special Education 0 0 0% XXXXXXXX 0%
Cost of Living 0 0 0% 0 0%
Vocational Education 0 0 0% 0 0%
Gifts/Grants 0 0 0% 0 0%
Special Liability 0 0 0% 0 0%
School Retirement 0 0 0% 0 0%
Extraordinary Growth Facilities 0 0 0% 0 0%
Special Reserve 0 0 0%
KPERS Spec. Ret. Contribution 0 0 0% 0 0%
Contingency Reserve 0 0 0% 0 0%
Text Book & Student Material 0 0 0% 0 0%
Activity Fund 0 0 0% 0 0%
Bond and Interest #1 0 0 0% 0 0%
Bond and Interest #2 0 0 0% 0 0%
No-Fund Warrant 0 0 0% 0 0%
Special Assessment 0 0 0% 0 0%
Temporary Note 0 0 0% 0 0%
SUBTOTAL 384,770 467,673 22% 555,994 19%
Enrollment (FTE)* 127.0 108.1 -15% 102.0 -6%
Amount per Pupil 3,030 4,326 43% 5,451 26%
Adult Education 0 0 0% 0 0%
Adult Supplemental Education 0 0 0% 0 0%
Tuition Reimbursement 0 0 0% 0 0%
Special Education Coop 0 0 0% 0 0%
TOTAL 384,770 467,673 22% 555,994 19%
NOTE: Gifts/Grants includes private grants and grants from nonfederal sources.
Amount per pupil excludes the following funds: Adult Education, Adult Supplemental Education, Special Education Coop
and Tuition Reimbursement.
* Enrollment (FTE) includes the current year enrollment on September 20, February 20, 4 yr old at-risk, and virtual.
It does not include non-funded preschool or full-day kindergarten not on an IEP.
0
100,000
200,000
300,000
400,000
500,000
600,000
2013-2014 2014-2015 2015-2016
384,770
467,673
555,994
Transfers (5200)
10/6/2015 4:12 PM Sumexpen.xlsx Page 19 of 30
USD# 269
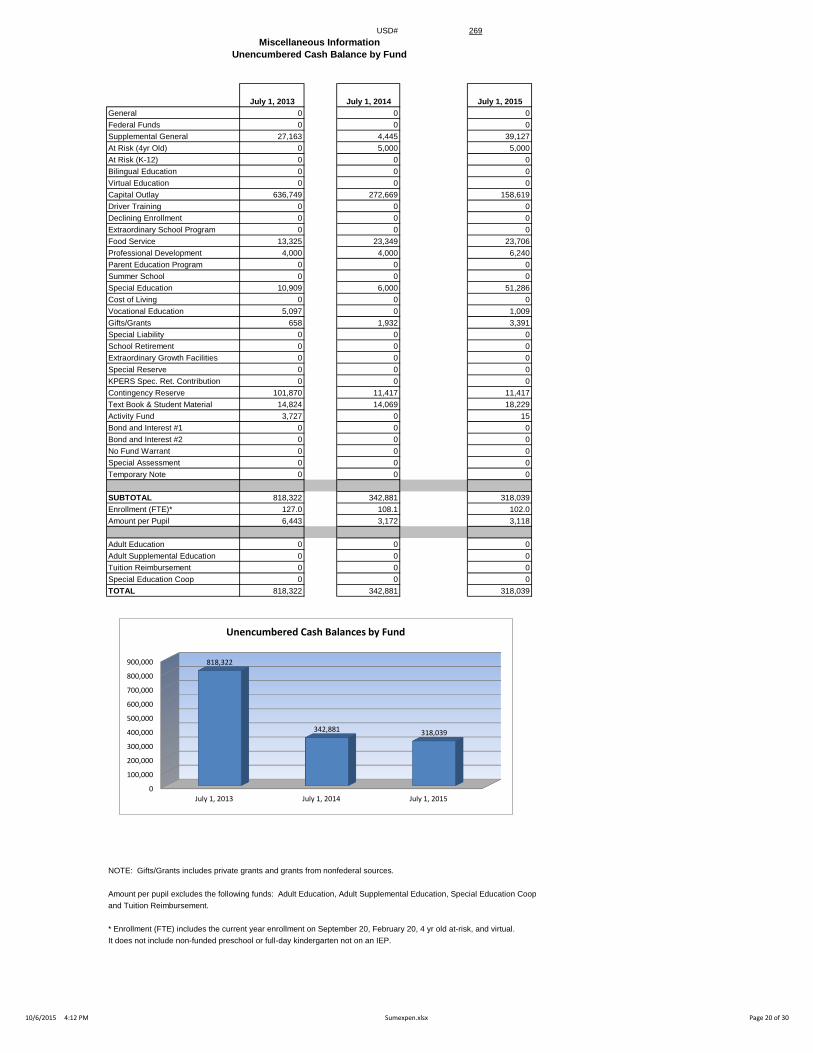
Miscellaneous Information
Unencumbered Cash Balance by Fund
July 1, 2013 July 1, 2014 July 1, 2015
General 0 0 0
Federal Funds 0 0 0
Supplemental General 27,163 4,445 39,127
At Risk (4yr Old) 0 5,000 5,000
At Risk (K-12) 0 0 0
Bilingual Education 0 0 0
Virtual Education 0 0 0
Capital Outlay 636,749 272,669 158,619
Driver Training 0 0 0
Declining Enrollment 0 0 0
Extraordinary School Program 0 0 0
Food Service 13,325 23,349 23,706
Professional Development 4,000 4,000 6,240
Parent Education Program 0 0 0
Summer School 0 0 0
Special Education 10,909 6,000 51,286
Cost of Living 0 0 0
Vocational Education 5,097 0 1,009
Gifts/Grants 658 1,932 3,391
Special Liability 0 0 0
School Retirement 0 0 0
Extraordinary Growth Facilities 0 0 0
Special Reserve 0 0 0
KPERS Spec. Ret. Contribution 0 0 0
Contingency Reserve 101,870 11,417 11,417
Text Book & Student Material 14,824 14,069 18,229
Activity Fund 3,727 0 15
Bond and Interest #1 0 0 0
Bond and Interest #2 0 0 0
No Fund Warrant 0 0 0
Special Assessment 0 0 0
Temporary Note 0 0 0
SUBTOTAL 818,322 342,881 318,039
Enrollment (FTE)* 127.0 108.1 102.0
Amount per Pupil 6,443 3,172 3,118
Adult Education 0 0 0
Adult Supplemental Education 0 0 0
Tuition Reimbursement 0 0 0
Special Education Coop 0 0 0
TOTAL 818,322 342,881 318,039
NOTE: Gifts/Grants includes private grants and grants from nonfederal sources.
Amount per pupil excludes the following funds: Adult Education, Adult Supplemental Education, Special Education Coop
and Tuition Reimbursement.
* Enrollment (FTE) includes the current year enrollment on September 20, February 20, 4 yr old at-risk, and virtual.
It does not include non-funded preschool or full-day kindergarten not on an IEP.
0
100,000
200,000
300,000
400,000
500,000
600,000
700,000
800,000
900,000
July 1, 2013 July 1, 2014 July 1, 2015
818,322
342,881 318,039
Unencumbered Cash Balances by Fund
10/6/2015 4:12 PM Sumexpen.xlsx Page 20 of 30
USD# 269
Reserve Funds
Unencumbered Cash Balance
July 1, 2013 July 1, 2014 July 1, 2015
Special Reserve 0 0 0
TOTAL OTHER 0 0 0
Amount per Pupil $0 $0 $0
*School districts are authorized by law to self insure rather than purchase insurance for the following categories: Worker's Comp,
Health Insurance, Life Insurance, Property and Casualty (Risk Management) and Disability Income Insurance. Monies are placed
in the Self Insured Fund to pay for claims which may arise from the categories listed above.
0
0
0
0
0
1
1
1
1
1
1
July 1, 2013 July 1, 2014 July 1, 2015
0 0 0
Unencumbered Cash Balances by Fund (Reserve Funds Only)
10/6/2015 4:12 PM Sumexpen.xlsx Page 21 of 30
USD# 269
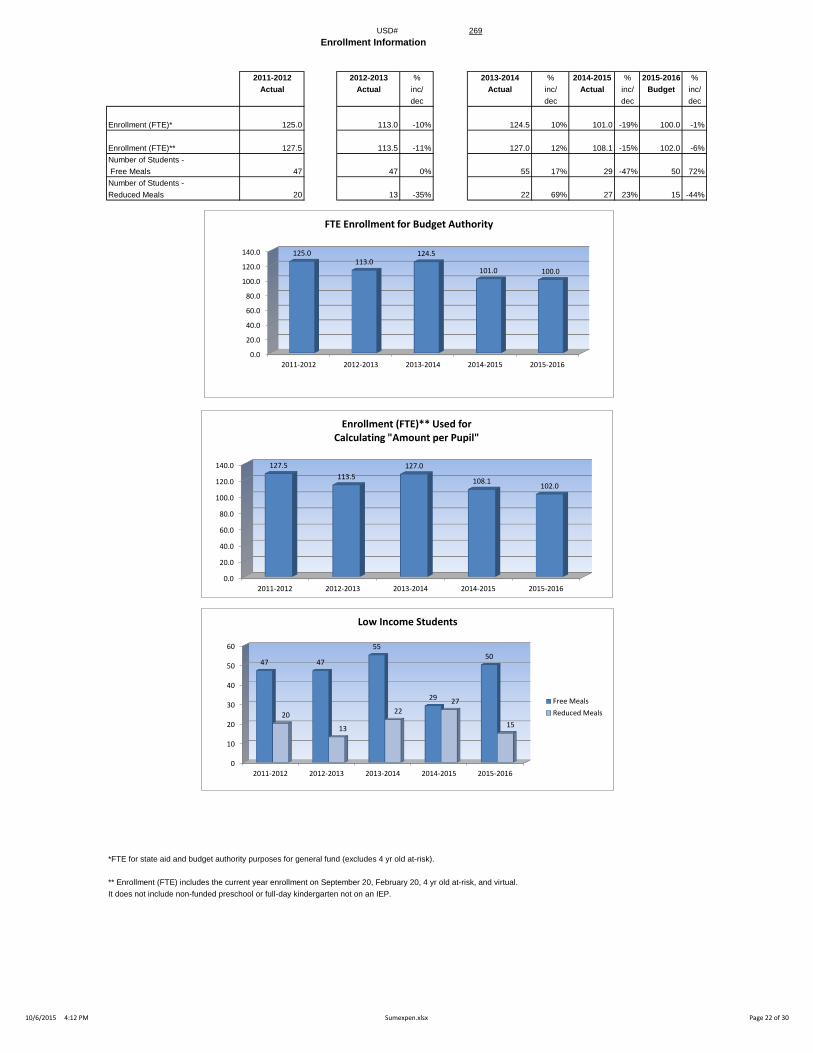
2011-2012 2012-2013 % 2013-2014 % 2014-2015 % 2015-2016 %
Actual Actual inc/ Actual inc/ Actual inc/ Budget inc/
dec dec dec dec
Enrollment (FTE)* 125.0 113.0 -10% 124.5 10% 101.0 -19% 100.0 -1%
Enrollment (FTE)** 127.5 113.5 -11% 127.0 12% 108.1 -15% 102.0 -6%
Number of Students -
Free Meals 47 47 0% 55 17% 29 -47% 50 72%
Number of Students -
Reduced Meals 20 13 -35% 22 69% 27 23% 15 -44%
*FTE for state aid and budget authority purposes for general fund (excludes 4 yr old at-risk).
** Enrollment (FTE) includes the current year enrollment on September 20, February 20, 4 yr old at-risk, and virtual.
It does not include non-funded preschool or full-day kindergarten not on an IEP.
Enrollment Information
0.0
20.0
40.0
60.0
80.0
100.0
120.0
140.0
2011-2012 2012-2013 2013-2014 2014-2015 2015-2016
127.5
113.5
127.0
108.1 102.0
Enrollment (FTE)** Used for Calculating "Amount per Pupil"
0
10
20
30
40
50
60
2011-2012 2012-2013 2013-2014 2014-2015 2015-2016
47 47
55
29
50
20
13
22 27
15
Low Income Students
Free Meals
Reduced Meals
0.0
20.0
40.0
60.0
80.0
100.0
120.0
140.0
2011-2012 2012-2013 2013-2014 2014-2015 2015-2016
125.0 113.0
124.5
101.0 100.0
FTE Enrollment for Budget Authority
10/6/2015 4:12 PM Sumexpen.xlsx Page 22 of 30
USD# 269
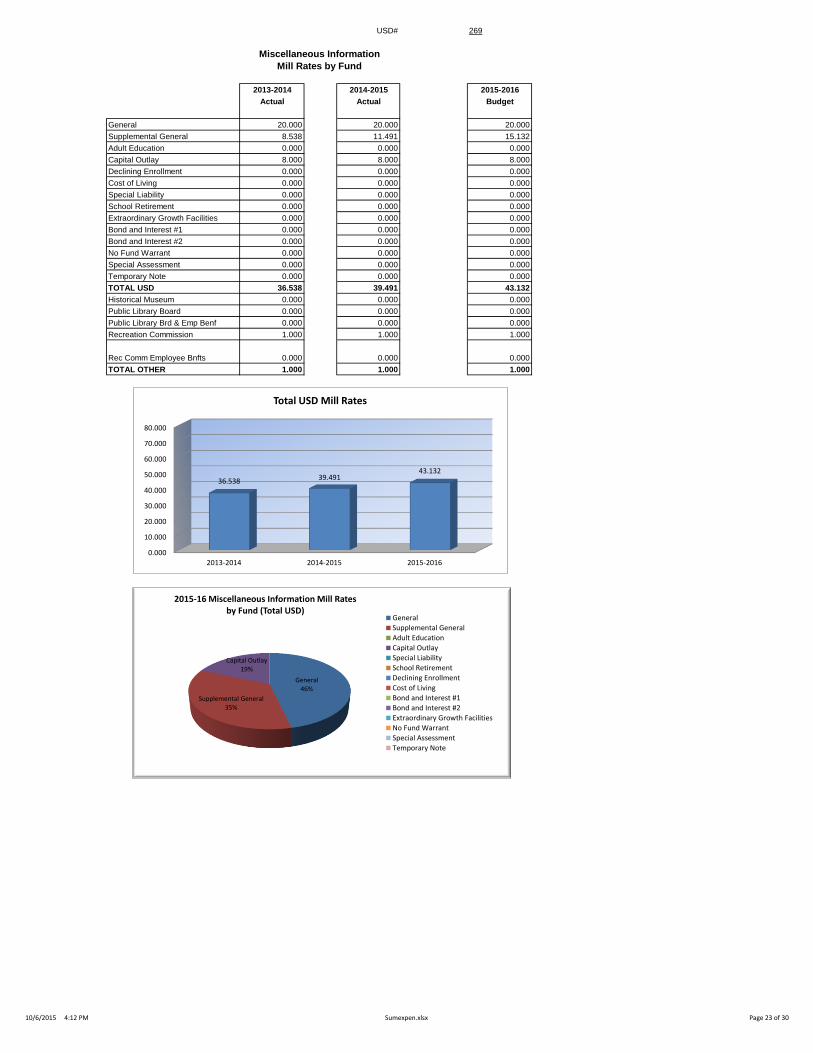
Miscellaneous Information
Mill Rates by Fund
2013-2014 2014-2015 2015-2016
Actual Actual Budget
General 20.000 20.000 20.000
Supplemental General 8.538 11.491 15.132
Adult Education 0.000 0.000 0.000
Capital Outlay 8.000 8.000 8.000
Declining Enrollment 0.000 0.000 0.000
Cost of Living 0.000 0.000 0.000
Special Liability 0.000 0.000 0.000
School Retirement 0.000 0.000 0.000
Extraordinary Growth Facilities 0.000 0.000 0.000
Bond and Interest #1 0.000 0.000 0.000
Bond and Interest #2 0.000 0.000 0.000
No Fund Warrant 0.000 0.000 0.000
Special Assessment 0.000 0.000 0.000
Temporary Note 0.000 0.000 0.000
TOTAL USD 36.538 39.491 43.132
Historical Museum 0.000 0.000 0.000
Public Library Board 0.000 0.000 0.000
Public Library Brd & Emp Benf 0.000 0.000 0.000
Recreation Commission 1.000 1.000 1.000
Rec Comm Employee Bnfts 0.000 0.000 0.000
TOTAL OTHER 1.000 1.000 1.000
0.000
10.000
20.000
30.000
40.000
50.000
60.000
70.000
80.000
2013-2014 2014-2015 2015-2016
36.538 39.491 43.132
Total USD Mill Rates
General 46%
Supplemental General 35%
Capital Outlay 19%
2015-16 Miscellaneous Information Mill Rates by Fund (Total USD)
General
Supplemental General
Adult Education
Capital Outlay
Special Liability
School Retirement
Declining Enrollment
Cost of Living
Bond and Interest #1
Bond and Interest #2
Extraordinary Growth Facilities
No Fund Warrant
Special Assessment
Temporary Note
10/6/2015 4:12 PM Sumexpen.xlsx Page 23 of 30
USD# 269
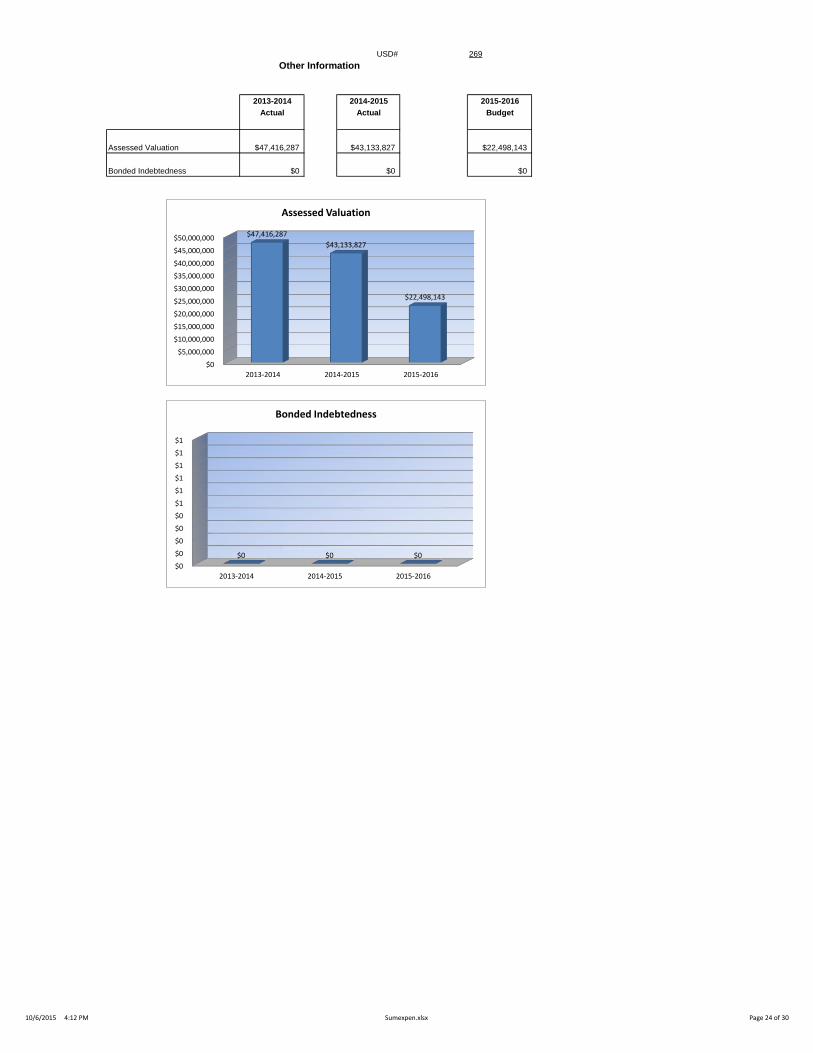
Other Information
2013-2014 2014-2015 2015-2016
Actual Actual Budget
Assessed Valuation $47,416,287 $43,133,827 $22,498,143
Bonded Indebtedness $0 $0 $0
$0
$5,000,000
$10,000,000
$15,000,000
$20,000,000
$25,000,000
$30,000,000
$35,000,000
$40,000,000
$45,000,000
$50,000,000
2013-2014 2014-2015 2015-2016
$47,416,287
$43,133,827
$22,498,143
Assessed Valuation
$0
$0
$0
$0
$0
$1
$1
$1
$1
$1
$1
2013-2014 2014-2015 2015-2016
$0 $0 $0
Bonded Indebtedness
10/6/2015 4:12 PM Sumexpen.xlsx Page 24 of 30
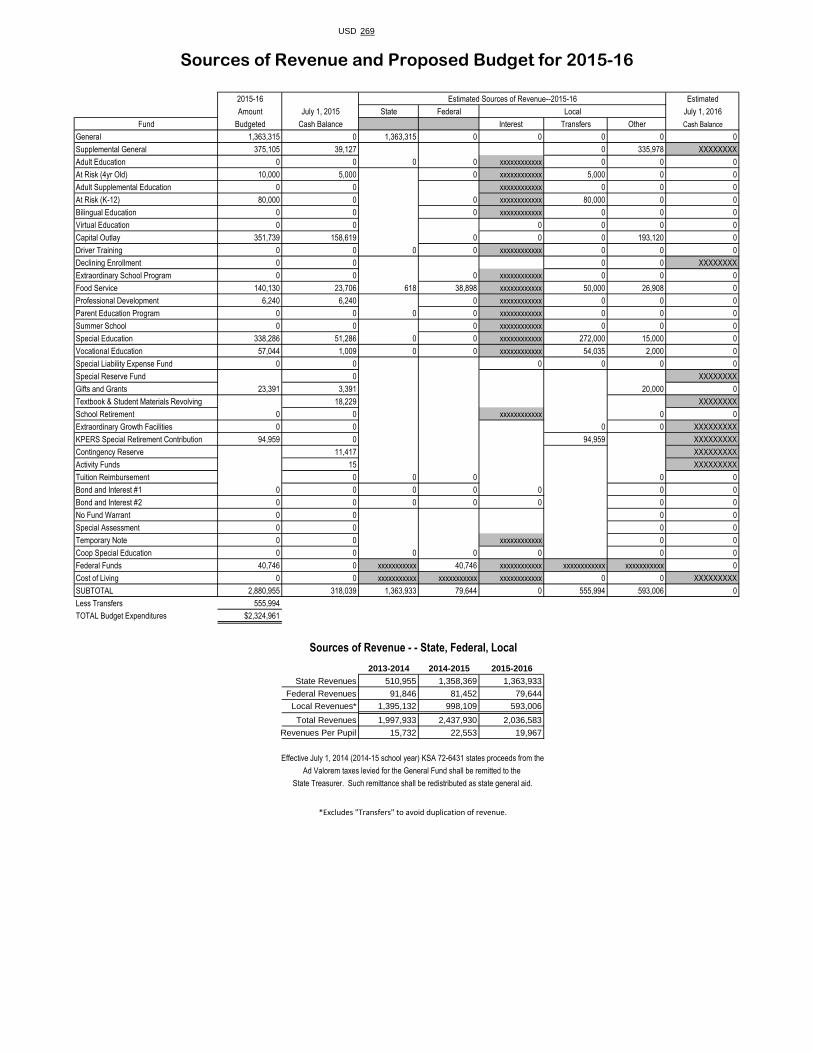
USD 269
2015-16 Estimated Sources of Revenue--2015-16 Estimated
Amount July 1, 2015 State Federal Local July 1, 2016
Fund Budgeted Cash Balance Interest Transfers Other Cash Balance
General 1,363,315 0 1,363,315 0 0 0 0 0
Supplemental General 375,105 39,127 0 335,978 XXXXXXXX
Adult Education 0 0 0 0 xxxxxxxxxxxx 0 0 0
At Risk (4yr Old) 10,000 5,000 0 xxxxxxxxxxxx 5,000 0 0
Adult Supplemental Education 0 0 xxxxxxxxxxxx 0 0 0
At Risk (K-12) 80,000 0 0 xxxxxxxxxxxx 80,000 0 0
Bilingual Education 0 0 0 xxxxxxxxxxxx 0 0 0
Virtual Education 0 0 0 0 0 0
Capital Outlay 351,739 158,619 0 0 0 193,120 0
Driver Training 0 0 0 0 xxxxxxxxxxxx 0 0 0
Declining Enrollment 0 0 0 0 XXXXXXXX
Extraordinary School Program 0 0 0 xxxxxxxxxxxx 0 0 0
Food Service 140,130 23,706 618 38,898 xxxxxxxxxxxx 50,000 26,908 0
Professional Development 6,240 6,240 0 xxxxxxxxxxxx 0 0 0
Parent Education Program 0 0 0 0 xxxxxxxxxxxx 0 0 0
Summer School 0 0 0 xxxxxxxxxxxx 0 0 0
Special Education 338,286 51,286 0 0 xxxxxxxxxxxx 272,000 15,000 0
Vocational Education 57,044 1,009 0 0 xxxxxxxxxxxx 54,035 2,000 0
Special Liability Expense Fund 0 0 0 0 0 0
Special Reserve Fund 0 XXXXXXXX
Gifts and Grants 23,391 3,391 20,000 0
Textbook & Student Materials Revolving 18,229 XXXXXXXX
School Retirement 0 0 xxxxxxxxxxxx 0 0
Extraordinary Growth Facilities 0 0 0 0 XXXXXXXXX
KPERS Special Retirement Contribution 94,959 0 94,959 XXXXXXXXX
Contingency Reserve 11,417 XXXXXXXXX
Activity Funds 15 XXXXXXXXX
Tuition Reimbursement 0 0 0 0 0
Bond and Interest #1 0 0 0 0 0 0 0
Bond and Interest #2 0 0 0 0 0 0 0
No Fund Warrant 0 0 0 0
Special Assessment 0 0 0 0
Temporary Note 0 0 xxxxxxxxxxxx 0 0
Coop Special Education 0 0 0 0 0 0 0
Federal Funds 40,746 0 xxxxxxxxxxx 40,746 xxxxxxxxxxxx xxxxxxxxxxxx xxxxxxxxxxx 0
Cost of Living 0 0 xxxxxxxxxxx xxxxxxxxxxx xxxxxxxxxxxx 0 0 XXXXXXXXX
SUBTOTAL 2,880,955 318,039 1,363,933 79,644 0 555,994 593,006 0
Less Transfers 555,994
TOTAL Budget Expenditures $2,324,961
2013-2014 2014-2015 2015-2016
State Revenues 510,955 1,358,369 1,363,933
Federal Revenues 91,846 81,452 79,644
Local Revenues* 1,395,132 998,109 593,006
Total Revenues 1,997,933 2,437,930 2,036,583
Revenues Per Pupil 15,732 22,553 19,967
*Excludes "Transfers" to avoid duplication of revenue.
Sources of Revenue and Proposed Budget for 2015-16
Sources of Revenue - - State, Federal, Local
Effective July 1, 2014 (2014-15 school year) KSA 72-6431 states proceeds from the
Ad Valorem taxes levied for the General Fund shall be remitted to the
State Treasurer. Such remittance shall be redistributed as state general aid.
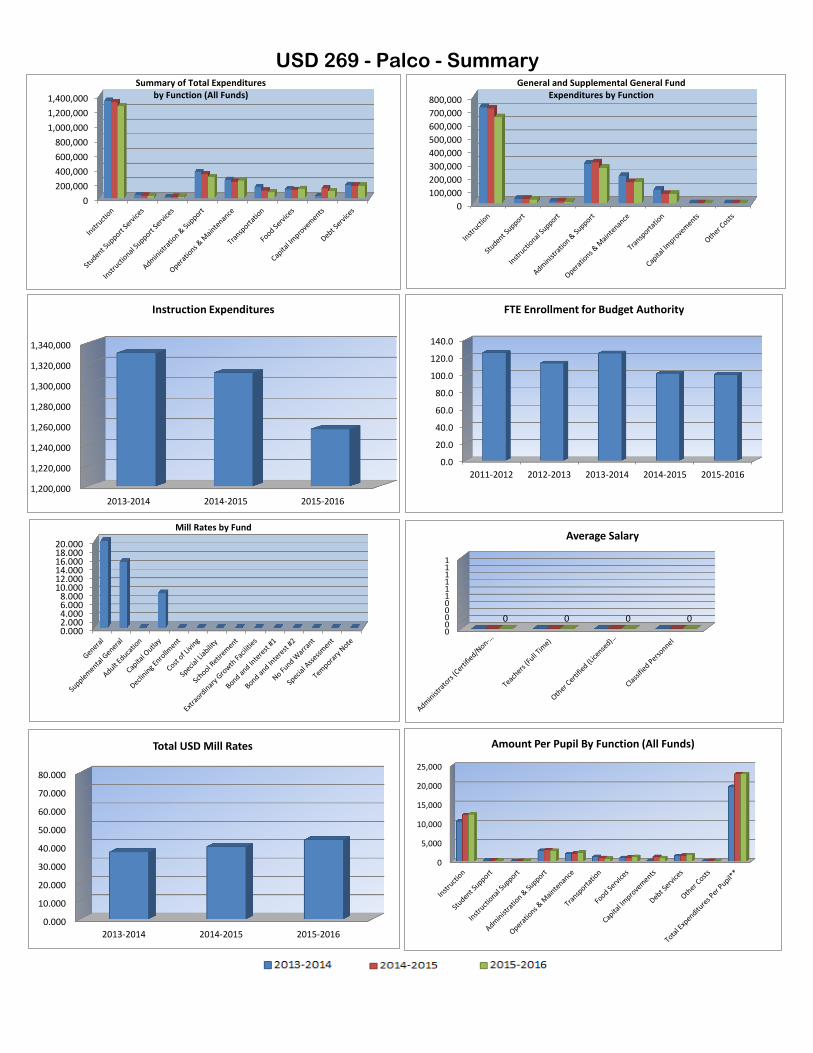
USD 269 - Palco - Summary
0
200,000
400,000
600,000
800,000
1,000,000
1,200,000
1,400,000
Summary of Total Expenditures by Function (All Funds)
0
100,000
200,000
300,000
400,000
500,000
600,000
700,000
800,000
General and Supplemental General Fund Expenditures by Function
1,200,000
1,220,000
1,240,000
1,260,000
1,280,000
1,300,000
1,320,000
1,340,000
2013-2014 2014-2015 2015-2016
Instruction Expenditures
0.0
20.0
40.0
60.0
80.0
100.0
120.0
140.0
2011-2012 2012-2013 2013-2014 2014-2015 2015-2016
FTE Enrollment for Budget Authority
0.0002.0004.0006.0008.000
10.00012.00014.00016.00018.00020.000
Mill Rates by Fund
0.000
10.000
20.000
30.000
40.000
50.000
60.000
70.000
80.000
2013-2014 2014-2015 2015-2016
Total USD Mill Rates
0
5,000
10,000
15,000
20,000
25,000
Amount Per Pupil By Function (All Funds)
00000111111
0 0 0 0
Average Salary

Intentionally left blank

Intentionally left blank

Intentionally left blank

Intentionally left blank