Embed Size (px)
Citation preview

PROFILE INFORMATION
2016-17
Fairfield USD #310
School Finance Kansas State Department of Education Landon State Office Building 900 SW Jackson Street, Suite 356 Topeka, Kansas 66612-1212 www.ksde.org

i
• Budget General Information (characteristics of district)
• Supplemental Information for Tables in Summary of Expenditures
• KSDE Website Information Available
• Summary of Expenditures (Sumexpen.xlsx)

1
2016-17 Budget General Information USD #: 310
Introduction
The mission of USD 310 Fairfield is to provide each student with the resources necessary to reach his or her potential in academics, activities, and athletics. At Fairfield Schools, we believe excellence in education is achieved when dedicated people with compassion, vision, and courage work together toward common goals. The Board of Education, administration, and staff are dedicated to providing a safe and caring environment conducive to excellence in education where students can become productive, responsible citizens, ready and able to meet the challenges of the future.
USD 310 Fairfield is committed to:
• Developing and promoting continuous improvement and student achievement through curriculum and expanding technology.
• Promoting the importance of parental and community participation. • Improving extra-curricular activities by increasing participation and raising
expectations. • Maintaining fiscal accountability. • Demanding high standards by recruiting and retaining a high quality staff. • Continuing to improve district facilities.
The budget is designed to support the philosophy of the district. USD 310 serves approximately 320 students from the communities of Abbyville, Arlington, Langdon, Plevna, Sylvia, and Turon. Beginning with the 2011-2012 school year, all Fairfield students are served at the Fairfield site one mile north of Langdon. Special education services are provided through an agreement with the Reno County Educational Cooperative.

2
Board Members
Derek Zongker, President 30600 W. Illinois 620-486-2457
Sylvia 67581 Steven C. Westfahl, Vice-President P.O. Box 146 620-899-7867
Arlington 67514 Jim Combs 206 S. Park Street 620-538-2497
Arlington 67514 Brent Fowler 28511 W. Illinois Ave 620-286-5240
Plevna 67568 Eric Geesling 31617 W. Parallel Road 620-497-6697
Turon 67583 Craig Knoche P.O. Box 4 620-286-5658
Abbyville, 67510 Travis Mathes P.O. Box 12 620-486-2131
Sylvia 67581
Key Staff Superintendent: Nathan Reed Business Office Staff:
Board Clerk Amy Riggs Board Treasurer Shea Hewitt
Curriculum & Instruction Staff: Nathan Reed, Superintendent RCEC Director Lena Kisner Other Key Contacts: Fairfield Middle/High School Principal Jason Briar
Fairfield Elementary Principal Betsy McKinney Transportation Craig Childs Maintenance Aaron Basye Technology Brian Dater Food Service Janet Hall

3
The District’s Accomplishments and Challenges Accomplishments: The graduation rate for Fairfield is an amazing rate. Knowing that high school graduation is the stepping-stone to a future in higher learning or a career, it is important to our board of education that the rate of students graduating from our school is significant. With an average of 100% over the last several years, there is confidence that it will continue to be seen as a priority for parents and students in the future.
Graduation Rates
2011 Fairfield High School 100% 2012 Fairfield High School 100% 2013 Fairfield High School 100% 2014 Fairfield High School 100% 2015 Fairfield High School 100% 2016 Fairfield High School 100% In 2012, the State of Kansas began reporting graduation rates based on a four-year average. 2013-2016 4-year graduation rate 100%
Pre-Kindergarten Program
Fairfield District offers a full-day pre-kindergarten program for up to 35 children ages three and four for four days a week. The program is the Kansas Preschool Program, and USD 310 for four year olds along with a district sponsored program supported by a grant for the three-year-old classroom that meets the needs of our communities. Services for students with special needs are provided by the Early Education Center.
Technology Fairfield Schools began a one-to-one laptop initiative for high school. All students in grades 3-12 will have Chromebooks. The teachers are expected to integrate technology into their lessons, thus

4
training students to work in a 21st century learning environment and preparing them for college and careers after graduation.. Wireless internet is available throughout the Fairfield facility. An upgrade was provided in the summer of 2015 that ramped up our speed and access. Each classroom has a ceiling mounted projector wired to provide access for computer use. Mobile laptop carts are available for all students and interactive white boards are installed in 10 classrooms. Beginning with the 2014-2015 school year, the district has purchased a new PC laptop for each teacher for use as an instructional tool and for access to the on-line student management system and grade book software. The district continues to add and update its hardware and software for students and staff. Presently the district ratio of computers to students is nearly 1:1.
Special Programs
USD 310 Fairfield started a pilot afterschool program for the 2008-2009 school year. The program has become an integral part of the district and served 97 students in the 2013-2014 school year. The Afterschool academy is funded through a grant from KSDE. Since 2014-2015, USD 310 has participated in Kansas Reading Roadmap, a state funded initiative focused on improving literacy in primary grades. It has a three-pronged approach. Funding is available for training, support, and materials for our Afterschool Program, the Summer School Program, and improvement of community and parent involvement. Along with this our K-3 grades will be trained and participate in the MTSS program that builds in intervention time for all students in the four grades with improving reading literacy, phonics, and comprehension the main goals. In fact, Fairfield Elementary received the School of the Year Award from KRR for meeting and exceeding the goals that were set for the year. In the spring of 2016, over 90% of students K-3 were reading at benchmark or above.
Facility upkeep and repair The Fairfield Board of Education has invested in the facilities of the district by funding needed repairs and maintenance. During the summer of 2015 there were several upgrades to the district facilities including: remodel of the two main bathrooms in the commons area that will provide ADA access; adding new carpet in the HS office, auditorium and a hallway; replace tiled steps in the gymnasium. A possible bond election is being considered for the near future. In April of 2010, the USD 310 Board of Education voted to close Fairfield East Elementary at Arlington and Fairfield West Elementary at Sylvia in order to reduce district expenses in the areas of personnel, maintenance, utility costs, and food service and increase the percentage of the budget allocated to student instruction. As a result, all Fairfield students in pre-kindergarten through grade 12 began attending class at the Fairfield campus in the fall of 2010. In June of 2010, Fairfield Schools was awarded $2,300,000 in Qualified School Construction Bonds (QSCB) to fund energy upgrades at the Fairfield campus. Phase one of the QSCB program funded energy upgrades at Fairfield, which included abandoning the existing boiler system and adding air conditioning in the gym and auditorium. The improvements also included replacement rooftop HVAC units for the oldest units, reconditioning of newer HVAC units, a computerized control system to control room temperatures, new ceilings, new lighting, a 4000 square foot modular unit

5
for pre-kindergarten and kindergarten classes as well as a phone system that increased building security by providing a phone in every classroom. In July of 2012, USD 310 completed the major component of the Phase Two portion of the QSCB program with the completion of a wastewater lagoon. The remaining funds are being used to upgrade interior doors, upgrade the campus security system, replace the 20-year-old cooler/freezer, and replace the oldest portion of roof with an insulated, built-up roofing system. The district continues to improve the facility with repair and upkeep through local effort funds. Challenges: Many challenges face public schools today, particularly small rural schools. The challenges include declining enrollment, shortage of qualified teachers, and upkeep of aging facilities. Fairfield District faces similar challenges and we work to address them in a proactive manner. The 2016-2017 budget reflects a very little increase in enrollment and a small increase to our mill rate. The resulting General Fund budget is comparable to the previous year’s budget. State aid has been predetermined by the block grant funding from the state that matches state aid at the exact level of FY 2014-2015. In the fall of 2010 Fairfield School District reduced the district’s operating expenses by $370,000 by closing the two elementary buildings and moving all students to the Fairfield campus. The Fairfield Board of Education will be conducting a long-range plan through committee work this fiscal year to guide them through difficult decisions and prioritize the resources available.

6
Supplemental Information for the Following Tables 1. Summary of Total Expenditures by Function (All Funds) 2. Summary of General Fund Expenditures by Function 3. Summary of Supplemental General Fund Expenditures by Function 4. Summary of General and Supplemental General Fund Expenditures by Function 5. Summary of Special Education Fund by Function 6. Instruction Expenditures (1000) 7. Student Support Expenditures (2100)
8. Instructional Support Expenditures (2200) 9. General Administration Expenditures (2300) 10. School Administration Expenditures (2400)
11. Central Services Expenditures (2500) 12. Operations and Maintenance Expenditures (2600)
13. Transportation Expenditures (2700) 14. Other Support Services Expenditures (2900)
15. Food Service Expenditures (3100)
16. Community Services Operations (3300) 17. Capital Improvements (4000) 18. Debt Services (5100)
19. Miscellaneous Information – Transfers (5200) 20. Miscellaneous Information Unencumbered Cash Balance by Fund 21. Reserve Funds Unencumbered Cash Balance 22. Other Information – Enrollment Information 23. Miscellaneous Information Mill Rates by Fund 24. Other Information – Assessed Valuation and Bonded Indebtedness

7
Note: The FTE (full time equivalency) used in this report to calculate the “Amount Per Pupil” is defined as follows: Enrollment (FTE) includes the current year enrollment on September 20, February 20, 4 yr old at-risk, and virtual. It does not include non-funded preschool or full-day kindergarten not on an IEP. KSDE Website Information Available K-12 Statistics (Building, District or State Totals) website below: http://svapp15586.ksde.org/k12/k12.aspx
• Attendance / Enrollment Reports • Staff Reports • Graduates / Dropouts Reports • Crime / Violence Reports
School Finance Reports and Publications website below: http://www.ksde.org/Agency/FiscalandAdministrativeServices/SchoolFinance/ReportsandPublications.aspx
• Assessed Valuation • Cash Balances • Headcount Enrollment • Mill Levies • Personnel (Certified/Non-Certified) • Salary Reports
Kansas Building Report Card website below: http://svapp15586.ksde.org/rcard/
• Attendance Rate • Graduation Rate • Dropout Rate • School Violence • Assessments
o Reading o Mathematics o Writing
• Graduates Passing Adv. Science Courses • Graduates Passing Adv. Math Courses
USD# 310
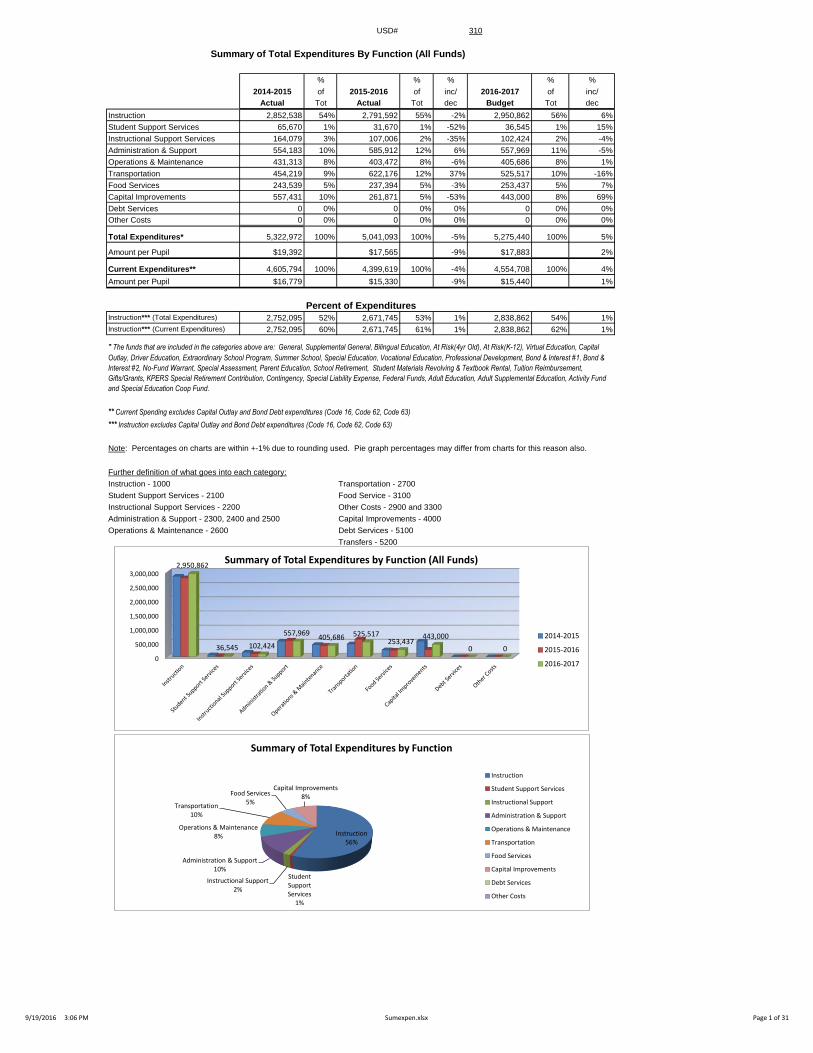
Summary of Total Expenditures By Function (All Funds)
% % % % %2014-2015 of 2015-2016 of inc/ 2016-2017 of inc/
Actual Tot Actual Tot dec Budget Tot decInstruction 2,852,538 54% 2,791,592 55% -2% 2,950,862 56% 6%Student Support Services 65,670 1% 31,670 1% -52% 36,545 1% 15%Instructional Support Services 164,079 3% 107,006 2% -35% 102,424 2% -4%Administration & Support 554,183 10% 585,912 12% 6% 557,969 11% -5%Operations & Maintenance 431,313 8% 403,472 8% -6% 405,686 8% 1%Transportation 454,219 9% 622,176 12% 37% 525,517 10% -16%Food Services 243,539 5% 237,394 5% -3% 253,437 5% 7%Capital Improvements 557,431 10% 261,871 5% -53% 443,000 8% 69%Debt Services 0 0% 0 0% 0% 0 0% 0%Other Costs 0 0% 0 0% 0% 0 0% 0%
Total Expenditures* 5,322,972 100% 5,041,093 100% -5% 5,275,440 100% 5%
Amount per Pupil $19,392 $17,565 -9% $17,883 2%
Current Expenditures** 4,605,794 100% 4,399,619 100% -4% 4,554,708 100% 4%Amount per Pupil $16,779 $15,330 -9% $15,440 1%
Instruction*** (Total Expenditures) 2,752,095 52% 2,671,745 53% 1% 2,838,862 54% 1%Instruction*** (Current Expenditures) 2,752,095 60% 2,671,745 61% 1% 2,838,862 62% 1%
Note: Percentages on charts are within +-1% due to rounding used. Pie graph percentages may differ from charts for this reason also.
Further definition of what goes into each category:Instruction - 1000 Transportation - 2700Student Support Services - 2100 Food Service - 3100Instructional Support Services - 2200 Other Costs - 2900 and 3300Administration & Support - 2300, 2400 and 2500 Capital Improvements - 4000Operations & Maintenance - 2600 Debt Services - 5100
Transfers - 5200
Percent of Expenditures
* The funds that are included in the categories above are: General, Supplemental General, Bilingual Education, At Risk(4yr Old), At Risk(K-12), Virtual Education, Capital
Outlay, Driver Education, Extraordinary School Program, Summer School, Special Education, Vocational Education, Professional Development, Bond & Interest #1, Bond &
Interest #2, No-Fund Warrant, Special Assessment, Parent Education, School Retirement, Student Materials Revolving & Textbook Rental, Tuition Reimbursement,
Gifts/Grants, KPERS Special Retirement Contribution, Contingency, Special Liability Expense, Federal Funds, Adult Education, Adult Supplemental Education, Activity Fund
and Special Education Coop Fund.
*** Instruction excludes Capital Outlay and Bond Debt expenditures (Code 16, Code 62, Code 63)
** Current Spending excludes Capital Outlay and Bond Debt expenditures (Code 16, Code 62, Code 63)
0
500,000
1,000,000
1,500,000
2,000,000
2,500,000
3,000,0002,950,862
36,545 102,424
557,969405,686 525,517
253,437443,000
0 0
Summary of Total Expenditures by Function (All Funds)
2014-2015
2015-2016
2016-2017
Instruction56%
Student Support Services
1%
Instructional Support2%
Administration & Support10%
Operations & Maintenance8%
Transportation10%
Food Services5%
Capital Improvements8%
Summary of Total Expenditures by Function
Instruction
Student Support Services
Instructional Support
Administration & Support
Operations & Maintenance
Transportation
Food Services
Capital Improvements
Debt Services
Other Costs
9/19/2016 3:06 PM Sumexpen.xlsx Page 1 of 31

USD# 310
Summary of General Fund Expendituresby Function
% % % % %2014-2015 of 2015-2016 of inc/ 2016-2017 of inc/
Actual Tot Actual Tot dec Budget Tot dec
Instruction 1,323,377 60% 1,451,955 61% 10% 1,420,051 62% -2%
Student Support 404 0% 3,025 0% 649% 2,700 0% -11%
Instructional Support 1,645 0% 12,774 1% 677% 12,850 1% 1%
Administration & Support 184,325 8% 248,962 10% 35% 217,385 9% -13%
Operations & Maintenance 412,973 19% 371,858 16% -10% 373,150 16% 0%
Transportation 290,464 13% 299,542 13% 3% 277,750 12% -7%
Capital Improvements 0 0% 0 0% 0% 0 0% 0%
Other Costs 0 0% 0 0% 0% 0 0% 0%
Total Expenditures 2,213,188 100% 2,388,116 100% 8% 2,303,886 100% -4%
Amount per Pupil $8,063 $8,321 3% $7,810 -6%
The Summary of General Fund Expenditures chart information comes from pages 6-13 and only uses the 'General Fund' line items.
0
200,000
400,000
600,000
800,000
1,000,000
1,200,000
1,400,000
1,600,000
Instruction StudentSupport
InstructionalSupport
Administration& Support
Operations &Maintenance
Transportation CapitalImprovements
Other Costs
1,420,051
2,700 12,850
217,385
373,150
277,750
0 0
Summary of General Fund Expenditures
2014-2015
2015-2016
2016-2017
Instruction62%
Instructional Support1%
Administration & Support9%
Operations & Maintenance16%
Transportation12%
Summary of General Fund Expenditures by Function
Instruction
Student Support
Instructional Support
Administration & Support
Operations & Maintenance
Transportation
Capital Improvements
Other Costs
9/19/2016 3:06 PM Sumexpen.xlsx Page 2 of 31
USD# 310
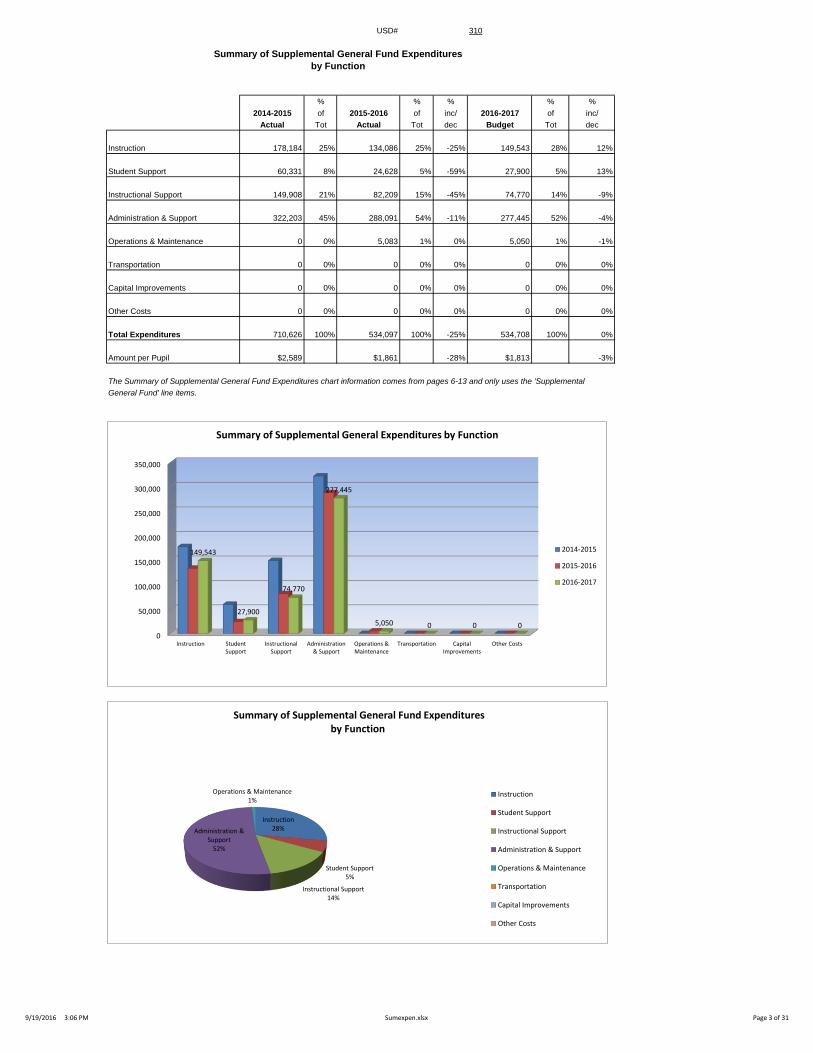
Summary of Supplemental General Fund Expendituresby Function
% % % % %2014-2015 of 2015-2016 of inc/ 2016-2017 of inc/
Actual Tot Actual Tot dec Budget Tot dec
Instruction 178,184 25% 134,086 25% -25% 149,543 28% 12%
Student Support 60,331 8% 24,628 5% -59% 27,900 5% 13%
Instructional Support 149,908 21% 82,209 15% -45% 74,770 14% -9%
Administration & Support 322,203 45% 288,091 54% -11% 277,445 52% -4%
Operations & Maintenance 0 0% 5,083 1% 0% 5,050 1% -1%
Transportation 0 0% 0 0% 0% 0 0% 0%
Capital Improvements 0 0% 0 0% 0% 0 0% 0%
Other Costs 0 0% 0 0% 0% 0 0% 0%
Total Expenditures 710,626 100% 534,097 100% -25% 534,708 100% 0%
Amount per Pupil $2,589 $1,861 -28% $1,813 -3%
The Summary of Supplemental General Fund Expenditures chart information comes from pages 6-13 and only uses the 'Supplemental
General Fund' line items.
0
50,000
100,000
150,000
200,000
250,000
300,000
350,000
Instruction StudentSupport
InstructionalSupport
Administration& Support
Operations &Maintenance
Transportation CapitalImprovements
Other Costs
149,543
27,900
74,770
277,445
5,050 0 0 0
Summary of Supplemental General Expenditures by Function
2014-2015
2015-2016
2016-2017
Instruction28%
Student Support5%
Instructional Support14%
Administration & Support
52%
Operations & Maintenance1%
Summary of Supplemental General Fund Expenditures by Function
Instruction
Student Support
Instructional Support
Administration & Support
Operations & Maintenance
Transportation
Capital Improvements
Other Costs
9/19/2016 3:06 PM Sumexpen.xlsx Page 3 of 31

USD# 310Summary of General and Supplemental General Fund
Expenditures by Function
% % % % %2014-2015 of 2015-2016 of inc/ 2016-2017 of inc/
Actual Tot Actual Tot dec Budget Tot dec
Instruction 1,501,561 51% 1,586,041 54% 6% 1,569,594 55% -1%
Student Support 60,735 2% 27,653 1% -54% 30,600 1% 11%
Instructional Support 151,553 5% 94,983 3% -37% 87,620 3% -8%
Administration & Support 506,528 17% 537,053 18% 6% 494,830 17% -8%
Operations & Maintenance 412,973 14% 376,941 13% -9% 378,200 13% 0%
Transportation 290,464 10% 299,542 10% 3% 277,750 10% -7%
Capital Improvements 0 0% 0 0% 0% 0 0% 0%
Other Costs 0 0% 0 0% 0% 0 0% 0%
Total Expenditures 2,923,814 100% 2,922,213 100% 0% 2,838,594 100% -3%
Amount per Pupil $10,651 $10,182 -4% $9,622 -5%
The Summary of General and Supplemental General Fund Expenditures chart information comes from pages 6-13 of the Sumexpen
and adds together the 'General Fund' and 'Supplemental General Fund' line items.
0
200,000
400,000
600,000
800,000
1,000,000
1,200,000
1,400,000
1,600,000
Instruction StudentSupport
InstructionalSupport
Administration& Support
Operations &Maintenance
Transportation CapitalImprovements
Other Costs
1,5
01
,56
1
60
,73
5
15
1,5
53
50
6,5
28
41
2,9
73
29
0,4
64
0 0
1,5
86
,04
1
27
,65
3
94
,98
3
53
7,0
53
37
6,9
41
29
9,5
42
0 0
1,5
69
,59
4
30
,60
0
87
,62
0
49
4,8
30
37
8,2
00
27
7,7
50
0 0
Summary of General and Supplemental General FundExpenditures by Function
2014-2015
2015-2016
2016-2017
Instruction55%
Student Support
1%
Instructional Support3%
Administration & Support
18%
Operations & Maintenance13%
Transportation10%
Summary of General and Supplemental General Fund Expenditures by Function
Instruction
Student Support
Instructional Support
Administration & Support
Operations & Maintenance
Transportation
Capital Improvements
Other Costs
9/19/2016 3:06 PM Sumexpen.xlsx Page 4 of 31

USD# 310
Summary of Special Education Fundby Function
% % % % %2014-2015 of 2015-2016 of inc/ 2016-2017 of inc/
Actual Tot Actual Tot dec Budget Tot dec
Instruction 381,373 83% 385,988 90% 1% 445,000 89% 15%
Student Support 0 0% 0 0% 0% 0 0% 0%
Instructional Support 0 0% 0 0% 0% 0 0% 0%
Administraton & Support 0 0% 0 0% 0% 0 0% 0%
Operations & Maintenance 205 0% 0 0% -100% 0 0% 0%
Transportation 77,572 17% 44,712 10% -42% 56,828 11% 27%
Capital Improvements 0 0% 0 0% 0% 0 0% 0%
Other Costs 0 0% 0 0% 0% 0 0% 0%
Total Expenditures 459,150 100% 430,700 100% -6% 501,828 100% 17%
Amount per Pupil $1,673 $1,501 -10% $1,701 13%
The Summary of Special Education Fund Expenditures chart information comes from pages 6-13 and only uses the 'Special Education Fund'
line items. (Total expenditures excludes Special Ed Coop Fund because it would include expenditures for all schools participating in the Coop.)
0
50,000
100,000
150,000
200,000
250,000
300,000
350,000
400,000
450,000
Instruction StudentSupport
InstructionalSupport
Administraton& Support
Operations &Maintenance
Transportation CapitalImprovements
Other Costs
38
1,3
73
0 0 0 20
5
77
,57
2
0 0
38
5,9
88
0 0 0 0
44
,71
2
0 0
44
5,0
00
0 0 0 0
56
,82
8
0 0
Summary of Special Education Fund Expenditures by Function
2014-2015
2015-2016
2016-2017
Instruction89%
Transportation11%
Summary of Special Education Fund by Function
Instruction
Student Support
Instructional Support
Administraton & Support
Operations & Maintenance
Transportation
Capital Improvements
Other Costs
9/19/2016 3:06 PM Sumexpen.xlsx Page 5 of 31
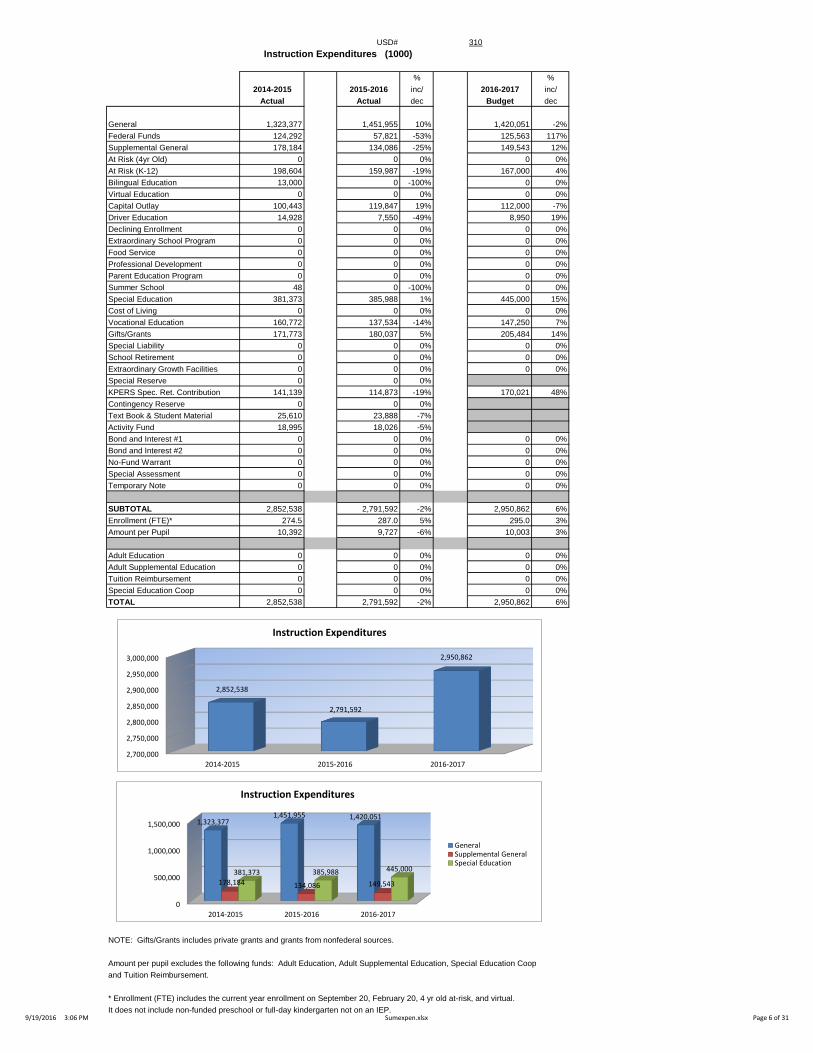
USD# 310Instruction Expenditures (1000)
% %2014-2015 2015-2016 inc/ 2016-2017 inc/
Actual Actual dec Budget dec
General 1,323,377 1,451,955 10% 1,420,051 -2%Federal Funds 124,292 57,821 -53% 125,563 117%Supplemental General 178,184 134,086 -25% 149,543 12%At Risk (4yr Old) 0 0 0% 0 0%At Risk (K-12) 198,604 159,987 -19% 167,000 4%Bilingual Education 13,000 0 -100% 0 0%Virtual Education 0 0 0% 0 0%Capital Outlay 100,443 119,847 19% 112,000 -7%Driver Education 14,928 7,550 -49% 8,950 19%Declining Enrollment 0 0 0% 0 0%Extraordinary School Program 0 0 0% 0 0%Food Service 0 0 0% 0 0%Professional Development 0 0 0% 0 0%Parent Education Program 0 0 0% 0 0%Summer School 48 0 -100% 0 0%Special Education 381,373 385,988 1% 445,000 15%Cost of Living 0 0 0% 0 0%Vocational Education 160,772 137,534 -14% 147,250 7%Gifts/Grants 171,773 180,037 5% 205,484 14%Special Liability 0 0 0% 0 0%School Retirement 0 0 0% 0 0%Extraordinary Growth Facilities 0 0 0% 0 0%Special Reserve 0 0 0%KPERS Spec. Ret. Contribution 141,139 114,873 -19% 170,021 48%Contingency Reserve 0 0 0%Text Book & Student Material 25,610 23,888 -7%Activity Fund 18,995 18,026 -5%Bond and Interest #1 0 0 0% 0 0%Bond and Interest #2 0 0 0% 0 0%No-Fund Warrant 0 0 0% 0 0%Special Assessment 0 0 0% 0 0%Temporary Note 0 0 0% 0 0%
SUBTOTAL 2,852,538 2,791,592 -2% 2,950,862 6%Enrollment (FTE)* 274.5 287.0 5% 295.0 3%Amount per Pupil 10,392 9,727 -6% 10,003 3%
Adult Education 0 0 0% 0 0%Adult Supplemental Education 0 0 0% 0 0%Tuition Reimbursement 0 0 0% 0 0%Special Education Coop 0 0 0% 0 0%TOTAL 2,852,538 2,791,592 -2% 2,950,862 6%
NOTE: Gifts/Grants includes private grants and grants from nonfederal sources.
Amount per pupil excludes the following funds: Adult Education, Adult Supplemental Education, Special Education Coopand Tuition Reimbursement.
* Enrollment (FTE) includes the current year enrollment on September 20, February 20, 4 yr old at-risk, and virtual. It does not include non-funded preschool or full-day kindergarten not on an IEP.
0
500,000
1,000,000
1,500,000
2014-2015 2015-2016 2016-2017
1,323,3771,451,955 1,420,051
178,184 134,086 149,543
381,373 385,988 445,000
Instruction Expenditures
GeneralSupplemental GeneralSpecial Education
2,700,000
2,750,000
2,800,000
2,850,000
2,900,000
2,950,000
3,000,000
2014-2015 2015-2016 2016-2017
2,852,538
2,791,592
2,950,862
Instruction Expenditures
9/19/2016 3:06 PM Sumexpen.xlsx Page 6 of 31

USD# 310
Student Support Expenditures (2100)
% %2014-2015 2015-2016 inc/ 2016-2017 inc/
Actual Actual dec Budget dec
General 404 3,025 649% 2,700 -11%Federal Funds 0 0 0% 0 0%Supplemental General 60,331 24,628 -59% 27,900 13%At Risk (4yr Old) 0 0 0% 0 0%At Risk (K-12) 0 0 0% 0 0%Bilingual Education 0 0 0% 0 0%Virtual Education 0 0 0% 0 0%Capital Outlay 0 0 0% 0 0%Driver Training 0 0 0% 0 0%Declining Enrollment 0 0 0% 0 0%Extraordinary School Program 0 0 0% 0 0%Food Service 0 0 0% 0 0%Professional Development 0 0 0% 0 0%Parent Education Program 0 0 0% 0 0%Summer School 0 0 0% 0 0%Special Education 0 0 0% 0 0%Cost of Living 0 0 0% 0 0%Vocational Education 0 0 0% 0 0%Gifts/Grants 0 0 0% 0 0%Special Liability 0 0 0% 0 0%School Retirement 0 0 0% 0 0%Extraordinary Growth Facilities 0 0 0% 0 0%Special Reserve 0 0 0%KPERS Spec. Ret. Contribution 4,935 4,017 -19% 5,945 48%Contingency Reserve 0 0 0%Text Book & Student Material 0 0 0%Activity Fund 0 0 0%Bond and Interest #1 0 0 0% 0 0%Bond and Interest #2 0 0 0% 0 0%No-Fund Warrant 0 0 0% 0 0%Special Assessment 0 0 0% 0 0%Temporary Note 0 0 0% 0 0%
SUBTOTAL 65,670 31,670 -52% 36,545 15%Enrollment (FTE)* 274.5 287.0 5% 295.0 3%Amount per Pupil 239 110 -54% 124 12%
Adult Education 0 0 0% 0 0%Adult Supplemental Education 0 0 0% 0 0%Tuition Reimbursement 0 0 0% 0 0%Special Education Coop 0 0 0% 0 0%TOTAL 65,670 31,670 -52% 36,545 15%
NOTE: Gifts/Grants includes private grants and grants from nonfederal sources.
Amount per pupil excludes the following funds: Adult Education, Adult Supplemental Education, Special Education Coopand Tuition Reimbursement.
* Enrollment (FTE) includes the current year enrollment on September 20, February 20, 4 yr old at-risk, and virtual. It does not include non-funded preschool or full-day kindergarten not on an IEP.
0
10,000
20,000
30,000
40,000
50,000
60,000
70,000
2014-2015 2015-2016 2016-2017
65,670
31,67036,545
Student Support Expenditures
9/19/2016 3:06 PM Sumexpen.xlsx Page 7 of 31

USD# 310
Instructional Support Expenditures (2200)
% %2014-2015 2015-2016 inc/ 2016-2017 inc/
Actual Actual dec Budget dec
General 1,645 12,774 677% 12,850 1%Federal Funds 0 0 0% 0 0%Supplemental General 149,908 82,209 -45% 74,770 -9%At Risk (4yr Old) 0 0 0% 0 0%At Risk (K-12) 0 0 0% 0 0%Bilingual Education 0 0 0% 0 0%Virtual Education 0 0 0% 0 0%Capital Outlay 0 0 0% 0 0%Driver Training 0 0 0% 0 0%Declining Enrollment 0 0 0% 0 0%Extraordinary School Program 0 0 0% 0 0%Food Service 0 0 0% 0 0%Professional Development 7,583 8,000 5% 8,850 11%Parent Education Program 0 0 0% 0 0%Summer School 0 0 0% 0 0%Special Education 0 0 0% 0 0%Cost of Living 0 0 0% 0 0%Vocational Education 0 0 0% 0 0%Gifts/Grants 0 0 0% 0 0%Special Liability 0 0 0% 0 0%School Retirement 0 0 0% 0 0%Extraordinary Growth Facilities 0 0 0% 0 0%Special Reserve 0 0 0%KPERS Spec. Ret. Contribution 4,943 4,023 -19% 5,954 48%Contingency Reserve 0 0 0%Text Book & Student Material 0 0 0%Activity Fund 0 0 0%Bond and Interest #1 0 0 0% 0 0%Bond and Interest #2 0 0 0% 0 0%No-Fund Warrant 0 0 0% 0 0%Special Assessment 0 0 0% 0 0%Temporary Note 0 0 0% 0 0%
SUBTOTAL 164,079 107,006 -35% 102,424 -4%Enrollment (FTE)* 274.5 287.0 5% 295.0 3%Amount per Pupil 598 373 -38% 347 -7%
Adult Education 0 0 0% 0 0%Adult Supplemental Education 0 0 0% 0 0%Tuition Reimbursement 0 0 0% 0 0%Special Education Coop 0 0 0% 0 0%TOTAL 164,079 107,006 -35% 102,424 -4%
NOTE: Gifts/Grants includes private grants and grants from nonfederal sources.
Amount per pupil excludes the following funds: Adult Education, Adult Supplemental Education, Special Education Coopand Tuition Reimbursement.
* Enrollment (FTE) includes the current year enrollment on September 20, February 20, 4 yr old at-risk, and virtual. It does not include non-funded preschool or full-day kindergarten not on an IEP.
0
20,000
40,000
60,000
80,000
100,000
120,000
140,000
160,000
180,000
2014-2015 2015-2016 2016-2017
164,079
107,006 102,424
Instructional Support Expenditures
9/19/2016 3:06 PM Sumexpen.xlsx Page 8 of 31
USD# 310
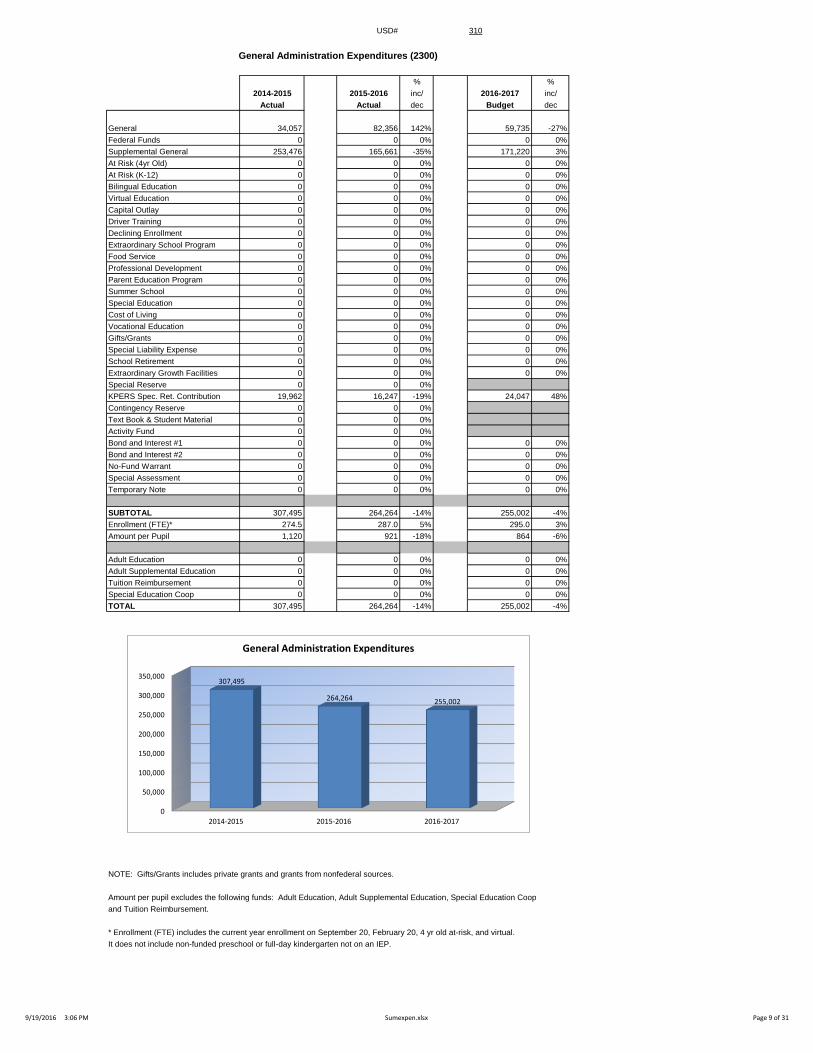
General Administration Expenditures (2300)
% %2014-2015 2015-2016 inc/ 2016-2017 inc/
Actual Actual dec Budget dec
General 34,057 82,356 142% 59,735 -27%Federal Funds 0 0 0% 0 0%Supplemental General 253,476 165,661 -35% 171,220 3%At Risk (4yr Old) 0 0 0% 0 0%At Risk (K-12) 0 0 0% 0 0%Bilingual Education 0 0 0% 0 0%Virtual Education 0 0 0% 0 0%Capital Outlay 0 0 0% 0 0%Driver Training 0 0 0% 0 0%Declining Enrollment 0 0 0% 0 0%Extraordinary School Program 0 0 0% 0 0%Food Service 0 0 0% 0 0%Professional Development 0 0 0% 0 0%Parent Education Program 0 0 0% 0 0%Summer School 0 0 0% 0 0%Special Education 0 0 0% 0 0%Cost of Living 0 0 0% 0 0%Vocational Education 0 0 0% 0 0%Gifts/Grants 0 0 0% 0 0%Special Liability Expense 0 0 0% 0 0%School Retirement 0 0 0% 0 0%Extraordinary Growth Facilities 0 0 0% 0 0%Special Reserve 0 0 0%KPERS Spec. Ret. Contribution 19,962 16,247 -19% 24,047 48%Contingency Reserve 0 0 0%Text Book & Student Material 0 0 0%Activity Fund 0 0 0%Bond and Interest #1 0 0 0% 0 0%Bond and Interest #2 0 0 0% 0 0%No-Fund Warrant 0 0 0% 0 0%Special Assessment 0 0 0% 0 0%Temporary Note 0 0 0% 0 0%
SUBTOTAL 307,495 264,264 -14% 255,002 -4%Enrollment (FTE)* 274.5 287.0 5% 295.0 3%Amount per Pupil 1,120 921 -18% 864 -6%
Adult Education 0 0 0% 0 0%Adult Supplemental Education 0 0 0% 0 0%Tuition Reimbursement 0 0 0% 0 0%Special Education Coop 0 0 0% 0 0%TOTAL 307,495 264,264 -14% 255,002 -4%
NOTE: Gifts/Grants includes private grants and grants from nonfederal sources.
Amount per pupil excludes the following funds: Adult Education, Adult Supplemental Education, Special Education Coopand Tuition Reimbursement.
* Enrollment (FTE) includes the current year enrollment on September 20, February 20, 4 yr old at-risk, and virtual. It does not include non-funded preschool or full-day kindergarten not on an IEP.
0
50,000
100,000
150,000
200,000
250,000
300,000
350,000
2014-2015 2015-2016 2016-2017
307,495
264,264 255,002
General Administration Expenditures
9/19/2016 3:06 PM Sumexpen.xlsx Page 9 of 31

USD# 310
School Administration Expenditures (2400)
% %2014-2015 2015-2016 inc/ 2016-2017 inc/
Actual Actual dec Budget dec
General 150,268 159,478 6% 153,650 -4%Federal Funds 0 0 0% 0 0%Supplemental General 68,727 70,866 3% 72,590 2%At Risk (4yr Old) 0 0 0% 0 0%At Risk (K-12) 0 0 0% 0 0%Bilingual Education 0 0 0% 0 0%Virtual Education 0 0 0% 0 0%Capital Outlay 0 10,073 0% 5,732 -43%Driver Training 0 0 0% 0 0%Declining Enrollment 0 0 0% 0 0%Extraordinary School Program 0 0 0% 0 0%Food Service 0 0 0% 0 0%Professional Development 0 0 0% 0 0%Parent Education Program 0 0 0% 0 0%Summer School 0 0 0% 0 0%Special Education 0 0 0% 0 0%Cost of Living 0 0 0% 0 0%Vocational Education 0 0 0% 0 0%Gifts/Grants 0 0 0% 0 0%Special Liability Expense 0 0 0% 0 0%School Retirement 0 0 0% 0 0%Extraordinary Growth Facilities 0 0 0% 0 0%Special Reserve 0 0 0%KPERS Spec. Ret. Contribution 27,693 22,539 -19% 33,360 48%Contingency Reserve 0 0 0%Text Book & Student Material 0 0 0%Activity Fund 0 0 0%Bond and Interest #1 0 0 0% 0 0%Bond and Interest #2 0 0 0% 0 0%No-Fund Warrant 0 0 0% 0 0%Special Assessment 0 0 0% 0 0%Temporary Note 0 0 0% 0 0%
SUBTOTAL 246,688 262,956 7% 265,332 1%Enrollment (FTE)* 274.5 287.0 5% 295.0 3%Amount per Pupil 899 916 2% 899 -2%
Adult Education 0 0 0% 0 0%Adult Supplemental Education 0 0 0% 0 0%Tuition Reimbursement 0 0 0% 0 0%Special Education Coop 0 0 0% 0 0%TOTAL 246,688 262,956 7% 265,332 1%
NOTE: Gifts/Grants includes private grants and grants from nonfederal sources.
Amount per pupil excludes the following funds: Adult Education, Adult Supplemental Education, Special Education Coopand Tuition Reimbursement.
* Enrollment (FTE) includes the current year enrollment on September 20, February 20, 4 yr old at-risk, and virtual. It does not include non-funded preschool or full-day kindergarten not on an IEP.
235,000
240,000
245,000
250,000
255,000
260,000
265,000
270,000
2014-2015 2015-2016 2016-2017
246,688
262,956
265,332
School Administration Expenditures
9/19/2016 3:06 PM Sumexpen.xlsx Page 10 of 31
USD# 310
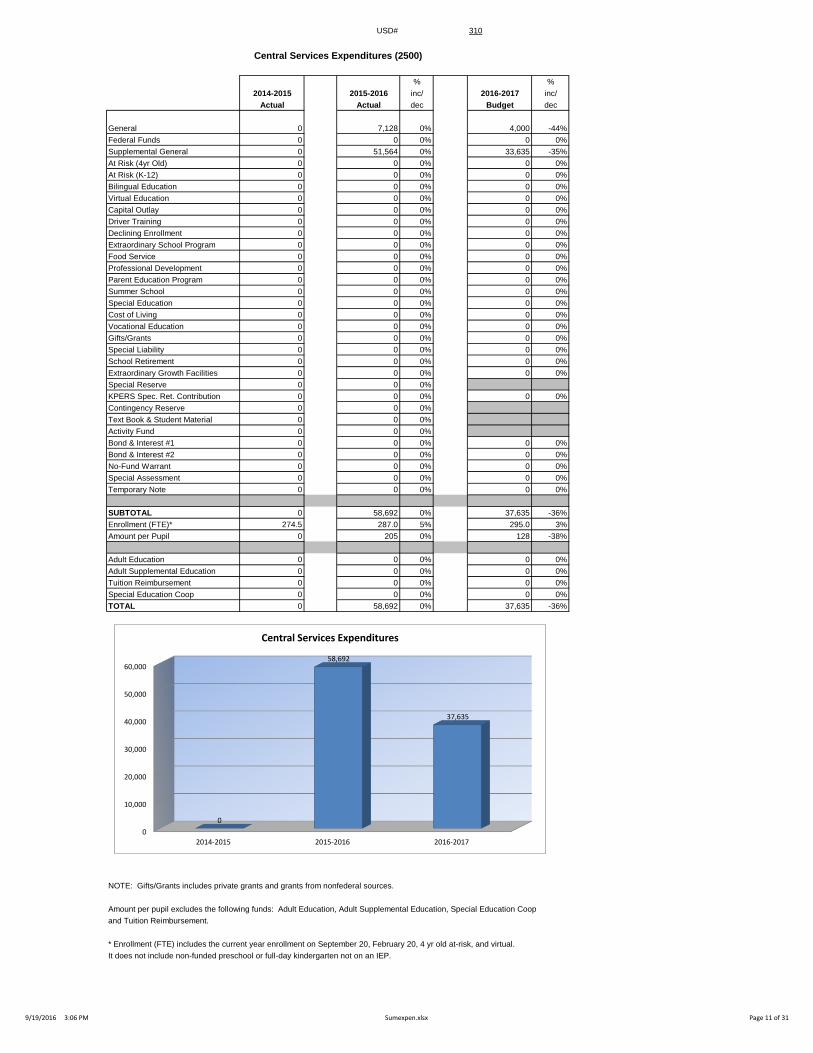
Central Services Expenditures (2500)
% %2014-2015 2015-2016 inc/ 2016-2017 inc/
Actual Actual dec Budget dec
General 0 7,128 0% 4,000 -44%Federal Funds 0 0 0% 0 0%Supplemental General 0 51,564 0% 33,635 -35%At Risk (4yr Old) 0 0 0% 0 0%At Risk (K-12) 0 0 0% 0 0%Bilingual Education 0 0 0% 0 0%Virtual Education 0 0 0% 0 0%Capital Outlay 0 0 0% 0 0%Driver Training 0 0 0% 0 0%Declining Enrollment 0 0 0% 0 0%Extraordinary School Program 0 0 0% 0 0%Food Service 0 0 0% 0 0%Professional Development 0 0 0% 0 0%Parent Education Program 0 0 0% 0 0%Summer School 0 0 0% 0 0%Special Education 0 0 0% 0 0%Cost of Living 0 0 0% 0 0%Vocational Education 0 0 0% 0 0%Gifts/Grants 0 0 0% 0 0%Special Liability 0 0 0% 0 0%School Retirement 0 0 0% 0 0%Extraordinary Growth Facilities 0 0 0% 0 0%Special Reserve 0 0 0%KPERS Spec. Ret. Contribution 0 0 0% 0 0%Contingency Reserve 0 0 0%Text Book & Student Material 0 0 0%Activity Fund 0 0 0%Bond & Interest #1 0 0 0% 0 0%Bond & Interest #2 0 0 0% 0 0%No-Fund Warrant 0 0 0% 0 0%Special Assessment 0 0 0% 0 0%Temporary Note 0 0 0% 0 0%
SUBTOTAL 0 58,692 0% 37,635 -36%Enrollment (FTE)* 274.5 287.0 5% 295.0 3%Amount per Pupil 0 205 0% 128 -38%
Adult Education 0 0 0% 0 0%Adult Supplemental Education 0 0 0% 0 0%Tuition Reimbursement 0 0 0% 0 0%Special Education Coop 0 0 0% 0 0%TOTAL 0 58,692 0% 37,635 -36%
NOTE: Gifts/Grants includes private grants and grants from nonfederal sources.
Amount per pupil excludes the following funds: Adult Education, Adult Supplemental Education, Special Education Coopand Tuition Reimbursement.
* Enrollment (FTE) includes the current year enrollment on September 20, February 20, 4 yr old at-risk, and virtual. It does not include non-funded preschool or full-day kindergarten not on an IEP.
0
10,000
20,000
30,000
40,000
50,000
60,000
2014-2015 2015-2016 2016-2017
0
58,692
37,635
Central Services Expenditures
9/19/2016 3:06 PM Sumexpen.xlsx Page 11 of 31

USD# 310
Operations and Maintenance Expenditures (2600)
% %2014-2015 2015-2016 inc/ 2016-2017 inc/
Actual Actual dec Budget dec
General 412,973 371,858 -10% 373,150 0%Federal Funds 0 0 0% 0 0%Supplemental General 0 5,083 0% 5,050 -1%At Risk (4yr Old) 0 0 0% 0 0%At Risk (K-12) 0 0 0% 0 0%Bilingual Education 0 0 0% 0 0%Virtual Education 0 0 0% 0 0%Capital Outlay 3,698 14,675 297% 10,000 -32%Driver Training 17 0 -100% 0 0%Declining Enrollment 0 0 0% 0 0%Extraordinary School Program 0 0 0% 0 0%Food Service 0 120 0% 115 -4%Professional Development 0 0 0% 0 0%Parent Education Program 0 0 0% 0 0%Summer School 0 0 0% 0 0%Special Education 205 0 -100% 0 0%Cost of Living 0 0 0% 0 0%Vocational Education 0 0 0% 0 0%Gifts/Grants 0 0 0% 0 0%Special Liability 0 0 0% 0 0%School Retirement 0 0 0% 0 0%Extraordinary Growth Facilities 0 0 0% 0 0%Special Reserve 0 0 0%KPERS Spec. Ret. Contribution 14,420 11,736 -19% 17,371 48%Contingency Reserve 0 0 0%Text Book & Student Material 0 0 0%Activity Fund 0 0 0%Bond and Interest #1 0 0 0% 0 0%Bond and Interest #2 0 0 0% 0 0%No-Fund Warrant 0 0 0% 0 0%Special Assessment 0 0 0% 0 0%Temporary Note 0 0 0% 0 0%
SUBTOTAL 431,313 403,472 -6% 405,686 1%Enrollment (FTE)* 274.5 287.0 5% 295.0 3%Amount per Pupil 1,571 1,406 -11% 1,375 -2%
Adult Education 0 0 0% 0 0%Adult Supplemental Education 0 0 0% 0 0%Tuition Reimbursement 0 0 0% 0 0%Special Education Coop 0 0 0% 0 0%TOTAL 431,313 403,472 -6% 405,686 1%
NOTE: Gifts/Grants includes private grants and grants from nonfederal sources.
Amount per pupil excludes the following funds: Adult Education, Adult Supplemental Education, Special Education Coopand Tuition Reimbursement.
* Enrollment (FTE) includes the current year enrollment on September 20, February 20, 4 yr old at-risk, and virtual. It does not include non-funded preschool or full-day kindergarten not on an IEP.
385,000
390,000
395,000
400,000
405,000
410,000
415,000
420,000
425,000
430,000
435,000
2014-2015 2015-2016 2016-2017
431,313
403,472405,686
Operations and Maintenance Expenditures
9/19/2016 3:06 PM Sumexpen.xlsx Page 12 of 31

USD# 310
Transportation Expenditures (2700)
% %2014-2015 2015-2016 inc/ 2016-2017 inc/
Actual Actual dec Budget dec
General 290,464 299,542 3% 277,750 -7%Federal Funds 0 0 0% 0 0%Supplemental General 0 0 0% 0 0%At Risk (4yr Old) 0 0 0% 0 0%At Risk (K-12) 0 0 0% 0 0%Bilingual Education 0 0 0% 0 0%Virtual Education 0 0 0% 0 0%Capital Outlay 55,606 235,008 323% 150,000 -36%Driver Training 0 0 0% 0 0%Declining Enrollment 0 0 0% 0 0%Extraordinary School Program 0 0 0% 0 0%Food Service 0 0 0% 0 0%Professional Development 0 0 0% 0 0%Parent Education Program 0 0 0% 0 0%Summer School 0 0 0% 0 0%Special Education 77,572 44,712 -42% 56,828 27%Cost of Living 0 0 0% 0 0%Vocational Education 0 0 0% 0 0%Gifts/Grants 13,195 28,767 118% 20,000 -30%Special Liability 0 0 0% 0 0%School Retirement 0 0 0% 0 0%Extraordinary Growth Facilities 0 0 0% 0 0%Special Reserve 0 0 0%KPERS Spec. Ret. Contribution 17,382 14,147 -19% 20,939 48%Contingency Reserve 0 0 0%Text Book & Student Material 0 0 0%Activity Fund 0 0 0%Bond and Interest #1 0 0 0% 0 0%Bond and Interest #2 0 0 0% 0 0%No-Fund Warrant 0 0 0% 0 0%Special Assessment 0 0 0% 0 0%Temporary Note 0 0 0% 0 0%
SUBTOTAL 454,219 622,176 37% 525,517 -16%Enrollment (FTE)* 274.5 287.0 5% 295.0 3%Amount per Pupil 1,655 2,168 31% 1,781 -18%
Adult Education 0 0 0% 0 0%Adult Supplemental Education 0 0 0% 0 0%Tuition Reimbursement 0 0 0% 0 0%Special Education Coop 0 0 0% 0 0%TOTAL 454,219 622,176 37% 525,517 -16%
NOTE: Gifts/Grants includes private grants and grants from nonfederal sources.
Amount per pupil excludes the following funds: Adult Education, Adult Supplemental Education, Special Education Coopand Tuition Reimbursement.
* Enrollment (FTE) includes the current year enrollment on September 20, February 20, 4 yr old at-risk, and virtual. It does not include non-funded preschool or full-day kindergarten not on an IEP.
0
100,000
200,000
300,000
400,000
500,000
600,000
700,000
2014-2015 2015-2016 2016-2017
454,219
622,176
525,517
Transportation Expenditures
9/19/2016 3:06 PM Sumexpen.xlsx Page 13 of 31

USD# 310
Other Support Services Expenditures (2900)
% %2014-2015 2015-2016 inc/ 2016-2017 inc/
Actual Actual dec Budget dec
General 0 0 0% 0 0%Federal Funds 0 0 0% 0 0%Supplemental General 0 0 0% 0 0%At Risk (4yr Old) 0 0 0% 0 0%At Risk (K-12) 0 0 0% 0 0%Bilingual Education 0 0 0% 0 0%Virtual Education 0 0 0% 0 0%Capital Outlay 0 0 0% 0 0%Driver Training 0 0 0% 0 0%Declining Enrollment 0 0 0% 0 0%Extraordinary School Program 0 0 0% 0 0%Food Service 0 0 0% 0 0%Professional Development 0 0 0% 0 0%Parent Education Program 0 0 0% 0 0%Summer School 0 0 0% 0 0%Special Education 0 0 0% 0 0%Cost of Living 0 0 0% 0 0%Vocational Education 0 0 0% 0 0%Gifts/Grants 0 0 0% 0 0%Special Liability 0 0 0% 0 0%School Retirement 0 0 0% 0 0%Extraordinary Growth Facilities 0 0 0% 0 0%Special Reserve 0 0 0%KPERS Spec. Ret. Contribution 0 0 0% 0 0%Contingency Reserve 0 0 0%Text Book & Student Material 0 0 0%Activity Fund 0 0 0%Bond and Interest #1 0 0 0% 0 0%Bond and Interest #2 0 0 0% 0 0%No-Fund Warrant 0 0 0% 0 0%Special Assessment 0 0 0% 0 0%Temporary Note 0 0 0% 0 0%
SUBTOTAL 0 0 0% 0 0%Enrollment (FTE)* 274.5 287.0 5% 295.0 3%Amount per Pupil 0 0 0% 0 0%
Adult Education 0 0 0% 0 0%Adult Supplemental Education 0 0 0% 0 0%Tuition Reimbursement 0 0 0% 0 0%Special Education Coop 0 0 0% 0 0%TOTAL 0 0 0% 0 0%
NOTE: Gifts/Grants includes private grants and grants from nonfederal sources.
Amount per pupil excludes the following funds: Adult Education, Adult Supplemental Education, Special Education Coopand Tuition Reimbursement.
* Enrollment (FTE) includes the current year enrollment on September 20, February 20, 4 yr old at-risk, and virtual. It does not include non-funded preschool or full-day kindergarten not on an IEP.
0
0
0
0
0
1
1
1
1
1
1
2014-2015 2015-2016 2016-2017
0 0 0
Other Support Services Expenditures
9/19/2016 3:06 PM Sumexpen.xlsx Page 14 of 31

USD# 310
Food Services Expenditures (3100)
% %2014-2015 2015-2016 inc/ 2016-2017 inc/
Actual Actual dec Budget dec
General 0 0 0% 0 0%Federal Funds 0 0 0% 0 0%Supplemental General 0 0 0% 0 0%At Risk (4yr Old) 0 0 0% 0 0%At Risk (K-12) 0 0 0% 0 0%Bilingual Education 0 0 0% 0 0%Virtual Education 0 0 0% 0 0%Capital Outlay 0 0 0% 0 0%Driver Training 0 0 0% 0 0%Declining Enrollment 0 0 0% 0 0%Extraordinary School Program 0 0 0% 0 0%Food Service 230,879 227,090 -2% 238,187 5%Professional Development 0 0 0% 0 0%Parent Education Program 0 0 0% 0 0%Summer School 0 0 0% 0 0%Special Education 0 0 0% 0 0%Cost of Living 0 0 0% 0 0%Vocational Education 0 0 0% 0 0%Gifts/Grants 0 0 0% 0 0%Special Liability 0 0 0% 0 0%School Retirement 0 0 0% 0 0%Extraordinary Growth Facilities 0 0 0% 0 0%Special Reserve 0 0 0%KPERS Spec. Ret. Contribution 12,660 10,304 -19% 15,250 48%Contingency Reserve 0 0 0%Text Book & Student Material 0 0 0%Activity Fund 0 0 0%Bond and Interest #1 0 0 0% 0 0%Bond and Interest #2 0 0 0% 0 0%No-Fund Warrant 0 0 0% 0 0%Special Assessment 0 0 0% 0 0%Temporary Note 0 0 0% 0 0%
SUBTOTAL 243,539 237,394 -3% 253,437 7%Enrollment (FTE)* 274.5 287.0 5% 295.0 3%Amount per Pupil 887 827 -7% 859 4%
Adult Education 0 0 0% 0 0%Adult Supplemental Education 0 0 0% 0 0%Tuition Reimbursement 0 0 0% 0 0%Special Education Coop 0 0 0% 0 0%TOTAL 243,539 237,394 -3% 253,437 7%
NOTE: Gifts/Grants includes private grants and grants from nonfederal sources.
Amount per pupil excludes the following funds: Adult Education, Adult Supplemental Education, Special Education Coopand Tuition Reimbursement.
* Enrollment (FTE) includes the current year enrollment on September 20, February 20, 4 yr old at-risk, and virtual. It does not include non-funded preschool or full-day kindergarten not on an IEP.
225,000
230,000
235,000
240,000
245,000
250,000
255,000
2014-2015 2015-2016 2016-2017
243,539
237,394
253,437
Food Service Expenditures
9/19/2016 3:06 PM Sumexpen.xlsx Page 15 of 31

USD# 310
Community Services Operations (3300)
% %2014-2015 2015-2016 inc/ 2016-2017 inc/
Actual Actual dec Budget dec
General 0 0 0% 0 0%Federal Funds 0 0 0% 0 0%Supplemental General 0 0 0% 0 0%At Risk (4yr Old) 0 0 0% 0 0%At Risk (K-12) 0 0 0% 0 0%Bilingual Education 0 0 0% 0 0%Virtual Education 0 0 0% 0 0%Capital Outlay 0 0 0% 0 0%Driver Training 0 0 0% 0 0%Declining Enrollment 0 0 0% 0 0%Extraordinary School Program 0 0 0% 0 0%Food Service 0 0 0% 0 0%Professional Development 0 0 0% 0 0%Parent Education Program 0 0 0% 0 0%Summer School 0 0 0% 0 0%Special Education 0 0 0% 0 0%Cost of Living 0 0 0% 0 0%Vocational Education 0 0 0% 0 0%Gifts/Grants 0 0 0% 0 0%Special Liability 0 0 0% 0 0%School Retirement 0 0 0% 0 0%Extraordinary Growth Facilities 0 0 0% 0 0%Special Reserve 0 0 0%KPERS Spec. Ret. Contribution 0 0 0% 0 0%Contingency Reserve 0 0 0%Text Book & Student Material 0 0 0%Activity Fund 0 0 0%Bond and Interest #1 0 0 0% 0 0%Bond and Interest #2 0 0 0% 0 0%No-Fund Warrant 0 0 0% 0 0%Special Assessment 0 0 0% 0 0%Temporary Note 0 0 0% 0 0%
SUBTOTAL 0 0 0% 0 0%Enrollment (FTE)* 274.5 287.0 5% 295.0 3%Amount per Pupil 0 0 0% 0 0%
Adult Education 0 0 0% 0 0%Adult Supplemental Education 0 0 0% 0 0%Tuition Reimbursement 0 0 0% 0 0%Special Education Coop 0 0 0% 0 0%TOTAL 0 0 0% 0 0%
NOTE: Gifts/Grants includes private grants and grants from nonfederal sources.
Amount per pupil excludes the following funds: Adult Education, Adult Supplemental Education, Special Education Coopand Tuition Reimbursement.
* Enrollment (FTE) includes the current year enrollment on September 20, February 20, 4 yr old at-risk, and virtual. It does not include non-funded preschool or full-day kindergarten not on an IEP.
0
0
0
0
0
1
1
1
1
1
1
2014-2015 2015-2016 2016-2017
0 0 0
Community Services Operations (3300)
9/19/2016 3:06 PM Sumexpen.xlsx Page 16 of 31

USD# 310
Capital Improvements Expenditures (4000)
% %2014-2015 2015-2016 inc/ 2016-2017 inc/
Actual Actual dec Budget dec
General 0 0 0% 0 0%Federal Funds 0 0 0% 0 0%Supplemental General 0 0 0% 0 0%At Risk (4yr Old) 0 0 0% 0 0%At Risk (K-12) 0 0 0% 0 0%Bilingual Education 0 0 0% 0 0%Virtual Education 0 0 0% 0 0%Capital Outlay 557,431 261,871 -53% 443,000 69%Driver Training 0 0 0% 0 0%Declining Enrollment 0 0 0% 0 0%Extraordinary School Program 0 0 0% 0 0%Food Service 0 0 0% 0 0%Professional Development 0 0 0% 0 0%Parent Education Program 0 0 0% 0 0%Summer School 0 0 0% 0 0%Special Education 0 0 0% 0 0%Cost of Living 0 0 0% 0 0%Vocational Education 0 0 0% 0 0%Gifts/Grants 0 0 0% 0 0%Special Liability 0 0 0% 0 0%School Retirement 0 0 0% 0 0%Extraordinary Growth Facilities 0 0 0% 0 0%Special Reserve 0 0 0%KPERS Spec. Ret. Contribution 0 0 0% 0 0%Contingency Reserve 0 0 0%Text Book & Student Material 0 0 0%Activity Fund 0 0 0%Bond and Interest #1 0 0 0% 0 0%Bond and Interest #2 0 0 0% 0 0%No-Fund Warrant 0 0 0% 0 0%Special Assessment 0 0 0% 0 0%Temporary Note 0 0 0% 0 0%
SUBTOTAL 557,431 261,871 -53% 443,000 69%Enrollment (FTE)* 274.5 287.0 5% 295.0 3%Amount per Pupil 2,031 912 -55% 1,502 65%
Adult Education 0 0 0% 0 0%Adult Supplemental Education 0 0 0% 0 0%Tuition Reimbursement 0 0 0% 0 0%Special Education Coop 0 0 0% 0 0%TOTAL 557,431 261,871 -53% 443,000 69%
NOTE: Gifts/Grants includes private grants and grants from nonfederal sources.
Amount per pupil excludes the following funds: Adult Education, Adult Supplemental Education, Special Education Coopand Tuition Reimbursement.
* Enrollment (FTE) includes the current year enrollment on September 20, February 20, 4 yr old at-risk, and virtual. It does not include non-funded preschool or full-day kindergarten not on an IEP.
0
100,000
200,000
300,000
400,000
500,000
600,000
2014-2015 2015-2016 2016-2017
557,431
261,871
443,000
Capital Improvements (4000)
9/19/2016 3:06 PM Sumexpen.xlsx Page 17 of 31

USD# 310
Debt Services Expenditures (5100)
% %2014-2015 2015-2016 inc/ 2016-2017 inc/
Actual Actual dec Budget dec
General 0 0 0% 0 0%Federal Funds 0 0 0% 0 0%Supplemental General 0 0 0% 0 0%At Risk (4yr Old) 0 0 0% 0 0%At Risk (K-12) 0 0 0% 0 0%Bilingual Education 0 0 0% 0 0%Virtual Education 0 0 0% 0 0%Capital Outlay 0 0 0% 0 0%Driver Training 0 0 0% 0 0%Declining Enrollment 0 0 0% 0 0%Extraordinary School Program 0 0 0% 0 0%Food Service 0 0 0% 0 0%Professional Development 0 0 0% 0 0%Parent Education Program 0 0 0% 0 0%Summer School 0 0 0% 0 0%Special Education 0 0 0% 0 0%Cost of Living 0 0 0% 0 0%Vocational Education 0 0 0% 0 0%Gifts/Grants 0 0 0% 0 0%Special Liability 0 0 0% 0 0%School Retirement 0 0 0% 0 0%Extraordinary Growth Facilities 0 0 0% 0 0%Special Reserve 0 0 0%KPERS Spec. Ret. Contribution 0 0 0% 0 0%Contingency Reserve 0 0 0%Text Book & Student Material 0 0 0%Activity Fund 0 0 0%Bond and Interest #1 0 0 0% 0 0%Bond and Interest #2 0 0 0% 0 0%No-Fund Warrant 0 0 0% 0 0%Special Assessment 0 0 0% 0 0%Temporary Note 0 0 0% 0 0%
SUBTOTAL 0 0 0% 0 0%Enrollment (FTE)* 274.5 287.0 5% 295.0 3%Amount per Pupil 0 0 0% 0 0%
Adult Education 0 0 0% 0 0%Adult Supplemental Education 0 0 0% 0 0%Tuition Reimbursement 0 0 0% 0 0%Special Education Coop 0 0 0% 0 0%TOTAL 0 0 0% 0 0%
NOTE: Gifts/Grants includes private grants and grants from nonfederal sources.
Amount per pupil excludes the following funds: Adult Education, Adult Supplemental Education, Special Education Coopand Tuition Reimbursement.
* Enrollment (FTE) includes the current year enrollment on September 20, February 20, 4 yr old at-risk, and virtual. It does not include non-funded preschool or full-day kindergarten not on an IEP.
0
0
0
0
0
1
1
1
1
1
1
2014-2015 2015-2016 2016-2017
0 0 0
Debt Services (5100)
9/19/2016 3:06 PM Sumexpen.xlsx Page 18 of 31
USD# 310
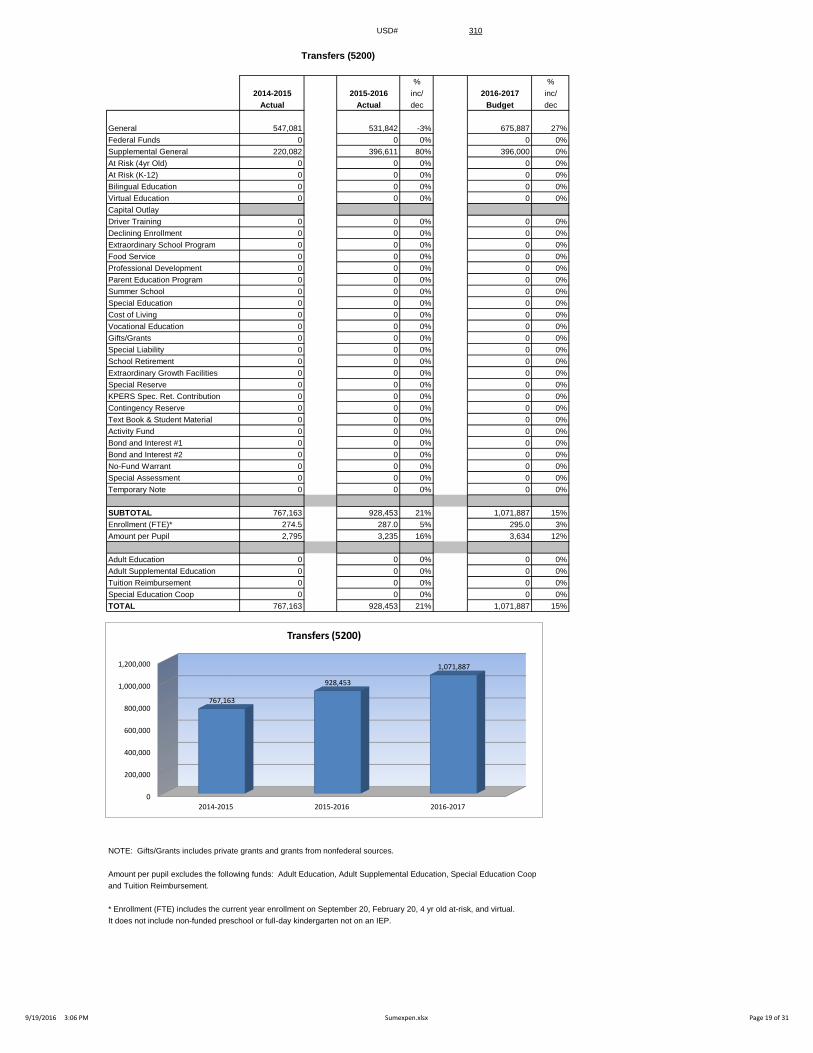
Transfers (5200)
% %2014-2015 2015-2016 inc/ 2016-2017 inc/
Actual Actual dec Budget dec
General 547,081 531,842 -3% 675,887 27%Federal Funds 0 0 0% 0 0%Supplemental General 220,082 396,611 80% 396,000 0%At Risk (4yr Old) 0 0 0% 0 0%At Risk (K-12) 0 0 0% 0 0%Bilingual Education 0 0 0% 0 0%Virtual Education 0 0 0% 0 0%Capital OutlayDriver Training 0 0 0% 0 0%Declining Enrollment 0 0 0% 0 0%Extraordinary School Program 0 0 0% 0 0%Food Service 0 0 0% 0 0%Professional Development 0 0 0% 0 0%Parent Education Program 0 0 0% 0 0%Summer School 0 0 0% 0 0%Special Education 0 0 0% 0 0%Cost of Living 0 0 0% 0 0%Vocational Education 0 0 0% 0 0%Gifts/Grants 0 0 0% 0 0%Special Liability 0 0 0% 0 0%School Retirement 0 0 0% 0 0%Extraordinary Growth Facilities 0 0 0% 0 0%Special Reserve 0 0 0% 0 0%KPERS Spec. Ret. Contribution 0 0 0% 0 0%Contingency Reserve 0 0 0% 0 0%Text Book & Student Material 0 0 0% 0 0%Activity Fund 0 0 0% 0 0%Bond and Interest #1 0 0 0% 0 0%Bond and Interest #2 0 0 0% 0 0%No-Fund Warrant 0 0 0% 0 0%Special Assessment 0 0 0% 0 0%Temporary Note 0 0 0% 0 0%
SUBTOTAL 767,163 928,453 21% 1,071,887 15%Enrollment (FTE)* 274.5 287.0 5% 295.0 3%Amount per Pupil 2,795 3,235 16% 3,634 12%
Adult Education 0 0 0% 0 0%Adult Supplemental Education 0 0 0% 0 0%Tuition Reimbursement 0 0 0% 0 0%Special Education Coop 0 0 0% 0 0%TOTAL 767,163 928,453 21% 1,071,887 15%
NOTE: Gifts/Grants includes private grants and grants from nonfederal sources.
Amount per pupil excludes the following funds: Adult Education, Adult Supplemental Education, Special Education Coopand Tuition Reimbursement.
* Enrollment (FTE) includes the current year enrollment on September 20, February 20, 4 yr old at-risk, and virtual. It does not include non-funded preschool or full-day kindergarten not on an IEP.
0
200,000
400,000
600,000
800,000
1,000,000
1,200,000
2014-2015 2015-2016 2016-2017
767,163
928,453
1,071,887
Transfers (5200)
9/19/2016 3:06 PM Sumexpen.xlsx Page 19 of 31

USD# 310Miscellaneous Information
Unencumbered Cash Balance by Fund
July 1, 2014 July 1, 2015 July 1, 2016General 1,999 14,214 14,719Federal Funds 0 0 0Supplemental General 213,930 145,153 78,773At Risk (4yr Old) 0 0 0At Risk (K-12) 0 0 0Bilingual Education 0 0 0Virtual Education 0 0 0Capital Outlay 683,781 472,715 412,023Driver Training 11,013 0 0Declining Enrollment 0 0 0Extraordinary School Program 0 0 0Food Service 60,273 35,898 22,788Professional Development 4,070 0 0Parent Education Program 0 0 0Summer School 0 0 0Special Education 39,460 33,408 26,828Cost of Living 0 0 0Vocational Education 60,772 8,315 8,315Gifts/Grants 11,665 22,799 25,484Special Liability 0 0 0School Retirement 0 0 0Extraordinary Growth Facilities 0 0 0Special Reserve 0 0 0KPERS Spec. Ret. Contribution 0 0 0Contingency Reserve 270,000 270,000 285,000Text Book & Student Material 57,710 38,850 14,962Activity Fund 189 213 1,213Bond and Interest #1 0 0 0Bond and Interest #2 0 0 0No Fund Warrant 0 0 0Special Assessment 0 0 0Temporary Note 0 0 0
SUBTOTAL 1,414,862 1,041,565 890,105Enrollment (FTE)* 274.5 287.0 295.0Amount per Pupil 5,154 3,629 3,017
Adult Education 0 0 0Adult Supplemental Education 0 0 0Tuition Reimbursement 0 0 0Special Education Coop 0 0 0TOTAL 1,414,862 1,041,565 890,105
NOTE: Gifts/Grants includes private grants and grants from nonfederal sources.
Amount per pupil excludes the following funds: Adult Education, Adult Supplemental Education, Special Education Coopand Tuition Reimbursement.
* Enrollment (FTE) includes the current year enrollment on September 20, February 20, 4 yr old at-risk, and virtual. It does not include non-funded preschool or full-day kindergarten not on an IEP.
0
200,000
400,000
600,000
800,000
1,000,000
1,200,000
1,400,000
1,600,000
July 1, 2014 July 1, 2015 July 1, 2016
1,414,862
1,041,565
890,105
Unencumbered Cash Balances by Fund
9/19/2016 3:06 PM Sumexpen.xlsx Page 20 of 31

USD# 310
Reserve FundsUnencumbered Cash Balance
July 1, 2014 July 1, 2015 July 1, 2016Special Reserve 0 0 0TOTAL OTHER 0 0 0Amount per Pupil $0 $0 $0
*School districts are authorized by law to self insure rather than purchase insurance for the following categories: Worker's Comp,Health Insurance, Life Insurance, Property and Casualty (Risk Management) and Disability Income Insurance. Monies are placedin the Self Insured Fund to pay for claims which may arise from the categories listed above.
0
0
0
0
0
1
1
1
1
1
1
July 1, 2014 July 1, 2015 July 1, 2016
0 0 0
Unencumbered Cash Balances by Fund (Reserve Funds Only)
9/19/2016 3:06 PM Sumexpen.xlsx Page 21 of 31

USD# 310
2012-2013 2013-2014 % 2014-2015 % 2015-2016 % 2016-2017 %Actual Actual inc/ Actual inc/ Actual inc/ Budget inc/
dec dec dec dec
Enrollment (FTE)* 266.5 272.0 2% 274.5 1% 287.0 5% 295.0 3%
Enrollment (FTE)** 266.5 272.0 2% 274.5 1% 287.0 5% 295.0 3%Number of Students - Free Meals 153 163 7% 145 -11% 160 10% 166 4%Number of Students - Reduced Meals 40 46 15% 51 11% 50 -2% 0 ####
*FTE for state aid and budget authority purposes for general fund (excludes 4 yr old at-risk).
** Enrollment (FTE) includes the current year enrollment on September 20, February 20, 4 yr old at-risk, and virtual. It does not include non-funded preschool or full-day kindergarten not on an IEP.
Enrollment Information
250.0
255.0
260.0
265.0
270.0
275.0
280.0
285.0
290.0
295.0
2012-2013 2013-2014 2014-2015 2015-2016 2016-2017
266.5
272.0274.5
287.0
295.0
Enrollment (FTE)** Used for Calculating "Amount per Pupil"
0
20
40
60
80
100
120
140
160
180
2012-2013 2013-2014 2014-2015 2015-2016 2016-2017
153163
145160 166
40 46 51 50
0
Low Income Students
Free Meals
Reduced Meals
250.0
260.0
270.0
280.0
290.0
300.0
2012-2013 2013-2014 2014-2015 2015-2016 2016-2017
266.5
272.0274.5
287.0
295.0
FTE Enrollment for Budget Authority
9/19/2016 3:06 PM Sumexpen.xlsx Page 22 of 31

USD# 310
Miscellaneous InformationMill Rates by Fund
2014-2015 2015-2016 2016-2017Actual Actual Budget
General 20.000 20.000 20.000Supplemental General 19.323 19.345 21.993Adult Education 0.000 0.000 0.000Capital Outlay 7.794 7.899 8.000Declining Enrollment 0.000 0.000 0.000Cost of Living 0.000 0.000 0.000Special Liability 0.000 0.000 0.000School Retirement 0.000 0.000 0.000Extraordinary Growth Facilities 0.000 0.000 0.000Bond and Interest #1 0.000 0.000 0.000Bond and Interest #2 0.000 0.000 0.000No Fund Warrant 0.000 0.000 0.000Special Assessment 0.000 0.000 0.000Temporary Note 0.000 0.000 0.000TOTAL USD 47.117 47.244 49.993Historical Museum 0.000 0.000 0.000Public Library Board 0.000 0.000 0.000Public Library Brd & Emp Benf 0.000 0.000 0.000Recreation Commission 0.000 0.000 0.000
Rec Comm Employee Bnfts 0.000 0.000 0.000TOTAL OTHER 0.000 0.000 0.000
0.000
10.000
20.000
30.000
40.000
50.000
60.000
70.000
80.000
2014-2015 2015-2016 2016-2017
47.117 47.24449.993
Total USD Mill Rates
General40%
Supplemental General44%
Capital Outlay16%
Miscellaneous Information Mill Rates by Fund (Total USD)
General
Supplemental General
Adult Education
Capital Outlay
Special Liability
School Retirement
Declining Enrollment
Cost of Living
Bond and Interest #1
Bond and Interest #2
Extraordinary Growth Facilities
No Fund Warrant
Special Assessment
Temporary Note
9/19/2016 3:06 PM Sumexpen.xlsx Page 23 of 31

USD# 310Other Information
2014-2015 2015-2016 2016-2017Actual Actual Budget
Assessed Valuation $40,215,432 $40,958,759 $38,797,084
Total USD Debt $2,338,495 $2,225,351 $1,977,906
$37,500,000
$38,000,000
$38,500,000
$39,000,000
$39,500,000
$40,000,000
$40,500,000
$41,000,000
2014-2015 2015-2016 2016-2017
$40,215,432
$40,958,759
$38,797,084
Assessed Valuation
$1,700,000
$1,800,000
$1,900,000
$2,000,000
$2,100,000
$2,200,000
$2,300,000
$2,400,000
2014-2015 2015-2016 2016-2017
$2,338,495
$2,225,351
$1,977,906
Total USD Debt
9/19/2016 3:06 PM Sumexpen.xlsx Page 24 of 31

USD 310
2016-17 Estimated Sources of Revenue--2016-17 Estimated
Amount July 1, 2016 State Federal Local July 1, 2017
Fund Budgeted Cash Balance Interest Transfers Other Cash Balance
General 2,979,773 14,719 2,965,054 0 0 0 0 0
Supplemental General 930,708 78,773 0 0 851,935 XXXXXXXX
Adult Education 0 0 0 0 xxxxxxxxxxxx 0 0 0
At Risk (4yr Old) 0 0 0 xxxxxxxxxxxx 0 0 0
Adult Supplemental Education 0 0 xxxxxxxxxxxx 0 0 0
At Risk (K-12) 167,000 0 0 xxxxxxxxxxxx 167,000 0 0
Bilingual Education 0 0 0 xxxxxxxxxxxx 0 0 0
Virtual Education 0 0 0 0 0 0
Capital Outlay 720,732 412,023 0 0 0 320,983 12,274
Driver Training 8,950 0 1,800 0 xxxxxxxxxxxx 7,150 0 0
Declining Enrollment 0 0 0 0 XXXXXXXX
Extraordinary School Program 0 0 0 xxxxxxxxxxxx 0 0 0
Food Service 238,302 22,788 1,742 157,919 0 0 55,853 0
Professional Development 8,850 0 0 xxxxxxxxxxxx 8,850 0 0
Parent Education Program 0 0 0 0 xxxxxxxxxxxx 0 0 0
Summer School 0 0 0 xxxxxxxxxxxx 0 0 0
Special Education 501,828 26,828 0 0 xxxxxxxxxxxx 475,000 0 0
Vocational Education 147,250 8,315 7,935 0 xxxxxxxxxxxx 121,000 10,000 0
Special Liability Expense Fund 0 0 0 0 0 0
Special Reserve Fund 0 XXXXXXXX
Gifts and Grants 225,484 25,484 200,000 0
Textbook & Student Materials Revolving 14,962 XXXXXXXX
School Retirement 0 0 xxxxxxxxxxxx 0 0
Extraordinary Growth Facilities 0 0 0 0 XXXXXXXXX
KPERS Special Retirement Contribution 292,887 0 292,887 XXXXXXXXX
Contingency Reserve 285,000 XXXXXXXXX
Activity Funds 1,213 XXXXXXXXX
Tuition Reimbursement 0 0 0 0 0
Bond and Interest #1 0 0 0 0 0 0 0
Bond and Interest #2 0 0 0 0 0 0 0
No Fund Warrant 0 0 0 0
Special Assessment 0 0 0 0
Temporary Note 0 0 xxxxxxxxxxxx 0 0
Coop Special Education 0 0 0 0 0 0 0
Federal Funds 125,563 0 xxxxxxxxxxx 125,563 xxxxxxxxxxxx xxxxxxxxxxxx xxxxxxxxxxx 0
Cost of Living 0 0 xxxxxxxxxxx xxxxxxxxxxx xxxxxxxxxxxx 0 0 XXXXXXXXX
SUBTOTAL 6,347,327 890,105 2,976,531 283,482 0 1,071,887 1,438,771 12,274
Less Transfers 1,071,887
TOTAL Budget Expenditures $5,275,440
2014-2015 2015-2016 2016-2017State Revenues 2,922,731 2,796,947 2,976,531
Federal Revenues 280,105 215,344 283,482Local Revenues* 1,742,521 1,872,840 1,438,771Total Revenues 4,945,357 4,885,131 4,698,784
Revenues Per Pupil 18,016 17,021 15,928
*Excludes "Transfers" to avoid duplication of revenue.
Sources of Revenue and Proposed Budget for 2016-17
Sources of Revenue - - State, Federal, Local
Effective July 1, 2014 (2014-15 school year) KSA 72-6431 states proceeds from the
Ad Valorem taxes levied for the General Fund shall be remitted to the
State Treasurer. Such remittance shall be redistributed as state general aid.
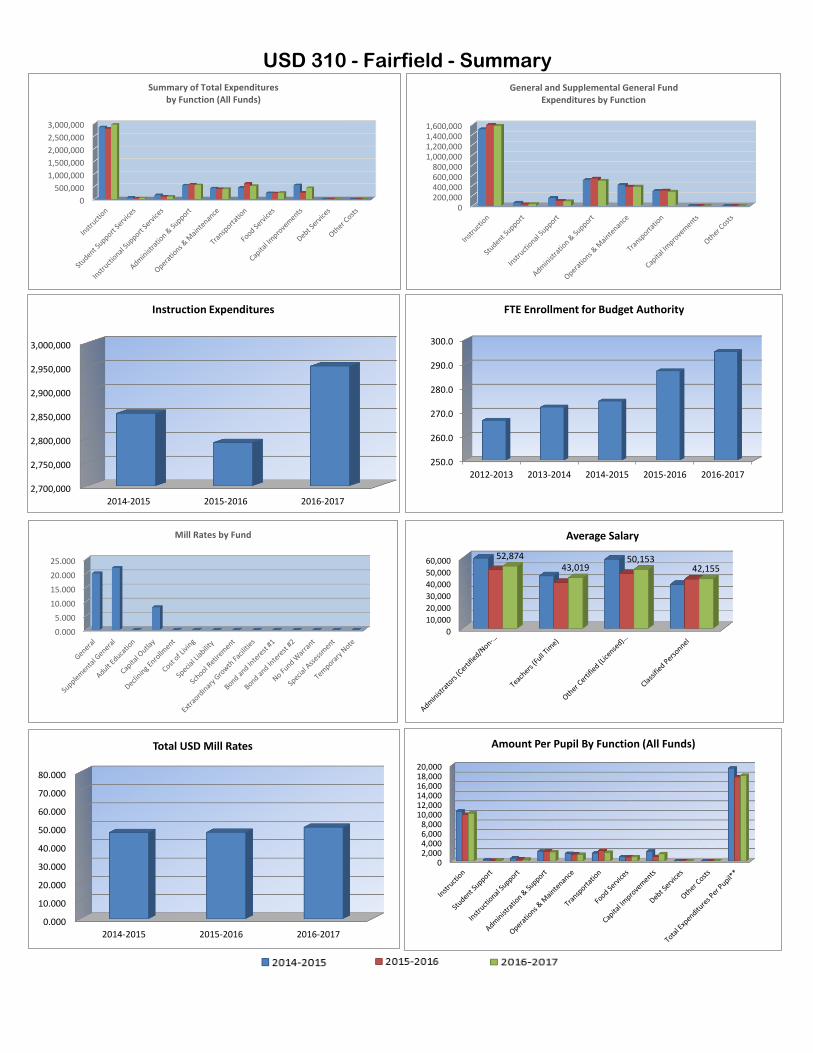
USD 310 - Fairfield - Summary
2,700,000
2,750,000
2,800,000
2,850,000
2,900,000
2,950,000
3,000,000
2014-2015 2015-2016 2016-2017
Instruction Expenditures
250.0
260.0
270.0
280.0
290.0
300.0
2012-2013 2013-2014 2014-2015 2015-2016 2016-2017
FTE Enrollment for Budget Authority
0.000
10.000
20.000
30.000
40.000
50.000
60.000
70.000
80.000
2014-2015 2015-2016 2016-2017
Total USD Mill Rates
02,0004,0006,0008,000
10,00012,00014,00016,00018,00020,000
Amount Per Pupil By Function (All Funds)
0
10,000
20,000
30,000
40,000
50,000
60,00052,874
43,01950,153
42,155
Average Salary
0
500,000
1,000,000
1,500,000
2,000,000
2,500,000
3,000,000
Summary of Total Expendituresby Function (All Funds)
0200,000400,000600,000800,000
1,000,0001,200,0001,400,0001,600,000
General and Supplemental General FundExpenditures by Function
0.000
5.000
10.000
15.000
20.000
25.000
Mill Rates by Fund

Intentionally left blank

Intentionally left blank

Intentionally left blank

Intentionally left blank

Intentionally left blank