Embed Size (px)
Citation preview

Fourth quarter 2019
results presentation
Q4Norwegian Finans Holding Group
February 20, 2020
2
Performance and events
Country overview and performance
Fourth quarter 2019 results
Outlook
Agenda
3
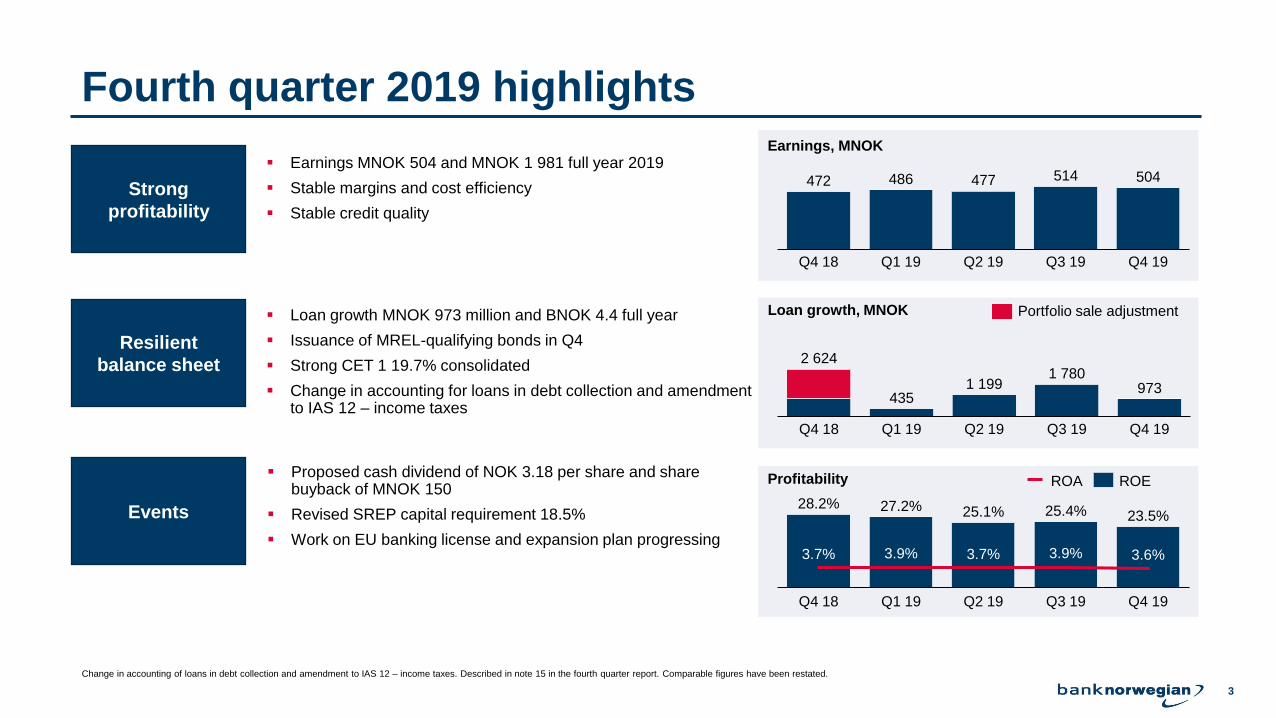
Fourth quarter 2019 highlights
▪ Earnings MNOK 504 and MNOK 1 981 full year 2019
▪ Stable margins and cost efficiency
▪ Stable credit quality
Strong
profitability
Resilient
balance sheet
Events
▪ Loan growth MNOK 973 million and BNOK 4.4 full year
▪ Issuance of MREL-qualifying bonds in Q4
▪ Strong CET 1 19.7% consolidated
▪ Change in accounting for loans in debt collection and amendment to IAS 12 – income taxes
▪ Proposed cash dividend of NOK 3.18 per share and share buyback of MNOK 150
▪ Revised SREP capital requirement 18.5%
▪ Work on EU banking license and expansion plan progressing
Loan growth, MNOK
Earnings, MNOK
Q4 18
435
Q1 19 Q3 19Q2 19 Q4 19
2 624
1 1991 780
973
504472
Q4 18 Q1 19 Q2 19 Q3 19 Q4 19
486 477 514
ROA ROE
3.7% 3.9%
Q4 19
3.9%3.7%
Q4 18 Q1 19 Q2 19 Q3 19
3.6%
28.2% 27.2% 25.1% 25.4% 23.5%
Profitability
Portfolio sale adjustment
Change in accounting of loans in debt collection and amendment to IAS 12 – income taxes. Described in note 15 in the fourth quarter report. Comparable figures have been restated.
4
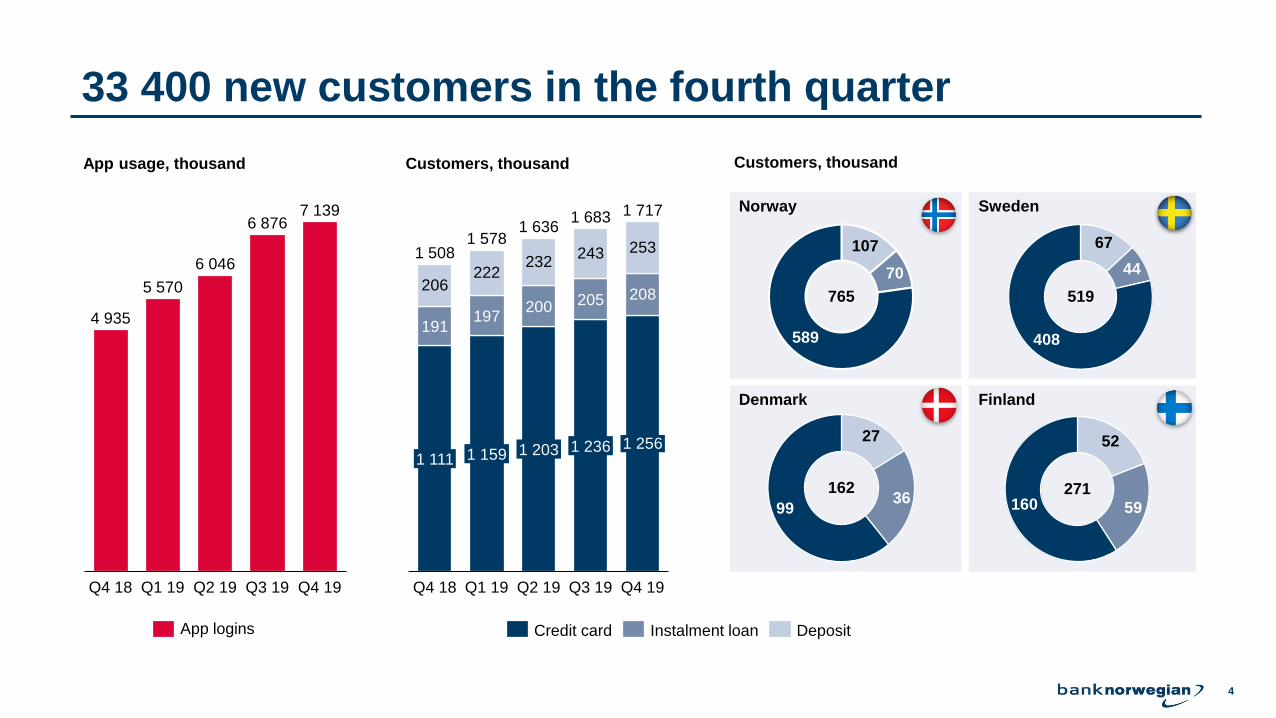
33 400 new customers in the fourth quarter
197200
206
243
191
222
1 111
Q4 18
205
1 203
Q1 19
1 159
232
1 717
Q2 19
1 236
Q3 19
2531 578
208
1 256
Q4 19
1 508
1 6361 683
Credit card Instalment loan Deposit
Customers, thousand
107
70
589
Norway Sweden
Customers, thousand
Q2 19
7 139
5 570
Q4 19Q3 19Q4 18 Q1 19
4 935
6 046
6 876
App usage, thousand
765
44
67
408
99
27
36
52
59160
Denmark Finland
519
App logins
271162
5
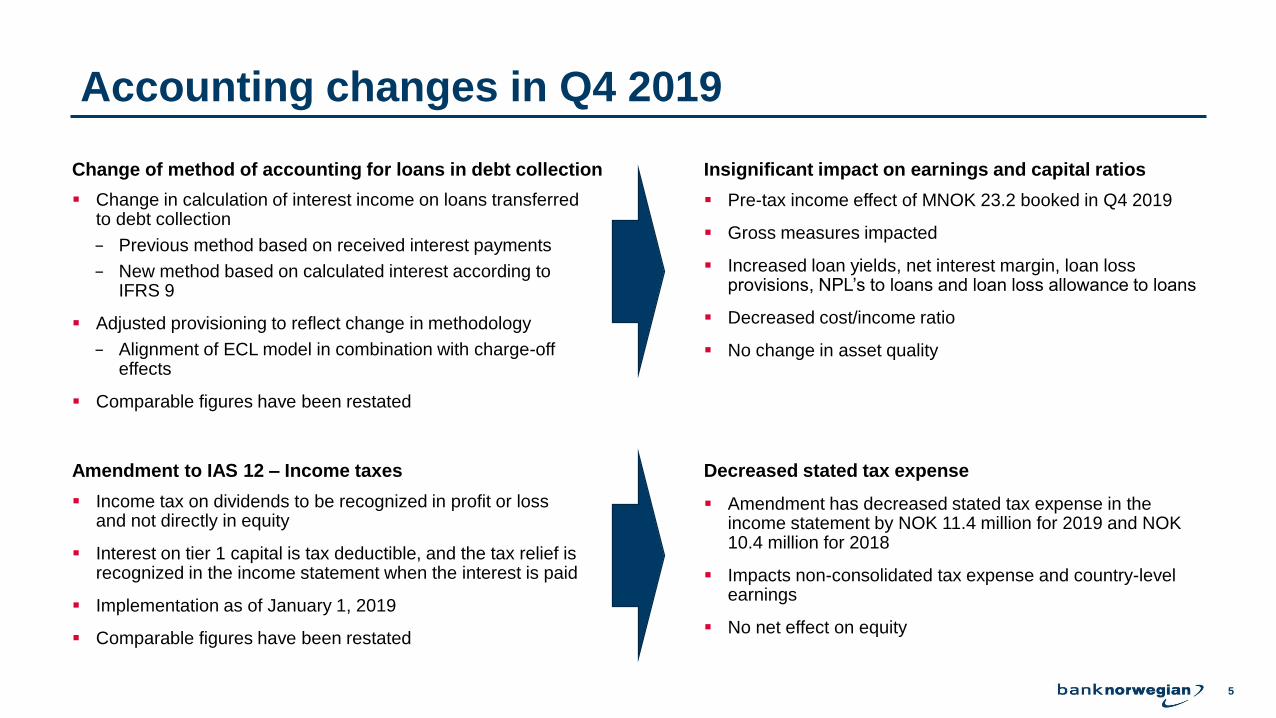
▪ Change in calculation of interest income on loans transferred to debt collection
− Previous method based on received interest payments
− New method based on calculated interest according to IFRS 9
▪ Adjusted provisioning to reflect change in methodology
− Alignment of ECL model in combination with charge-off effects
▪ Comparable figures have been restated
Change of method of accounting for loans in debt collection
Accounting changes in Q4 2019
▪ Pre-tax income effect of MNOK 23.2 booked in Q4 2019
▪ Gross measures impacted
▪ Increased loan yields, net interest margin, loan loss provisions, NPL’s to loans and loan loss allowance to loans
▪ Decreased cost/income ratio
▪ No change in asset quality
Amendment to IAS 12 – Income taxes
▪ Income tax on dividends to be recognized in profit or loss and not directly in equity
▪ Interest on tier 1 capital is tax deductible, and the tax relief is recognized in the income statement when the interest is paid
▪ Implementation as of January 1, 2019
▪ Comparable figures have been restated
▪ Amendment has decreased stated tax expense in the income statement by NOK 11.4 million for 2019 and NOK 10.4 million for 2018
▪ Impacts non-consolidated tax expense and country-level earnings
▪ No net effect on equity
Insignificant impact on earnings and capital ratios
Decreased stated tax expense
6
Performance and events
Country overview and performance
Fourth quarter 2019 results
Outlook
Agenda
7
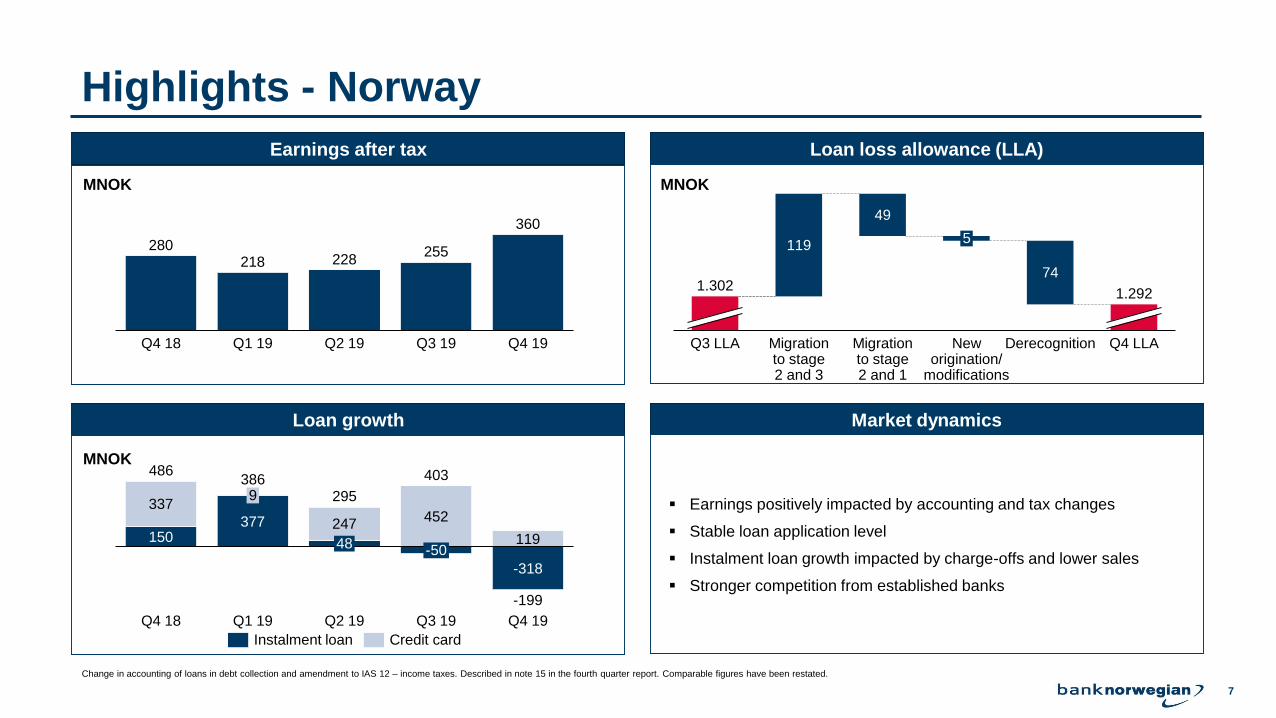
Highlights - Norway
Earnings after tax Loan loss allowance (LLA)
Loan growth Market dynamics
▪ Earnings positively impacted by accounting and tax changes
▪ Stable loan application level
▪ Instalment loan growth impacted by charge-offs and lower sales
▪ Stronger competition from established banks
280218 228
255
360
Q4 18 Q2 19Q1 19 Q4 19Q3 19
MNOK
150377 452
119
337
247
-318
Q3 19
-199
Q2 19
403
Q4 18
48
9
Q1 19
-50
Q4 19
486386
295
Instalment loan Credit card
119
49
74
DerecognitionMigration to stage 2 and 3
Migration to stage 2 and 1
Q3 LLA Q4 LLA
5
New origination/
modifications
1.3021.292
MNOK
MNOK
Change in accounting of loans in debt collection and amendment to IAS 12 – income taxes. Described in note 15 in the fourth quarter report. Comparable figures have been restated.
8
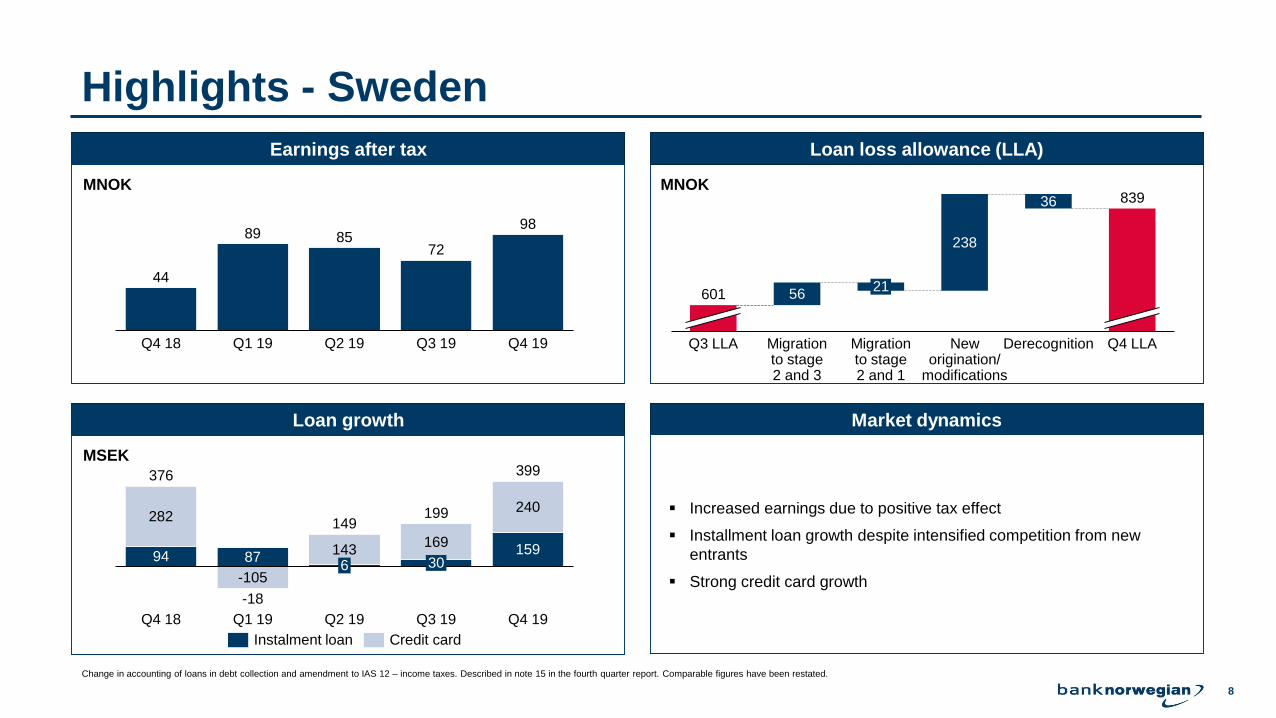
56
238
36
Q3 LLA
839
Migration to stage 2 and 3
21
Migration to stage 2 and 1
New origination/
modifications
Derecognition Q4 LLA
601
Highlights - Sweden
Earnings after tax Loan loss allowance (LLA)
Loan growth Market dynamics
▪ Increased earnings due to positive tax effect
▪ Installment loan growth despite intensified competition from new
entrants
▪ Strong credit card growth
MNOK
44
89 8572
98
Q4 18 Q1 19 Q4 19Q3 19Q2 19
MSEK
94 87159
282
-105
143169
240
Q4 18 Q1 19
399
Q4 19Q3 19
6 30
Q2 19
376
-18
149199
Instalment loan Credit card
MNOK
Change in accounting of loans in debt collection and amendment to IAS 12 – income taxes. Described in note 15 in the fourth quarter report. Comparable figures have been restated.
9
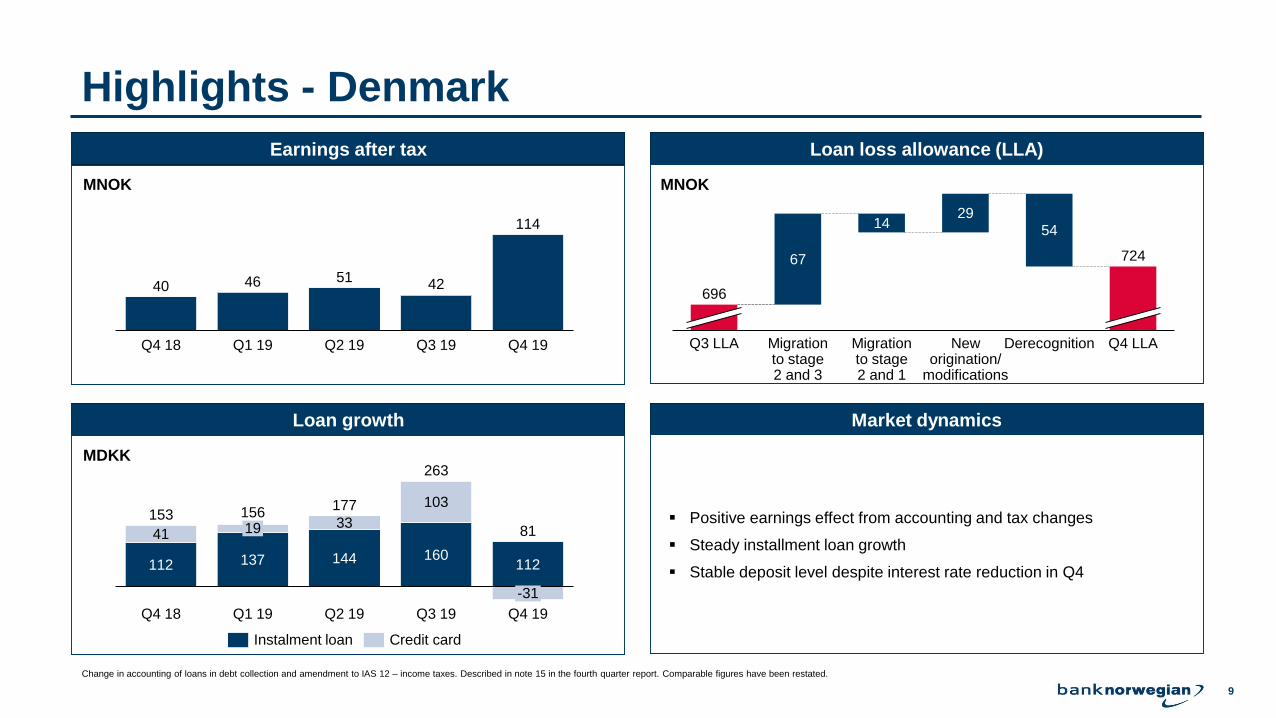
Highlights - Denmark
Earnings after tax Loan loss allowance (LLA)
Loan growth Market dynamics
▪ Positive earnings effect from accounting and tax changes
▪ Steady installment loan growth
▪ Stable deposit level despite interest rate reduction in Q4
MNOK
40 46 5142
114
Q1 19 Q4 19Q3 19Q4 18 Q2 19
67
1429
54
Migration to stage 2 and 3
696
Q3 LLA Migration to stage 2 and 1
New origination/
modifications
Derecognition Q4 LLA
724
MDKK
112 137 144 160112
4133
103
Q1 19Q4 18
15319
Q2 19
-31
Q3 19 Q4 19
156177
263
81
Instalment loan Credit card
MNOK
Change in accounting of loans in debt collection and amendment to IAS 12 – income taxes. Described in note 15 in the fourth quarter report. Comparable figures have been restated.
10
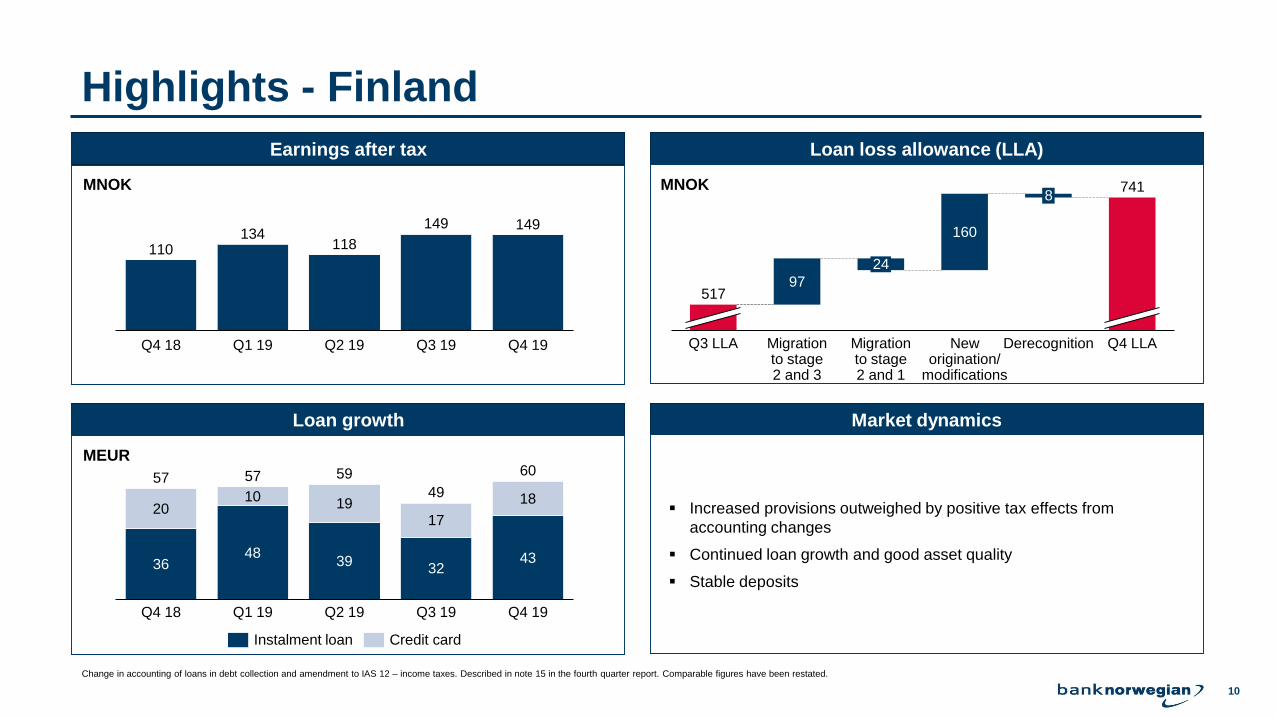
Highlights - Finland
Earnings after tax Loan loss allowance (LLA)
Loan growth Market dynamics
▪ Increased provisions outweighed by positive tax effects from
accounting changes
▪ Continued loan growth and good asset quality
▪ Stable deposits
MNOK
110134
118
149 149
Q4 19Q4 18 Q2 19Q1 19 Q3 19
97
160
8
Q3 LLA New origination/
modifications
Migration to stage 2 and 3
Migration to stage 2 and 1
Derecognition Q4 LLA
517
24
741
MEUR
3648
3932
43
2010
1917
18
Q4 19Q1 19Q4 18 Q2 19
5757
Q3 19
59
49
60
Instalment loan Credit card
MNOK
Change in accounting of loans in debt collection and amendment to IAS 12 – income taxes. Described in note 15 in the fourth quarter report. Comparable figures have been restated.
11
Performance and events
Country overview and performance
Fourth quarter 2019 results
Outlook
Agenda
12
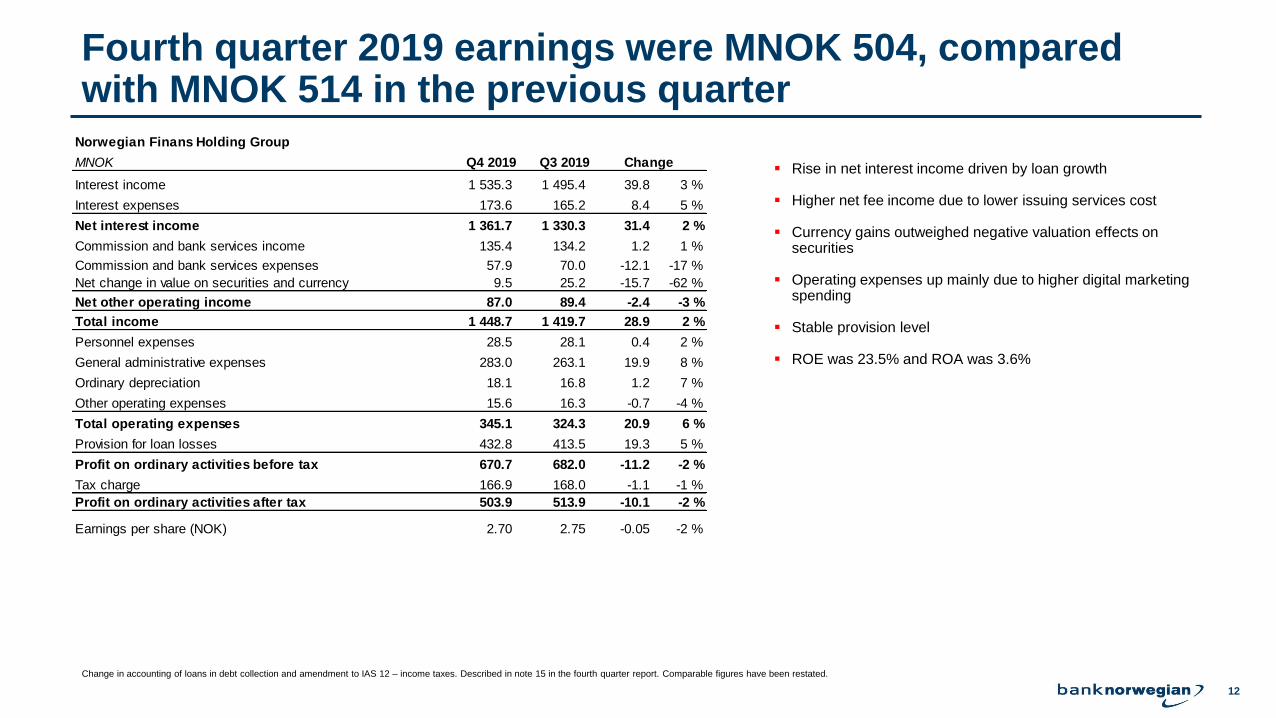
Fourth quarter 2019 earnings were MNOK 504, compared with MNOK 514 in the previous quarter
▪ Rise in net interest income driven by loan growth
▪ Higher net fee income due to lower issuing services cost
▪ Currency gains outweighed negative valuation effects on securities
▪ Operating expenses up mainly due to higher digital marketing spending
▪ Stable provision level
▪ ROE was 23.5% and ROA was 3.6%
Norwegian Finans Holding Group
MNOK Q4 2019 Q3 2019 Change
Interest income 1 535.3 1 495.4 39.8 3 %
Interest expenses 173.6 165.2 8.4 5 %
Net interest income 1 361.7 1 330.3 31.4 2 %
Commission and bank services income 135.4 134.2 1.2 1 %
Commission and bank services expenses 57.9 70.0 -12.1 -17 %
Net change in value on securities and currency 9.5 25.2 -15.7 -62 %
Net other operating income 87.0 89.4 -2.4 -3 %
Total income 1 448.7 1 419.7 28.9 2 %
Personnel expenses 28.5 28.1 0.4 2 %
General administrative expenses 283.0 263.1 19.9 8 %
Ordinary depreciation 18.1 16.8 1.2 7 %
Other operating expenses 15.6 16.3 -0.7 -4 %
Total operating expenses 345.1 324.3 20.9 6 %
Provision for loan losses 432.8 413.5 19.3 5 %
Profit on ordinary activities before tax 670.7 682.0 -11.2 -2 %
Tax charge 166.9 168.0 -1.1 -1 %
Profit on ordinary activities after tax 503.9 513.9 -10.1 -2 %
Earnings per share (NOK) 2.70 2.75 -0.05 -2 %
Change in accounting of loans in debt collection and amendment to IAS 12 – income taxes. Described in note 15 in the fourth quarter report. Comparable figures have been restated.
13
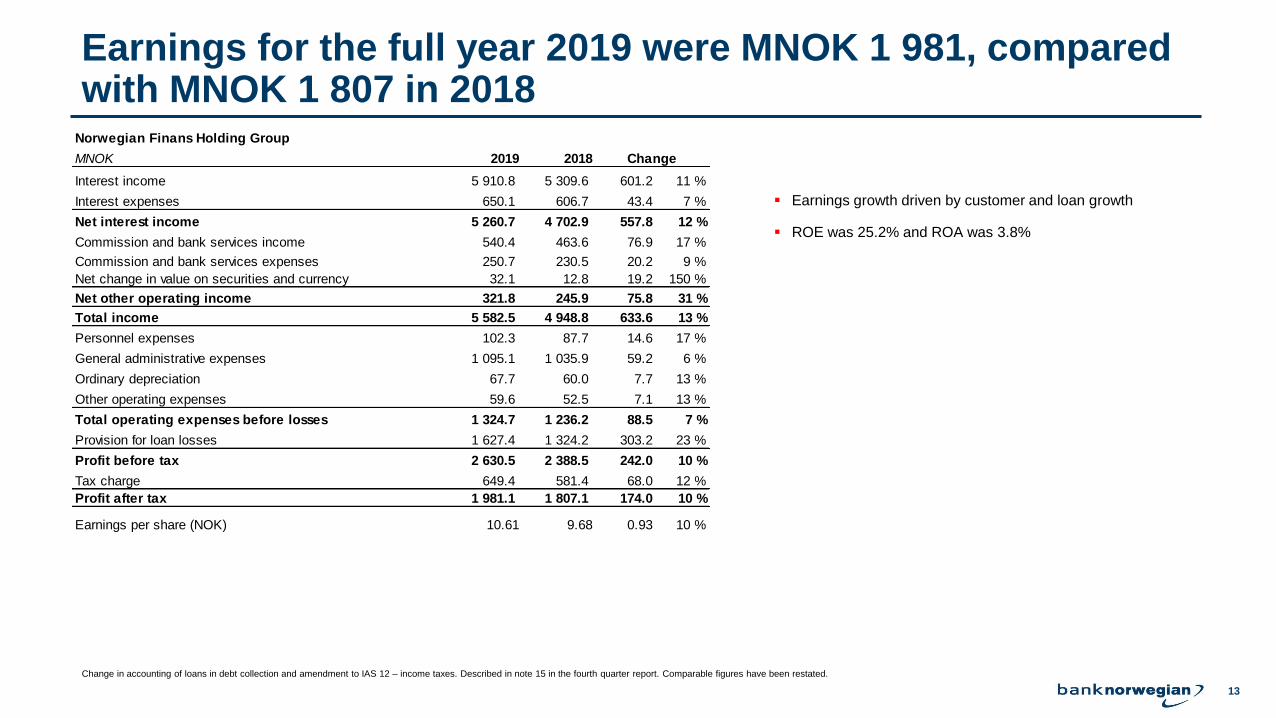
Earnings for the full year 2019 were MNOK 1 981, compared with MNOK 1 807 in 2018
▪ Earnings growth driven by customer and loan growth
▪ ROE was 25.2% and ROA was 3.8%
Norwegian Finans Holding Group
MNOK 2019 2018
Interest income 5 910.8 5 309.6 601.2 11 %
Interest expenses 650.1 606.7 43.4 7 %
Net interest income 5 260.7 4 702.9 557.8 12 %
Commission and bank services income 540.4 463.6 76.9 17 %
Commission and bank services expenses 250.7 230.5 20.2 9 %
Net change in value on securities and currency 32.1 12.8 19.2 150 %
Net other operating income 321.8 245.9 75.8 31 %
Total income 5 582.5 4 948.8 633.6 13 %
Personnel expenses 102.3 87.7 14.6 17 %
General administrative expenses 1 095.1 1 035.9 59.2 6 %
Ordinary depreciation 67.7 60.0 7.7 13 %
Other operating expenses 59.6 52.5 7.1 13 %
Total operating expenses before losses 1 324.7 1 236.2 88.5 7 %
Provision for loan losses 1 627.4 1 324.2 303.2 23 %
Profit before tax 2 630.5 2 388.5 242.0 10 %
Tax charge 649.4 581.4 68.0 12 %
Profit after tax 1 981.1 1 807.1 174.0 10 %
Earnings per share (NOK) 10.61 9.68 0.93 10 %
Change
Change in accounting of loans in debt collection and amendment to IAS 12 – income taxes. Described in note 15 in the fourth quarter report. Comparable figures have been restated.
14Bank Norwegian AS1 Includes sales financing
Resilient balance sheet
10
50
30
20
40
70
60
0 0.3
14.7
2.2
12.4
1.6
0.5
2.3
10.6
12.0 11.8
Q4 18
10.3
2.2
28.4
0.4
Q1 19
10.0
Q3 19
0.5
29.0
Q2 19
1.7
11.3
13.4
29.8
13.9
30.3
0.5
Q4 19
27.8
Assets, BNOK
30
25
0
35
60
5
10
55
15
20
40
45
50
39.1
2.0 0.80.9
40.1
0.87.3
Q4 18 Q4 19
6.5
37.7
8.8
3.30.80.8
7.8
Q1 19
38.2
3.3
Q3 19
0.8
8.3
Q2 19
39.2
3.51.31.1
1.90.8
8.5
Liabilities and equity, BNOK
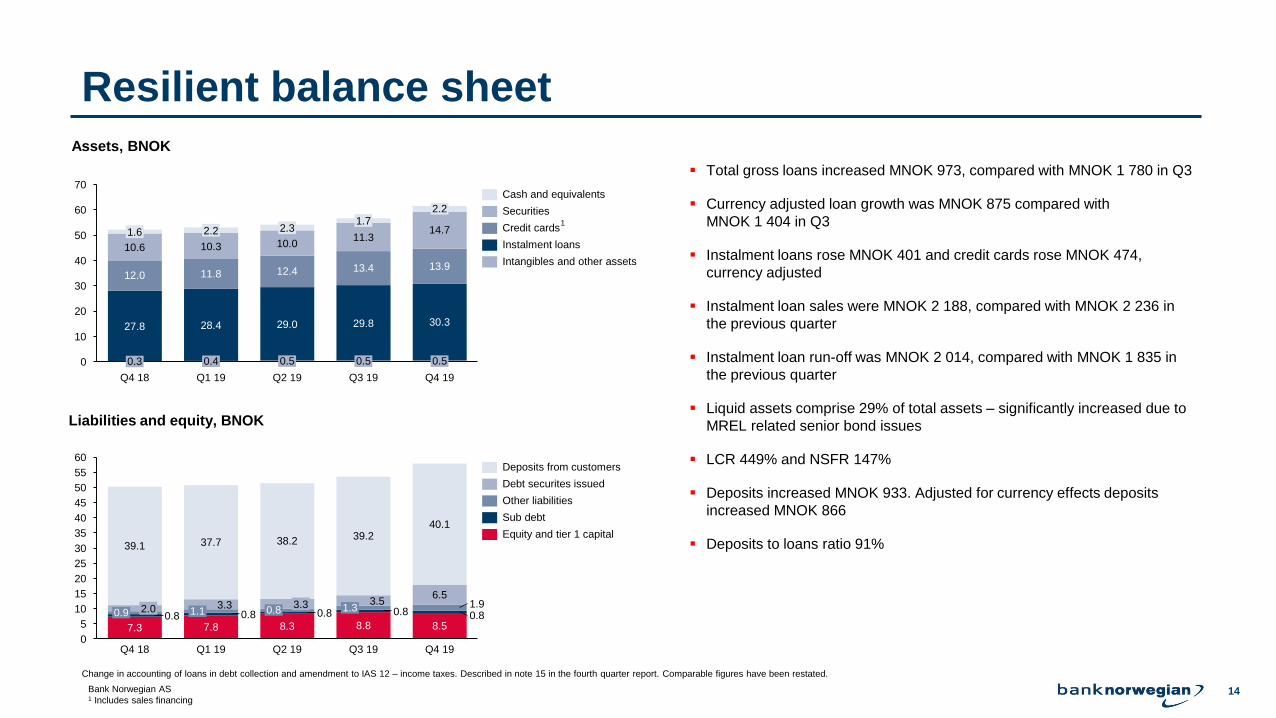
▪ Total gross loans increased MNOK 973, compared with MNOK 1 780 in Q3
▪ Currency adjusted loan growth was MNOK 875 compared with
MNOK 1 404 in Q3
▪ Instalment loans rose MNOK 401 and credit cards rose MNOK 474,
currency adjusted
▪ Instalment loan sales were MNOK 2 188, compared with MNOK 2 236 in
the previous quarter
▪ Instalment loan run-off was MNOK 2 014, compared with MNOK 1 835 in
the previous quarter
▪ Liquid assets comprise 29% of total assets – significantly increased due to
MREL related senior bond issues
▪ LCR 449% and NSFR 147%
▪ Deposits increased MNOK 933. Adjusted for currency effects deposits
increased MNOK 866
▪ Deposits to loans ratio 91%
Cash and equivalents
Credit cards
Securities
Instalment loans
Intangibles and other assets
Other liabilities
Deposits from customers
Equity and tier 1 capital
Sub debt
Debt securites issued
1
Change in accounting of loans in debt collection and amendment to IAS 12 – income taxes. Described in note 15 in the fourth quarter report. Comparable figures have been restated.
15
Stable yields and margins
0%
2%
4%
6%
8%
10%
12%
9.4%
1.2%
11.5%
7.0%
11.5%
10.5%
Q4 18
1.1%
11.3%
10.3%
7.2%
1.2%
Q1 19
10.2%
7.1%
1.3%
Q2 19
Risk-adjusted margin
10.0%
6.9%
Net interest margin
Q3 19
9.7%
6.6%
11.0%
1.2%
Q4 19
Interest income
Interest expenses
Margins as a % of average assets
Asset yield and cost of funds
0%
2%
4%
6%
8%
10%
12%
14%
16%14.2%
1.2%
1.1%
Q4 18
Debt securities cost
Deposit cost
1.2%1.2%
15.4%
Q4 19
13.5%
1.2%
Risk-adjusted total loan yield
1.5%
13.4%
1.4%
Q1 19
1.6%
10.6%
2.1%
1.3%
Q2 19
15.3%
10.5%
13.1%12.5%
10.5%
2.2%
1.2%
Q3 19
15.2%
2.4%
10.3%
13.3%
1.2%
15.4%
1.3%
Instalment loan yield
Credit card loan yield
10.8%
Liquidity yield
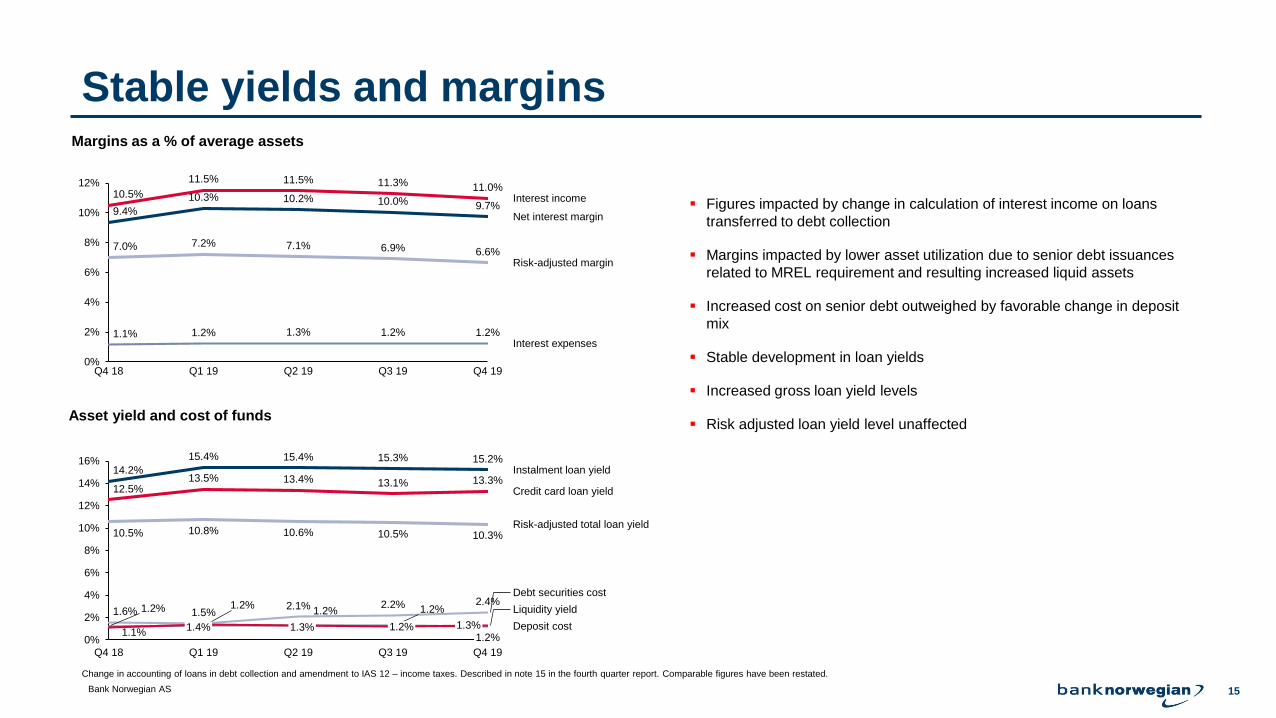
▪ Figures impacted by change in calculation of interest income on loans
transferred to debt collection
▪ Margins impacted by lower asset utilization due to senior debt issuances
related to MREL requirement and resulting increased liquid assets
▪ Increased cost on senior debt outweighed by favorable change in deposit
mix
▪ Stable development in loan yields
▪ Increased gross loan yield levels
▪ Risk adjusted loan yield level unaffected
Bank Norwegian AS
Change in accounting of loans in debt collection and amendment to IAS 12 – income taxes. Described in note 15 in the fourth quarter report. Comparable figures have been restated.
16
Strong credit metrics
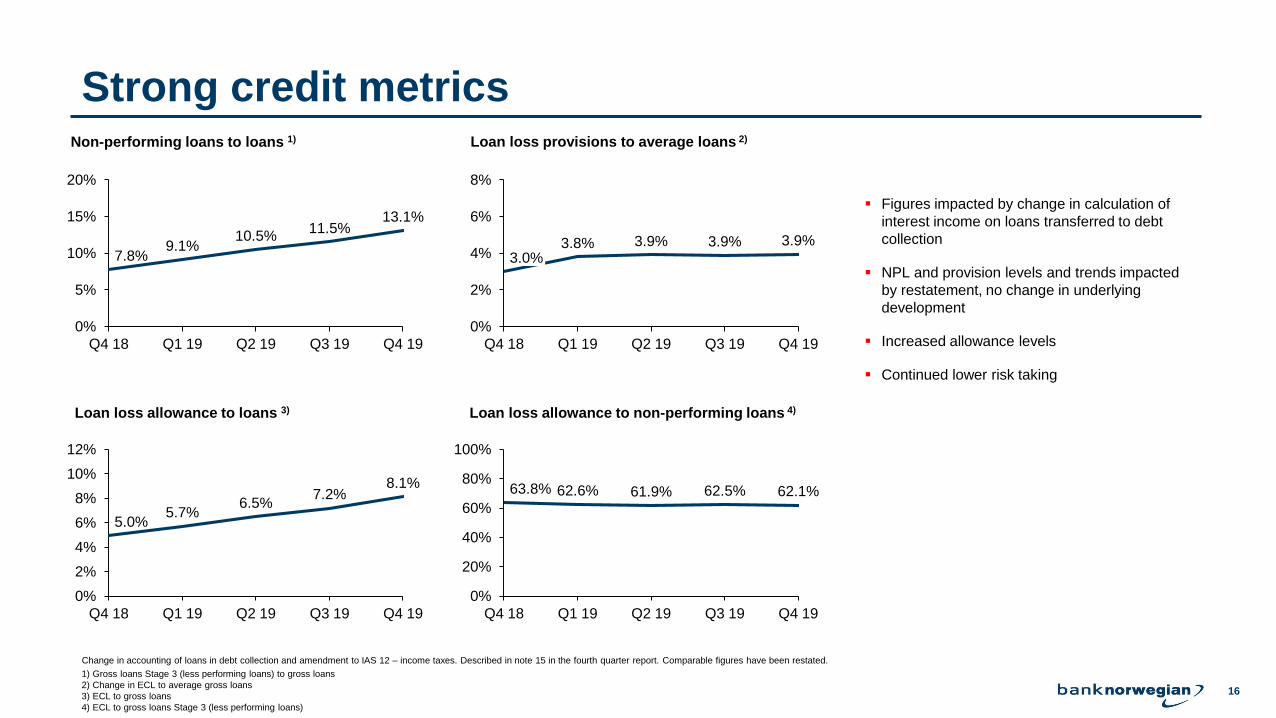
▪ Figures impacted by change in calculation of
interest income on loans transferred to debt
collection
▪ NPL and provision levels and trends impacted
by restatement, no change in underlying
development
▪ Increased allowance levels
▪ Continued lower risk taking
0%
5%
10%
15%
20%
10.5%11.5%
7.8%
Q4 18
9.1%
Q2 19Q1 19 Q3 19
13.1%
Q4 19
Loan loss provisions to average loans 2)Non-performing loans to loans 1)
Loan loss allowance to non-performing loans 4)Loan loss allowance to loans 3)
0%
2%
4%
6%
8%
3.0%
Q4 18
3.9%3.9%
Q1 19
3.8%
Q2 19 Q3 19
3.9%
Q4 19
0%
2%
4%
6%
8%
10%
12%
6.5%
Q3 19
5.0%
Q4 18 Q2 19Q1 19
5.7%
7.2%8.1%
Q4 19
0%
20%
40%
60%
80%
100%
62.5%61.9%
Q4 18
62.6%63.8%
Q2 19Q1 19 Q3 19
62.1%
Q4 19
1) Gross loans Stage 3 (less performing loans) to gross loans
2) Change in ECL to average gross loans
3) ECL to gross loans
4) ECL to gross loans Stage 3 (less performing loans)
Change in accounting of loans in debt collection and amendment to IAS 12 – income taxes. Described in note 15 in the fourth quarter report. Comparable figures have been restated.
17
High operating efficiency
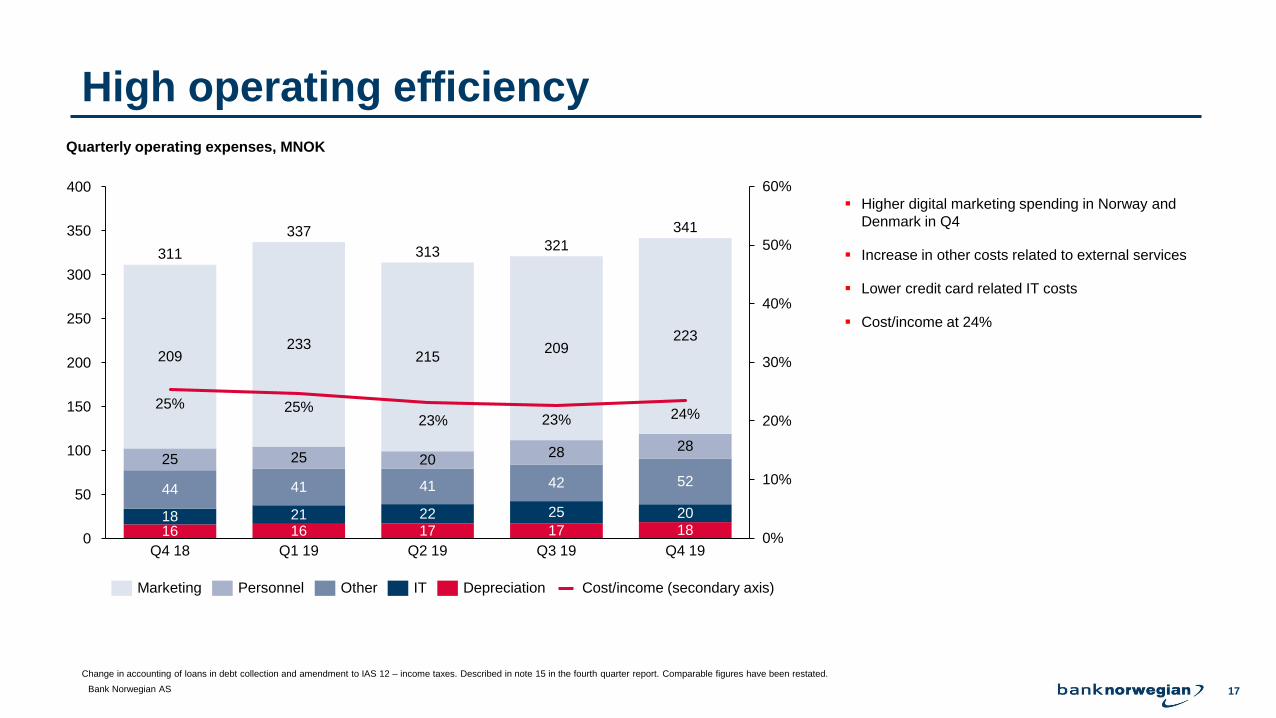
▪ Higher digital marketing spending in Norway and
Denmark in Q4
▪ Increase in other costs related to external services
▪ Lower credit card related IT costs
▪ Cost/income at 24%
Quarterly operating expenses, MNOK
25% 25%23% 23% 24%
0%
10%
20%
30%
40%
50%
60%
300
400
150
0
50
250
100
350
200
313
Q2 19
215209
25
44
181816
341
Q4 18
42
233
25
4141
2116
223
Q1 19
20
2217
209
311
28
25
Q3 19
17
52
20
Q4 19
337321
28
Marketing Personnel DepreciationOther IT Cost/income (secondary axis)
Bank Norwegian AS
Change in accounting of loans in debt collection and amendment to IAS 12 – income taxes. Described in note 15 in the fourth quarter report. Comparable figures have been restated.
18
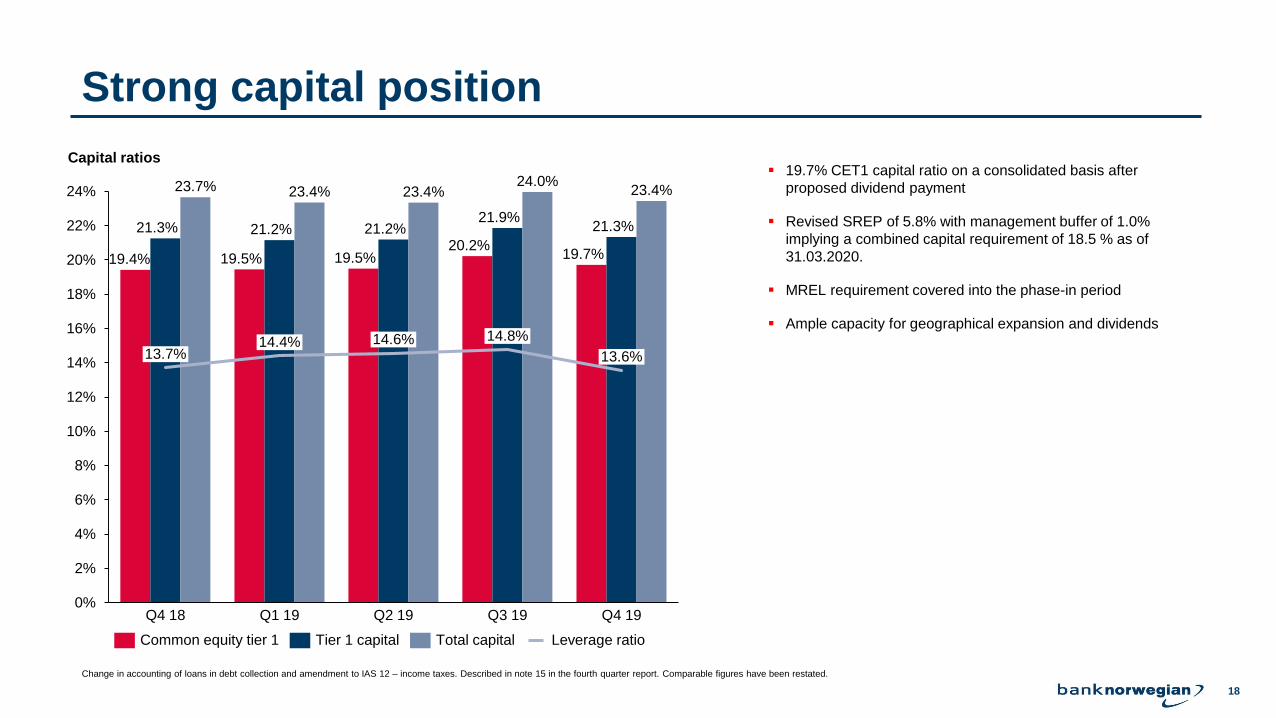
Strong capital position
▪ 19.7% CET1 capital ratio on a consolidated basis after
proposed dividend payment
▪ Revised SREP of 5.8% with management buffer of 1.0%
implying a combined capital requirement of 18.5 % as of
31.03.2020.
▪ MREL requirement covered into the phase-in period
▪ Ample capacity for geographical expansion and dividends
Capital ratios
0%
2%
4%
6%
8%
10%
12%
14%
16%
18%
20%
22%
24%
Q3 19
21.9%
14.8%14.6%14.4%
21.2%
13.7%
23.7%
Q4 19Q4 18 Q1 19 Q2 19
13.6%
19.4%
21.3%
23.4%
19.5%
21.2%
19.5%
23.4%
20.2%
24.0%
19.7%
21.3%
23.4%
Leverage ratioCommon equity tier 1 Tier 1 capital Total capital
Change in accounting of loans in debt collection and amendment to IAS 12 – income taxes. Described in note 15 in the fourth quarter report. Comparable figures have been restated.
19
Performance and events
Country overview and performance
Fourth quarter 2019 results
Outlook
Agenda
20
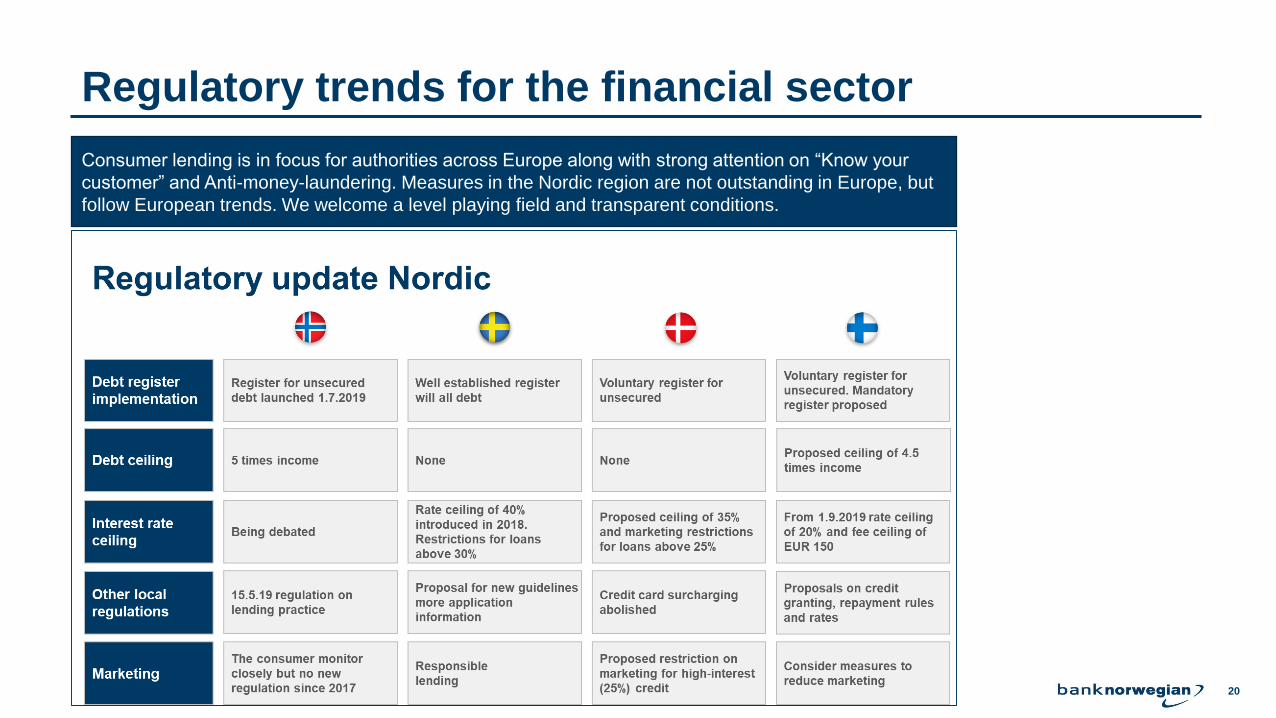
Regulatory trends for the financial sector
Consumer lending is in focus for authorities across Europe along with strong attention on “Know your
customer” and Anti-money-laundering. Measures in the Nordic region are not outstanding in Europe, but
follow European trends. We welcome a level playing field and transparent conditions.
21
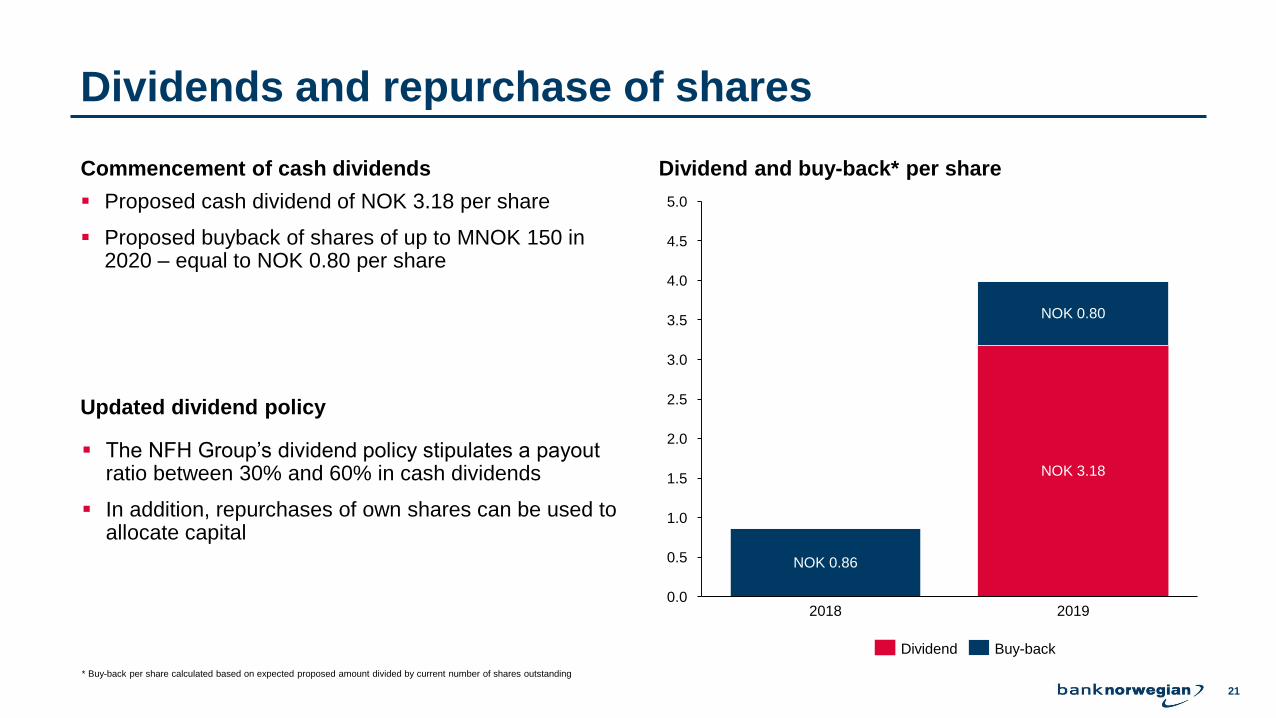
Dividends and repurchase of shares
Commencement of cash dividends Dividend and buy-back* per share
▪ Proposed cash dividend of NOK 3.18 per share
▪ Proposed buyback of shares of up to MNOK 150 in 2020 – equal to NOK 0.80 per share
Dividend Buy-back
1.0
0.0
0.5
1.5
2.0
2.5
3.0
3.5
4.0
4.5
5.0
2018 2019
NOK 3.18
NOK 0.86
NOK 0.80
* Buy-back per share calculated based on expected proposed amount divided by current number of shares outstanding
Updated dividend policy
▪ The NFH Group’s dividend policy stipulates a payout ratio between 30% and 60% in cash dividends
▪ In addition, repurchases of own shares can be used to allocate capital
22
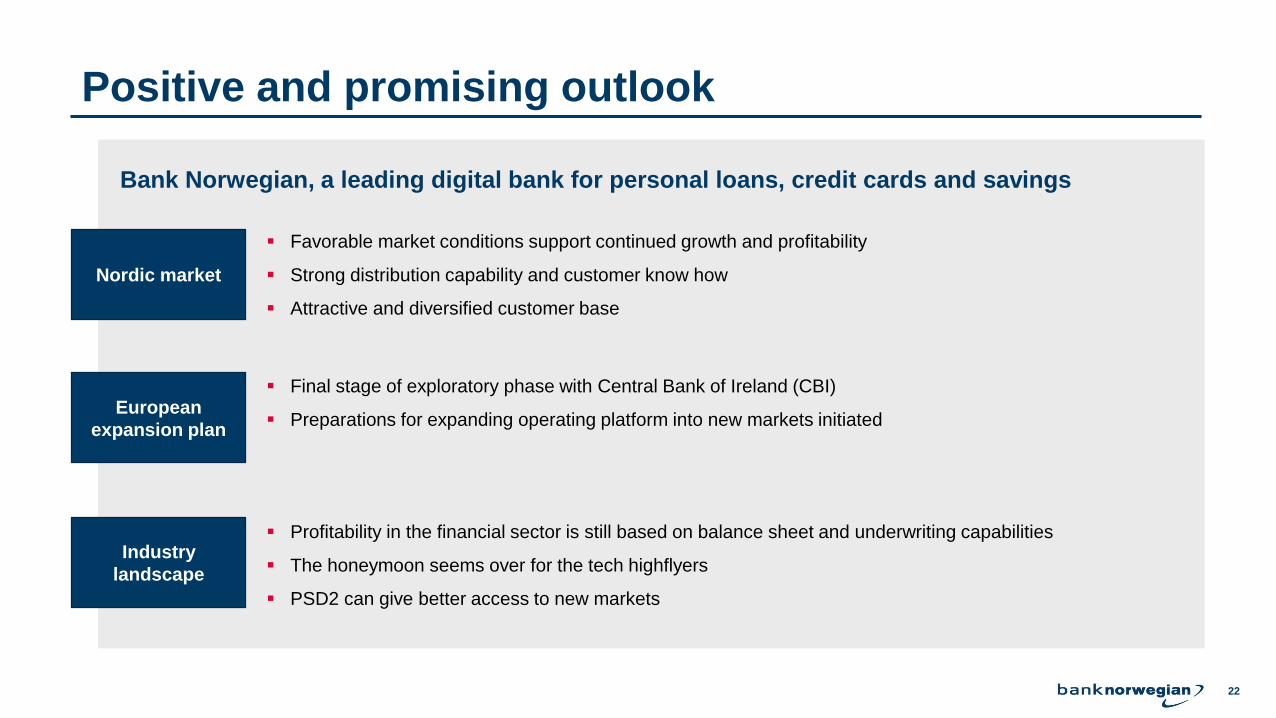
Positive and promising outlook
Nordic market
▪ Favorable market conditions support continued growth and profitability
▪ Strong distribution capability and customer know how
▪ Attractive and diversified customer base
European
expansion plan
Industry
landscape
▪ Final stage of exploratory phase with Central Bank of Ireland (CBI)
▪ Preparations for expanding operating platform into new markets initiated
▪ Profitability in the financial sector is still based on balance sheet and underwriting capabilities
▪ The honeymoon seems over for the tech highflyers
▪ PSD2 can give better access to new markets
Bank Norwegian, a leading digital bank for personal loans, credit cards and savings
23
24
Appendix
25
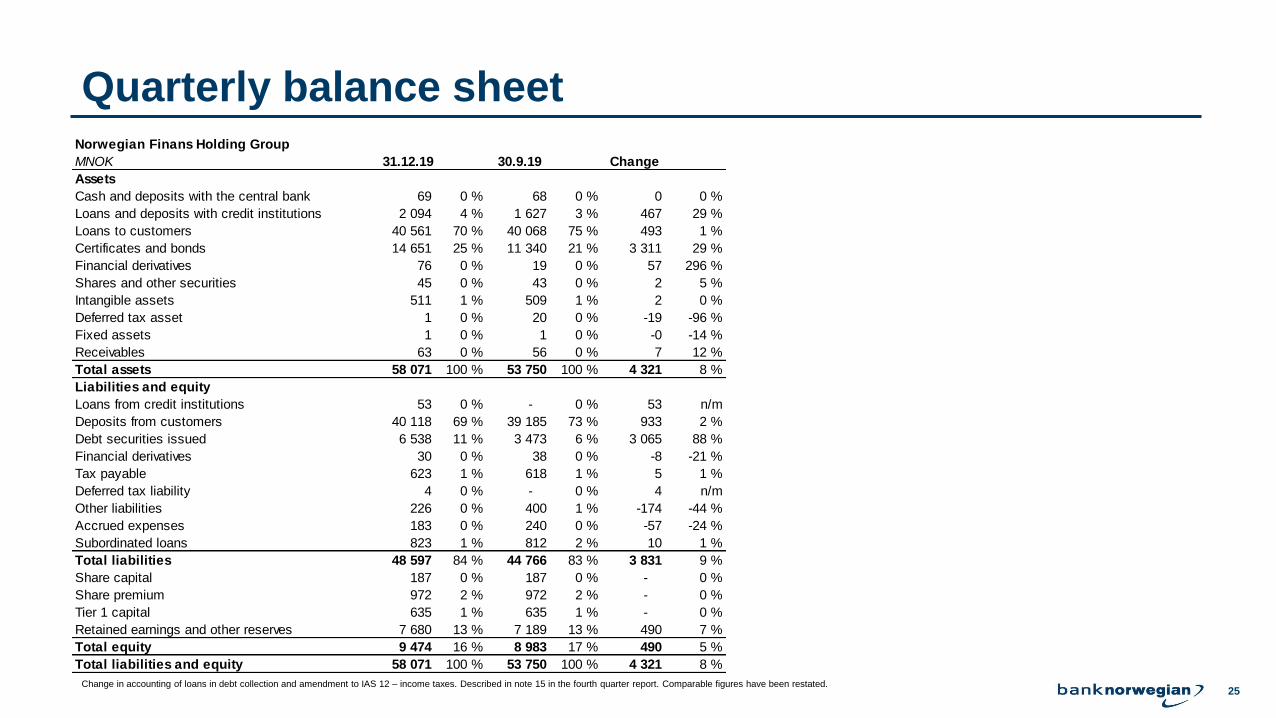
Quarterly balance sheetNorwegian Finans Holding Group
MNOK 31.12.19 30.9.19 Change
Assets
Cash and deposits with the central bank 69 0 % 68 0 % 0 0 %
Loans and deposits with credit institutions 2 094 4 % 1 627 3 % 467 29 %
Loans to customers 40 561 70 % 40 068 75 % 493 1 %
Certificates and bonds 14 651 25 % 11 340 21 % 3 311 29 %
Financial derivatives 76 0 % 19 0 % 57 296 %
Shares and other securities 45 0 % 43 0 % 2 5 %
Intangible assets 511 1 % 509 1 % 2 0 %
Deferred tax asset 1 0 % 20 0 % -19 -96 %
Fixed assets 1 0 % 1 0 % -0 -14 %
Receivables 63 0 % 56 0 % 7 12 %
Total assets 58 071 100 % 53 750 100 % 4 321 8 %
Liabilities and equity
Loans from credit institutions 53 0 % - 0 % 53 n/m
Deposits from customers 40 118 69 % 39 185 73 % 933 2 %
Debt securities issued 6 538 11 % 3 473 6 % 3 065 88 %
Financial derivatives 30 0 % 38 0 % -8 -21 %
Tax payable 623 1 % 618 1 % 5 1 %
Deferred tax liability 4 0 % - 0 % 4 n/m
Other liabilities 226 0 % 400 1 % -174 -44 %
Accrued expenses 183 0 % 240 0 % -57 -24 %
Subordinated loans 823 1 % 812 2 % 10 1 %
Total liabilities 48 597 84 % 44 766 83 % 3 831 9 %
Share capital 187 0 % 187 0 % - 0 %
Share premium 972 2 % 972 2 % - 0 %
Tier 1 capital 635 1 % 635 1 % - 0 %
Retained earnings and other reserves 7 680 13 % 7 189 13 % 490 7 %
Total equity 9 474 16 % 8 983 17 % 490 5 %
Total liabilities and equity 58 071 100 % 53 750 100 % 4 321 8 %
Change in accounting of loans in debt collection and amendment to IAS 12 – income taxes. Described in note 15 in the fourth quarter report. Comparable figures have been restated.
26
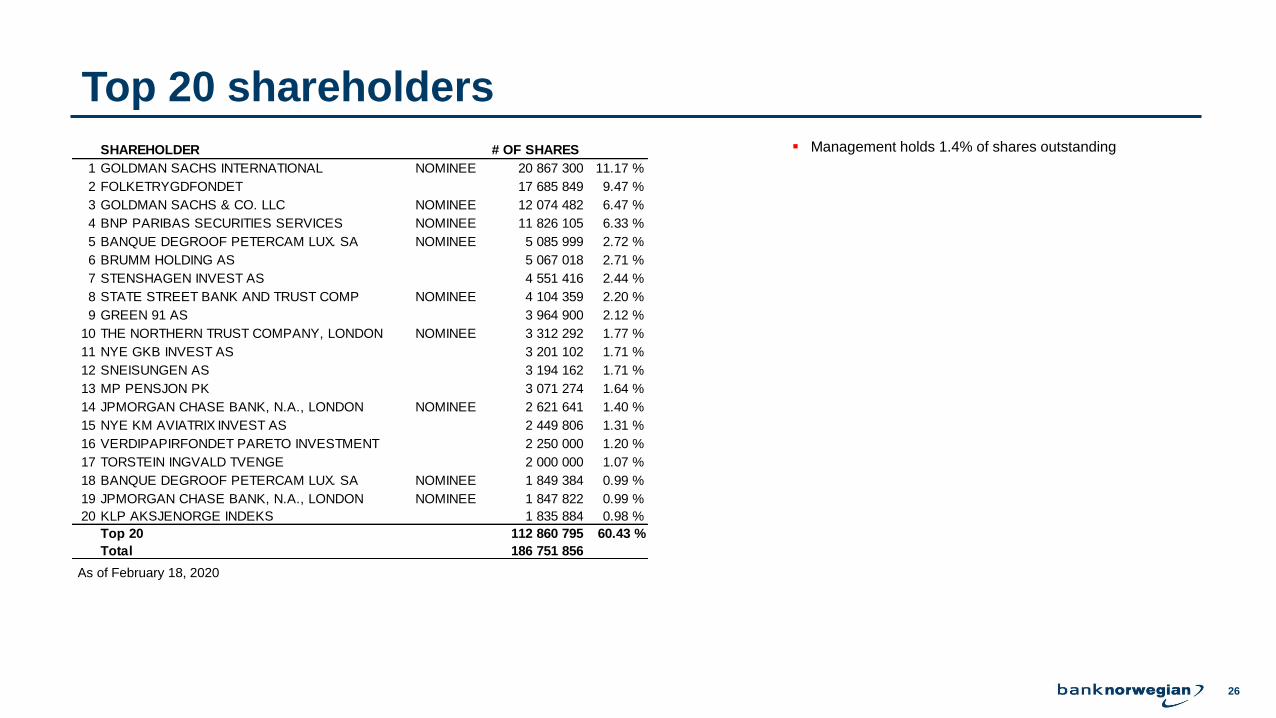
Top 20 shareholders
▪ Management holds 1.4% of shares outstanding
As of February 18, 2020
SHAREHOLDER # OF SHARES
1 GOLDMAN SACHS INTERNATIONAL NOMINEE 20 867 300 11.17 %
2 FOLKETRYGDFONDET 17 685 849 9.47 %
3 GOLDMAN SACHS & CO. LLC NOMINEE 12 074 482 6.47 %
4 BNP PARIBAS SECURITIES SERVICES NOMINEE 11 826 105 6.33 %
5 BANQUE DEGROOF PETERCAM LUX. SA NOMINEE 5 085 999 2.72 %
6 BRUMM HOLDING AS 5 067 018 2.71 %
7 STENSHAGEN INVEST AS 4 551 416 2.44 %
8 STATE STREET BANK AND TRUST COMP NOMINEE 4 104 359 2.20 %
9 GREEN 91 AS 3 964 900 2.12 %
10 THE NORTHERN TRUST COMPANY, LONDON NOMINEE 3 312 292 1.77 %
11 NYE GKB INVEST AS 3 201 102 1.71 %
12 SNEISUNGEN AS 3 194 162 1.71 %
13 MP PENSJON PK 3 071 274 1.64 %
14 JPMORGAN CHASE BANK, N.A., LONDON NOMINEE 2 621 641 1.40 %
15 NYE KM AVIATRIX INVEST AS 2 449 806 1.31 %
16 VERDIPAPIRFONDET PARETO INVESTMENT 2 250 000 1.20 %
17 TORSTEIN INGVALD TVENGE 2 000 000 1.07 %
18 BANQUE DEGROOF PETERCAM LUX. SA NOMINEE 1 849 384 0.99 %
19 JPMORGAN CHASE BANK, N.A., LONDON NOMINEE 1 847 822 0.99 %
20 KLP AKSJENORGE INDEKS 1 835 884 0.98 %
Top 20 112 860 795 60.43 %
Total 186 751 856