Embed Size (px)
Citation preview
- more -
Final
Starbucks Reports Record Fourth Quarter and Fiscal 2012 Results
Q4 Revenues up 11% to a Record $3.4 Billion Q4 EPS of $0.46; Up 24% After Excluding Non-Routine Gains in Prior Year
Strong Traffic Drives 7% US Comparable Store Sales Growth; 6% Global Growth Channel Development Revenue Grows 32%
Board Raises Quarterly Cash Dividend 24% on Strength of Business and Outlook
SEATTLE; November 1, 2012 – Starbucks Corporation (NASDAQ: SBUX) today reported financial results for its 13-week fiscal
fourth quarter and 52-week fiscal year ended September 30, 2012. When comparing with prior year results, note that fiscal 2011
included non-routine gains related to the sale of corporate real estate and the acquisition of the company’s joint venture operations
in Switzerland and Austria. A reconciliation of select FY11 GAAP measures to non-GAAP measures is included at the end of this
document.
Fiscal Fourth Quarter 2012 Highlights:
Total net revenues increased 11% to a fourth-quarter record of $3.4 billion
Global comparable store sales increased 6% driven by a 5% increase in traffic and a 1% increase in average ticket
o Americas comparable store sales increased 7% driven by 5% growth in traffic and 2% growth in average ticket
Operating margin expanded 60 basis points to 15.4% over the prior year’s operating margin of 14.8%, which included a
100 basis point benefit from a non-routine gain in Q4 FY11
o Operating margin expanded 160 basis points when compared to prior year non-GAAP operating margin of 13.8%
after excluding the non-routine gain in Q4 FY11
EPS was $0.46 per share compared to the prior year EPS of $0.47 per share, which included $0.10 relating to non-routine
gains in Q4 FY11
o Fourth quarter EPS of $0.46 grew 24% over Q4 FY11 non-GAAP EPS of $0.37 per share, which excluded the
non-routine gains in Q4 FY11
o EPS includes charges of $0.02 per share related to store portfolio optimization initiatives in Europe
The Board of Directors declared a cash dividend of $0.21 per share, a 24% increase from $0.17 per share
Fiscal Year 2012 Highlights:
Total net revenues increased 14% reaching a record $13.3 billion
Global comparable store sales increased 7% driven by a 6% increase in traffic and a 1% increase in average ticket
o Americas comparable store sales increased 8% driven by a 6% increase in traffic and a 2% increase in average
ticket
Channel Development revenue grew 50% to $1.3 billion
The company opened 1,063 net new stores globally
Operating margin improved 20 basis points to 15.0% over the prior year’s operating margin of 14.8%, which included a
non-routine gain in FY11, despite 160 basis points of impact due to higher commodity costs in FY12
- Page 2 -
- more -
o Operating margin expanded 50 basis points when compared to prior year non-GAAP operating margin of 14.5%
after excluding the non-routine gain from FY11
EPS increased 10% to $1.79 per share compared to the prior year EPS of $1.62 per share which included $0.10 relating to
non-routine gains in FY11
o EPS of $1.79 grew 18% over the prior year non-GAAP EPS of $1.52, excluding the non-routine gains in FY11
Operating cash flow totaled $1.7 billion
Starbucks returned approximately $1.1 billion to shareholders through share repurchases and dividend payments
“Our Q4 and overall 2012 fiscal year performance demonstrates the strength of our business and brand,” said Howard Schultz,
chairman, president and chief executive officer, Starbucks Coffee Company. “The resiliency and relevance of our U.S. retail
business, acceleration of the Channel Development business and expansion in Asia all contributed significantly to our strong
results. I am incredibly proud of our 200,000 Starbucks partners around the world who have contributed to the success of the
company and I am optimistic about achieving our aspirations for the future.”
“Our excellent fourth quarter and full fiscal year results reflect the strength of our business and the solid execution by our partners,
specifically illustrated in the fourth quarter by strong traffic growth, continued momentum in Channel Development, and rapid
earnings growth,” stated Troy Alstead, chief financial officer. “By delivering relevant innovation to our customers while increasing
focus on execution and operating efficiencies, we drove sales growth and expanded profit margins. On the strength of our business
in fiscal 2012 and the momentum we carry into the new fiscal year, we remain confident in our fiscal 2013 outlook of continued
strong profitable growth on a global scale.”
- Page 3 -
- more -
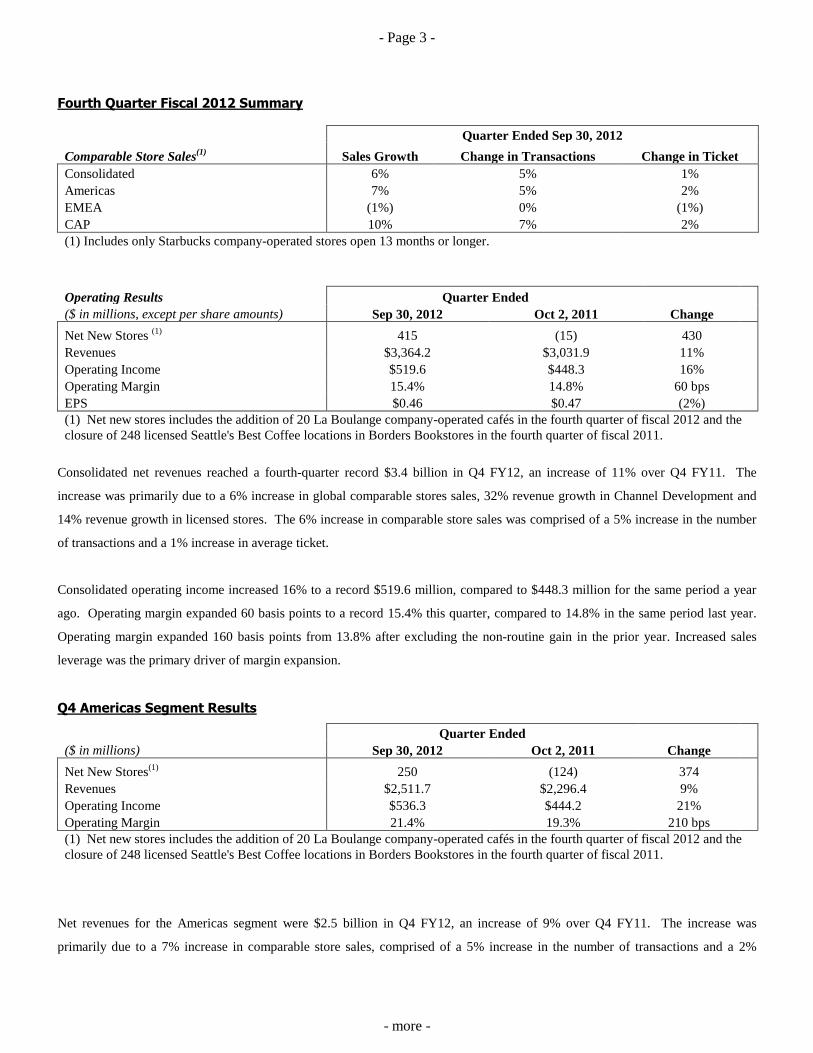
Fourth Quarter Fiscal 2012 Summary
Quarter Ended Sep 30, 2012
Comparable Store Sales(1)
Sales Growth Change in Transactions Change in Ticket
Consolidated 6% 5% 1%
Americas 7% 5% 2%
EMEA (1%) 0% (1%)
CAP 10% 7% 2%
(1) Includes only Starbucks company-operated stores open 13 months or longer.
Operating Results Quarter Ended
($ in millions, except per share amounts) Sep 30, 2012 Oct 2, 2011 Change
Net New Stores (1)
415 (15) 430
Revenues $3,364.2 $3,031.9 11%
Operating Income $519.6 $448.3 16%
Operating Margin 15.4% 14.8% 60 bps
EPS $0.46 $0.47 (2%)
(1) Net new stores includes the addition of 20 La Boulange company-operated cafés in the fourth quarter of fiscal 2012 and the
closure of 248 licensed Seattle's Best Coffee locations in Borders Bookstores in the fourth quarter of fiscal 2011.
Consolidated net revenues reached a fourth-quarter record $3.4 billion in Q4 FY12, an increase of 11% over Q4 FY11. The
increase was primarily due to a 6% increase in global comparable stores sales, 32% revenue growth in Channel Development and
14% revenue growth in licensed stores. The 6% increase in comparable store sales was comprised of a 5% increase in the number
of transactions and a 1% increase in average ticket.
Consolidated operating income increased 16% to a record $519.6 million, compared to $448.3 million for the same period a year
ago. Operating margin expanded 60 basis points to a record 15.4% this quarter, compared to 14.8% in the same period last year.
Operating margin expanded 160 basis points from 13.8% after excluding the non-routine gain in the prior year. Increased sales
leverage was the primary driver of margin expansion.
Q4 Americas Segment Results
Quarter Ended
($ in millions) Sep 30, 2012 Oct 2, 2011 Change
Net New Stores(1)
250 (124) 374
Revenues $2,511.7 $2,296.4 9%
Operating Income $536.3 $444.2 21%
Operating Margin 21.4% 19.3% 210 bps
(1) Net new stores includes the addition of 20 La Boulange company-operated cafés in the fourth quarter of fiscal 2012 and the
closure of 248 licensed Seattle's Best Coffee locations in Borders Bookstores in the fourth quarter of fiscal 2011.
Net revenues for the Americas segment were $2.5 billion in Q4 FY12, an increase of 9% over Q4 FY11. The increase was
primarily due to a 7% increase in comparable store sales, comprised of a 5% increase in the number of transactions and a 2%
- Page 4 -
- more -
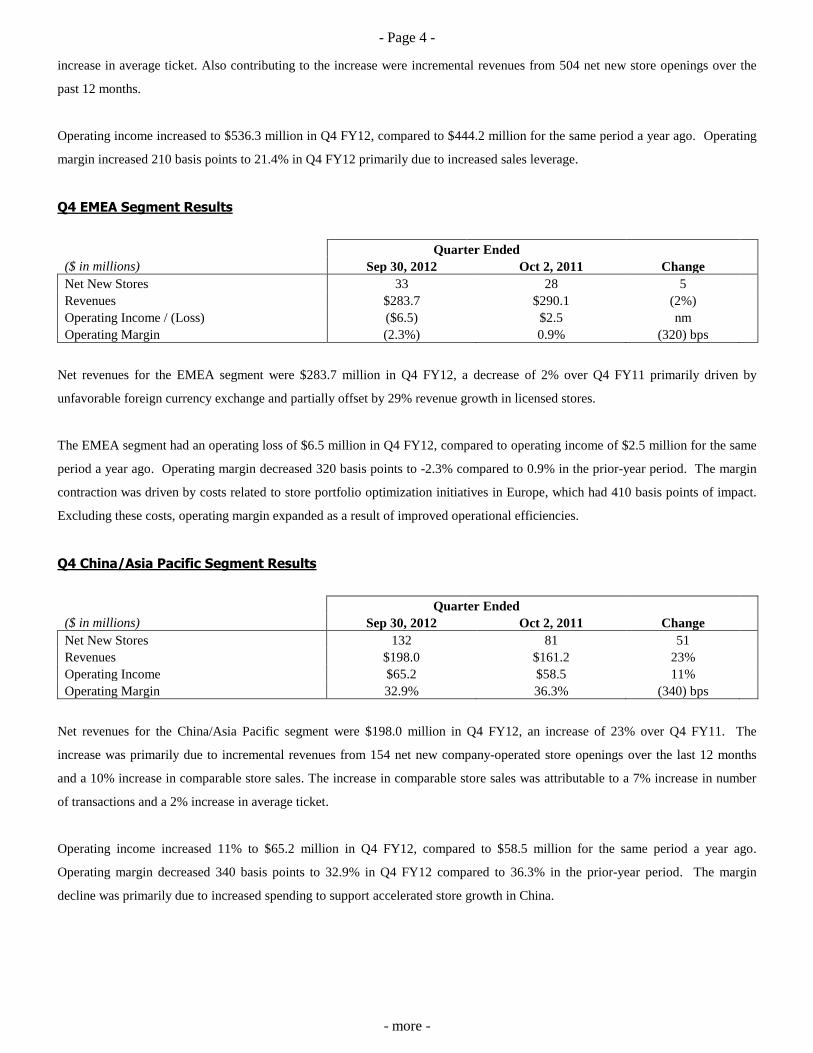
increase in average ticket. Also contributing to the increase were incremental revenues from 504 net new store openings over the
past 12 months.
Operating income increased to $536.3 million in Q4 FY12, compared to $444.2 million for the same period a year ago. Operating
margin increased 210 basis points to 21.4% in Q4 FY12 primarily due to increased sales leverage.
Q4 EMEA Segment Results
Quarter Ended
($ in millions) Sep 30, 2012 Oct 2, 2011 Change
Net New Stores 33 28 5
Revenues $283.7 $290.1 (2%)
Operating Income / (Loss) ($6.5) $2.5 nm
Operating Margin (2.3%) 0.9% (320) bps
Net revenues for the EMEA segment were $283.7 million in Q4 FY12, a decrease of 2% over Q4 FY11 primarily driven by
unfavorable foreign currency exchange and partially offset by 29% revenue growth in licensed stores.
The EMEA segment had an operating loss of $6.5 million in Q4 FY12, compared to operating income of $2.5 million for the same
period a year ago. Operating margin decreased 320 basis points to -2.3% compared to 0.9% in the prior-year period. The margin
contraction was driven by costs related to store portfolio optimization initiatives in Europe, which had 410 basis points of impact.
Excluding these costs, operating margin expanded as a result of improved operational efficiencies.
Q4 China/Asia Pacific Segment Results
Quarter Ended
($ in millions) Sep 30, 2012 Oct 2, 2011 Change
Net New Stores 132 81 51
Revenues $198.0 $161.2 23%
Operating Income $65.2 $58.5 11%
Operating Margin 32.9% 36.3% (340) bps
Net revenues for the China/Asia Pacific segment were $198.0 million in Q4 FY12, an increase of 23% over Q4 FY11. The
increase was primarily due to incremental revenues from 154 net new company-operated store openings over the last 12 months
and a 10% increase in comparable store sales. The increase in comparable store sales was attributable to a 7% increase in number
of transactions and a 2% increase in average ticket.
Operating income increased 11% to $65.2 million in Q4 FY12, compared to $58.5 million for the same period a year ago.
Operating margin decreased 340 basis points to 32.9% in Q4 FY12 compared to 36.3% in the prior-year period. The margin
decline was primarily due to increased spending to support accelerated store growth in China.
- Page 5 -
- more -
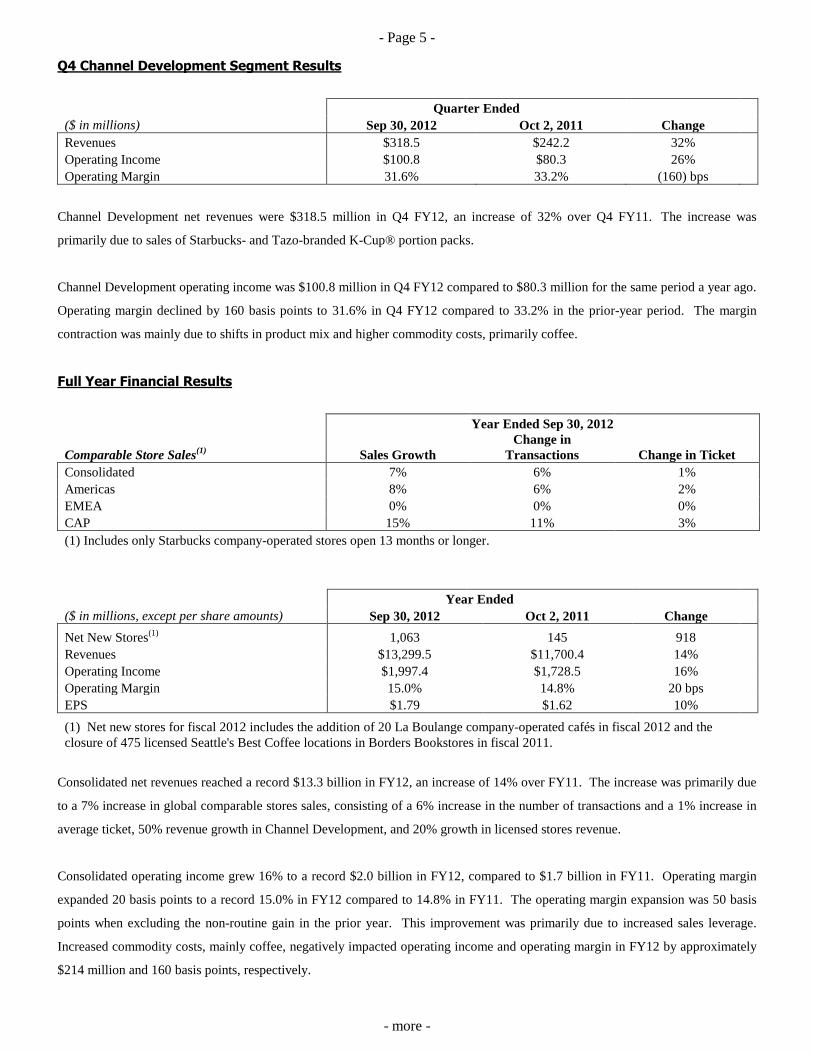
Q4 Channel Development Segment Results
Quarter Ended
($ in millions) Sep 30, 2012 Oct 2, 2011 Change
Revenues $318.5 $242.2 32%
Operating Income $100.8 $80.3 26%
Operating Margin 31.6% 33.2% (160) bps
Channel Development net revenues were $318.5 million in Q4 FY12, an increase of 32% over Q4 FY11. The increase was
primarily due to sales of Starbucks- and Tazo-branded K-Cup® portion packs.
Channel Development operating income was $100.8 million in Q4 FY12 compared to $80.3 million for the same period a year ago.
Operating margin declined by 160 basis points to 31.6% in Q4 FY12 compared to 33.2% in the prior-year period. The margin
contraction was mainly due to shifts in product mix and higher commodity costs, primarily coffee.
Full Year Financial Results
Year Ended Sep 30, 2012
Comparable Store Sales(1)
Sales Growth
Change in
Transactions Change in Ticket
Consolidated 7% 6% 1%
Americas 8% 6% 2%
EMEA 0% 0% 0%
CAP 15% 11% 3%
(1) Includes only Starbucks company-operated stores open 13 months or longer.
Year Ended
($ in millions, except per share amounts) Sep 30, 2012 Oct 2, 2011 Change
Net New Stores(1)
1,063 145 918
Revenues $13,299.5 $11,700.4 14%
Operating Income $1,997.4 $1,728.5 16%
Operating Margin 15.0% 14.8% 20 bps
EPS $1.79 $1.62 10%
(1) Net new stores for fiscal 2012 includes the addition of 20 La Boulange company-operated cafés in fiscal 2012 and the
closure of 475 licensed Seattle's Best Coffee locations in Borders Bookstores in fiscal 2011.
Consolidated net revenues reached a record $13.3 billion in FY12, an increase of 14% over FY11. The increase was primarily due
to a 7% increase in global comparable stores sales, consisting of a 6% increase in the number of transactions and a 1% increase in
average ticket, 50% revenue growth in Channel Development, and 20% growth in licensed stores revenue.
Consolidated operating income grew 16% to a record $2.0 billion in FY12, compared to $1.7 billion in FY11. Operating margin
expanded 20 basis points to a record 15.0% in FY12 compared to 14.8% in FY11. The operating margin expansion was 50 basis
points when excluding the non-routine gain in the prior year. This improvement was primarily due to increased sales leverage.
Increased commodity costs, mainly coffee, negatively impacted operating income and operating margin in FY12 by approximately
$214 million and 160 basis points, respectively.
- Page 6 -
- more -
Fiscal 2013 Targets
Starbucks has updated its fiscal 2013 targets as follows:
The company is further accelerating its store growth target through the opening of approximately 1,300 net new stores
globally, representing 22% growth over fiscal 2012.
o Maintaining its growth target of approximately 600 net new stores in the Americas, with the majority of those in
the U.S. Of the approximately 600 stores, approximately half of the additions will be licensed stores.
o Accelerating growth in China/Asia Pacific to approximately 600 net new stores, with licensed stores comprising
approximately half of the new additions. Of the approximately 600 stores, slightly more than half will be in
China.
o Maintaining growth of approximately 100 net new stores in EMEA (Europe, Middle East, Russia and Africa),
with licensed stores comprising more than two thirds of the new stores.
Starbucks continues to target approximately 10% - 13% revenue growth, driven by mid-single-digit comparable store sales
growth, approximately 1,300 net new store openings, and continued strong growth in the Channel Development business.
The company now expects full-year consolidated operating margin improvement of approximately 100 basis points over
FY12 results.
Reflecting the strength of its global business and the pipeline of profitable growth initiatives, Starbucks is raising its
earnings per share target to a range of $2.06 to $2.15, representing growth in the range of 15% - 20%, and consistent with
its long-term outlook.
Capital expenditures are now expected to be approximately $1.2 billion for the full year, reflecting the increase in new
store growth and an increase in production capacity to support recently-announced initiatives.
Company Updates
Starbucks Coffee Company and its joint venture partner in India, Tata Global Beverages Limited, opened the first three
Starbucks stores in India in October, located in Mumbai. Starbucks now operates retail stores in 61 countries around the
world.
The company opened its 700th
store in China as it continues to execute against its significant growth plans in the CAP
region.
The Verismo™ System by Starbucks was introduced and is now available at more than 6,400 locations including
participating Starbucks retail stores in the US, Canada and select international markets, Verismo.com, and specialty
retailers in the US and Canada.
Starbucks announced a partnership with Square, Inc. to provide enhancements to its mobile payment platform.
In August, Starbucks announced plans to open a high-tech juicery that will significantly expand the production and
distribution capacity of Evolution FreshTM
juices.
Evolution Fresh opened new retail locations in downtown Seattle and San Francisco. The San Francisco opening is the
first outside of the Seattle area.
Starbucks announced a partnership with Umoe Restaurant Group to open stores in Scandinavia. The first high street
locations are expected to open in 2013 in Sweden and Norway.
Starbucks hosted approximately 10,000 store managers in Houston on Oct 3-6 for its 2012 Global Leadership Conference.
The Board of Directors declared a cash dividend of $0.21 per share, an increase from $0.17 per share, payable on
November 30, 2012, to shareholders of record as of November 15, 2012.
The company repurchased approximately 12 million shares of common stock in fiscal 2012; approximately 12 million
shares remain available for purchase under previous authorizations.
- Page 7 -
- more -
Conference Call
Starbucks will be holding a conference call today at 2:00 p.m. Pacific Time, which will be hosted by Howard Schultz, chairman,
president and ceo, Michelle Gass, president, Starbucks Coffee EMEA and Troy Alstead, cfo. The call will be broadcast live over
the Internet and can be accessed at the company’s web site address of http://investor.starbucks.com. A replay of the call will be
available via telephone through 9:00 p.m. Pacific Time on Friday, November 2, 2012 by calling 1-855-859-2056, reservation
number 99153013. A replay of the webcast will also be available via the Investor Relations page on Starbucks.com through
approximately 5:00 p.m. Pacific Time on Friday, November 30, 2012 at the following URL: http://investor.starbucks.com.
The company’s consolidated statements of earnings, operating segment results, and other additional information have been
provided on the following pages in accordance with current year classifications. This information should be reviewed in
conjunction with this press release. Please refer to the company’s Annual Report on Form 10-K for the fiscal year ended
October 2, 2011 for additional information.
About Starbucks Since 1971, Starbucks Coffee Company has been committed to ethically sourcing and roasting the highest quality arabica coffee in
the world. Today, with stores around the globe, the company is the premier roaster and retailer of specialty coffee in the world.
Through our unwavering commitment to excellence and our guiding principles, we bring the unique Starbucks Experience to life
for every customer through every cup. To share in the experience, please visit us in our stores or online at www.starbucks.com.
Forward-Looking Statements This release contains forward-looking statements relating to certain company initiatives, strategies and plans, as well as trends in or
expectations regarding, earnings per share, revenues, shareholder value, operational improvements and efficiencies, diversified
business model, changes to the organizational and leadership structures, business momentum, growth and growth opportunities
overall and of specific businesses, markets and channels, sales leverage, store traffic, average ticket, overall performance of new
and existing stores, loyalty programs, operating margins, profits, capital expenditures, operating costs, charges, comparable store
sales, store openings and closings, the strength, health and potential of our business and brand, product innovations, store
experience, tax rate and commodity costs and their impact. These forward-looking statements are based on currently available
operating, financial and competitive information and are subject to a number of significant risks and uncertainties. Actual future
results may differ materially depending on a variety of factors including, but not limited to, coffee, dairy and other raw material
prices and availability, costs associated with, and the successful execution of, the company’s initiatives, strategies and plans, the
acceptance of the company’s products by our customers, fluctuations in U.S. and international economies and currencies, the
impact of competition, the effect of legal proceedings, and other risks detailed in the company filings with the Securities and
Exchange Commission, including the “Risk Factors” section of Starbucks Annual Report on Form 10-K for the fiscal year ended
October 2, 2011. The company assumes no obligation to update any of these forward-looking statements.
Contacts: Starbucks Contact, Investor Relations: Starbucks Contact, Media: JoAnn DeGrande Zack Hutson
206-318-7118 206-318-7100 [email protected] [email protected]
- Page 8 -
- more -
% September October 2,
Change 2012 2011
Net revenues:
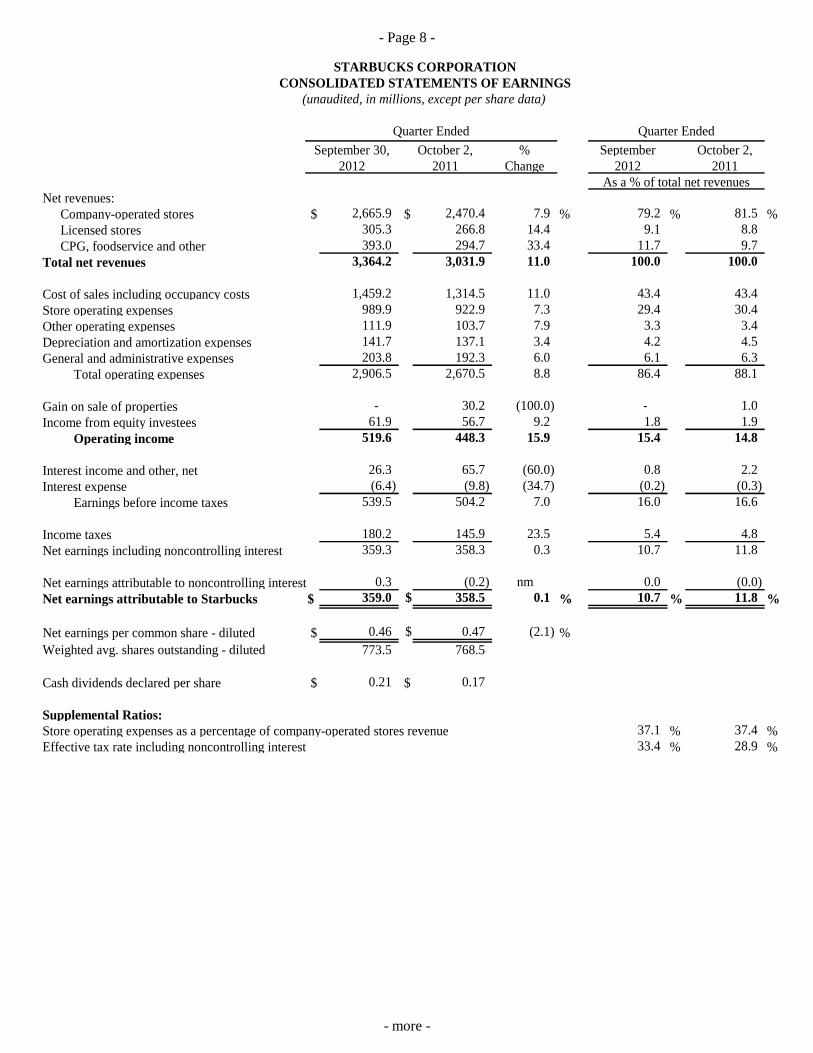
Company-operated stores $ 2,665.9 $ 2,470.4 7.9 % 79.2 % 81.5 %
Licensed stores 305.3 266.8 14.4 9.1 8.8
CPG, foodservice and other 393.0 294.7 33.4 11.7 9.7
Total net revenues 3,364.2 3,031.9 11.0 100.0 100.0
Cost of sales including occupancy costs 1,459.2 1,314.5 11.0 43.4 43.4
Store operating expenses 989.9 922.9 7.3 29.4 30.4
Other operating expenses 111.9 103.7 7.9 3.3 3.4
Depreciation and amortization expenses 141.7 137.1 3.4 4.2 4.5
General and administrative expenses 203.8 192.3 6.0 6.1 6.3
Total operating expenses 2,906.5 2,670.5 8.8 86.4 88.1
Gain on sale of properties - 30.2 (100.0) - 1.0
Income from equity investees 61.9 56.7 9.2 1.8 1.9
Operating income 519.6 448.3 15.9 15.4 14.8
Interest income and other, net 26.3 65.7 (60.0) 0.8 2.2
Interest expense (6.4) (9.8) (34.7) (0.2) (0.3)
Earnings before income taxes 539.5 504.2 7.0 16.0 16.6
Income taxes 180.2 145.9 23.5 5.4 4.8
Net earnings including noncontrolling interest 359.3 358.3 0.3 10.7 11.8
Net earnings attributable to noncontrolling interest 0.3 (0.2) nm 0.0 (0.0)
Net earnings attributable to Starbucks $ 359.0 $ 358.5 0.1 % 10.7 % 11.8 %
Net earnings per common share - diluted $ 0.46 $ 0.47 (2.1) %
Weighted avg. shares outstanding - diluted 773.5 768.5
Cash dividends declared per share $ 0.21 $ 0.17
Supplemental Ratios:
Store operating expenses as a percentage of company-operated stores revenue 37.1 % 37.4 %
Effective tax rate including noncontrolling interest 33.4 % 28.9 %
STARBUCKS CORPORATION
CONSOLIDATED STATEMENTS OF EARNINGS
(unaudited, in millions, except per share data)
Quarter Ended Quarter Ended
As a % of total net revenues
September 30, October 2,
2012 2011
- Page 9 -
- more -
% September October 2,
Change 2012 2011
Net revenues:
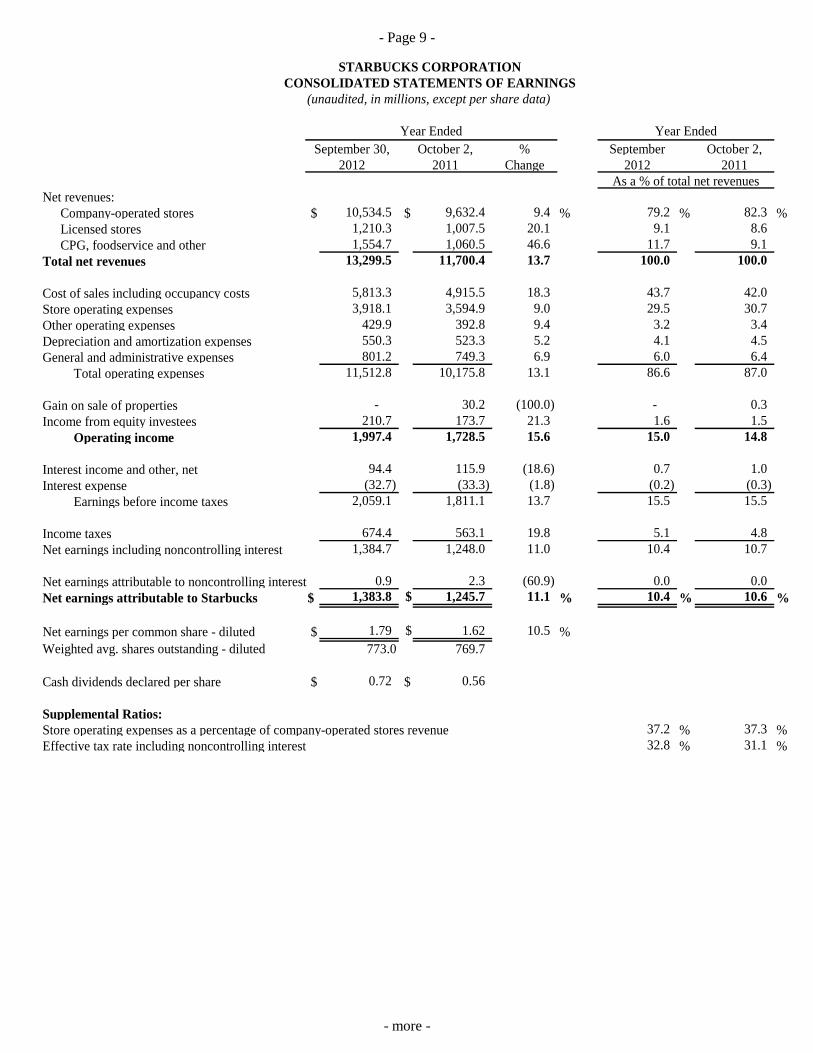
Company-operated stores $ 10,534.5 $ 9,632.4 9.4 % 79.2 % 82.3 %
Licensed stores 1,210.3 1,007.5 20.1 9.1 8.6
CPG, foodservice and other 1,554.7 1,060.5 46.6 11.7 9.1
Total net revenues 13,299.5 11,700.4 13.7 100.0 100.0
Cost of sales including occupancy costs 5,813.3 4,915.5 18.3 43.7 42.0
Store operating expenses 3,918.1 3,594.9 9.0 29.5 30.7
Other operating expenses 429.9 392.8 9.4 3.2 3.4
Depreciation and amortization expenses 550.3 523.3 5.2 4.1 4.5
General and administrative expenses 801.2 749.3 6.9 6.0 6.4
Total operating expenses 11,512.8 10,175.8 13.1 86.6 87.0
Gain on sale of properties - 30.2 (100.0) - 0.3
Income from equity investees 210.7 173.7 21.3 1.6 1.5
Operating income 1,997.4 1,728.5 15.6 15.0 14.8
Interest income and other, net 94.4 115.9 (18.6) 0.7 1.0
Interest expense (32.7) (33.3) (1.8) (0.2) (0.3)
Earnings before income taxes 2,059.1 1,811.1 13.7 15.5 15.5
Income taxes 674.4 563.1 19.8 5.1 4.8
Net earnings including noncontrolling interest 1,384.7 1,248.0 11.0 10.4 10.7
Net earnings attributable to noncontrolling interest 0.9 2.3 (60.9) 0.0 0.0
Net earnings attributable to Starbucks $ 1,383.8 $ 1,245.7 11.1 % 10.4 % 10.6 %
Net earnings per common share - diluted $ 1.79 $ 1.62 10.5 %
Weighted avg. shares outstanding - diluted 773.0 769.7
Cash dividends declared per share $ 0.72 $ 0.56
Supplemental Ratios:
Store operating expenses as a percentage of company-operated stores revenue 37.2 % 37.3 %
Effective tax rate including noncontrolling interest 32.8 % 31.1 %
As a % of total net revenues
2011
Year Ended Year Ended
September 30, October 2,
2012
CONSOLIDATED STATEMENTS OF EARNINGS
STARBUCKS CORPORATION
(unaudited, in millions, except per share data)
- Page 10 -
- more -
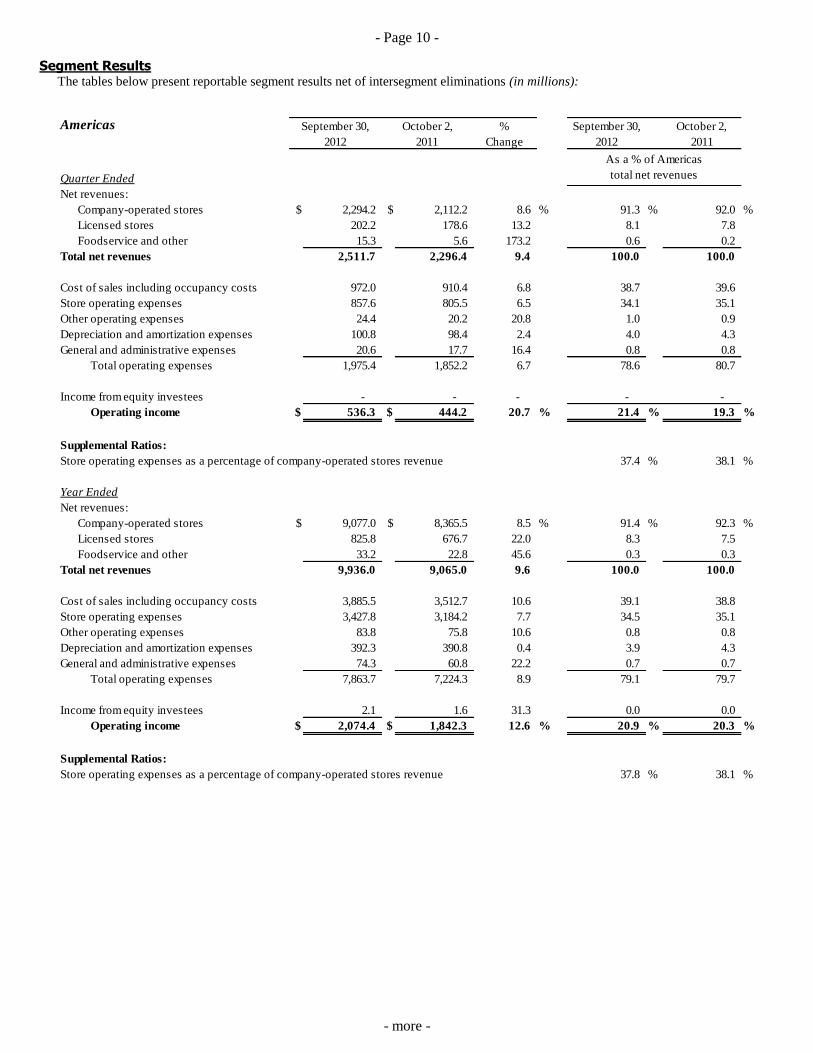
Segment Results The tables below present reportable segment results net of intersegment eliminations (in millions):
Americas % September 30, October 2,
Change 2012 2011
Quarter Ended
Net revenues:
Company-operated stores $ 2,294.2 $ 2,112.2 8.6 % 91.3 % 92.0 %
Licensed stores 202.2 178.6 13.2 8.1 7.8
Foodservice and other 15.3 5.6 173.2 0.6 0.2
Total net revenues 2,511.7 2,296.4 9.4 100.0 100.0
Cost of sales including occupancy costs 972.0 910.4 6.8 38.7 39.6
Store operating expenses 857.6 805.5 6.5 34.1 35.1
Other operating expenses 24.4 20.2 20.8 1.0 0.9
Depreciation and amortization expenses 100.8 98.4 2.4 4.0 4.3
General and administrative expenses 20.6 17.7 16.4 0.8 0.8
Total operating expenses 1,975.4 1,852.2 6.7 78.6 80.7
Income from equity investees - - - - -
Operating income $ 536.3 $ 444.2 20.7 % 21.4 % 19.3 %
Supplemental Ratios:
Store operating expenses as a percentage of company-operated stores revenue 37.4 % 38.1 %
Year Ended
Net revenues:
Company-operated stores $ 9,077.0 $ 8,365.5 8.5 % 91.4 % 92.3 %
Licensed stores 825.8 676.7 22.0 8.3 7.5
Foodservice and other 33.2 22.8 45.6 0.3 0.3
Total net revenues 9,936.0 9,065.0 9.6 100.0 100.0
Cost of sales including occupancy costs 3,885.5 3,512.7 10.6 39.1 38.8
Store operating expenses 3,427.8 3,184.2 7.7 34.5 35.1
Other operating expenses 83.8 75.8 10.6 0.8 0.8
Depreciation and amortization expenses 392.3 390.8 0.4 3.9 4.3
General and administrative expenses 74.3 60.8 22.2 0.7 0.7
Total operating expenses 7,863.7 7,224.3 8.9 79.1 79.7
Income from equity investees 2.1 1.6 31.3 0.0 0.0
Operating income $ 2,074.4 $ 1,842.3 12.6 % 20.9 % 20.3 %
Supplemental Ratios:
Store operating expenses as a percentage of company-operated stores revenue 37.8 % 38.1 %
As a % of Americas
total net revenues
October 2,
2012
September 30,
2011
- Page 11 -
- more -
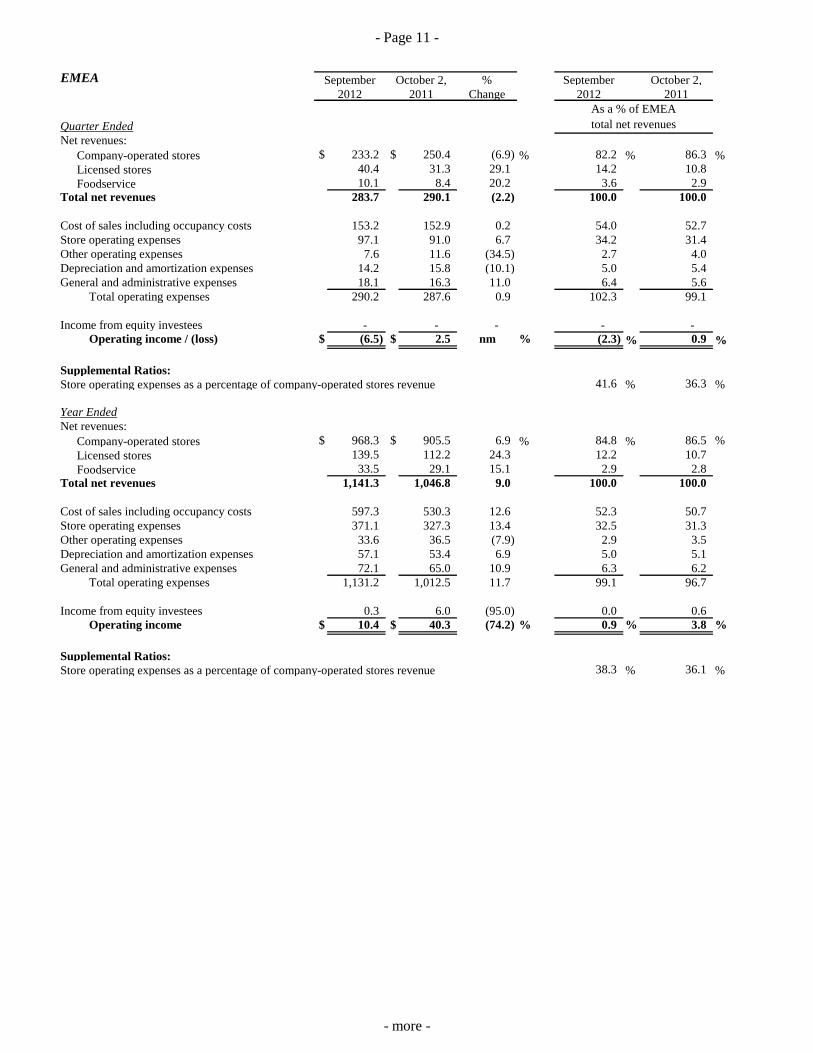
EMEA % September October 2,
Change 2012 2011
Quarter Ended
Net revenues:
Company-operated stores $ 233.2 $ 250.4 (6.9) % 82.2 % 86.3 %
Licensed stores 40.4 31.3 29.1 14.2 10.8
Foodservice 10.1 8.4 20.2 3.6 2.9
Total net revenues 283.7 290.1 (2.2) 100.0 100.0
Cost of sales including occupancy costs 153.2 152.9 0.2 54.0 52.7
Store operating expenses 97.1 91.0 6.7 34.2 31.4
Other operating expenses 7.6 11.6 (34.5) 2.7 4.0
Depreciation and amortization expenses 14.2 15.8 (10.1) 5.0 5.4
General and administrative expenses 18.1 16.3 11.0 6.4 5.6
Total operating expenses 290.2 287.6 0.9 102.3 99.1
Income from equity investees - - - - -
Operating income / (loss) $ (6.5) $ 2.5 nm % (2.3) % 0.9 %
Supplemental Ratios:
Store operating expenses as a percentage of company-operated stores revenue 41.6 % 36.3 %
Year Ended
Net revenues:
Company-operated stores $ 968.3 $ 905.5 6.9 % 84.8 % 86.5 %
Licensed stores 139.5 112.2 24.3 12.2 10.7
Foodservice 33.5 29.1 15.1 2.9 2.8
Total net revenues 1,141.3 1,046.8 9.0 100.0 100.0
Cost of sales including occupancy costs 597.3 530.3 12.6 52.3 50.7
Store operating expenses 371.1 327.3 13.4 32.5 31.3
Other operating expenses 33.6 36.5 (7.9) 2.9 3.5
Depreciation and amortization expenses 57.1 53.4 6.9 5.0 5.1
General and administrative expenses 72.1 65.0 10.9 6.3 6.2
Total operating expenses 1,131.2 1,012.5 11.7 99.1 96.7
Income from equity investees 0.3 6.0 (95.0) 0.0 0.6
Operating income $ 10.4 $ 40.3 (74.2) % 0.9 % 3.8 %
Supplemental Ratios:
Store operating expenses as a percentage of company-operated stores revenue 38.3 % 36.1 %
2011
September October 2,
2012
As a % of EMEA
total net revenues
- Page 12 -
- more -
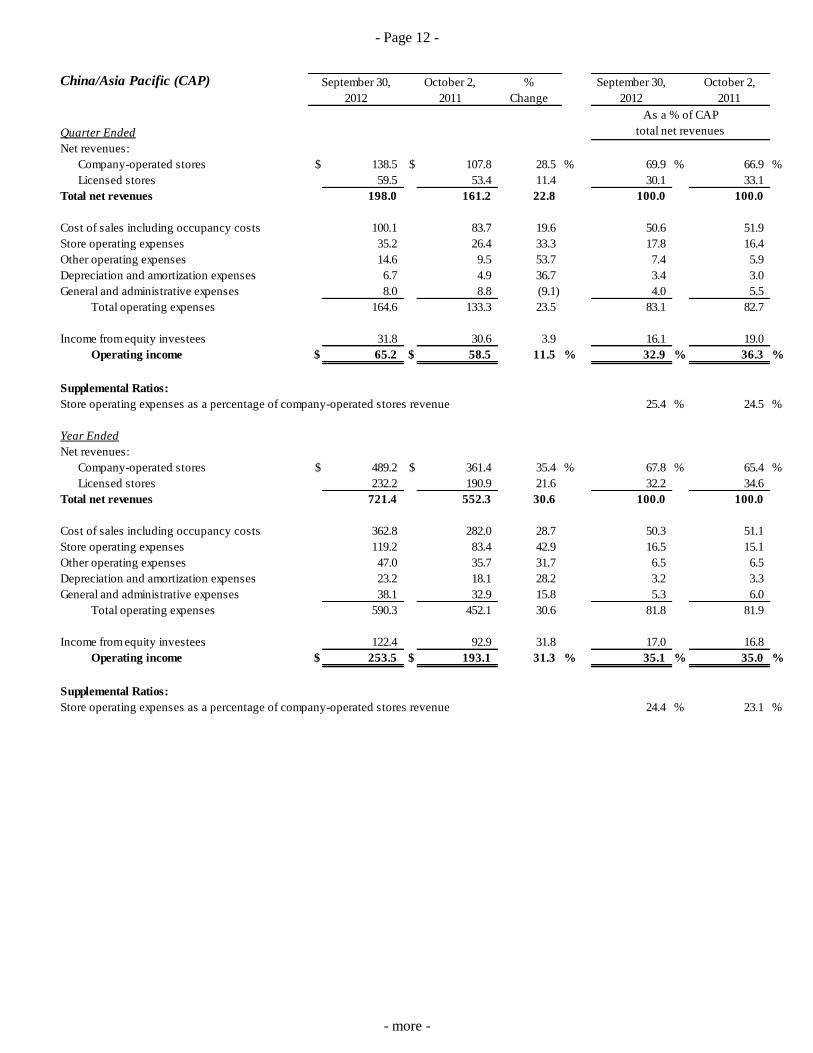
China/Asia Pacific (CAP) % September 30, October 2,
Change 2012 2011
Quarter Ended
Net revenues:
Company-operated stores $ 138.5 $ 107.8 28.5 % 69.9 % 66.9 %
Licensed stores 59.5 53.4 11.4 30.1 33.1
Total net revenues 198.0 161.2 22.8 100.0 100.0
Cost of sales including occupancy costs 100.1 83.7 19.6 50.6 51.9
Store operating expenses 35.2 26.4 33.3 17.8 16.4
Other operating expenses 14.6 9.5 53.7 7.4 5.9
Depreciation and amortization expenses 6.7 4.9 36.7 3.4 3.0
General and administrative expenses 8.0 8.8 (9.1) 4.0 5.5
Total operating expenses 164.6 133.3 23.5 83.1 82.7
Income from equity investees 31.8 30.6 3.9 16.1 19.0
Operating income $ 65.2 $ 58.5 11.5 % 32.9 % 36.3 %
Supplemental Ratios:
Store operating expenses as a percentage of company-operated stores revenue 25.4 % 24.5 %
Year Ended
Net revenues:
Company-operated stores $ 489.2 $ 361.4 35.4 % 67.8 % 65.4 %
Licensed stores 232.2 190.9 21.6 32.2 34.6
Total net revenues 721.4 552.3 30.6 100.0 100.0
Cost of sales including occupancy costs 362.8 282.0 28.7 50.3 51.1
Store operating expenses 119.2 83.4 42.9 16.5 15.1
Other operating expenses 47.0 35.7 31.7 6.5 6.5
Depreciation and amortization expenses 23.2 18.1 28.2 3.2 3.3
General and administrative expenses 38.1 32.9 15.8 5.3 6.0
Total operating expenses 590.3 452.1 30.6 81.8 81.9
Income from equity investees 122.4 92.9 31.8 17.0 16.8
Operating income $ 253.5 $ 193.1 31.3 % 35.1 % 35.0 %
Supplemental Ratios:
Store operating expenses as a percentage of company-operated stores revenue 24.4 % 23.1 %
As a % of CAP
total net revenues
September 30, October 2,
2012 2011
- Page 13 -
- more -
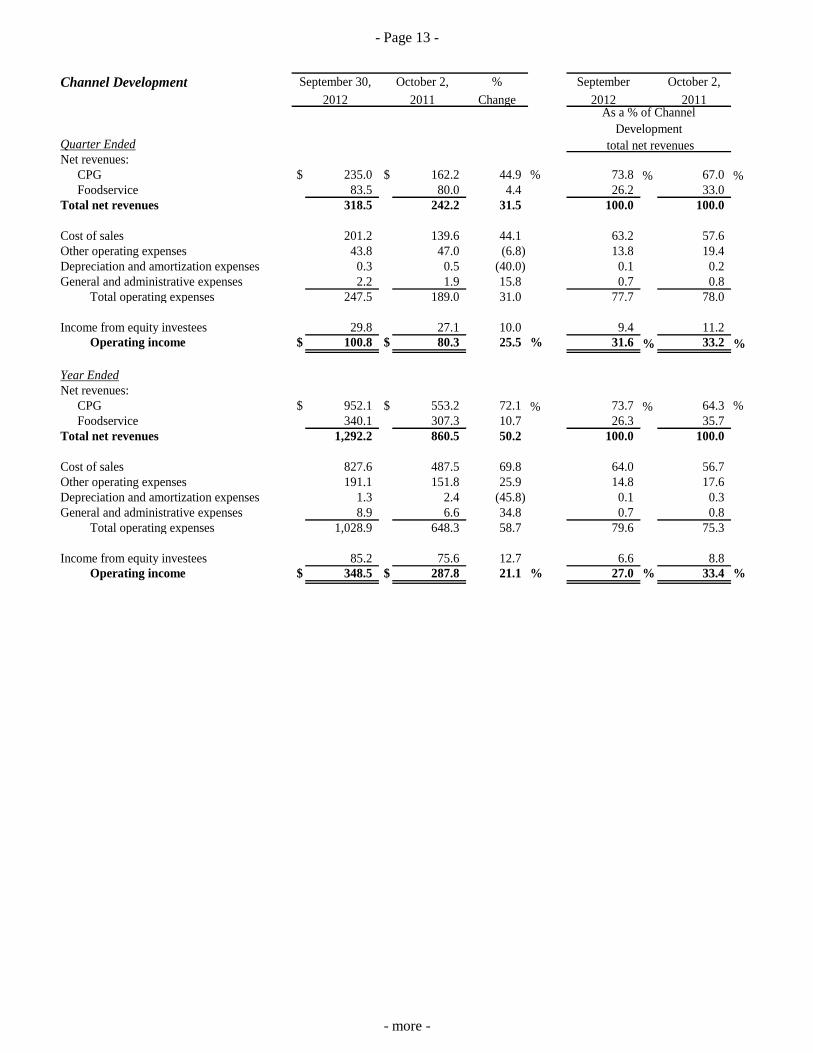
Channel Development % September
30,
October 2,
Change 2012 2011
Quarter Ended
Net revenues:
CPG $ 235.0 $ 162.2 44.9 % 73.8 % 67.0 %Foodservice 83.5 80.0 4.4 26.2 33.0
Total net revenues 318.5 242.2 31.5 100.0 100.0
Cost of sales 201.2 139.6 44.1 63.2 57.6
Other operating expenses 43.8 47.0 (6.8) 13.8 19.4
Depreciation and amortization expenses 0.3 0.5 (40.0) 0.1 0.2
General and administrative expenses 2.2 1.9 15.8 0.7 0.8
Total operating expenses 247.5 189.0 31.0 77.7 78.0
Income from equity investees 29.8 27.1 10.0 9.4 11.2
Operating income $ 100.8 $ 80.3 25.5 % 31.6 % 33.2 %
Year Ended
Net revenues:
CPG $ 952.1 $ 553.2 72.1 % 73.7 % 64.3 %
Foodservice 340.1 307.3 10.7 26.3 35.7
Total net revenues 1,292.2 860.5 50.2 100.0 100.0
Cost of sales 827.6 487.5 69.8 64.0 56.7
Other operating expenses 191.1 151.8 25.9 14.8 17.6
Depreciation and amortization expenses 1.3 2.4 (45.8) 0.1 0.3
General and administrative expenses 8.9 6.6 34.8 0.7 0.8
Total operating expenses 1,028.9 648.3 58.7 79.6 75.3
Income from equity investees 85.2 75.6 12.7 6.6 8.8
Operating income $ 348.5 $ 287.8 21.1 % 27.0 % 33.4 %
September 30, October 2,
2012 2011As a % of Channel
Development
total net revenues
- Page 14 -
- more -
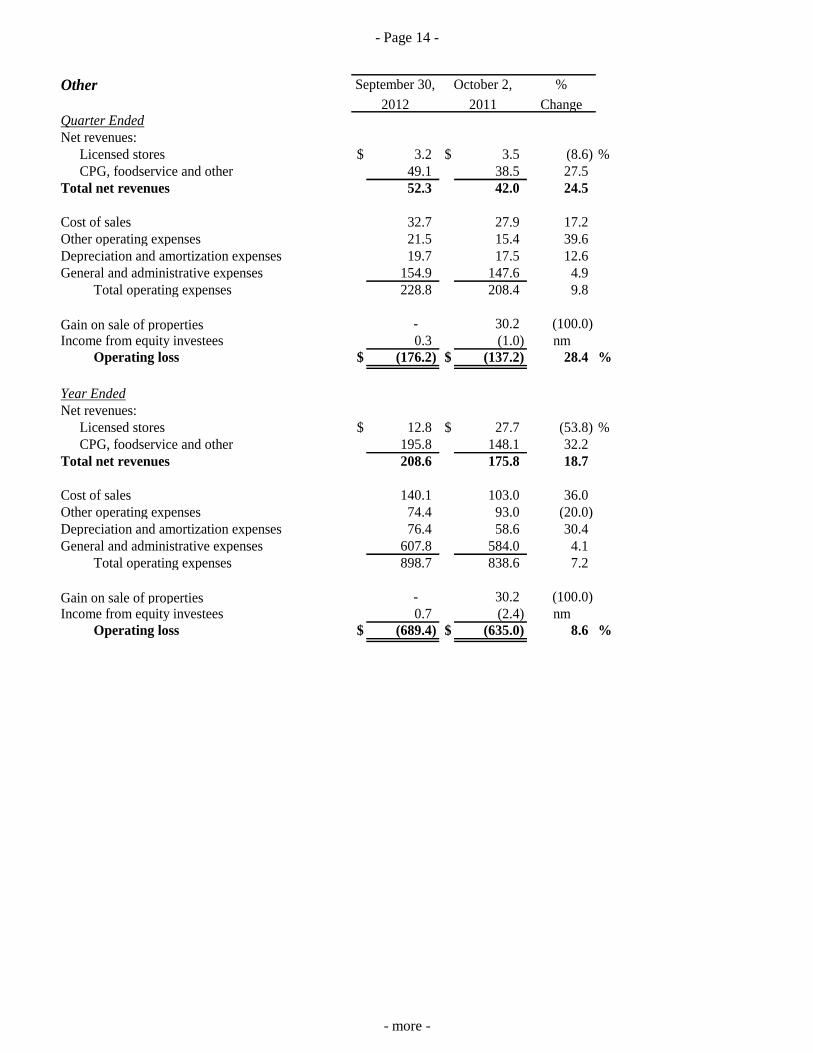
Other %
ChangeQuarter Ended
Net revenues:
Licensed stores $ 3.2 $ 3.5 (8.6) %
CPG, foodservice and other 49.1 38.5 27.5
Total net revenues 52.3 42.0 24.5
Cost of sales 32.7 27.9 17.2
Other operating expenses 21.5 15.4 39.6
Depreciation and amortization expenses 19.7 17.5 12.6
General and administrative expenses 154.9 147.6 4.9
Total operating expenses 228.8 208.4 9.8
Gain on sale of properties - 30.2 (100.0)
Income from equity investees 0.3 (1.0) nm
Operating loss $ (176.2) $ (137.2) 28.4 %
Year Ended
Net revenues:
Licensed stores $ 12.8 $ 27.7 (53.8) %
CPG, foodservice and other 195.8 148.1 32.2
Total net revenues 208.6 175.8 18.7
Cost of sales 140.1 103.0 36.0
Other operating expenses 74.4 93.0 (20.0)
Depreciation and amortization expenses 76.4 58.6 30.4
General and administrative expenses 607.8 584.0 4.1
Total operating expenses 898.7 838.6 7.2
Gain on sale of properties - 30.2 (100.0)
Income from equity investees 0.7 (2.4) nm
Operating loss $ (689.4) $ (635.0) 8.6 %
October 2,
2012 2011
September 30,
- Page 15 -
- more -
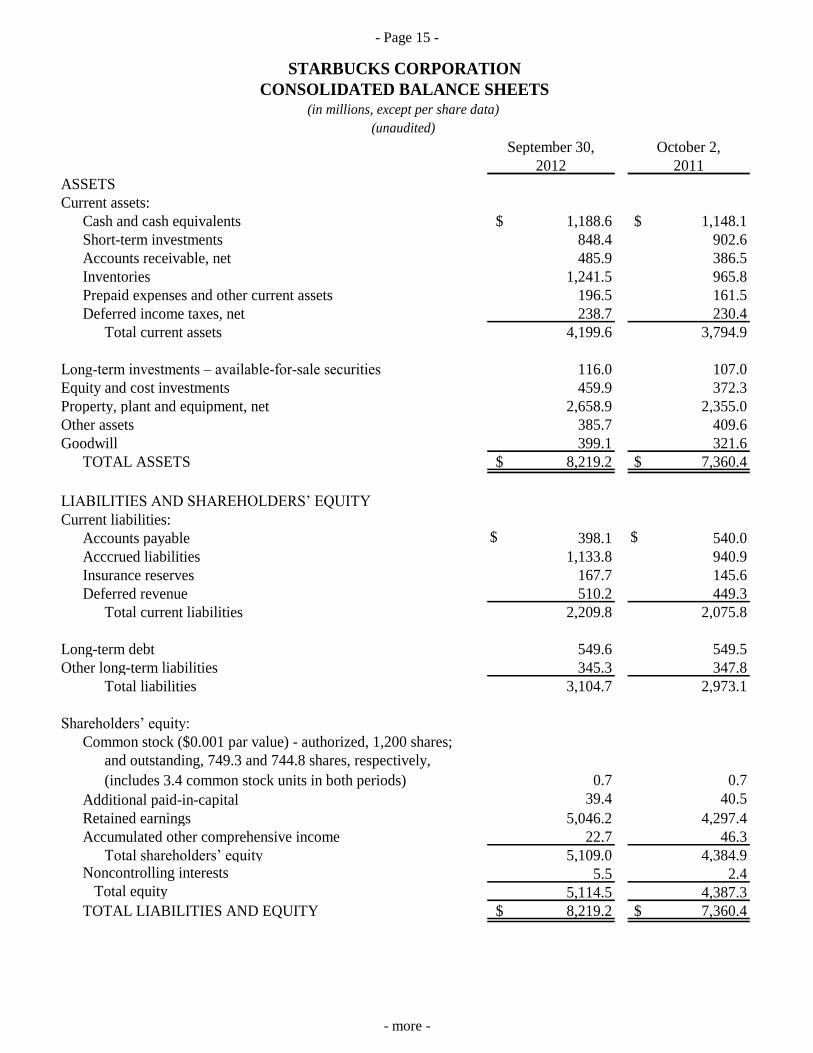
ASSETS
$ 1,188.6 $ 1,148.1
848.4 902.6
485.9 386.5
1,241.5 965.8
196.5 161.5
238.7 230.4
Total current assets 4,199.6 3,794.9
116.0 107.0
459.9 372.3
2,658.9 2,355.0
385.7 409.6
399.1 321.6
$ 8,219.2 $ 7,360.4
$ 398.1 $ 540.0
Acccrued liabilities 1,133.8 940.9
167.7 145.6
510.2 449.3
Total current liabilities 2,209.8 2,075.8
549.6 549.5
345.3 347.8
Total liabilities 3,104.7 2,973.1
0.7 0.7
39.4 40.5
5,046.2 4,297.4
22.7 46.3
Total shareholders’ equity 5,109.0 4,384.9Noncontrolling interests 5.5 2.4
Total equity 5,114.5 4,387.3
$ 8,219.2 $ 7,360.4
Accumulated other comprehensive income
Long-term debt
Other long-term liabilities
Insurance reserves
Deferred revenue
Common stock ($0.001 par value) - authorized, 1,200 shares;
and outstanding, 749.3 and 744.8 shares, respectively,
(includes 3.4 common stock units in both periods)
TOTAL LIABILITIES AND EQUITY
Shareholders’ equity:
Additional paid-in-capital
Retained earnings
Property, plant and equipment, net
Other assets
Goodwill
TOTAL ASSETS
LIABILITIES AND SHAREHOLDERS’ EQUITY
Current liabilities:
Accounts payable
Deferred income taxes, net
Long-term investments – available-for-sale securities
Equity and cost investments
Short-term investments
Accounts receivable, net
Inventories
Prepaid expenses and other current assets
Current assets:
Cash and cash equivalents
September 30, October 2,
2012 2011
STARBUCKS CORPORATION
CONSOLIDATED BALANCE SHEETS(in millions, except per share data)
(unaudited)
- Page 16 -
- more -
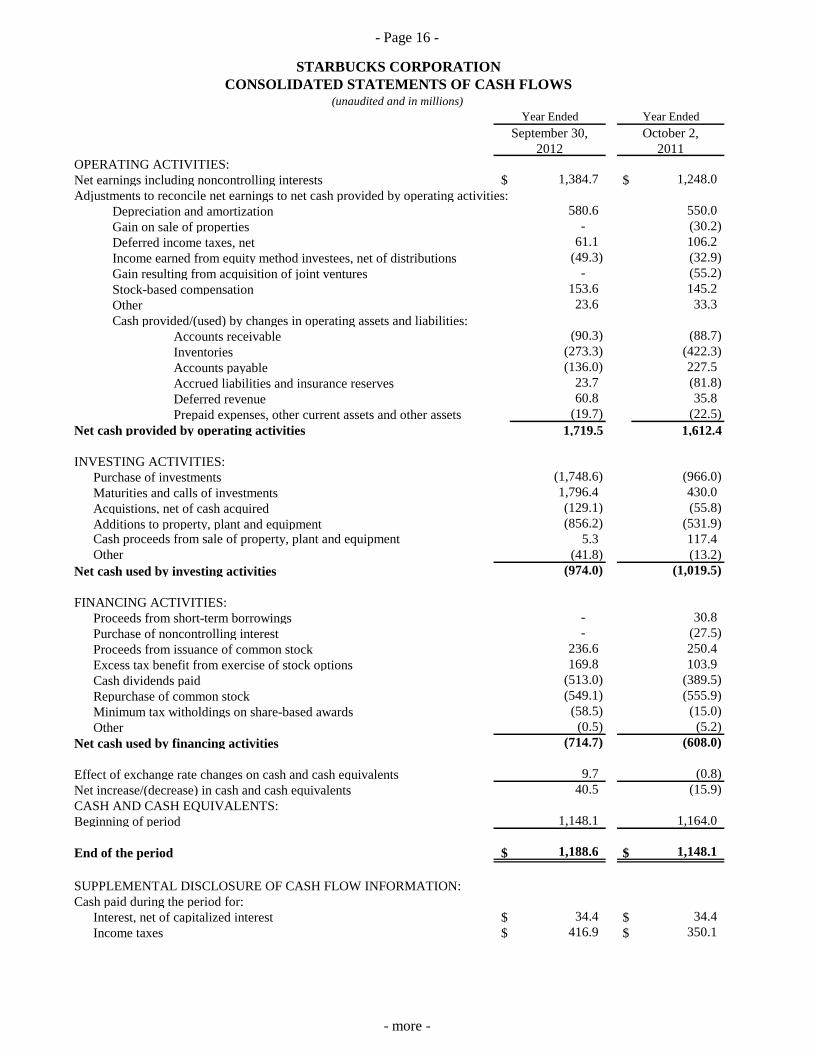
OPERATING ACTIVITIES:
Net earnings including noncontrolling interests $ 1,384.7 $ 1,248.0
Adjustments to reconcile net earnings to net cash provided by operating activities:
Depreciation and amortization 580.6 550.0
Gain on sale of properties - (30.2)
Deferred income taxes, net 61.1 106.2
Income earned from equity method investees, net of distributions (49.3) (32.9)
Gain resulting from acquisition of joint ventures - (55.2)
Stock-based compensation 153.6 145.2
Other 23.6 33.3
Cash provided/(used) by changes in operating assets and liabilities:
Accounts receivable (90.3) (88.7)
Inventories (273.3) (422.3)
Accounts payable (136.0) 227.5
Accrued liabilities and insurance reserves 23.7 (81.8)
Deferred revenue 60.8 35.8
Prepaid expenses, other current assets and other assets (19.7) (22.5)
Net cash provided by operating activities 1,719.5 1,612.4
INVESTING ACTIVITIES:
Purchase of investments (1,748.6) (966.0)
Maturities and calls of investments 1,796.4 430.0
Acquistions, net of cash acquired (129.1) (55.8)
Additions to property, plant and equipment (856.2) (531.9)
Cash proceeds from sale of property, plant and equipment 5.3 117.4
Other (41.8) (13.2)
Net cash used by investing activities (974.0) (1,019.5)
FINANCING ACTIVITIES:
Proceeds from short-term borrowings - 30.8
Purchase of noncontrolling interest - (27.5)
Proceeds from issuance of common stock 236.6 250.4
Excess tax benefit from exercise of stock options 169.8 103.9
Cash dividends paid (513.0) (389.5)
Repurchase of common stock (549.1) (555.9)
Minimum tax witholdings on share-based awards (58.5) (15.0)
Other (0.5) (5.2)
Net cash used by financing activities (714.7) (608.0)
Effect of exchange rate changes on cash and cash equivalents 9.7 (0.8)
Net increase/(decrease) in cash and cash equivalents 40.5 (15.9)
CASH AND CASH EQUIVALENTS:
Beginning of period 1,148.1 1,164.0
End of the period $ 1,188.6 $ 1,148.1
SUPPLEMENTAL DISCLOSURE OF CASH FLOW INFORMATION:
Cash paid during the period for:
Interest, net of capitalized interest $ 34.4 $ 34.4
Income taxes $ 416.9 $ 350.1
October 2,
Year Ended
STARBUCKS CORPORATION
CONSOLIDATED STATEMENTS OF CASH FLOWS(unaudited and in millions)
2012 2011
Year Ended
September 30,
- Page 17 -
- more -
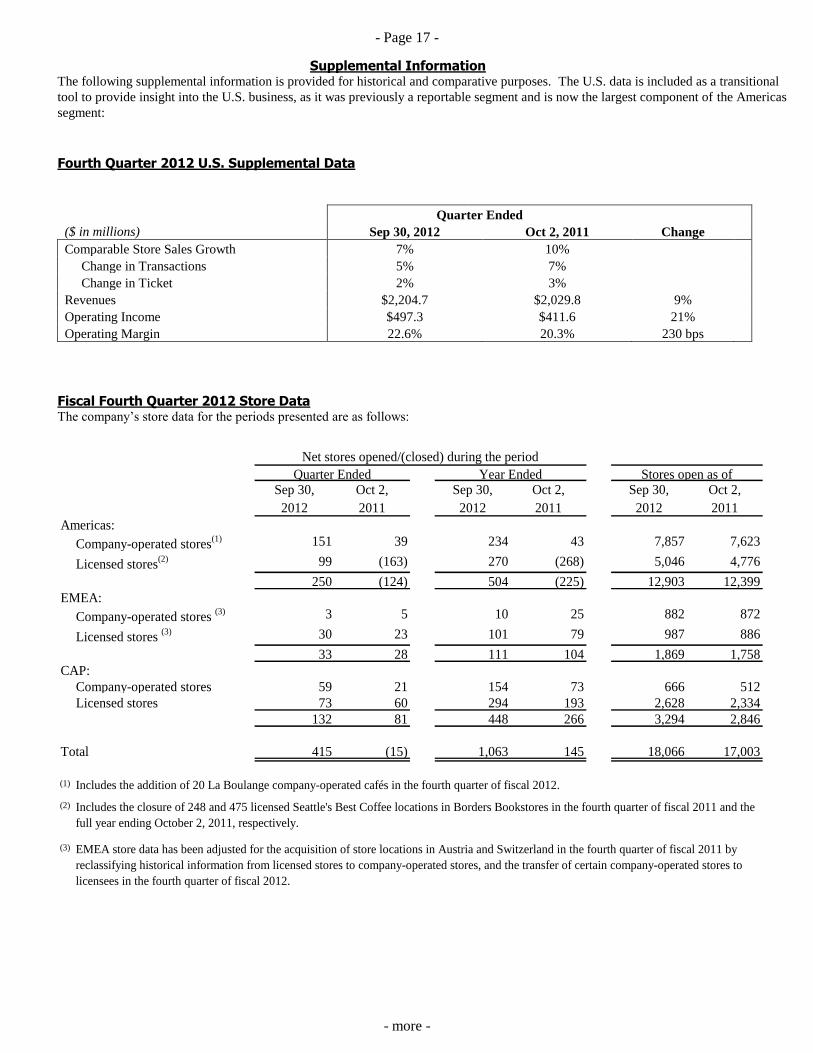
Supplemental Information The following supplemental information is provided for historical and comparative purposes. The U.S. data is included as a transitional
tool to provide insight into the U.S. business, as it was previously a reportable segment and is now the largest component of the Americas
segment:
Fourth Quarter 2012 U.S. Supplemental Data
Quarter Ended
($ in millions) Sep 30, 2012 Oct 2, 2011 Change
Comparable Store Sales Growth 7% 10%
Change in Transactions 5% 7%
Change in Ticket 2% 3%
Revenues $2,204.7 $2,029.8 9%
Operating Income $497.3 $411.6 21%
Operating Margin 22.6% 20.3% 230 bps
Fiscal Fourth Quarter 2012 Store Data The company’s store data for the periods presented are as follows:
Sep 30, Oct 2, Sep 30, Oct 2, Sep 30, Oct 2,
2012 2011 2012 2011 2012 2011
Americas:
Company-operated stores(1) 151 39 234 43 7,857 7,623
Licensed stores(2) 99 (163) 270 (268) 5,046 4,776
250 (124) 504 (225) 12,903 12,399
EMEA:
Company-operated stores (3) 3 5 10 25 882 872
Licensed stores (3) 30 23 101 79 987 886
33 28 111 104 1,869 1,758
CAP:
Company-operated stores 59 21 154 73 666 512
Licensed stores 73 60 294 193 2,628 2,334
132 81 448 266 3,294 2,846
Total 415 (15) 1,063 145 18,066 17,003
(1)
(2)
(3)
Includes the closure of 248 and 475 licensed Seattle's Best Coffee locations in Borders Bookstores in the fourth quarter of fiscal 2011 and the
full year ending October 2, 2011, respectively.
EMEA store data has been adjusted for the acquisition of store locations in Austria and Switzerland in the fourth quarter of fiscal 2011 by
reclassifying historical information from licensed stores to company-operated stores, and the transfer of certain company-operated stores to
licensees in the fourth quarter of fiscal 2012.
Includes the addition of 20 La Boulange company-operated cafés in the fourth quarter of fiscal 2012.
Net stores opened/(closed) during the period
Quarter Ended Year Ended Stores open as of
- Page 18 -
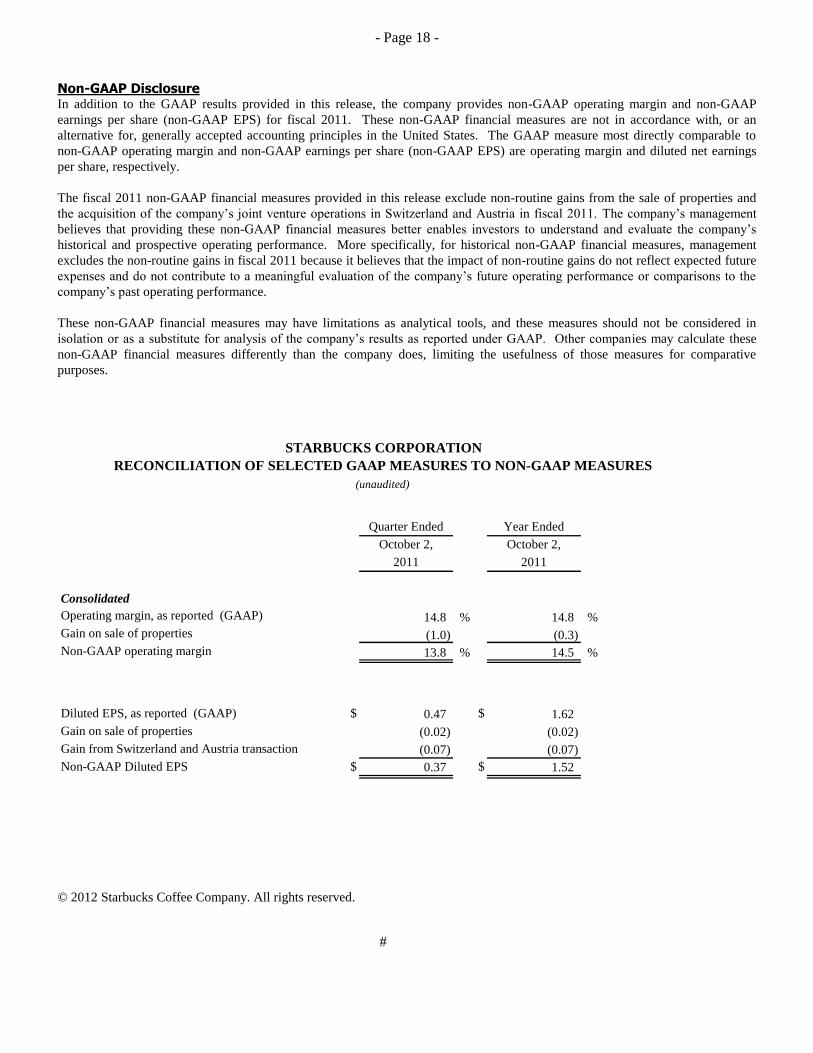
Non-GAAP Disclosure In addition to the GAAP results provided in this release, the company provides non-GAAP operating margin and non-GAAP
earnings per share (non-GAAP EPS) for fiscal 2011. These non-GAAP financial measures are not in accordance with, or an
alternative for, generally accepted accounting principles in the United States. The GAAP measure most directly comparable to
non-GAAP operating margin and non-GAAP earnings per share (non-GAAP EPS) are operating margin and diluted net earnings
per share, respectively.
The fiscal 2011 non-GAAP financial measures provided in this release exclude non-routine gains from the sale of properties and
the acquisition of the company’s joint venture operations in Switzerland and Austria in fiscal 2011. The company’s management
believes that providing these non-GAAP financial measures better enables investors to understand and evaluate the company’s
historical and prospective operating performance. More specifically, for historical non-GAAP financial measures, management
excludes the non-routine gains in fiscal 2011 because it believes that the impact of non-routine gains do not reflect expected future
expenses and do not contribute to a meaningful evaluation of the company’s future operating performance or comparisons to the
company’s past operating performance.
These non-GAAP financial measures may have limitations as analytical tools, and these measures should not be considered in
isolation or as a substitute for analysis of the company’s results as reported under GAAP. Other companies may calculate these
non-GAAP financial measures differently than the company does, limiting the usefulness of those measures for comparative
purposes.
Quarter Ended Year Ended
October 2, October 2,
2011 2011
Consolidated
14.8 % 14.8 %
(1.0) (0.3)
13.8 % 14.5 %
Diluted EPS, as reported (GAAP) $ 0.47 $ 1.62
Gain on sale of properties (0.02) (0.02)
Gain from Switzerland and Austria transaction (0.07) (0.07)
Non-GAAP Diluted EPS $ 0.37 $ 1.52
STARBUCKS CORPORATION
RECONCILIATION OF SELECTED GAAP MEASURES TO NON-GAAP MEASURES
(unaudited)
Operating margin, as reported (GAAP)
Gain on sale of properties
Non-GAAP operating margin
© 2012 Starbucks Coffee Company. All rights reserved.
#