Embed Size (px)
Citation preview
Tele2 – Full Year and Fourth Quarter Report 2017 A (34)
Full Year and fourth quarter 2017 report
Tele2 – Full Year and Fourth Quarter Report 2017 1 (34)
Key Financial Data
Q4 FY
SEK million 2017 2016 % 2017 2016 %
Net sales 6,642 6,340 5 25,024 21,190 18
Net sales, like-for-like2) 6,642 6,611 0 25,024 24,401 3
Mobile end-user service revenue 3,437 3,271 5 13,503 12,226 10
Mobile end-user service revenue, like-for-like2) 3,437 3,276 5 13,503 12,754 6
EBITDA 1,527 1,461 5 6,407 5,408 18
EBITDA, like-for-like2) 1,527 1,477 3 6,407 5,771 11
EBIT 766 622 23 3,564 2,528 41
EBIT excluding items affecting comparability (Note 2) 817 849 –4 3,821 3,250 18
Net profit 952 204 367 2,672 1,601 67
Earnings per share, after dilution (SEK) 1.50 0.77 95 5.03 4.20 20
Operating cash flow, rolling 12 months1) 4,471 3,089 45 4,471 3,089 45
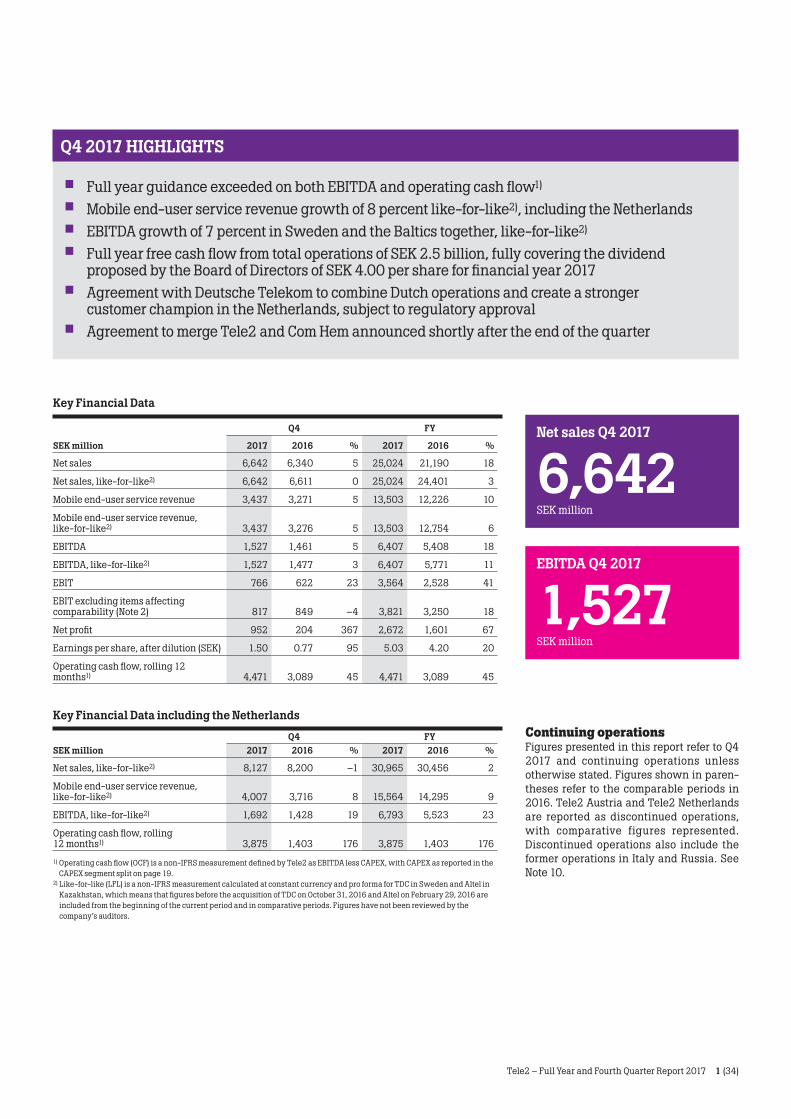
Q4 2017 HIGHLIGHTS
• Full year guidance exceeded on both EBITDA and operating cash flow1)
• Mobile end-user service revenue growth of 8 percent like-for-like2), including the Netherlands
• EBITDA growth of 7 percent in Sweden and the Baltics together, like-for-like2)
• Full year free cash flow from total operations of SEK 2.5 billion, fully covering the dividend proposed by the Board of Directors of SEK 4.00 per share for financial year 2017
• Agreement with Deutsche Telekom to combine Dutch operations and create a stronger customer champion in the Netherlands, subject to regulatory approval
• Agreement to merge Tele2 and Com Hem announced shortly after the end of the quarter
Net sales Q4 2017
6,642SEK million
EBITDA Q4 2017
1,527SEK million
Continuing operationsFigures presented in this report refer to Q4 2017 and continuing operations unless otherwise stated. Figures shown in paren-theses refer to the comparable periods in 2016. Tele2 Austria and Tele2 Netherlands are reported as discontinued operations, with comparative figures represented. Discontinued operations also include the former operations in Italy and Russia. See Note 10.
Key Financial Data including the Netherlands
Q4 FYSEK million 2017 2016 % 2017 2016 %
Net sales, like-for-like2) 8,127 8,200 –1 30,965 30,456 2
Mobile end-user service revenue, like-for-like2) 4,007 3,716 8 15,564 14,295 9
EBITDA, like-for-like2) 1,692 1,428 19 6,793 5,523 23
Operating cash flow, rolling 12 months1) 3,875 1,403 176 3,875 1,403 176
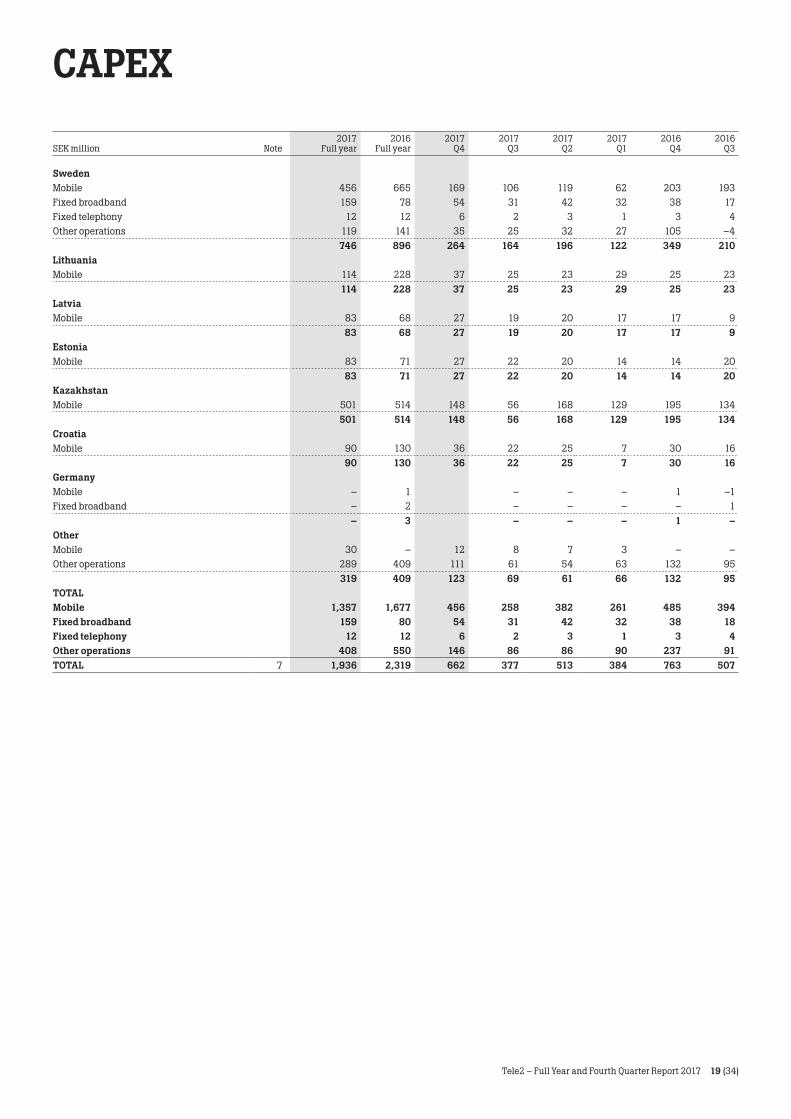
1) Operating cash flow (OCF) is a non-IFRS measurement defined by Tele2 as EBITDA less CAPEX, with CAPEX as reported in the CAPEX segment split on page 19.
2) Like-for-like (LFL) is a non-IFRS measurement calculated at constant currency and pro forma for TDC in Sweden and Altel in Kazakhstan, which means that figures before the acquisition of TDC on October 31, 2016 and Altel on February 29, 2016 are included from the beginning of the current period and in comparative periods. Figures have not been reviewed by the company’s auditors.
Tele2 – Full Year and Fourth Quarter Report 2017 2 (34)
CEO Word, Q4 2017
The fourth quarter concludes an extraordinary year for the Tele2 Group. The transformation of the Group to reach our strategic ambition is running at full speed alongside strong organic business momentum, driven by insatiable demand for mobile data, and cost control.
We are also concluding the end of the investment cycle in our Investment Markets through the business combination with T-Mobile in the Netherlands, which we announced in December. This gives us the opportunity to be part of a future customer cham-pion with sustainable strength to fight the Dutch market duopoly. Meanwhile fearless commercial propositions produced growth and rising profitability in the Swedish consumer segment and in the Baltics, despite the headwinds of Roam Like at Home (RLAH). Tele2 Sweden, already a one-stop shop for business customers following the integration of TDC Sweden, is now ready for the next big step in 2018 as we plan to merge with Com Hem to create a truly integrated connectivity provider.
Mobile end-user service revenue grew by 5 percent in the quarter, like-for-like, or 8 percent when including the Netherlands which is now reported as a discontinued operation. We thus met our full-year objective of high-single digit growth, by having a relentless focus on offering more value to customers who are hungry for mobile data. Data consumption by consumers on our Tele2 brand in Sweden increased by over 60 percent in Q4, more than doubled in the Baltics and quadrupled in the Netherlands.
In Sweden, our consumer mobile end-user service revenue grew by 2 percent, and by 3 percent excluding RLAH, driven again by very strong performance of the Comviq brand. In B2B, the expected continuation of recent headwinds were accentuated by a decline in low-margin equipment revenue against a tough comp. We expect this pressure to reduce somewhat in Q1, but more importantly I am pleased with great customer wins including an extended engage-ment with PostNord and a new contract with the Swedish Migration Agency. Sweden’s EBITDA grew by 3 percent in the quarter, despite an impact from RLAH of SEK 70 million, as benefits from the Challenger Program and TDC synergies flowed through.
Our Baltic businesses ended the year with another quarter of strong growth, 9 percent on mobile end-user service revenue and 21 percent on EBITDA. This was driven by successful take-up of our commercial propositions, designed to deliver increasing value to customers, and of costs, which have been well contained despite strong growth.
This momentum generated OCF in Sweden and the Baltics, our Baltic Sea Challenger business, of SEK 4.6 billion for the full year, corresponding to growth of 26 percent.
Our Investment Markets are now gradually moving into positive OCF, and during 2017 they consumed 77 percent less negative OCF than in 2016 including the Netherlands.
Kazakhstan had another strong quarter, with 18 percent growth in mobile end-user service revenue and an EBITDA margin of 28 percent, well on track towards our mid-term ambition of 30 percent. 4G population coverage reached 73 percent at the end of the year, and leading network quality keeps being an important foundation for our strategy.
Netherlands momentum also continued, with growth of 30 per-cent in mobile end-user service revenue. Looking forward, the business combination with T-Mobile announced on December 15 significantly improves the ability of the business to take on the Dutch market duopoly, while also significantly bringing forward cash returns for the Tele2 Group and improving our risk profile. Upon closing, the agreement entitles Tele2 to a 25 percent stake in the combined Dutch business and EUR 190 million in cash.
“This planned merger with Com Hem takes Tele2 into a new chapter and a new world of possibilities that will fearlessly liberate a more connected life for Swedish house holds, individuals and businesses of all sizes.”
Amid all these new developments it is also time to draw conclusions from an older but equally important one. The Challenger Program, which I launched in 2014, exceeded its goal run-rate of SEK 1 billion in the fourth quarter, and delivered on its purpose of driving produc-tivity and competitiveness for the Group. The program’s investments were lower than expected at SEK 728 million over the three years. As it draws to a close, the mission for improved productivity and opera-tional excellence will continue. As a challenger, cost consciousness is in our DNA. New initiatives that will improve our productivity and the cost to serve our customers have therefore already been initiated.
The integration of TDC is progressing well and we are approach-ing our target run-rate benefits of around SEK 300 million, originally our four-year target, only one year after the acquisition. In 2018 we will therefore look for further opportunities beyond our earlier target level, and we believe this is achievable with a lower integration cost than the SEK 750 million previously communicated.
For 2018 we are guiding for mid-single digit mobile end-user service revenue growth, EBITDA of SEK 6.5 to 6.8 billion and CAPEX of SEK 2.1 to 2.4 billion for the full year, excluding the Netherlands. However, this does not include our greatest opportunity, as we are now looking forward to one of the most complementary mergers of assets that could possibly be found in our industry, with Com Hem, today a high-quality customer oriented leader in its segment. Besides a stronger customer offer and better growth prospects, we will also broaden our cash flow base and long-term dividend capacity. The Board is therefore introduc-ing a policy of a dividend to rise over time, from today’s levels, and a continued principle of returns of any excess cash.
This planned merger with Com Hem takes Tele2 into a new chap-ter and a new world of possibilities that will fearlessly liberate a more connected life for Swedish households, individuals and businesses of all sizes. As a result, we will deliver sustainable value creation for years to come, for our customers, employees and shareholders alike. I am immensely proud of the whole Tele2 team, who have contrib-uted to this quite extraordinary year, and look forward to exciting times ahead as we further execute on our strategic ambitions.
Allison Kirkby President and CEO
Tele2 – Full Year and Fourth Quarter Report 2017 3 (34)
Financial overview
Tele2’s financial performance is driven by a consistent focus on developing mobile services on own infrastructure, complemented in certain countries by fixed broadband services and B2B offerings. In addition, the Group concentrates on maximizing the return from legacy fixed line services.
Net customer intake amounted to –32,000 (–129,000) customers in Q4 2017. The customer net intake in mobile services amounted to –12,000 (–107,000), mainly related to seasonal effects in Sweden and Croatia. The fixed broadband customer base decreased by –4,000 (–5,000), with declines in Sweden and Germany. As expected, the number of fixed telephony customers fell by –16,000 (–17,000), in line with the market trend. On December 31, 2017, the total customer base amounted to 15,347,000 (15,011,000).
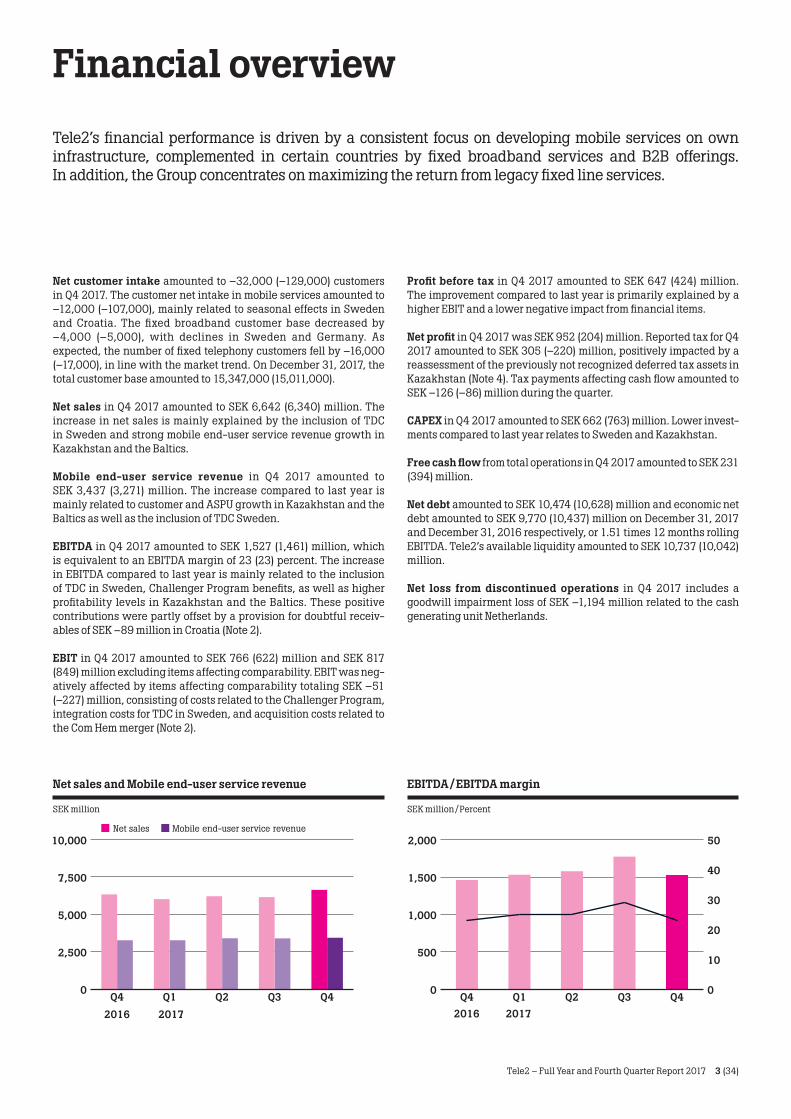
Net sales in Q4 2017 amounted to SEK 6,642 (6,340) million. The increase in net sales is mainly explained by the inclusion of TDC in Sweden and strong mobile end-user service revenue growth in Kazakhstan and the Baltics.
Mobile end-user service revenue in Q4 2017 amounted to SEK 3,437 (3,271) million. The increase compared to last year is mainly related to customer and ASPU growth in Kazakhstan and the Baltics as well as the inclusion of TDC Sweden.
EBITDA in Q4 2017 amounted to SEK 1,527 (1,461) million, which is equivalent to an EBITDA margin of 23 (23) percent. The increase in EBITDA compared to last year is mainly related to the inclusion of TDC in Sweden, Challenger Program benefits, as well as higher profitability levels in Kazakhstan and the Baltics. These positive contributions were partly offset by a provision for doubtful receiv-ables of SEK –89 million in Croatia (Note 2).
EBIT in Q4 2017 amounted to SEK 766 (622) million and SEK 817 (849) million excluding items affecting comparability. EBIT was neg-atively affected by items affecting comparability totaling SEK –51 (–227) million, consisting of costs related to the Challenger Program, integration costs for TDC in Sweden, and acquisition costs related to the Com Hem merger (Note 2).
Profit before tax in Q4 2017 amounted to SEK 647 (424) million. The improvement compared to last year is primarily explained by a higher EBIT and a lower negative impact from financial items.
Net profit in Q4 2017 was SEK 952 (204) million. Reported tax for Q4 2017 amounted to SEK 305 (–220) million, positively impacted by a reassessment of the previously not recognized deferred tax assets in Kazakhstan (Note 4). Tax payments affecting cash flow amounted to SEK –126 (–86) million during the quarter.
CAPEX in Q4 2017 amounted to SEK 662 (763) million. Lower invest-ments compared to last year relates to Sweden and Kazakhstan.
Free cash flow from total operations in Q4 2017 amounted to SEK 231 (394) million.
Net debt amounted to SEK 10,474 (10,628) million and economic net debt amounted to SEK 9,770 (10,437) million on December 31, 2017 and December 31, 2016 respectively, or 1.51 times 12 months rolling EBITDA. Tele2’s available liquidity amounted to SEK 10,737 (10,042) million.
Net loss from discontinued operations in Q4 2017 includes a goodwill impairment loss of SEK –1,194 million related to the cash generating unit Netherlands.
0
2,500
5,000
7,500
10,000
Q4Q3Q2Q1Q4
2016 2017
Net sales Mobile end-user service revenue
0
500
1,000
1,500
2,000
Q4Q3Q2Q1Q42016 2017
0
10
20
30
40
50
Net sales and Mobile end-user service revenue SEK million
EBITDA / EBITDA margin SEK million / Percent
Tele2 – Full Year and Fourth Quarter Report 2017 4 (34)
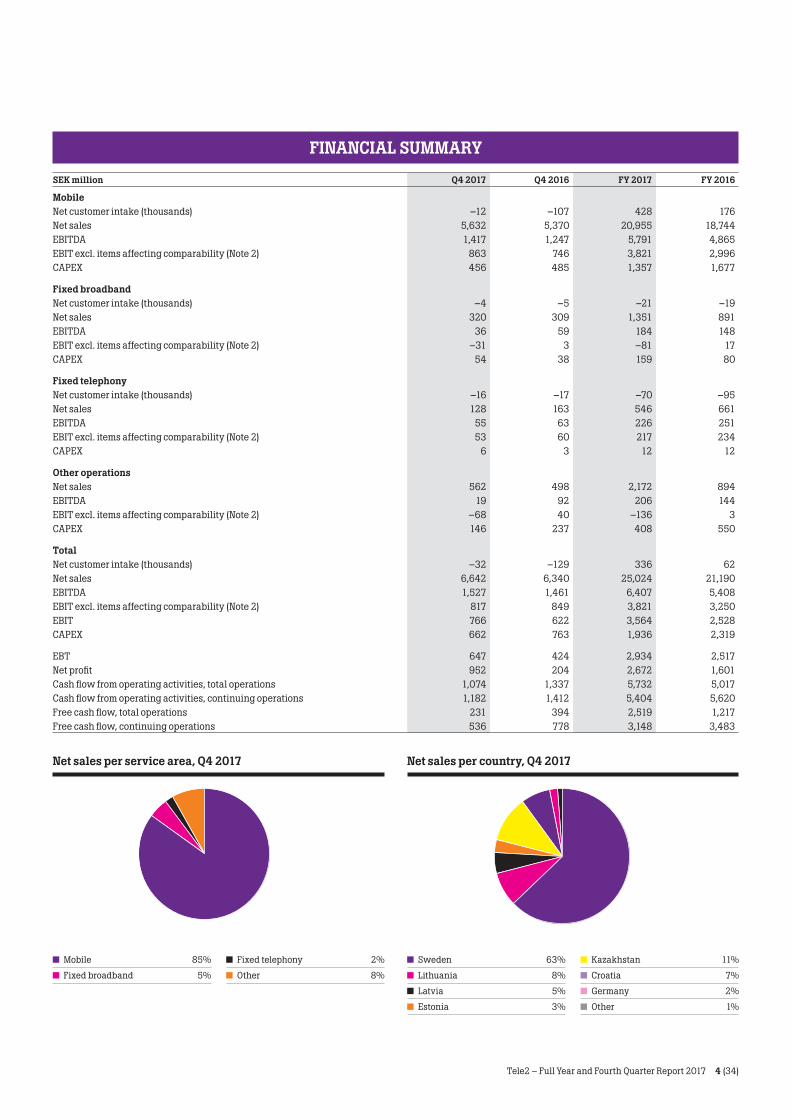
Net sales per service area, Q4 2017
Net sales per country, Q4 2017
Mobile 85%
Fixed broadband 5%
Fixed telephony 2%
Other 8%
Sweden 63%
Lithuania 8%
Latvia 5%
Estonia 3%
Kazakhstan 11%
Croatia 7%
Germany 2%
Other 1%
FINANCIAL SUMMARY
SEK million Q4 2017 Q4 2016 FY 2017 FY 2016
MobileNet customer intake (thousands) –12 –107 428 176Net sales 5,632 5,370 20,955 18,744EBITDA 1,417 1,247 5,791 4,865EBIT excl. items affecting comparability (Note 2) 863 746 3,821 2,996CAPEX 456 485 1,357 1,677
Fixed broadbandNet customer intake (thousands) –4 –5 –21 –19Net sales 320 309 1,351 891EBITDA 36 59 184 148EBIT excl. items affecting comparability (Note 2) –31 3 –81 17CAPEX 54 38 159 80
Fixed telephonyNet customer intake (thousands) –16 –17 –70 –95Net sales 128 163 546 661EBITDA 55 63 226 251EBIT excl. items affecting comparability (Note 2) 53 60 217 234CAPEX 6 3 12 12
Other operationsNet sales 562 498 2,172 894EBITDA 19 92 206 144EBIT excl. items affecting comparability (Note 2) –68 40 –136 3CAPEX 146 237 408 550
TotalNet customer intake (thousands) –32 –129 336 62Net sales 6,642 6,340 25,024 21,190EBITDA 1,527 1,461 6,407 5,408EBIT excl. items affecting comparability (Note 2) 817 849 3,821 3,250EBIT 766 622 3,564 2,528CAPEX 662 763 1,936 2,319
EBT 647 424 2,934 2,517Net profit 952 204 2,672 1,601Cash flow from operating activities, total operations 1,074 1,337 5,732 5,017Cash flow from operating activities, continuing operations 1,182 1,412 5,404 5,620Free cash flow, total operations 231 394 2,519 1,217Free cash flow, continuing operations 536 778 3,148 3,483
Tele2 – Full Year and Fourth Quarter Report 2017 5 (34)
Financial guidance
Tele2 AB gives the following guidance for 2018 for continuing operations in constant currencies:
• Mobile end-user service revenue growth of mid-single digits• EBITDA between SEK 6.5 and 6.8 billion• CAPEX between SEK 2.1 and 2.4 billion (excluding spectrum investments)
Dividend For the financial year 2017, the Board of Tele2 AB has decided to recom-mend an ordinary dividend payment of SEK 4.00 per ordinary A and B share to the Annual General Meeting (AGM) in May 2018.
Financial targets following merger with Com HemPursuant to the announcement on January 10 of the proposed merger with Com Hem, the Board of Directors of Tele2, together with Tele2’s management, have considered appropriate financial targets for the combined entity and agreed on below framework. Subsequent to the completion of the merger, the Tele2 management team will together with the Tele2 Board of Directors refine and possibly adapt these targets.
Shareholder remuneration: Following completion of the merger, the combined entity will remain committed to covering shareholder remu-neration with equity free cash flow and to returning excess capital to shareholders. It is envisaged that the combined entity will increase shareholder remuneration relative to Tele2’s level today and grow it over time.
Capital structure: The combined entity will be committed to a credit profile consistent with an investment grade credit rating and to main-tain the current leverage target of 2.0–2.5x over the medium term.
The Challenger ProgramA group-wide program focused on increasing productivity was launched at the end of 2014. The program has built over 3 years and exceeded its target level of SEK 1 billion on an annualized run-rate basis in the fourth quarter of 2017. Thus, it is expected to result in more than SEK 1 billion of benefits in 2018 compared to the 2014 baseline, including the now discontinued operations in the Netherlands and Austria. Program investments amounted to SEK 728 million over 3 years, lower than the forecasted SEK 1 billion. Program investments have been reported as items affecting comparability, with an impact on EBIT. The Challenger Program ended on 31 December, 2017. For more details, see Note 2.
Tele2 – Full Year and Fourth Quarter Report 2017 6 (34)
BALTIC SEA CHALLENGERS
SwedenThe mobile market continued to be competitive in the fourth quarter, with intense campaigning in both bundled and SIM only segments. Additional competing brands started to use introduction discounts as a customer acquisition tool.
Growth of mobile data usage continued to accelerate in the quar-ter, creating good demand for large data bundles. Customer intake was similar to the corresponding quarter last year, with a decline in prepaid and mobile broadband partly compensated for by growth in postpaid customers.
Total net sales declined by 3 percent like-for-like, to SEK 4,210 million (SEK 3,294 million for Tele2 excluding the contribution from TDC and SEK 1,038 million for TDC in Q4 2016), due to effects of RLAH and continued decline in fixed-line services.
Mobile end-user service revenue declined by 1 percent like-for-like, but grew 1 percent excluding the effects of RLAH.
EBITDA increased by 3 percent, like-for-like, to SEK 1,077 mil-lion (SEK 941 million for Tele2 excluding contribution from TDC and SEK 104 million for TDC in Q4 2016), despite a negative effect of SEK 70 million due to RLAH, as integration synergies and benefits from the Challenger Program exceeded the effect of declining fixed-line service revenue. Mobile EBITDA increased to SEK 961 million and the EBITDA margin improved to 29 (27) percent.
Sweden ConsumerConsumer mobile end-user service revenue grew by 2 percent, or 3 percent adjusted for RLAH effects. Comviq postpaid, the largest contributor to growth, repeated its successful Christmas campaign concept for the fourth consecutive year, again with a record cus-tomer intake. For the Tele2 brand, customer momentum is gradually improving under the Power 2 campaign, and revenue from the brand was unchanged. Revenue from the prepaid segment declined.
Demand for larger data buckets continued and data consumption on the Tele2 brand grew by more than 60 percent to an average of 7.3 GB per month.
Sweden B2BThe B2B market continued to be price competitive, affecting both fixed and mobile service revenue.
The Large Enterprise segment reported a 10 percent decline in net sales, like-for-like, as a result of price competition, RLAH and due to high equipment revenue in Q4 2016. A period of low customer additions earlier in 2017 continue to have an impact on revenue, however all major existing contracts up for renewal were retained in the quarter, combined with significant new customer additions including the Swedish Migration Agency and an extended contract with PostNord.
Synergies from the TDC integration continued to develop ahead of its time plan. Accumulated synergies amounted to SEK 209 million for the full year, with SEK 72 million recognized in the fourth quarter. The annualized run-rate level of synergies is approaching the four-year target of SEK 300 million, with scope to possibly raise the target level during 2018. The cost for the integration program is estimated to be lower than the previously forecasted SEK 750 million.
LithuaniaTele2 continued its data monetization strategy with gradual renew-als of its commercial propositions in the different segments of the customer base, resulting in mobile end-user service revenue growth of 7 percent in local currency, with particularly strong growth in the B2B segment.
A JV for the development of mobile payments solutions was formed in December between Tele2 and the other two mobile net-work operators, following approval by the European Commission. The service will be offered to both consumer and business customers in Lithuania.
The EBITDA margin increased to 31 (26) percent driven by reve-nue growth and cost control, and due to lower investments in growth in mobile broadband compared to the high levels in Q4 2016.
Tele2 was named the country’s most transparent company by Transparency International Lithuania, based on a review of organi-zational, financial and anti-corruption transparency among all of the country’s large companies.
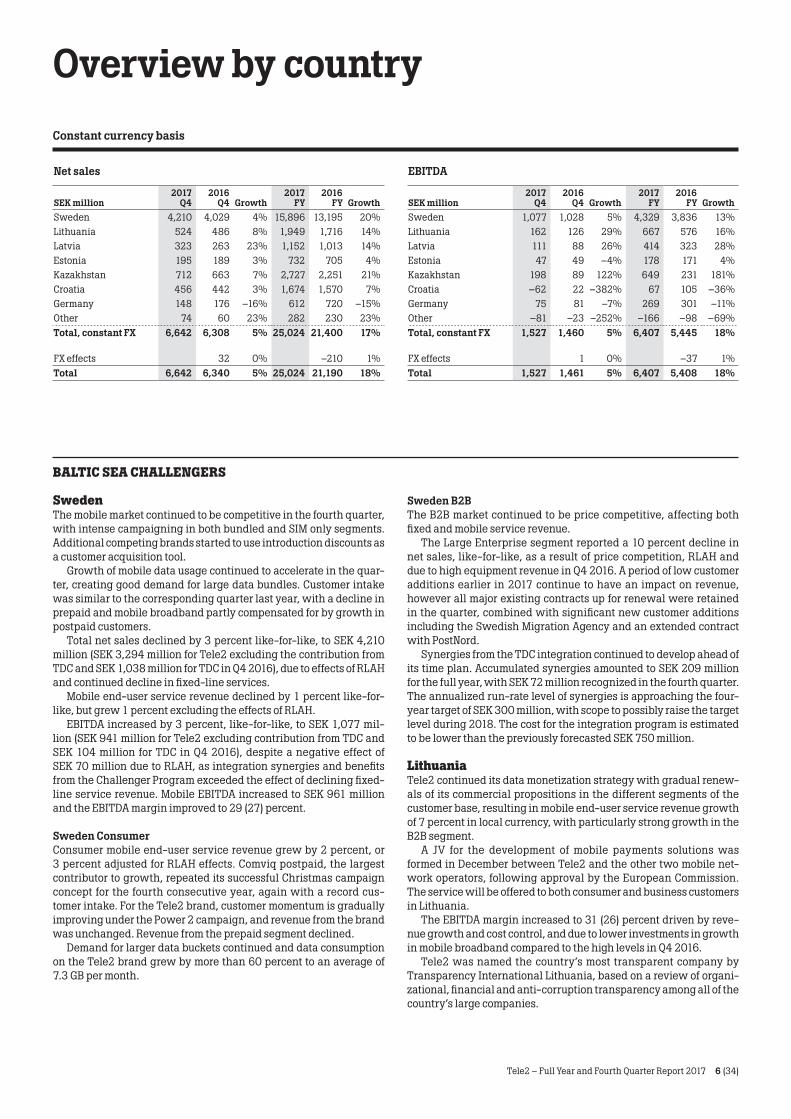
Overview by countryConstant currency basis
Net sales
SEK million2017
Q42016
Q4
Growth 2017
FY2016
FY
Growth Sweden 4,210 4,029 4% 15,896 13,195 20%Lithuania 524 486 8% 1,949 1,716 14%Latvia 323 263 23% 1,152 1,013 14%Estonia 195 189 3% 732 705 4%Kazakhstan 712 663 7% 2,727 2,251 21%Croatia 456 442 3% 1,674 1,570 7%Germany 148 176 –16% 612 720 –15%Other 74 60 23% 282 230 23%Total, constant FX 6,642 6,308 5% 25,024 21,400 17%
FX effects 32 0% –210 1%Total 6,642 6,340 5% 25,024 21,190 18%
EBITDA
SEK million2017
Q42016
Q4
Growth 2017
FY2016
FY
Growth Sweden 1,077 1,028 5% 4,329 3,836 13%Lithuania 162 126 29% 667 576 16%Latvia 111 88 26% 414 323 28%Estonia 47 49 –4% 178 171 4%Kazakhstan 198 89 122% 649 231 181%Croatia –62 22 –382% 67 105 –36%Germany 75 81 –7% 269 301 –11%Other –81 –23 –252% –166 –98 –69%Total, constant FX 1,527 1,460 5% 6,407 5,445 18%
FX effects 1 0% –37 1%Total 1,527 1,461 5% 6,407 5,408 18%
Tele2 – Full Year and Fourth Quarter Report 2017 7 (34)
LatviaThe competition was mainly focused on handset campaigns by operators and handset vendors, driving equipment revenue in the market. In the price-oriented market segment there were aggressive win-back offerings by the competition in the quarter.
At 14 percent growth in local currency, the strong trend of recent quarters in mobile end-user service revenue was sustained. Positive customer dynamics were driven by intake of B2B customers, partly offset by prepaid seasonality.
EBITDA growth of 26 percent was driven by higher revenue, with the margin largely constant compared to Q4 2016.
EstoniaThe market continued to be characterized by aggressive telemarket-ing but without significant changes to list prices. Tele2 responded with campaigns that included attractive hardware offerings, with positive results towards the end of the quarter.
Tele2’s digital brand Snäpp – an online-only business – was awarded best website for digital sales at Digitegu 2017.
Mobile end-user service revenue grew by 4 percent in local cur-rency despite tough competition and the effects of RLAH, while the EBITDA margin was affected by low margin equipment sales and campaign costs, as well as higher costs for RLAH.
INVESTMENT MARKETS
KazakhstanThere were few changes to list prices in the quarter but strong com-petition in introduction offerings with large upfront discounts for the first month of service, some of which have continued into Q1.
Tele2 grew strongly with mobile end-user service revenue 26 per-cent higher versus Q4 2016, in local currency, driven by a continued shift towards higher-ASPU bundles. Network quality is another important driver, with the market leading 4G population coverage reaching 73 percent. In the quarter, a Tele2-branded smartphone named Tele2 Urban was launched, selling for KZT 29,900 and coming with an Android operating system.
The EBITDA margin increased to 28 (13) percent, driven mainly by improved scale, successful cost management and a higher-margin product mix.
Tele2 Kazakhstan made a first repayment of the shareholder loan through a KZT 3.3 billion payment to Tele2 Group in the quarter.
CroatiaCompetition was mainly focused on offering more-for-more, includ-ing some competitors adding value in the form of fixed-line and con-tent services. Tele2 remains the only operator offering Unlimited on consumer postpaid and mobile broadband.
The subscriber development was affected as usual in Q4 by the seasonal decline in prepaid, while there was continued growth in both the postpaid consumer and mobile broadband segments.
Growth in mobile end-user service revenue of 9 percent in local currency was driven by postpaid consumer and mobile broadband
The reported EBITDA of SEK –62 million was negatively affected by a provision for doubtful receivables of SEK –89 million, as further described in Note 2. Excluding the provision, the EBITDA margin would have been 6 (5) percent.
CASH GENERATOR
GermanyThe decline of the customer and revenue base continued as expected, although still producing a cash flow at higher levels than anticipated.
The EBITDA margin was 51 (46) percent in the quarter, as the rev-enue decline was compensated for by lower fixed termination rates and a reduction of indirect costs as a result of continuous savings initiatives.
BALTIC SEA CHALLENGERS CONT.
Tele2 – Full Year and Fourth Quarter Report 2017 8 (34)
Other itemsRisks and uncertainty factorsTele2’s operations are affected by a number of external factors. The risk factors considered to be most significant to Tele2’s future devel-opment are insufficient spectrum availability, changes in regulatory legislation, market dynamics, failure to deliver on strategic trans-formation initiatives, operations in Kazakhstan, failure of network IT and infrastructure, data protection and cyber security, instability in partnerships and Joint Ventures, unstable geopolitical conditions, and financial risks such as currency risk, interest risk, liquidity risk, credit risk, risks related to tax matters and impairment of assets. Additionally, there is a risk that Tele2 may not be able to obtain suffi-cient funding for its operations. Please refer to Tele2’s annual report for 2016 (Administration report and Note 2) for a detailed description of Tele2’s risk exposure and risk management.
The Supreme Court of the Netherlands as the final instance found in 2016 that mobile contracts that are bundled with a free or discounted device are to be treated as consumer credit or installment purchases. Accordingly, such contracts are subject to the Dutch consumer credit law. Contracts that do not comply with the new consumer credit regu-lations can be rescinded. As of May 1, 2017, the indirect sales partner of Tele2 Netherlands is the customer’s contracting party for the sale of the handset, and Tele2 is the offeror of the handset credit. As a conse-quence, sales of handsets by indirect sales partners are not reported as revenue by Tele2. In addition, the consumer credit regulations may potentially have an adverse effect on sales of subscriptions bundled with handsets in the market going forward.
On April 25, 2017, the European Commission initiated an investiga-tion on the premises of Tele2 in Kista about possible anti-competitive cooperation between operators in the mobile market and/or possible abuse of collective dominant position. Similar investigations were simultaneously initiated towards other Swedish mobile network operators.
Subsequent eventsOn January 10, it was announced that Tele2 and Com Hem will merge to create a leading integrated connectivity provider. The merger is subject to regulatory approval by the relevant competition authorities and is therefore expected to close during H2 2018. The completion of the merger is subject to approval by the shareholders of each of Tele2 and Com Hem at their respective Extraordinary General Meetings. At completion of the merger, Anders Nilsson will become the CEO of Tele2. More information about the merger can be found in Note 10.
Tele2 AB (publ) Annual General Meeting 2018The 2018 Annual General Meeting will be held on May 21, 2018 in Stockholm. Shareholders wishing to have a matter considered at the Annual General Meeting should submit their proposals in writing to [email protected] or to legal counsel Katarina Areskoug, Tele2 AB (publ), P.O. Box 62, SE 164 94 Kista, Sweden, at least seven weeks before the Annual General Meeting for the proposal to be included in the notice to the meeting. Further details on how and when to register will be published in advance of the Annual General Meeting.
Nomination committee for the 2018 Annual General MeetingIn accordance with the resolution of the 2017 Annual General Meeting, Mike Parton, Chairman of the Board of Directors, has convened a Nomination Committee consisting of members appointed by the larg-est shareholders in terms of voting interest in Tele2 AB (publ) (“Tele2”).
The Nomination Committee comprises Mike Parton as Chairman of the Board of Directors; Cristina Stenbeck appointed by Kinnevik AB; John Hernander appointed by Nordea Funds and Martin Wallin appointed by Lannebo Funds.
The three shareholder representatives on the Nomination Committee have been appointed by shareholders that jointly repre-sent approximately 51 percent of the total votes in Tele2. The mem-bers of the Nomination Committee appointed Cristina Stenbeck as the Committee Chairman at their first meeting.
Information about the work of the Nomination Committee can be found on Tele2’s corporate website at www.tele2.com. Shareholders wishing to propose candidates for election to the Board of Directors of Tele2 should submit their proposal in writing to [email protected] or to legal counsel Katarina Areskoug, Tele2 AB (publ), P.O. Box 62, SE 164 94 Kista, Sweden.
Auditors’ review reportThis interim report has not been subject to specific review by the company’s auditors.
OtherThe annual report for 2017 is expected to be released on March 28, 2018 and will be available on www.tele2.com.
Tele2 will release its financial and operating results for the period ending March 31, 2018 on April 23, 2018.
The Board of Directors and CEO declare that the full-year report provides a fair overview of the parent company’s and Group’s operations, their financial position and performance, and describes material
risks and uncertainties facing the parent company and other companies in the Group.
Stockholm, February 2, 2018Tele2 AB
Mike PartonChairman
Sofia Arhall Bergendorff Anders Björkman Georgi Ganev
Cynthia Gordon Irina Hemmers Eamonn O’Hare
Carla Smits-Nusteling
Allison KirkbyPresident and CEO
Tele2 – Full Year and Fourth Quarter Report 2017 9 (34)
Tele2 will host a presentation, with the possibility to join through a conference call, for the global financial community at 10:00 am CET (09:00 am GMT/04:00 am EST) on Friday, February 2, 2018. The presentation will be held in English and also made available as a webcast on Tele2’s website: www.tele2.com.
Erik Strandin PersHead of Investor RelationsTelephone: +46 (0) 733 41 41 88
Tele2 ABCompany registration nr: 556410-8917Skeppsbron 18P.O. Box 2094SE-103 13 StockholmSwedenTel + 46 (0) 8 5620 0060www.tele2.com
VISIT OUR WEBSITE: www.tele2.com
Income statementComprehensive incomeBalance sheetCash flow statementChange in equityNumber of customersNet salesMobile external net sales splitEBITDAEBITCAPEXFive-year summaryParent companyNotes
Q4 2017 PRESENTATION
CONTACTS APPENDICES
Dial-in informationTo ensure that you are connected to the conference call, please dial in a few minutes before the start of the conference call to register your attendance.
Dial-in numbersSE: +46 (0) 8 5065 3942UK: +44 (0) 330 336 9412US: +1 323 794 2093
TELE2’S MISSION IS TO FEARLESSLY LIBERATE PEOPLE TO LIVE A MORE CONNECTED LIFE. We believe the connected life is a better life, and so our aim is to make connectivity increasingly accessible to our customers, no matter where or when they need it. Ever since Jan Stenbeck founded the company in 1993, it has been a tough challenger to the former government monopolies and other established providers. Tele2 offers mobile services, fixed broadband and telephony, data network services, content services and global IoT solutions. Every day our 17 million customers across eight countries enjoy a fast and wireless experience through our award winning networks. Tele2 has been listed on the NASDAQ OMX Stockholm since 1996. In 2017, Tele2 had net sales of SEK 25 billion and reported an operating profit (EBITDA) of SEK 6.4 billion. For definitions of measures, please see the last pages of the Annual Report 2016. Follow @Tele2group on Twitter for the latest updates.
Tele2 – Full Year and Fourth Quarter Report 2017 10 (34)
Income statement
SEK million Note2017
Full year2016
Full year2017
Q42016
Q4
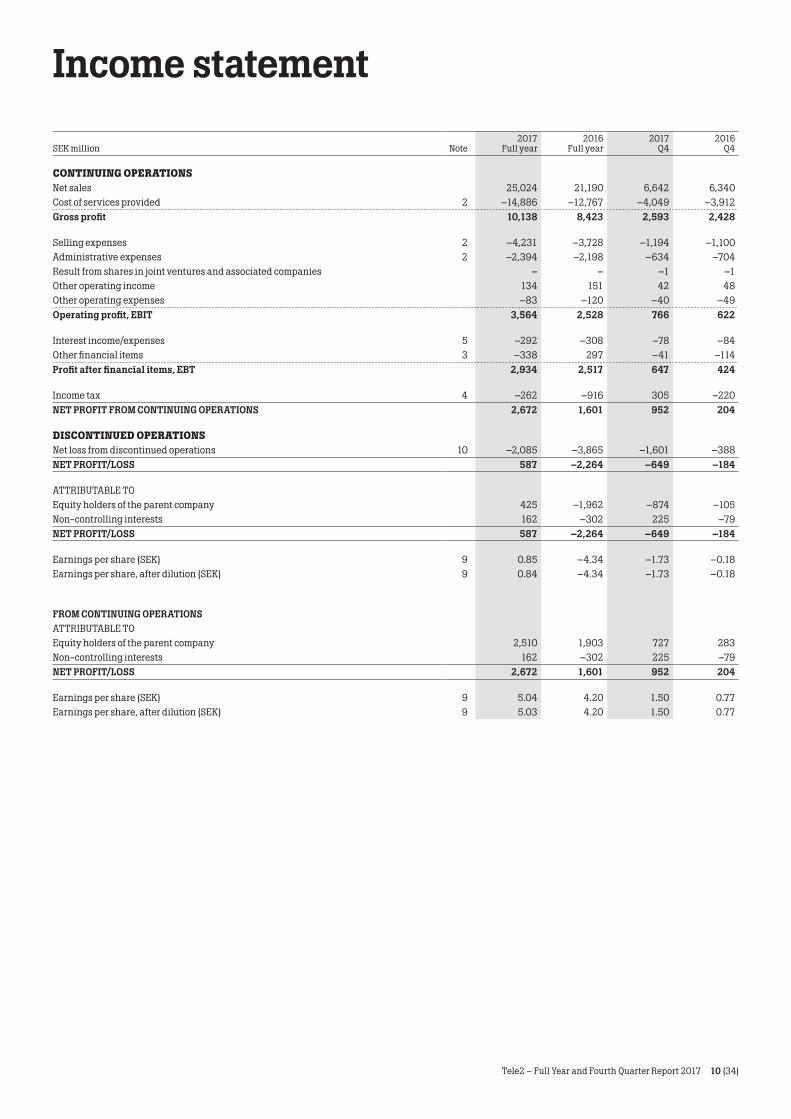
CONTINUING OPERATIONSNet sales 25,024 21,190 6,642 6,340Cost of services provided 2 –14,886 –12,767 –4,049 –3,912Gross profit 10,138 8,423 2,593 2,428
Selling expenses 2 –4,231 –3,728 –1,194 –1,100Administrative expenses 2 –2,394 –2,198 –634 –704Result from shares in joint ventures and associated companies – – –1 –1Other operating income 134 151 42 48Other operating expenses –83 –120 –40 –49Operating profit, EBIT 3,564 2,528 766 622
Interest income/expenses 5 –292 –308 –78 –84Other financial items 3 –338 297 –41 –114Profit after financial items, EBT 2,934 2,517 647 424
Income tax 4 –262 –916 305 –220NET PROFIT FROM CONTINUING OPERATIONS 2,672 1,601 952 204
DISCONTINUED OPERATIONSNet loss from discontinued operations 10 –2,085 –3,865 –1,601 –388NET PROFIT/LOSS 587 –2,264 –649 –184
ATTRIBUTABLE TOEquity holders of the parent company 425 –1,962 –874 –105Non-controlling interests 162 –302 225 –79NET PROFIT/LOSS 587 –2,264 –649 –184
Earnings per share (SEK) 9 0.85 –4.34 –1.73 –0.18Earnings per share, after dilution (SEK) 9 0.84 –4.34 –1.73 –0.18
FROM CONTINUING OPERATIONSATTRIBUTABLE TOEquity holders of the parent company 2,510 1,903 727 283Non-controlling interests 162 –302 225 –79NET PROFIT/LOSS 2,672 1,601 952 204
Earnings per share (SEK) 9 5.04 4.20 1.50 0.77Earnings per share, after dilution (SEK) 9 5.03 4.20 1.50 0.77
Tele2 – Full Year and Fourth Quarter Report 2017 11 (34)
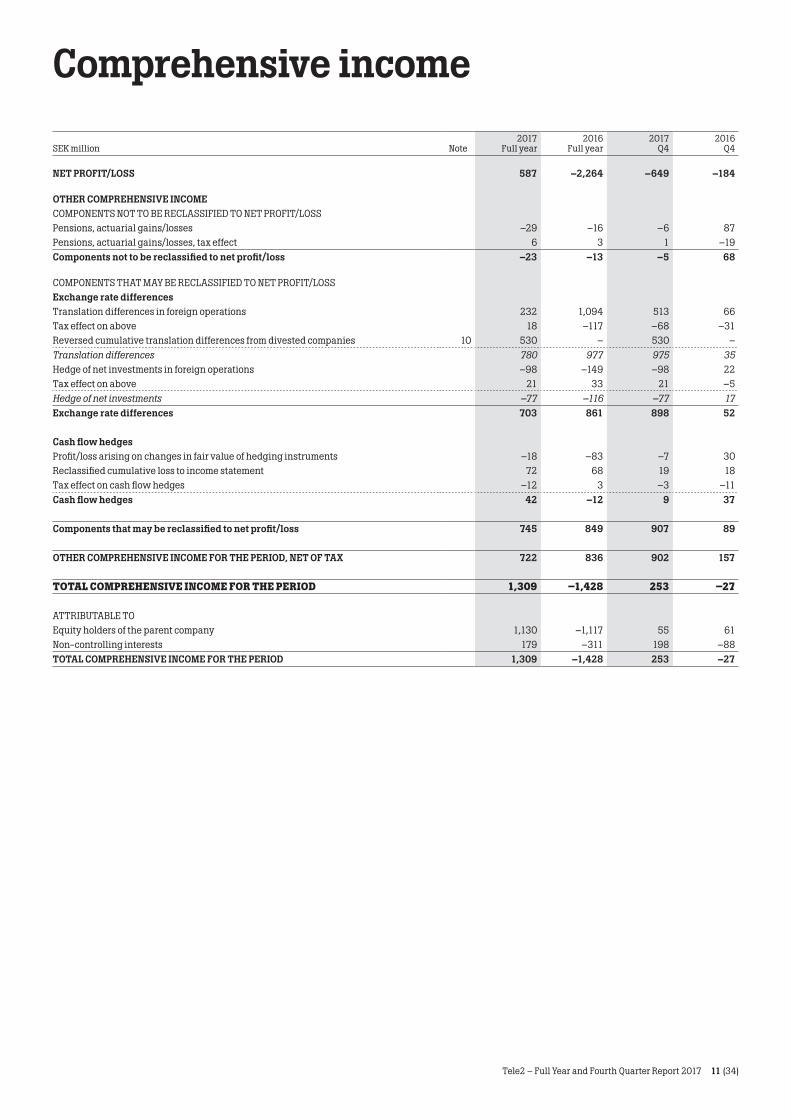
Comprehensive income
SEK million Note2017
Full year2016
Full year2017
Q42016
Q4
NET PROFIT/LOSS 587 –2,264 –649 –184
OTHER COMPREHENSIVE INCOMECOMPONENTS NOT TO BE RECLASSIFIED TO NET PROFIT/LOSSPensions, actuarial gains/losses –29 –16 –6 87Pensions, actuarial gains/losses, tax effect 6 3 1 –19Components not to be reclassified to net profit/loss –23 –13 –5 68
COMPONENTS THAT MAY BE RECLASSIFIED TO NET PROFIT/LOSSExchange rate differencesTranslation differences in foreign operations 232 1,094 513 66Tax effect on above 18 –117 –68 –31Reversed cumulative translation differences from divested companies 10 530 – 530 –Translation differences 780 977 975 35Hedge of net investments in foreign operations –98 –149 –98 22Tax effect on above 21 33 21 –5Hedge of net investments –77 –116 –77 17Exchange rate differences 703 861 898 52
Cash flow hedgesProfit/loss arising on changes in fair value of hedging instruments –18 –83 –7 30Reclassified cumulative loss to income statement 72 68 19 18Tax effect on cash flow hedges –12 3 –3 –11Cash flow hedges 42 –12 9 37
Components that may be reclassified to net profit/loss 745 849 907 89
OTHER COMPREHENSIVE INCOME FOR THE PERIOD, NET OF TAX 722 836 902 157
TOTAL COMPREHENSIVE INCOME FOR THE PERIOD 1,309 –1,428 253 –27
ATTRIBUTABLE TOEquity holders of the parent company 1,130 –1,117 55 61Non-controlling interests 179 –311 198 –88TOTAL COMPREHENSIVE INCOME FOR THE PERIOD 1,309 –1,428 253 –27
Tele2 – Full Year and Fourth Quarter Report 2017 12 (34)
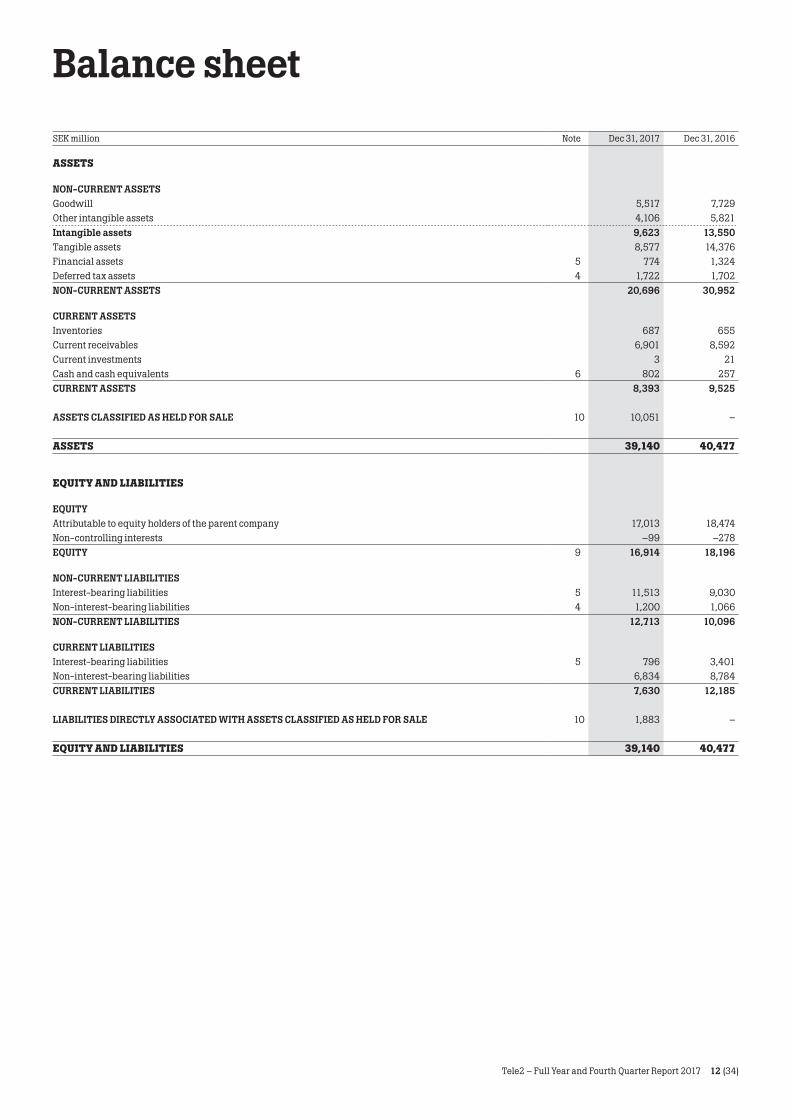
Balance sheetSEK million Note Dec 31, 2017 Dec 31, 2016
ASSETS
NON-CURRENT ASSETSGoodwill 5,517 7,729Other intangible assets 4,106 5,821Intangible assets 9,623 13,550Tangible assets 8,577 14,376Financial assets 5 774 1,324Deferred tax assets 4 1,722 1,702NON-CURRENT ASSETS 20,696 30,952
CURRENT ASSETSInventories 687 655Current receivables 6,901 8,592Current investments 3 21Cash and cash equivalents 6 802 257CURRENT ASSETS 8,393 9,525
ASSETS CLASSIFIED AS HELD FOR SALE 10 10,051 –
ASSETS 39,140 40,477
EQUITY AND LIABILITIES
EQUITYAttributable to equity holders of the parent company 17,013 18,474Non-controlling interests –99 –278EQUITY 9 16,914 18,196
NON-CURRENT LIABILITIESInterest-bearing liabilities 5 11,513 9,030Non-interest-bearing liabilities 4 1,200 1,066NON-CURRENT LIABILITIES 12,713 10,096
CURRENT LIABILITIESInterest-bearing liabilities 5 796 3,401Non-interest-bearing liabilities 6,834 8,784CURRENT LIABILITIES 7,630 12,185
LIABILITIES DIRECTLY ASSOCIATED WITH ASSETS CLASSIFIED AS HELD FOR SALE 10 1,883 –
EQUITY AND LIABILITIES 39,140 40,477
Tele2 – Full Year and Fourth Quarter Report 2017 13 (34)
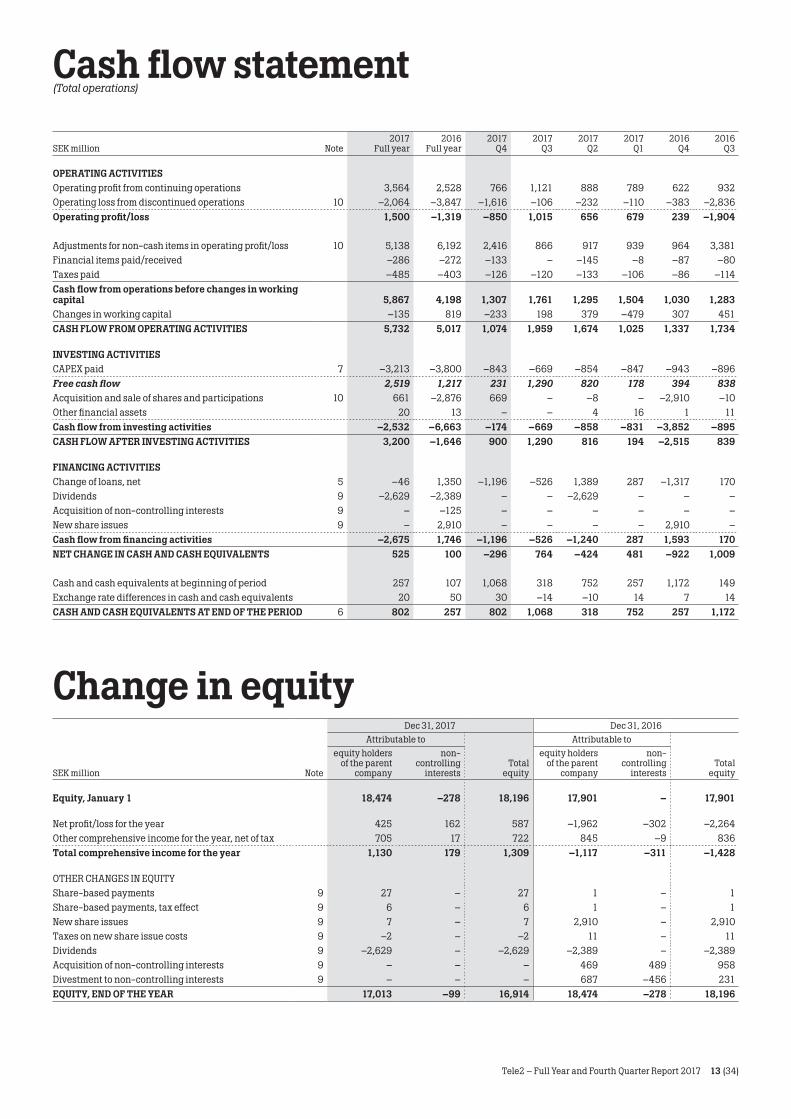
Cash flow statement(Total operations)
Change in equity
SEK million Note2017
Full year2016
Full year2017
Q42017
Q32017
Q22017
Q12016
Q42016
Q3
OPERATING ACTIVITIESOperating profit from continuing operations 3,564 2,528 766 1,121 888 789 622 932Operating loss from discontinued operations 10 –2,064 –3,847 –1,616 –106 –232 –110 –383 –2,836Operating profit/loss 1,500 –1,319 –850 1,015 656 679 239 –1,904
Adjustments for non-cash items in operating profit/loss 10 5,138 6,192 2,416 866 917 939 964 3,381Financial items paid/received –286 –272 –133 – –145 –8 –87 –80Taxes paid –485 –403 –126 –120 –133 –106 –86 –114Cash flow from operations before changes in working capital 5,867 4,198 1,307 1,761 1,295 1,504 1,030 1,283Changes in working capital –135 819 –233 198 379 –479 307 451CASH FLOW FROM OPERATING ACTIVITIES 5,732 5,017 1,074 1,959 1,674 1,025 1,337 1,734
INVESTING ACTIVITIESCAPEX paid 7 –3,213 –3,800 –843 –669 –854 –847 –943 –896Free cash flow 2,519 1,217 231 1,290 820 178 394 838Acquisition and sale of shares and participations 10 661 –2,876 669 – –8 – –2,910 –10Other financial assets 20 13 – – 4 16 1 11Cash flow from investing activities –2,532 –6,663 –174 –669 –858 –831 –3,852 –895CASH FLOW AFTER INVESTING ACTIVITIES 3,200 –1,646 900 1,290 816 194 –2,515 839
FINANCING ACTIVITIESChange of loans, net 5 –46 1,350 –1,196 –526 1,389 287 –1,317 170Dividends 9 –2,629 –2,389 – – –2,629 – – –Acquisition of non-controlling interests 9 – –125 – – – – – –New share issues 9 – 2,910 – – – – 2,910 –Cash flow from financing activities –2,675 1,746 –1,196 –526 –1,240 287 1,593 170NET CHANGE IN CASH AND CASH EQUIVALENTS 525 100 –296 764 –424 481 –922 1,009
Cash and cash equivalents at beginning of period 257 107 1,068 318 752 257 1,172 149Exchange rate differences in cash and cash equivalents 20 50 30 –14 –10 14 7 14CASH AND CASH EQUIVALENTS AT END OF THE PERIOD 6 802 257 802 1,068 318 752 257 1,172
Dec 31, 2017 Dec 31, 2016Attributable to Attributable to
SEK million Note
equity holders of the parent
company
non- controlling
interestsTotal
equity
equity holders of the parent
company
non- controlling
interestsTotal
equity
Equity, January 1 18,474 –278 18,196 17,901 – 17,901
Net profit/loss for the year 425 162 587 –1,962 –302 –2,264Other comprehensive income for the year, net of tax 705 17 722 845 –9 836Total comprehensive income for the year 1,130 179 1,309 –1,117 –311 –1,428
OTHER CHANGES IN EQUITYShare-based payments 9 27 – 27 1 – 1Share-based payments, tax effect 9 6 – 6 1 – 1New share issues 9 7 – 7 2,910 – 2,910Taxes on new share issue costs 9 –2 – –2 11 – 11Dividends 9 –2,629 – –2,629 –2,389 – –2,389Acquisition of non-controlling interests 9 – – – 469 489 958Divestment to non-controlling interests 9 – – – 687 –456 231EQUITY, END OF THE YEAR 17,013 –99 16,914 18,474 –278 18,196
Tele2 – Full Year and Fourth Quarter Report 2017 14 (34)
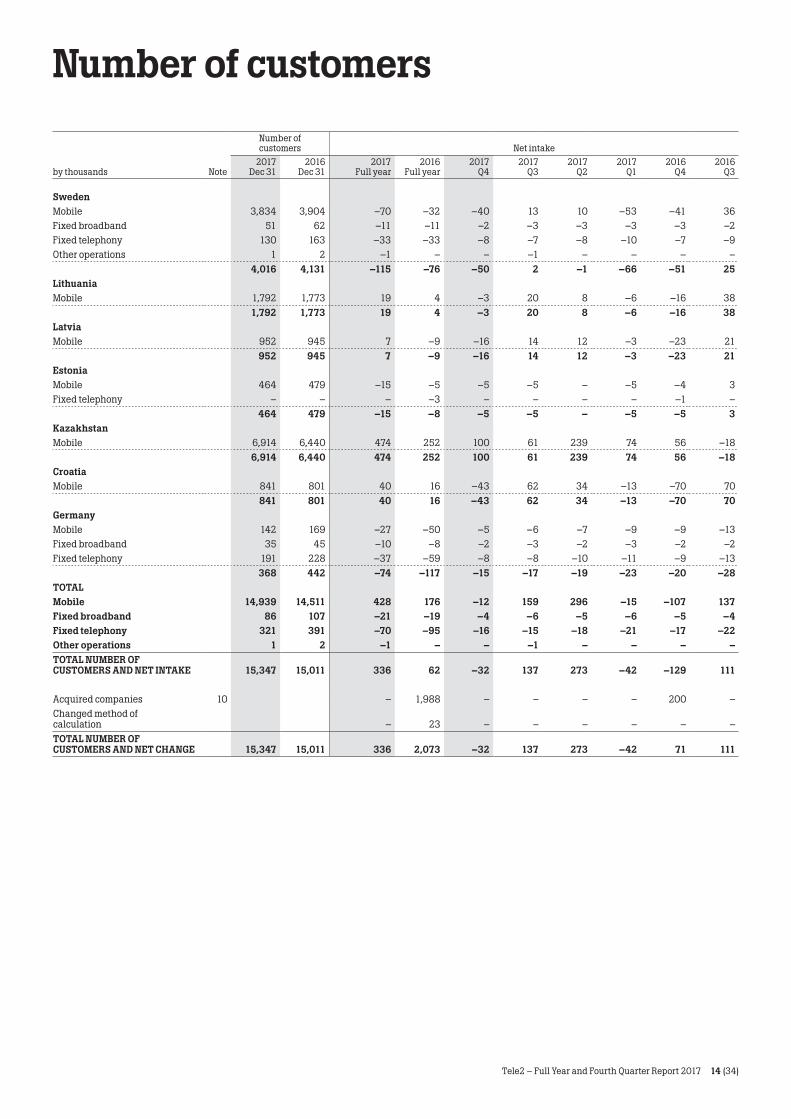
Number of customersNumber of customers Net intake
by thousands Note2017
Dec 312016
Dec 312017
Full year2016
Full year2017
Q42017
Q32017
Q22017
Q12016
Q42016
Q3
SwedenMobile 3,834 3,904 –70 –32 –40 13 10 –53 –41 36Fixed broadband 51 62 –11 –11 –2 –3 –3 –3 –3 –2Fixed telephony 130 163 –33 –33 –8 –7 –8 –10 –7 –9Other operations 1 2 –1 – – –1 – – – –
4,016 4,131 –115 –76 –50 2 –1 –66 –51 25LithuaniaMobile 1,792 1,773 19 4 –3 20 8 –6 –16 38
1,792 1,773 19 4 –3 20 8 –6 –16 38LatviaMobile 952 945 7 –9 –16 14 12 –3 –23 21
952 945 7 –9 –16 14 12 –3 –23 21EstoniaMobile 464 479 –15 –5 –5 –5 – –5 –4 3Fixed telephony – – – –3 – – – – –1 –
464 479 –15 –8 –5 –5 – –5 –5 3KazakhstanMobile 6,914 6,440 474 252 100 61 239 74 56 –18
6,914 6,440 474 252 100 61 239 74 56 –18CroatiaMobile 841 801 40 16 –43 62 34 –13 –70 70
841 801 40 16 –43 62 34 –13 –70 70GermanyMobile 142 169 –27 –50 –5 –6 –7 –9 –9 –13Fixed broadband 35 45 –10 –8 –2 –3 –2 –3 –2 –2Fixed telephony 191 228 –37 –59 –8 –8 –10 –11 –9 –13
368 442 –74 –117 –15 –17 –19 –23 –20 –28TOTALMobile 14,939 14,511 428 176 –12 159 296 –15 –107 137Fixed broadband 86 107 –21 –19 –4 –6 –5 –6 –5 –4Fixed telephony 321 391 –70 –95 –16 –15 –18 –21 –17 –22Other operations 1 2 –1 – – –1 – – – –TOTAL NUMBER OF CUSTOMERS AND NET INTAKE 15,347 15,011 336 62 –32 137 273 –42 –129 111
Acquired companies 10 – 1,988 – – – – 200 –Changed method of calculation – 23 – – – – – –TOTAL NUMBER OF CUSTOMERS AND NET CHANGE 15,347 15,011 336 2,073 –32 137 273 –42 71 111
Tele2 – Full Year and Fourth Quarter Report 2017 15 (34)
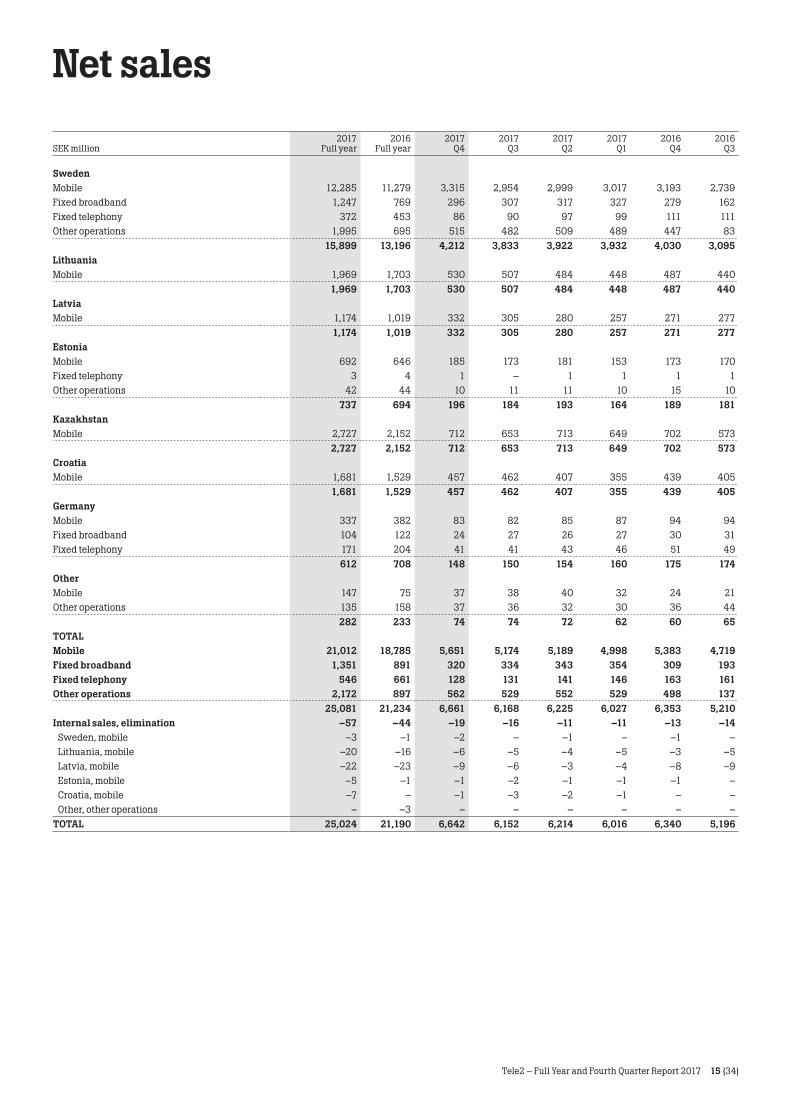
Net sales
SEK million2017
Full year2016
Full year2017
Q42017
Q32017
Q22017
Q12016
Q42016
Q3
SwedenMobile 12,285 11,279 3,315 2,954 2,999 3,017 3,193 2,739Fixed broadband 1,247 769 296 307 317 327 279 162Fixed telephony 372 453 86 90 97 99 111 111Other operations 1,995 695 515 482 509 489 447 83
15,899 13,196 4,212 3,833 3,922 3,932 4,030 3,095LithuaniaMobile 1,969 1,703 530 507 484 448 487 440
1,969 1,703 530 507 484 448 487 440LatviaMobile 1,174 1,019 332 305 280 257 271 277
1,174 1,019 332 305 280 257 271 277EstoniaMobile 692 646 185 173 181 153 173 170Fixed telephony 3 4 1 – 1 1 1 1Other operations 42 44 10 11 11 10 15 10
737 694 196 184 193 164 189 181KazakhstanMobile 2,727 2,152 712 653 713 649 702 573
2,727 2,152 712 653 713 649 702 573CroatiaMobile 1,681 1,529 457 462 407 355 439 405
1,681 1,529 457 462 407 355 439 405GermanyMobile 337 382 83 82 85 87 94 94Fixed broadband 104 122 24 27 26 27 30 31Fixed telephony 171 204 41 41 43 46 51 49
612 708 148 150 154 160 175 174OtherMobile 147 75 37 38 40 32 24 21Other operations 135 158 37 36 32 30 36 44
282 233 74 74 72 62 60 65TOTALMobile 21,012 18,785 5,651 5,174 5,189 4,998 5,383 4,719Fixed broadband 1,351 891 320 334 343 354 309 193Fixed telephony 546 661 128 131 141 146 163 161Other operations 2,172 897 562 529 552 529 498 137
25,081 21,234 6,661 6,168 6,225 6,027 6,353 5,210Internal sales, elimination –57 –44 –19 –16 –11 –11 –13 –14 Sweden, mobile –3 –1 –2 – –1 – –1 – Lithuania, mobile –20 –16 –6 –5 –4 –5 –3 –5 Latvia, mobile –22 –23 –9 –6 –3 –4 –8 –9 Estonia, mobile –5 –1 –1 –2 –1 –1 –1 – Croatia, mobile –7 – –1 –3 –2 –1 – – Other, other operations – –3 – – – – – –TOTAL 25,024 21,190 6,642 6,152 6,214 6,016 6,340 5,196
Tele2 – Full Year and Fourth Quarter Report 2017 16 (34)
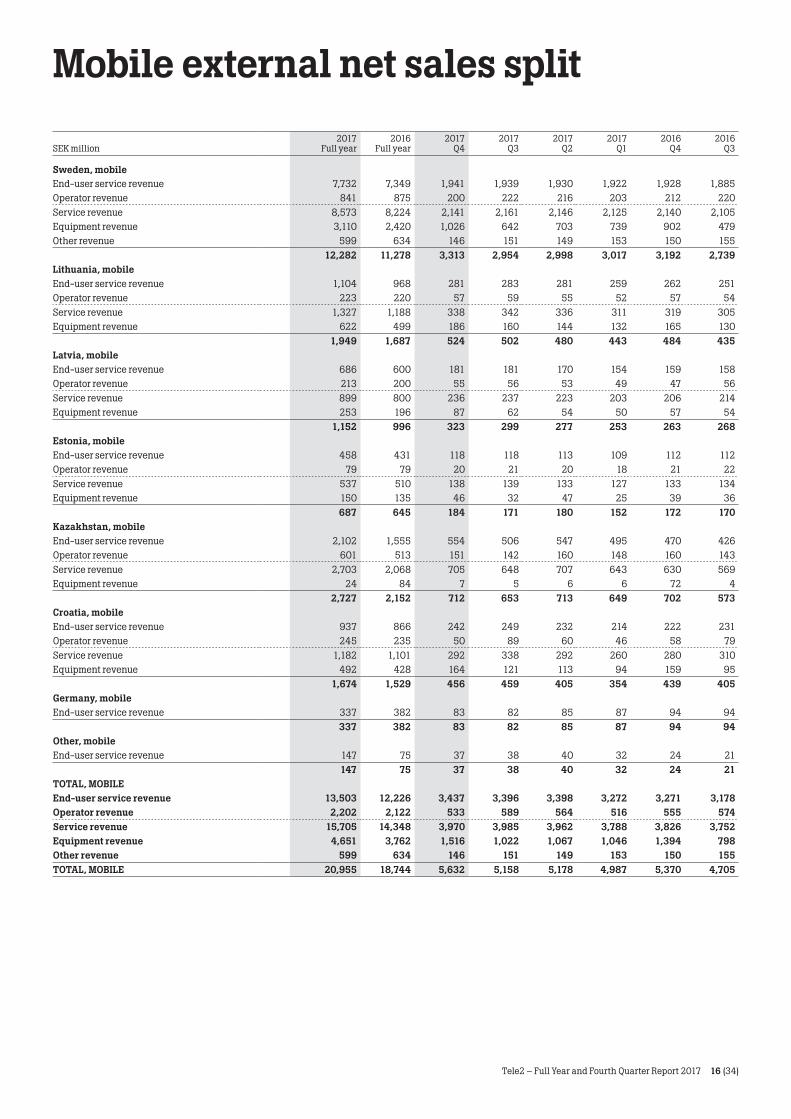
Mobile external net sales split
SEK million2017
Full year2016
Full year2017
Q42017
Q32017
Q22017
Q12016
Q42016
Q3
Sweden, mobileEnd-user service revenue 7,732 7,349 1,941 1,939 1,930 1,922 1,928 1,885Operator revenue 841 875 200 222 216 203 212 220Service revenue 8,573 8,224 2,141 2,161 2,146 2,125 2,140 2,105Equipment revenue 3,110 2,420 1,026 642 703 739 902 479Other revenue 599 634 146 151 149 153 150 155
12,282 11,278 3,313 2,954 2,998 3,017 3,192 2,739Lithuania, mobileEnd-user service revenue 1,104 968 281 283 281 259 262 251Operator revenue 223 220 57 59 55 52 57 54Service revenue 1,327 1,188 338 342 336 311 319 305Equipment revenue 622 499 186 160 144 132 165 130
1,949 1,687 524 502 480 443 484 435Latvia, mobileEnd-user service revenue 686 600 181 181 170 154 159 158Operator revenue 213 200 55 56 53 49 47 56Service revenue 899 800 236 237 223 203 206 214Equipment revenue 253 196 87 62 54 50 57 54
1,152 996 323 299 277 253 263 268Estonia, mobileEnd-user service revenue 458 431 118 118 113 109 112 112Operator revenue 79 79 20 21 20 18 21 22Service revenue 537 510 138 139 133 127 133 134Equipment revenue 150 135 46 32 47 25 39 36
687 645 184 171 180 152 172 170Kazakhstan, mobileEnd-user service revenue 2,102 1,555 554 506 547 495 470 426Operator revenue 601 513 151 142 160 148 160 143Service revenue 2,703 2,068 705 648 707 643 630 569Equipment revenue 24 84 7 5 6 6 72 4
2,727 2,152 712 653 713 649 702 573Croatia, mobileEnd-user service revenue 937 866 242 249 232 214 222 231Operator revenue 245 235 50 89 60 46 58 79Service revenue 1,182 1,101 292 338 292 260 280 310Equipment revenue 492 428 164 121 113 94 159 95
1,674 1,529 456 459 405 354 439 405Germany, mobileEnd-user service revenue 337 382 83 82 85 87 94 94
337 382 83 82 85 87 94 94Other, mobileEnd-user service revenue 147 75 37 38 40 32 24 21
147 75 37 38 40 32 24 21TOTAL, MOBILEEnd-user service revenue 13,503 12,226 3,437 3,396 3,398 3,272 3,271 3,178Operator revenue 2,202 2,122 533 589 564 516 555 574Service revenue 15,705 14,348 3,970 3,985 3,962 3,788 3,826 3,752Equipment revenue 4,651 3,762 1,516 1,022 1,067 1,046 1,394 798Other revenue 599 634 146 151 149 153 150 155TOTAL, MOBILE 20,955 18,744 5,632 5,158 5,178 4,987 5,370 4,705
Tele2 – Full Year and Fourth Quarter Report 2017 17 (34)
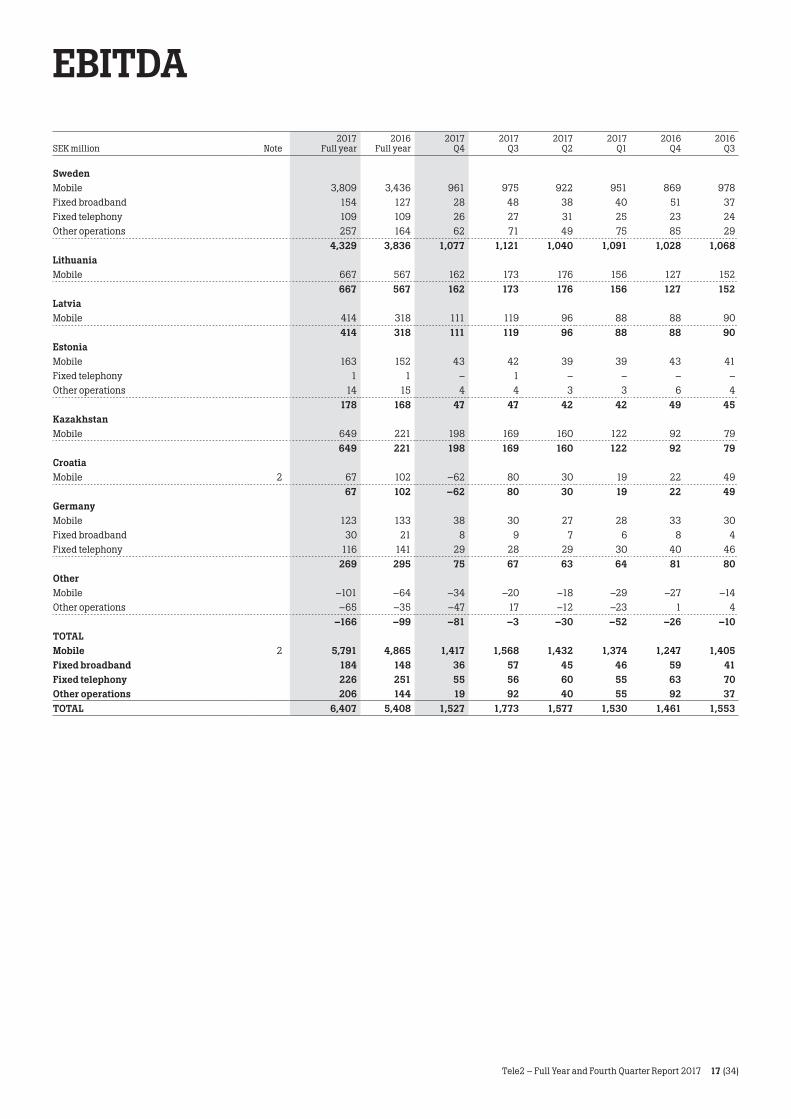
EBITDA
SEK million Note2017
Full year2016
Full year2017
Q42017
Q32017
Q22017
Q12016
Q42016
Q3
SwedenMobile 3,809 3,436 961 975 922 951 869 978Fixed broadband 154 127 28 48 38 40 51 37Fixed telephony 109 109 26 27 31 25 23 24Other operations 257 164 62 71 49 75 85 29
4,329 3,836 1,077 1,121 1,040 1,091 1,028 1,068LithuaniaMobile 667 567 162 173 176 156 127 152
667 567 162 173 176 156 127 152LatviaMobile 414 318 111 119 96 88 88 90
414 318 111 119 96 88 88 90EstoniaMobile 163 152 43 42 39 39 43 41Fixed telephony 1 1 – 1 – – – –Other operations 14 15 4 4 3 3 6 4
178 168 47 47 42 42 49 45KazakhstanMobile 649 221 198 169 160 122 92 79
649 221 198 169 160 122 92 79CroatiaMobile 2 67 102 –62 80 30 19 22 49
67 102 –62 80 30 19 22 49GermanyMobile 123 133 38 30 27 28 33 30Fixed broadband 30 21 8 9 7 6 8 4Fixed telephony 116 141 29 28 29 30 40 46
269 295 75 67 63 64 81 80OtherMobile –101 –64 –34 –20 –18 –29 –27 –14Other operations –65 –35 –47 17 –12 –23 1 4
–166 –99 –81 –3 –30 –52 –26 –10TOTALMobile 2 5,791 4,865 1,417 1,568 1,432 1,374 1,247 1,405Fixed broadband 184 148 36 57 45 46 59 41Fixed telephony 226 251 55 56 60 55 63 70Other operations 206 144 19 92 40 55 92 37TOTAL 6,407 5,408 1,527 1,773 1,577 1,530 1,461 1,553
Tele2 – Full Year and Fourth Quarter Report 2017 18 (34)
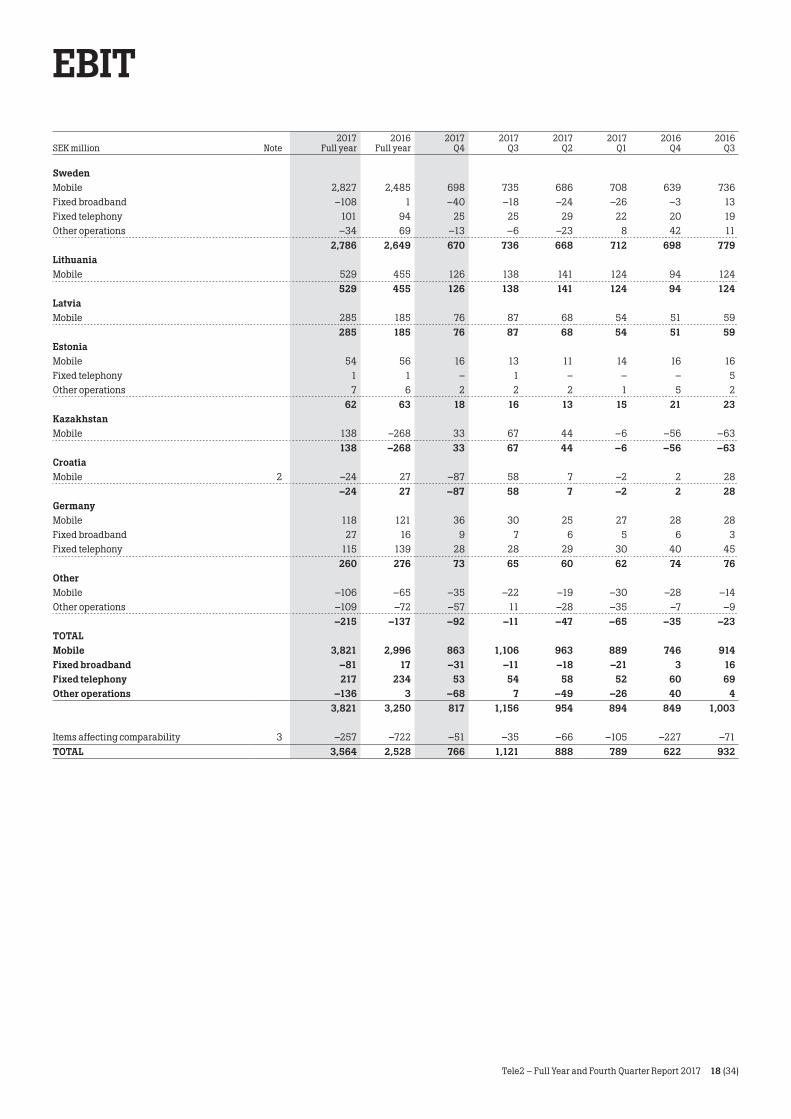
EBIT
SEK million Note2017
Full year2016
Full year2017
Q42017
Q32017
Q22017
Q12016
Q42016
Q3
SwedenMobile 2,827 2,485 698 735 686 708 639 736Fixed broadband –108 1 –40 –18 –24 –26 –3 13Fixed telephony 101 94 25 25 29 22 20 19Other operations –34 69 –13 –6 –23 8 42 11
2,786 2,649 670 736 668 712 698 779LithuaniaMobile 529 455 126 138 141 124 94 124
529 455 126 138 141 124 94 124LatviaMobile 285 185 76 87 68 54 51 59
285 185 76 87 68 54 51 59EstoniaMobile 54 56 16 13 11 14 16 16Fixed telephony 1 1 – 1 – – – 5Other operations 7 6 2 2 2 1 5 2
62 63 18 16 13 15 21 23KazakhstanMobile 138 –268 33 67 44 –6 –56 –63
138 –268 33 67 44 –6 –56 –63CroatiaMobile 2 –24 27 –87 58 7 –2 2 28
–24 27 –87 58 7 –2 2 28GermanyMobile 118 121 36 30 25 27 28 28Fixed broadband 27 16 9 7 6 5 6 3Fixed telephony 115 139 28 28 29 30 40 45
260 276 73 65 60 62 74 76OtherMobile –106 –65 –35 –22 –19 –30 –28 –14Other operations –109 –72 –57 11 –28 –35 –7 –9
–215 –137 –92 –11 –47 –65 –35 –23TOTALMobile 3,821 2,996 863 1,106 963 889 746 914Fixed broadband –81 17 –31 –11 –18 –21 3 16Fixed telephony 217 234 53 54 58 52 60 69Other operations –136 3 –68 7 –49 –26 40 4
3,821 3,250 817 1,156 954 894 849 1,003
Items affecting comparability 3 –257 –722 –51 –35 –66 –105 –227 –71TOTAL 3,564 2,528 766 1,121 888 789 622 932
Tele2 – Full Year and Fourth Quarter Report 2017 19 (34)
CAPEX
SEK million Note2017
Full year2016
Full year2017
Q42017
Q32017
Q22017
Q12016
Q42016
Q3
SwedenMobile 456 665 169 106 119 62 203 193Fixed broadband 159 78 54 31 42 32 38 17Fixed telephony 12 12 6 2 3 1 3 4Other operations 119 141 35 25 32 27 105 –4
746 896 264 164 196 122 349 210LithuaniaMobile 114 228 37 25 23 29 25 23
114 228 37 25 23 29 25 23LatviaMobile 83 68 27 19 20 17 17 9
83 68 27 19 20 17 17 9EstoniaMobile 83 71 27 22 20 14 14 20
83 71 27 22 20 14 14 20KazakhstanMobile 501 514 148 56 168 129 195 134
501 514 148 56 168 129 195 134CroatiaMobile 90 130 36 22 25 7 30 16
90 130 36 22 25 7 30 16GermanyMobile – 1 – – – 1 –1Fixed broadband – 2 – – – – 1
– 3 – – – 1 –OtherMobile 30 – 12 8 7 3 – –Other operations 289 409 111 61 54 63 132 95
319 409 123 69 61 66 132 95TOTALMobile 1,357 1,677 456 258 382 261 485 394Fixed broadband 159 80 54 31 42 32 38 18Fixed telephony 12 12 6 2 3 1 3 4Other operations 408 550 146 86 86 90 237 91TOTAL 7 1,936 2,319 662 377 513 384 763 507
Tele2 – Full Year and Fourth Quarter Report 2017 20 (34)
Five-year summarySEK million Note 2017 2016 2015 2014 2013
CONTINUING OPERATIONSNet sales 25,024 21,190 19,924 19,307 19,078Numbers of customers (by thousands) 15,347 15,011 12,938 12,081 12,122EBITDA 6,407 5,408 5,186 4,822 4,383EBIT 3,564 2,528 2,846 3,164 1,742EBT 2,934 2,517 2,432 3,177 1,192Net profit 2,672 1,601 1,649 2,420 329
Key ratiosEBITDA margin, % 25.6 25.5 26.0 25.0 23.0EBIT margin, % 14.2 11.9 14.3 16.4 9.1
Value per share (SEK)Net profit 9 5.04 4.20 3.60 5.29 0.72Net profit after dilution 9 5.03 4.20 3.58 5.26 0.71
TOTALEquity 16,914 18,196 17,901 22,682 21,591Total assets 39,140 40,477 36,149 39,848 39,855Cash flow from operating activities 5,732 5,017 3,529 4,578 5,813Free cash flow 7 2,519 1,217 –486 432 572Available liquidity 10,737 10,042 7,890 8,224 9,306Net debt 5 10,474 10,628 9,878 8,135 7,328Economic net debt 5 9,770 10,437 9,878 8,135 7,328Net investments in intangible and tangible assets, CAPEX 2,964 3,831 4,240 3,976 5,534
Key ratiosDebt/equity ratio, multiple 0.62 0.58 0.55 0.36 0.34Equity/assets ratio, % 43 45 50 57 54ROCE, return on capital employed, % 9 5.3 –4.5 14.0 10.1 48.0Average interest rate, % 2.3 2.7 4.1 4.7 5.2
Value per share (SEK)Net profit/loss 9 0.85 –4.34 6.52 4.83 31.90Net profit/loss after dilution 9 0.84 –4.34 6.48 4.80 31.69Equity 9 33.85 40.86 39.07 49.55 47.20Cash flow from operating activities 9 11.40 11.10 7.70 10.00 12.71Dividend, ordinary 4.001) 5.23 5.35 4.85 4.40Extraordinary dividend – – – 10.00 –Redemption – – – – 28.00Market price at closing day 100.80 73.05 84.75 94.95 72.851) Proposed dividend
Tele2 – Full Year and Fourth Quarter Report 2017 21 (34)
Parent companyIncome statement
SEK million 2017 2016
Net sales 59 28Administrative expenses –123 –105Operating loss, EBIT –64 –77
Dividend from group company 7,000 –Exchange rate difference on financial items –42 –131Net interest expenses and other financial items –246 –272Profit/loss after financial items, EBT 6,648 –480
Appropriations, group contribution 348 774Tax on profit/loss 1 –65NET PROFIT 6,997 229
Balance sheet
SEK million Note Dec 31, 2017 Dec 31, 2016
ASSETS
NON-CURRENT ASSETSTangible assets – 1Financial assets 13,608 13,617NON-CURRENT ASSETS 13,608 13,618
CURRENT ASSETSCurrent receivables 13,065 8,521Cash and cash equivalents – 4CURRENT ASSETS 13,065 8,525
ASSETS 26,673 22,143
EQUITY AND LIABILITIES
EQUITYRestricted equity 9 5,619 5,619Unrestricted equity 9 10,470 6,026EQUITY 16,089 11,645
NON-CURRENT LIABILITIESInterest-bearing liabilities 5 9,830 7,485NON-CURRENT LIABILITIES 9,830 7,485
CURRENT LIABILITIESInterest-bearing liabilities 5 656 2,850Non-interest-bearing liabilities 98 163CURRENT LIABILITIES 754 3,013
EQUITY AND LIABILITIES 26,673 22,143
Tele2 – Full Year and Fourth Quarter Report 2017 22 (34)
Notes
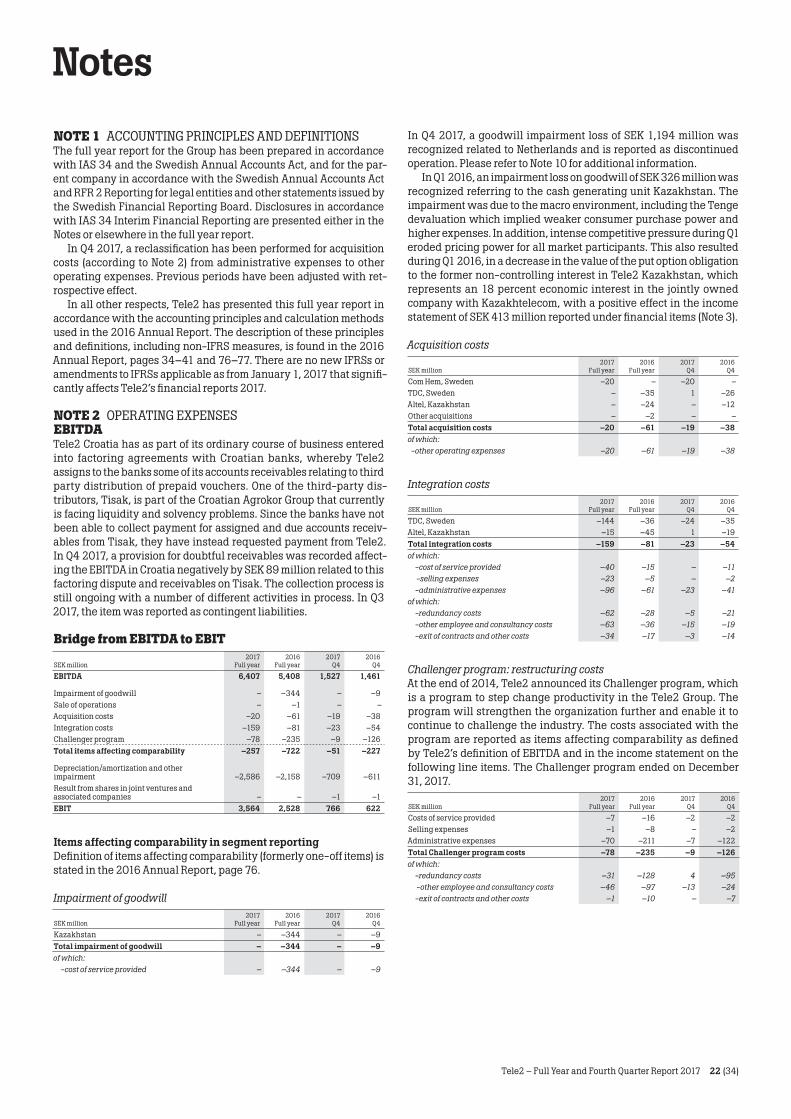
NOTE 1 ACCOUNTING PRINCIPLES AND DEFINITIONSThe full year report for the Group has been prepared in accordance with IAS 34 and the Swedish Annual Accounts Act, and for the par-ent company in accordance with the Swedish Annual Accounts Act and RFR 2 Reporting for legal entities and other statements issued by the Swedish Financial Reporting Board. Disclosures in accordance with IAS 34 Interim Financial Reporting are presented either in the Notes or elsewhere in the full year report.
In Q4 2017, a reclassification has been performed for acquisition costs (according to Note 2) from administrative expenses to other operating expenses. Previous periods have been adjusted with ret-rospective effect.
In all other respects, Tele2 has presented this full year report in accordance with the accounting principles and calculation methods used in the 2016 Annual Report. The description of these principles and definitions, including non-IFRS measures, is found in the 2016 Annual Report, pages 34–41 and 76–77. There are no new IFRSs or amendments to IFRSs applicable as from January 1, 2017 that signifi-cantly affects Tele2’s financial reports 2017.
NOTE 2 OPERATING EXPENSESEBITDATele2 Croatia has as part of its ordinary course of business entered into factoring agreements with Croatian banks, whereby Tele2 assigns to the banks some of its accounts receivables relating to third party distribution of prepaid vouchers. One of the third-party dis-tributors, Tisak, is part of the Croatian Agrokor Group that currently is facing liquidity and solvency problems. Since the banks have not been able to collect payment for assigned and due accounts receiv-ables from Tisak, they have instead requested payment from Tele2. In Q4 2017, a provision for doubtful receivables was recorded affect-ing the EBITDA in Croatia negatively by SEK 89 million related to this factoring dispute and receivables on Tisak. The collection process is still ongoing with a number of different activities in process. In Q3 2017, the item was reported as contingent liabilities.
Bridge from EBITDA to EBIT
SEK million2017
Full year2016
Full year2017
Q42016
Q4
EBITDA 6,407 5,408 1,527 1,461
Impairment of goodwill – –344 – –9Sale of operations – –1 – –Acquisition costs –20 –61 –19 –38Integration costs –159 –81 –23 –54Challenger program –78 –235 –9 –126Total items affecting comparability –257 –722 –51 –227
Depreciation/amortization and other impairment –2,586 –2,158 –709 –611Result from shares in joint ventures and associated companies – – –1 –1EBIT 3,564 2,528 766 622
Items affecting comparability in segment reportingDefinition of items affecting comparability (formerly one-off items) is stated in the 2016 Annual Report, page 76.
Impairment of goodwill
SEK million2017
Full year2016
Full year2017
Q42016
Q4
Kazakhstan – –344 – –9Total impairment of goodwill – –344 – –9of which: -cost of service provided – –344 – –9
In Q4 2017, a goodwill impairment loss of SEK 1,194 million was recognized related to Netherlands and is reported as discontinued operation. Please refer to Note 10 for additional information.
In Q1 2016, an impairment loss on goodwill of SEK 326 million was recognized referring to the cash generating unit Kazakhstan. The impairment was due to the macro environment, including the Tenge devaluation which implied weaker consumer purchase power and higher expenses. In addition, intense competitive pressure during Q1 eroded pricing power for all market participants. This also resulted during Q1 2016, in a decrease in the value of the put option obligation to the former non-controlling interest in Tele2 Kazakhstan, which represents an 18 percent economic interest in the jointly owned company with Kazakhtelecom, with a positive effect in the income statement of SEK 413 million reported under financial items (Note 3).
Acquisition costs
SEK million2017
Full year2016
Full year2017
Q42016
Q4
Com Hem, Sweden –20 – –20 –TDC, Sweden – –35 1 –26Altel, Kazakhstan – –24 – –12Other acquisitions – –2 – –Total acquisition costs –20 –61 –19 –38of which: -other operating expenses –20 –61 –19 –38
Integration costs
SEK million2017
Full year2016
Full year2017
Q42016
Q4
TDC, Sweden –144 –36 –24 –35Altel, Kazakhstan –15 –45 1 –19Total integration costs –159 –81 –23 –54of which: -cost of service provided –40 –15 – –11 -selling expenses –23 –5 – –2 -administrative expenses –96 –61 –23 –41of which: -redundancy costs –62 –28 –5 –21 -other employee and consultancy costs –63 –36 –15 –19 -exit of contracts and other costs –34 –17 –3 –14
Challenger program: restructuring costsAt the end of 2014, Tele2 announced its Challenger program, which is a program to step change productivity in the Tele2 Group. The program will strengthen the organization further and enable it to continue to challenge the industry. The costs associated with the program are reported as items affecting comparability as defined by Tele2’s definition of EBITDA and in the income statement on the following line items. The Challenger program ended on December 31, 2017.
SEK million2017
Full year2016
Full year2017
Q42016
Q4
Costs of service provided –7 –16 –2 –2Selling expenses –1 –8 – –2Administrative expenses –70 –211 –7 –122Total Challenger program costs –78 –235 –9 –126of which: -redundancy costs –31 –128 4 –95 -other employee and consultancy costs –46 –97 –13 –24 -exit of contracts and other costs –1 –10 – –7
Tele2 – Full Year and Fourth Quarter Report 2017 23 (34)
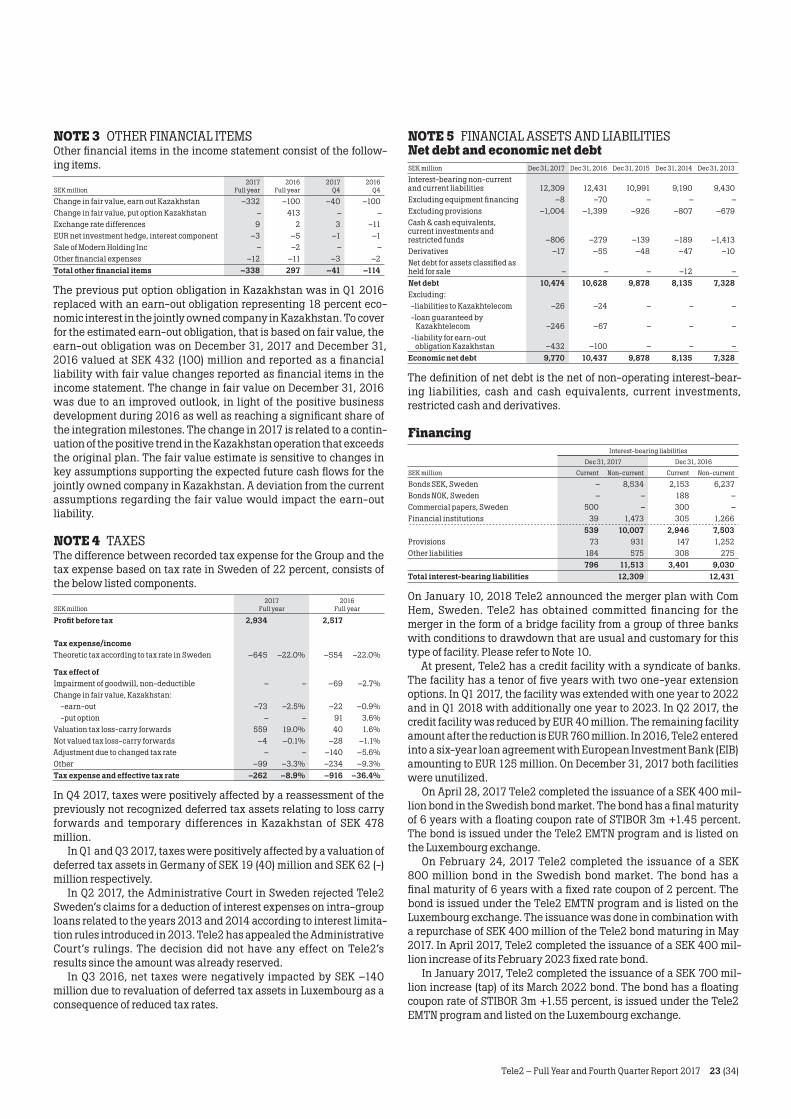
NOTE 3 OTHER FINANCIAL ITEMSOther financial items in the income statement consist of the follow-ing items.
SEK million2017
Full year2016
Full year2017
Q42016
Q4
Change in fair value, earn out Kazakhstan –332 –100 –40 –100Change in fair value, put option Kazakhstan – 413 – –Exchange rate differences 9 2 3 –11EUR net investment hedge, interest component –3 –5 –1 –1Sale of Modern Holding Inc – –2 – –Other financial expenses –12 –11 –3 –2Total other financial items –338 297 –41 –114
The previous put option obligation in Kazakhstan was in Q1 2016 replaced with an earn-out obligation representing 18 percent eco-nomic interest in the jointly owned company in Kazakhstan. To cover for the estimated earn-out obligation, that is based on fair value, the earn-out obligation was on December 31, 2017 and December 31, 2016 valued at SEK 432 (100) million and reported as a financial liability with fair value changes reported as financial items in the income statement. The change in fair value on December 31, 2016 was due to an improved outlook, in light of the positive business development during 2016 as well as reaching a significant share of the integration milestones. The change in 2017 is related to a contin-uation of the positive trend in the Kazakhstan operation that exceeds the original plan. The fair value estimate is sensitive to changes in key assumptions supporting the expected future cash flows for the jointly owned company in Kazakhstan. A deviation from the current assumptions regarding the fair value would impact the earn-out liability.
NOTE 4 TAXESThe difference between recorded tax expense for the Group and the tax expense based on tax rate in Sweden of 22 percent, consists of the below listed components.
SEK million2017
Full year2016
Full year
Profit before tax 2,934 2,517
Tax expense/incomeTheoretic tax according to tax rate in Sweden –645 –22.0% –554 –22.0%
Tax effect ofImpairment of goodwill, non-deductible – – –69 –2.7%Change in fair value, Kazakhstan: -earn-out –73 –2.5% –22 –0.9% -put option – – 91 3.6%Valuation tax loss-carry forwards 559 19.0% 40 1.6%Not valued tax loss-carry forwards –4 –0.1% –28 –1.1%Adjustment due to changed tax rate – – –140 –5.6%Other –99 –3.3% –234 –9.3%Tax expense and effective tax rate –262 –8.9% –916 –36.4%
In Q4 2017, taxes were positively affected by a reassessment of the previously not recognized deferred tax assets relating to loss carry forwards and temporary differences in Kazakhstan of SEK 478 million.
In Q1 and Q3 2017, taxes were positively affected by a valuation of deferred tax assets in Germany of SEK 19 (40) million and SEK 62 (-) million respectively.
In Q2 2017, the Administrative Court in Sweden rejected Tele2 Sweden’s claims for a deduction of interest expenses on intra-group loans related to the years 2013 and 2014 according to interest limita-tion rules introduced in 2013. Tele2 has appealed the Administrative Court’s rulings. The decision did not have any effect on Tele2’s results since the amount was already reserved.
In Q3 2016, net taxes were negatively impacted by SEK –140 million due to revaluation of deferred tax assets in Luxembourg as a consequence of reduced tax rates.
NOTE 5 FINANCIAL ASSETS AND LIABILITIESNet debt and economic net debtSEK million Dec 31, 2017 Dec 31, 2016 Dec 31, 2015 Dec 31, 2014 Dec 31, 2013
Interest-bearing non-current and current liabilities 12,309 12,431 10,991 9,190 9,430Excluding equipment financing –8 –70 – – –Excluding provisions –1,004 –1,399 –926 –807 –679Cash & cash equivalents, current investments and restricted funds –806 –279 –139 –189 –1,413Derivatives –17 –55 –48 –47 –10Net debt for assets classified as held for sale – – – –12 –Net debt 10,474 10,628 9,878 8,135 7,328Excluding: -liabilities to Kazakhtelecom –26 –24 – – – - loan guaranteed by
Kazakhtelecom –246 –67 – – – - liability for earn-out
obligation Kazakhstan –432 –100 – – –Economic net debt 9,770 10,437 9,878 8,135 7,328
The definition of net debt is the net of non-operating interest-bear-ing liabilities, cash and cash equivalents, current investments, restricted cash and derivatives.
FinancingInterest-bearing liabilities
Dec 31, 2017 Dec 31, 2016
SEK million Current Non-current Current Non-current
Bonds SEK, Sweden – 8,534 2,153 6,237Bonds NOK, Sweden – – 188 –Commercial papers, Sweden 500 – 300 –Financial institutions 39 1,473 305 1,266
539 10,007 2,946 7,503Provisions 73 931 147 1,252Other liabilities 184 575 308 275
796 11,513 3,401 9,030Total interest-bearing liabilities 12,309 12,431
On January 10, 2018 Tele2 announced the merger plan with Com Hem, Sweden. Tele2 has obtained committed financing for the merger in the form of a bridge facility from a group of three banks with conditions to drawdown that are usual and customary for this type of facility. Please refer to Note 10.
At present, Tele2 has a credit facility with a syndicate of banks. The facility has a tenor of five years with two one-year extension options. In Q1 2017, the facility was extended with one year to 2022 and in Q1 2018 with additionally one year to 2023. In Q2 2017, the credit facility was reduced by EUR 40 million. The remaining facility amount after the reduction is EUR 760 million. In 2016, Tele2 entered into a six-year loan agreement with European Investment Bank (EIB) amounting to EUR 125 million. On December 31, 2017 both facilities were unutilized.
On April 28, 2017 Tele2 completed the issuance of a SEK 400 mil-lion bond in the Swedish bond market. The bond has a final maturity of 6 years with a floating coupon rate of STIBOR 3m +1.45 percent. The bond is issued under the Tele2 EMTN program and is listed on the Luxembourg exchange.
On February 24, 2017 Tele2 completed the issuance of a SEK 800 million bond in the Swedish bond market. The bond has a final maturity of 6 years with a fixed rate coupon of 2 percent. The bond is issued under the Tele2 EMTN program and is listed on the Luxembourg exchange. The issuance was done in combination with a repurchase of SEK 400 million of the Tele2 bond maturing in May 2017. In April 2017, Tele2 completed the issuance of a SEK 400 mil-lion increase of its February 2023 fixed rate bond.
In January 2017, Tele2 completed the issuance of a SEK 700 mil-lion increase (tap) of its March 2022 bond. The bond has a floating coupon rate of STIBOR 3m +1.55 percent, is issued under the Tele2 EMTN program and listed on the Luxembourg exchange.
Tele2 – Full Year and Fourth Quarter Report 2017 24 (34)
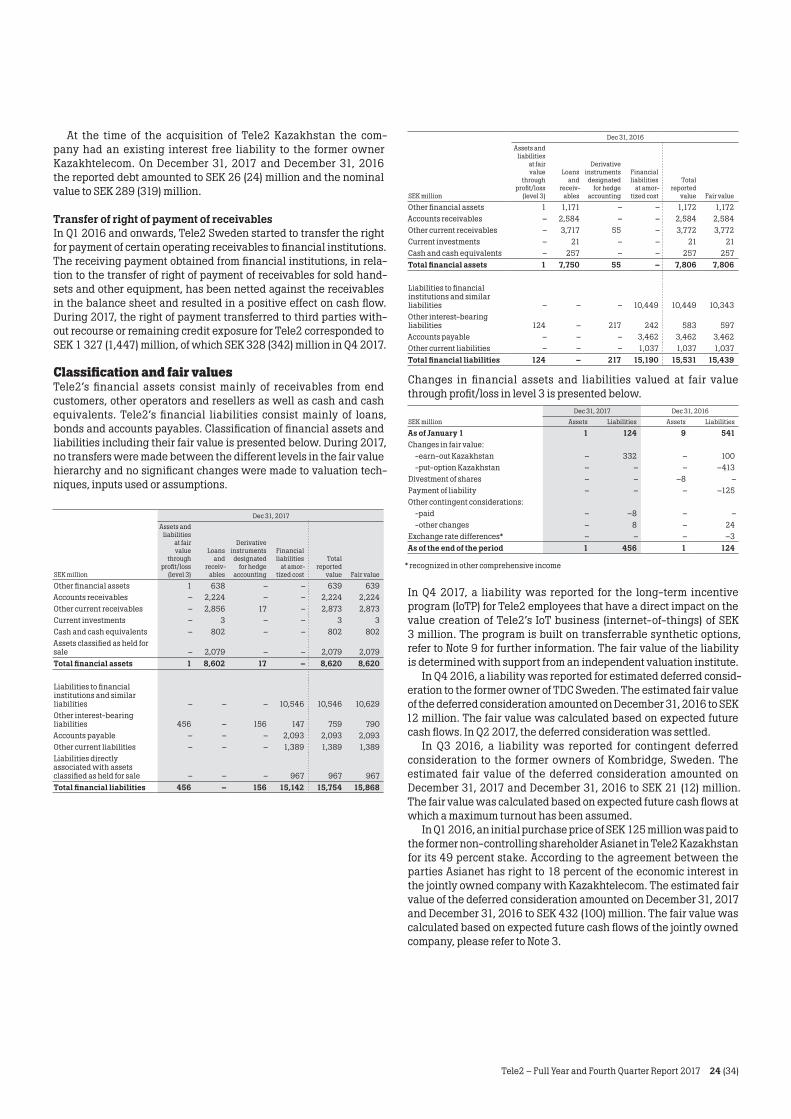
At the time of the acquisition of Tele2 Kazakhstan the com-pany had an existing interest free liability to the former owner Kazakhtelecom. On December 31, 2017 and December 31, 2016 the reported debt amounted to SEK 26 (24) million and the nominal value to SEK 289 (319) million.
Transfer of right of payment of receivablesIn Q1 2016 and onwards, Tele2 Sweden started to transfer the right for payment of certain operating receivables to financial institutions. The receiving payment obtained from financial institutions, in rela-tion to the transfer of right of payment of receivables for sold hand-sets and other equipment, has been netted against the receivables in the balance sheet and resulted in a positive effect on cash flow. During 2017, the right of payment transferred to third parties with-out recourse or remaining credit exposure for Tele2 corresponded to SEK 1 327 (1,447) million, of which SEK 328 (342) million in Q4 2017.
Classification and fair valuesTele2’s financial assets consist mainly of receivables from end customers, other operators and resellers as well as cash and cash equivalents. Tele2’s financial liabilities consist mainly of loans, bonds and accounts payables. Classification of financial assets and liabilities including their fair value is presented below. During 2017, no transfers were made between the different levels in the fair value hierarchy and no significant changes were made to valuation tech-niques, inputs used or assumptions.
Dec 31, 2017
SEK million
Assets and liabilities
at fair value
through profit/loss
(level 3)
Loans and
receiv-ables
Derivative instruments designated
for hedge accounting
Financial liabilities
at amor-tized cost
Total reported
value Fair value
Other financial assets 1 638 – – 639 639Accounts receivables – 2,224 – – 2,224 2,224Other current receivables – 2,856 17 – 2,873 2,873Current investments – 3 – – 3 3Cash and cash equivalents – 802 – – 802 802Assets classified as held for sale – 2,079 – – 2,079 2,079Total financial assets 1 8,602 17 – 8,620 8,620
Liabilities to financial institutions and similar liabilities – – – 10,546 10,546 10,629Other interest-bearing liabilities 456 – 156 147 759 790Accounts payable – – – 2,093 2,093 2,093Other current liabilities – – – 1,389 1,389 1,389Liabilities directly associated with assets classified as held for sale – – – 967 967 967Total financial liabilities 456 – 156 15,142 15,754 15,868
Dec 31, 2016
SEK million
Assets and liabilities
at fair value
through profit/loss
(level 3)
Loans and
receiv-ables
Derivative instruments designated
for hedge accounting
Financial liabilities
at amor-tized cost
Total reported
value Fair value
Other financial assets 1 1,171 – – 1,172 1,172Accounts receivables – 2,584 – – 2,584 2,584Other current receivables – 3,717 55 – 3,772 3,772Current investments – 21 – – 21 21Cash and cash equivalents – 257 – – 257 257Total financial assets 1 7,750 55 – 7,806 7,806
Liabilities to financial institutions and similar liabilities – – – 10,449 10,449 10,343Other interest-bearing liabilities 124 – 217 242 583 597Accounts payable – – – 3,462 3,462 3,462Other current liabilities – – – 1,037 1,037 1,037Total financial liabilities 124 – 217 15,190 15,531 15,439
Changes in financial assets and liabilities valued at fair value through profit/loss in level 3 is presented below.
Dec 31, 2017 Dec 31, 2016SEK million Assets Liabilities Assets Liabilities
As of January 1 1 124 9 541Changes in fair value: -earn-out Kazakhstan – 332 – 100 -put-option Kazakhstan – – – –413Divestment of shares – – –8 –Payment of liability – – – –125Other contingent considerations: -paid – –8 – – -other changes – 8 – 24Exchange rate differences* – – – –3As of the end of the period 1 456 1 124
* recognized in other comprehensive income
In Q4 2017, a liability was reported for the long-term incentive program (IoTP) for Tele2 employees that have a direct impact on the value creation of Tele2’s IoT business (internet-of-things) of SEK 3 million. The program is built on transferrable synthetic options, refer to Note 9 for further information. The fair value of the liability is determined with support from an independent valuation institute.
In Q4 2016, a liability was reported for estimated deferred consid-eration to the former owner of TDC Sweden. The estimated fair value of the deferred consideration amounted on December 31, 2016 to SEK 12 million. The fair value was calculated based on expected future cash flows. In Q2 2017, the deferred consideration was settled.
In Q3 2016, a liability was reported for contingent deferred consideration to the former owners of Kombridge, Sweden. The estimated fair value of the deferred consideration amounted on December 31, 2017 and December 31, 2016 to SEK 21 (12) million. The fair value was calculated based on expected future cash flows at which a maximum turnout has been assumed.
In Q1 2016, an initial purchase price of SEK 125 million was paid to the former non-controlling shareholder Asianet in Tele2 Kazakhstan for its 49 percent stake. According to the agreement between the parties Asianet has right to 18 percent of the economic interest in the jointly owned company with Kazakhtelecom. The estimated fair value of the deferred consideration amounted on December 31, 2017 and December 31, 2016 to SEK 432 (100) million. The fair value was calculated based on expected future cash flows of the jointly owned company, please refer to Note 3.
Tele2 – Full Year and Fourth Quarter Report 2017 25 (34)
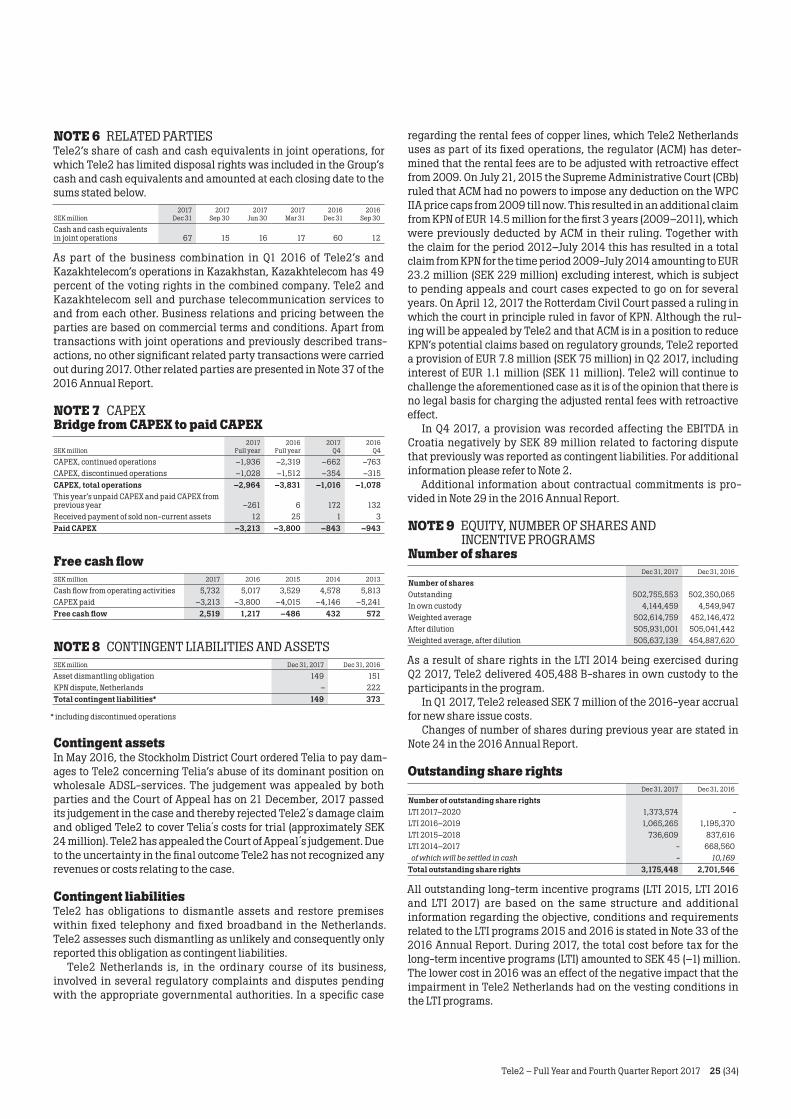
NOTE 6 RELATED PARTIESTele2’s share of cash and cash equivalents in joint operations, for which Tele2 has limited disposal rights was included in the Group’s cash and cash equivalents and amounted at each closing date to the sums stated below.
SEK million2017
Dec 312017
Sep 302017
Jun 302017
Mar 312016
Dec 312016
Sep 30
Cash and cash equivalents in joint operations 67 15 16 17 60 12
As part of the business combination in Q1 2016 of Tele2’s and Kazakhtelecom’s operations in Kazakhstan, Kazakhtelecom has 49 percent of the voting rights in the combined company. Tele2 and Kazakhtelecom sell and purchase telecommunication services to and from each other. Business relations and pricing between the parties are based on commercial terms and conditions. Apart from transactions with joint operations and previously described trans-actions, no other significant related party transactions were carried out during 2017. Other related parties are presented in Note 37 of the 2016 Annual Report.
NOTE 7 CAPEXBridge from CAPEX to paid CAPEX
SEK million2017
Full year2016
Full year2017
Q42016
Q4
CAPEX, continued operations –1,936 –2,319 –662 –763CAPEX, discontinued operations –1,028 –1,512 –354 –315CAPEX, total operations –2,964 –3,831 –1,016 –1,078This year’s unpaid CAPEX and paid CAPEX from previous year –261 6 172 132Received payment of sold non-current assets 12 25 1 3Paid CAPEX –3,213 –3,800 –843 –943
Free cash flowSEK million 2017 2016 2015 2014 2013
Cash flow from operating activities 5,732 5,017 3,529 4,578 5,813CAPEX paid –3,213 –3,800 –4,015 –4,146 –5,241Free cash flow 2,519 1,217 –486 432 572
NOTE 8 CONTINGENT LIABILITIES AND ASSETSSEK million Dec 31, 2017 Dec 31, 2016
Asset dismantling obligation 149 151KPN dispute, Netherlands – 222Total contingent liabilities* 149 373
* including discontinued operations
Contingent assetsIn May 2016, the Stockholm District Court ordered Telia to pay dam-ages to Tele2 concerning Telia’s abuse of its dominant position on wholesale ADSL-services. The judgement was appealed by both parties and the Court of Appeal has on 21 December, 2017 passed its judgement in the case and thereby rejected Tele2´s damage claim and obliged Tele2 to cover Telia´s costs for trial (approximately SEK 24 million). Tele2 has appealed the Court of Appeal´s judgement. Due to the uncertainty in the final outcome Tele2 has not recognized any revenues or costs relating to the case.
Contingent liabilitiesTele2 has obligations to dismantle assets and restore premises within fixed telephony and fixed broadband in the Netherlands. Tele2 assesses such dismantling as unlikely and consequently only reported this obligation as contingent liabilities.
Tele2 Netherlands is, in the ordinary course of its business, involved in several regulatory complaints and disputes pending with the appropriate governmental authorities. In a specific case
regarding the rental fees of copper lines, which Tele2 Netherlands uses as part of its fixed operations, the regulator (ACM) has deter-mined that the rental fees are to be adjusted with retroactive effect from 2009. On July 21, 2015 the Supreme Administrative Court (CBb) ruled that ACM had no powers to impose any deduction on the WPC IIA price caps from 2009 till now. This resulted in an additional claim from KPN of EUR 14.5 million for the first 3 years (2009–2011), which were previously deducted by ACM in their ruling. Together with the claim for the period 2012–July 2014 this has resulted in a total claim from KPN for the time period 2009-July 2014 amounting to EUR 23.2 million (SEK 229 million) excluding interest, which is subject to pending appeals and court cases expected to go on for several years. On April 12, 2017 the Rotterdam Civil Court passed a ruling in which the court in principle ruled in favor of KPN. Although the rul-ing will be appealed by Tele2 and that ACM is in a position to reduce KPN’s potential claims based on regulatory grounds, Tele2 reported a provision of EUR 7.8 million (SEK 75 million) in Q2 2017, including interest of EUR 1.1 million (SEK 11 million). Tele2 will continue to challenge the aforementioned case as it is of the opinion that there is no legal basis for charging the adjusted rental fees with retroactive effect.
In Q4 2017, a provision was recorded affecting the EBITDA in Croatia negatively by SEK 89 million related to factoring dispute that previously was reported as contingent liabilities. For additional information please refer to Note 2.
Additional information about contractual commitments is pro-vided in Note 29 in the 2016 Annual Report.
NOTE 9 EQUITY, NUMBER OF SHARES AND INCENTIVE PROGRAMS
Number of sharesDec 31, 2017 Dec 31, 2016
Number of sharesOutstanding 502,755,553 502,350,065In own custody 4,144,459 4,549,947Weighted average 502,614,759 452,146,472After dilution 505,931,001 505,041,442Weighted average, after dilution 505,637,139 454,887,620
As a result of share rights in the LTI 2014 being exercised during Q2 2017, Tele2 delivered 405,488 B-shares in own custody to the participants in the program.
In Q1 2017, Tele2 released SEK 7 million of the 2016-year accrual for new share issue costs.
Changes of number of shares during previous year are stated in Note 24 in the 2016 Annual Report.
Outstanding share rightsDec 31, 2017 Dec 31, 2016
Number of outstanding share rightsLTI 2017–2020 1,373,574 -LTI 2016–2019 1,065,265 1,195,370LTI 2015–2018 736,609 837,616LTI 2014–2017 - 668,560 of which will be settled in cash - 10,169Total outstanding share rights 3,175,448 2,701,546
All outstanding long-term incentive programs (LTI 2015, LTI 2016 and LTI 2017) are based on the same structure and additional information regarding the objective, conditions and requirements related to the LTI programs 2015 and 2016 is stated in Note 33 of the 2016 Annual Report. During 2017, the total cost before tax for the long-term incentive programs (LTI) amounted to SEK 45 (–1) million. The lower cost in 2016 was an effect of the negative impact that the impairment in Tele2 Netherlands had on the vesting conditions in the LTI programs.
Tele2 – Full Year and Fourth Quarter Report 2017 26 (34)
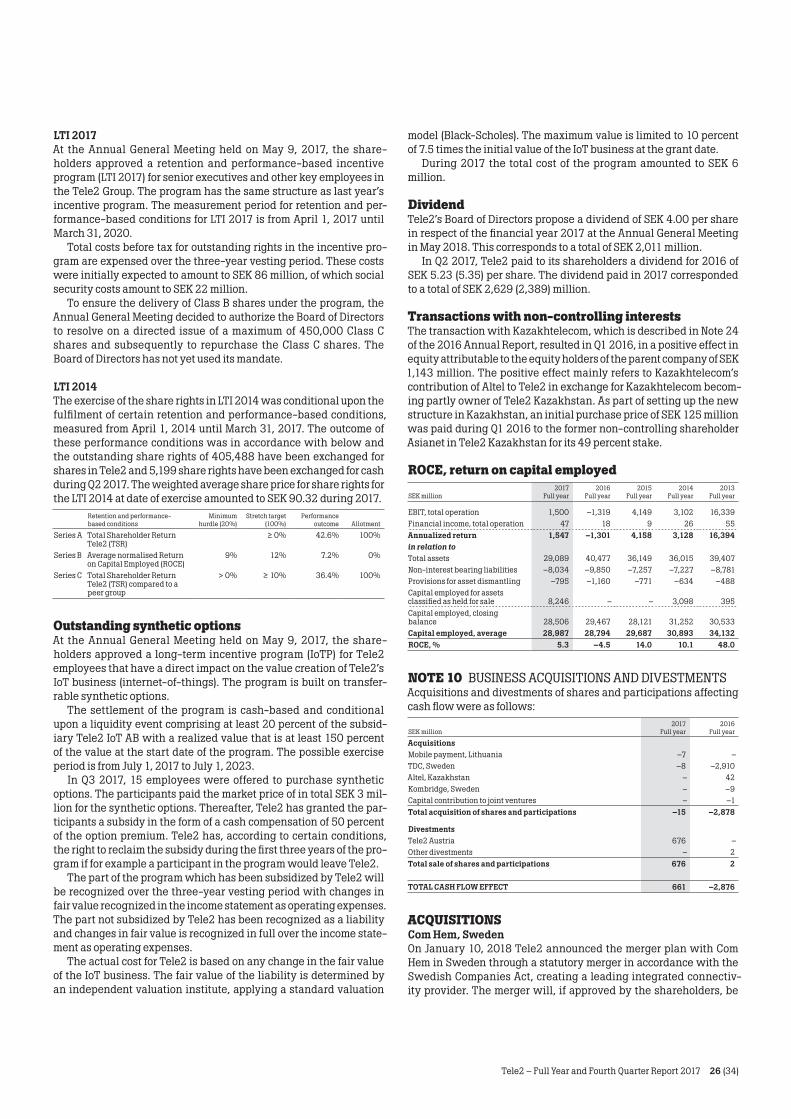
LTI 2017At the Annual General Meeting held on May 9, 2017, the share-holders approved a retention and performance-based incentive program (LTI 2017) for senior executives and other key employees in the Tele2 Group. The program has the same structure as last year’s incentive program. The measurement period for retention and per-formance-based conditions for LTI 2017 is from April 1, 2017 until March 31, 2020.
Total costs before tax for outstanding rights in the incentive pro-gram are expensed over the three-year vesting period. These costs were initially expected to amount to SEK 86 million, of which social security costs amount to SEK 22 million.
To ensure the delivery of Class B shares under the program, the Annual General Meeting decided to authorize the Board of Directors to resolve on a directed issue of a maximum of 450,000 Class C shares and subsequently to repurchase the Class C shares. The Board of Directors has not yet used its mandate.
LTI 2014The exercise of the share rights in LTI 2014 was conditional upon the fulfilment of certain retention and performance-based conditions, measured from April 1, 2014 until March 31, 2017. The outcome of these performance conditions was in accordance with below and the outstanding share rights of 405,488 have been exchanged for shares in Tele2 and 5,199 share rights have been exchanged for cash during Q2 2017. The weighted average share price for share rights for the LTI 2014 at date of exercise amounted to SEK 90.32 during 2017.
Retention and performance- based conditions
Minimum hurdle (20%)
Stretch target (100%)
Performance outcome Allotment
Series A Total Shareholder Return Tele2 (TSR)
≥ 0% 42.6% 100%
Series B Average normalised Return on Capital Employed (ROCE)
9% 12% 7.2% 0%
Series C Total Shareholder Return Tele2 (TSR) compared to a peer group
> 0% ≥ 10% 36.4% 100%
Outstanding synthetic optionsAt the Annual General Meeting held on May 9, 2017, the share-holders approved a long-term incentive program (IoTP) for Tele2 employees that have a direct impact on the value creation of Tele2’s IoT business (internet-of-things). The program is built on transfer-rable synthetic options.
The settlement of the program is cash-based and conditional upon a liquidity event comprising at least 20 percent of the subsid-iary Tele2 IoT AB with a realized value that is at least 150 percent of the value at the start date of the program. The possible exercise period is from July 1, 2017 to July 1, 2023.
In Q3 2017, 15 employees were offered to purchase synthetic options. The participants paid the market price of in total SEK 3 mil-lion for the synthetic options. Thereafter, Tele2 has granted the par-ticipants a subsidy in the form of a cash compensation of 50 percent of the option premium. Tele2 has, according to certain conditions, the right to reclaim the subsidy during the first three years of the pro-gram if for example a participant in the program would leave Tele2.
The part of the program which has been subsidized by Tele2 will be recognized over the three-year vesting period with changes in fair value recognized in the income statement as operating expenses. The part not subsidized by Tele2 has been recognized as a liability and changes in fair value is recognized in full over the income state-ment as operating expenses.
The actual cost for Tele2 is based on any change in the fair value of the IoT business. The fair value of the liability is determined by an independent valuation institute, applying a standard valuation
model (Black-Scholes). The maximum value is limited to 10 percent of 7.5 times the initial value of the IoT business at the grant date.
During 2017 the total cost of the program amounted to SEK 6 million.
DividendTele2’s Board of Directors propose a dividend of SEK 4.00 per share in respect of the financial year 2017 at the Annual General Meeting in May 2018. This corresponds to a total of SEK 2,011 million.
In Q2 2017, Tele2 paid to its shareholders a dividend for 2016 of SEK 5.23 (5.35) per share. The dividend paid in 2017 corresponded to a total of SEK 2,629 (2,389) million.
Transactions with non-controlling interestsThe transaction with Kazakhtelecom, which is described in Note 24 of the 2016 Annual Report, resulted in Q1 2016, in a positive effect in equity attributable to the equity holders of the parent company of SEK 1,143 million. The positive effect mainly refers to Kazakhtelecom’s contribution of Altel to Tele2 in exchange for Kazakhtelecom becom-ing partly owner of Tele2 Kazakhstan. As part of setting up the new structure in Kazakhstan, an initial purchase price of SEK 125 million was paid during Q1 2016 to the former non-controlling shareholder Asianet in Tele2 Kazakhstan for its 49 percent stake.
ROCE, return on capital employed
SEK million2017
Full year2016
Full year2015
Full year2014
Full year2013
Full year
EBIT, total operation 1,500 –1,319 4,149 3,102 16,339Financial income, total operation 47 18 9 26 55Annualized return 1,547 –1,301 4,158 3,128 16,394in relation toTotal assets 29,089 40,477 36,149 36,015 39,407Non-interest bearing liabilities –8,034 –9,850 –7,257 –7,227 –8,781Provisions for asset dismantling –795 –1,160 –771 –634 –488Capital employed for assets classified as held for sale 8,246 – – 3,098 395Capital employed, closing balance 28,506 29,467 28,121 31,252 30,533Capital employed, average 28,987 28,794 29,687 30,893 34,132ROCE, % 5.3 –4.5 14.0 10.1 48.0
NOTE 10 BUSINESS ACQUISITIONS AND DIVESTMENTSAcquisitions and divestments of shares and participations affecting cash flow were as follows:
SEK million2017
Full year2016
Full year
AcquisitionsMobile payment, Lithuania –7 –TDC, Sweden –8 –2,910Altel, Kazakhstan – 42Kombridge, Sweden – –9Capital contribution to joint ventures – –1Total acquisition of shares and participations –15 –2,878
DivestmentsTele2 Austria 676 –Other divestments – 2Total sale of shares and participations 676 2
TOTAL CASH FLOW EFFECT 661 –2,876
ACQUISITIONSCom Hem, SwedenOn January 10, 2018 Tele2 announced the merger plan with Com Hem in Sweden through a statutory merger in accordance with the Swedish Companies Act, creating a leading integrated connectiv-ity provider. The merger will, if approved by the shareholders, be
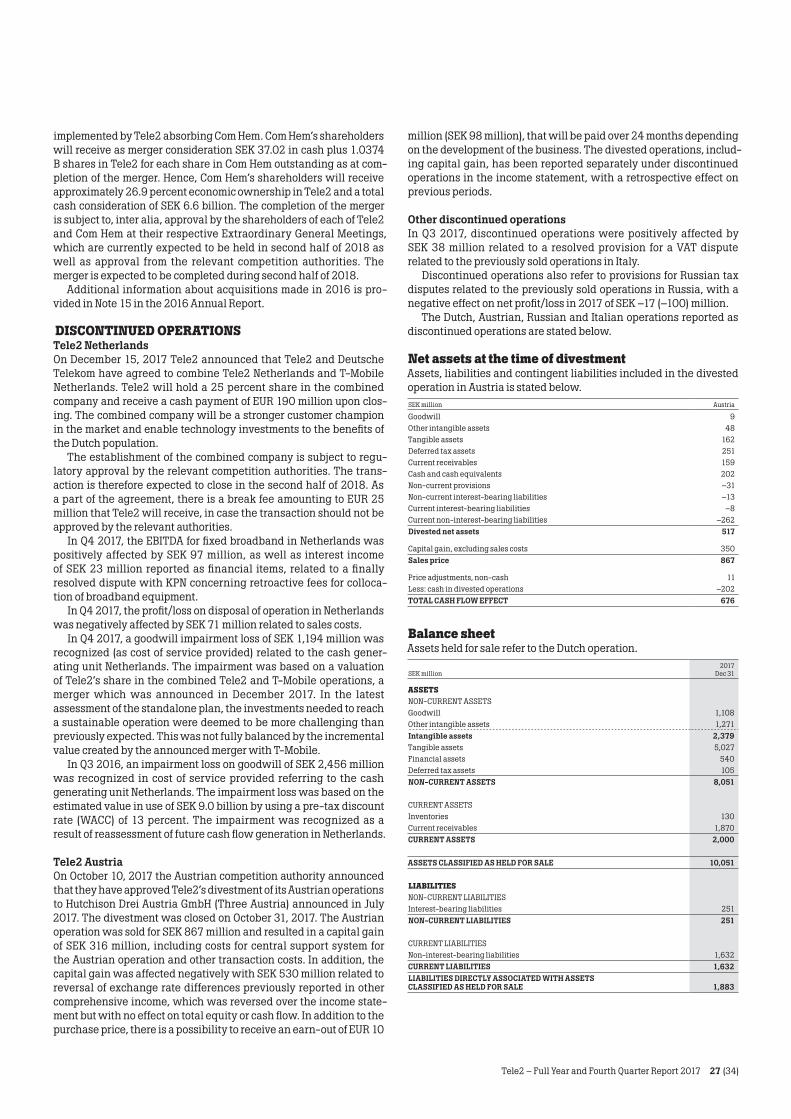
Tele2 – Full Year and Fourth Quarter Report 2017 27 (34)
implemented by Tele2 absorbing Com Hem. Com Hem’s shareholders will receive as merger consideration SEK 37.02 in cash plus 1.0374 B shares in Tele2 for each share in Com Hem outstanding as at com-pletion of the merger. Hence, Com Hem’s shareholders will receive approximately 26.9 percent economic ownership in Tele2 and a total cash consideration of SEK 6.6 billion. The completion of the merger is subject to, inter alia, approval by the shareholders of each of Tele2 and Com Hem at their respective Extraordinary General Meetings, which are currently expected to be held in second half of 2018 as well as approval from the relevant competition authorities. The merger is expected to be completed during second half of 2018.
Additional information about acquisitions made in 2016 is pro-vided in Note 15 in the 2016 Annual Report.
DISCONTINUED OPERATIONSTele2 NetherlandsOn December 15, 2017 Tele2 announced that Tele2 and Deutsche Telekom have agreed to combine Tele2 Netherlands and T-Mobile Netherlands. Tele2 will hold a 25 percent share in the combined company and receive a cash payment of EUR 190 million upon clos-ing. The combined company will be a stronger customer champion in the market and enable technology investments to the benefits of the Dutch population.
The establishment of the combined company is subject to regu-latory approval by the relevant competition authorities. The trans-action is therefore expected to close in the second half of 2018. As a part of the agreement, there is a break fee amounting to EUR 25 million that Tele2 will receive, in case the transaction should not be approved by the relevant authorities.
In Q4 2017, the EBITDA for fixed broadband in Netherlands was positively affected by SEK 97 million, as well as interest income of SEK 23 million reported as financial items, related to a finally resolved dispute with KPN concerning retroactive fees for colloca-tion of broadband equipment.
In Q4 2017, the profit/loss on disposal of operation in Netherlands was negatively affected by SEK 71 million related to sales costs.
In Q4 2017, a goodwill impairment loss of SEK 1,194 million was recognized (as cost of service provided) related to the cash gener-ating unit Netherlands. The impairment was based on a valuation of Tele2’s share in the combined Tele2 and T-Mobile operations, a merger which was announced in December 2017. In the latest assessment of the standalone plan, the investments needed to reach a sustainable operation were deemed to be more challenging than previously expected. This was not fully balanced by the incremental value created by the announced merger with T-Mobile.
In Q3 2016, an impairment loss on goodwill of SEK 2,456 million was recognized in cost of service provided referring to the cash generating unit Netherlands. The impairment loss was based on the estimated value in use of SEK 9.0 billion by using a pre-tax discount rate (WACC) of 13 percent. The impairment was recognized as a result of reassessment of future cash flow generation in Netherlands.
Tele2 AustriaOn October 10, 2017 the Austrian competition authority announced that they have approved Tele2’s divestment of its Austrian operations to Hutchison Drei Austria GmbH (Three Austria) announced in July 2017. The divestment was closed on October 31, 2017. The Austrian operation was sold for SEK 867 million and resulted in a capital gain of SEK 316 million, including costs for central support system for the Austrian operation and other transaction costs. In addition, the capital gain was affected negatively with SEK 530 million related to reversal of exchange rate differences previously reported in other comprehensive income, which was reversed over the income state-ment but with no effect on total equity or cash flow. In addition to the purchase price, there is a possibility to receive an earn-out of EUR 10
million (SEK 98 million), that will be paid over 24 months depending on the development of the business. The divested operations, includ-ing capital gain, has been reported separately under discontinued operations in the income statement, with a retrospective effect on previous periods.
Other discontinued operationsIn Q3 2017, discontinued operations were positively affected by SEK 38 million related to a resolved provision for a VAT dispute related to the previously sold operations in Italy.
Discontinued operations also refer to provisions for Russian tax disputes related to the previously sold operations in Russia, with a negative effect on net profit/loss in 2017 of SEK –17 (–100) million.
The Dutch, Austrian, Russian and Italian operations reported as discontinued operations are stated below.
Net assets at the time of divestmentAssets, liabilities and contingent liabilities included in the divested operation in Austria is stated below.SEK million Austria
Goodwill 9Other intangible assets 48Tangible assets 162Deferred tax assets 251Current receivables 159Cash and cash equivalents 202Non-current provisions –31Non-current interest-bearing liabilities –13Current interest-bearing liabilities –8Current non-interest-bearing liabilities –262Divested net assets 517
Capital gain, excluding sales costs 350Sales price 867
Price adjustments, non-cash 11Less: cash in divested operations –202TOTAL CASH FLOW EFFECT 676
Balance sheetAssets held for sale refer to the Dutch operation.
2017SEK million Dec 31
ASSETSNON-CURRENT ASSETSGoodwill 1,108Other intangible assets 1,271Intangible assets 2,379Tangible assets 5,027Financial assets 540Deferred tax assets 105NON-CURRENT ASSETS 8,051
CURRENT ASSETSInventories 130Current receivables 1,870CURRENT ASSETS 2,000
ASSETS CLASSIFIED AS HELD FOR SALE 10,051
LIABILITIESNON-CURRENT LIABILITIESInterest-bearing liabilities 251NON-CURRENT LIABILITIES 251
CURRENT LIABILITIESNon-interest-bearing liabilities 1,632CURRENT LIABILITIES 1,632LIABILITIES DIRECTLY ASSOCIATED WITH ASSETS CLASSIFIED AS HELD FOR SALE 1,883
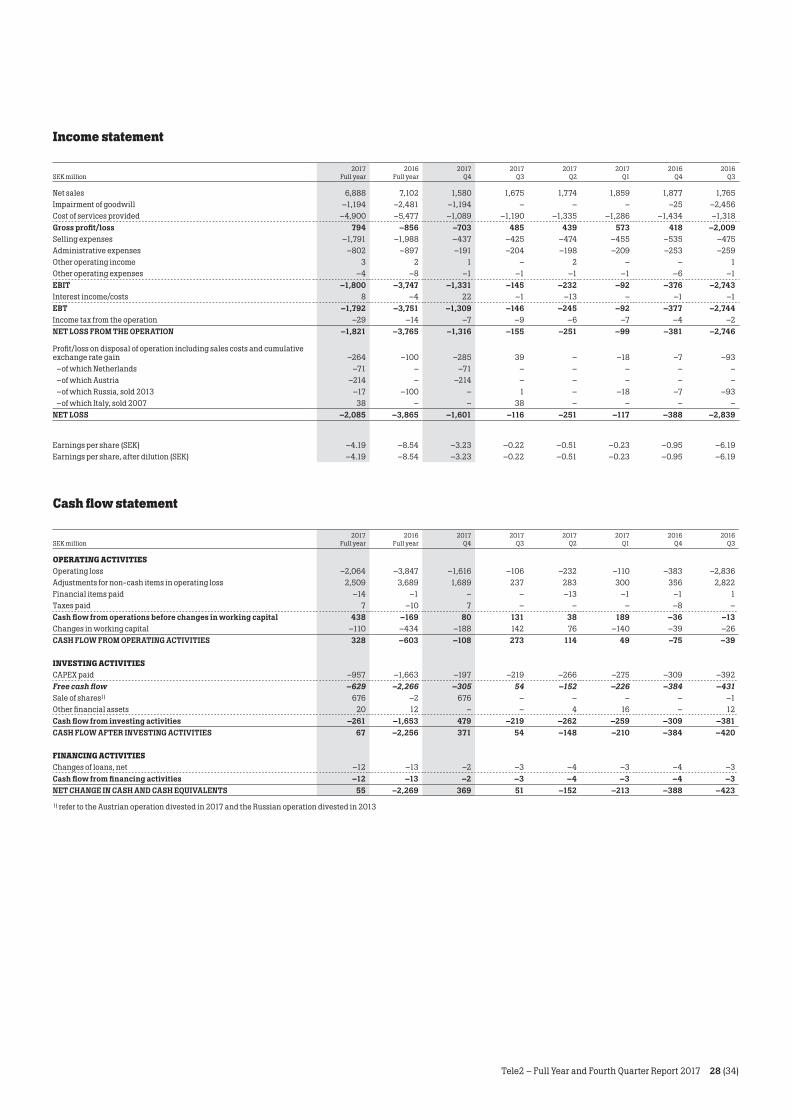
Tele2 – Full Year and Fourth Quarter Report 2017 28 (34)
Income statement
2017 2016 2017 2017 2017 2017 2016 2016SEK million Full year Full year Q4 Q3 Q2 Q1 Q4 Q3
Net sales 6,888 7,102 1,580 1,675 1,774 1,859 1,877 1,765Impairment of goodwill –1,194 –2,481 –1,194 – – – –25 –2,456Cost of services provided –4,900 –5,477 –1,089 –1,190 –1,335 –1,286 –1,434 –1,318Gross profit/loss 794 –856 –703 485 439 573 418 –2,009Selling expenses –1,791 –1,988 –437 –425 –474 –455 –535 –475Administrative expenses –802 –897 –191 –204 –198 –209 –253 –259Other operating income 3 2 1 – 2 – – 1Other operating expenses –4 –8 –1 –1 –1 –1 –6 –1EBIT –1,800 –3,747 –1,331 –145 –232 –92 –376 –2,743Interest income/costs 8 –4 22 –1 –13 – –1 –1EBT –1,792 –3,751 –1,309 –146 –245 –92 –377 –2,744Income tax from the operation –29 –14 –7 –9 –6 –7 –4 –2NET LOSS FROM THE OPERATION –1,821 –3,765 –1,316 –155 –251 –99 –381 –2,746
Profit/loss on disposal of operation including sales costs and cumulative exchange rate gain –264 –100 –285 39 – –18 –7 –93 –of which Netherlands –71 – –71 – – – – – –of which Austria –214 – –214 – – – – – –of which Russia, sold 2013 –17 –100 – 1 – –18 –7 –93 –of which Italy, sold 2007 38 – – 38 – – – –NET LOSS –2,085 –3,865 –1,601 –116 –251 –117 –388 –2,839
Earnings per share (SEK) –4.19 –8.54 –3.23 –0.22 –0.51 –0.23 –0.95 –6.19Earnings per share, after dilution (SEK) –4.19 –8.54 –3.23 –0.22 –0.51 –0.23 –0.95 –6.19
Cash flow statement
2017 2016 2017 2017 2017 2017 2016 2016SEK million Full year Full year Q4 Q3 Q2 Q1 Q4 Q3
OPERATING ACTIVITIES Operating loss –2,064 –3,847 –1,616 –106 –232 –110 –383 –2,836Adjustments for non-cash items in operating loss 2,509 3,689 1,689 237 283 300 356 2,822Financial items paid –14 –1 – – –13 –1 –1 1Taxes paid 7 –10 7 – – – –8 –Cash flow from operations before changes in working capital 438 –169 80 131 38 189 –36 –13Changes in working capital –110 –434 –188 142 76 –140 –39 –26CASH FLOW FROM OPERATING ACTIVITIES 328 –603 –108 273 114 49 –75 –39
INVESTING ACTIVITIESCAPEX paid –957 –1,663 –197 –219 –266 –275 –309 –392Free cash flow –629 –2,266 –305 54 –152 –226 –384 –431Sale of shares1) 676 –2 676 – – – – –1Other financial assets 20 12 – – 4 16 – 12Cash flow from investing activities –261 –1,653 479 –219 –262 –259 –309 –381CASH FLOW AFTER INVESTING ACTIVITIES 67 –2,256 371 54 –148 –210 –384 –420
FINANCING ACTIVITIESChanges of loans, net –12 –13 –2 –3 –4 –3 –4 –3Cash flow from financing activities –12 –13 –2 –3 –4 –3 –4 –3NET CHANGE IN CASH AND CASH EQUIVALENTS 55 –2,269 369 51 –152 –213 –388 –423
1) refer to the Austrian operation divested in 2017 and the Russian operation divested in 2013
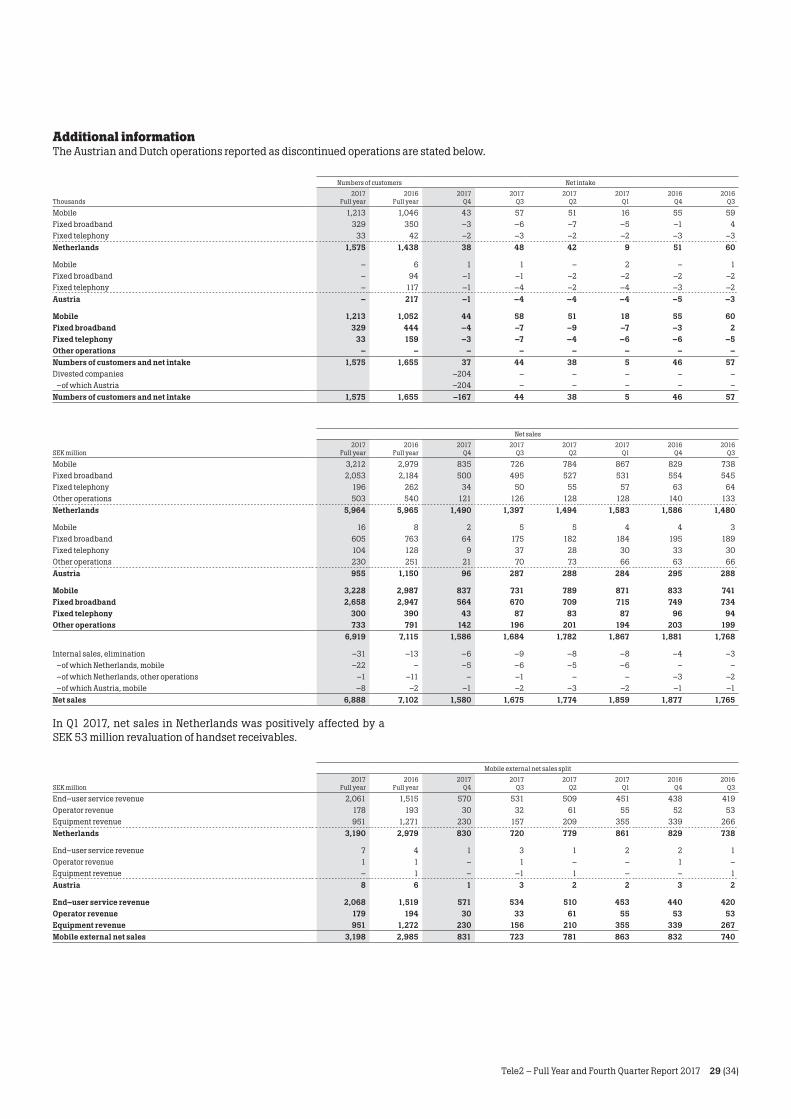
Tele2 – Full Year and Fourth Quarter Report 2017 29 (34)
Additional information The Austrian and Dutch operations reported as discontinued operations are stated below.
Numbers of customers Net intake2017 2016 2017 2017 2017 2017 2016 2016
Thousands Full year Full year Q4 Q3 Q2 Q1 Q4 Q3
Mobile 1,213 1,046 43 57 51 16 55 59Fixed broadband 329 350 –3 –6 –7 –5 –1 4Fixed telephony 33 42 –2 –3 –2 –2 –3 –3Netherlands 1,575 1,438 38 48 42 9 51 60
Mobile – 6 1 1 – 2 – 1Fixed broadband – 94 –1 –1 –2 –2 –2 –2Fixed telephony – 117 –1 –4 –2 –4 –3 –2Austria – 217 –1 –4 –4 –4 –5 –3
Mobile 1,213 1,052 44 58 51 18 55 60Fixed broadband 329 444 –4 –7 –9 –7 –3 2Fixed telephony 33 159 –3 –7 –4 –6 –6 –5Other operations – – – – – – – –Numbers of customers and net intake 1,575 1,655 37 44 38 5 46 57Divested companies –204 – – – – – –of which Austria –204 – – – – –Numbers of customers and net intake 1,575 1,655 –167 44 38 5 46 57
Net sales2017 2016 2017 2017 2017 2017 2016 2016
SEK million Full year Full year Q4 Q3 Q2 Q1 Q4 Q3
Mobile 3,212 2,979 835 726 784 867 829 738Fixed broadband 2,053 2,184 500 495 527 531 554 545Fixed telephony 196 262 34 50 55 57 63 64Other operations 503 540 121 126 128 128 140 133Netherlands 5,964 5,965 1,490 1,397 1,494 1,583 1,586 1,480
Mobile 16 8 2 5 5 4 4 3Fixed broadband 605 763 64 175 182 184 195 189Fixed telephony 104 128 9 37 28 30 33 30Other operations 230 251 21 70 73 66 63 66Austria 955 1,150 96 287 288 284 295 288
Mobile 3,228 2,987 837 731 789 871 833 741Fixed broadband 2,658 2,947 564 670 709 715 749 734Fixed telephony 300 390 43 87 83 87 96 94Other operations 733 791 142 196 201 194 203 199
6,919 7,115 1,586 1,684 1,782 1,867 1,881 1,768
Internal sales, elimination –31 –13 –6 –9 –8 –8 –4 –3 –of which Netherlands, mobile –22 – –5 –6 –5 –6 – – –of which Netherlands, other operations –1 –11 – –1 – – –3 –2 –of which Austria, mobile –8 –2 –1 –2 –3 –2 –1 –1Net sales 6,888 7,102 1,580 1,675 1,774 1,859 1,877 1,765
In Q1 2017, net sales in Netherlands was positively affected by a SEK 53 million revaluation of handset receivables.
Mobile external net sales split2017 2016 2017 2017 2017 2017 2016 2016
SEK million Full year Full year Q4 Q3 Q2 Q1 Q4 Q3
End–user service revenue 2,061 1,515 570 531 509 451 438 419Operator revenue 178 193 30 32 61 55 52 53Equipment revenue 951 1,271 230 157 209 355 339 266Netherlands 3,190 2,979 830 720 779 861 829 738
End–user service revenue 7 4 1 3 1 2 2 1Operator revenue 1 1 – 1 – – 1 –Equipment revenue – 1 – –1 1 – – 1Austria 8 6 1 3 2 2 3 2
End–user service revenue 2,068 1,519 571 534 510 453 440 420Operator revenue 179 194 30 33 61 55 53 53Equipment revenue 951 1,272 230 156 210 355 339 267Mobile external net sales 3,198 2,985 831 723 781 863 832 740
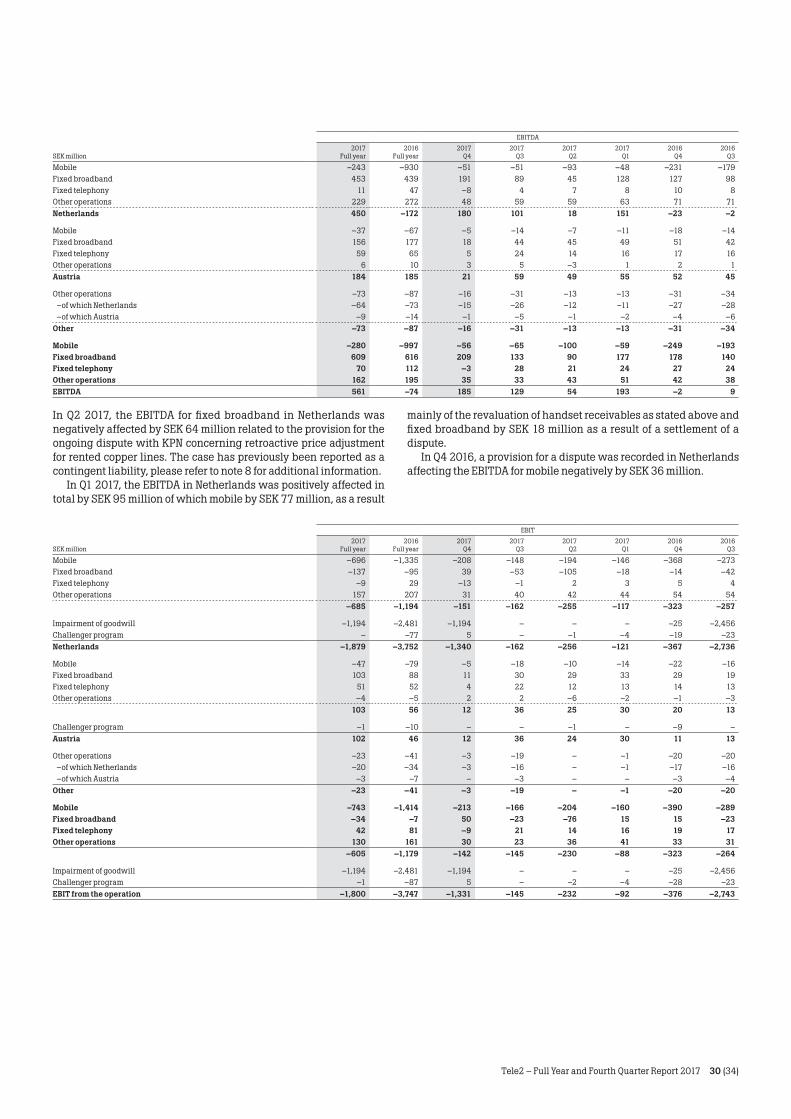
Tele2 – Full Year and Fourth Quarter Report 2017 30 (34)
EBITDA2017 2016 2017 2017 2017 2017 2016 2016
SEK million Full year Full year Q4 Q3 Q2 Q1 Q4 Q3
Mobile –243 –930 –51 –51 –93 –48 –231 –179Fixed broadband 453 439 191 89 45 128 127 98Fixed telephony 11 47 –8 4 7 8 10 8Other operations 229 272 48 59 59 63 71 71Netherlands 450 –172 180 101 18 151 –23 –2
Mobile –37 –67 –5 –14 –7 –11 –18 –14Fixed broadband 156 177 18 44 45 49 51 42Fixed telephony 59 65 5 24 14 16 17 16Other operations 6 10 3 5 –3 1 2 1Austria 184 185 21 59 49 55 52 45
Other operations –73 –87 –16 –31 –13 –13 –31 –34 –of which Netherlands –64 –73 –15 –26 –12 –11 –27 –28 –of which Austria –9 –14 –1 –5 –1 –2 –4 –6Other –73 –87 –16 –31 –13 –13 –31 –34
Mobile –280 –997 –56 –65 –100 –59 –249 –193Fixed broadband 609 616 209 133 90 177 178 140Fixed telephony 70 112 –3 28 21 24 27 24Other operations 162 195 35 33 43 51 42 38EBITDA 561 –74 185 129 54 193 –2 9
In Q2 2017, the EBITDA for fixed broadband in Netherlands was negatively affected by SEK 64 million related to the provision for the ongoing dispute with KPN concerning retroactive price adjustment for rented copper lines. The case has previously been reported as a contingent liability, please refer to note 8 for additional information.
In Q1 2017, the EBITDA in Netherlands was positively affected in total by SEK 95 million of which mobile by SEK 77 million, as a result
mainly of the revaluation of handset receivables as stated above and fixed broadband by SEK 18 million as a result of a settlement of a dispute.
In Q4 2016, a provision for a dispute was recorded in Netherlands affecting the EBITDA for mobile negatively by SEK 36 million.
EBIT2017 2016 2017 2017 2017 2017 2016 2016
SEK million Full year Full year Q4 Q3 Q2 Q1 Q4 Q3
Mobile –696 –1,335 –208 –148 –194 –146 –368 –273Fixed broadband –137 –95 39 –53 –105 –18 –14 –42Fixed telephony –9 29 –13 –1 2 3 5 4Other operations 157 207 31 40 42 44 54 54
–685 –1,194 –151 –162 –255 –117 –323 –257
Impairment of goodwill –1,194 –2,481 –1,194 – – – –25 –2,456Challenger program – –77 5 – –1 –4 –19 –23Netherlands –1,879 –3,752 –1,340 –162 –256 –121 –367 –2,736
Mobile –47 –79 –5 –18 –10 –14 –22 –16Fixed broadband 103 88 11 30 29 33 29 19Fixed telephony 51 52 4 22 12 13 14 13Other operations –4 –5 2 2 –6 –2 –1 –3
103 56 12 36 25 30 20 13
Challenger program –1 –10 – – –1 – –9 –Austria 102 46 12 36 24 30 11 13
Other operations –23 –41 –3 –19 – –1 –20 –20 –of which Netherlands –20 –34 –3 –16 – –1 –17 –16 –of which Austria –3 –7 – –3 – – –3 –4Other –23 –41 –3 –19 – –1 –20 –20
Mobile –743 –1,414 –213 –166 –204 –160 –390 –289Fixed broadband –34 –7 50 –23 –76 15 15 –23Fixed telephony 42 81 –9 21 14 16 19 17Other operations 130 161 30 23 36 41 33 31
–605 –1,179 –142 –145 –230 –88 –323 –264
Impairment of goodwill –1,194 –2,481 –1,194 – – – –25 –2,456Challenger program –1 –87 5 – –2 –4 –28 –23EBIT from the operation –1,800 –3,747 –1,331 –145 –232 –92 –376 –2,743
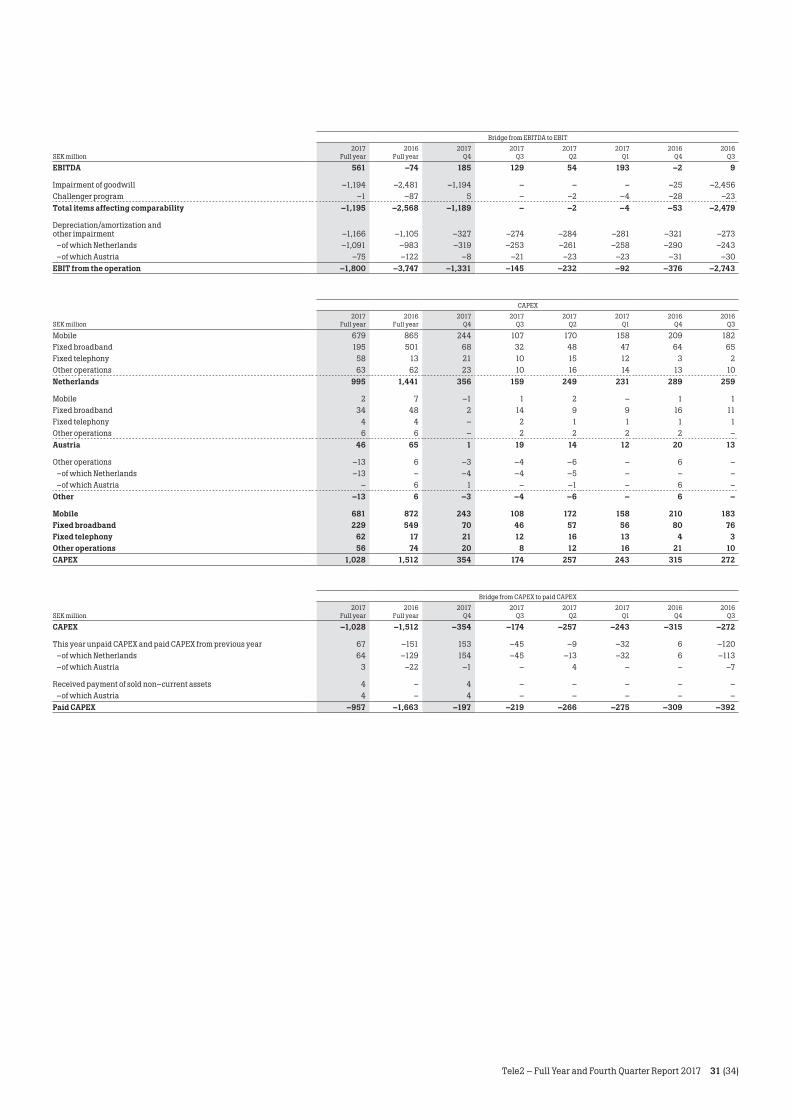
Tele2 – Full Year and Fourth Quarter Report 2017 31 (34)
Bridge from EBITDA to EBIT2017 2016 2017 2017 2017 2017 2016 2016
SEK million Full year Full year Q4 Q3 Q2 Q1 Q4 Q3
EBITDA 561 –74 185 129 54 193 –2 9
Impairment of goodwill –1,194 –2,481 –1,194 – – – –25 –2,456Challenger program –1 –87 5 – –2 –4 –28 –23Total items affecting comparability –1,195 –2,568 –1,189 – –2 –4 –53 –2,479
Depreciation/amortization and other impairment –1,166 –1,105 –327 –274 –284 –281 –321 –273 –of which Netherlands –1,091 –983 –319 –253 –261 –258 –290 –243 –of which Austria –75 –122 –8 –21 –23 –23 –31 –30EBIT from the operation –1,800 –3,747 –1,331 –145 –232 –92 –376 –2,743
CAPEX2017 2016 2017 2017 2017 2017 2016 2016
SEK million Full year Full year Q4 Q3 Q2 Q1 Q4 Q3
Mobile 679 865 244 107 170 158 209 182Fixed broadband 195 501 68 32 48 47 64 65Fixed telephony 58 13 21 10 15 12 3 2Other operations 63 62 23 10 16 14 13 10Netherlands 995 1,441 356 159 249 231 289 259
Mobile 2 7 –1 1 2 – 1 1Fixed broadband 34 48 2 14 9 9 16 11Fixed telephony 4 4 – 2 1 1 1 1Other operations 6 6 – 2 2 2 2 –Austria 46 65 1 19 14 12 20 13
Other operations –13 6 –3 –4 –6 – 6 – –of which Netherlands –13 – –4 –4 –5 – – – –of which Austria – 6 1 – –1 – 6 –Other –13 6 –3 –4 –6 – 6 –
Mobile 681 872 243 108 172 158 210 183Fixed broadband 229 549 70 46 57 56 80 76Fixed telephony 62 17 21 12 16 13 4 3Other operations 56 74 20 8 12 16 21 10CAPEX 1,028 1,512 354 174 257 243 315 272
Bridge from CAPEX to paid CAPEX2017 2016 2017 2017 2017 2017 2016 2016
SEK million Full year Full year Q4 Q3 Q2 Q1 Q4 Q3
CAPEX –1,028 –1,512 –354 –174 –257 –243 –315 –272
This year unpaid CAPEX and paid CAPEX from previous year 67 –151 153 –45 –9 –32 6 –120 –of which Netherlands 64 –129 154 –45 –13 –32 6 –113 –of which Austria 3 –22 –1 – 4 – – –7
Received payment of sold non–current assets 4 – 4 – – – – – –of which Austria 4 – 4 – – – – –Paid CAPEX –957 –1,663 –197 –219 –266 –275 –309 –392
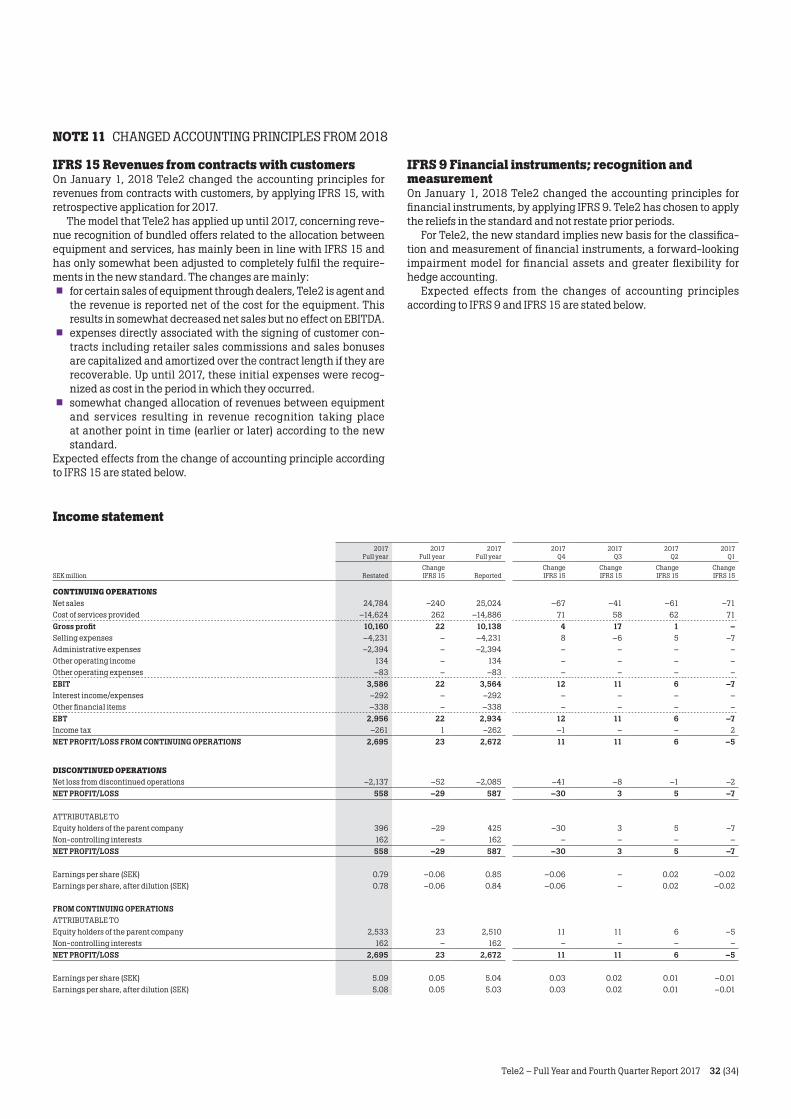
Tele2 – Full Year and Fourth Quarter Report 2017 32 (34)
Income statement
2017 Full year
2017 Full year
2017 Full year
2017 Q4
2017 Q3
2017 Q2
2017 Q1
SEK million RestatedChange IFRS 15 Reported
Change IFRS 15
Change IFRS 15
Change IFRS 15
Change IFRS 15
CONTINUING OPERATIONSNet sales 24,784 –240 25,024 –67 –41 –61 –71Cost of services provided –14,624 262 –14,886 71 58 62 71Gross profit 10,160 22 10,138 4 17 1 –Selling expenses –4,231 – –4,231 8 –6 5 –7Administrative expenses –2,394 – –2,394 – – – –Other operating income 134 – 134 – – – –Other operating expenses –83 – –83 – – – –EBIT 3,586 22 3,564 12 11 6 –7Interest income/expenses –292 – –292 – – – –Other financial items –338 – –338 – – – –EBT 2,956 22 2,934 12 11 6 –7Income tax –261 1 –262 –1 – – 2NET PROFIT/LOSS FROM CONTINUING OPERATIONS 2,695 23 2,672 11 11 6 –5
DISCONTINUED OPERATIONSNet loss from discontinued operations –2,137 –52 –2,085 –41 –8 –1 –2NET PROFIT/LOSS 558 –29 587 –30 3 5 –7
ATTRIBUTABLE TOEquity holders of the parent company 396 –29 425 –30 3 5 –7Non-controlling interests 162 – 162 – – – –NET PROFIT/LOSS 558 –29 587 –30 3 5 –7
Earnings per share (SEK) 0.79 –0.06 0.85 –0.06 – 0.02 –0.02Earnings per share, after dilution (SEK) 0.78 –0.06 0.84 –0.06 – 0.02 –0.02
FROM CONTINUING OPERATIONSATTRIBUTABLE TOEquity holders of the parent company 2,533 23 2,510 11 11 6 –5Non-controlling interests 162 – 162 – – – –NET PROFIT/LOSS 2,695 23 2,672 11 11 6 –5
Earnings per share (SEK) 5.09 0.05 5.04 0.03 0.02 0.01 –0.01Earnings per share, after dilution (SEK) 5.08 0.05 5.03 0.03 0.02 0.01 –0.01
NOTE 11 CHANGED ACCOUNTING PRINCIPLES FROM 2018
IFRS 15 Revenues from contracts with customersOn January 1, 2018 Tele2 changed the accounting principles for revenues from contracts with customers, by applying IFRS 15, with retrospective application for 2017.
The model that Tele2 has applied up until 2017, concerning reve-nue recognition of bundled offers related to the allocation between equipment and services, has mainly been in line with IFRS 15 and has only somewhat been adjusted to completely fulfil the require-ments in the new standard. The changes are mainly: • for certain sales of equipment through dealers, Tele2 is agent and
the revenue is reported net of the cost for the equipment. This results in somewhat decreased net sales but no effect on EBITDA.• expenses directly associated with the signing of customer con-tracts including retailer sales commissions and sales bonuses are capitalized and amortized over the contract length if they are recoverable. Up until 2017, these initial expenses were recog-nized as cost in the period in which they occurred.• somewhat changed allocation of revenues between equipment and services resulting in revenue recognition taking place at another point in time (earlier or later) according to the new standard.
Expected effects from the change of accounting principle according to IFRS 15 are stated below.
IFRS 9 Financial instruments; recognition and measurementOn January 1, 2018 Tele2 changed the accounting principles for financial instruments, by applying IFRS 9. Tele2 has chosen to apply the reliefs in the standard and not restate prior periods.
For Tele2, the new standard implies new basis for the classifica-tion and measurement of financial instruments, a forward-looking impairment model for financial assets and greater flexibility for hedge accounting.
Expected effects from the changes of accounting principles according to IFRS 9 and IFRS 15 are stated below.
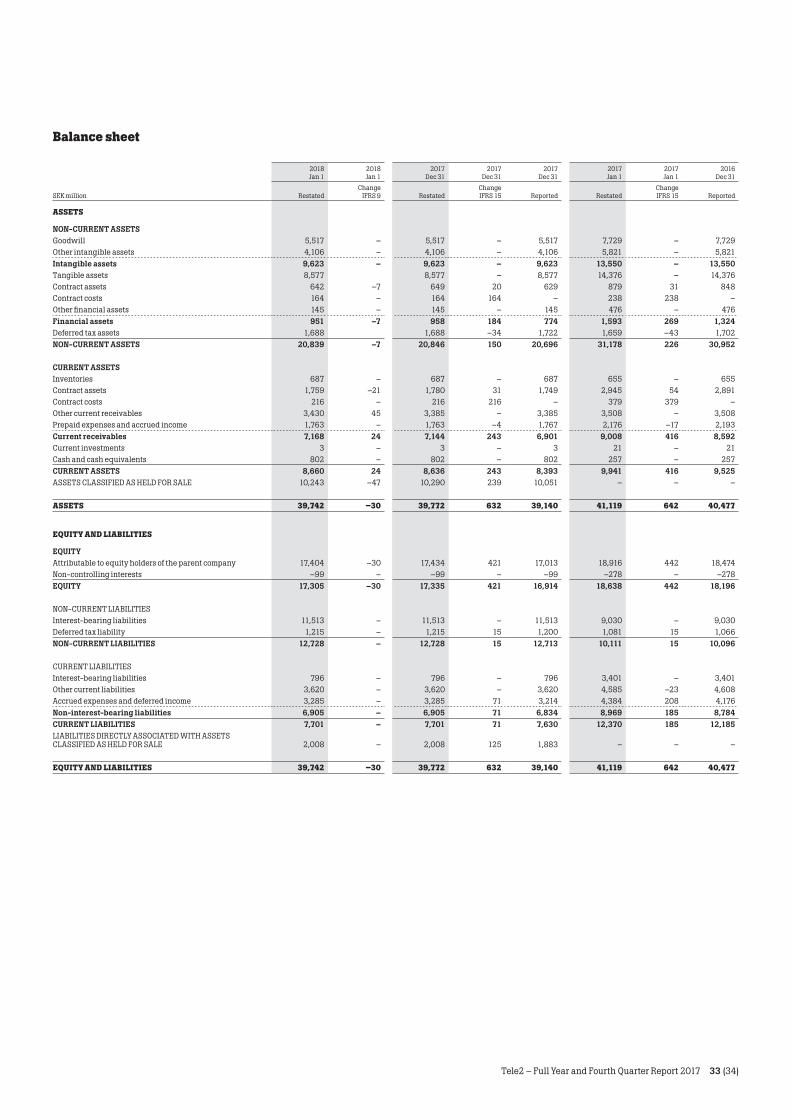
Tele2 – Full Year and Fourth Quarter Report 2017 33 (34)
Balance sheet
2018 Jan 1
2018 Jan 1
2017 Dec 31
2017 Dec 31
2017 Dec 31
2017 Jan 1
2017 Jan 1
2016 Dec 31
SEK million RestatedChange
IFRS 9 RestatedChange IFRS 15 Reported Restated
Change IFRS 15 Reported
ASSETS
NON-CURRENT ASSETSGoodwill 5,517 – 5,517 – 5,517 7,729 – 7,729Other intangible assets 4,106 – 4,106 – 4,106 5,821 – 5,821Intangible assets 9,623 – 9,623 – 9,623 13,550 – 13,550Tangible assets 8,577 8,577 – 8,577 14,376 – 14,376Contract assets 642 –7 649 20 629 879 31 848Contract costs 164 – 164 164 – 238 238 –Other financial assets 145 – 145 – 145 476 – 476Financial assets 951 –7 958 184 774 1,593 269 1,324Deferred tax assets 1,688 1,688 –34 1,722 1,659 –43 1,702NON-CURRENT ASSETS 20,839 –7 20,846 150 20,696 31,178 226 30,952
CURRENT ASSETSInventories 687 – 687 – 687 655 – 655Contract assets 1,759 –21 1,780 31 1,749 2,945 54 2,891Contract costs 216 – 216 216 – 379 379 –Other current receivables 3,430 45 3,385 – 3,385 3,508 – 3,508Prepaid expenses and accrued income 1,763 – 1,763 –4 1,767 2,176 –17 2,193Current receivables 7,168 24 7,144 243 6,901 9,008 416 8,592Current investments 3 – 3 – 3 21 – 21Cash and cash equivalents 802 – 802 – 802 257 – 257CURRENT ASSETS 8,660 24 8,636 243 8,393 9,941 416 9,525ASSETS CLASSIFIED AS HELD FOR SALE 10,243 –47 10,290 239 10,051 – – –
ASSETS 39,742 –30 39,772 632 39,140 41,119 642 40,477
EQUITY AND LIABILITIES
EQUITYAttributable to equity holders of the parent company 17,404 –30 17,434 421 17,013 18,916 442 18,474Non-controlling interests –99 – –99 – –99 –278 – –278EQUITY 17,305 –30 17,335 421 16,914 18,638 442 18,196
NON-CURRENT LIABILITIESInterest-bearing liabilities 11,513 – 11,513 – 11,513 9,030 – 9,030Deferred tax liability 1,215 – 1,215 15 1,200 1,081 15 1,066NON-CURRENT LIABILITIES 12,728 – 12,728 15 12,713 10,111 15 10,096
CURRENT LIABILITIESInterest-bearing liabilities 796 – 796 – 796 3,401 – 3,401Other current liabilities 3,620 – 3,620 – 3,620 4,585 –23 4,608Accrued expenses and deferred income 3,285 – 3,285 71 3,214 4,384 208 4,176Non-interest-bearing liabilities 6,905 – 6,905 71 6,834 8,969 185 8,784CURRENT LIABILITIES 7,701 – 7,701 71 7,630 12,370 185 12,185LIABILITIES DIRECTLY ASSOCIATED WITH ASSETS CLASSIFIED AS HELD FOR SALE 2,008 – 2,008 125 1,883 – – –
EQUITY AND LIABILITIES 39,742 –30 39,772 632 39,140 41,119 642 40,477

Tele2 – Full Year and Fourth Quarter Report 2017 34 (34)